Embed Size (px)
DESCRIPTION
Color perception
Citation preview

Capacity limit of feature-based attention to color
Taosheng Liu1,2, Michael Jigo1, Samantha Blair1
1Department of Psychology, Michigan State University, East Lansing, MI 2Neuroscience Program, Michigan State University, East Lansing, MI
Correspondence:
Taosheng Liu PhD Department of Psychology Michigan State Univeristy 316 Physics Rd East Lansing, MI 48864 Email: [email protected]
Acknowledgment:
We would like to thank Yixue Wang for help in data collection. This work is supported by a grant from NIH (EY022727).

2
Abstract
Attention to a feature enhances the sensory representation of that feature. Although much
has been learned about the properties of attentional modulation when attending to a single
feature, the capacity of feature-based attention is not well established. We investigated
this question in a series of experiments using a color detection task while varying the
number of precues that directed participants’ attention to colors. We measured the
threshold for color detection in a color coherence stimulus. We found consistent
facilitation of detection performance in the one-cue condition compared to the no-cue and
two-cue conditions, and no improvement in the two-cue condition compared to the no-
cue condition. Additional experiments demonstrated that insufficient cue-processing time
or selectively attending to a single color could not explain performance in the two-cue
condition. Thus, our results show that we can only attend to a single color at a time. This
severe capacity limit is likely due to an inability to simultaneously modulate
representations of multiple colors with attention. We further discuss the implications of
our results for studies on attentional control setting and states of working memory.
Keywords: visual attention, feature, color, capacity

3
Introduction
Attention is a crucial cognitive mechanism that selects a limited set of sensory
input from the environment for prioritized processing. Classical studies of visual attention
have emphasized the selection of spatial locations (Posner, 1980; Carrasco, 2006). More
recent studies have also shown that attention can select non-spatial properties such as
features and objects (Maunsell & Treue, 2006; Scolari, Ester, & Serences, 2014). In this
research we focus on feature-based attention, which refers to the selection of specific
values within a feature dimension (e.g., selecting the red color among other colors,
selecting the vertical orientation among other orientations).
It is now well-established that attending to a feature can enhance its early sensory
representations, as shown by a variety of studies employing psychophysical (Arman et
al., 2006; Liu & Hou, 2011; Liu & Mance, 2011; Saenz et al., 2003; White & Carrasco,
2011), neurophysiological (Cohen & Maunsell, 2011; Martinez-Trujillo & Treue, 2004)
and brain imaging measures (Liu, Larsson, & Carrasco, 2007; Saenz et al., 2002). An
enhanced feature representation would be useful for other cognitive operations requiring
the processing of that feature (e.g., during visual search for a specific feature). This body
of work generally tested attention to a single feature, thus leaving open an important
question regarding the capacity of feature-based attention, i.e., how many features can be
attended to simultaneously? Answering this question would deepen our understanding of
the mechanisms of attention, and also have practical implications on optimizing human
performance in visually guided tasks.
The capacity of feature-based attention has received limited investigation. Two
previous studies used directional cues to direct attention to motion and manipulated the

4
reliability of the cue (Ball & Sekuler, 1981; Herrmann, Heeger, & Carrasco, 2012). A
reliable cue would indicate a narrow range of possible directions for an upcoming
moving target, whereas a unreliable cue would indicate a wide range of possible target
directions. It was found that performance deteriorated as the cue became less reliable.
This implies a limit in feature-based attention in that attention cannot be directed to more
directions as effectively as to fewer directions. However, these studies do not provide a
precise estimate of the capacity of feature-based attention, nor were they designed to
achieve such an objective. A recent study by us addressed this question by manipulating
the number of discrete directional cues in a motion detection task (Liu, Becker, & Jigo,
2013). Compared to a baseline neutral condition, performance was improved when
participants attended to a single direction, as well as when they attended to two
orthogonal directions. However, there was a significant performance decrement when
attending to two directions compared to attending to a single direction, thus revealing a
limitation in our ability to attend to multiple directions. What we could not ascertain,
however, was whether participants could only attend to one direction, or, they could
attend to two directions but with less efficiency. Both scenarios are possible explanations
of our previous results on attention to motion (Liu, Becker, & Jigo, 2013).
In the present study, we investigated the capacity of attention to the color feature,
due to the following considerations. First, color is an intrinsically important visual feature
and has been shown to be particularly effective in guiding attention (Motter & Belky,
1998; Williams, 1966). For this reason, color is possibly the most widely used feature in
studies of visual attention. Hence, it is important to know whether results obtained for
motion direction can be generalized to color. Indeed, studies on attentional control setting

5
(ACS) have found that attention can be captured by two possible colors (Adamo et al.,
2008; Moore & Weissman, 2010; Irons, Folk, & Remington, 2012; Becker, Ravizza, &
Peltier, 2015). Thus attention to color might have a higher capacity than attention to
motion, such that participants can simultaneously attend to two colors. Second, studying
color offers another opportunity to get a better estimate of the number of features that can
be concurrently attended. Our previous results on motion did not allow us to distinguish
the two possible scenarios mentioned above. As will be seen later, our color results
provided a more definitive estimate of the capacity of feature-based attention.
Here we manipulated the number of color precues and measured the detection
threshold of a color signal in a psychophysical task. This allowed us to assess how
sensitivity to color changes as a function of number of attentional cues. To preview our
results, our findings support the idea that participants can only effectively attend to a
single color at a time.
Experiment 1a
In this first experiment, we used a color detection task, modeled after our motion
experiment (Liu, Becker, & Jigo, 2013), and varied the number of color cues to test the
capacity of feature-based attention to color. There was always a single color target on
every trial, but the target color was conveyed to participants either alone or in a group of
other colors. This allowed us to test how efficiently participants can attend to multiple
colors.
Methods
Participants

6
Six students from Michigan State University participated in this experiment. All
participants had normal or corrected-to-normal acuity, and reported to have normal color
vision. We informally assessed their color vision by presenting them the Dvorine Pseudo-
Isochromatic Plates (Dvorine, 1963) for which all participants correctly identified all the
numbers (this assessment was also performed for all participants in the subsequent
experiments). Participants gave informed consent and were compensated at a rate of
$10/hr.
Color Selection: isoluminance setting procedure
To study color-based attention, we needed to ensure that our stimuli only differed
in color (or more precisely, hue), but not in other characteristics, such as luminance.
Otherwise, participants might use luminance, instead of color, to guide their attention.
Thus, for each participant, we selected six color values at their own psychophysical
isoluminance. We started with six saturated and distinct hues (red, green, blue, yellow,
purple, and orange), and used the method of heterochromatic flicker photometry to equate
the brightness among the colors for each participant (Kaiser, 1991; Lee, Martin &
Valberg 1988). Participants viewed a flickering checkerboard (8 Hz) consisting of a
constant gray (6.34 cd/m2) and one of the six colors (Figure 1A), whose luminance was
adjusted by the participant to minimize their perception of flicker. Each participant
repeated four measurements for each of the six color-gray pairings, and the mean across
the four measurements was used as the luminance value for that color. In general, we did
not observe significant variations in these isoluminance settings across participants (see
Figure 1B for colors from the average setting values).
Visual Stimuli: attention task

7
The stimuli were static arrays of 240 colored dots (dot size: 0.1°), whose locations
were restricted to a 4° thick annulus centered on the fixation dot (inner radius = 1°, outer
radius = 5°). The dots were drawn in six colors, the values of which were individually
determined for each participant (see above). The spatial location of each dot was
randomly assigned for each stimulus. Stimuli were presented on a 21” CRT monitor with
a refresh rate of 75Hz and a resolution of 1024×768. Participants rested their heads on a
chin rest that was positioned 57 cm away from the monitor.
We manipulated the proportion of a particular color, and referred to this measure
as color coherence. Zero color coherence was defined as an equal proportion in the
number of dots among all six colors (i.e., 40 dots per color), whereas a non-zero
coherence indicated that one color had a larger proportion than the others. In the latter
case, the color with a larger proportion was referred to as the dominant color, and the
other five colors were equally proportioned. Numerically, the coherence was defined by
the following equation:
color coherence = Ps – Pn
where Ps was the proportion of dots in the dominant color, and Pn was proportion of dots
in each non-dominant color, with the following constraint:
Pn = (1-Ps)/5
That is, all non-dominant colors were equally proportioned after accounting for
the dominant color. The color coherence is a color analog of motion coherence
implemented in the classic, and widely used, random-dot motion stimulus (Newsome &
Pare, 1988), and it has been used in our previous study (Wang, Miller, & Liu, 2015).

8
Task and Procedures
Participants detected the presence of a dominant color in a two-interval forced
choice task (2IFC, see Figure 2). Each trial started with a 0.5 s cue period followed by a
0.7 s blank interval, after which two intervals of stimuli were shown, each for 0.3 s and
separated by 0.7 s. One interval contained a 0% coherent stimulus in which the six colors
were in equal proportion (noise), while the other interval contained a non-zero coherent
stimulus in which one color had a larger proportion than the other five colors (signal). We
used six coherence levels (2%, 6%, 12%, 18%, 24%, 30%, 36%) with the method of
constant stimuli to measure performance in this color detection task. Participants were
instructed to report the interval that contained the dominant color by pressing the “1” or
“2” key on the numeric keypad of a standard computer keyboard for the first and second
interval, respectively. Participants were instructed to respond as accurately as possible. A
sound was played on incorrect trials after the participant’s response as feedback. An
inter-trial interval of 1.5 s followed the participant’s response.
The dominant color could be any one of the six colors. To manipulate feature-
based attention, we presented one of four types of cues at the beginning of a trial. In the
no-cue (baseline) condition, the fixation dot dimmed to indicate the upcoming color
stimulus. In the one-cue condition, an additional circle (radius 0.5°) drawn in the
dominant color was shown either on the left or right of fixation (distance to fixation 1.5°)
to indicate the signal color. In the two-cue condition, two circles were shown on the left
and right side of fixation, one of which was drawn in the dominant color while the other
was drawn in another color, selected randomly from the remaining five colors. In the
three-cue condition, three circles were shown on the left, right, and above the fixation.

9
One circle was drawn in the dominant color while the other two circles were drawn with
two other colors. Participants were instructed to attend to the cued color(s), as it would
help them to detect the signal. We used a long cue-to-stimulus delay (1.2 s) to ensure that
participants had sufficient time to encode and use the cues (Ball & Sekuler, 1981; Liu,
Stevens et al., 2007).
Participants performed the task in blocks of 35 trials, within which the type of cue
(no-cue, one-cue, two-cue, three-cue) was held constant. Cue type was indicated by a
prompt at the beginning of each block. Within a block, the dominant color, coherence
level of the color signal, and cue location of the dominant color (in the one-cue, two-cue,
and three-cue conditions) were all randomized. Thirty-two blocks of trials were run, with
eight blocks for each cue type. The order of blocks was pseudo-randomized such that for
every four blocks, each of the four cue types occurred once in a random order. This
ensured that there were no consistent order effects among the different cue conditions.
The experiment was completed in two separate hour-long sessions.
The majority of our participants were not familiar with the color detection task. In
our experience, there is a considerable perceptual learning effect for participants who
have never seen this type of stimulus. Thus, in addition to the main experiment, we also
ran a practice session using exactly the same procedure as the no-cue condition described
above. Participants performed the color detection task in 35-trial blocks until their
coherence threshold did not show a sizable drop in 3 consecutive blocks. The practice
session always took place on a different day and before the main experiment. We also ran
the practice session for participants in subsequent experiments who have not had much
experience with our random dot color stimuli.

1
Data analysis
Proportion correct data were fitted by a three-parameter Weibull function with a
location parameter, a slope parameter, and a lapse parameter representing deviation from
1 at the upper asymptote (e.g., due to pressing the wrong buttons). The lower asymptote
was fixed at 0.5 (it was fixed at 0 in the one-interval Yes/No task in Experiments 2 and
3). Fits were performed using maximum-likelihood estimation, as implemented in the
Palamedes Toolbox (Prins & Kingdom, 2009). Threshold was defined as the coherence
level corresponding to an accuracy of 75% in Experiment 1 and 50% in Experiments 2
and 3.
Results and Discussion
Accuracy showed a monotonic increase as a function of color coherence, which
was well fit by a sigmoid function such as Weibull (Figure 3A). Compared to the baseline
condition (no-cue), a single cue shifted the psychometric function to the left, indicating
that a lower color coherence was needed to detect the signal at the same criterion
performance. Neither the two-cue nor the three-cue condition shifted the psychometric
function to the left, indicating no cueing benefit. Indeed, the psychometric functions for
the two- and three-cue conditions were slightly shifted to the right. To quantify the
cueing effect, we fitted individual participant data with the Weibull function and obtained
thresholds, defined as the color coherence corresponding to 75% accuracy. Figure 3B
shows the group-averaged thresholds for the four cue types, which were significantly
different from each other as assessed by a one-way repeated measures ANOVA (F(3,
15)=8.21, p < 0.05). Post-hoc paired comparisons showed that the one-cue condition had
1
a significantly lower threshold than the baseline (no-cue) condition (t(5)=4.04, p < 0.05),
the two-cue condition (t(5)= 3.20, p < 0.05), and the three-cue condition (t(5)=4.17, p <
0.05). No other comparisons reached significance.
These results showed that knowing the color of the upcoming target facilitates its
detection. This finding is consistent with many earlier studies that showed that attending
to a feature enhances its processing (Lankheet & Vestraten, 1995; Saenz, Buracas &
Boynton, 2002, 2003; Arman, Ciaramitaro & Boynton 2006; Liu, Larsson & Carrasco,
2007; Liu & Mance, 2011; Liu & Hou, 2011; White & Carrasco, 2011). Furthermore, by
manipulating the number of attended colors, our results revealed a severe capacity limit
in attention to color. The coherence thresholds for the two-cue and three-cue conditions
were similar to that of the baseline condition. A trivial explanation for these results is that
participants simply forgot which colors to attend after the cue period. This is very
unlikely because working memory capacity for simple colors is at least 3-4 (Cowan,
2001; Luck & Vogel, 1997; Zhang, & Luck, 2008). Furthermore, all participants indeed
subjectively reported to know which colors to attend in all conditions when we queried
them at the end of the experiment.
These results are thus consistent with the idea that the focus of attention contains
a single active item (a color feature in this case). Before accepting this conclusion,
however, we need to consider some alternative explanations. One possible explanation
for the absence of a cueing effect in the two-cue and three-cue conditions is that
participants needed more time to process multiple cues. Although our choice of stimulus-
onset-asynchrony (SOA) between the cue and the dot stimulus was quite long (1.2 s), and
should have been sufficient given previous research showing that a single feature cue

1
took somewhere between 300 and 500 ms to exert its effects (Liu, Stevens, & Carrasco,
2007), it is possible that multiple color cues need more time to be processed in order to
facilitate target detection. Therefore, in Experiment 1b, we used an even longer cue-to-
target SOA to test whether more processing time would help participants use the
information from multiple cues.
Experiment 1b
In this experiment, we prolonged the cue-to-stimulus SOA to investigate whether
the lack of cueing effect in Experiment 1a was due to an insufficient amount of time
given to process the cues. We removed the three-cue condition in this experiment because
performance did not differ between the two-cue and three-cue conditions; if participants
could not utilize two cues they probably could not utilize three cues either. Thus, we
focused on whether attending to two colors can improve performance if participants were
given more time to process the cue.
Methods
Participants
Six students from Michigan State University participated in this experiment, two
of which participated in Experiment 1a. All participants had normal or corrected-to-
normal acuity, as well as reported to have normal color vision. Participants gave
informed consent and were compensated at the rate of $10/hr.
Task and Procedures
The experiment was identical to Experiment 1a with the following exceptions.
There were three conditions: no-cue (baseline), one-cue, and two-cue. The cue-to-

1
stimulus SOA was prolonged to 2 s with a 0.5 s cue duration and 1.5 s blank interval.
Participants were instructed that the cues were always valid and should be used to detect
the signal interval. There were six 35-trial blocks for each cue type (18 blocks total).
Every three blocks were pseudo-randomized such that they would contain a random
permutation of the three cue types. The experiment was completed in two 40-min
sessions on separate days.
Results and Discussion
Compared to the baseline condition, the one-cue condition shifted the
psychometric function to the left, but the two-cue condition did not produce a sizable
leftward shift (Figure 4A). Group averaged coherence thresholds (Figure 4B) were
significantly different from each other (F(2,10)=5.60, p <0.05). Post-hoc comparisons
showed that detection threshold was significantly lower for the one-cue condition than for
the no-cue (t(5)=3.10, p < 0.05) and two-cue conditions (t(5)=2.74, p < 0.05), but did not
differ between the no-cue and two-cue conditions (t(5)=0.59, p = 0.58).
Again, we observed a reliable cueing effect in the one-cue condition and the lack
of a cueing effect in the two-cue condition, which replicated the results in Experiment 1a.
Despite increasing the cue-to-stimulus SOA, two cues did not improve performance
compared to the baseline. These results again suggest that feature-based attention to color
is limited to a single color. There was, however, another caveat due to the 2IFC task and
the nature of the color coherence stimulus. Consider a two-cue trial, where one cue was
the dominant color (say red) and the other cue was a non-dominant color (say green). The
dominant color had a higher proportion in the signal interval than the noise interval. At

1
the observed coherence threshold of ~10%, the signal interval contained ~25% of the
dominant color, whereas the noise interval contained 16.7% (1/6) of the dominant color.
Thus a mechanism that amplifies the dominant color will favor the correct choice of the
signal interval. However, the cued, but non-dominant color was actually more prevalent
in the noise interval (16.7%) than the signal interval (~15%). This difference was
relatively small, but a mechanism that amplifies the cued non-dominant color would
favor the choice of the noise interval. Could it be that participants actually attended to
two colors on the two-cue trials, but the attentional enhancement of the cued non-
dominant color favored the choice of the noise interval, thus reducing the overall
performance on the two-cue trials? Numerically, this seems implausible, as the
proportion difference between the signal and noise interval for the dominant color (25%
vs. 16.7%) was much larger than that for the non-dominant color (15% vs. 16.7%). Thus,
even if such an effect exists, it should not completely cancel out the cueing benefit, which
was what we have found so far. Nevertheless, such a possibility does add some
uncertainty to our interpretation, and we sought to improve our paradigm in the
subsequent experiments to seek additional evidence.
Experiment 2
As discussed above, the cued, but non-dominant, color could lead to erroneous
responses in the two-cue condition in Experiment 1 because of the requirement of explicit
comparison between the two intervals in the 2IFC task. We reasoned that if we removed
the explicit comparison by using a single interval “yes/no” task, then this problem would
be alleviated. Thus in this experiment, we presented either a signal or noise stimulus in a
single interval and asked participants to respond whether they detected the signal.

1
Methods
Participants
Six students from Michigan State University participated in this experiment, one
of which participated in Experiment 1. All participants had normal or corrected-to-normal
acuity, as well as reported to have normal color vision. Participants gave informed
consent and were compensated at the rate of $10/hr.
Task and Procedures
This experiment was similar to Experiment 1 so only the differences are
emphasized here. We used a one interval target-present/target-absent (Yes/No) task. Each
trial started with a 0.5 s cue period, followed by a 0.7 s blank period and a single 0.3 s
stimulus interval (Figure 5). Half of the trials contained a 0% coherent stimulus where
the six colors were in equal proportion (target absent), while the other half of trials
contained a non-zero coherent stimulus where one color had a larger proportion than the
other five colors (target present). We used six coherence levels (8%, 12%, 18%, 24%,
36%, 60%) with the method of constant stimuli. The coherence values were different
from Experiment 1 because pilot study indicated that the single-interval task was more
difficult, thus requiring a larger range to cover the entire psychometric function.
Participants were instructed to report the presence of the target by pressing 1 and its
absence by pressing 2 on the numeric keyboard of a standard computer keyboard. They
were instructed to respond as accurately as possible. The same auditory feedback and
inter-trial interval as in Experiment 1 were used.

1
Participants performed the task in blocks of 36 trials, within which the type of cue
(no-cue, one-cue, two-cue) was held constant. Cue type was indicated by a prompt at the
beginning of each block. Within a block, the dominant color, coherence level, and cue
location of the dominant color were all randomized. Forty-two blocks of trials were run,
with fourteen blocks for each cue type. The order of blocks was pseudo-randomized such
that for every three blocks, each of the three cue types occurred once in a random order.
The experiment was completed in two hour-long sessions, which occurred on separate
days.
Results and Discussion
In the analysis of overall performance, accuracy was defined as the difference
between the hit rate and false alarm rate. Accuracy on the task showed a monotonic
increase as a function of color coherence (Figure 6A). Compared to the baseline
condition (no-cue), a single cue shifted the psychometric function to the left, indicating a
cueing benefit. However, two cues did not produce a leftward shift. We fitted individual
participant data with the Weibull function and obtained thresholds, defined as the color
coherence that produced an accuracy of 50%. Figure 6B shows the group-averaged
thresholds for the three cueing conditions, which were significantly different from each
other as assessed by a one-way repeated measures ANOVA (F(2, 10)=14.73, p < 0.05).
Post-hoc comparisons showed that the one-cue condition had a lower threshold than both
the baseline (no-cue) condition (t(5)=3.46, p < 0.05) and the two-cue condition
(t(5)=6.33, p < 0.05). Critically, the two-cue condition was not different from the
baseline.

1
Once again we observed a reliable cueing effect in the one-cue condition but none
in the two-cue condition, which replicated the results in Experiment 1. Despite removing
the comparison process that was inherent in our 2IFC paradigm, our results still suggest
that two color cues cannot be attended to simultaneously, again, consistent with the
notion that only a single color feature can be in the focus of attention. Although this
result has been quite consistent across the three experiments so far, it is also intriguing in
that the two-cue condition did not produce any performance benefit compared to the
baseline (no-cue) condition. One might expect a reduced, but nevertheless detectable,
benefit of two cues over baseline, given that two cues still provided useful (albeit less
specific) information and we know participants can use one cue effectively. In the next
experiment, we explored one potential scenario that could occur in the two-cue condition,
namely, that participants chose one cue to attend on every trial.
Experiment 3
Here we further probed what can explain the lack of any cueing effect in the two-
cue condition. One possibility is that participants randomly chose one cue to attend on a
two-cue trial. If this were the case, then on half of the trials, their performance should be
facilitated by attending to the right color, similar to the one-cue condition. On the other
half of the trials, they would be attending to a non-dominant color. In this case,
performance would be either similar to the baseline, which seems likely given our
previous numerical reasoning (at the end of Experiment 1), or below baseline, if the small
difference in color proportion leads to incorrect responses. One way to test these
possibilities is to explicitly instruct participants to attend to only one color on a two-cue
trial. This essentially creates a situation where the cue is 50% valid, which we refer to as

1
“partial one-cue”. If performance in this condition still showed no improvement over
baseline, this would imply that participants indeed chose one cue to attend on the two-cue
trials in Experiments 1 & 2. If, however, performance in the partial one-cue trials was
better than baseline, then it would suggest that participants did not voluntarily choose one
cue to attend in the original two-cue trials, but that other factors limited their
performance.
Methods
Participants
Six students from Michigan State University participated in this experiment, one
of which participated in Experiments 1 & 2. All participants had normal or corrected-to-
normal acuity, as well as reported to have normal color vision. Participants gave
informed consent and were compensated at the rate of $10/hr.
Task and Procedures
The experiment was identical to Experiment 2, with the only difference being that
the two-cue condition was replaced by a partial one-cue condition in which a cue with
50% validity was presented on each trial; therefore, the cued color matched the dominant
color on half of the trials (valid trials) and a non-dominant color on the other half of the
trials (invalid trials). Valid and invalid trials were analyzed both together and separately,
thus, we ultimately analyzed five different cue types: no-cue (baseline), one-cue, valid
cue, invalid cue, and partial one-cue. The partial one-cue was intended to simulate
participants attending to a single cue on every trial of the two-cue condition. We did not
present two cues and ask participants to only attend to one, because the presence of two

1
cues could lead them to automatically attend to both colors, which would be impossible
to control.
Participants performed the task in blocks of 48 trials, within which the type of cue
(no-cue, one-cue, partial one-cue) was held constant. Cue type was indicated by a prompt
at the beginning of each block. Within a block, the dominant color, coherence level, and
cue location of the target color were all randomized. Forty-two blocks of trials were run,
with 12 blocks for the no-cue and one-cue conditions, and 18 blocks for the partial one-
cue condition. We had more blocks of the partial one-cue condition in order to collect an
adequate number of valid and invalid trials. The order of blocks was pseudo-randomized
such that for every seven blocks, the partial one-cue condition was presented three times,
while the no-cue and one-cue conditions were each presented twice. The order of the
conditions was randomized every seven blocks. The experiment was completed in two
hour-long sessions on separate days.
Results and Discussion
Accuracy was defined as the difference between the hit rate and false alarm rate.
For the partial one-cue condition, we calculated both the overall accuracy and separate
accuracies for valid and invalid trials. Thus, we ultimately analyzed five different cues
types: no-cue (baseline), one-cue, valid cue, invalid cue, and partial one-cue. Accuracy
showed a monotonic increase as a function of color coherence (Figure 7A). Compared to
the baseline condition (no-cue), the one-cue condition and valid cues in the partial one-
cue condition shifted the psychometric function to the left. Conversely, invalid cues did
not appreciably shift the psychometric function away from the baseline. Finally, the

2
overall performance in the partial one-cue condition was midway between that of valid
and invalid cues, and also midway between no-cue and one-cue conditions.
We also fitted individual participant data and obtained color coherence thresholds,
corresponding to 50% accuracy. Figure 7B shows the group-averaged thresholds for the
no-cue, one-cue, and partial one-cue conditions. We focused our comparison among these
three cue types without the valid and invalid conditions because the partial one-cue was
comprised of, and thus not independent from, valid and invalid cues. Thresholds were
significantly different from each other (F(2, 10)=36.78, p < 0.01). Post-hoc paired
comparisons showed that one-cue lowered the threshold compared to the baseline
(t(5)=7.30, p < 0.01) and partial one-cue (t(5)=4.85, p < 0.05). Critically, partial one-cue
also significantly lowered the threshold compared to the baseline (t(5)=5.94, p < 0.05).
We also compared thresholds in the valid and invalid trials to baseline and found that
valid cues lowered the threshold (mean=0.18, t(5)=5.91, p < 0.05), while invalid cues did
not change the threshold (mean=0.22, t(5)=1.02, p = 0.35).
Again, we found a robust cueing effect in the one-cue condition. Interestingly, the
partial one-cue condition also produced a reliable cueing effect compared to the baseline.
This was due to a positive cueing effect on the valid trials, and a lack of (but not
negative) cueing effect on the invalid trials. These two effects combined to give rise to an
overall smaller, but significant, cueing effect compared to the baseline. Thus, when we
explicitly instructed participants to attend to one cue with a 50% validity, we observed a
cueing benefit, unlike the two-cue condition in the previous experiments, which showed a
lack of any cueing benefit. The inference is thus that participants in the previous
experiments did not choose to attend only one cue on the two-cue trials, because if they

2
did, we should have observed a cueing benefit similar to the partial one-cue condition in
this experiment. Thus, the lack of cueing effects in the standard two-cue condition must
be due to other constraints in the attentional system, to which we turn our discussion in
the next section.
General Discussion
We measured the detection threshold for a weak color signal in a noisy stimulus
while manipulating the number of color cues to direct attention. Over four experiments
employing both single-interval and two-interval tasks, results showed a consistent
pattern: attending to one color improved performance, while attending to two colors did
not improve performance relative to a neutral baseline without any precue. These results
suggest that participants can only effectively attend to a single color at a time, indicating
a severe capacity limit of feature-based attention to color.
Capacity of feature-based attentional modulation
There are several design features of our experiments that afforded us to
investigate feature-based attentional modulation of sensory representations. First, we
measured detection threshold in a psychophysical task to index the sensitivity to color.
Second, we presented a single stimulus at fixation, thus eliminating the contribution of
spatial attention. The experimental design is similar to our previous work on attention to
motion directions (Liu, Becker, & Jigo, 2013). We also obtained mostly consistent results
with the motion study, in that attending to two features is less effective than attending to
one feature, but results differed when comparing the two-cue to the no-cue baseline.

2
Attending to two directions yielded better performance than the baseline, but attending to
two colors yielded similar performance as the baseline. As mentioned in the Introduction,
the former result is consistent with either participants attending to only one direction, or
with participants attending to two directions but with less efficiency. The color results are
less ambiguous in that they strongly suggest that participants can attend to only one color
at a time.
Although the color results are more definitive than the motion results, they also
raised a question, regarding the consistent observation that the two-cue condition did not
afford any performance benefit over the no-cue baseline. If participants could attend to
one color on the two-cue trials, then on half the trials they would attend to the target
color, similar to the one-cue condition, and on the other half of the trials they would
attend to the wrong color, which could be similar to the no-cue condition. If so, then on
average, performance on two-cue trials should be better than no-cue baseline, though this
performance benefit should be reduced. In Experiment 3, we explicitly tested this
hypothesis by asking participants to attend to only one color on two-cue trials (the partial
one-cue condition). Results from this experiment confirmed the above intuition in that
now the partial one-cue trials exhibited a small, but significant cueing effect over the no-
cue baseline. These results suggest that on the standard two-cue trials in Experiments 1
and 2, participants probably did not choose one color to attend, because if they did, the
two-cue condition should exhibit a cueing effect, like the partial one-cue condition.
Hence, the most likely explanation on two-cue trials is that participants attempted to
attend to both colors, but such an effort did not enhance either color’s representation.
Data from the one-cue condition showed that the attentional control mechanism can

2
enhance the representation of a single color. When two colors need to be simultaneously
attended, however, the limit in attentional control is such that neither color can be
enhanced. This interpretation is consistent with a similar finding in research on active
working memory templates, discussed below.
Because our previous results on motion (Liu, Becker, & Jigo, 2013) showed a
performance benefit in the two-cue condition relative to a no-cue baseline, it seems that
attention to motion direction has a higher capacity than attention to color. It is unclear
what caused this difference. One possibility is that participant can partially attend to two
directions; another possibility is that participants attended to one direction but the
enhancement spreads to neighboring directions. We favor the latter interpretation based
on considerations of parsimony, although further research is needed to understand the
basis of the observed difference between motion and color. Nevertheless, the overall
results demonstrate a highly limited capacity in attending to multiple features. Thus,
although subjectively it seems we are able to attend to multiple, or at least two, simple
features, psychophysical performance showed either a modest or no improvement over a
neutral condition. These results demonstrate a severe limit in the size of the attentional
focus for visual features, and could inform further development of theories of visual
attention (Wolfe, 1994; Tsotsos et al., 1995; Reynolds & Heeger, 2009; Lee & Maunsell,
2009).
Relationship to studies on attentional capture and working memory
Our results also have implications on a body of literature using contingent
attentional capture (Folk, Remington, & Johnston, 1992) to assess the capacity of the
2
attentional control setting (ACS). In this paradigm, the effect of peripheral, task-
irrelevant, color cues on identifying a subsequent target was measured, and the
interference effect of the cue (i.e., attentional capture) was taken as evidence that the
cued color was in the focus of attention. A number of studies have shown that cueing one
of two colors produced capture effect when searching for targets defined by either color,
suggesting that the ACS can contain two colors (Adamo et al., 2008; Moore &
Weissman, 2010; Irons, Folk, & Remington, 2012; Becker, Ravizza, & Peltier, 2015). In
another study using a visual search task, participants were asked to find a colored target
that can assume one of two possible colors among distractors of other colors (Beck,
Hollingworth, & Luck, 2012). From fixation duration patterns, the authors inferred that
simultaneously searching through both colors was possible, again supporting the notion
that ACS can contain two colors.
These above studies have exclusively tested the color feature, and they seem to
contradict our current claim that attention can be directed only to one color at a time.
However, it is not clear whether these different paradigms tap into the same process. We
measured how actively attending to colors improves detection sensitivity in a
psychophysical procedure, whereas studies on ACS measured how task-irrelevant colors
impaired performance, often in terms of a slowdown in response latency. Our task
presumably provided a more direct measure of the attentional modulation of early
sensory representations. The effects revealed in the ACS studies could be due to later
stages of processing such as sensory read-out and response selection. We have previously
made similar arguments in our motion study (Liu, Becker, & Jigo, 2013), with a caveat
that they were based on comparing two different feature dimensions (motion and color).

2
The present experiments further strengthened this argument by demonstrating the
capacity limit in attention to colors. This early vs. late conjecture is supported by
electroencephalography evidence that color congruency only modulated late event-related
potentials in a contingent capture paradigm, suggesting that ACS operates at stages after
initial selection (Adamo, Pun, & Ferber, 2010).
Another body of literature relevant to this discussion is the research examining
how working memory biases attentional selection. In this paradigm, participants were
first asked to remember some features for an upcoming memory test, which was followed
by an intervening visual search task in which the remembered features could appear as
distractors (Pashler & Shiu, 1999; Downing, 2000; Soto, Heinke, Humphreys, & Blanco,
2005). It was found that the memorized feature impeded search performance relative to a
non-memorized feature, which suggests that the memorized feature was part of the active
working memory. Given that it is generally believed that top-down attentional selection is
mediated by the content of active working memory (Wolfe, 1994; Desimone & Duncan,
1995; Hamker, 2005), we would expect that performance in our task should be related to
the number of active items in working memory. A recent theoretical synthesis based on
behavioral and neural data proposed that contents in visual working memory can be
divided into two states, an active state that contains only one item, and an accessory state
that contains the rest of the items in storage. Furthermore, the active memory
representation serves as an attention template that guides selection, whereas the accessory
items do not directly interact with attention (Olivers, Peters, Houtkamp, & Roelfsema,
2011). This view fits nicely with our results, which showed only one color in the
attentional focus. It is worth noting that the working memory studies used a very different

2
paradigm where the memory items were irrelevant to the search task and a distractor cost
was measured. Our paradigm required active attention to the features and measured how
detection sensitivity was improved by attention. Thus our results provide converging
evidence for the view that there is only one active attention template at a time (also see
Houtkamp & Roelfsema, 2009).
Interestingly, an analogous effect with our two-cue condition was reported in a
recent study on working memory’s guidance of attention (van Moorselaar, Theeuwes, &
Olivers, 2014). These investigators found that holding one color in working memory
produced a robust distractor cost, whereas holding two colors did not produce any cost,
compared to a neutral condition. It was suggested that when two colors are held in
working memory, neither item can become the active template (van Moorselaar,
Theeuwes, & Olivers, 2014). Our finding of a lack of cueing effect in the two-cue
condition is consistent with this suggestion. It could be the case that there is some
threshold activation that an item must surpass to become the active template, and the act
of attending to two items does not give enough activation to either item, thus rendering
neither item active.
Conclusions
Our results demonstrate that people cannot actively pay attention to more than one
color during a threshold detection task. These results are probably due to an inability to
simultaneously modulate multiple sensory representations. This view is consistent with
studies on different states of working memory and their influence on attention. Overall,

2
these studies reveal a severe bottleneck in our ability to attend to multiple features and
inform ways to optimize performance in visual tasks.

2
References
Adamo, M., Pun, C., Pratt, J., & Ferber, S. (2008). Your divided attention, please! The maintenance of multiple attentional control sets over distinct regions in space. Cognition, 107(1), 295–303.
Adamo, M., Pun, C., & Ferber, S. (2010). Multiple attentional control settings influence late attentional selection but do not provide an early attentional filter. Cognitive Neuroscience, 1(2), 102-110.
Arman, A. C., Ciaramitaro, V. M., & Boynton, G. M. (2006). Effects of feature-based attention on the motion aftereffect at remote locations. Vision Research, 46(18), 2968–2976.
Ball, K., & Sekuler, R. (1981). Cues reduce direction uncertainty and enhance motion detection. Perception & Psychophysics, 30(2), 119-128.
Beck, V. M., Hollingworth, A., & Luck, S.J. (2012). Simultaneous control of attention by multiple working memory representations. Psychological Science, 23(8), 887-898.
Becker, M. W., Ravizza, S. M., & Peltier, C. (2015). An inability to set independent attentional control settings by hemifield. Attention, Perception, & Psychophysics, 1-13.
Carrasco, M. (2006). Covert attention increases contrast sensitivity: Psychophysical, neurophysiological, and neuroimaging studies. In Visual Perception, S. Martinez-Conde, S. L. Macknik, L. M. Martinez, J. M. Alonso, and P. U. Tse, eds. (Amsterdam: Elsevier), pp. 33–70.
Cohen, M. R., & Maunsell, J. H. R. (2011). Using neuronal populations to study the mechanisms underlying spatial and feature attention. Neuron, 70(6), 1192-1204.
Cowan, N. (2001). The magical number 4 in short-term memory: A reconsideration of mental storage capacity. Behavioral and Brain Sciences, 24(1), 87–114.
Cousineau, D. (2005). Confidence intervals in within-subject designs: A simpler solution to Loftus and Masson’s method. Tutorials in quantitative methods for psychology, 1(1), 42-45.
Desimone, R., & Duncan, J. (1995). Neural mechanisms of selective visual attention. Annual Review of Neuroscience, 18(1), 193-222.
Downing, P. E. (2000). Interactions between visual working memory and selective attention. Psychological Science, 11(6), 467-473.
Dvorine, I. (1963). Dvorine Pseudo-Isochromatic Plates. Harcourt, Brace & World: New York, NY.
Folk, C. L., Remington, R. W., & Johnston, J. C. (1992). Involuntary covert orienting is contingent on attentional control settings. Journal of Experimental Psychology: Human Perception & Performance, 18(4), 1030–1044.

2
Hamker, F. H. (2005). The reentry hypothesis: the putative interaction of the frontal eye field, ventrolateral prefrontal cortex, and areas V4, IT for attention and eye movement. Cerebral Cortex, 15(4), 431-447.
Herrmann, K., Heeger, D.J. & Carrasco, M. (2012). Feature-based attention enhances performance by increasing response gain. Vision Research, 74, 10-20.
Houtkamp, R., & Roslfsema, P. R. (2009). Matching of visual input to only one item at any one time. Psychological Research, 73, 317-326.
Irons, J. L., Folk, C. L., & Remington, R. W. (2012). All set! Evidence of simultaneous attentional control settings for multiple target colors. Journal of Experimental Psychololgy: Human Perception & Performance, 38(3), 758–775.
Kaiser, P. K. (1991). Flicker as a function of wavelength and hetero-chromatic flicker photometry. In: Limits of vision (J. J. Kulikowski, V. Walsh, I. J. Murray, eds), pp. 171–190. Basingstoke: MacMillan.
Lankheet, M. J. M., & Vestraten, F. A. J. (1995). Attentional modulation of adaptation to two-component transparent motion. Vision Research, 35(10), 1401-1412.
Lee, B. B., Martin, P. R., & Valberg, A. (1988). The physiological basis of heterochromatic flicker photometry demonstrated in the ganglion cells of the macaque retina. Journal of Physiology, 404(1), 323-347.
Lee, J., & Maunsell, J. H. (2009). A normalization model of attentional modulation of single unit responses. PLoS ONE 4(2): e4651.
Liu, T., Becker, M. W., Jigo, M. (2013). Limited featured-based attention to multiple features. Vision Research. 85(7), 36-44.
Liu, T. & Hou, Y. (2011) Global feature-based attention to orientation. Journal of Vision, 11(10), 1-8.
Liu, T., Larsson, J., & Carrasco, M. (2007) Feature-based attention modulates orientation-selective responses in human visual cortex. Neuron, 55, 313-323.
Liu, T., Mance, I. (2011) Constant spread of feature-based attention across the visual field. Vision Research, 51, 26-33.
Liu, T., Stevens, S. T., & Carrasco, M. (2007). Comparing the time course and efficacy of spatial and feature-based attention. Vision Research, 47, 108-113.
Luck, S. J., & Vogel, E. K. (1997). The capacity of visual working memory for features and conjunctions. Nature, 390(6657), 279–281.
Martinez-Trujillo, J. C., & Treue, S. (2004). Feature-based attention increases the selectivity of population responses in primate visual cortex. Current Biology, 14, 744-751.
Maunsell, J. H. R., & Treue, S. (2006). Feature-based attention in visual cortex. Trends in Neurosciences, 29(6), 317-322.
Moore, K. S., & Weissman, D. H. (2010). Involuntary transfer of a top-down attentional set into the focus of attention: Evidence from a contingent attentional capture paradigm. Attention, Perception & Psychophysics, 72(6), 1495–1509.

3
Motter, B. C., & Belky, E. J. (1998). The guidance of eye movements during active visual search. Vision Research, 38, 1805–1815.
Newsome, W. T., & Pare, E. B. (1988). A selective impairment of motion perception following lesions of the middle temporal visual area (MT). The Journal of Neuroscience, 8(6), 2201-2211.
Olivers, C. N., Peters, J., Houtkamp, R., & Roelfsema, P. R. (2011). Different states in visual working memory: When it guides attention and when it does not. Trends in cognitive sciences, 15(7), 327-334.
Pashler, H., & Shiu, L. P. (1999). Do images involuntarily trigger search? A test of Pillsbury’s hypothesis. Psychonomic Bulletin & Review, 6(3), 445-448.
Posner, M.I. (1980) Orienting of attention. Quarterly Journal of Experiment Psychology, A, 32(1): 3–25.
Prins, N & Kingdom, F.A.A. (2009) Palamedes: Matlab routines for analyzing psychophysical data. http://www.palamedestoolbox.org
Reynolds, J. H., & Heeger, D. J. (2009). The normalization model of attention. Neuron, 61(2), 168-185.
Saenz, M., Buracas, G. T., & Boynton, G. M. (2002). Global effects of feature-based attention in human visual cortex. Nature Neuroscience, 5(7), 631-632.
Saenz, M., Buracas, G. T., & Boynton, G. M. (2003). Global feature-based attention for motion and color. Vision Research, 43, 629-637.
Scolari, M., Ester, E. F., & Serences, J. T. (2014). Feature- and object-based attentional modulation in the human visual system. In K. Nobre & S. Kastner (Eds.), Oxford Handbook of Attention. Oxford, UK: Oxford University Press.
Soto, D., Heinke, D., Humphreys, G. W., & Blanco, M. J. (2005). Early, involuntary top-down guidance of attention from working memory. Journal of Experimental Psychology: Human Perception & Performance, 31(2), 248.
Tsotsos, J. K., Culhane, S. M., Wai, W. Y. K., Lai, Y., Davis, N., & Nuflo, F. (1995). Modeling visual attention via selective tuning. Artificial Intelligence, 78(1), 507-545.
van Moorselaar, D., Theeuwes, J., & Olivers, C. N. (2014). In competition for the attentional template: Can multiple items within visual working memory guide attention? Journal of experimental psychology: human perception and performance, 40(4), 1450.
Wang, Y., Miller, J. R., & Liu, T. (2015). Suppression effects in feature-based attention. Journal of Vision, 15(5):15, 1-16.
White, A. L., & Carrasco, M. (2011). Feature-based attention involuntarily and simultaneously improves visual performance across locations. Journal of Vision, 11(6), 1-10.
Williams, L. G. (1966). The effect of target specification on objects fixated during visual search. Perception & Psychophysics, 1, 315– 318.

3
Wolfe, J. M. (1994). Guided Search 2.0: A revised model of visual search. Psychonomic Bulletin & Review 1(2): 202–238.
Zhang, W., & Luck, S. J. (2008). Discrete fixed-resolution representations in visual working memory. Nature, 453(8), 233-236.

3
Figures
Figure 1: A, Schematic of the checkerboard stimulus used in the isoluminance procedure.
Gray squares at a constant luminance and color squares (in this example, green) with
adjustable luminance were used to construct a counter-phase flickering checkerboard. B,
Average color values across participants from the isoluminance setting procedure during
Experiment 1a. The colors are generally muted because light colors (e.g., yellow and
orange) needed to be shown at lower luminance values to equate their subjective
brightness with dark colors (e.g., red and blue).

3
Figure 2. Schematic of trials in Experiment 1a. Each trial commenced with one of four
cue types: no-cue, one-cue, two-cue, and three-cue. The one, two, and three cue types
contained the color that would be the dominant color in the signal interval. Two intervals
of the color stimuli then followed, with one interval containing a larger proportion of one
color (signal interval) and the other containing an equal proportion of all six colors (noise
interval). Participants were instructed to report which interval contained the signal. In this
example, the signal is in the first interval, with the dominant color being purple.

3
Figure 3. Results from Experiment 1a. A, Group-averaged psychometric functions for
each cue type fitted with the Weibull function. Vertical dashed lines correspond to the
thresholds for each cue type. B, Group-averaged thresholds for each cue type. Error bars
are ± 1 SEM within subjects following the method of Cousineau (2005). Asterisks
indicate the significance level in paired t-tests (*: p < 0.05).

3
Figure 4. Results from Experiment 1b. A, Group-averaged psychometric functions for
each cue type fitted with the Weibull function. B, Group-averaged thresholds for each
cue type. Plotting conventions are the same as in Figure 3.
3
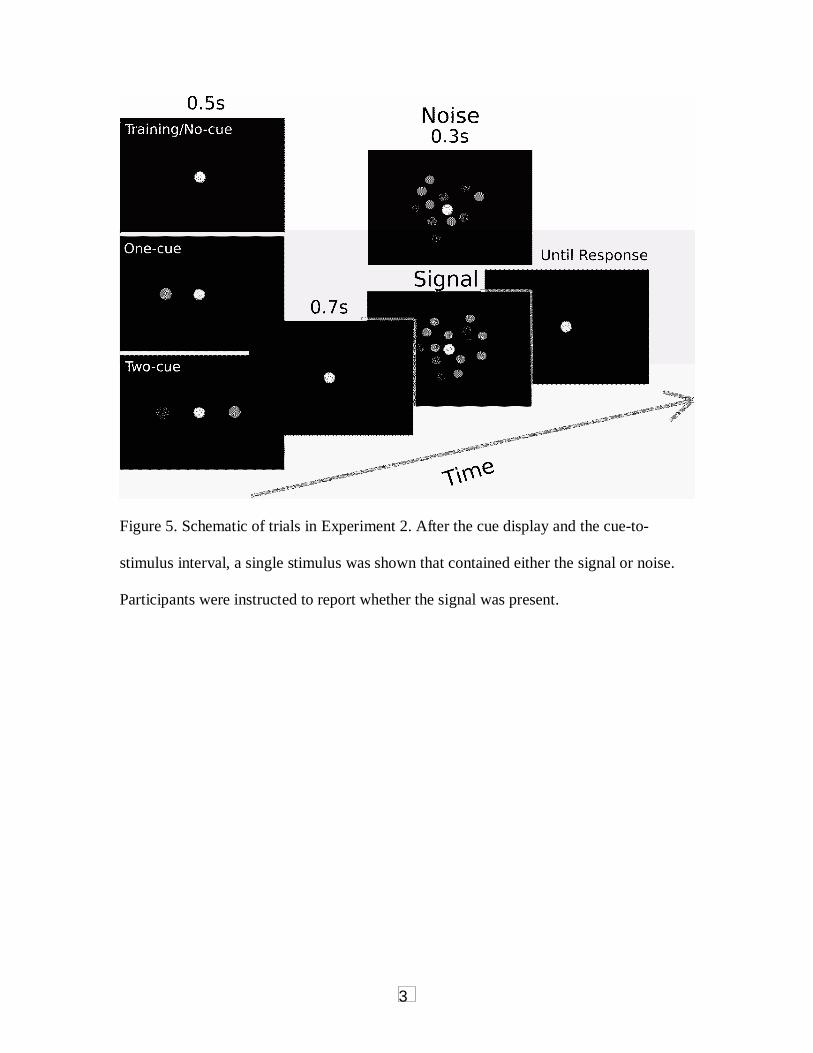
Figure 5. Schematic of trials in Experiment 2. After the cue display and the cue-to-
stimulus interval, a single stimulus was shown that contained either the signal or noise.
Participants were instructed to report whether the signal was present.

3
Figure 6. Results from Experiment 2. A, Group-averaged psychometric functions for each
cue type fitted with the Weibull function. B, Group-averaged thresholds for each cue
type. Plotting conventions are the same as in Figure 3.

3
Figure 7. Results from Experiment 3. A, Group-averaged psychometric functions for each
cue type fitted with the Weibull function. Vertical dashed lines correspond to the
thresholds for each cue type. B, Group-averaged thresholds for each cue type. Plotting
conventions are the same as in Figure 3 (*: p < 0.05; **: p < 0.01).