Embed Size (px)
Citation preview
Canonical Correlation between Strategic Design Requirements and
Performance Measures of Lean and Agile Supply Chains - A Case
Study in Small and Medium Enterprises
D.Venkata Ramana, J.Suresh Kumar, K.Narayana Rao
Abstract— Companies seeking to survive in the business need to meet the customer demands for variety, time, price and quality. The challenge faced by a supply chain delivering fashion products is to develop a strategy that will improve the match between supply and demand and enable the companies to respond faster to the market. These results in three fundamental supply chain strategies namely, lean strategy; agile strategy; lean and agile (leagile) strategy; A suitable supply chain can be designed once the relationship between strategic design requirements (SDRs) and supply chain performance measures (SPMs) is understood. The aim of this paper, is investigating interactions between SDRs and measures of supply chain performance. To do this after reviewing the literature and identification of SDRs and SPMs, a questionnaire in respect of lean and agile supply chain was developed and distributed to three types of medium and small scale industries, namely (i) apparel manufacturing (ii) automotive spare parts and (iii) electronic components. Canonical Correlation Analysis (CCA) was used to assess the relations between the SDRs and SPMs. Research findings indicate that that there is the significant and positive relationship between SDRs and SPMs.
Index Terms— Lean and Agile supply chain; Strategic design requirements; Performance Measures; Canonical Correlation
Analysis; small and Medium Enterprises.
—————————— ——————————
1. INTRODUCTION Small and medium companies contribute a large portion of a country’s GNP. The financial health and competitiveness of the SMEs, therefore, are critical for the nation’s economy. Supply chain in Small and Medium-Sized Enterprises (SMEs) is a set of business activities including purchase from open/spot market, manufacturing or processing of sub-components /sub-assembly within the plant and delivery to large enterprises using hired transportation to enhance value of end product and in-turn to ensure long-term regular purchase orders. Superior features and quality, as well as superior customer service, are ways that SMEs often use to differentiate their products and services from those of the more commoditized Large Enterprises, Porter [16]. Ph.D. Candidate, Dept of Mech Eng, JNTU, Hyderabad.,
Email: [email protected]
• Professor, Dept of Mechanical Engg
• Head of Mechanical Engg, GMR Paderu, Vizag
SME have played a significant role in the global supply chain and in the landscape of global business competition Chapman et al.[5].
The characteristics of SME suggest that the survival and success of these companies depend on their ability to compete in the market with providing/producing more at less cost, in less time, and higher quality. In particular, in the supply chain process, SME can improve their strategic positions by providing quality products/services to customers and strive to add value to meet the needs of the entire supply chain network. In this new information economy, the supply chain is geared toward the customer “pulling” products, customized to their specific needs, and the firm’s resources are organized to meet the unpredictable demand patterns of the customer. SME that exhibit innovative behavior can use partnership and integration strategies along with new information technologies to provide new products and services, business value to customers. The supply chain strategy must be in alignment with the competitive strategy. The literature on supply chain management it is observed that there are three kinds of supply chain strategies: lean strategy, agile strategy, and lean & agile (Leagile) strategy. Today companies involving manufacturing of volatile and unforeseeable products like apparel and automotive must pioneer in strategy such as the lean & agile supply chain.
International Journal of Scientific & Engineering Research, Volume 4, Issue 9, September-2013 ISSN 2229-5518 1537
IJSER © 2013 http://www.ijser.org
IJSER
Prabir and Helge [17], made a study to demonstrate improvement in the logistics processes in small and medium size companies through information exchange. SME as the suppliers would be able to access the retailer’s information systems to view stock levels and future requirements. On the other hand, Advanced Planning Systems (APSs) make it possible to include suppliers and customer relations in the planning procedure to optimize a whole supply chain on a real-time basis Kennerly, et.al. [11]. Tumaini and Qin Zheng [21], presented a case study on perceptions towards Adoption of Supply Chain Management Strategy in SMEs. The authors found that SMEs give less attention to supply chain management strategies, also reluctant to employ transparent integrated system to link them with other actors in the chain. Absence of compatible organization structures in SMEs is seen as a major obstacle for complete implementation of integration strategy. Asghar sabbaghi and Ganesh Vaidyanathan [3], made a study to develop a conceptual framework describing the SME strategies in a supply chain network. Despite the large number of SMEs and their essential role in supply chain, the literature around SMEs and Supply Chain Management (SCM) practices within them is still small and disperse, Quayle [18]. Chen et al [6], recognized that, besides the problems experienced due to structure of SMEs, their Integration through supply chains lead to the benefits namely, Standardization of production, Simplification of supply chain process, Automation of processes etc. Thakkar et al. [20], carried out a critical review of 77 related articles on the issues of SCM and SMEs, pointed out the growing importance of this research area and the need for further exploration with qualitative case based research to investigate issues in more depth within the strong social environment of SMEs. There is a high potential for researches on SMEs and SCM strategies of Large Enterprises (LEs), especially the ability and sustainability of SMEs to meet changing needs in the supply chain of LEs, by investigating the interaction between SMEs and supply chain of LEs, Sama Hamisi [21], made a study to identify challenges and opportunities for Tanzanian SMEs in adapting supply chain management. SMEs today are under pressure to better manage the supply chain and to improve efficiency and logistics operations while remaining responsive to changing market conditions and
customer demands. Manufacturers and distributors are forced to become more responsive to the retailers and consumers. Manufacturers/buying organizations have to reduce costs, decrease order cycle times, and improve their operating efficiencies. As a result, manufacturers are under pressure to better manage the supply chain and to improve manufacturing efficiency and logistics operations while remaining responsive to changing market conditions and customer demands. There are some challenges in implementing SCM practices includes minimizing inventory levels, transportation & logistic costs, setting of customer service level, complexities related to the global sourcing and non-utilization of latest technologies. In order to meet the customers’ demands SME’s supply chain is responsive to the customer needs and has the capacity to quickly meet the customer demand through mass customization or by postponement. SME’s supply chain has to be agile at the downstream end in response to meet the customer demand quickly. Efficient supply chain requires the ‘agility’ to enable it to meet the frequent changing market conditions. Whereas on the other hand i.e. the upstream section of supply chain requires the ‘leanness’ which mainly focuses on waste elimination. However, due to severe competition and increasing customer demand from the turbulent and unstable market, companies need to get competitive advantage not by simply adopting the lean principles but define and developing the other domains to create and carry out a more balanced approach [8], The overall result is a supply chain which is lean and responsive and suits for both the worlds. When supply chain is viewed in broad context then main point in the supply chain application may be ‘lean’ (efficient), ‘agile’ (responsive ) or mixture of lean and agile i.e. ‘leagile’. At present the current focus of on leagile supply chains are quested. On the other hand an agile supply chain for SME is market responsive. Christopher [7], describes a supply chain which is market sensitive, virtual, network based and possesses integrated processes is an agile supply chain. The lean and agile supply chain approaches are not two different or exclusive models in supply chain for SME operations, and are not to be viewed in opposition or isolation of each other. They can coexist if properly managed. In SME’s supply chain, the upstream part of the supply chain must be streamlined to eliminate all the waste and the downstream portion will be highly flexible and responsive or agile to respond rapidly to market signals. If we design Supply chain with the above qualities then it is possible to tie both the types of supply chains together to get the best. However the critical question lies that where the decoupling point or push and pull boundary which separates the lean process from agile. In manufacturing process, the supply chain is commonly
International Journal of Scientific & Engineering Research, Volume 4, Issue 9, September-2013 ISSN 2229-5518 1538
IJSER © 2013 http://www.ijser.org
IJSER
maintaining the strategic stock that buffers to meet the changes in customer demand, particularly in terms of both variety and volume Naim et al. [15]. When SMEs supply chain is said to be under control, the decoupling point has to be different at different conditions depending upon the global customer requirements. The leagile supply chain concept is very relevant to suit today’s highly competitive market conditions. By careful designing of supply chain and in accordance with the implementation of ‘legality’ would allow a SME to take out maximum benefit. For SMEs the leagile supply chain management must effective and should have the capacity to respond quickly and timely to the changes in the customer requirements and business goals. SMEs adopt different business tactics for downturns and for global economic buoyancy i.e for different scenarios. Boom periods naturally spell about abundant demand. In such periods Legality in SMEs have to ensure higher suppliers. On the other hand for SME’s supply chain downturns are much more challenging but Naim et al. [15], pointed that, the focus is to configure the product as delay as possible to allow a substantial element of flexibility and hence customer choice (or customization) while making the best use of standardized components.. Fynes et al. [9], investigated the dynamics of supply chain (SC) relationships impact on manufacturing performance. The authors developed a conceptual framework considering dimensions of SC relationship dynamics and manufacturing performance. Structural equation modeling was used to test the model. Fynes et al. [10], studied the relationship between supply chain requirement effects on supply chain performance. It is necessary to analyze relationship between the strategic design requirements and performance measures to better manage the supply chain to reduce order cycle times, costs , improve the operating efficiencies while remaining responsive to changing market conditions and customer demands in implementing SCM practices in SMEs. From the review of literature, it is observed that there is a limited study focusing on supply chain design requirements effect on Supply chain performance for lean and agile supply chains of SMEs. Hence, in this study the relationship between strategic design requirements and performance measures of lean and agile supply chains of small and medium enterprises is established using canonical correlation analysis. The data from the literature Venkata Ramana et al. [22, 23], is considered for the analysis.
2. STRATEGIC DESIGN REQUIREMENTS OF
LEAN AND AGILE SUPPLY CHAINS Strategic design requirements of the supply chains are the strategies that deal with the business processes through which company need to fulfill the customer needs. Venkata Ramana et al. [23], presented confirmatory factor analysis to determine the strategic design requirements (SDRs) for lean & agile supply chains are considered in the study. These SDRs namely, new product development, sourcing procedures, flexible manufacturing functions, demand management, use of information technology, supply chain net work design, and inventory reduction policies are of great importance in deciding the strategy. 2.1 Product Development (PD): Due to short period of product life cycle new product introduction to market as an appropriate and successful strategy. A product design strategy that shifts product differentiation closer to the consumer by postponing identity changes, such as assembly or packaging. 2.2 Sourcing (SOU): The superior criteria for selection should be: speed, flexibility, quality and price. There should be minimum and reliable suppliers. Just in time (JIT) supply processes ensure that certain parts of the product enter on the assembly line just in time to be fitted to the particular product. 2.3 Manufacturing (MFG): Flexible manufacturing concept may be adopted. Flexible manufacturing strategies are incorporated by a business to make a factory capable of producing multiple products/models. The strategy makes use of manufacturing tactics that can work to increase a company’s bottom line profits by reducing overhead costs. 2.4 Demand Management (DM): The customer’s demand is uncertain; products design may also need to be reconsidered several times. When the customer demand is unpredictable leagile supply chain is best suitable by deciding the decoupling point. 2.5 Information Technology (IT): IT has greatest influence on lead time, quality and service level. Information technology applied to inbound and outbound logistics to increases the speed of the information, providing faster and more accurate data for decision making. Service / Delivery on time and communication system for customer service qualify the supply chain as order winner. The information technology applied to the production justifies the use of lean tools in a productive environment, making the material and the information itself to flow faster.
International Journal of Scientific & Engineering Research, Volume 4, Issue 9, September-2013 ISSN 2229-5518 1539
IJSER © 2013 http://www.ijser.org
IJSER
2.6 Supply Chain network Design (SCN): Supply chain network design in upstream side should be based on minimizing cost and maximizing quality where as Supply chain network design in downstream side should be based on maximizing service level and minimizing lead time. 2.7 Inventory Management (INV): Enterprise-wide inventory will be lowest in the agile system. In lean & agile supply chain network Vendor Managed Inventory (VMI) played a critical role. The lean & agile supply chains include elements of both the lean and agile operations to minimize the inventory with specified service level. 3. SUPPLY CHAIN PERFORMANCE MEASURES The definition of organizational performance depends on the views of different stakeholders. Vickery et al. [24], considers that the organizational performance refers to how well an organization achieves its market-oriented goals as well as its financial goals. Thus, they set up the measurement performance items as return on assets, growth rate and market share. This study followed the indicators adopted by Barua et al. [4], and Li et al. [13], as the base for designing the questionnaire evaluating organizational performance, including market share, sale growth, ROI and green image. Venkata Ramana et al [23] presented a frame work for the application of confirmatory factor analysis to determine the adoption of performance measures for lean & agile supply chains are considered in the study. 3.1 Operational Performance (OP): In this study product cycle time, due date performance, cost and quality are considered as performance enablers under operational performance. These enablers will influence the competitors of the market. 3.2 Customer Service Performance (CSP): In this study, customer satisfaction, delivery dependability, responsiveness and order fill capacity are considered as performance enablers under logistic performance. 3.3 Flexibility (FL): In this study, Product Development Flexibility, Sourcing Flexibility, Manufacturing Flexibility, and Information Technology Flexibility are considered as performance enablers under flexibility. 3.4 ORGANISATIONAL PERFORMANCE (ORP): In this study, market share, return on investment (ROI), sales growth and green image are considered as performance enablers under organizational performance.
4. CANONICAL CORRELATION ANALYSIS Canonical correlation Analysis is a multivariate statistical model that facilitates the study of interrelationships among set of multiple dependent variables and multiple independent variables. Canonical correlation simultaneously predicts multiple dependent variables from multiple independent variables. This approach is used for measuring linear relationship between different groups of variables. This approach can also play an important role in exploratory mean when multi attribute variables have some relations to an analytical category Lima et al. [14]. CCA is obtaining linear composition of predicting variables that has the most correlation with linear combination of criteria variables, Le
Clere et al.[12]. The analysis is based upon the derivation of canonical functions. Numbers of canonical functions are equal to minimum number among the dependent variables and the number of independent variables. Canonical correlation is the measure of the strength of the overall relationships between the linear composites (canonical variates) for the independent and dependent variables. In effect, it represents the bi-variate correlation between the two canonical variates. Mohaghar et al. [1], Used Canonical Correlation Analysis, to examine the interdependencies between supply chain relation quality and supply chain performance in automotive industry in Iran. Ali and Rohollah [1], investigated the interactions between indicators of supply chain relationship quality (SCRQ) and SCP in a supply chain (SC). To assess the relations between the set of SCRQ and SCP, canonical correlation analysis (CCA) was used. Ali and Rohollah [2], developed a conceptual model for supply relationship quality (SCRQ) and Supply Chain Performance (SCP) in supply chain (SC) through structural equation modeling. The authors found that SCRQ will positively influence SCP meaningfully. Also “Communication”, “Commitment” & “Atmosphere” are fairly most important dimensions of SCRQ and in the SCP “Delivery performance” and “Quality performance” are fairly most important dimensions of SCP. 5. PROPOSED MODEL This Proposed model is composed of two kinds of variables: Strategic Design Requirements (SDRs) and Supply chain Performance Measures (SPMs). In this Study SDRs namely, product development (PD), sourcing (SOU), Manufacturing (MFG), Demand management (DM), Information Technology (IT), Supply chain Network Design (SCN) and Inventory Management (INV) are considered. Operational Performance (OP), Customer Service Performance (CSP), Organizational
International Journal of Scientific & Engineering Research, Volume 4, Issue 9, September-2013 ISSN 2229-5518 1540
IJSER © 2013 http://www.ijser.org
IJSER
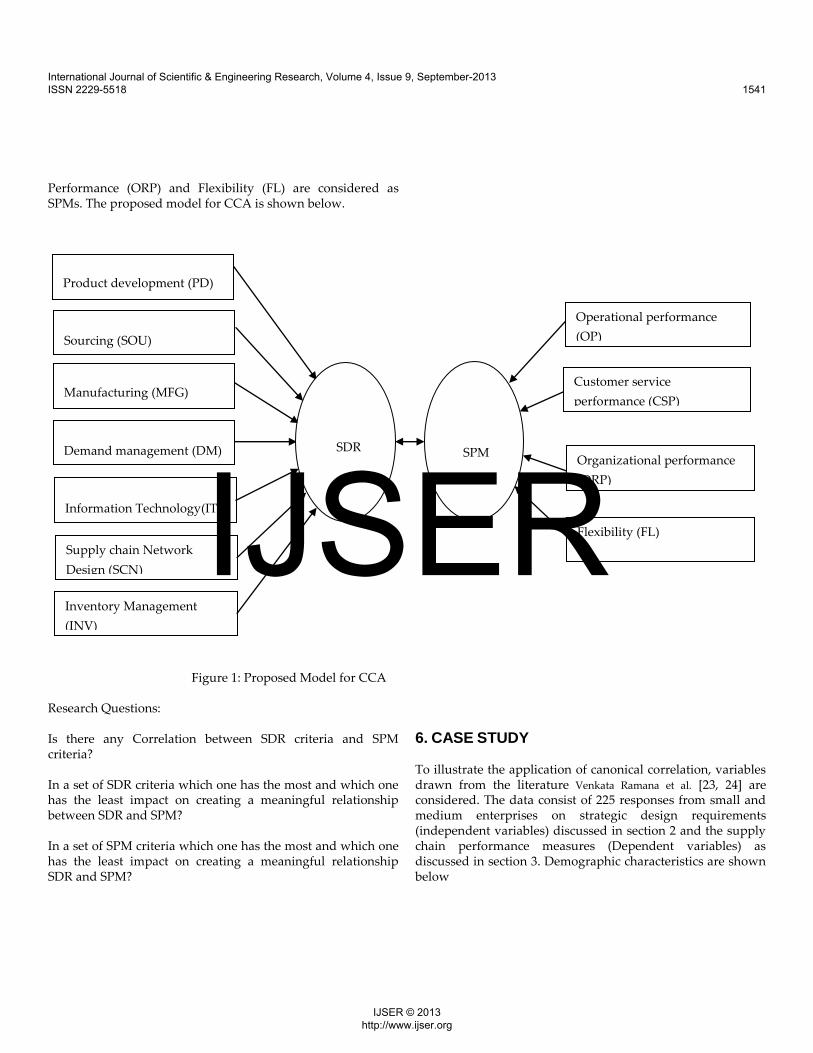
Performance (ORP) and Flexibility (FL) are considered as SPMs. The proposed model for CCA is shown below.
Figure 1: Proposed Model for CCA Research Questions: Is there any Correlation between SDR criteria and SPM criteria? In a set of SDR criteria which one has the most and which one has the least impact on creating a meaningful relationship between SDR and SPM? In a set of SPM criteria which one has the most and which one has the least impact on creating a meaningful relationship SDR and SPM?
6. CASE STUDY To illustrate the application of canonical correlation, variables drawn from the literature Venkata Ramana et al. [23, 24] are considered. The data consist of 225 responses from small and medium enterprises on strategic design requirements (independent variables) discussed in section 2 and the supply chain performance measures (Dependent variables) as discussed in section 3. Demographic characteristics are shown below
Product development (PD)
Sourcing (SOU)
Inventory Management
(INV)
Manufacturing (MFG)
Demand management (DM)
Information Technology(IT)
Supply chain Network
Design (SCN)
SDR
Flexibility (FL)
Organizational performance
(ORP)
Operational performance
(OP)
Customer service
performance (CSP)
SPM
International Journal of Scientific & Engineering Research, Volume 4, Issue 9, September-2013 ISSN 2229-5518 1541
IJSER © 2013 http://www.ijser.org
IJSER
TABLE 1:
DEMOGRAPHIC CHARACTERISTICS
Feature Category Frequen
cy Percentage
Business function
Production Purchasing Sales & Distribution
65 52
108
29 23 48
Type of Industry
Apparel Automotive electronics
18 10 14
42.85 23.81 33.34
Size of the Firm
<50 50-100 100-200
10 18 14
23.81 42.85 33.34
Customer Type
Retailer Bulk Manufacturer Distributor Customer direct
09 10 15 08
21.43 23.81 35.71 19.05
Experience of Employees
< 2 years Years >5 years
56 75 94
24.89 33.33 41.78
STATISTICA 7 software is used for Canonical correlation analysis. Illustration of the canonical correlation for the above case study is discussed below. 6.1 CORRELATION BETWEEN STRATEGIC DESIGN
REQUIREMENTS (SDRS)
TABLE: 2 CORRELATION BETWEEN STRATEGIC DESIGN REQUIREMENTS
RDSs
PD SOU MFG DM IT SCN INV
PD 1 0.8229
0.9489
0.9367
0.8423
0.7870
0.7828
SOU 0.8229
1 0.8763
0.8051
0.8117
0.8353
0.8877
MFG 0.9489
0.8763
1 0.9331
0.8432
0.8079
0.8148
DM 0.9367
0.8051
0.9331
1 0.8238
0.7760
0.7983
IT 0.8423
0.8117
0.8432
0.8238
1 0.8551
0.8214
SCN 0.7870
0.8353
0.8079
0.7760
0.8551
1 0.8002
INV 0.7828
0.8877
0.8148
0.7983
0.8214
0.8002
1
From the results shown in the table 2 indicates that there is a strong positive correlation among SDRs. From the results it is observed that Product development has strong correlation (0.9489) on Manufacturing and demand management (0.9367). Sourcing shows similar strong correlation on other SDRs. Manufacturing shows relatively strong positive correlation (0.9331) on demand management In case of demand management it shows relatively strong positive correlation (0.8238) with information technology. IT shows similar strong correlation on other SDRs. Supply chain network shows relatively strong positive correlation (0.8551) on IT. Inventory shows relatively strong positive correlation (0.8877) on sourcing. 6.2 CORRELATION BETWEEN PERFORMANCE MEASURES
(PMS)
TABLE: 3 CORRELATION BETWEEN PERFORMANCE MEASURES
PM’s OP CSP ORP FL
OP 1 0.8098 0.7368 0.7269
CSP 0.8098 1 0.7639 0.7279
ORP 0.7368 0.7639 1 0.7817
FL 0.7269 0.7279 0.7817 1
Table 3 shows the correlation among the performance measures. From the results it is observed that operational performance has relatively strong positive correlation (0.8098) on customer service performance. Operational performance shows similar correlation on other performance measures. Organizational performance is positive correlation (0.7817) on flexibility.
International Journal of Scientific & Engineering Research, Volume 4, Issue 9, September-2013 ISSN 2229-5518 1542
IJSER © 2013 http://www.ijser.org
IJSER
6.3 CORRELATION COEFFICIENT BETWEEN SDRS AND
SPMS
TABLE: 4 CORRELATION COEFFICIENTS
SDR’s/ PM’s
OP CSP ORP FL
PD 0.8017 0.7864 0.7494 0.7116
SOU 0.8316 0.7418 0.7054 0.7467
MFG 0.8480 0.7960 0.7644 0.7216
DM 0.8107 0.7898 0.7741 0.7214
IT 0.8485 0.8374 0.7754 0.8452
SCN 0.8582 0.7976 0.7306 0.7446
INV 0.8156 0.7419 0.6720 0.6960
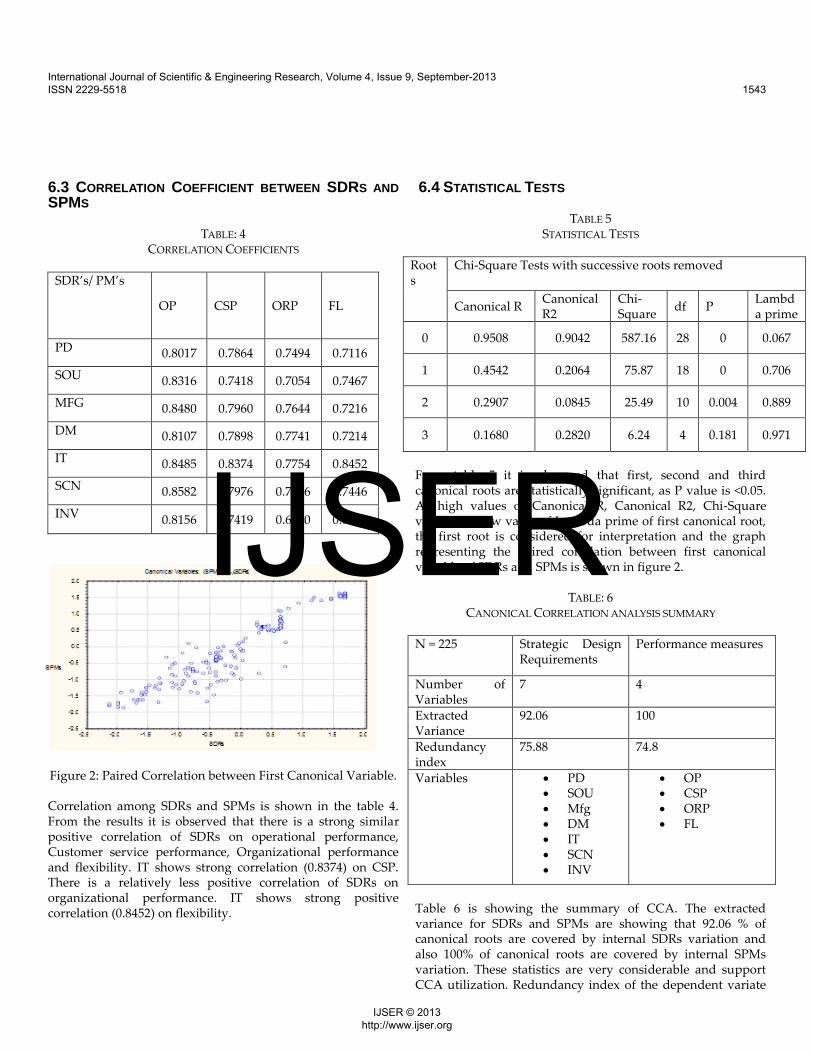
Figure 2: Paired Correlation between First Canonical Variable. Correlation among SDRs and SPMs is shown in the table 4. From the results it is observed that there is a strong similar positive correlation of SDRs on operational performance, Customer service performance, Organizational performance and flexibility. IT shows strong correlation (0.8374) on CSP. There is a relatively less positive correlation of SDRs on organizational performance. IT shows strong positive correlation (0.8452) on flexibility.
6.4 STATISTICAL TESTS
TABLE 5 STATISTICAL TESTS
Roots
Chi-Square Tests with successive roots removed
Canonical R Canonical R2
Chi-Square
df P Lambda prime
0 0.9508 0.9042 587.16 28 0 0.067
1 0.4542 0.2064 75.87 18 0 0.706
2 0.2907 0.0845 25.49 10 0.004 0.889
3 0.1680 0.2820 6.24 4 0.181 0.971
From table 5 it is observed that first, second and third canonical roots are statistically significant, as P value is <0.05. As high values of Canonical R, Canonical R2, Chi-Square values and low value of Lambda prime of first canonical root, the first root is considered for interpretation and the graph representing the paired correlation between first canonical variable of SDRs and SPMs is shown in figure 2.
TABLE: 6 CANONICAL CORRELATION ANALYSIS SUMMARY
N = 225 Strategic Design
Requirements Performance measures
Number of Variables
7 4
Extracted Variance
92.06 100
Redundancy index
75.88 74.8
Variables PD SOU Mfg DM IT SCN INV
OP CSP ORP FL
Table 6 is showing the summary of CCA. The extracted variance for SDRs and SPMs are showing that 92.06 % of canonical roots are covered by internal SDRs variation and also 100% of canonical roots are covered by internal SPMs variation. These statistics are very considerable and support CCA utilization. Redundancy index of the dependent variate
International Journal of Scientific & Engineering Research, Volume 4, Issue 9, September-2013 ISSN 2229-5518 1543
IJSER © 2013 http://www.ijser.org
IJSER
(SPMs) is 74.8% represents the amount of variance in the dependent variables explained by the independent (SDRs) canonical variate. Also, redundancy index of the independent variate (SDRs) is 75.88% represents the amount of variance in the independent variables explained by the dependent (SPMs) canonical variate indicates significant determination of the model. Interpreting canonical functions involves examining the sign and the magnitude of the canonical weight assigned to each variable in its canonical variate. Variables with relatively larger weights contribute more to the variates, and vice versa. Similarly, variables whose weights have opposite signs exhibit an inverse relationship with each other, and variables with weights of the same sign exhibit a direct relationship.
TABLE 7 FACTOR STRUCTURE OF SDRS
Table 7 indicates the canonical factor loadings of SDRs. These loadings can be interpreted as loadings in factor analysis. The values represent the correlation between the variables with the respective canonical variate (SDRs). The results indicate that IT, SCN, MFG, SOU, DM PD and INV are highly correlated with the strategic design requirements of lean and agile supply chains. The variance extracted (82.78%) and redundancy (74.84%) indicates that significance of the above variables in the SDRs
Table 8 indicates the canonical factor loadings of SPMs. The values represent the correlation between the variables with the respective canonical variate (SPMs). The results indicate that OP, CSP, FL, and ORG are highly correlated with the lean and agile supply chain performance. The variance extracted (80.35%) and redundancy (72.65%) indicates that significance of the above variables in the SPMs.
TABLE: 8 FACTOR STRUCTURE OF SPMS.
7.0 CONCLUSION The study is made to analyze the relationship between SDRs and SPMs by using CCA for lean and agility of SMEs supply chains. In this study, criteria of SDRs and SPMs are considered from the literature. Questionnaire is devised and distributed employees, suppliers, distributor’s, customers and other professionals of SMEs comprising of apparel manufacturing, automotive spare parts and electronic components. Analysis is carried out from responses by utilizing CCA. From the study it is observed that there is correlation between SDR criteria and SPM criteria. It is also observed that in a set of SDR criteria, supply chain network has the most and product development has the least impact on operational performance. In case of CSP, information technology has the most and sourcing has the least impact. Information Technology has the most and inventory has the least impact on organizational performance. In case of flexibility, information technology has the most and inventory has the least impact. Further, all the SPM criteria have strong impact on creating a meaningful relationship with SDRs. Findings in this research are useful to analyze further the relationship between SDRs and SPMs. In addition, the model also can help managers to improve their understanding of performance measurement of lean and agile supply chains and enables decision makers to assess the performance of leagile supply chains. This study can be extended to evaluate the efficiency of Lean and agile supply chains basing on both strategic design requirements and performance measures. Also, the study can be extended to analyze the relationships between SDRs, SPMs, and organizational characteristics.
SDRs Root 1
Product Development (PD) 0.8870
Sourcing (SOU) 0.8981
Manufacturing (MFG) 0.9171
Demand Management (DM) 0.8976
Information Technology (IT) 0.9673
Supply chain Network (SCN) 0.9268
Inventory (INV) 0.8712
Performance Measurers Root 1
Operational performance (OP) 0.9472
Customer service performance (CSP) 0.9037
Organizational performance (ORP) 0.8492
Flexibility (FL) 0.8826
International Journal of Scientific & Engineering Research, Volume 4, Issue 9, September-2013 ISSN 2229-5518 1544
IJSER © 2013 http://www.ijser.org
IJSER
8. REFERENCES [1]. Ali Mohaghar and Rohollah Ghasemi, (2011), A Conceptual Model for
Supply Chain Relations Quality and Supply Chain Performance by
Structural Equation Modeling: A Case Study in the Iranian Automotive
Industry, European Journal of Social Sciences – Volume 21, Number 3,
456-470
[2]. Ali Mohaghar, Hossein Safari, Rohollah Ghasemi, Behzad Abdullahi
and Mohammad Hasan Maleki, (2011), Canonical Correlation Analysis
between Supply Chain Relationship Quality and Supply Chain
Performance: A Case Study in the Iranian Automotive Industry ,
International Bulletin of Business Administration, X, 10, 122-134. [3]. Asghar sabbaghi and Ganesh Vaidyanathan (2005), Small to Medium
Size Enterprises and Supply Chain Strategies, Proc ISECON, v22, pp. 1-9;
[4]. Barua, A., Konana, P. and Whinston, A. B., 2004, “An empirical
investigation of Net-Enabled business value,” MIS Quarterly, Vol. 28, No.
4, pp. 585-616. [5]. Chapman, S., L. P. Ettkin, M. M. Helms (2000). “Do Small Businesses
Need Supply Chain Management?” IIE Solution, 32(8): 31.
[6]. Chen H, Themistocleous M, Chiu KH (2003). Interorganisational
Application Integration: the Case of 15 Taiwan's smes. Las Vegas, Nevada,
USA: Proceedings of ISO World Conference
[7]. Christopher M (1999). Responding to the Global Supply Chain
Challenge. SCM Rev. Winter., 7-9
[8]. Cusumano MA (1994). The Limits of "Lean", Sloan Manage. Rev.,
35(4): 27-32.
[9]. Fynes, B.; Voss, C. and Búrca, S. de (2005), "The impact of supply chain
relationship dynamics on manufacturing performance", International
Journal of Operation & Production Management, 25 (1) (2005), pp. 6–19.
[10]. Fynes, B.; Mangan.J and Búrca, S. de (2008), "The effect of
relationship characteristics on relationship quality and performance",
International Journal of Production Economics, Volume 111, Issue 1,
January 2008, pp. 56-69.
[11]. Kennerly, M., A. Neely (2001). “Enterprise Resource Planning:
Analyzing and Impact.” Integrated Manufacturing System, 12(2):103-113.
[12]. Le Clere, J.Marc (2006)."Bankruptcy studies and ad hoc variable
selection: a canonical Correlation analysis". Review of Accounting and
Finance.Vol. 5 No. 4, pp. 410-422.
[13]. Li, S., Ragu-Nathan, B., Ragu-Nathan, T. S. and Rao, S. S., 2006, “The
impact of supply chain management practices on competitive advantage
and organizational performance,” Omega, Vol. 34, No. 2, pp. 107-124.
[14]. Lima, M. A. M.; Resende, M. & Hasenclever, L. (2004)."Skill
enhancement efforts and firm performance in the Brazilian chemical
industry: An exploratory canonical correlation analysis research note"
.International Journal of Production Economics, Volume 87, Issue 2, 28
January, pp. 149-155.
[15]. Naim M, Naylor J, Barlow J (1999). Developing Lean and Agile
Supply Chains in the UK House building Industry. University of
California and Berkeley, CA, USA.
[16]. Porter, M.E. (1985). Competitive Advantage. Free Press, New York,
NY.Prentice hall, 2005. pp. 830.
[17]. Prabir K. Bagchi and Helge Virum (2000), Logistics Competence in
Small and Medium-Sized Enterprises: The Norwegian Experience, Supply
Chain forum An International Journal, No. 1, 46-55.
[18]. Quayle, M. (2003). A study of supply chain management practices in
UK industrial SMEs. Supply Chain Management – An International
Journal, Vol. 8 No. 1, pp. 79-86.
[19]. Sama Hamisi,(2011), Challenges and opportunities of Tanzanian
SMEs in adapting supply chain management, African Journal of Business
Management Vol. 5(4), pp. 1266-1276.
[20]. Thakkar J, Kanda A, Deshmukh SG (2008) Interpretive structural
modeling (ISM) of IT-enablers for Indian manufacturing SMEs. Inf Manag
& Comput Secur 16(2):113–136
[21]. Tumaini Mujuni Katunzi and Qin Zheng (2010), Tanzanian SMEs’
Perceptions towards Adoption of Supply Chain Management (SCM)
Strategy, International Journal of Business and Management Vol. 5, No.
10, 42-5
[22]. Venkata Ramana. D., Narayana Rao.K., Suresh Kumar. J. and
Venkatasubbaiah. K., (2012), Identification of Measurement items of
design requirements for lean and agile supply chains- Confirmatory
Factor Analysis, International Journal of Quality Research, X, X, 939-948
[23]. Venkata Ramana. D., Narayana Rao.K., Suresh Kumar. J. and
Venkatasubbaiah. K.,(2013), Prioritization of Strategic Design
Requirements for Lean & Agile supply chains, International Journal of
Advanced Research in Engineering and Applied Sciences, 2,1,62-82.
[24]. Vickery, S. K., Droge, C. and Markland, R. E., 1991, “Production
competence and business strategy: Do they affect business performance?”
Decision Science, Vol. 24, No. 2, pp. 435-455.
International Journal of Scientific & Engineering Research, Volume 4, Issue 9, September-2013 ISSN 2229-5518 1545
IJSER © 2013 http://www.ijser.org
IJSER