Embed Size (px)
Citation preview

Cancer Cell
Article
SIRT3 Is a Mitochondria-Localized Tumor SuppressorRequired for Maintenance of MitochondrialIntegrity and Metabolism during StressHyun-Seok Kim,1,7 Krish Patel,2,7 Kristi Muldoon-Jacobs,2 Kheem S. Bisht,2 Nukhet Aykin-Burns,3 J. Daniel Pennington,2
Riet van der Meer,4 Phuongmai Nguyen,2 Jason Savage,2 Kjerstin M. Owens,6 Athanassios Vassilopoulos,1
Ozkan Ozden,2 Seong-Hoon Park,2 Keshav K. Singh,6 Sarki A. Abdulkadir,4 Douglas R. Spitz,3 Chu-Xia Deng,1,*and David Gius2,5,*1Genetics of Development and Disease Branch, NIDDK, NIH, Bethesda, MD 20892, USA2Molecular Radiation Oncology, Radiation Oncology Branch, Center for Cancer Research, NCI, NIH, Bethesda, MD 20892, USA3Free Radical and Radiation Biology Program, Department of Radiation Oncology, University of Iowa, Iowa City, IA 52242, USA4Department of Pathology5Department of Radiation Oncology
Vanderbilt University Medical Center, Nashville, TN 37232, USA6Department of Cancer Genetics, Roswell Park Cancer Institute, Buffalo, NY 14263, USA7These authors contributed equally to this work*Correspondence: [email protected] (C.-X.D.), [email protected] (D.G.)
DOI 10.1016/j.ccr.2009.11.023
SUMMARY
The sirtuin gene family (SIRT) is hypothesized to regulate the aging process and play a role in cellular repair.This work demonstrates that SIRT3�/�mouse embryonic fibroblasts (MEFs) exhibit abnormal mitochondrialphysiology as well as increases in stress-induced superoxide levels and genomic instability. Expression ofa single oncogene (Myc or Ras) in SIRT3�/� MEFs results in in vitro transformation and altered intracellularmetabolism. Superoxide dismutase prevents transformation by a single oncogene in SIRT3�/� MEFs andreverses the tumor-permissive phenotype as well as stress-induced genomic instability. In addition,SIRT3�/� mice develop ER/PR-positive mammary tumors. Finally, human breast and other human cancerspecimens exhibit reduced SIRT3 levels. These results identify SIRT3 as a genomically expressed, mitochon-dria-localized tumor suppressor.
INTRODUCTION
An emerging theme in aging research is that sirtuin genes appear
to regulate longevity in a wide variety of living systems from yeast
to mammals (Sinclair, 2005; Tissenbaum and Guarente, 2001).
Sirtuin genes are the human and murine homologs of the
Saccharomyces cerevisiae Sir2 gene, which has been shown
to regulate both replicative and overall life span (Guarente and
Kenyon, 2000). The sirtuin genes are also central to the regula-
tion of longevity in C. elegans and D. melanogaster (Rogina
SIGNIFICANCE
The incidence of human malignancies increases significantly w(longevity) and carcinogenesis. One aspect of that connection iaging cells and cancer cells as aberrant oxidative metabolismand D. melanogaster, and in mammals, three of the seven sirtuThese observations led us to hypothesize that SIRT3 might bemaintaining mitochondrial integrity and efficient oxidative mefunction of SIRT3 results in a cellular environment permissivemetabolism.
and Helfand, 2004). The mammalian sirtuin family consists of
seven NAD+-dependent protein deacetylases that are localized
to the nucleus (SIRT1, SIRT6, and SIRT7), mitochondria (SIRT3,
SIRT4, and SIRT5), and cytoplasm (SIRT2), respectively, and
that regulate a wide range of intracellular process (Haigis and
Guarente, 2006).
The incidence of human malignancies increases exponentially
as a function of aging, suggesting a mechanistic connection
between aging (longevity) and carcinogenesis (Finkel et al.,
2009). Mammalian cells contain fidelity proteins or tumor
ith age, suggesting a mechanistic connection between agings impaired mitochondrial function, which is observed in both. Sirtuin family genes regulate longevity in yeast, C. elegans,in genes are localized to the mitochondria, including SIRT3.a tumor suppressor that protects against carcinogenesis bytabolism. The current work demonstrates that the loss offor carcinogenesis and characterized by aberrant oxidative
Cancer Cell 17, 41–52, January 19, 2010 ª2010 Elsevier Inc. 41

Figure 1. SIRT3 Knockout MEFs Exhibit
Increased Superoxide Levels, Aneuploidy
in Response to Exogenous Stress, and
Decreased Mitochondrial Integrity with
Increasing Age
(A) Superoxide levels were elevated in SIRT3
knockout cells exposed to agents that induce
mitochondrial damage. SIRT3+/+ and SIRT3�/�
MEFs were cultured in 6% oxygen and exposed
to either 5 Gy of IR or 5 mM antimycin A for 3 hr,
and superoxide levels were monitored by DHE
oxidation as compared to control, untreated cells
(Cont). For all DHE oxidation experiments, the
results were the normalized mean fluorescence
intensity (MFI) for three independent replicates.
(B) SIRT3�/� superoxide levels were elevated
when cultured in 21% oxygen. SIRT3+/+ and
SIRT3�/� MEF cells were cultured at 21% O2 for
6 hr, and superoxide levels were monitored by
DHE oxidation, as compared with control cells
grown at 6% O2.
(C) Mitochondrial superoxide levels are elevated in
SIRT3 knockout MEFs and increase following
exogenous stress. Mitochondrial superoxide
levels were determined by the addition of Mito-
SOX (3 mM) to the culture medium and cells were
incubated for an additional 10 min before being
trypsinized and resuspended. Fluorescence was
measured via flow cytometry, and 20,000 and
40,000 cells were counted for each sample.
(D) SIRT3 knockout MEFs exhibited aneuploidy
following exposure to IR. SIRT3+/+ and SIRT3�/�
MEFs were exposed to either 2 or 5 Gy. Whole-
mount chromosomes were counted in a blinded
fashion. Bars show the mean chromosome
number per cell from 100 separate counts.
(E) Livers from SIRT3 knockout mice have increased mtDNA damage with age. DNA was isolated from the livers of SIRT3 wild-type and knockout mice at 20, 36,
and 58 weeks, and mtDNA primers that amplify either the 10 kb amplicon or a 117 bp region (Figure S4A) were used for PCR. Primers to the genomic b-globin
gene were used as a control.
(F) SIRT3 knockout MEFs have decreased mtDNA integrity. DNA was isolated from SIRT3+/+ and SIRT3�/�MEFs at passage 2, 6, and 10, and mtDNA primers that
amplify either the 10 kb amplicon used for PCR. All the results in this figure are from at least three separate experiments. Data are presented as the average ± SD;
*p < 0.05 by t test. See also Figure S1.
Cancer Cell
SIRT3 Is a Mitochondria-Localized Tumor Suppressor
suppressor (TS) genes, such as p53, and loss of function of these
proteins results in a damage-permissive cell phenotype (Sherr,
2004). As such, the loss of function of these fidelity proteins is
considered an early event in carcinogenesis. Because cancer
is a disease of aging, and sirtuin genes appear to play a role in
repair of cellular damage during aging, it is reasonable to
propose that sirtuin genes may also have an anticarcinogenic
role and function as TSs (Saunders and Verdin, 2007; Wang
et al., 2008). If so, it follows that loss of function of sirtuin genes
may contribute to a tumor-permissive phenotype (Deng, 2009).
It has also been suggested that the mitochondria play a
central role in aging and carcinogenesis by generating reactive
oxygen species as a byproduct of respiration (Singh, 2006).
Mitochondrial abnormalities associated with altered oxidative
metabolism are observed in tumor cells in vitro and in vivo and
appear to contribute to a chronic condition of oxidative stress
(Hsu and Sabatini, 2008). SIRT3 is one of the three genomically
expressed sirtuins that localize to mitochondria (Onyango
et al., 2002; Schwer et al., 2002) and is the primary mitochon-
drial protein deacetylase (Lombard et al., 2007). In this regard,
it is proposed that SIRT3 is ideally situated to function as
42 Cancer Cell 17, 41–52, January 19, 2010 ª2010 Elsevier Inc.
a mitochondrial fidelity protein, and by extension, loss of function
could result in a damage-permissive and tumorigenic cellular
environment.
RESULTS
SIRT3 Knockout MEFs Exhibit Increased SuperoxideLevels and Chromosomal Instability in Responseto Exogenous StressWe have previously shown that HCT116 cells genetically altered
to express a deacetylation-null mutant SIRT3 gene (SIRT3dn)
have difficulty responding to increased reactive oxygen species
(Jacobs et al., 2008). In addition, it has previously been shown
that SIRT3�/� livers and MEFs have decreased total ATP levels
and mitochondrial respiration (Ahn et al., 2008). As such,
steady-state levels of superoxide were determined in SIRT3+/+
and SIRT3�/� MEFs by following the oxidation of dihydroethi-
dium (DHE) as mean fluorescence intensity. No differences in
total cellular DHE oxidation levels were seen between the wild-
type and SIRT3 knockout MEFs that are cultured in 6% oxygen
for these studies unless otherwise stated (Figure 1A). However,

Cancer Cell
SIRT3 Is a Mitochondria-Localized Tumor Suppressor
in MEFs from a transgenic mouse expressing SIRT3dn, a roughly
2-fold increase in superoxide levels was observed (see
Figure S1A available online).
In contrast, a difference was observed in cells treated with
two stress-inducing exogenous agents. Ionizing radiation (IR)
and antimycin A, a mitochondrial electron transport chain
(Complex III) inhibitor, represent genotoxic and metabolic
stresses, respectively, that have been hypothesized to cause
an increase in mitochondrial superoxide levels (Aykin-Burns
et al., 2009). Exposure of SIRT3�/�MEFs to either IR or antimycin
A significantly increased intracellular superoxide levels, while
only a comparatively modest increase was observed in SIRT3+/+
cells (Figure 1A). In addition, SIRT3�/� MEFs exhibited signifi-
cantly higher intracellular superoxide levels when cultured at
21% O2 for 6 hr (Figure 1B), compared with either SIRT3+/+ or
SIRT3�/� MEFs that are routinely grown at 6% O2 or SIRT3+/+
MEFs cultured at 21% O2.
Mitochondrial superoxide levels (measured using Mito-SOX
oxidation) were elevated in the SIRT3�/� MEFs and significantly
increased following exposure to either IR or antimycin A
(Figure 1C). In contrast, a much smaller increase in mitochondrial
superoxide levels was observed in irradiated or antimycin-A-
treated SIRT3+/+ MEFs. An increase in mitochondrial superoxide
level was also observed in the SIRT3�/� MEFs at 21% O2
(Figure S1B). These results suggest that loss of SIRT3 may
allow exogenous stressing agents to more readily disrupt oxida-
tive metabolism, leading to increased steady-state levels of
superoxide.
Cellular exposure to exogenous genotoxic stress, such as IR,
has previously been shown to induce chromosomal aberrations,
and one mechanism accounting for this observation has been
hypothesized to involve increased intracellular superoxide levels
(Spitz et al., 2004). Chromosome analysis of at least 100 meta-
phases from SIRT3+/+ or SIRT3�/�MEFs showed a chromosome
complement of 40 ± 2 in both knockout and wild-type cells. In
contrast, a relatively modest dose of radiation (2 and 5 Gy)
caused a significant increase in chromosome number in the
SIRT3�/� MEFs after 72 hr (Figure 1D), suggesting that loss of
SIRT3 results in chromosomal instability induced by genotoxic
stress.
SIRT3 Knockout Livers and MEFs Have DecreasedMitochondrial Integrity with AgeIt has previously been suggested that nuclear sirtuins may
function as fidelity proteins that play a role in the maintenance
of genomic integrity (Wang et al., 2008). Because SIRT3 is local-
ized to the mitochondria (Onyango et al., 2002; Schwer et al.,
2002), it seemed logical to investigate if it might also play
a role in the maintenance of mitochondrial DNA (mtDNA) integ-
rity. Livers from SIRT3 knockout mice at 20, 36, and 58 weeks
showed a gradual decrease in mtDNA integrity, as measured
by the amplification efficiency for a large (10,095 bp) fragment
of mtDNA, compared with isogenic wild-type mice (Figure 1E).
SIRT3 knockout MEFs also showed a decrease in mtDNA integ-
rity that was first observed at passage number 6 (Figure 1F) and
was further decreased at passage number 10, as compared with
SIRT3+/+ MEFs. The amplification efficiency of a small control
117 bp fragment was unchanged in both the livers (Figure S1C)
and MEFs (Figure S1D).
SIRT3 Knockout MEFs Do Not SpontaneouslyImmortalizeIt is well established that mitochondrial abnormalities, including
those associated with altered mitochondrial metabolism, are
observed in tumor cells in vitro and in human malignancies
(Singh, 2006; Warburg, 1956). We therefore determined if
SIRT3 knockout MEFs would exhibit altered growth characteris-
tics as compared with SIRT3+/+ MEFs. SIRT3+/+ and SIRT3�/�
MEFs at passage 3 were cultured identically and at passage 8
exhibited increased doubling times, and neither was able to
divide beyond cell passage 15 (data not shown). These primary
cells have identical doubling times (data not shown). Thus,
SIRT3+/+ and SIRT3�/� MEFs do not have the ability to divide
beyond passage 15, and as such cannot spontaneously immor-
talize (see Experimental Procedures for further description).
These MEFs at passage three were also measured for loss of
contact inhibited cell growth via colony-formation assays. This
assay measures the ability of tissue culture cells plated to conflu-
ence to spontaneously form colonies, which are defined as
concentrated nests of cells that pile up and grow on top of
each other. MEFs were plated at 106 in a 100 mm dish and the
medium was changed every 2 days until 28 days, when cells
were stained with crystal violet. SIRT3�/� MEFs stained after
28 days formed a greater number of colonies (Figures 2A and
2B, bars 1 and 2), relative to SIRT3+/+ MEFs. In addition,
SIRT3�/� MEFs exhibited decreased stress-induced apoptosis
in response to either IR (2 and 5 Gy) or camptothecin (Figure S2A)
and these results are in agreement with previously published
results (Allison and Milner, 2007) suggesting SIRT3 is a general
proapoptotic factor. These results suggest that SIRT3�/� MEFs
have decreased stress-induced apoptosis as well as relatively
low frequency of contact inhibition; however, these cells cannot
grow beyond passage 15, and therefore did not spontaneously
immortalize.
SIRT3�/� MEFs Expressing a Single Oncogene Displaya Transformation-Permissive PhenotypeIt was shown over 20 years ago that primary immortalized cells
can be transformed in vitro by the cooperation of at least two
oncogenes, such as Ras and Myc (Land et al., 1986; Parada
et al., 1984), validating the Knudson two-hit model for carcino-
genesis (Knudson, 1971). This idea has been extended to
show that inactivation or deletion of a TS gene can complement
the activation of a single oncogene, resulting in cellular transfor-
mation (Sherr, 2004).
To determine if loss of SIRT3 results in an in vitro transforma-
tion-permissive phenotype, SIRT3+/+ and SIRT3�/� MEFs were
infected with lentivirus expressing either Myc or Ras. It has
been previously shown that overexpression of Myc in primary
cells results in massive programmed cell death, whereas overex-
pression of Ras induces premature senescence (Sebastian et al.,
2005; Serrano et al., 1997). Consistent with previous findings,
SIRT3+/+ MEFs exhibited in vivo immortalization (see Experi-
mental Procedures for description) after infection with both
Myc and Ras, but not with either Myc or Ras alone (Table 1). In
contrast, SIRT3�/� MEFs infected with either Myc or Ras alone
became immortalized, as well as cells infected with both genes
(Table 1). In addition, MEFs from a transgenic mouse expressing
SIRT3dn (amino acid 248 changed from histidine to tyrosine) and
Cancer Cell 17, 41–52, January 19, 2010 ª2010 Elsevier Inc. 43

Figure 2. SIRT3 Knockout MEFs Expressing
a Single Oncogene Exhibit an In Vitro Trans-
formation-Permissive Phenotype
(A) Long-term culture (28 days) of confluent SIRT3
knockout MEFs results in decreased contact inhi-
bition as shown by spontaneous colony formation.
SIRT3+/+ and SIRT3�/� MEFs were plated at
1 3 106/100 mm dish and fed with fresh media
every 3 or 4 days for a total of 28 days. Colonies
were evident by both phase-contrast microscopy
and H&E stain.
(B) SIRT3�/�MEFs infected with Myc, Ras, or both
demonstrated decreased contact inhibition.
SIRT3+/+, SIRT3�/�, SIRT3+/+ Myc/Ras, SIRT3�/�
Myc, SIRT3�/� Ras, and SIRT3�/� Myc/Ras cells
were plated as above and medium was replaced
every 2 days for 28 days. Cells were then stained
with crystal violet and counted.
(C) SIRT3 knockout Myc, Ras, and Myc/Ras MEFs
exhibit an increased proproliferative growth
phenotype when plated at very low densities.
SIRT3+/+, SIRT3+/+ Myc/Ras, SIRT3�/�, SIRT3�/�
Myc, SIRT3�/� Ras, and SIRT3�/� Myc/Ras
MEFs were plated at either 100 or 250 cells per
plate (six-well plates), stained with crystal.
For B and C, all results are from at least three
separate experiments. Data are presented as the
average ± SD; *p < 0.01 by t test. Scale bar,
3 mm in (A). See also Figure S2.
Table 1. Immortalization of SIRT3�/� MEFs Only Requires
a Single Oncogene
MEFs Control Myc Ras Myc/Ras
SIRT3+/+ none none none immort
SIRT3�/� none immort immort immort
SIRT3�/� + Lenti-MnSOD none none none immort
SIRT3wt-SIRT3�/� none none none immort
SIRT3dn-SIRT3�/� none immort immort immort
None, no MEF immortalization; immort, immortalization. Lenti-MnSOD,
lentiviral-MnSOD 10 MOI. Immortalization experiments were done in
triplicate.
Cancer Cell
SIRT3 Is a Mitochondria-Localized Tumor Suppressor
lacking SIRT3 (SIRT3dn-SIRT3�/�) were also immortalized by
a single oncogene. In contrast, SIRT3wt-SIRT3�/�MEFs required
both Myc and Ras (Table 1). Polymerase chain reaction (PCR)
and western analysis confirmed viral integration and expression
of Myc and Ras (data not shown). These results suggest that
SIRT3 may act as a TS by substituting for one of the two onco-
genes required for in vitro immortalization (see Experimental
Procedures for description).
SIRT3+/+, SIRT3+/+ Myc/Ras, SIRT3�/�, SIRT3�/� Myc,
SIRT3�/� Ras, and SIRT3�/� Myc/Ras (referred to hereafter as
‘‘the panel’’) MEFs were plated at 1 3 106/100 mm dish for a total
of 28 days and contact inhibited cell growth was determined.
SIRT3�/� Ras and SIRT3�/� Myc/Ras cells displayed a sizeable
increase in focal colony formation (Figure 2B, bars 4 and 6), while
SIRT3�/� Myc and SIRT3+/+ Myc/Ras (bars 3 and 5) showed
a slight increase, as compared with SIRT3+/+ and SIRT3�/�
MEFs (bars 1 and 2). These results reveal that cells lacking
SIRT3 display a significant loss of contact inhibition in response
to oncogene expression.
Another cell biological criterion of in vitro transformation is the
ability of cells to form colonies when plated at very low cell
densities, which is a measure of increased mitotic activity or
reproductive integrity. As such, the panel of MEFs was plated at
either 100 or 250 cells per well in 60 mm six-well tissue culture
plates and stained with crystal violet after 10 days (Figure 2C).
The results of these experiments show that cells lacking SIRT3
and expressing Myc, Ras, or Myc/Ras form more colonies than
SIRT3 wild-type cells expressing both Myc and Ras. The trans-
formed SIRT3�/� Myc, SIRT3�/� Ras, and SIRT3�/� Myc/Ras
cells also exhibit less basal apoptosis than the SIRT3+/+ Myc/
Ras cells (Figure S2B). Finally, SIRT3�/�Myc/Ras, SIRT3�/�Ras,
and SIRT3�/� Myc cells exhibited a more transformed mor-
44 Cancer Cell 17, 41–52, January 19, 2010 ª2010 Elsevier Inc.
phology as shown by random cell orientation, changes in cellular
architecture, and nuclear to cytoplasmic ratios (data not shown).
Loss of SIRT3 Results in an Invasive and TumorigenicPhenotypeThe frequency of aneuploidy and/or polyploidy has been sug-
gested as one of many biomarkers that may be proportional to
the degree of malignancy of a tumor (Deng, 2006). Fluores-
cence-activated cell sorting (FACS) analysis demonstrated that
SIRT3�/� Myc, SIRT3�/� Ras, and SIRT3�/� Myc/Ras cells
have significantly more polyploid cells (Figure 3A) and chromo-
somal analysis showed more aneuploidy (Figure 3B) than
measured in the SIRT3+/+, SIRT3+/+ Myc/Ras, or SIRT3�/� cell
lines. The results of these cell biological experiments suggest
that cells lacking SIRT3 and overexpressing at least one exoge-
nous oncogene exhibit a more in vitro transformed phenotype
than wild-type SIRT3 cells expressing two oncogenes (Myc
and Ras).

Figure 3. Loss of SIRT3 Results in an Inva-
sive and Tumorigenic Phenotype
(A) SIRT3 knockout MEFs expressing Myc and/or
Ras exhibit polyploidy. Transformed MEF cells
were harvested and analyzed by FACS. The
percentage of cells containing greater than 4n is
shown.
(B) SIRT3�/� Myc and/or Ras MEFs exhibit
increased chromosomal aberrations. Whole-
mount chromosomes were counted in a blinded
fashion. Columns are the mean chromosome
number per cell from 100 separate counts.
(C) SIRT3 knockout MEFs expressing Ras or Myc
or both display anchorage independent growth in
soft agar. SIRT3+/+, SIRT3�/�, SIRT3+/+ Myc/Ras,
SIRT3�/� Myc, SIRT3�/� Ras, and SIRT3�/�
Myc/Ras cells were seeded and colonies were
stained with methylene blue after 12 days and
counted.
(D) SIRT3+/+, SIRT3�/�, SIRT3+/+ Myc/Ras,
SIRT3�/� Myc, SIRT3�/� Myc/Ras, and SIRT3�/�
Ras cells were implanted into both hind limbs of
nude mice. Photographs of the hind limbs of
nude mice injected with the cells are shown.
(E) Histological examination of SIRT3�/� Myc/Ras
allograft tumors stained with H&E. Results in this
figure are the mean of at least three separate
experiments. Error bars represent 1 SD about the
arithmetic mean; *p < 0.05 by t test. Scale bar,
80 mm in (E).
Cancer Cell
SIRT3 Is a Mitochondria-Localized Tumor Suppressor
Cell growth in soft agar and athymic nude mice are well-
established systems in which to assess anchorage independent
growth and tumorigenesis, respectively. It has been demon-
strated that MEFs immortalized with two oncogenes, such as
Myc and Ras, have altered growth properties but do not grow
in soft agar or form allograft tumors in nude mice unless an addi-
tional genetic event occurs (Land et al., 1986). Anchorage-inde-
pendent growth was determined by examining cell growth in soft
agar, and these experiments showed that SIRT3�/� Ras,
SIRT3�/�Myc/Ras, and, to a smaller degree, SIRT3�/�Myc cells
have an anchorage-independent phenotype (Figure 3C). To
determine in vivo tumorigenesis, 106 cells were implanted into
the hind limbs of nude mice. After 3 weeks, the SIRT3�/� Myc/
Ras cell lines were able to grow (in 6/6 mice) allograft tumors
(Figure 3D) consistent with a poorly differentiated sarcoma (Fig-
ure 3E), while no tumors were observed for either the SIRT3+/+
Myc/Ras or the other cell lines (0/6 mice). These results suggest
that loss of SIRT3, when combined with Myc and Ras, provides
a necessary genetic event resulting in tumorigenesis.
SIRT3 Knockout Transformed MEFs Display AlteredIntracellular MetabolismWe have shown that SIRT3 knockout MEFs demonstrate normal
steady-state levels of superoxide under unstressed conditions,
but exhibit a stress-induced increase in superoxide levels. As
such, superoxide levels were measured in transformed SIRT3
knockout cells to determine whether the genetic loss of SIRT3
combined with oncogene transformation created an increased
pro-oxidant intracellular environment. SIRT3�/� Ras, SIRT3�/�
Myc/Ras, and, to a lesser extent, SIRT3�/� Myc cells exhibited
higher steady-state levels of total cellular superoxide (Figure 4A)
as well as mitochondrial superoxide levels (Figure S3A).
The SIRT3�/� Ras and SIRT3�/� Myc/Ras cells exhibit
increased total cellular ATP levels (Figure 4B) when compared
with the SIRT3+/+ Myc/Ras or untransformed SIRT3+/+ MEFs
(data not shown). Surprisingly, the SIRT3�/� Ras and SIRT3�/�
Myc/Ras cells had significantly decreased mitochondrial ATP
levels (Figure 4C, Figure S3B). These results suggest that the
transformed SIRT3 knockout cells are more metabolically active
but are generating this energy from sources other than mito-
chondrial oxidative phosphorylation, and are either producing
more reactive oxygen species or have a decreased ability to
scavenge superoxide.
SIRT3 Knockout Transformed MEFs Display IncreasedGlycolysis and Decreased Oxidative PhosphorylationIt is well established that tumor cells consume glucose at a much
greater rate than nontransformed cells, and this is referred to as
the Warburg effect (Warburg, 1956). As such, glucose metabo-
lism was monitored in the panel of MEF cell lines. Figure 4D
shows that SIRT3 knockout cells infected with Myc, Ras, or
Myc and Ras consume increased amounts of glucose.
One potential mechanism accounting for the observed
increases in intracellular superoxide and glycolysis in the
SIRT3�/� Ras and SIRT3�/� Myc/Ras cells might involve
changes in the level of oxidative phosphorylation. As such, the
activities of electron transport complexes I, II, III, and IV were
determined in the SIRT3 wild-type and knockout transformed
cell lines. These experiments showed a significant decrease in
complex I and complex III activity in the SIRT3�/� Ras and
Cancer Cell 17, 41–52, January 19, 2010 ª2010 Elsevier Inc. 45
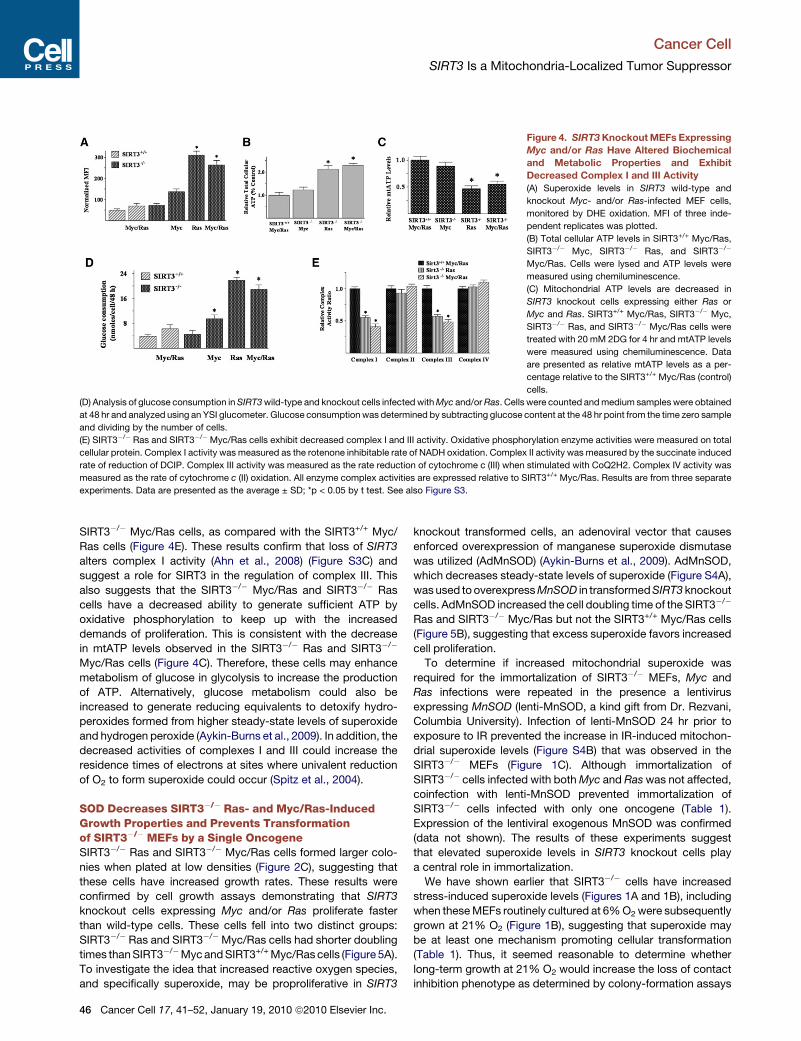
Figure 4. SIRT3 Knockout MEFs Expressing
Myc and/or Ras Have Altered Biochemical
and Metabolic Properties and Exhibit
Decreased Complex I and III Activity
(A) Superoxide levels in SIRT3 wild-type and
knockout Myc- and/or Ras-infected MEF cells,
monitored by DHE oxidation. MFI of three inde-
pendent replicates was plotted.
(B) Total cellular ATP levels in SIRT3+/+ Myc/Ras,
SIRT3�/� Myc, SIRT3�/� Ras, and SIRT3�/�
Myc/Ras. Cells were lysed and ATP levels were
measured using chemiluminescence.
(C) Mitochondrial ATP levels are decreased in
SIRT3 knockout cells expressing either Ras or
Myc and Ras. SIRT3+/+ Myc/Ras, SIRT3�/� Myc,
SIRT3�/� Ras, and SIRT3�/� Myc/Ras cells were
treated with 20 mM 2DG for 4 hr and mtATP levels
were measured using chemiluminescence. Data
are presented as relative mtATP levels as a per-
centage relative to the SIRT3+/+ Myc/Ras (control)
cells.
(D) Analysis of glucose consumption in SIRT3 wild-type and knockout cells infected with Myc and/or Ras. Cells were counted and medium samples were obtained
at 48 hr and analyzed using an YSI glucometer. Glucose consumption was determined by subtracting glucose content at the 48 hr point from the time zero sample
and dividing by the number of cells.
(E) SIRT3�/� Ras and SIRT3�/�Myc/Ras cells exhibit decreased complex I and III activity. Oxidative phosphorylation enzyme activities were measured on total
cellular protein. Complex I activity was measured as the rotenone inhibitable rate of NADH oxidation. Complex II activity was measured by the succinate induced
rate of reduction of DCIP. Complex III activity was measured as the rate reduction of cytochrome c (III) when stimulated with CoQ2H2. Complex IV activity was
measured as the rate of cytochrome c (II) oxidation. All enzyme complex activities are expressed relative to SIRT3+/+ Myc/Ras. Results are from three separate
experiments. Data are presented as the average ± SD; *p < 0.05 by t test. See also Figure S3.
Cancer Cell
SIRT3 Is a Mitochondria-Localized Tumor Suppressor
SIRT3�/� Myc/Ras cells, as compared with the SIRT3+/+ Myc/
Ras cells (Figure 4E). These results confirm that loss of SIRT3
alters complex I activity (Ahn et al., 2008) (Figure S3C) and
suggest a role for SIRT3 in the regulation of complex III. This
also suggests that the SIRT3�/� Myc/Ras and SIRT3�/� Ras
cells have a decreased ability to generate sufficient ATP by
oxidative phosphorylation to keep up with the increased
demands of proliferation. This is consistent with the decrease
in mtATP levels observed in the SIRT3�/� Ras and SIRT3�/�
Myc/Ras cells (Figure 4C). Therefore, these cells may enhance
metabolism of glucose in glycolysis to increase the production
of ATP. Alternatively, glucose metabolism could also be
increased to generate reducing equivalents to detoxify hydro-
peroxides formed from higher steady-state levels of superoxide
and hydrogen peroxide (Aykin-Burns et al., 2009). In addition, the
decreased activities of complexes I and III could increase the
residence times of electrons at sites where univalent reduction
of O2 to form superoxide could occur (Spitz et al., 2004).
SOD Decreases SIRT3�/� Ras- and Myc/Ras-InducedGrowth Properties and Prevents Transformationof SIRT3�/� MEFs by a Single OncogeneSIRT3�/� Ras and SIRT3�/� Myc/Ras cells formed larger colo-
nies when plated at low densities (Figure 2C), suggesting that
these cells have increased growth rates. These results were
confirmed by cell growth assays demonstrating that SIRT3
knockout cells expressing Myc and/or Ras proliferate faster
than wild-type cells. These cells fell into two distinct groups:
SIRT3�/� Ras and SIRT3�/�Myc/Ras cells had shorter doubling
times than SIRT3�/�Myc and SIRT3+/+ Myc/Ras cells (Figure 5A).
To investigate the idea that increased reactive oxygen species,
and specifically superoxide, may be proproliferative in SIRT3
46 Cancer Cell 17, 41–52, January 19, 2010 ª2010 Elsevier Inc.
knockout transformed cells, an adenoviral vector that causes
enforced overexpression of manganese superoxide dismutase
was utilized (AdMnSOD) (Aykin-Burns et al., 2009). AdMnSOD,
which decreases steady-state levels of superoxide (Figure S4A),
was used to overexpress MnSOD in transformed SIRT3 knockout
cells. AdMnSOD increased the cell doubling time of the SIRT3�/�
Ras and SIRT3�/� Myc/Ras but not the SIRT3+/+ Myc/Ras cells
(Figure 5B), suggesting that excess superoxide favors increased
cell proliferation.
To determine if increased mitochondrial superoxide was
required for the immortalization of SIRT3�/� MEFs, Myc and
Ras infections were repeated in the presence a lentivirus
expressing MnSOD (lenti-MnSOD, a kind gift from Dr. Rezvani,
Columbia University). Infection of lenti-MnSOD 24 hr prior to
exposure to IR prevented the increase in IR-induced mitochon-
drial superoxide levels (Figure S4B) that was observed in the
SIRT3�/� MEFs (Figure 1C). Although immortalization of
SIRT3�/� cells infected with both Myc and Ras was not affected,
coinfection with lenti-MnSOD prevented immortalization of
SIRT3�/� cells infected with only one oncogene (Table 1).
Expression of the lentiviral exogenous MnSOD was confirmed
(data not shown). The results of these experiments suggest
that elevated superoxide levels in SIRT3 knockout cells play
a central role in immortalization.
We have shown earlier that SIRT3�/� cells have increased
stress-induced superoxide levels (Figures 1A and 1B), including
when these MEFs routinely cultured at 6% O2 were subsequently
grown at 21% O2 (Figure 1B), suggesting that superoxide may
be at least one mechanism promoting cellular transformation
(Table 1). Thus, it seemed reasonable to determine whether
long-term growth at 21% O2 would increase the loss of contact
inhibition phenotype as determined by colony-formation assays

Figure 5. The Transformative and Growth
Properties of Transformed SIRT3 Knockout
Cells Are Decreased by SOD
(A) SIRT3 knockout cells exhibited an increased
growth rate. SIRT3+/+, SIRT3�/�, SIRT3�/� Myc,
SIRT3�/� Ras, SIRT3+/+ Myc/Ras, and SIRT3�/�
Myc/Ras MEFs were plated at 2 3 104 cells per
plate and harvested at 2, 3, and 4 days. The
number of cells per plate was plotted as a function
of days to determine growth rate and doubling
times.
(B) Infection with a MnSOD-expressing adeno-
virus decreases the growth rate of SIRT3 knockout
cells. SIRT3+/+ Myc/Ras, SIRT3�/� Myc/Ras, and
SIRT3�/� Ras cells were infected with Adeno-
MnSOD and cells were isolated at 72 and 90 hr
to determine cell growth rates.
(C) SIRT3�/� MEFs exhibit increased in vitro
colony formation at 21% O2. 1 3 106 SIRT3+/+
and SIRT3�/� MEFs were plated on a 10 cm plate
and cultured at either 6% or 21% O2. Media was
replaced every 2 days and after 28 days the
MEFs were subsequently stained with crystal
violet and counted.
(D) The addition of MnSOD reverses the increase
in contact-inhibited growth in SIRT3�/� cells at
21% O2. SIRT3�/�MEFs were plated and cultured
at either 6% or 21% O2 with infection with either
5 MOI of either a control lentivirus or a lentivirus
containing MnSOD. Cells were subsequently
stained with crystal violet and counted as above.
(E) MnSOD prevents aneuploidy in SIRT3
knockout MEFs exposed to IR. SIRT3�/� MEFs
were infected with either a control lentivirus or
lenti-MnSOD 24 hr prior to exposure to 2 or
5 Gy. Whole-mount chromosomes were counted
in a blinded fashion. Bars show the mean chromo-
some number per cell from 100 separate counts.
(F) MnSOD expression in wild-type and SIRT3
knockout mouse livers at 5, 9, and 13 months.
RNA was harvested from four age-matched
SIRT3+/+ and SIRT3�/� mouse livers and MnSOD
expression was determined by quantitative real-
time polymerase chain reaction (qRT-PCR) using
MnSOD and b-actin Taqman probes (ABI).
(G) Infection of lenti-SIRT3-wt but not lenti-SIRT3-
dn (deacetylation null mutant) increases MnSOD
protein levels in SIRT3�/� Myc/Ras-transformed MEFs. SIRT3�/� Myc/Ras cells were infected with virus, and 48 hr later cells were harvested and extracts
were isolated and 20 mg protein were separated by SDS-PAGE, transferred onto nitrocellulose, and immunoblotted using an anti-MnSOD antibody (Cell Signaling
Technology, Inc.).
(H) Infection of lenti-SIRT3-wt but not lenti-SIRT3-dn in SIRT3�/� Myc/Ras transformed MEFs reverses the increase in mitochondrial superoxide levels. Mito-
chondrial superoxide levels were determined by the addition of Mito-SOX (3 mM) to the culture medium and cells were incubated for an additional 10 min before
being trypsinized and resuspended. Fluorescence was measured via flow cytometry, and 20,000 and 40,000 cells were counted for each sample. Results are
from at least three separate experiments. Data are presented as the average ± SD; *p < 0.05 and **p < 0.01 by t test. See also Figure S4.
Cancer Cell
SIRT3 Is a Mitochondria-Localized Tumor Suppressor
(Figures 2A and 2B). As such, SIRT3+/+ and SIRT3�/�MEFs were
cultured at 21% O2 for 28 days to determine if these conditions
would increase cell contact inhibition. A roughly 5-fold increase
in loss of contact inhibition, as determined by colony formation,
was observed in the SIRT3�/� MEFs grown at 21% (Figure 5C,
bar 2 versus 4), whereas no difference was observed in the
SIRT3+/+ MEFs (bar 1 versus 3). Similar to the results observed
in Table 1, the addition of lenti-MnSOD reversed the increase
in colonies formed when SIRT3�/� cells were grown at 21% O2
for 28 days (Figure 5D, bar 2 versus 4,) as well as the overall
density of the colonies (data not shown). Finally, we previously
showed that SIRT3�/� MEFs exposed to IR displayed an
increase in total cellular superoxide levels (Figure 1A) and
genomic instability (Figure 1D). When these experiments were
repeated in the presence of MnSOD (Figure 5E), the IR-induced
increase in aneuploidy was prevented.
These results suggest that the increase in superoxide
observed in the SIRT3�/� MEFs plays a role, at least in part, in
the tumor-permissive phenotype. To address this idea, MnSOD
expression was determined in wild-type and SIRT3 knockout
Cancer Cell 17, 41–52, January 19, 2010 ª2010 Elsevier Inc. 47
Cancer Cell
SIRT3 Is a Mitochondria-Localized Tumor Suppressor
mouse livers at 5, 9, and 13 months. A slight decrease in MnSOD
expression was observed at 9 months that became statistically
significant at 13 months (Figure 5F, Figure S4C). In contrast, no
significant change in MnSOD expression was observed in the
wild-type mice. A decrease in MnSOD expression was also
observed in the transformed SIRT3�/� Ras and SIRT3�/� Myc/
Ras cells (Figure S4D), which have previously been shown to
have increased superoxide levels compared to the SIRT3+/+
Myc/Ras cells (Figure 4A). Finally, similar to the SIRT3�/�
MEFs, MnSOD�/� MEFs (a kind gift from Prabhat Goswami,
University of Iowa) are also immortalized by a single oncogene
(Table S1), suggesting that loss of MnSOD may also result in
an immortalization-permissive phenotype.
Chromatin immunoprecipitation analysis of SIRT3+/+ and
SIRT3�/� livers showed decreased binding of two primary tran-
scription factors that regulate MnSOD, FOXO3a and NF-kB
(Figure S4E), to the MnSOD promoter at 13 months but not
5 months (data not shown). No change in total (Figure S4F)
or mitochondrial (data not shown) FOXO3a or NF-kB was
observed in SIRT3+/+ or SIRT3�/� age-matched mice. However,
SIRT3 deacetylates FOXO3a (Figure S4G) and there is a signifi-
cant increase in phospho-FOXO3a levels in cells expressing
SIRT3dn, as compared with cells expressing the wild-type
SIRT3 (Figure S4H, lower panel). These results are consistent
with recently published data (Sundaresan et al., 2009). Finally,
cells expressing SIRT3dn contain decreased nuclear FOXO3a
protein levels (Figure S4I), as shown by others (Sundaresan
et al., 2009). These results suggest that loss of SIRT3 deacetyla-
tion activity decreases FOXO3a nuclear localization.
Finally, transfection with a vector expressing a constitutively
active FOXO3a dominant positive gene (pCMV-N-FOXO3a),
which increases nuclear FOXO3a protein levels (Jacobs et al.,
2008), prevented immortalization of SIRT3�/� MEFs by a single
(Myc or Ras) oncogene (Table S1). These results suggest that
nuclear import of FOXO3a may play a role, at least in part, in
an immortalization-permissive phenotype.
SIRT3 Wild-Type, But Not a Deacetylation-Null MutantGene, Induces MnSOD Gene Expression and DecreasesMitochondrial Superoxide LevelsMnSOD protein levels are decreased in the SIRT3�/� Myc/Ras
(Figure 5G, bar 1), as compared with the SIRT3+/+ Myc/Ras
(bar 2) cells. As such, SIRT3�/� Myc/Ras cells were infected
with lentivirus expressing either a wild-type SIRT3 (lenti-SIRT3-
wt) or a deacetylation null mutant SIRT3 (Ahn et al., 2008)
gene (lenti-SIRT3-dn). These experiments showed that the
wild-type (Figure 5G, bar 1 versus 3), but not the deacetylation
null mutant SIRT3 (bar 4) gene, increased MnSOD protein
levels to those observed in the wild-type SIRT3+/+ Myc/Ras
MEFs (bar 2). Exogenous Myc tagged SIRT3 expression was
confirmed by western blotting (data not shown). In addition,
lenti-SIRT3-wt, but not lenti-SIRT3-dn, reversed the increase
in mitochondrial superoxide levels observed in the SIRT3�/�
Myc/Ras cells (Figure 5H). Finally, SIRT3+/+ Myc/Ras MEFs
cells infected with retroviruses expressing two different SIRT3
shRNAs also decreased MnSOD expression (Figure S4J).
These results suggest a more direct link between SIRT3 deacety-
lation and MnSOD expression as well as altered mitochondrial
metabolism.
48 Cancer Cell 17, 41–52, January 19, 2010 ª2010 Elsevier Inc.
SIRT3 Is a Mitochondria-Localized Murine TumorSuppressorSIRT3 knockout MEFs are immortalized and transformed in vitro
by the expression of a single oncogene, suggesting that loss
of SIRT3 results in a tumor-permissive phenotype. Thus, we
investigated whether SIRT3 knockout mice developed tumors.
SIRT3�/� mice were healthy, and no outwardly observed
phenotype was noted (Lombard et al., 2007); however, 7 of 20
female mice developed mammary gland tumors (Figure 6A)
over 24 months (Figure 6B), while 0 SIRT3+/+ mice developed
mammary tumors during the same period. Histological H&E
examination of these mammary tumors showed a characteristic
invasive ductal carcinoma (Figure 6C). In addition, single, but not
double, positive immunohistochemistry (IHC) staining, was
observed for cytokeratin 14 (CK14), a basal epithelial cell marker,
or CK18, a luminal epithelial cell marker (Figure 6D), suggesting
a well differentiated histological pathology. IHC identified these
tumors as estrogen receptor and progesterone receptor (ER/
PR) positive (Figure 6E). These results parallel a well-differenti-
ated, receptor-positive histological characteristic that is com-
monly observed in breast malignancies in older women.
SIRT3�/� mouse livers exhibit increased mtDNA damage
and decreased MnSOD expression with age and develop
mammary tumors after 12 months, suggesting that cellular reac-
tive oxygen species might increase with age in the SIRT3�/�
mice. Mammary tissue isolated from SIRT3+/+ and SIRT3�/�
mice were stained with an anti-nitrotyrosine antibody as a
marker for increased protein damage caused by intracellular
reactive oxygen/nitrogen species, because increased nitrotyro-
sine formation on proteins is believed to reflect increased forma-
tion of ONOO�, which is the reaction product of nitric oxide and
superoxide. SIRT3 knockout mouse mammary ductal cells
exhibited increased anti-nitrotyrosine staining (StressMarq
Biosciences Inc.) at 12 months (Figure 6F, Figure S5), while no
differences were detected at 5 months (data not shown). This
suggests that increased oxidative/nitrosative damage to
proteins is occurring in the mammary tissues of SIRT3�/�
animals as a function of age.
SIRT3 Is a Potential Human Tumor SuppressorThe hypothesis that SIRT3 serves as a tumor suppressor in vivo
was further supported by the observation that SIRT3 expression
is decreased in breast cancer specimens from a commercially
available tissue array (US Biomax, Inc.), as compared with
normal breast tissue samples (Figure 7A). In addition, zero of
nine metastatic lymph nodes positively stained for SIRT3 (data
not shown). IHC staining also confirmed that SIRT3 localizes
to normal mammary ductal cells (Figure 7B). SIRT3 RNA
expression is also decreased in stage IIA, IIB, and III malignancy
breast samples (TissueScan Breast Cancer Panel 1, Origene)
(Figure 7C).
The Oncomine cancer microarray database (Rhodes et al.,
2007) was subsequently used to determine if SIRT3 expression
is decreased in human malignancies. SIRT3 was decreased
in breast tumors as compared with normal breast (Figure 7D)
and as a function of both Elston Grade (G-1, G-2, or G-3) (Fig-
ure 7E, Figure S6A) and pathological differentiation (well, moder-
ately, or poorly differentiated) (Figure 7F, Figure S6B). Finally,
SIRT3 expression was also decreased in several other human

Figure 6. SIRT3 Is a Mitochondria-Local-
ized Murine Tumor Suppressor
(A) SIRT3 knockout mice develop mammary
tumors. The total number of mammary tumors at
24 months in SIRT3 wild-type and knockout mice
is shown. Data are presented as the average ± SD;
*p < 0.05 by t test.
(B) Plot of the number of tumor-free SIRT3�/�
(n = 10 3 2) and wild-type mice (n = 12 3 2) over
24 months.
(C) Representative H&E slides from mammary
tissue from two SIRT3�/� mice that developed
a mammary tumor.
(D) IHC staining of SIRT3�/� murine mammary
tumors with DAPI/CK14 (left panel), DAPI/CK18
(middle panel), and merged (right panel).
(E) IHC staining for ER and PR status was per-
formed on paraffin sections from the seven
SIRT3�/� mice that developed mammary tumors.
ER/PR levels were characterized as absent (�),
intermediate (+), or strongly present throughout
the sample (++).
(F) SIRT3 knockout mice mammary ductal cells
exhibit increased anti-nitrotyrosine IHC staining.
Mammary tissue from four SIRT3+/+ and SIRT3�/�
mice at age 12 months was stained with an anti-
nitrotyrosine antibody (StressMarq Biosciences
Inc.). A representative micrograph is shown. Scale
bar, 160 mm in (C, left panel), 80 mm in (C, right
panel) and (F), and 40 mm in (D). See also
Figure S5.
Cancer Cell
SIRT3 Is a Mitochondria-Localized Tumor Suppressor
malignancies including testicular (Figure S6C), glioblastoma
multiforme (Figure S6D), prostate (Figure S6E), head and neck
squamous cell (Figure S6F), clear cell renal (Figure S6G), and
hepatocellular (Figure S6H) cancers.
DISCUSSION
Although there is no universal definition of a TS gene, for the
purposes of this work, we defined a TS gene as one that: (1)
protects a tissue culture cell from one step on the path to
in vitro transformation; (2) results in tumorigenesis in murine
models lacking expression; (3) is decreased in human malignan-
cies; and (4) results in the loss of functional organelle integrity
or the accumulation of cellular damage to critical biomolecules
either spontaneously or following exposure to stress. Based on
these criteria, we propose that SIRT3 is a mitochondrial TS.
In this regard, we demonstrated that SIRT3�/� MEFs infected
with a single oncogene become immortalized as well as in vitro
transformed, and that they exhibit anchorage-independent
growth. Furthermore, SIRT3�/� MEFs expressing Myc and Ras
grew in nude mice, suggesting that loss of SIRT3 also results
Cancer Cell 17, 41–5
in an in vivo tumorigenic phenotype.
In addition, SIRT3 knockout mice sponta-
neously form mammary tumors later in
life. Finally, SIRT3 protein levels are
decreased in human breast cancers as
well as several other human malignan-
cies. In our murine model, SIRT3 appears
to be limited to the mitochondria. Thus,
we propose that SIRT3 is a genomically expressed, mitochond-
rially localized TS.
Interestingly, the murine mammary tumors we assayed were
well-differentiated, ER/PR positive. In humans, these markers
are most often seen in tumors from women who develop breast
cancer later in life. Because sirtuins are the human homologs of
longevity genes in C. elegans and yeast (Tissenbaum and Guar-
ente, 2001), this result suggests that the SIRT3 knockout mouse
may be useful as a model for an ER/PR-positive subtype of
breast cancer that is more commonly observed in women over
65 years of age.
In this work we have also shown that the transformed SIRT3�/�
Myc/Ras cells, but not the wild-type Myc/Ras cells, have signifi-
cant increases in glucose metabolism, superoxide levels, and
total cellular ATP levels, but decreased ATP from oxidative
phosphorylation. However, it is unclear if this was due to loss of
SIRT3 or the natural process of transformation. In addition, the
activity of complexes I and III of the electron transport chain
was significantly decreased in the SIRT3�/� Myc/Ras and
SIRT3�/� Ras cells, as compared with SIRT3+/+ Myc/Ras cells.
This could explain why the addition of lentivirus MnSOD
2, January 19, 2010 ª2010 Elsevier Inc. 49

Figure 7. SIRT3 Is a Potential Human Tumor
Suppressor
(A) SIRT3 protein levels are decreased in human
breast tumors; 38 normal and 36 breast cancer
(US Biomax, Inc.) samples were measured by
IHC on a tissue array. Tissue arrays were stained
with a human SIRT3 antibody (Cell Signaling Tech-
nology, Inc.) and slides were read by two indepen-
dent researchers. Levels of SIRT3 staining were
classified as absent, medium, or high.
(B) IHC images from breast tumor and normal
samples demonstrating SIRT3 staining. The
boxed regions (enlarged in the bottom row) show
SIRT3 in normal epithelium (left six images) and
breast tumors (right four images).
(C) SIRT3 expression in RNA samples from normal
breast (NB) and stage I, IIA, IIB, and III breast
malignancies (TissueScan Breast Cancer Panel 1
Origene). SIRT3 expression was determined by
qRT-PCR using SIRT3 and b-actin Taqman probes
(ABI).
(D–F) SIRT3 expression is decreased in human
breast cancer and as a function of pathological
classification. The Oncomine cancer microarray
database (http://www.oncomine.org) was used to
determine SIRT3 expression in (D) normal versus
breast cancers (Richardson et al., 2006), as a func-
tion of (E) Elston (G-1, G-2, or G-3) Grade (Ivshina
et al., 2006), or (F) pathological (well, moderately,
or poorly differentiated) differentiation (Sotiriou
et al., 2006). The y axis represents normalized
expression units. Shaded boxes represent the
interquartile range; whiskers represent the 10th-
90th percentile range; bars represent the median.
(G) Schema for the development of increased
mtROS and ER/PR-positive mammary tumors in
ductal cells lacking SIRT3. Scale bar, 80 mm in
(B). See also Figure S6.
Cancer Cell
SIRT3 Is a Mitochondria-Localized Tumor Suppressor
prevented the immortalization of SIRT3�/� cells by Myc or Ras
alone; however, expression of both Myc and Ras provided an
additional proproliferation event that pushed the cells over the
edge toward immortalization, transformation, and tumorigenesis.
Finally, the in vivo situation might be more complex than in
cultured cell model, because that data showed that the
decreased MnSOD expression was only observed in older
SIRT3 mutant mice. This issue is potentially interesting and will
be investigated in future studies.
Eukaryotic cells contain fidelity proteins that function to
monitor the integrity of critical intracellular processes, and dele-
tion or mutation of the corresponding genes results in a cellular
environment permissive for the accumulation of DNA damage
(Hunter, 1997). Thus, it seems like a logical extension that the
mitochondria would also contain fidelity proteins to maintain
the integrity of the mitochondria. In this regard, loss of SIRT3
results in a decrease in MnSOD as a function of age resulting
in an increase in mitochondrial superoxide and perhaps other
ROS (Figure 7G). This may create a cellular environment per-
missive for in vivo carcinogenesis including receptor-positive
mammary tumors that are observed in the SIRT3 knockout
mice after age 13 months. As such, we propose that SIRT3
functions as a genomically expressed, mitochondrially localized
fidelity protein, in addition to meeting the criteria to be classified
as a TS.
50 Cancer Cell 17, 41–52, January 19, 2010 ª2010 Elsevier Inc.
EXPERIMENTAL PROCEDURES
Cell Lines
MEFs were isolated from E14.5 isogenic SIRT3+/+ and SIRT3+/+ mice and
maintained in a 37�C incubator with 5% CO2 and 6% oxygen except when
otherwise noted. SIRT3+/+ or SIRT3�/� MEFs were infected at passage 3
with lentivirus expressing either Myc, Ras, or MnSOD were made by Applied
Biological Materials, Inc. (Richmond, British Columbia), and pooled selected
cells were used for all experiments. For this study, our definition of sponta-
neous immortalization of primary MEFs is the ability to continue dividing past
passage 15 and subsequently divide indefinitely. For in vitro immortalization
experiments via enforced genetic expression of one or two oncogenes,
MEFs at passage 3 were infected with a lentivirus containing Myc, Ras, or
both. Cells were cultured and split every 2 days to prevent confluency and
plated into a new 100 mm dish at 3.0 3 105 cells. After 17 additional passages
(20 total), cells were considered immortalized if they continued to divide.
MEFs were infected with 5 MOI virus per 10 cm/plate. Levels of Myc and Ras
were confirmed by western blot analysis, and PCR analysis (data not shown).
Soft agar and colony formation assays were done as previously described
(Supplemental Experimental Procedures).
Statistical Analysis
Data were analyzed by Student’s t test, and results were considered significant
at p < 0.05. Results are presented as mean and standard deviation (±SD).
Measurement of Intracellular Superoxide Levels
Superoxide production was determined as described elsewhere (Slane et al.,
2006) using the fluorescent dye dihydroethidium (DHE), obtained from Molec-
ular Probes (Eugene, OR). Mitochondrial superoxide levels were determined

Cancer Cell
SIRT3 Is a Mitochondria-Localized Tumor Suppressor
by the addition of Mito-SOX (3 mM) to the cells, cultured as described above
and incubated for an additional 10 min before being trypsinized and
resuspended and measured by fluorescence (Molecular Probes). See Supple-
mental Experimental Procedures for more detail.
Measurement of Glucose Consumption, ATP Levels, and Oxygen
Consumption
Glucose consumption per cell was measured by plating 300,000 cells on a
60 mm plate. Cells were given fresh medium at time zero. Cells were counted
and medium samples were obtained at 48 hr and analyzed using a YSI glucom-
eter. Glucose consumption was determined by subtracting glucose content at
48 hr from the time zero samples and dividing by the number of cells.
Total ATP levels were monitored using a CellTiter-Glo Luminescent Cell
Viability Assay as per the manufacturer’s instructions (Promega). CellTiter-
Glo was added to 106 cells and placed on an orbital shaker to induce cell lysis,
and samples were read on a chemiluminescence plate reader (Tecam Safire;
integration time of 1 s). Mitochondrial ATP was determined by incubating
MEFs in 20 mM 2DG and 5 mM pyruvate for 4 and 24 hr prior to using an aden-
osine 50-triphosphate bioluminescent somatic cell assay kit (Supplemental
Experimental Procedures).
Oxygen consumption was measured using the YSI oxygen monitor contain-
ing a Clark-type electrode as per the manufacturer’s instructions. The cell
pellet was resuspended at a density of 2.5 3 106 cells/ml in phosphate-buff-
ered saline (PBS) containing 5 mM glucose. For each sample, a 3 ml sample
was placed in the electrode chamber and allowed to equilibrate with air for
3 min. Oxygen consumption was then recorded for 15 min. The data were
normalized to cell number.
Chromosome Aberrations
MEFs were exposed at passage four to irradiation and harvested after 72 hr.
Whole-mount chromosomes were counted in a blinded fashion. Individual
spreads were deemed countable if all chromosomes were clearly defined
and clearly visible within the ghost of a single cytoplasm.
Real-Time Long PCR Assay for mtDNA Damage
mtDNA damage was measured as amplification efficiency for a large
(10,095 bp) fragment relative to a short (117 bp) Amplicon of mtDNA in wild-
type and knockout mice (see Supplemental Experimental Procedures).
Allograft and Tissue Specimen
Cells (2 3 106 or 1 3 106) in PBS for a total volume of 100 ml/injection site were
injected subcutaneously in right and left flanks of 8-week-old male athymic
mice (Jackson Laboratories).Tumor sizes were measured twice weekly in
two dimensions (width, W, and length, L) with calipers. Average tumor volume
(V) was calculated as V = 0.5 3 L 3 W2. At the termination of the experiment,
mice were sacrificed; tumors were excised and weighed. All animal care
followed approved institutional guidelines of the National Institutes of Health.
All experiments were approved by the animal care and use committee of
the National Institute Diabetes and Digestive and Kidney Diseases (K069-
GDDB-08) or the National Cancer Institute (ROB-118).
Normal and breast cancer tissue slides were purchased from (US Biomax,
Inc.) and analyzed by IHC. RNA samples from normal breast (NB) and malig-
nant breast were purchased (TissueScan Breast Cancer Panel 1 Origene)
and analyzed per the supplier’s instructions. As these samples were obtained
commercially without accompanying patient identifying data, they are consid-
ered ‘‘exempt’’ according to HHS guidelines.
Oxidative Phosphorylation Enzyme Activities
Oxidative phosphorylation enzyme activities were measured on total cellular
protein including complex I (Supplemental Experimental Procedures).
Complex II, III, and IV methods are presented in the Supplemental Experi-
mental Procedures section.
SUPPLEMENTAL INFORMATION
Supplemental Data include Supplemental Experimental Procedures, six
figures, and one table, and can be found with this article online at
doi:10.1016/j.ccr.2009.11.023.
ACKNOWLEDGMENTS
This research was supported (in part) by the Intramural Research Program
of the National Institute Diabetes and Digestive and Kidney Diseases, National
Cancer Institute, and CCR, National Institutes of Health. D.R.S. and N.A.B. are
supported by grants from the National Institutes of Health (R01CA100045,
R01CA133114, and P30 CA086862). K.K.S. was supported by R01 121904
and 116430. J.D.S. was supported by F30AG030839. S.A.A. was supported
by CA094858 and CA123484. We thank Melissa Stauffer, PhD, of Scientific
Editing Solutions, for editorial assistance.
Received: February 20, 2009
Revised: June 18, 2009
Accepted: November 9, 2009
Published: January 19, 2010
REFERENCES
Ahn, B.H., Kim, H.S., Song, S., Lee, I.H., Liu, J., Vassilopoulos, A., Deng, C.X.,
and Finkel, T. (2008). A role for the mitochondrial deacetylase Sirt3 in regu-
lating energy homeostasis. Proc. Natl. Acad. Sci. USA 105, 14447–14452.
Allison, S.J., and Milner, J. (2007). SIRT3 is pro-apoptotic and participates in
distinct basal apoptotic pathways. Cell Cycle 6, 2669–2677.
Aykin-Burns, N., Ahmad, I.M., Zhu, Y., Oberley, L.W., and Spitz, D.R. (2009).
Increased levels of superoxide and H2O2 mediate the differential susceptibility
of cancer cells versus normal cells to glucose deprivation. Biochem. J. 418,
29–37.
Deng, C.X. (2006). BRCA1: cell cycle checkpoint, genetic instability, DNA
damage response and cancer evolution. Nucleic Acids Res. 34, 1416–1426.
Deng, C.X. (2009). SIRT1, is it a tumor promoter or tumor suppressor? Int.
J. Biol. Sci. 5, 147–152.
Finkel, T., Deng, C.X., and Mostoslavsky, R. (2009). Recent progress in the
biology and physiology of sirtuins. Nature 460, 587–591.
Guarente, L., and Kenyon, C. (2000). Genetic pathways that regulate ageing in
model organisms. Nature 408, 255–262.
Haigis, M.C., and Guarente, L.P. (2006). Mammalian sirtuins–emerging roles in
physiology, aging, and calorie restriction. Genes Dev. 20, 2913–2921.
Hsu, P.P., and Sabatini, D.M. (2008). Cancer cell metabolism: Warburg and
beyond. Cell 134, 703–707.
Hunter, T. (1997). Oncoprotein networks. Cell 88, 333–346.
Ivshina, A.V., George, J., Senko, O., Mow, B., Putti, T.C., Smeds, J., Lindahl,
T., Pawitan, Y., Hall, P., Nordgren, H., et al. (2006). Genetic reclassification
of histologic grade delineates new clinical subtypes of breast cancer. Cancer
Res. 66, 10292–10301.
Jacobs, K.M., Pennington, J.D., Bisht, K.S., Aykin-Burns, N., Kim, H.S.,
Mishra, M., Sun, L., Nguyen, P., Ahn, B.H., Leclerc, J., et al. (2008). SIRT3 inter-
acts with the daf-16 homolog FOXO3a in the Mitochondria, as well as
increases FOXO3a dependent gene expression. Int. J. Biol. Sci. 4, 291–299.
Knudson, A.G., Jr. (1971). Mutation and cancer: statistical study of retinoblas-
toma. Proc. Natl. Acad. Sci. USA 68, 820–823.
Land, H., Chen, A.C., Morgenstern, J.P., Parada, L.F., and Weinberg, R.A.
(1986). Behavior of myc and ras oncogenes in transformation of rat embryo
fibroblasts. Mol. Cell. Biol. 6, 1917–1925.
Lombard, D.B., Alt, F.W., Cheng, H.L., Bunkenborg, J., Streeper, R.S., Mosto-
slavsky, R., Kim, J., Yancopoulos, G., Valenzuela, D., Murphy, A., et al. (2007).
Mammalian Sir2 homolog SIRT3 regulates global mitochondrial lysine acetyla-
tion. Mol. Cell Biol. 27, 8807–8814.
Onyango, P., Celic, I., McCaffery, J.M., Boeke, J.D., and Feinberg, A.P. (2002).
SIRT3, a human SIR2 homologue, is an NAD-dependent deacetylase localized
to mitochondria. Proc. Natl. Acad. Sci. USA 99, 13653–13658.
Parada, L.F., Land, H., Weinberg, R.A., Wolf, D., and Rotter, V. (1984). Coop-
eration between gene encoding p53 tumour antigen and ras in cellular trans-
formation. Nature 312, 649–651.
Cancer Cell 17, 41–52, January 19, 2010 ª2010 Elsevier Inc. 51

Cancer Cell
SIRT3 Is a Mitochondria-Localized Tumor Suppressor
Rhodes, D.R., Kalyana-Sundaram, S., Mahavisno, V., Varambally, R., Yu, J.,
Briggs, B.B., Barrette, T.R., Anstet, M.J., Kincead-Beal, C., Kulkarni, P.,
et al. (2007). Oncomine 3.0: genes, pathways, and networks in a collection
of 18,000 cancer gene expression profiles. Neoplasia 9, 166–180.
Richardson, A.L., Wang, Z.C., De Nicolo, A., Lu, X., Brown, M., Miron, A., Liao,
X., Iglehart, J.D., Livingston, D.M., and Ganesan, S. (2006). X chromosomal
abnormalities in basal-like human breast cancer. Cancer Cell 9, 121–132.
Rogina, B., and Helfand, S.L. (2004). Sir2 mediates longevity in the fly through
a pathway related to calorie restriction. Proc. Natl. Acad. Sci. USA 101, 15998–
16003.
Saunders, L.R., and Verdin, E. (2007). Sirtuins: critical regulators at the cross-
roads between cancer and aging. Oncogene 26, 5489–5504.
Schwer, B., North, B.J., Frye, R.A., Ott, M., and Verdin, E. (2002). The human
silent information regulator (Sir)2 homologue hSIRT3 is a mitochondrial
nicotinamide adenine dinucleotide-dependent deacetylase. J. Cell Biol. 158,
647–657.
Sebastian, T., Malik, R., Thomas, S., Sage, J., and Johnson, P.F. (2005).
C/EBPbeta cooperates with RB:E2F to implement Ras(V12)-induced cellular
senescence. EMBO J 24, 3301–3312.
Serrano, M., Lin, A.W., McCurrach, M.E., Beach, D., and Lowe, S.W. (1997).
Oncogenic ras provokes premature cell senescence associated with accumu-
lation of p53 and p16INK4a. Cell 88, 593–602.
Sherr, C.J. (2004). Principles of tumor suppression. Cell 116, 235–246.
Sinclair, D.A. (2005). Toward a unified theory of caloric restriction and longevity
regulation. Mech. Ageing Dev. 126, 987–1002.
52 Cancer Cell 17, 41–52, January 19, 2010 ª2010 Elsevier Inc.
Singh, K.K. (2006). Mitochondria damage checkpoint, aging, and cancer. Ann.
N Y Acad. Sci. 1067, 182–190.
Slane, B.G., Aykin-Burns, N., Smith, B.J., Kalen, A.L., Goswami, P.C.,
Domann, F.E., and Spitz, D.R. (2006). Mutation of succinate dehydrogenase
subunit C results in increased O2.-, oxidative stress, and genomic instability.
Cancer Res. 66, 7615–7620.
Sotiriou, C., Wirapati, P., Loi, S., Harris, A., Fox, S., Smeds, J., Nordgren, H.,
Farmer, P., Praz, V., Haibe-Kains, B., et al. (2006). Gene expression profiling
in breast cancer: understanding the molecular basis of histologic grade to
improve prognosis. J. Natl. Cancer Inst 98, 262–272.
Spitz, D.R., Azzam, E.I., Li, J.J., and Gius, D. (2004). Metabolic oxidation/
reduction reactions and cellular responses to ionizing radiation: a unifying
concept in stress response biology. Cancer Metastasis Rev. 23, 311–322.
Sundaresan, N.R., Gupta, M., Kim, G., Rajamohan, S.B., Isbatan, A., and
Gupta, M.P. (2009). Sirt3 blocks the cardiac hypertrophic response by
augmenting Foxo3a-dependent antioxidant defense mechanisms in mice.
J. Clin. Invest 19, 2758–2771.
Tissenbaum, H.A., and Guarente, L. (2001). Increased dosage of a sir-2 gene
extends lifespan in Caenorhabditis elegans. Nature 410, 227–230.
Wang, R.H., Sengupta, K., Li, C., Kim, H.S., Cao, L., Xiao, C., Kim, S., Xu, X.,
Zheng, Y., Chilton, B., et al. (2008). Impaired DNA damage response, genome
instability, and tumorigenesis in SIRT1 mutant mice. Cancer Cell 14, 312–323.
Warburg, O. (1956). On the origin of cancer cells. Science 123, 309–314.


![Establishment and Identification of Small Cell Lung Cancer Cell … · [CANCER RESEARCH 45, 2913-2923, June 1985] Establishment and Identification of Small Cell Lung Cancer Cell Lines](https://img.pdfslide.us/doc/110x75/60347fa5d25195593e3efdb8/establishment-and-identification-of-small-cell-lung-cancer-cell-cancer-research.jpg)