Embed Size (px)
DESCRIPTION
Cancer Cell
Citation preview


Cancer Cell
Previews
Three Down and One To Go: ModelingMedulloblastoma Subgroups
Charles G. Eberhart1,*1Departments of Pathology, Ophthalmology and Oncology, Johns Hopkins University School of Medicine, Baltimore, MD 21205, USA*Correspondence: [email protected] 10.1016/j.ccr.2012.01.013
In this issue of Cancer Cell, Pei et al. and Kawauchi et al. describe murine models of an aggressive medullo-blastoma subtype driven by Myc. These tumors have a cellular origin, microscopic appearance, and molec-ular profile distinct from those of three other major subgroups. Thus, themodels fill a significant clinical need.
Medulloblastoma are embryonal tumors
involving the cerebellum and comprised
of tightly packed stem-like cells that retain
the capacity to differentiate along multiple
lineages. Current treatments cure only
a subsetofpatientsand result in significant
long-term morbidity. Thus, improved
prognostic markers and therapies are
clearly needed. Recent gene expression
studies have divided medulloblastoma
into four major molecular subtypes, many
of which also have unique clinical and
histopathological features (Cho et al.,
2011; Northcott et al., 2011). An interna-
tional consensus panel has proposed
names for the four groups (Taylor et al.,
2011; Figure 1). It is hoped that our
improving molecular understanding of
medulloblastoma will lead to more tar-
geted therapeutic approaches, promoting
reduced morbidity in children harboring
less aggressive tumors and longer survival
in those with more aggressive variants.
The first two medulloblastoma sub-
groups are defined molecularly by WNT
and Sonic Hedgehog (SHH) pathway
activation, respectively, with the former
associated with very good clinical
behavior and the latter showing fairly
good outcomes in infants and interme-
diate ones in older individuals. Because
of their roles in Turcot and Gorlin syn-
dromes, these pathways have long been
associated with medulloblastoma for-
mation. A transgenic mouse model of
WNT-induced medulloblastoma has re-
cently been reported, with tumors arising
from progenitor cells in the embryonic
dorsal brainstem and lower rhombic lip
but not from granule neuron precursors
(GNPs) that generate most of the cells in
the cerebellum (Gibson et al., 2010). In
contrast, using several transgenic medul-
loblastoma models driven by increased
Hedgehog signaling, it has been shown
that even when SHH tumors are initiated
in cerebellar stem cells in vivo, they must
first commit to aGNP lineagebefore grow-
ing into neoplastic masses in the brain
(Schuller et al., 2008; Yang et al., 2008).
What has been lacking until now is
a well-validated model of Group 3 medul-
loblastoma. This is clinically important, as
this subgroup is the most aggressive in
terms of its growth, dissemination, and
resistance to current therapies. Group 3
medulloblastoma are characterized by
amplification and overexpression of the
c-myc (MYC) oncogene, and many of
them are of the large cell/anaplastic
(LCA) histopathological subtype (Taylor
et al., 2011). It has been shown that
Mycn can drive medulloblastoma forma-
tion in mice, but only a subset of these
show an LCA phenotype, andmost Group
3 tumors are not associated with elevated
MYCN levels (Swartling et al., 2010).
In human medulloblastoma cell lines,
the introduction of MYC can promote
aggressive xenograft growth and an
LCA appearance (Stearns et al., 2006).
However, it has not been clear if MYC
plays a role in the initiation of medullo-
blastoma, or what cells might be suscep-
tible to transformation by this oncogene.
The models described in this issue of
Cancer Cell significantly improve our
understanding of how Group 3 medullo-
blastoma form, and will be critical for
testing potential therapies for the group
of children with highly aggressive medul-
loblastoma, which needs them most.
Pei et al. (2012 [in this issue of Cancer
Cell]) isolated cells from postnatal murine
cerebellum based on expression of the
stem cell marker Prominin1 (Prom1) and
lack of lineage marker expression that
defines GNPs. They have previously
Cancer Cell 21,
shown that this population has functional
stem cell properties and resides predom-
inantly in the cerebellar white matter. The
introduction of a mutant, stabilized Myc
construct was sufficient to promote
proliferation and self-renewal in vitro;
however, when injected into the cerebella
of immunocompromised mice, cells pro-
liferated for a few weeks but also showed
significant apoptosis and did not form
tumors. By introducing both stabilized
Myc and dominant negative p53 (DNp53),
the investigators were able to block this
apoptotic induction and tumors formed
in vivo within three months of injection.
Wild-type Myc could also induce tumors
in conjunction with DNp53, but with re-
duced penetrance and increased latency.
Importantly, the murine tumors recapit-
ulated many features of human Group 3
medulloblastoma. The cells were larger
than those in SHH-driven models and
showed other morphological similarities
to LCA tumors, including nuclear molding
and prominent cell death. Gene expres-
sion analysis revealed that they were
distinct from SHH-inducedmurine medul-
loblastomas and, among human medul-
loblastomas, were most similar to the
subgroups defined by elevated MYC
(Cho et al., 2011; Northcott et al., 2011).
Both immunohistochemical analysis and
RNA profiling suggested that the tumors
were largely undifferentiated.
Kawauchi et al. (2012 [in this issue
of Cancer Cell]) also introduced Myc
into cerebellar cells ex vivo, but they
used Trp53 null GNPs sorted using the
neuronal lineage marker Atoh1. Injection
of these cells into immunocompromised
mice resulted in tumors with LCA features
distinct from the WNT or SHH-induced
medulloblastoma previously analyzed by
this group, both of which have a more
February 14, 2012 ª2012 Elsevier Inc. 137

Figure 1. Medulloblastoma SubgroupsTranscriptional profiling supports the existence of four main medulloblastoma subgroups that differ withrespect to their common microscopic appearance and clinical associations. The cartoons below depicta classic medulloblastoma comprised of heterogenous embryonal cells, a desmoplastic/nodular tumorwith a central region of neuronal differentiation, and a large cell anaplastic medulloblastoma withincreased nuclear size and pronounced cellular molding/engulfment.
Cancer Cell
Previews
classic histopathological appearance.
Analysis of the Myc-driven tumor tran-
scriptome also supported the notion that
they were similar to human Group 3
medulloblastoma and distinct from prior
murine models induced by WNT, SHH, or
Mycn. Mycn is a target of the SHH
pathway in the developing cerebellum,
and medulloblastoma previously gener-
ated using Mycn by this group had
a gene expression profile more similar to
SHH tumors than those promoted byMyc.
Kawauchi et al. (2012) also detected
increased expression of Prom1 and other
stem cell factors in their Myc-driven
tumors despite the fact that they were
initiated in sorted populations of GNPs
largely negative for these markers.
Indeed, Atoh1 expression was lost in
tumors, suggesting that either they had
arisen from rare Atoh1 negative cells in
the highly enriched starting material or
that sorted GNPs were de-differentiating
or otherwise silencing expression of line-
age markers as part of their transforma-
tion. Pei et al. (2012) also could induce
tumors from sorted GNP populations and
found that the resulting medulloblastoma
had lost expression of neuronal lineage
markers. Moreover, both groups found
that expression profiles of theMyc-driven
138 Cancer Cell 21, February 14, 2012 ª2012
medulloblastoma showed significant
overlap with those of neural stem cells,
induced pluripotent stem cells, and em-
bryonic stem cells. Together, these sug-
gest that Group 3 medulloblastoma either
arise fromneural stemcells or de-differen-
tiate and take on a stem-like phenotype as
part of their Myc-induced transformation.
Both groups also began to use their
new models to evaluate potential thera-
pies for these clinically aggressive
tumors. Kawauchi et al. (2012) showed
that the tumors are resistant to SHH
pathway inhibitors, a significant finding
as these compounds have begun to enter
clinical trials, and it had been suggested
that their efficacy might not be limited to
the SHH medulloblastoma subgroup. Pei
et al. (2012) similarly found that their
tumors were insensitive to SHH pathway
blockade but demonstrated that ongoing
Myc expression is required to maintain
tumor growth. They also used gene
expression profiling to identify PI3K and
mTOR signaling as potential novel thera-
peutic targets inMyc-driven medulloblas-
toma, demonstrated that small molecule
inhibitors of PI3K and mTOR could slow
tumor cell growth in vitro, and then vali-
dated the pro-survival effects of one
compound in vivo.
Elsevier Inc.
To improve our treatment of cancer, we
must embrace and seek to understand its
complexity. Over the last two decades,
analysisof thepediatric brain tumormedul-
loblastoma has generated numerous
insights into how cancer can be meaning-
fully subgrouped and how oncogenic
stimuli associated with developmentally
important signaling pathways interact with
specific populations of stem and progen-
itor cells to induce tumors. The two studies
discussed above represent the next link in
this chain, providing important new tools
for preclinical testing and yielding insights
into the origin and nature of an aggressive
medulloblastoma subgroup associated
with Myc. The new models will also be
useful in addressing unexpected recent
findings, such as the discovery of a strong
photoreceptor expression signature in
Group 3 medulloblastoma.
REFERENCES
Cho, Y.J., Tsherniak, A., Tamayo, P., Santagata,S., Ligon, A., Greulich, H., Berhoukim, R., Amani,V., Goumnerova, L., Eberhart, C.G., et al. (2011).J. Clin. Oncol. 29, 1424–1430.
Gibson, P., Tong, Y., Robinson, G., Thompson,M.C., Currle, D.S., Eden, C., Kranenburg, T.A.,Hogg, T., Poppleton, H., Martin, J., et al. (2010).Nature 468, 1095–1099.
Kawauchi, D., Robinson, G., Uziel, T., Gibson, P.,Rehg, J.E., Gao, C., Finkelstein, D., Qu, C., and Po-unds, S. (2012). Cancer Cell 21, this issue,168–180.
Northcott, P.A., Korshunov, A., Witt, H., Hielscher,T., Eberhart, C.G., Mack, S., Bouffet, E., Clifford,S.C., Hawkins, C.E., French, P., et al. (2011). J.Clin. Oncol. 29, 1408–1414.
Pei, Y., Moore, C.E., Wang, J., Tewari, A.K., Erosh-kin, A., Cho, Y.J., Witt, H., Korshunov, A., Read,T.A., and Sun, J.L. (2012). Cancer Cell 21, thisissue, 155–167.
Schuller, U., Heine, V.M., Mao, J., Kho, A.T., Dillon,A.K., Han, Y.G., Huillard, E., Sun, T., Ligon, A.H.,Qian, Y., et al. (2008). Cancer Cell 14, 123–134.
Stearns, D., Chaudhry, A., Abel, T.W., Burger, P.C.,Dang, C.V., and Eberhart, C.G. (2006). Cancer Res.66, 673–681.
Swartling, F.J., Grimmer, M.R., Hackett, C.S.,Northcott, P.A., Fan, Q.W., Goldenberg, D.D.,Lau, J., Masic, S., Nguyen, K., Yakovenko, S.,et al. (2010). Genes Dev. 24, 1059–1072.
Taylor, M.D., Northcott, P.A., Korshunov, A.,Remke, M., Cho, Y.J., Clifford, S.C., Eberhart,C.G., Parsons, D.W., Rutkowski, S., Gajjar, A.,et al. (2011). Acta Neuropathol.
Yang, Z.J., Ellis, T., Markant, S.L., Read, T.A.,Kessler, J.D., Bourboulas, M., Schuller, U., Mac-hold, R., Fishell, G., Rowitch, D.H., et al. (2008).Cancer Cell 14, 135–145.

Cancer Cell
Previews
VEGF-D(ilated) Lymphaticsas Gateways to Metastasis
Janusz Rak1,*1Montreal Children’sHospital TheResearch Institute –McGillUniversityHealthCentre, 4060SteCatherineWest,Montreal,QC,H3Z3Z2,Canada*Correspondence: [email protected] 10.1016/j.ccr.2012.01.012
VEGF-C and VEGF-D have been implicated in lymphatic metastasis, mainly as inducers of new intra/peritu-moral capillary lymphatics. In this issue of Cancer Cell, Karnezis and colleagues challenge this notion anddemonstrate that tumor-derived VEGF-D promotes metastasis by causing prostaglandin-dependent dilationof collecting lymphatics outside of the tumor mass.
Metastasis defines the progressive, sys-
temic, and intractable nature of late-stage
human cancers. Implicitly, this process
involves trafficking of cancer cells within
blood and lymphatic compartments to
sites of their secondary growth in distant
organs and regional lymph nodes, respec-
tively (Fidler, 2003). By extension, the cor-
responding processes of tumor-induced
formation of new blood vessels (angiogen-
esis) and lymphatics (lymphangiogenesis)
are often viewed as prerequisites for the
onset of hematogenous and lymphatic
dissemination. Either of the resulting mi-
crovascular networks may constitute a
point of entry for cancer cells into the
vascular system and a rate limiting step in
disease spreading (Folkman, 2007; Alitalo,
2011). In spite of some controversy as to
the causal role of lymph node metastases
as ‘‘launch pads’’ of systemic dissemina-
tion (Sleeman and Thiele, 2009), the in-
herent appeal of this possibility has con-
tributed to a growing interest in targeting
lymphangiogenesis as an early pro-meta-
static switch in cancer (Alitalo, 2011).
Much of the effort in this area has
centered around obliteration of major
lymphangiogenic growth factor pathways
triggeredbymembersof thevascularendo-
thelial growth factor (VEGF) family, espe-
ciallyVEGF-C,VEGF-D,and tosomeextent
VEGF-A, all of which may be expressed by
metastatic cancer cells. The respective
receptors for these factors, VEGFR3 and
VEGFR2, are present on lymphatic endo-
thelial cells (LECs), which can be distin-
guished from their vascular counterparts
by patterns of gene expression and distinct
molecularmarkers (LYVE-1,Prox1, andpo-
doplanin) (Alitalo, 2011). LECs line both the
terminal, thin walled lymphatics, devoid of
supporting mural cells, and their draining
contractile ducts, collecting lymphatic
vessels (CLVs), which contain mural cells
and pass the interstitial fluid (and cancer
cells) to the regional lymph nodes.
Several specific monoclonal anti-
bodies, soluble receptors, and small mol-
ecule inhibitors have been developed
to block VEGF/VEGF receptor (VEGFR)
pathways and impede lymphangiogene-
sis. In addition, the expression of VEGFs
by cancer cells can be inhibited using
non-steroidal anti-inflammatory drugs
(NSAIDs) and other agents. The intuitively
obvious way to observe whether these
drugs actually work in cancer would be
to follow the expected decline in density
of capillary lymphatics within, and adja-
cent to, the tumor mass, using LEC
markers such as LYVE-1. Indeed, such
effects have been observed and may, at
least in some cases, be rate-limiting for
lymphatic and systemic metastasis.
As it turns out, clues as to the role of
VEGFs in lymph node metastasis may
also be found outside of the proverbial
‘‘box,’’ i.e., away from the tumor masses,
and within their draining CLVs. A compel-
ling example of this scenario is described
by Karnezis et al., (2012) in this issue of
Cancer Cell. These authors set out to
explore processes by which tumors
expressing VEGF-D trigger lymph node
metastasis. Although such tumors do
contain rich networks of capillary lym-
phatics, these investigators noticed that
what separated them from their non-meta-
static counterparts was a startling (macro-
scopic) enlargement of CLVs draining the
tumor basin to sentinel lymph nodes. The
striking images of this CLV dilation suggest
that the lymphatic influence of a growing
cancer is not confined to its physical
boundaries, but extends far beyond. What
Cancer Cell 21,
might be the mechanism by which VEGF-
D-expressing tumor cells exert such
a long distance influence (over tens ofmilli-
meters), and what are the consequences?
In search for answers Karnezis et al.,
(2012) first documented that CVL dilation
is, indeed, directly VEGF-D-dependent.
For example, this effect was absent in the
case of non-metastic and VEGF-D non-ex-
pressing tumors or when VEGF-D was
replacedwithVEGF-A. Likewise, treatment
with neutralizing antibodies against
VEGF-D (VD1), VEGFR3 (mF4-31C1), or
VEGFR2 (DC101) abolished CLV dilation.
These observations suggest that VEGF-D
causesdilation throughcooperativeactiva-
tion of VEGFR3 and VEGFR2 in LECs that
are located in the extra-tumoral CLV
segments.Todetermine thenatureof these
responses, CLVs were isolated, and their
LEC populations were purified and profiled
for gene expression. This revealed a dis-
tinct molecular signature of these cells,
including their ability to markedly down-
regulate prostaglandin dehydrogenase
(PGDH) in the presence of VEGF-D.
PGDH breaks down prostaglandins (e.g.,
PGE2), thereby opposing the action of the
prostaglandin synthesis pathway driven
by cyclooxygenase 2. Thus, downregula-
tion of PGDH in LECs exposed to VEGF-D
raises the levels of circulating prostaglan-
dins, which in turn act on mural cells within
tumor-related CLVs, causing their dilation.
These events have profound conse-
quences for metastasis. Karnezis et al.,
(2012) demonstrated that essentially all
treatments that counteracted CLV dila-
tion also diminished the metastatic load
in draining lymph nodes. Interestingly,
Etodolac, an NSAID, triggers these ef-
fects essentially without changing the
lymphatic or blood vessel density within
February 14, 2012 ª2012 Elsevier Inc. 139

Cancer Cell
Previews
the primary tumor, which suggests that
CLV dilation may have a far more central
role in the metastatic process than hith-
erto appreciated. Interestingly, Etodolac
also diminished metastatic burden in the
lung. These results suggest that a level
of control over the lymphatic and sys-
temic dissemination could potentially be
achieved by administration of relatively
safe anti-inflammatory agents.
This provocative study adds an impor-
tant dimension to the process that might
be viewed as vascular system ‘‘condi-
tioning’’ for cancer metastasis. While the
focus of the present study is on CLV dila-
tion, others observed lymphangiogenesis
within lymph nodes prior to their meta-
static colonization (Tobler and Detmar,
2006), a process that may be attributed
to remote influences of growth factors
or exosomes (Hood et al., 2011). Analo-
gous pre-metastatic niches were also
described at sites of blood borne metas-
tases (Kaplan et al., 2005).
The enlargement ofmacroscopic vessels
located outside of a growing tumor is not
restricted to CLVs. Similar increases in
diameter are often observed in the case of
bloodvessels thatsupply tumormicrocircu-
lation (feeding arteries and collecting veins),
which is also apparent from some of the
images included in the study by Karnezis
et al., (2012). Although this is a commonly
observed phenomenon, the underlying bio-
logical process has thus far attracted
minimal attention (Yu and Rak, 2003). In
contrast to angiogenesis, which occurs at
the level of microscopic capillaries (Carme-
140 Cancer Cell 21, February 14, 2012 ª2012
liet and Jain, 2011), formation of larger
tumor-feeding blood vessels may involve
such mechanisms as dilation, similar to
that occurring in CLVs, or circumferential
growth (‘‘tumor arteriogenesis’’) (Yu and
Rak, 2003). Whether such macroscopic
changes control tumor microenvironment,
growth, or hematogenous metastasis (by
analogy to CLVs) remains to be studied.
The novel and fascinating link between
CLV dilation and lymphatic metastasis
described by these authors raises several
important questions. For example, how
does CLV dilation promote metastasis? Is
this merely a wider conduit (‘‘plumbing’’)
effect, or does it involve more subtle regu-
latory mechanisms (e.g., tumor-LEC inter-
actions)? Since the VEGF-D-induced
increase in prostaglandin levels is detected
inperipheral blood, could suchachangebe
indicative of impending lymphatic metas-
tasis in the clinic? How early in progression
ofhumancancerswould increase inprosta-
glandins occur, and how discrete, how
detectable, would this event be? What
systemic consequences may be associ-
ated with VEGF-D-induced increase in
prostaglandins in blood, e.g., for the
vascular system? What turns on lymphan-
giogenic growth factors in metastatic
cancers, and is there a link between onco-
genic pathways and CLV dilation?
It is fascinating to think that a pharmaco-
logical blockade of the pathological CLV
dilation and metastasis could be achieved
with already available agents (VEGF/
VEGFR3/2 inhibitors and NSAIDs). How-
ever, onewonderswhether such treatment
Elsevier Inc.
could interfere with the lymph outflow from
the primary tumor mass leading to a build
up of interstitial fluid pressure (IFP)?
Increase in IFP has been linked to impaired
drug delivery and could result in vascular
compression, hypoxia, and perhaps in
hematogenous metastasis. It is unclear if
anyof theseeffectsmightaccompany ther-
apeutic interference with CLV dilation.
Indeed, the work of Karnezis et al., (2012)
opens up several new lines of inquiry
and a new domain in the field of lymphan-
giogenesis and cancer progression.
REFERENCES
Fidler, I.J. (2003). Nat. Rev. Cancer 3, 453–458.
Folkman,J. (2007).Nat.Rev.DrugDiscov.6, 273–286.
Alitalo, K. (2011). Nat. Med. 17, 1371–1380.
Sleeman, J.P., and Thiele, W. (2009). Int. J. Cancer125, 2747–2756.
Karnezis, T., Shayan, R., Ceasar, C., Roufail, S.,Harris, N.C., Ardipradja, K., Zhang, Y.F., Williams,S.P., Farnsworth, R.H., Chai, M.G., et al. (2012).Cancer Cell 21, this issue, 181–195.
Tobler, N.E., and Detmar, M. (2006). J. Leukoc.Biol. 80, 691–696.
Hood, J.L., San, R.S., and Wickline, S.A. (2011).Cancer Res. 71, 3792–3801.
Kaplan, R.N., Riba, R.D., Zacharoulis, S., Bramley,A.H., Vincent, L., Costa, C., MacDonald, D.D., Jin,D.K., Shido, K., Kerns, S.A., et al. (2005). Nature438, 820–827.
Yu, J.L., and Rak, J.W. (2003). Breast Cancer Res.5, 83–88.
Carmeliet, P., and Jain, R.K. (2011). Nature 473,298–307.
aSIRTing Control over Cancer Stem Cells
Takahiro Ito,1 Bryan Zimdahl,1,2 and Tannishtha Reya1,*1Department of Pharmacology, University of California San Diego School of Medicine, La Jolla, CA 92093, USA2Department of Pharmacology and Cancer Biology, Duke University Medical Center, Durham, NC 27710, USA*Correspondence: [email protected] 10.1016/j.ccr.2012.01.014
Cancer stem cells lie at the root of chronic myelogenous leukemia (CML) and mediate its continued growth.Their resistance to current therapies results in an inability to eradicate the disease. In this issue ofCancer Cell,Li et al. identify SIRT1 as a new target for eliminating CML cancer stem cells.
Chronic myelogenous leukemia (CML) is
a cancer that begins in hematopoietic
stem cells. Triggered by the BCR-ABL
translocation (Melo and Barnes, 2007),
additional mutations can induce its
progression from a slow-growing chronic

Figure 1. SIRT1 Inhibition Effectively Targets CML Cancer Stem CellsChronicmyelogenous leukemia (CML) is composed of differentiated cells (blue and purple) as well as amore primitive pool of cancer stem cells (red) that have thecapacity to propagate the disease (left). The kinase inhibitor Imatinib can eliminate differentiated CML cells but cannot effectively target cancer stem cells(middle). Though insensitive to Imatinib, cancer stem cells remain dependent on SIRT1. Thus, the combined use of the SIRT1 inhibitor Tenovin 6 and Imatinibeffectively removes residual cancer stem cells and may block CML at its root (right).
Cancer Cell
Previews
phase to a more aggressive and undiffer-
entiated blast crisis phase. The discovery
of the kinase inhibitor imatinib mesylate
revolutionized the treatment of CML.
Over the years, however, it has become
clear that while kinase inhibitors can
hold CML at bay, they are unable to erad-
icate the disease, leading to a life-long
dependence on the drug and an in-
creased risk of relapse and progression.
In addition, kinase inhibitors are ineffec-
tive against drug-resistant and advanced
stage disease. Although such patients
may not form a large group in developed
countries, the global face of CML is very
different, and many patients are not diag-
nosed until the disease is at an advanced
stage. Insight into the limitations of tar-
geted kinase therapy came from an
understanding that CML is composed of
differentiated cells as well as a more
undifferentiated pool of cancer stem cells
that have the capacity to propagate the
disease (Wang et al., 1998). Emerging
evidence suggests that differentiated
CML cells are addicted to ABL and can
be eliminated by kinase inhibitors, while
cancer stem cells can become ABL inde-
pendent and thus persist despite therapy
(Graham et al., 2002; Corbin et al., 2011).
Thus, identifying regulators that are
required for CML cancer stem cell growth
and renewal is critical for effectively tar-
geting the disease. In this issue of Cancer
Cell, Li et al. (2012) identify SIRT1, the
founding member of the Sirtuin family of
proteins, as an exciting new target for
eradicating CML cancer stem cells and
thereby stopping CML growth.
Sirtuins, mammalian homologs of the
yeast protein silent information regulator
2, represent a unique subclass of histone
deacetylases; their substrates can
include both histones and non histone
proteins, and unlike other HDACs, they
act in an NAD-dependent manner (Haigis
andSinclair, 2010). Sirtuins exert a power-
ful influence on a wide array of cellular
processes including DNA repair, cell
survival, metabolism, and aging in diverse
organisms (Haigis and Sinclair, 2010).
In this study, the authors use a combi-
nation of genetically engineered mouse
models and primary leukemia xenografts
Cancer Cell 21,
to assess the role of SIRT1 in mouse and
human CML growth. The authors first
examined the expression of SIRT1 in
normal and CML cells, focusing on the
stem cell enriched CD34+ population.
SIRT1 was expressed at higher levels in
human CML CD34+ cells than in normal
CD34+ cells. Moreover, knockdown of
SIRT1 in CD34+ CML cells led to reduced
proliferation, enhanced apoptosis, and
impaired colony-forming ability. Impor-
tantly, SIRT1 knockdown had less of an
effect on proliferation and apoptosis of
normal CD34+ cells, suggesting that
CML and normal stem cells display
a differential dependence on SIRT1.
Further, the combined use of SIRT1 inhi-
bition together with imatinib led to an
increase in cell death, suggesting that
suppression of SIRT1 could cooperate
with imatinib to more effectively block
CML stem cells (Figure 1).
To test if the dependence of CML on
SIRT1 could be useful in a therapeutic
context, the authors used the small mole-
cule Tenovin 6 (TV-6), which blocks the
activity of sirtuin family proteins (Lain
February 14, 2012 ª2012 Elsevier Inc. 141

Cancer Cell
Previews
et al., 2008). In vitro treatment with TV-6,
and to a greater extent with TV-6 and im-
atinib, reduced colony formation and
in vivo engraftment more effectively than
imatinib alone, highlighting the potential
utility of SIRT inhibition in the context of
combination therapy.
While the experiments involving ex vivo
exposure suggested that pharmacologic
blockade of SIRT1 was effective against
CML, it was critical to assess whether
the drug could affect disease in a physio-
logical context. To test this, the group iso-
lated leukemic cells from an inducible
BCR-ABL transgenic mouse and trans-
planted them into irradiated recipients.
These mice were subsequently treated
with imatinib, TV-6, or the combination
daily for 21 days. Although imatinib alone
impaired leukemia growth, it failed to
target CML stem cells. In contrast, TV-6
alone, and to a greater extent TV-6 and
imatinib, led to a very significant loss of
CML stem cells. Consistent with this,
mice treated with the combination
showed improved survival, with reduced
numbers of residual leukemic cells in
the bone marrow after discontinuation of
treatment. Although the changes in sur-
vival were perhaps not as dramatic as
the drop in cancer stem cell content may
have predicted, it is important to note
that the drug was discontinued after 3
weeks; thus, continued treatment, modi-
fied dosing or the use of alternate inhibi-
tors might show further benefits in vivo.
In a key experiment, the authors also
tested the effect of TV-6 on mice xeno-
grafted with an imatinib-resistant blast
crisis CML patient sample and found
that it led to a significant reduction in
engraftment at multiple sites of leukemia
growth. This suggests that targeting
SIRT1 may be effective against both
chronic phase and in imatinib-resistant
advanced stage disease. More broadly,
this work identifies Sirtuins as an impor-
142 Cancer Cell 21, February 14, 2012 ª2012
tant control point for cancer stem cells
and provides a strong rationale for
considering SIRT1 inhibitors for treatment
of myeloid leukemias and perhaps other
malignancies that display activation of
this pathway.
How does SIRT1 inhibition eliminate
CML cancer stem cells? SIRT1 has previ-
ously been shown to deacetylate p53 and
thereby regulate its transcriptional activity
(Haigis and Sinclair, 2010). In support of
this notion, SIRT1 inhibition elevated acet-
ylated and total p53 levels in both chronic
and blast crisis phase CML CD34+ cells,
triggering a rise in p53 target genes. Loss
of function studies indicated that TV-6
depends on p53 to affect CML, consistent
with the fact that p53 activation can effec-
tively target CML. This suggests that
consideration of SIRT1 as a target should
take into account a patient’s p53 status,
since the 30% of blast crisis patients
whose disease display p53 mutations are
unlikely to respond to this strategy (Melo
and Barnes, 2007).
In the last few years, basic and transla-
tional work has identified several path-
ways that are critical for CML stem cell
function and renewal, including promye-
locytic leukemia protein (PML), b-catenin,
Alox5, and Smoothened (reviewed in
Chen et al., 2010). These studies shed
light on the molecular mechanisms that
protect and sustain CML cancer stem
cells, allowing them to evade imatinib.
Some have been of immediate transla-
tional interest because they can be readily
targeted; this is true in particular for PML
and Smoothened, which can be inhibited
by arsenic trioxide and by Hedgehog
pathway antagonists (Dierks et al., 2008;
Ito et al., 2008; Zhao et al., 2009). Both
strategies are currently being tested in
trials of myeloid leukemia, and it will be
of great interest to see how effective and
durable they turn out to be. But consid-
ering the fact that kinase inhibitors can
Elsevier Inc.
hold CML at bay in many patients, the
bar for a new therapeutic in this disease
may be high. At this stage, it is not unrea-
sonable to hope for eradication of residual
cancer stem cells and an ability to discon-
tinue therapy without relapse. Perhaps
the blockade of SIRT1 will allow us to
finally assert control over CML cancer
stem cells and accelerate progress
toward this goal.
REFERENCES
Chen, Y., Peng, C., Sullivan, C., Li, D., and Li, S.(2010). Leukemia 24, 1545–1554.
Corbin, A.S., Agarwal, A., Loriaux, M., Cortes, J.,Deininger, M.W., and Druker, B.J. (2011). J. Clin.Invest. 121, 396–409.
Dierks, C., Beigi, R., Guo, G.R., Zirlik, K., Stegert,M.R., Manley, P., Trussell, C., Schmitt-Graeff, A.,Landwerlin, K., Veelken, H., and Warmuth, M.(2008). Cancer Cell 14, 238–249.
Graham, S.M., Jørgensen, H.G., Allan, E., Pearson,C., Alcorn, M.J., Richmond, L., and Holyoake, T.L.(2002). Blood 99, 319–325.
Haigis, M.C., and Sinclair, D.A. (2010). Annu. Rev.Pathol. 5, 253–295.
Ito, K., Bernardi, R., Morotti, A., Matsuoka, S., Sa-glio, G., Ikeda, Y., Rosenblatt, J., Avigan, D.E., Ter-uya-Feldstein, J., and Pandolfi, P.P. (2008). Nature453, 1072–1078.
Lain, S., Hollick, J.J., Campbell, J., Staples, O.D.,Higgins, M., Aoubala,M.,McCarthy, A., Appleyard,V., Murray, K.E., Baker, L., et al. (2008). Cancer Cell13, 454–463.
Li, L., Wang, L., Liang, L., Wang, Z., Ho, Y., McDo-nald, T., Holyoake, T.L., Chen, W., and Bhatia, R.(2012). Cancer Cell 21, this issue, 266–281.
Melo, J.V., and Barnes, D.J. (2007). Nat. Rev.Cancer 7, 441–453.
Wang, J.C., Lapidot, T., Cashman, J.D., Doedens,M., Addy, L., Sutherland, D.R., Nayar, R., Laraya,P., Minden, M., Keating, A., et al. (1998). Blood91, 2406–2414.
Zhao, C., Chen, A., Jamieson, C.H., Fereshteh, M.,Abrahamsson, A., Blum, J., Kwon, H.Y., Kim, J.,Chute, J.P., Rizzieri, D., et al. (2009). Nature 458,776–779.

Cancer Cell
Previews
Glycine Decarboxylase Cleavesa ‘‘Malignant’’ Metabolic Pathto Promote Tumor Initiation
John E. Dominy,1,3 Francisca Vazquez,2,4 and Pere Puigserver1,3,*1Department of Cancer Biology2Department of Medical Oncology, Dana-Farber Cancer Institute3Department of Cell BiologyHarvard Medical School, Boston, MA 02115, USA4Broad Institute of Harvard and MIT, Cambridge, MA 02142, USA*Correspondence: [email protected] 10.1016/j.ccr.2012.01.019
Tumor-initiating cells (TICs) are thought to be critical for promoting tumorigenesis. In a recent Cell article,Zhang and colleagues found that non-small cell lung cancer TICs overexpress the metabolic enzyme glycinedecarboxylase, which leads to increases in pyrimidine synthesis and is critical for proliferation and tumorinitiation.
Tumors are frequently composed of a
heterogeneous population of cancer
cells, and accumulating evidence sug-
gests that, in many tumor types, only a
subpopulation of these cells, named can-
cer stem cells or tumor-initiating cells
(TICs) (Nguyen et al., 2012), are respon-
sible for tumor maintenance and pro-
gression. There is also evidence that
TICs are more resistant to many conven-
tional chemotherapies and radiotherapies
and, as such, are suspected to be re-
sponsible for tumor recurrence after
treatment (Singh and Settleman, 2010).
Hence, understanding the vulnerabilities
of TICs could enable more effective
cancer therapies.
Within this context, Zhang et al., (2012)
describe the isolation of TICs from non-
small cell lung cancer (NSCLC) and char-
acterization of some of the TICs’ uni-
que phenotypic features in a recent Cell
article. Remarkably, NSCLC TICs have
robust increases in glycolysis as well as
in glycine/serine metabolism, most nota-
bly at the level of the glycine cleavage
system enzyme, leading to increased
pyrimidine synthesis and proliferation.
This study supports a large body of work
indicating that cancer cells differ from
non-transformed cells in their program-
ming for nutrient metabolism (Ferreira
et al., 2012).
In a very deft series of experiments,
Zhang et al., (2012) report that within the
otherwise heterogeneous NSCLCs, there
exists a subpopulation of CD166+ cells
that are extremely potent in their ability
to induce tumor formation in immuno-
compromised NOD/SCID Il2rg�/� mice
and form tumor spheres in vitro. As
such, they can be considered TICs. Yet
another remarkable feature of the TICs is
their metabolic profile. Concomitant with
an upregulation of glycolytic genes, there
is also a strong upregulation of genes
involved in serine, glycine, and one-
carbon metabolism. Intracellular metabo-
lite levels from TICs accord well with the
gene expression profiles, as there is
a relative increase in glycolytic inter-
mediates as well as intermediates associ-
ated with glycine/serine and nucleotide
metabolism. Among all of the gene
expression changes observed in TICs,
the most striking one is a powerful in-
crease in glycine decarboxylase (GLDC),
a member of the protein complex
that catabolizes glycine into carbon
dioxide, ammonia, and 5,10-methylene-
tetrahydrofolate.
Convincingly, Zhang et al., (2012)
showed that GLDC overexpression pro-
motes glycolysis, serine/glycine metabo-
lism, and the accumulation of pyrimidine
nucleotides. Consistent with the idea
that the deviant serine/glycine metabo-
lism of TICs facilitates their tumorigenic
capacity, CD166� lung tumor cells, which
are otherwise non-tumorigenic, were able
to establish tumors at low frequency
when made to overexpress GLDC. Fur-
thermore, GLDC overexpression alone
was able to transform NIH 3T3 cells
in vitro and drive tumor formation in vivo,
which required GLDC’s enzymatic activity
Cancer Cell 21,
to be intact. Knockdown of this enzyme,
on the other hand, was effective in di-
minishing many of these parameters,
including tumorigenicity, in cells that
express high levels of GLDC. Together,
these results suggest that GLDC could
be a new NSCLC oncogene—a finding
that will be strengthened if recurrent ge-
nomic alterations that increase GLDC
activity are found in primary tumors. The
potential clinical relevance of GLDC over-
expression in NSCLC was given further
salience by the revelation that high
expression of GLDC in primary NSCLC
tumors is significantly associated with a
higher risk of patient mortality.
Although originally identified in TICs
derived from primary lung tumors, Zhang
et al., (2012) also show that GLDC is
expressed at high levels in many other
tumor types and in about 25% of cancer
cell lines tested. Knockdown of GLDC in
these high expressing cell lines, such as
A549 lung adenocarcinoma cells and
CACO2 colon cancer cells, reduces their
proliferation and tumorigenic potential.
Importantly, to demonstrate that this is
a newly acquired vulnerability of these
cancer cell lines and not an activity that
is generally required for proliferation,
Zhang et al., (2012) showed that GLDC
knockdown did not affect the proliferation
of normal human lung fibroblasts. They
also hint on the possibility of exploiting
this new metabolic vulnerability for
therapeutic purposes by showing that
cells that overexpress this enzyme are
more sensitive to the antifolate drug
February 14, 2012 ª2012 Elsevier Inc. 143

Figure 1. A Summary of the Protein Constituents of the Glycine Cleavage Complex and theReactions that They CatalyzeThe oxidative decarboxylation and deamination of glycine begins with glycine decarboxylase (GLDC;P protein), which removes carbon dioxide from glycine and transfers amethylamine group to the dithiolanering of a lipoic acid molecule attached to H protein. The methylamine moiety is transferred to tetrahydro-folate (THF) by T protein, generating 5,10-methylene-tetrahydrofolate and reduced lipoate-H protein in theprocess. The reduced lipoate group of H protein is subsequently oxidized by L protein using NAD+. Thisreaction regenerates the dithiolane ring of H protein’s lipoate functional group, permitting it to participatein another catalytic cycle. Reducing equivalents in the form of NADH, one-carbon groups in the form of5,10-methylene-THF and ammonium are important products of this reaction system. Based upon thework of Zhang et al., (2012), it is the enhanced supply of 5,10-methylene-THF available for use in theone-carbon cycle as well as for the synthesis of pyrimidines whereby upregulation of GLDC promotestumor initiation.
Cancer Cell
Previews
methotrexane. It will be interesting to
investigate if GLDC expression is a
predictor of response to antifolate drugs
in some cancers.
The work presented by Zhang et al.,
(2012) is a technical tour-de-force for
its isolation of a rare subpopulation
of TICs from primary NSCLC and for
providing the scientific community with
an explanation for what is genetically
and metabolically unique about them.
Although it certainly adds to our under-
standing about the metabolic differences
between cancerous and non-cancerous
cells, it also raised several fascinating
questions.
The first—and most general—question
concerns the nature of the recurring asso-
ciation between serine/glycine metabo-
lism and tumorigenesis/cell proliferation.
Other groups have also reported that
many cancers have elevated levels of en-
zymes involved in the processing of
serine/glycine (Possemato et al., 2011;
Locasale et al., 2011; Vazquez et al.,
144 Cancer Cell 21, February 14, 2012 ª2012
2011; Vie et al., 2008), and overexpres-
sion of some of these enzymes is suffi-
cient to enhance the potential for cellular
transformation and/or increase the rate
of cellular proliferation (Locasale et al.,
2011; Vie et al., 2008). How does an
increase in this pathway facilitate prolif-
eration and tumorigenesis? Does it pro-
vide extra pyrimidines for DNA replication
and prevent uracil accumulation? Are
there epigenetic effects on proliferative
gene expression, perhaps due to changes
in one-carbon metabolism and cellular
methylation capacity? Or are there other
explanations? The metabolic fate of the
amino acids serine and glycine is com-
plexly intertwined with pathways associ-
ated with the TCA cycle, glycolysis,
protein synthesis, generation of interme-
diates for one-carbon metabolism, phos-
pholipid synthesis, nucleotide synthesis,
and maintenance of cellular osmolarity.
Carefully dissecting the contribution of
changes in the flux of these subsidiary
metabolic pathways as a consequence
Elsevier Inc.
of a change in the rate in which a cell
processes serine/glycine is an arduous
task and will require more than a simple
measurement of steady-state metabolite
levels—an often deceptive marker of
both the rate and directionality of flux
(Fell, 1992; Snell and Fell, 1990). This later
point is particularly important when
evaluating the serine/glycine pathway,
as many of the enzymes operate with
only a slight displacement from equilib-
rium and flux determining steps are not
intuitive.
The second question, as a corollary to
the first, is how upregulated flux through
the serine/glycine pathway is sustained
in cancerous cells given all of the feed-
back mechanisms that are present in
normal cells that prevent excess cycling
through this pathway. Zhang et al.,
(2012) provide a tantalizing hint that, at
least in the case of GLDC, oncogenes
may drive the chronically high expression
of serine/glycine metabolic enzymes, but
how this occurs is unknown.
Finally, in regard to the biology of
GLDC, it is curious that overexpression
of only one component of the glycine
cleavage complex is sufficient to mas-
sively perturb glycine dissimilation (Fig-
ure 1). The glycine cleavage complex is
a multi-enzyme complex composed of
four different subunits (P-[aka, GLDC]
and H-, T-, and L-subunits) that are pre-
sent in a ratio of 2P:27H:9T:1L and coop-
erate to channel substrates to reaction
completion. Given this information, why
are other subunits of the glycine cleavage
complex not elevated in TICs? Is there
a stoichiometric deficiency of GLDC in
non-TICs that normally limits flux through
the glycine cleavage complex? Is there
a rearrangement of the complex ratios or
modifications to the constituent subunits
to handle an increase in GLDC-mediated
product formation?
Overall, the paper presented by Zhang
et al., (2012) makes a number of important
contributions toward our understanding
of the genetic and metabolic hetero-
geneity that is found in the cells within
human tumors. It also suggests that inhi-
bition of GLDC can be used in conjunction
with existing antifolate chemotherapeutic
regiments for the treatment of certain
types of cancer. We shall watch with great
interest as the story behind serine/glycine
metabolism in cancer unfolds over the
coming years.

Cancer Cell
Previews
REFERENCES
Fell, D.A. (1992). Biochem. J. 286, 313–330.
Ferreira, L.M.R., Hebrant, A., and Dumont, J.E.(2012). Oncogene. Published online January 9,2012. 10.1038/onc.2011.576.
Locasale, J.W., Grassian, A.R., Melman, T.,Lyssiotis, C.A., Mattaini, K.R., Bass, A.J., Heffron,G., Metallo, C.M., Muranen, T., Sharfi, H., et al.(2011). Nat. Genet. 43, 869–874.
Nguyen, L.V., Vanner, R., Dirks, P., and Eaves, C.J.(2012). Nat. Rev. Cancer 12, 133–143.
Possemato, R., Marks, K.M., Shaul, Y.D., Pacold,M.E., Kim, D., Birsoy, K., Sethumadhavan, S.,Woo, H.K., Jang, H.G., Jha, A.K., et al. (2011).Nature 476, 346–350.
Singh, A., and Settleman, J. (2010). Oncogene 29,4741–4751.
Snell, K., and Fell, D.A. (1990). Adv. Enzyme Regul.30, 13–32.
Cancer Cell 21,
Vazquez, A., Markert, E.K., and Oltvai, Z.N. (2011).PLoS ONE 6, e25881.
Vie, N., Copois, V., Bascoul-Mollevi, C., Denis, V.,Bec, N., Robert, B., Fraslon, C., Conseiller, E.,Molina, F., Larroque, C., et al. (2008). Mol. Cancer7, 14.
Zhang, W.C., Shyh-Chang, N., Yang, H., Rai, A.,Umashankar, S., Ma, S., Soh, B.S., Sun, L.L.,Tai, B.C., Nga, M.E., et al. (2012). Cell 148,259–272.
PI3King on MYCN to Improve NeuroblastomaTherapeutics
Michael D. Hogarty1,* and John M. Maris1,*1Division of Oncology, Children’s Hospital of Philadelphia, Perelman School of Medicine University of Pennsylvania, Philadelphia,PA 19104, USA*Correspondence: [email protected] (M.D.H.), [email protected] (J.M.M.)DOI 10.1016/j.ccr.2012.01.018
MYCN is an oncogenic driver of childhood neuroblastoma, a frequently lethal pediatric tumor. In a recentpaper in Science Translational Medicine, Chanthery and colleagues demonstrate that PI3K inhibition leadsto the dual therapeutic benefits of enhanced MYCN degradation and loss of a paracrine angiogenic signalmediated by MYCN.
Despite decades of ever-improving
outcomes across diverse pediatric
cancers, neuroblastoma has remained a
frustrating clinical entity. Most children
are diagnosed with tumors that harbor
genetic and biological features highly
correlated with a poor treatment out-
come. Current therapy for such high-risk
patients includes dose-intensive chemo-
therapy, radiotherapy, and retinoids.
Though there have been recent impres-
sive translational successes for this
tumor, such as immunotherapy using
an antibody targeting cell-surface GD2
given with immunostimulatory cytokines
(Yu et al., 2010), 3 year relapse free
survival estimates for high-risk disease
remain under 50%.
Further compounding the frustration is
the fact that the genome of neuroblas-
toma is one of the most comprehensively
characterized among pediatric cancers,
but it has not yet led to more effective
treatment. The recent discovery that the
ALK receptor tyrosine kinase is constitu-
tively activated in �10% of neuroblas-
tomas (Mosse et al., 2008) provides one
such therapeutic opportunity, as ALK
inhibitors have been in development due
to the involvement of this kinase in a
subset of non-small-cell lung cancers
and anaplastic lymphomas. First genera-
tion ALK inhibitors such as crizotinib are
already in Phase 2 trials for children with
relapsed or refractory neuroblastoma
and may make their way soon into upfront
therapy for those patients with ALK-
mutated tumors.
Contrast that withMYCN, the only other
bona fide oncogene yet discovered in
neuroblastoma that was initially identified
almost 30 years ago (Brodeur et al., 1984).
Despite this lead-time and a great deal of
effort, no therapeutic has yet emerged to
be able to target this clear oncogenic
driver of the most aggressive subset
of neuroblastomas. MYCN, which is a
homolog of the MYC proto-oncogene, is
somatically amplified in the tumor cells
of �20% of neuroblastoma patients (and
in �40% of those with a high-risk pheno-
type). MYCN amplification is indepen-
dently correlated with advanced stage
disease and poor outcome and therefore
is used worldwide in risk classification
algorithms. Moreover, genetically engi-
neered mouse models with MYCN ex-
pression targeted to neural crest tissue
develop tumors that resemble human
neuroblastoma (Weiss et al., 1997). MYC
proteins, including MYCN, serve pleio-
tropic roles in malignancy, such as
altering metabolic programs, supporting
angiogenesis, promoting self-renewal
and ‘‘stemness,’’ and driving proliferation
while inhibiting differentiation.
ALK as a kinase is a pharmacologically
tractable target, and a wealth of experi-
ence suggests that inhibition of activated
kinases can lead to clinically impressive
tumor responses. MYCN, in contrast,
has long been seen as a problematic
therapeutic target, as inactivating a highly
abundant nuclear transcription factor that
operates through a network of protein-
protein interactions is pharmacologically
daunting. Still, tumors are remarkably
heterogeneous and cancer cells are
remarkably adaptive. Resistance to tar-
geted therapeutics can be efficiently
selected for, especially when cells have
February 14, 2012 ª2012 Elsevier Inc. 145

Figure 1. Neuroblast-Intrinsic and -Extrinsic Therapeutic Effects of the Dual PI3K/mTORInhibitor NVP-BEZ235MYCN (and MYC, when similarly dysregulated) induce vasculogenesis via secretion of VEGF and otherangiogenic factors. Tumor-associated angiogenesis is similarly supported by paracrine signaling viaVEGF downstream of MYCN. NVP-BEZ235 impacts tumorigenesis through inhibition of PI3K andmTOR kinases, through PI3K inhibition-mediated degradation of MYCN, through GSK3b-mediated phos-phodegradation pathways, and through direct anti-angiogenic effects on tumor-associated endothelialcells themselves. Not shown are effects attributable to mTOR inhibition, and pleiotropic effects realizedby antagonism of MYCN activity in neuroblasts.
Cancer Cell
Previews
functionally redundant or degenerate
pathways to compensate for the one
being targeted, as is often the case with
apical kinases such as ALK. MYC
proteins, however, are unique in that their
actions are largely non-redundant. In
many experimental systems, the only
gene products that can substitute for
MYC are other MYC homologs. Emerging
data using animal models also suggest
that toxicity associating with MYC inhibi-
tion might not be as problematic as
initially feared (Soucek et al., 2008). So
MYC remains a compelling therapeutic
target for neuroblastoma and many other
cancers (Delmore et al., 2011).
It is therefore of great interest that
a recent paper in Science Translational
Medicine demonstrates the benefits of
inhibiting PI3K and mTOR signaling with
the small molecule NVP-BEZ235 in
complementarymodels of neuroblastoma
(Chanthery et al., 2012). Neuroblastomas
are richly vascular tumors, particularly
those with MYCN amplification, and it
has long been inferred that MYCN may
modulate tumor angiogenesis via regula-
tion of VEGF expression, as has been
more formally demonstrated for MYC
(Baudino et al., 2002). Indeed, it has been
shown that PI3K/mTOR blockade leads
to destabilization of MYCN and commen-
146 Cancer Cell 21, February 14, 2012 ª2012
surate reduction in VEGF secretion, along
with inhibition of neuroblastoma progres-
sion in murine models (Chesler et al.,
2006). One critical component lacking
up until now had been the relative contri-
butions of inhibiting PI3K/mTOR in the
tumor cells themselves, as opposed to in
other cells within the tumor microenviron-
ment. That is, is the observed anti-tumor
activity mediated by tumor cell intrinsic
or extrinsic mechanisms, or both?
Chanthery et al., (2012) demonstrate
that NVP-BEZ235 inhibits neuroblast
proliferation in vitro and that this effect is
more pronounced in those cell lines with
MYCN amplification and overexpression.
They then corroborate an impact on
tumor progression using both a neuro-
blastoma xenograft model (in which
contributions of the immune compart-
ment are lacking) as well as a MYCN-
dependent transgenic model (recapitu-
lating a MYCN ‘‘amplified’’ tumor arising
at its autochthonous site). Though tumor
regressions were not described, there
was inhibition of tumor growth in both
models, attributed to both reductions
in tumor-associated vascular density
and neuroblast proliferation. MYCN was
markedly reduced in treated tumors, and
evidence for both PI3K and mTOR inhibi-
tion was demonstrated, supporting the
Elsevier Inc.
notion that PI3K inhibition led to derepres-
sion of GSK3b with resultant Thr58 phos-
phorylation and destabilization of MYCN.
The authors used a series of elegant
experiments to then decipher the contri-
butions of the tumor compartment by
introducing wild-type MYCN or a Thr58
mutant MYCN that is resistant to Thr58-
mediated destabilization into a neuroblas-
toma cell line with undetectable MYCN.
These models allow the investigators to
attribute tumor-cell autonomous effects
of NVP-BEZ235 to MYCN degradation
by correlating MYCN stability, VEGF
secretion, and recruitment of HUVECcells
in endothelial migration assays. The
impact of NVP-BEZ235 onMYCN stability
and proliferation was reduced in cells
expressing the Thr58 mutant MYCN.
Importantly, VEGF secretion and HUVEC
migration also was shown to be substan-
tially MYCN-dependent, supporting a
paracrine role downstream of MYCN.
Indeed, direct knock-down of MYCN or
indirect upregulation via knock-down of
HUWE1 (an E3-ligase that degrades
phosphorylated MYCN) led to commen-
surate changes in MYCN stability, VEGF
secretion, and HUVEC recruitment,
underscoring a prominent role for MYCN
in this paracrine activity. NVP-BEZ235
clearly had a direct impact on endothelial
cells themselves. However, this suggests
the anti-angiogenic effects seen in vivo
were both tumor cell intrinsic and extrinsic
(Figure 1).
It should be noted that the impact of
NVP-BEZ235 (via PI3K/mTOR inhibition)
was more modest in most of these
assays than was knock-down of MYCN,
suggesting that its impact on MYCN
was suboptimal. Still, an agent that
targets the predominant oncogenic driver
in this malignancy to impact diverse
MYCN-mediated functions and represses
tumor-associated angiogenesis directly
through effects on endothelial cells and
indirectly through paracrine mediated
effects of tumor cells is certainly worth
exploring clinically. Chanthery et al.,
(2012) demonstrate compelling indirect
evidence that VEGF is the intermediate
in this paracrine process but do not
directly demonstrate this either by VEGF
knock-down or by using available VEGF
antagonists in their assays. Might PI3K/
mTOR inhibition synergize with VEGF
antagonists to potentiate these anti-
angiogenic effects? Also, it is fair to

Cancer Cell
Previews
wonder whether these effects are truly
restricted to neuroblastomas with MYCN
amplification, as surmised, or might oper-
ate similarly through MYC when this
homolog is deregulated. In high-risk
neuroblastomas that lack MYCN amplifi-
cation, MYC is frequently deregulated
(Westermann et al., 2008), suggesting
some degree of MYC or MYCN augmen-
tation may be essential for the high-risk
phenotype. This was not directly tested
because the available transgenic model
for this tumor mimicsMYCN amplification
as an oncogenic driver and no MYCN
non-amplified tumor xenografts were
explored. Though elucidation of a novel
MYCN-directed therapeutic is significant
enough, the impact may be further broad-
ened to a greater proportion of patients
with high-risk neuroblastoma should
MYC serve a similar role, which is aworthy
pursuit, and may extend the relevance of
these findings to all human cancers that
usurp MYC signaling as an essential
component of sustaining the malignant
phenotype.
REFERENCES
Baudino, T.A., McKay, C., Pendeville-Samain, H.,Nilsson, J.A., Maclean, K.H., White, E.L., Davis,A.C., Ihle, J.N., and Cleveland, J.L. (2002). GenesDev. 16, 2530–2543.
Brodeur, G.M., Seeger, R.C., Schwab, M., Varmus,H.E., and Bishop, J.M. (1984). Science 224, 1121–1124.
Chanthery, Y.H., Gustafson, W.C., Itsara, M.,Persson, A., Hackett, C.S., Grimmer, M., Charron,E., Yakovenko, S., Kim, G., Matthay, K.K., andWeiss, W.A. (2012). Sci Transl Med. 4, 115ra113.
Chesler, L., Schlieve, C., Goldenberg, D.D.,Kenney, A., Kim, G., McMillan, A., Matthay, K.K.,Rowitch, D., and Weiss, W.A. (2006). Cancer Res.66, 8139–8146.
Cancer Cell 21,
Delmore, J.E., Issa, G.C., Lemieux, M.E., Rahl,P.B., Shi, J., Jacobs, H.M., Kastritis, E., Gilpatrick,T., Paranal, R.M., Qi, J., et al. (2011). Cell 146,904–917.
Mosse, Y.P., Laudenslager, M., Longo, L., Cole,K.A., Wood, A., Attiyeh, E.F., Laquaglia, M.J.,Sennett, R., Lynch, J.E., Perri, P., et al. (2008).Nature 455, 930–935.
Soucek, L., Whitfield, J., Martins, C.P., Finch, A.J.,Murphy, D.J., Sodir, N.M., Karnezis, A.N., Swigart,L.B., Nasi, S., and Evan, G.I. (2008). Nature 455,679–683.
Weiss, W.A., Aldape, K., Mohapatra, G., Feuer-stein, B.G., and Bishop, J.M. (1997). EMBO J. 16,2985–2995.
Westermann, F., Muth, D., Benner, A., Bauer, T.,Henrich, K.O., Oberthuer, A., Brors, B., Beissbarth,T., Vandesompele, J., Pattyn, F., et al. (2008).Genome Biol. 9, R150.
Yu, A.L., Gilman, A.L., Ozkaynak, M.F., London,W.B., Kreissman, S.G., Chen, H.X., Smith, M.,Anderson, B., Villablanca, J.G., Matthay, K.K.,et al; Children’s Oncology Group. (2010). N. Engl.J. Med. 363, 1324–1334.
The RAF Inhibitor Paradox Revisited
Adrienne D. Cox1,2,* and Channing J. Der1,*1Department of Radiation Oncology2Department of PharmacologyLineberger Comprehensive Cancer Center, University of North Carolina at Chapel Hill, Chapel Hill, NC 27599, USA*Correspondence: [email protected] (A.D.C.), [email protected] (C.J.D.)DOI 10.1016/j.ccr.2012.01.017
The success of theRAFprotein kinase inhibitor vemurafenib for the treatment ofBRAFmutantmetastaticmela-noma has produced another poster child for the promise of personalized medicine. However, the results ofa recent study also reveal unexpected pitfalls in the application of signal transduction-targeted therapies.
The era of personalized cancer medicine
is upon us. The cancer patient’s genome
can now be interrogated for specific
genetic alterations to guide the applica-
tion of therapies specifically targeted to
those alterations. A dramatic therapeutic
advance in this area is the BRAF-selective
inhibitor vemurafenib, which has pro-
vided a significant improvement in overall
survival compared to the previous stan-
dard of care for metastatic melanoma
(Chapman et al., 2011). However, recent
findings with vemurafenib and other pro-
tein kinase inhibitors demonstrate that
the new era of signal transduction-tar-
geted therapies is handicapped by some
of the same issues that have plagued
traditional cytotoxic drugs.
One key distinction between targeted
versus cytotoxic therapies is decreased
normal cell toxicity. Symptoms such as
the classic myelosuppression associated
with many cytotoxic antineoplastics are
not as limiting with targeted agents,
whose therapeutic effects are typically
achievable at doses lower than those
conferring myelosuppression or other
dose-limiting toxicities. However, rapidly
acquired cancer cell resistance shortens
the duration of treatment response. For
example, although the initial response
to vemurafenib is impressive, with a re-
sponse rate of �50% and significant sur-
vival benefit, tumor resistance usually
occurs within 2–18 months of initial treat-
ment. Multiple mechanisms of resistance
have been described, including muta-
tional activation of NRAS or receptor tyro-
sine kinase-mediated activation of RAS,
both leading to CRAF-dependent activa-
tion of MEK-ERK signaling (Figure 1)
(Johannessen et al., 2010; Nazarian et al.,
2010). Thus, as for cytotoxic drugs, com-
binations of targeted therapies will be
needed, both to enhance the initial re-
sponse and to reduce the subsequent
onset of drug resistance. Such com-
binations may also have advantages in
blocking the existing tumor without
inducing or allowing new ones to appear.
That chemotherapy can both cure and
cause cancer is not a new concept. Con-
ventional cytotoxic chemotherapy has
long been known to contribute to the
February 14, 2012 ª2012 Elsevier Inc. 147

Cancer Cell
Minireview
Conflicting Roles of Moleculesin Hepatocarcinogenesis:Paradigm or Paradox
Gen-Sheng Feng1,2,*1Department of Pathology, School of Medicine2Molecular Biology Section, Division of Biological SciencesUniversity of California at San Diego, La Jolla, CA 92093-0864, USA*Correspondence: [email protected] 10.1016/j.ccr.2012.01.001
In delineating the molecular pathogenesis of hepatocellular carcinoma (HCC), recent experiments in mousetumor models have revealed unexpected tumor-suppressing effects in genes previously identified as pro-oncogenic. This contradiction underscores the complexity of hepatocarcinogenesis and predicts uncertaintyin targeting these molecules for HCC therapy. Deciphering the underlying mechanisms for these paradoxicalfunctions will elucidate the complex molecular and cellular communications driving HCC development, andwill also suggest more thoughtful therapeutic strategies for this deadly disease.
Hepatocellular carcinoma (HCC) is the third leading cause of
cancer-related death worldwide. However, the molecular and
cellular mechanisms underlying HCC initiation and development
are poorly understood. In recent studies, a number of groups
have employed cell type-specific gene knockout (KO) mouse
models to dissect HCC pathogenesis. This approach has no
doubt provided mechanistic insights into hepatocarcinogenesis.
However, opposing roles in promoting and suppressing HCC
have been reported for the same molecules in different animal
models (Figure 1). These conflicting results do not necessarily
obscure the understanding of molecular pathogenesis in HCC.
Instead, further experiments carefully designed to decipher the
opposing roles will lead to better understanding of HCCdevelop-
ment.
Contradictory Results from Different Animal ModelsThe NF-kB pathway that promotes cell survival and proliferation
is constitutively activated in a variety of tumors. Consistently,
several groups have reported tumor-promoting effects of NF-
kB in mouse models (Haybaeck et al., 2009; Pikarsky et al.,
2004). Removal of Mdr-2 P-glycoprotein triggered spontaneous
development of cholestatic hepatitis and consequently HCC in
mice, and inactivation of the NF-kBpathway in hepatocytes sup-
pressed HCC progression initiated by Mdr-2 deletion (Pikarsky
et al., 2004). By controlling the timing of shutting down the NF-
kB pathway, the authors demonstrated that NF-kB was required
for the later stage of HCC progression, without significant impact
on transformation or the early stage of tumor development. In
contrast, Karin’s group reported that hepatocyte-specific abla-
tion of Ikkb (IkkbDhep), a kinase required for the activation of
NF-kB, resulted in dramatic increase in HCC development
induced by the chemical carcinogen diethylnitrosamine (DEN),
pointing to an antitumor effect of NF-kB in the liver (Maeda
et al., 2005). DEN, as a procarcinogen, can bemetabolically acti-
vated in hepatocytes and forms bulky DNA adducts that induce
genomic instability and gene mutations (Aleksic et al., 2011;
Verna et al., 1996). The carcinogenic effect of DEN can be
150 Cancer Cell 21, February 14, 2012 ª2012 Elsevier Inc.
enhanced by other tumor promoters, such as phenobarbital,
in adult mice. Consistent with the increased susceptibility of
IkkbDhep mice to DEN-induced tumorigenesis, hepatocyte-
specific deletion of NEMO/Ikkg, another component of the Ikk
complex, leads to spontaneous development of HCC, following
hepatic steatosis and chronic inflammation in mice (Luedde
et al., 2007).
Highlighting a similar paradox, several groups have demon-
strated either tumor-promoting or tumor-suppressing actions
of Jnk kinases in HCC. Hui et al. detected high levels of p-Jnk1
in human HCC lesions and found that the incidence of DEN/
phenobarbital-induced HCC was significantly reduced in
Jnk1�/� but not in Jnk2�/� mice (Hui et al., 2008). Consistently,
siRNA-mediated Jnk1 or Jnk1 together with Jnk2 knockdown
in Huh7 human HCC cells suppressed in vitro proliferation and
tumor formation as subcutaneous xenografts in nude mice,
with no effect observed for Jnk2 knockdown. In contrast, Davis
and colleagues presented data suggesting a tumor-suppressing
effect of Jnk1 and Jnk2 in hepatocytes (Das et al., 2011). The
authors generated mutant mice (HDJnk) with Jnk1 and Jnk2 defi-
ciency in hepatocytes by deleting Jnk1 specifically in hepato-
cytes in the Jnk2�/� background. Their results indicate that
combined deficiency of Jnk1 and Jnk2 leads to increased tumor
sizes in DEN-treated mice.
Stat3 clearly has a pro-oncogenic function, based on the
detection of activating mutations or enhanced p-Stat3 signals
in different types of cancer (Calvisi, 2011; Yu et al., 2009).
However, both pro- and anti-oncogenic activities of Stat3
in HCC development were observed in hepatocyte-specific
Stat3 knockouts, transgenic mice expressing dominant-active
or -negative mutants of Stat3, or tumor-bearing animals treated
with Stat3 inhibitors (Lin et al., 2009; Schneller et al., 2011; Wang
et al., 2011b). Interestingly, hepatocyte-specific deletion of
the tyrosine phosphatase Shp2 resulted in a marked increase
in DEN-induced HCC incidence, which was compromised
by the additional removal of Stat3 (Bard-Chapeau et al.,
2011). However, deleting Stat3 alone also led to enhanced
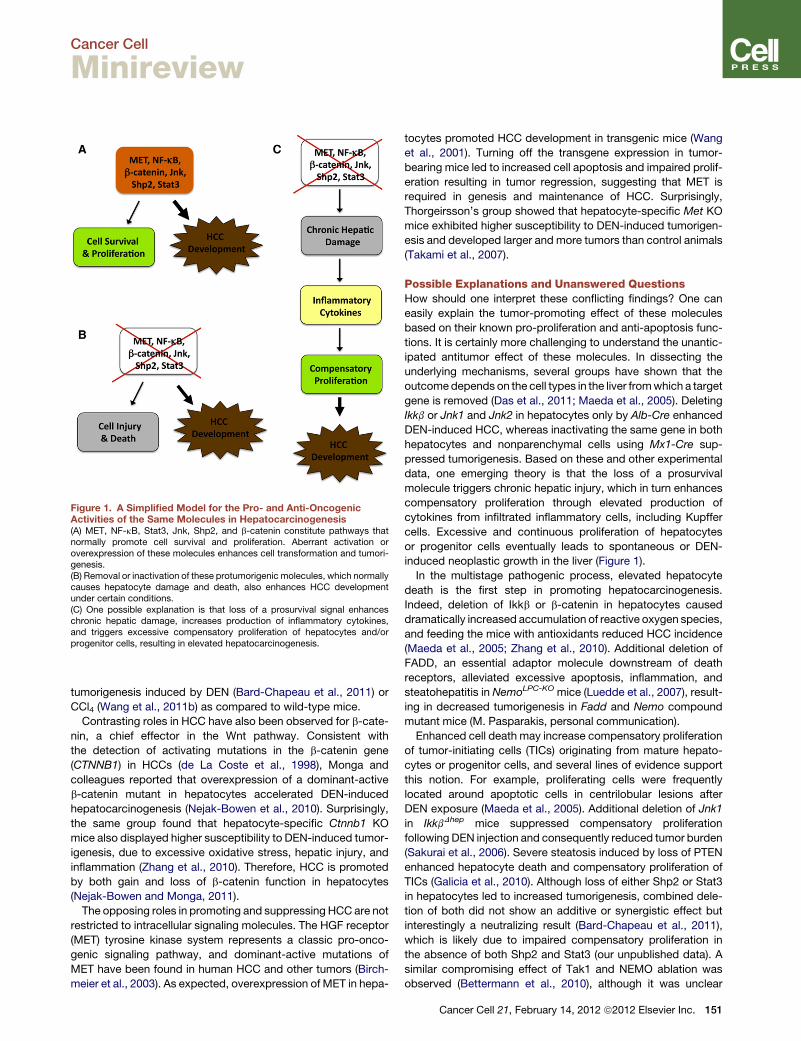
Figure 1. A Simplified Model for the Pro- and Anti-OncogenicActivities of the Same Molecules in Hepatocarcinogenesis(A) MET, NF-kB, Stat3, Jnk, Shp2, and b-catenin constitute pathways thatnormally promote cell survival and proliferation. Aberrant activation oroverexpression of these molecules enhances cell transformation and tumori-genesis.(B) Removal or inactivation of these protumorigenic molecules, which normallycauses hepatocyte damage and death, also enhances HCC developmentunder certain conditions.(C) One possible explanation is that loss of a prosurvival signal enhanceschronic hepatic damage, increases production of inflammatory cytokines,and triggers excessive compensatory proliferation of hepatocytes and/orprogenitor cells, resulting in elevated hepatocarcinogenesis.
Cancer Cell
Minireview
tumorigenesis induced by DEN (Bard-Chapeau et al., 2011) or
CCl4 (Wang et al., 2011b) as compared to wild-type mice.
Contrasting roles in HCC have also been observed for b-cate-
nin, a chief effector in the Wnt pathway. Consistent with
the detection of activating mutations in the b-catenin gene
(CTNNB1) in HCCs (de La Coste et al., 1998), Monga and
colleagues reported that overexpression of a dominant-active
b-catenin mutant in hepatocytes accelerated DEN-induced
hepatocarcinogenesis (Nejak-Bowen et al., 2010). Surprisingly,
the same group found that hepatocyte-specific Ctnnb1 KO
mice also displayed higher susceptibility to DEN-induced tumor-
igenesis, due to excessive oxidative stress, hepatic injury, and
inflammation (Zhang et al., 2010). Therefore, HCC is promoted
by both gain and loss of b-catenin function in hepatocytes
(Nejak-Bowen and Monga, 2011).
The opposing roles in promoting and suppressing HCC are not
restricted to intracellular signaling molecules. The HGF receptor
(MET) tyrosine kinase system represents a classic pro-onco-
genic signaling pathway, and dominant-active mutations of
MET have been found in human HCC and other tumors (Birch-
meier et al., 2003). As expected, overexpression of MET in hepa-
tocytes promoted HCC development in transgenic mice (Wang
et al., 2001). Turning off the transgene expression in tumor-
bearing mice led to increased cell apoptosis and impaired prolif-
eration resulting in tumor regression, suggesting that MET is
required in genesis and maintenance of HCC. Surprisingly,
Thorgeirsson’s group showed that hepatocyte-specific Met KO
mice exhibited higher susceptibility to DEN-induced tumorigen-
esis and developed larger and more tumors than control animals
(Takami et al., 2007).
Possible Explanations and Unanswered QuestionsHow should one interpret these conflicting findings? One can
easily explain the tumor-promoting effect of these molecules
based on their known pro-proliferation and anti-apoptosis func-
tions. It is certainly more challenging to understand the unantic-
ipated antitumor effect of these molecules. In dissecting the
underlying mechanisms, several groups have shown that the
outcomedepends on the cell types in the liver fromwhich a target
gene is removed (Das et al., 2011; Maeda et al., 2005). Deleting
Ikkb or Jnk1 and Jnk2 in hepatocytes only by Alb-Cre enhanced
DEN-induced HCC, whereas inactivating the same gene in both
hepatocytes and nonparenchymal cells using Mx1-Cre sup-
pressed tumorigenesis. Based on these and other experimental
data, one emerging theory is that the loss of a prosurvival
molecule triggers chronic hepatic injury, which in turn enhances
compensatory proliferation through elevated production of
cytokines from infiltrated inflammatory cells, including Kupffer
cells. Excessive and continuous proliferation of hepatocytes
or progenitor cells eventually leads to spontaneous or DEN-
induced neoplastic growth in the liver (Figure 1).
In the multistage pathogenic process, elevated hepatocyte
death is the first step in promoting hepatocarcinogenesis.
Indeed, deletion of Ikkb or b-catenin in hepatocytes caused
dramatically increased accumulation of reactive oxygen species,
and feeding the mice with antioxidants reduced HCC incidence
(Maeda et al., 2005; Zhang et al., 2010). Additional deletion of
FADD, an essential adaptor molecule downstream of death
receptors, alleviated excessive apoptosis, inflammation, and
steatohepatitis in NemoLPC-KO mice (Luedde et al., 2007), result-
ing in decreased tumorigenesis in Fadd and Nemo compound
mutant mice (M. Pasparakis, personal communication).
Enhanced cell death may increase compensatory proliferation
of tumor-initiating cells (TICs) originating from mature hepato-
cytes or progenitor cells, and several lines of evidence support
this notion. For example, proliferating cells were frequently
located around apoptotic cells in centrilobular lesions after
DEN exposure (Maeda et al., 2005). Additional deletion of Jnk1
in IkkbDhep mice suppressed compensatory proliferation
following DEN injection and consequently reduced tumor burden
(Sakurai et al., 2006). Severe steatosis induced by loss of PTEN
enhanced hepatocyte death and compensatory proliferation of
TICs (Galicia et al., 2010). Although loss of either Shp2 or Stat3
in hepatocytes led to increased tumorigenesis, combined dele-
tion of both did not show an additive or synergistic effect but
interestingly a neutralizing result (Bard-Chapeau et al., 2011),
which is likely due to impaired compensatory proliferation in
the absence of both Shp2 and Stat3 (our unpublished data). A
similar compromising effect of Tak1 and NEMO ablation was
observed (Bettermann et al., 2010), although it was unclear
Cancer Cell 21, February 14, 2012 ª2012 Elsevier Inc. 151

Cancer Cell
Minireview
whether removal of the two molecules suppressed hepatocyte
proliferation potential.
Pro-inflammatory cytokines play important roles in these HCC
animal models. Hepatic expression of TNFa, IL-6, and HGF was
increased in IkkbDhep mice (Maeda et al., 2005). Higher circu-
lating levels of IL-1a and IL-6 were detected in IkkbDhep and
p38aDhep mice following DEN injection, which were alleviated
by antioxidant treatment that prevented hepatocyte death
(Sakurai et al., 2008). Blocking IL-1a action by injection of IL-
1R antagonist or ablation of IL-1R suppressed DEN-induced
IL-6 production, compensatory proliferation, and tumorigenesis.
These results suggest that IL-1a released from dying hepato-
cytes stimulates production of IL-6, which in turn induces
surviving hepatocytes to proliferate (Sakurai et al., 2008).
A similar mechanism involving paracrine action of cytokines
was identified inmicewith Jnk or Stat3 deficiency in hepatocytes
only or in hepatocytes plus nonparenchymal cells (Das
et al., 2011; Horiguchi et al., 2008). In aggregate, these results
highlight the importance of hepatic cell communication in liver
tumorigenesis.
It remains to be elucidated at which stage(s) the paracrine
cytokines and the infiltrated inflammatory cells contribute to
hepatocarcinogenesis. The ability to isolate TICs at early stages
of HCC development following DEN exposure (He et al., 2010)
will help clarify this issue. Opposite effects on tumorigenesis
were observed when deleting the same gene using Alb-Cre
and Mx1-Cre lines, respectively (Das et al., 2011; Maeda et al.,
2005). It will be interesting to isolate and compare TICs from
the two mutant mouse lines. If mutant TICs of the two origins
display opposite growth properties in vitro and in allografts in
recipient animals, the result would suggest that the initial trans-
formation event is already influenced by the hepatic microenvi-
ronment. However, if the TICs of the two origins display similar
phenotypes, one may conclude that the inflammatory cytokines
or the hepatic microenvironment influences tumor progression
without effect on TIC genesis.
One issue that could affect the interpretation of data from
hepatocyte-specific KO mice is the timing and efficiency of
Cre expression. The nature of the few surviving hepatocytes
that become TICs and eventually develop into HCCs remains
to be determined. It is possible that a few hepatocytes have
escaped Cre-mediated DNA excision and thus gain survival
and proliferative advantages over neighboring cells with a pro-
survival gene ablated. Arguing against this theory are the data
that the targeted genes were efficiently deleted in tumors
(Bard-Chapeau et al., 2011; Das et al., 2011; Maeda et al.,
2005; Sakurai et al., 2008). However, the possibility that a target
gene was intact in TICs but was deleted later during cancer
progression, which no longer requires the gene product, has
not been excluded. Indeed, one report on HCC induced
by Ddb1 deletion suggests that HCC originates from hepato-
cytes that escaped Alb-Cre-mediated gene ablation (Yamaji
et al., 2010). In another study, Chen and colleagues found that
liver tumors developed from b-catenin-positive hepatic progen-
itor cells in Alb-Cre-mediated Ctnnb1 deletion (Wang et al.,
2011a). To unequivocally determine the gene deletion status
during HCC initiation and progression, it is important to use
inducible and tightly controlled Cre expression strategies that
are yet to be optimized.
152 Cancer Cell 21, February 14, 2012 ª2012 Elsevier Inc.
Thus far, most studies have largely focused on the final
outcome of HCC development after a long period of DEN treat-
ment. More rigorous analyses of the kinetics of hepatic injury and
disorders associated with early stages of tumorigenesis will
provide mechanistic insights into the pathogenic process. With
regard to the hepatic microenvironment in tumorigenesis, rela-
tive contributions of Kupffer cells versus other infiltrating cell
types will need to be clarified. Possible roles of oval cells and
hepatic stellate cells in HCC development need to be carefully
examined, which may help interpret the seemingly contradictory
findings.
There are many open questions for the antitumor effect of pro-
tumorigenic molecules. The cell death-compensatory prolifera-
tion-transformation-hepatocarcinogenesis scheme (Figure 1) is
likely an oversimplified model, and other mechanisms may also
be involved in promoting HCC development. Inactivation of
one protumorigenic pathway in hepatocytes may lead to aber-
rant activation of another. For example, overexpression of
PDGFRa and c-Myc was detected in b-catenin-deficient livers
(Zhang et al., 2010), and upregulated Stat3 activity was observed
in the liver of IkkbDhep or Shp2Dhep mice (Bard-Chapeau et al.,
2011; He et al., 2010). Rather than showing increased apoptosis,
Ikkb-deficient TICs were found to exhibit higher survival and
proliferative capacity in vitro, although the molecular basis is
not fully understood (He et al., 2010). Thus, excessive compen-
satory reaction to loss of a proliferative signal may also
contribute to the unexpected tumor-promoting effect observed
upon removal of a protumorigenic molecule, at least in some
cases.
Implications in Human HCC Pathogenesis and TherapyAs described above, either aberrant gain or loss of function of the
same molecule can lead to malignant growth, reinforcing the
concept that homeostasis is critical for preventing tumorigenesis
in the liver. A critical question is whether the results from these
animal experiments are relevant to human HCCs. Constitutive
activation of MET, b-catenin, NF-kB, and Stat3 has been
detected in human HCC samples or cell lines (Birchmeier et al.,
2003; Calvisi, 2011; He et al., 2010; Nejak-Bowen and Monga,
2011; Yu et al., 2009). In contrast, there has been almost no
definitive report of loss-of-function mutations in these genes in
humanHCCs, thus the paucity of evidence to support their tumor
suppressor role. Although deficient expression of Shp2 was
detected in primary human HCCs (Bard-Chapeau et al., 2011),
it was unclear whether Shp2 deficiency plays a causative role
in their pathogenesis. Genome-wide sequencing of human
HCC samples worldwide may identify inactivating mutations in
these proto-oncogenes, most likely at low frequencies.
Despite the rare detection of corresponding mutations in
humans, these mouse mutants recapitulate many aspects of
pathological features in human patients, including chronic hepa-
tocyte damage, elevated oxidative stress, inflammation, fibrosis,
steatohepatitis, and cholestasis. Therefore, these animal models
are useful for understanding the molecular and cellular mecha-
nisms of liver cancer in humans. In particular, the mouse models
provide access to early events in tumorigenesis, particularly the
dynamic interplay of TICs with the hepatic microenvironment.
Given the 100% penetrance in DEN-induced carcinogenesis
and the high degree of similarity in pathogenesis, mutant mice

Cancer Cell
Minireview
can serve as platforms in the search for biomarkers for early
diagnosis of HCC, the significance of which cannot be over-
stated given the current poor prognosis of patients with late
stages of HCC.
Personalized therapeutic strategies can be developed based
on dominantly activating mutations detected in tumors. A potent
MET inhibitor might be effective in treating a liver cancer patient
with an activating MET mutation (You et al., 2011). However, the
pro- and anti-oncogenic roles of signaling molecules and the cell
type-specific effects of gene deletion described above bring
uncertainty to using inhibitors of these molecules as anticancer
drugs, as reported for Stat3 inhibitors (Yue and Turkson, 2009).
One interesting idea is the development of anti-HCC therapeu-
tics by sorting beneficial from harmful functions of a signaling
molecule such as b-catenin (Nejak-Bowen and Monga, 2011).
Due to the compensatory upregulation of one pathway in reac-
tion to the loss of another, simultaneous blockade of several
pathways by a cocktail of inhibitors may be a more effective
approach. Additional removal of Stat3 reversed the tumor-
promoting effect of Shp2 deletion (Bard-Chapeau et al., 2011),
and inhibition of PDGFRa suppressed tumorigenesis induced
by ablation of b-catenin (Zhang et al., 2010).
The debate over the relevance of mouse data to human HCCs
will likely continue. However, in-depth molecular analyses in
animal models cannot be replaced by examination of human
HCC specimens. The opposing roles of signaling molecules
revealed by these mouse models indicate a need for reassess-
ment of current approaches in drug targeting and screening.
Finally, although the discussion in this article focuses on HCC,
contrasting roles of NF-kB have been observed in other types
of cancer, such as skin cancer (van Hogerlinden et al., 2002).
Therefore, it is crucial to elucidate factors that regulate various
functions of each of these oncogenic pathways.
ACKNOWLEDGMENTS
The author apologizes for not citing many other exciting papers in this shortarticle and thanks colleagues for critical reading of the manuscript. Work inthe author’s laboratory has been supported by NIH grant numbersR01DK075916 and HL096125.
REFERENCES
Aleksic, K., Lackner, C., Geigl, J.B., Schwarz, M., Auer, M., Ulz, P., Fischer, M.,Trajanoski, Z., Otte, M., and Speicher, M.R. (2011). Evolution of genomic insta-bility in diethylnitrosamine-induced hepatocarcinogenesis inmice. Hepatology53, 895–904.
Bard-Chapeau, E.A., Li, S., Ding, J., Zhang, S.S., Zhu, H.H., Princen, F., Fang,D.D., Han, T., Bailly-Maitre, B., Poli, V., et al. (2011). Ptpn11/Shp2 acts as atumor suppressor in hepatocellular carcinogenesis. Cancer Cell 19, 629–639.
Bettermann, K., Vucur, M., Haybaeck, J., Koppe, C., Janssen, J., Heymann, F.,Weber, A., Weiskirchen, R., Liedtke, C., Gassler, N., et al. (2010). TAK1suppresses a NEMO-dependent but NF-kB-independent pathway to livercancer. Cancer Cell 17, 481–496.
Birchmeier, C., Birchmeier, W., Gherardi, E., and Vande Woude, G.F. (2003).Met, metastasis, motility and more. Nat. Rev. Mol. Cell Biol. 4, 915–925.
Calvisi, D.F. (2011). Dr. Jekyll and Mr. Hyde: a paradoxical oncogenic andtumor suppressive role of signal transducer and activator of transcription 3in liver cancer. Hepatology 54, 9–12.
Das, M., Garlick, D.S., Greiner, D.L., and Davis, R.J. (2011). The role of JNKin the development of hepatocellular carcinoma. Genes Dev. 25, 634–645.
de La Coste, A., Romagnolo, B., Billuart, P., Renard, C.A., Buendia, M.A.,Soubrane, O., Fabre, M., Chelly, J., Beldjord, C., Kahn, A., and Perret, C.(1998). Somatic mutations of the b-catenin gene are frequent in mouse andhuman hepatocellular carcinomas. Proc. Natl. Acad. Sci. USA 95, 8847–8851.
Galicia, V.A., He, L., Dang, H., Kanel, G., Vendryes, C., French, B.A., Zeng, N.,Bayan, J.A., Ding, W., Wang, K.S., et al. (2010). Expansion of hepatic tumorprogenitor cells in Pten-null mice requires liver injury and is reversed by lossof AKT2. Gastroenterology 139, 2170–2182.
Haybaeck, J., Zeller, N., Wolf, M.J., Weber, A., Wagner, U., Kurrer, M.O.,Bremer, J., Iezzi, G., Graf, R., Clavien, P.A., et al. (2009). A lymphotoxin-drivenpathway to hepatocellular carcinoma. Cancer Cell 16, 295–308.
He, G., Yu, G.Y., Temkin, V., Ogata, H., Kuntzen, C., Sakurai, T., Sieghart, W.,Peck-Radosavljevic, M., Leffert, H.L., and Karin, M. (2010). Hepatocyte IKKb/NF-kB inhibits tumor promotion and progression by preventing oxidativestress-driven STAT3 activation. Cancer Cell 17, 286–297.
Horiguchi, N., Wang, L., Mukhopadhyay, P., Park, O., Jeong, W.I., Lafdil, F.,Osei-Hyiaman, D., Moh, A., Fu, X.Y., Pacher, P., et al. (2008). Cell type-depen-dent pro- and anti-inflammatory role of signal transducer and activator of tran-scription 3 in alcoholic liver injury. Gastroenterology 134, 1148–1158.
Hui, L., Zatloukal, K., Scheuch, H., Stepniak, E., and Wagner, E.F. (2008).Proliferation of human HCC cells and chemically induced mouse liver cancersrequires JNK1-dependent p21 downregulation. J. Clin. Invest. 118, 3943–3953.
Lin, L., Amin, R., Gallicano, G.I., Glasgow, E., Jogunoori, W., Jessup, J.M.,Zasloff, M., Marshall, J.L., Shetty, K., Johnson, L., et al. (2009). The STAT3inhibitor NSC 74859 is effective in hepatocellular cancers with disruptedTGF-b signaling. Oncogene 28, 961–972.
Luedde, T., Beraza, N., Kotsikoris, V., van Loo, G., Nenci, A., De Vos, R.,Roskams, T., Trautwein, C., and Pasparakis, M. (2007). Deletion of NEMO/IKKg in liver parenchymal cells causes steatohepatitis and hepatocellularcarcinoma. Cancer Cell 11, 119–132.
Maeda, S., Kamata, H., Luo, J.L., Leffert, H., and Karin, M. (2005). IKKbcouples hepatocyte death to cytokine-driven compensatory proliferationthat promotes chemical hepatocarcinogenesis. Cell 121, 977–990.
Nejak-Bowen, K.N., and Monga, S.P. (2011). b-catenin signaling, liver regen-eration and hepatocellular cancer: sorting the good from the bad. Semin.Cancer Biol. 21, 44–58.
Nejak-Bowen, K.N., Thompson, M.D., Singh, S., Bowen, W.C., Jr., Dar, M.J.,Khillan, J., Dai, C., and Monga, S.P. (2010). Accelerated liver regeneration andhepatocarcinogenesis in mice overexpressing serine-45 mutant b-catenin.Hepatology 51, 1603–1613.
Pikarsky, E., Porat, R.M., Stein, I., Abramovitch, R., Amit, S., Kasem, S.,Gutkovich-Pyest, E., Urieli-Shoval, S., Galun, E., and Ben-Neriah, Y. (2004).NF-kB functions as a tumour promoter in inflammation-associated cancer.Nature 431, 461–466.
Sakurai, T., Maeda, S., Chang, L., and Karin, M. (2006). Loss of hepatic NF-kBactivity enhances chemical hepatocarcinogenesis through sustained c-JunN-terminal kinase 1 activation. Proc. Natl. Acad. Sci. USA 103, 10544–10551.
Sakurai, T., He, G., Matsuzawa, A., Yu, G.Y., Maeda, S., Hardiman, G., andKarin, M. (2008). Hepatocyte necrosis induced by oxidative stress and IL-1arelease mediate carcinogen-induced compensatory proliferation and livertumorigenesis. Cancer Cell 14, 156–165.
Schneller, D., Machat, G., Sousek, A., Proell, V., van Zijl, F., Zulehner, G.,Huber, H., Mair, M., Muellner, M.K., Nijman, S.M., et al. (2011). p19(ARF)/p14(ARF) controls oncogenic functions of signal transducer and activator oftranscription 3 in hepatocellular carcinoma. Hepatology 54, 164–172.
Takami, T., Kaposi-Novak, P., Uchida, K., Gomez-Quiroz, L.E., Conner, E.A.,Factor, V.M., and Thorgeirsson, S.S. (2007). Loss of hepatocyte growthfactor/c-Met signaling pathway accelerates early stages of N-nitrosodiethyl-amine–induced hepatocarcinogenesis. Cancer Res. 67, 9844–9851.
van Hogerlinden, M., Auer, G., and Toftgard, R. (2002). Inhibition of Rel/Nuclear Factor-kB signaling in skin results in defective DNA damage-inducedcell cycle arrest and Ha-ras- and p53-independent tumor development. Onco-gene 21, 4969–4977.
Cancer Cell 21, February 14, 2012 ª2012 Elsevier Inc. 153

Cancer Cell
Minireview
Verna, L., Whysner, J., and Williams, G.M. (1996). N-nitrosodiethylaminemechanistic data and risk assessment: bioactivation, DNA-adduct formation,mutagenicity, and tumor initiation. Pharmacol. Ther. 71, 57–81.
Wang, E.Y., Yeh, S.H., Tsai, T.F., Huang, H.P., Jeng, Y.M., Lin, W.H.,Chen, W.C., Yeh, K.H., Chen, P.J., and Chen, D.S. (2011a). Depletion ofb-catenin from mature hepatocytes of mice promotes expansion of hepaticprogenitor cells and tumor development. Proc. Natl. Acad. Sci. USA 108,18384–18389.
Wang, H., Lafdil, F.,Wang, L., Park, O., Yin, S., Niu, J., Miller, A.M., Sun, Z., andGao, B. (2011b). Hepatoprotective versus oncogenic functions of STAT3 inliver tumorigenesis. Am. J. Pathol. 179, 714–724.
Wang, R., Ferrell, L.D., Faouzi, S., Maher, J.J., and Bishop, J.M. (2001). Acti-vation of the Met receptor by cell attachment induces and sustains hepatocel-lular carcinomas in transgenic mice. J. Cell Biol. 153, 1023–1034.
154 Cancer Cell 21, February 14, 2012 ª2012 Elsevier Inc.
Yamaji, S., Zhang, M., Zhang, J., Endo, Y., Bibikova, E., Goff, S.P., and Cang,Y. (2010). Hepatocyte-specific deletion of DDB1 induces liver regenerationand tumorigenesis. Proc. Natl. Acad. Sci. USA 107, 22237–22242.
You, H., Ding, W., Dang, H., Jiang, Y., and Rountree, C.B. (2011). c-Met repre-sents a potential therapeutic target for personalized treatment in hepatocel-lular carcinoma. Hepatology 54, 879–889.
Yu, H., Pardoll, D., and Jove, R. (2009). STATs in cancer inflammation andimmunity: a leading role for STAT3. Nat. Rev. Cancer 9, 798–809.
Yue, P., and Turkson, J. (2009). Targeting STAT3 in cancer: how successful arewe? Expert Opin. Investig. Drugs 18, 45–56.
Zhang, X.F., Tan, X., Zeng, G., Misse, A., Singh, S., Kim, Y., Klaunig, J.E., andMonga, S.P. (2010). Conditional b-catenin loss in mice promotes chemicalhepatocarcinogenesis: role of oxidative stress and platelet-derived growthfactor receptor a/phosphoinositide 3-kinase signaling. Hepatology 52,954–965.

Cancer Cell
Article
An Animal Model of MYC-Driven MedulloblastomaYanxin Pei,1 Colin E. Moore,1 Jun Wang,1 Alok K. Tewari,3 Alexey Eroshkin,2 Yoon-Jae Cho,4 Hendrik Witt,5
Andrey Korshunov,5 Tracy-Ann Read,6 Julia L. Sun,7,8 Earlene M. Schmitt,9 C. Ryan Miller,11 Anne F. Buckley,8
Roger E. McLendon,8 Thomas F. Westbrook,9,10 Paul A. Northcott,12 Michael D. Taylor,12 Stefan M. Pfister,5
Phillip G. Febbo,3 and Robert J. Wechsler-Reya1,7,*1Tumor Development Program2Bioinformatics Shared Resource
NCI-Designated Cancer Center, Sanford-Burnham Medical Research Institute, La Jolla, CA 92037, USA3Department of Medicine and Helen Diller Family Comprehensive Cancer Center, University of California, San Francisco, San Francisco,CA 94158-9001, USA4Stanford University School of Medicine, Stanford, CA 94305, USA5German Cancer Research Center and University of Heidelberg, Heidelberg D-69120, Germany6Department of Neurosurgery, Emory University School of Medicine, Atlanta, GA 30322, USA7Department of Pharmacology and Cancer Biology8Department of Pathology
Duke University Medical Center, Durham, NC 27710, USA9Verna and Marrs McLean Department of Biochemistry and Molecular Biology, and Department of Molecular and Human Genetics Baylor
College of Medicine, Houston, TX 77030, USA10Department of Pediatrics and Dan L. Duncan Cancer Center11Department of Pathology and Laboratory MedicineUniversity of North Carolina, Chapel Hill, NC 27514, USA12Hospital for Sick Children and University of Toronto, Toronto, M5G 1X8 Ontario, Canada
*Correspondence: [email protected]
DOI 10.1016/j.ccr.2011.12.021
SUMMARY
Medulloblastoma (MB) is the most commonmalignant brain tumor in children. Patients whose tumors exhibitoverexpression or amplification of theMYC oncogene (c-MYC) usually have an extremely poor prognosis, butthere are no animal models of this subtype of the disease. Here, we show that cerebellar stem cells express-ing Myc and mutant Trp53 (p53) generate aggressive tumors following orthotopic transplantation. Thesetumors consist of large, pleiomorphic cells and resemble human MYC-driven MB at a molecular level.Notably, antagonists of PI3K/mTOR signaling, but not Hedgehog signaling, inhibit growth of tumor cells.These findings suggest that cerebellar stem cells can give rise to MYC-driven MB and identify a novel modelthat can be used to test therapies for this devastating disease.
INTRODUCTION
Medulloblastoma (MB) is a highly malignant tumor of the cere-
bellum that occurs most frequently in children between 5 and
10 years of age (Polkinghorn and Tarbell, 2007). Current treat-
ment for MB includes resection of the tumor followed by radia-
tion and high-dose chemotherapy. Although this has resulted
in significant increases in survival, approximately one-third of
Significance
Animal models are valuable for studying the origins and molectest new therapeutic strategies. Existing mouse models of MBSonic hedgehog pathway mutations. In contrast, no modelsdescribe a mouse model of this tumor based on transplantatnegative p53. These tumors resemble human MYC-driven MBby antagonists of the PI3K/mTOR pathway. This model reprepeutic responsiveness of MYC-driven MB.
C
MBpatients still die from their disease. Moreover, survivors often
suffer severe side effects, including dramatic losses in cognitive
function, endocrine disorders, and increased susceptibility to
secondary tumors (Palmer et al., 2007; Stavrou et al., 2001).
Thus, more effective and less toxic therapies for MB are desper-
ately needed.
Traditionally, MB has been classified based on histological
characteristics. In this context, tumors with large-cell-anaplastic
ular mechanisms of cancer and can be used to develop andhave been extremely useful for studying MB associated withhave been developed to study MYC-driven MB. Here weion of cerebellar stem cells expressing Myc and dominant-at a histological and molecular level and can be inhibited
sents an important tool for studying the biology and thera-
ancer Cell 21, 155–167, February 14, 2012 ª2012 Elsevier Inc. 155
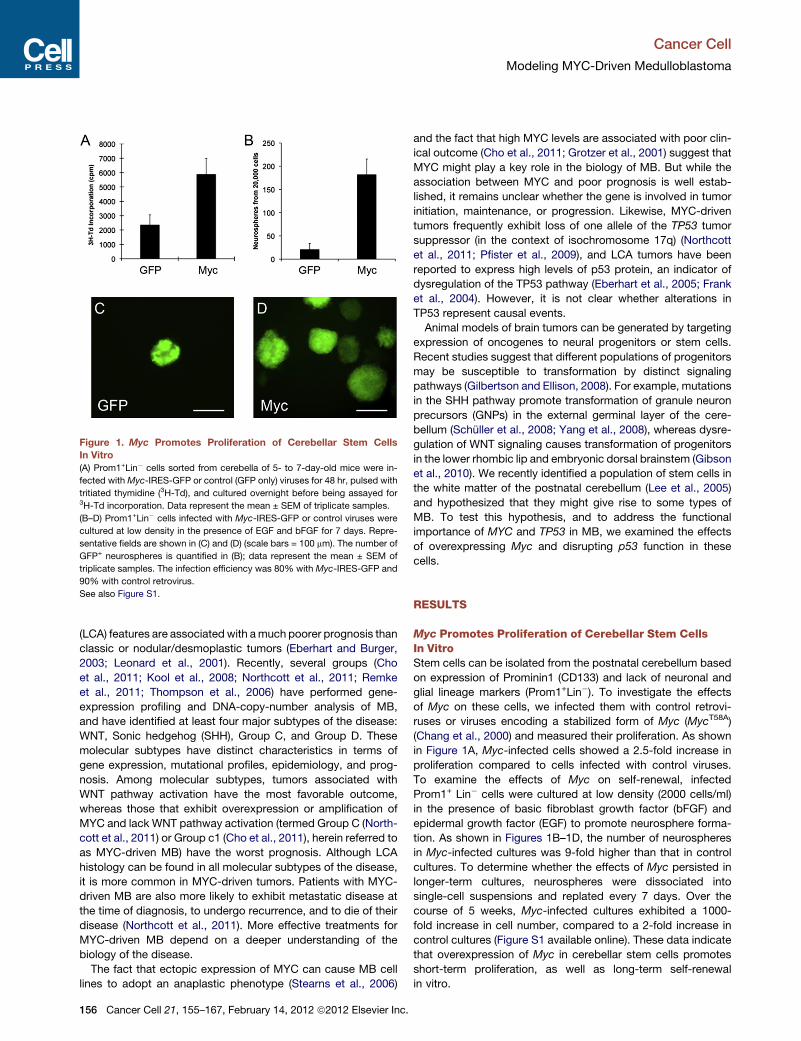
Figure 1. Myc Promotes Proliferation of Cerebellar Stem Cells
In Vitro
(A) Prom1+Lin� cells sorted from cerebella of 5- to 7-day-old mice were in-
fected withMyc-IRES-GFP or control (GFP only) viruses for 48 hr, pulsed with
tritiated thymidine (3H-Td), and cultured overnight before being assayed for3H-Td incorporation. Data represent the mean ± SEM of triplicate samples.
(B–D) Prom1+Lin� cells infected with Myc-IRES-GFP or control viruses were
cultured at low density in the presence of EGF and bFGF for 7 days. Repre-
sentative fields are shown in (C) and (D) (scale bars = 100 mm). The number of
GFP+ neurospheres is quantified in (B); data represent the mean ± SEM of
triplicate samples. The infection efficiency was 80% with Myc-IRES-GFP and
90% with control retrovirus.
See also Figure S1.
Cancer Cell
Modeling MYC-Driven Medulloblastoma
(LCA) features are associated with amuch poorer prognosis than
classic or nodular/desmoplastic tumors (Eberhart and Burger,
2003; Leonard et al., 2001). Recently, several groups (Cho
et al., 2011; Kool et al., 2008; Northcott et al., 2011; Remke
et al., 2011; Thompson et al., 2006) have performed gene-
expression profiling and DNA-copy-number analysis of MB,
and have identified at least four major subtypes of the disease:
WNT, Sonic hedgehog (SHH), Group C, and Group D. These
molecular subtypes have distinct characteristics in terms of
gene expression, mutational profiles, epidemiology, and prog-
nosis. Among molecular subtypes, tumors associated with
WNT pathway activation have the most favorable outcome,
whereas those that exhibit overexpression or amplification of
MYC and lack WNT pathway activation (termed Group C (North-
cott et al., 2011) or Group c1 (Cho et al., 2011), herein referred to
as MYC-driven MB) have the worst prognosis. Although LCA
histology can be found in all molecular subtypes of the disease,
it is more common in MYC-driven tumors. Patients with MYC-
driven MB are also more likely to exhibit metastatic disease at
the time of diagnosis, to undergo recurrence, and to die of their
disease (Northcott et al., 2011). More effective treatments for
MYC-driven MB depend on a deeper understanding of the
biology of the disease.
The fact that ectopic expression of MYC can cause MB cell
lines to adopt an anaplastic phenotype (Stearns et al., 2006)
156 Cancer Cell 21, 155–167, February 14, 2012 ª2012 Elsevier Inc.
and the fact that high MYC levels are associated with poor clin-
ical outcome (Cho et al., 2011; Grotzer et al., 2001) suggest that
MYC might play a key role in the biology of MB. But while the
association between MYC and poor prognosis is well estab-
lished, it remains unclear whether the gene is involved in tumor
initiation, maintenance, or progression. Likewise, MYC-driven
tumors frequently exhibit loss of one allele of the TP53 tumor
suppressor (in the context of isochromosome 17q) (Northcott
et al., 2011; Pfister et al., 2009), and LCA tumors have been
reported to express high levels of p53 protein, an indicator of
dysregulation of the TP53 pathway (Eberhart et al., 2005; Frank
et al., 2004). However, it is not clear whether alterations in
TP53 represent causal events.
Animal models of brain tumors can be generated by targeting
expression of oncogenes to neural progenitors or stem cells.
Recent studies suggest that different populations of progenitors
may be susceptible to transformation by distinct signaling
pathways (Gilbertson and Ellison, 2008). For example, mutations
in the SHH pathway promote transformation of granule neuron
precursors (GNPs) in the external germinal layer of the cere-
bellum (Schuller et al., 2008; Yang et al., 2008), whereas dysre-
gulation of WNT signaling causes transformation of progenitors
in the lower rhombic lip and embryonic dorsal brainstem (Gibson
et al., 2010). We recently identified a population of stem cells in
the white matter of the postnatal cerebellum (Lee et al., 2005)
and hypothesized that they might give rise to some types of
MB. To test this hypothesis, and to address the functional
importance of MYC and TP53 in MB, we examined the effects
of overexpressing Myc and disrupting p53 function in these
cells.
RESULTS
Myc Promotes Proliferation of Cerebellar Stem CellsIn VitroStem cells can be isolated from the postnatal cerebellum based
on expression of Prominin1 (CD133) and lack of neuronal and
glial lineage markers (Prom1+Lin�). To investigate the effects
of Myc on these cells, we infected them with control retrovi-
ruses or viruses encoding a stabilized form of Myc (MycT58A)
(Chang et al., 2000) and measured their proliferation. As shown
in Figure 1A, Myc-infected cells showed a 2.5-fold increase in
proliferation compared to cells infected with control viruses.
To examine the effects of Myc on self-renewal, infected
Prom1+ Lin� cells were cultured at low density (2000 cells/ml)
in the presence of basic fibroblast growth factor (bFGF) and
epidermal growth factor (EGF) to promote neurosphere forma-
tion. As shown in Figures 1B–1D, the number of neurospheres
in Myc-infected cultures was 9-fold higher than that in control
cultures. To determine whether the effects of Myc persisted in
longer-term cultures, neurospheres were dissociated into
single-cell suspensions and replated every 7 days. Over the
course of 5 weeks, Myc-infected cultures exhibited a 1000-
fold increase in cell number, compared to a 2-fold increase in
control cultures (Figure S1 available online). These data indicate
that overexpression of Myc in cerebellar stem cells promotes
short-term proliferation, as well as long-term self-renewal
in vitro.

Figure 2. Myc-Infected Stem Cells Give Rise to Transient Hyper-plastic Lesions following Transplantation
(A–F) Prom1+Lin� cells were infected withMyc-IRES-GFP or control retrovirus
for 20 hr and then transplanted into the cerebella of NSG mice. Hosts were
sacrificed after 2.5 weeks. Frozen sections from mice that received GFP-in-
fected (A and B) or Myc-infected (C–F) cells were stained with anti-Ki67 anti-
bodies (A–D) or H&E (E and F). Note the large mass of proliferating (Ki67+) cells
seen in animals that received Myc-infected cells (C and D). The box in (E)
corresponds to the high-power field shown in (F). Scale bars = 50 mm (A–D and
F) and 100 mm (E).
(G and H) Prom1+ cells were infected with Myc-IRES-GFP or control-GFP
viruses for 20 hr and then transplanted into the cerebella of NSG hosts. Mice
were sacrificed after 2 weeks. Frozen sections frommice that received control
(G) or Myc-infected cells (H) were stained with antibodies specific for cleaved
caspase-3 (CC3) to detect apoptotic cells. Scale bars = 50 mm.
See also Figure S2.
Cancer Cell
Modeling MYC-Driven Medulloblastoma
Myc-Expressing Stem Cells Form TransientHyperplastic Lesions In VivoIn light of the above results, we investigated whether Myc-ex-
pressing cells could give rise to tumors in vivo. We stereotaxi-
cally implanted control (GFP virus-infected) or Myc-infected
stem cells into the cerebella of immunocompromised (NOD-
SCID-IL2RGammanull, or NSG) mice and examined cerebella of
recipients 2–3 weeks later. As shown in Figures 2A and 2B, in
animals that had received control cells, few infected cells
(marked by GFP) could be detected, and only a small proportion
C
of these were proliferating (based on Ki67 staining). In contrast,
in animals transplanted withMyc-expressing cells, large masses
of infected cells could be detected, and the majority of these
were proliferating (Figures 2C–2F). These results suggest that
Myc-infected cells can undergo persistent proliferation in vivo.
To determinewhetherMyc-infected cells can continue to grow
and give rise to tumors, we sacrificed animals (n = 5) four weeks
after transplantation. Surprisingly, at this stage, few transplanted
cells could be detected in the cerebella of mice that had received
either control or Myc-infected cells. Consistent with this, we fol-
lowed a cohort of mice (n = 6) transplanted with Myc-infected
cells for 6months, and found that none of themdeveloped symp-
toms during this period (data not shown). This suggested that
Myc can drive proliferation of stem cells, but is not sufficient to
promote tumor growth.
The fact thatMyc-infected cells formed large masses 2 weeks
after transplantation but were undetectable 4 weeks after trans-
plantation raised the question of what happened to these cells.
Since Myc can induce apoptosis as well as proliferation (Pelen-
garis et al., 2000), we examined cerebella from recipients of
control and Myc-infected cells for evidence of apoptosis by
staining with anti-cleaved caspase 3 (CC3). Few control virus-in-
fected cells were labeled with anti-CC3 (although some staining
was seen around the transplant site), whereasMyc-infected cells
exhibited a significant amount of CC3 staining (Figures 2G and
2H), suggesting that they were undergoing apoptosis in situ.
These data suggest that Myc promotes proliferation as well as
apoptosis of cerebellar stem cells.
Mutant p53 Synergizes with Myc to Promote TumorFormationMYC-induced apoptosis is frequently dependent on TP53 (Her-
meking and Eick, 1994). To test whether inactivation of p53 could
inhibit Myc-induced cell death in cerebellar stem cells, we
measured apoptosis in cells infected with control (GFP), Myc,
dominant-negative p53 (DNp53) (Bowman et al., 1996), or
Myc + DNp53 viruses. As shown in Figures S2A–S2D, cells in-
fected with Myc viruses alone exhibited a marked increase in
apoptosis compared to cells infected with control viruses
(Figures S2A and S2B), but DNp53 completely abolished the
proapoptotic effects of Myc (Figures S2C and S2D). These
results suggest that Myc-mediated apoptosis of stem cells can
be blocked by inhibition of p53 function.
Theabovefindings raised thepossibility that cellsoverexpress-
ing Myc and DNp53might be able to give rise to tumors. To test
this, we coinfected stem cells with viruses encoding these genes
and implanted them into the cerebella of NSG mice. Animals
transplanted with cells coexpressing the two genes developed
highly aggressive tumors and had to be sacrificed at 6–12 weeks
(Figures 3A and 3B). These experiments were performed using
the T58A mutant of Myc. Notably, stem cells infected with WT
Myc +DNp53 also gave rise to tumors, albeit with reduced pene-
trance (33%) and longer latency (15–20 weeks). These studies
suggest that mutant p53 can cooperate with Myc to promote
transformation of cerebellar stem cells.
We characterized tumors arising from stem cells infected with
Myc and DNp53 (MP tumors), using tumors from Ptch1 mutant
mice (a model for SHH-associated MB) for comparison (Figures
3C–3H). Whereas Ptch1+/� tumor cells were not much bigger
ancer Cell 21, 155–167, February 14, 2012 ª2012 Elsevier Inc. 157
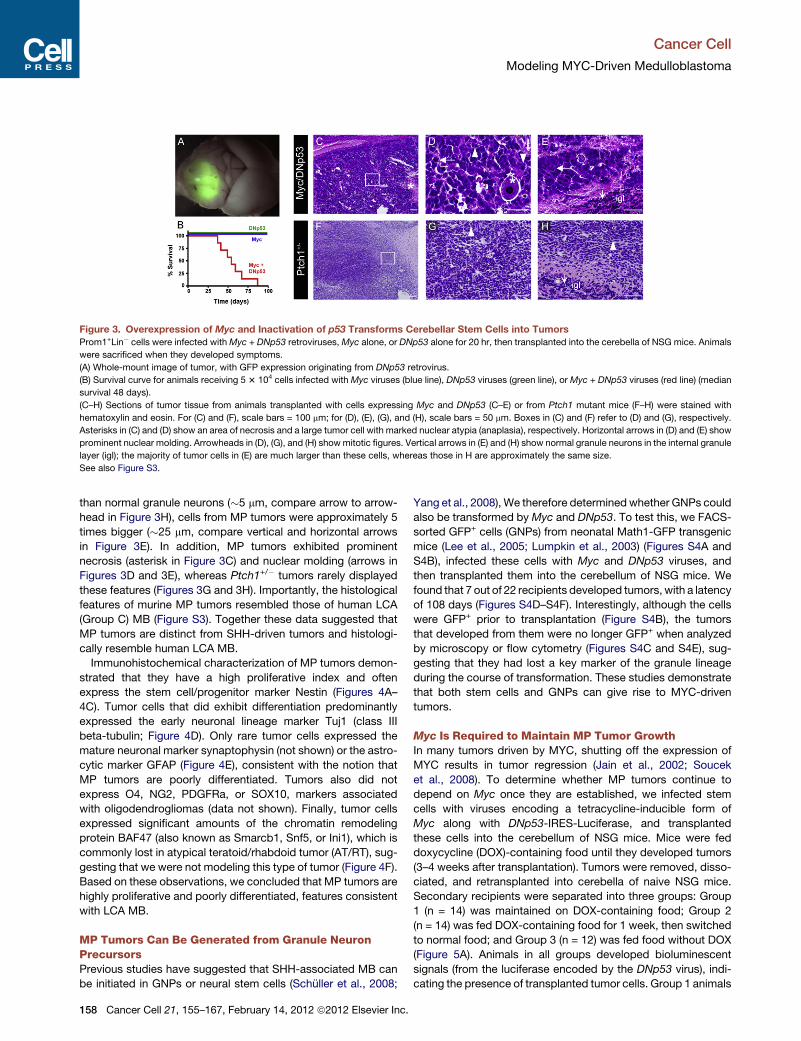
Figure 3. Overexpression of Myc and Inactivation of p53 Transforms Cerebellar Stem Cells into Tumors
Prom1+Lin� cells were infected withMyc + DNp53 retroviruses,Myc alone, or DNp53 alone for 20 hr, then transplanted into the cerebella of NSG mice. Animals
were sacrificed when they developed symptoms.
(A) Whole-mount image of tumor, with GFP expression originating from DNp53 retrovirus.
(B) Survival curve for animals receiving 5 3 104 cells infected with Myc viruses (blue line), DNp53 viruses (green line), or Myc + DNp53 viruses (red line) (median
survival 48 days).
(C–H) Sections of tumor tissue from animals transplanted with cells expressing Myc and DNp53 (C–E) or from Ptch1 mutant mice (F–H) were stained with
hematoxylin and eosin. For (C) and (F), scale bars = 100 mm; for (D), (E), (G), and (H), scale bars = 50 mm. Boxes in (C) and (F) refer to (D) and (G), respectively.
Asterisks in (C) and (D) show an area of necrosis and a large tumor cell with marked nuclear atypia (anaplasia), respectively. Horizontal arrows in (D) and (E) show
prominent nuclear molding. Arrowheads in (D), (G), and (H) showmitotic figures. Vertical arrows in (E) and (H) show normal granule neurons in the internal granule
layer (igl); the majority of tumor cells in (E) are much larger than these cells, whereas those in H are approximately the same size.
See also Figure S3.
Cancer Cell
Modeling MYC-Driven Medulloblastoma
than normal granule neurons (�5 mm, compare arrow to arrow-
head in Figure 3H), cells from MP tumors were approximately 5
times bigger (�25 mm, compare vertical and horizontal arrows
in Figure 3E). In addition, MP tumors exhibited prominent
necrosis (asterisk in Figure 3C) and nuclear molding (arrows in
Figures 3D and 3E), whereas Ptch1+/� tumors rarely displayed
these features (Figures 3G and 3H). Importantly, the histological
features of murine MP tumors resembled those of human LCA
(Group C) MB (Figure S3). Together these data suggested that
MP tumors are distinct from SHH-driven tumors and histologi-
cally resemble human LCA MB.
Immunohistochemical characterization of MP tumors demon-
strated that they have a high proliferative index and often
express the stem cell/progenitor marker Nestin (Figures 4A–
4C). Tumor cells that did exhibit differentiation predominantly
expressed the early neuronal lineage marker Tuj1 (class III
beta-tubulin; Figure 4D). Only rare tumor cells expressed the
mature neuronal marker synaptophysin (not shown) or the astro-
cytic marker GFAP (Figure 4E), consistent with the notion that
MP tumors are poorly differentiated. Tumors also did not
express O4, NG2, PDGFRa, or SOX10, markers associated
with oligodendrogliomas (data not shown). Finally, tumor cells
expressed significant amounts of the chromatin remodeling
protein BAF47 (also known as Smarcb1, Snf5, or Ini1), which is
commonly lost in atypical teratoid/rhabdoid tumor (AT/RT), sug-
gesting that we were not modeling this type of tumor (Figure 4F).
Based on these observations, we concluded that MP tumors are
highly proliferative and poorly differentiated, features consistent
with LCA MB.
MP Tumors Can Be Generated from Granule NeuronPrecursorsPrevious studies have suggested that SHH-associated MB can
be initiated in GNPs or neural stem cells (Schuller et al., 2008;
158 Cancer Cell 21, 155–167, February 14, 2012 ª2012 Elsevier Inc.
Yang et al., 2008), We therefore determinedwhether GNPs could
also be transformed by Myc and DNp53. To test this, we FACS-
sorted GFP+ cells (GNPs) from neonatal Math1-GFP transgenic
mice (Lee et al., 2005; Lumpkin et al., 2003) (Figures S4A and
S4B), infected these cells with Myc and DNp53 viruses, and
then transplanted them into the cerebellum of NSG mice. We
found that 7 out of 22 recipients developed tumors, with a latency
of 108 days (Figures S4D–S4F). Interestingly, although the cells
were GFP+ prior to transplantation (Figure S4B), the tumors
that developed from them were no longer GFP+ when analyzed
by microscopy or flow cytometry (Figures S4C and S4E), sug-
gesting that they had lost a key marker of the granule lineage
during the course of transformation. These studies demonstrate
that both stem cells and GNPs can give rise to MYC-driven
tumors.
Myc Is Required to Maintain MP Tumor GrowthIn many tumors driven by MYC, shutting off the expression of
MYC results in tumor regression (Jain et al., 2002; Soucek
et al., 2008). To determine whether MP tumors continue to
depend on Myc once they are established, we infected stem
cells with viruses encoding a tetracycline-inducible form of
Myc along with DNp53-IRES-Luciferase, and transplanted
these cells into the cerebellum of NSG mice. Mice were fed
doxycycline (DOX)-containing food until they developed tumors
(3–4 weeks after transplantation). Tumors were removed, disso-
ciated, and retransplanted into cerebella of naive NSG mice.
Secondary recipients were separated into three groups: Group
1 (n = 14) was maintained on DOX-containing food; Group 2
(n = 14) was fed DOX-containing food for 1 week, then switched
to normal food; and Group 3 (n = 12) was fed food without DOX
(Figure 5A). Animals in all groups developed bioluminescent
signals (from the luciferase encoded by the DNp53 virus), indi-
cating the presence of transplanted tumor cells. Group 1 animals

Figure 4. MP Tumors Exhibit Characteristics of Human MB
Cryosections fromMP tumors were stained with H&E (A) or with antibodies specific for Ki67 (B), Nestin (C), Tuj1 (D), GFAP (E), or BAF47/Ini1 (F). Images in (A)–(E)
represent adjacent sections. Scale bars = 50 mm.
See also Figure S4.
Cancer Cell
Modeling MYC-Driven Medulloblastoma
showed a rapid and dramatic increase in bioluminescence (Fig-
ure 5B, top graph), and by 3-4 weeks after transplantation, all
mice had developed symptoms and had to be sacrificed (Fig-
ure 5F). Analysis of brains from these mice revealed large tumors
in every animal (Figure 5C). In contrast, bioluminescence in
Group 2 and Group 3 mice decayed in the absence of DOX (Fig-
ure 5B, bottom two graphs). Moreover, no tumors could be de-
tected in these animals 3 weeks after transplantation (Figures
5D and 5E), and animals remained asymptomatic at 6 weeks
(Figure 5F). Together these data suggest that Myc is not only
necessary for tumor initiation but is also required to maintain
growth of MP tumors.
MP Tumors Resemble Human MYC-Driven MBOur histological analysis indicated that MP tumors resemble
human LCA MB. Since LCA histology is more common in
MYC-driven tumors (Cho et al., 2011; Northcott et al., 2011),
this supported the notion that MP tumors might represent
a model for human MYC-driven MB. To test whether MP tumors
resembled human MYC-driven MB at a molecular level, we per-
formed gene expression analysis of MP tumors and compared
the resulting gene expression profiles with profiles of the four
subtypes of human MB (WNT, SHH, Group C, and Group D)
defined by Northcott et al. (2011). In this classification scheme,
Group C tumors, which are associated with the poorest prog-
nosis, frequently exhibit amplification or overexpression of
MYC (Northcott et al., 2011). Using genes differentially ex-
pressed in each subgroup and previously published methods
(Bild et al., 2006), we identified four sets of genes (‘‘subgroup
signatures’’) whose expression accurately predicted the
subgroup of the humanMB samples (see Human Tumor Analysis
in the Supplemental Information).
Human MB subgroup signatures were then applied to gene
expression data from murine MP and Ptch1 mutant tumors,
with each tumor receiving a subgroup signature score represent-
ing its similarity to each subgroup of human MB. As shown in
Figure 6A and Table S1, murine Ptch1 tumors most closely
C
resembled human SHH-associated tumors, with one exception,
which possessed a profile consistent with both the WNT and
SHH groups. In contrast, MP tumors were most similar to Group
C/D tumors, with the exception of a tumor that resembled both
the WNT and Group C/D signatures. To validate these findings,
we compared data from murine tumors to expression profiles
from a distinct set of human MB samples (Cho et al., 2011).
Utilizing a subclass mapping algorithm (Hoshida et al., 2007),
we generated a similarity metric between MP tumors and the
MB subgroups defined in Cho et al. (2011). As shown in Fig-
ure S5, this analysis revealed a high degree of similarity between
MP tumors and the ‘c1’ subtype of human MB, which is charac-
terized by copy number gains of c-MYC and gene expression
signatures indicative of robust MYC transcriptional activity
(Cho et al., 2011).
Finally, we stained an independent set ofMPandPtch1 tumors
with antibodies that have been found to mark each of the four
human MB subgroups (Northcott et al., 2011). Murine Ptch1
mutant tumors expressed high levels of the SHH-subgroup
marker SFRP1 (Figure 6B) and lacked expression of the WNT-
subgroup marker nuclear CTNNB1 (not shown), the Group C
marker NPR3 (Figure 6C), and the Group D marker KCNA1 (Fig-
ure 6D). In contrast, MP tumors exhibited high levels of NPR3
(Figure 6F) and lacked expression of the other markers (Figures
6E and 6G and data not shown). Together, these data suggested
that MP tumors resemble human Group C (MYC-driven) MB.
Gene Expression Profile of MP TumorsWe compared the gene-expression profiles of MP tumors to
those of freshly isolated cerebellar stem cells and tumors from
Ptch1 mutant mice. Using principal component analysis, an
unsupervised approach designed to group samples based on
their similarity in gene expression, we determined that MP
tumors generated by infection of Prom1+Lin� stem cells and
those generated by infection of Prom1+ cells were indistinguish-
able based upon global RNA expression (Figure 7A). Both of
these tumor types were distinct from normal (uninfected)
ancer Cell 21, 155–167, February 14, 2012 ª2012 Elsevier Inc. 159

Figure 5. Myc Is Required for Continued Growth of MP Tumors
(A) Strategy for generating Tet-regulatable MP tumors.
(B–F) Bioluminescent imaging of animals at 1, 2, and 3 weeks after tumor cell transplantation. (B) Representative images of four animals from each group at each
time point (X’s denote animals that died before they could be imaged). Graphs at right show the mean percent increase in bioluminescence for all animals in the
group (with the 1-week signal for each animal set at 100%). In the top graph, the 1- and 2-week time points represent the average signal intensity for all 14 animals;
the 3-week time point (marked by an asterisk) represents the average for the three animals that remained alive at the time of imaging. (C–E) H&E-stained cerebellar
sections from representative animals in Groups 1 (C), 2 (D), and 3 (E) 3 weeks after transplantation. Arrows in (D) and (E) point to the injection site. Scale bars =
250 mm. (F) Survival curve (Groups 1 and 2, n = 14; Group 3, n = 12).
Cancer Cell
Modeling MYC-Driven Medulloblastoma
cerebellar stem cells and from Ptch1 mutant tumors. Hierar-
chical clustering (Figure 7B) confirmed the similarity between
MP tumors generated from Prom1+Lin� and Prom1+ cells, as
well as the differences between these tumors, Ptch1 tumors,
and normal stem cells. Focusing on changes in gene expression
of 3-fold and higher (p-value with FDR correction < 0.0001), we
identified 1228 genes (1465 probe sets) that were differentially
expressed between MP tumors and Ptch1 tumors (Com-
parison A, Table S2), and 812 genes (955 probe sets) differen-
tially expressed between MP tumors and normal stem cells
(Comparison B, Table S3).
To learn about the functional significance of these genes, we
analyzed them using gene set enrichment analysis (GSEA) (Sub-
160 Cancer Cell 21, 155–167, February 14, 2012 ª2012 Elsevier Inc.
ramanian et al., 2005) and NextBio software (Kupershmidt et al.,
2010) (see Figure 7 and Table S4 and Table S5). Several impor-
tant correlations emerged from this analysis. First, we noted that
genes expressed at high levels in MP tumors were similar to
those found to be targets of MYC in other studies (Figure 7C,
Table S4 and Table S5). Another set of differentially expressed
genes, which exhibited decreased expression in MP tumors,
were targets of forkhead transcription factors (e.g., Foxo1) (Fig-
ure 7D). This is notable, because FOXO proteins often inhibit
expression of MYC targets, induce expression of MYC antago-
nists, and suppress MYC-induced transformation (Bouchard
et al., 2004, 2007; Delpuech et al., 2007).We also noted amarked
similarity between genes expressed in MP tumors and those

Figure 6. MP Tumors Resemble Human MYC-Driven MB
(A) Gene expression profiles of Myc/DNp53 tumors from Prom1+/Lin� cells (MP-pl2-6) or from Prom1+ cells (MP-p3-7) and Ptch1 mutant (Ptc1-4) tumors were
compared to signatures generated from human MB subtypes WNT (blue), SHH (red), and Group C/D (green). Each murine tumor was assigned a score denoting
its similarity to each subtype of human tumor (for details, see Supplemental Experimental Procedures and Table S1).
(B–G) Ptch1 and MP tumors were stained with antibodies specific for secreted frizzled-related protein 1 (SFRP1, a marker for SHH tumors), natriuretic peptide
receptor C (NPR3, a marker for Group C tumors), or potassium voltage-gated channel, shaker-related subfamily, member 1 (KCNA1, a marker for Group D
tumors). Scale bars = 100 mm.
See also Figure S5 and Table S1.
Cancer Cell
Modeling MYC-Driven Medulloblastoma
enriched in embryonic stem (ES) cells and induced pluripotent
stem (iPS) cells, including those induced by Oct4 and Klf4 (i.e.,
in the absence of exogenous Myc) (Figure 7F). These genes
were enriched in MP tumors compared to Ptch1 tumors, consis-
tent with the fact that the former are derived from stem cells and
the latter originate from lineage-restricted neuronal progenitors.
However, they were also enriched in MP tumors compared to
cerebellar stem cells, suggesting that MP tumors have adopted
a more primitive differentiation state than the cells from which
they were derived. In support of this notion, MP tumors showed
decreased expression of genes associatedwith neuronal lineage
commitment and differentiation (Figure 7E). Finally, our analysis
revealed significant enrichment of a PI3K signaling gene set, as
well as a set of genes downregulated by rapamycin in another
cancer cell line (Table S4 and Table S5). Notably, analysis of
human MYC-driven (Group c1) tumors using Connectivity Map
(CMAP), an algorithm that screens a given gene expression
signature against a compendium of drug-induced gene expres-
sion signatures (Lamb et al., 2006), suggested that genes regu-
lated by PI3K and mTOR inhibitors are also enriched in these
tumors (Table S6). These observations, and the fact that MP
tumors have decreased expression of Foxo targets, which are
negatively regulated by the PI3K pathway, suggested that this
pathway might play an important role in tumor growth.
MP Tumors Are Sensitive to Inhibitors of PI3 Kinaseand mTORTo determine whether MP tumors were dependent on PI3K/
mTOR signaling, we first tested the effects of PI3K/mTOR inhib-
itors on tumor cell growth in vitro (Figure 8A). MP tumors showed
complete growth inhibition in the presence of 1–5 mM BEZ-235
(an antagonist of both PI3K and mTOR) and 5 mM BKM-120
(an antagonist of PI3K), and partial inhibition in the presence of
lower concentrations of these compounds. The mTOR antago-
C
nist RAD-001 also inhibited growth, albeit incompletely, at
concentrations of 0.2–5 mM. Consistent with their continued
dependency on Myc, tumor cells were dramatically inhibited by
10058-F4, a small molecule that interferes with Myc-Max dimer-
ization (Huang et al., 2006). In contrast, we found that MP tumor
cells showed no growth inhibition in response to the SHH antag-
onist cyclopamine.
To determine whether BEZ-235 and BKM-120 could also
affect long-term tumor cell growth, we cultured MP tumor cells
for 3, 7, or 14 days in the presence of these inhibitors, and
counted cell number at each time point. We found that all three
doses of BEZ-235 inhibited cell growth, whereas only the highest
concentration of BKM-120 (5 mM) was able to cause growth
inhibition (Figure 7B). Similar results were observed when we
used neurosphere assays to measure tumor cell clonogenicity
(Figure S6).
To confirm that these compounds were acting on the PI3K/
mTOR pathway, we performed western blotting to analyze
phosphorylation of critical proteins in the pathway. As shown
in Figure 8C, MP tumor cells showed substantial amounts of
phospho-AKT and phospho-S6 in the absence of inhibitors
(DMSO lanes). Treatment with BEZ-235 or BKM-120 inhibited
phosphorylation of both AKT and S6. In contrast, RAD-001 in-
hibited S6 phosphorylation but did not affect phospho-AKT.
The fact that BEZ-235 and BKM-120 weremore potent inhibitors
of tumor cell proliferation than RAD-001 (Figures 8A and 8B) sug-
gested that blocking activity of PI3K, or both PI3K and mTOR,
might be required for effective tumor inhibition.
To determine whether inhibition of PI3K/mTOR signaling could
also inhibit growth of MP tumors in vivo, we isolated MP tumor
cells and transplanted them into naive NSG mice. After 7 days,
we began treating animals with BKM-120 once daily until clinical
signs of tumor formation were observed. Animals treated with
BKM-120 survived significantly longer than controls (median
ancer Cell 21, 155–167, February 14, 2012 ª2012 Elsevier Inc. 161

Figure 7. MP Tumors Are Molecularly Distinct from Stem Cells and from Ptch1 Tumors
(A) Principal component analysis (PCA). Three PCA coordinates describe 55.2% of the total data variation (PC1, 27.2%; PC2, 19.8%; and PC3, 8.23%). Green,
MP tumors derived from Prom1+Lin� cells; purple, MP tumors derived from Prom1+ cells; blue, Ptch1 tumors; red, normal stem cells (NSCs).
(B) Unsupervised hierarchical clustering analysis. Each column represents a distinct sample and each row represents an individual gene. The normalized (log2)
and standardized (each sample to mean signal = 0 and standard deviation = 1) level of gene expression is denoted by color (green, low; dark, intermediate; red,
high), as indicated in the gradient at the bottom.
(C–F) Genes differentially expressed between MP tumors and Ptch1 tumors (Comp A) were subjected to NextBio analysis, to identify biogroups and studies
(biosets) that contain similar genes. Representative biogroups (C–E) and studies (F) are shown. Venn diagrams show the number of common and unique genes in
both sets. Bars at right show the significance of overlap between gene subsets (the scale of the bar is measured in –log(p-value), so the taller the bar, the higher
the significance of the gene overlap). Whereas each biogroup is represented by a single list of genes, signature genes from studies have two lists, one for
upregulated and one for downregulated genes. Thus, biogroup comparisons consist of just two graphs, whereas comparisons of studies consist of four graphs.
See also Tables S2–S6.
Cancer Cell
Modeling MYC-Driven Medulloblastoma
survival = 35 versus 25 days) (Figure 8D). These results suggest
that inhibitors of PI3K/mTOR signaling might be useful for treat-
ment of MYC-driven MB.
DISCUSSION
MYC-drivenMB is a highly malignant pediatric brain tumor that is
often resistant to conventional radiation and chemotherapy.
More effective approaches to treat this disease are critical, and
162 Cancer Cell 21, 155–167, February 14, 2012 ª2012 Elsevier Inc.
these can be facilitated by the development of robust animal
models. The fact that a subset of human MBs exhibit amplifica-
tion or overexpression of MYC prompted us to develop a mouse
model that can be used to investigate the biology of, and test
therapies for, MYC-driven MB.
Cooperation between Myc and Mutant p53Our observation thatMyc induces proliferation of cerebellar stem
cells is consistent with previous reports showing mitogenic
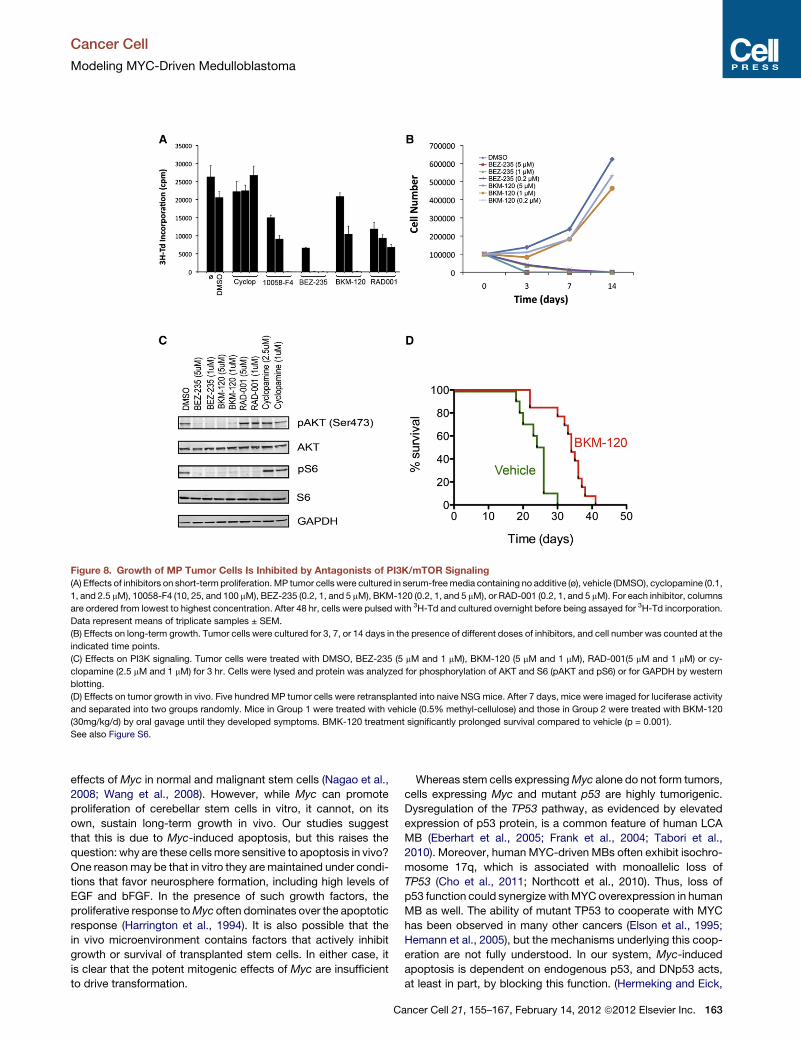
Figure 8. Growth of MP Tumor Cells Is Inhibited by Antagonists of PI3K/mTOR Signaling
(A) Effects of inhibitors on short-termproliferation. MP tumor cells were cultured in serum-freemedia containing no additive (ø), vehicle (DMSO), cyclopamine (0.1,
1, and 2.5 mM), 10058-F4 (10, 25, and 100 mM), BEZ-235 (0.2, 1, and 5 mM), BKM-120 (0.2, 1, and 5 mM), or RAD-001 (0.2, 1, and 5 mM). For each inhibitor, columns
are ordered from lowest to highest concentration. After 48 hr, cells were pulsed with 3H-Td and cultured overnight before being assayed for 3H-Td incorporation.
Data represent means of triplicate samples ± SEM.
(B) Effects on long-term growth. Tumor cells were cultured for 3, 7, or 14 days in the presence of different doses of inhibitors, and cell number was counted at the
indicated time points.
(C) Effects on PI3K signaling. Tumor cells were treated with DMSO, BEZ-235 (5 mM and 1 mM), BKM-120 (5 mM and 1 mM), RAD-001(5 mM and 1 mM) or cy-
clopamine (2.5 mM and 1 mM) for 3 hr. Cells were lysed and protein was analyzed for phosphorylation of AKT and S6 (pAKT and pS6) or for GAPDH by western
blotting.
(D) Effects on tumor growth in vivo. Five hundred MP tumor cells were retransplanted into naive NSG mice. After 7 days, mice were imaged for luciferase activity
and separated into two groups randomly. Mice in Group 1 were treated with vehicle (0.5% methyl-cellulose) and those in Group 2 were treated with BKM-120
(30mg/kg/d) by oral gavage until they developed symptoms. BMK-120 treatment significantly prolonged survival compared to vehicle (p = 0.001).
See also Figure S6.
Cancer Cell
Modeling MYC-Driven Medulloblastoma
effects of Myc in normal and malignant stem cells (Nagao et al.,
2008; Wang et al., 2008). However, while Myc can promote
proliferation of cerebellar stem cells in vitro, it cannot, on its
own, sustain long-term growth in vivo. Our studies suggest
that this is due to Myc-induced apoptosis, but this raises the
question: why are these cellsmore sensitive to apoptosis in vivo?
One reasonmay be that in vitro they aremaintained under condi-
tions that favor neurosphere formation, including high levels of
EGF and bFGF. In the presence of such growth factors, the
proliferative response toMyc often dominates over the apoptotic
response (Harrington et al., 1994). It is also possible that the
in vivo microenvironment contains factors that actively inhibit
growth or survival of transplanted stem cells. In either case, it
is clear that the potent mitogenic effects of Myc are insufficient
to drive transformation.
C
Whereas stem cells expressingMyc alone do not form tumors,
cells expressing Myc and mutant p53 are highly tumorigenic.
Dysregulation of the TP53 pathway, as evidenced by elevated
expression of p53 protein, is a common feature of human LCA
MB (Eberhart et al., 2005; Frank et al., 2004; Tabori et al.,
2010). Moreover, human MYC-driven MBs often exhibit isochro-
mosome 17q, which is associated with monoallelic loss of
TP53 (Cho et al., 2011; Northcott et al., 2010). Thus, loss of
p53 function could synergize withMYCoverexpression in human
MB as well. The ability of mutant TP53 to cooperate with MYC
has been observed in many other cancers (Elson et al., 1995;
Hemann et al., 2005), but the mechanisms underlying this coop-
eration are not fully understood. In our system, Myc-induced
apoptosis is dependent on endogenous p53, and DNp53 acts,
at least in part, by blocking this function. (Hermeking and Eick,
ancer Cell 21, 155–167, February 14, 2012 ª2012 Elsevier Inc. 163

Cancer Cell
Modeling MYC-Driven Medulloblastoma
1994). However, loss of p53 function has also been reported to
increase neural stem cell self-renewal and to promote pluripo-
tency (Kawamura et al., 2009; Meletis et al., 2006; Zheng et al.,
2008), both of which could certainly contribute to transformation.
Moreover, loss of p53 function promotes genomic instability (Ha-
nel and Moll, 2012), which could result in additional mutations
that promote tumor formation. Which of these functions of p53
are most critical in our tumors is the subject of ongoing studies.
Our observation that stem cells can be transformed by the
combination of Myc and DNp53, but not by either gene alone,
suggests that these genes are both required for tumor initiation.
But whether initiating oncogenes continue to be required once
tumors are formed is unclear. Previous studies have demon-
strated that in many types of cancer, tumors become addicted
to expression of the oncogene and undergo regression when
expression is shut off (Jain et al., 2002; Soucek et al., 2008).
However, there have been reports of tumors that continue to
grow even whenMyc is silenced (Boxer et al., 2004). Our results
suggest that continued expression ofMyc is required for mainte-
nance of MP tumor growth. If similar findings hold true for human
MYC-drivenMB, it would suggest that targetingMYC itself might
be an effective approach to therapy.
MP Tumors as a Model for Human MBThe tumors that are induced by Myc and DNp53 resemble
human LCA andMYC-drivenMB. Interestingly, two other groups
have recently described animal models of LCA MB. Deletion of
Rb and p53 in neural progenitors results in tumors that exhibit
amplification of MycN and resemble LCA MB (Shakhova et al.,
2006). Likewise, mice in which MycN is overexpressed in Glt1+
progenitors develop either classic or LCA MB (Swartling et al.,
2010). While each of these tumors exhibits large cell-anaplastic
histology, it is important to note that they may not all represent
the same subtype of MB. We have previously reported that
LCA histology can occur in all molecular subgroups of MB,
including WNT, SHH, Group C and Group D tumors (Northcott
et al., 2010). However, MBs that overexpress MYCN are largely
distinct from those that overexpress MYC. Thus, the models
described by these groups may correspond to human MYCN-
associated MB, whereas MP tumors may represent human
MYC-driven (Group C) MB. Interestingly, tumors from a recently
developed MBmodel in which Rb and p53were deleted in post-
natal cerebellar stem cells did not overexpress MycN and, like
our tumors, expressed high levels of NSC markers (Sutter
et al., 2010). It will be interesting to compare these models at
a molecular level to determine the similarities and differences
between them.
Cellular Origins of Myc-Associated TumorsPrevious studies have shown that activation of the SHH pathway
in GNPs results in MB with 100% penetrance (Schuller et al.,
2008; Yang et al., 2008). Moreover, activation of the SHH
pathway in stem cells within the cerebellar ventricular zone
(VZ) results in expansion of the VZ, but cells do not become
transformed until they commit to the granule lineage (Schuller
et al., 2008; Yang et al., 2008). These studies suggest that
lineage restriction is a critical determinant of susceptibility to
transformation by SHH signaling. The current studies suggest
that Myc + DNp53 can also cause transformation of both stem
164 Cancer Cell 21, 155–167, February 14, 2012 ª2012 Elsevier Inc.
cells and GNPs. However, once transformed, the stem cells do
not appear to undergo lineage commitment; indeed, their gene
expression profile suggests that Myc/DNp53-transformed cells
are even more immature or undifferentiated than normal neural
stem cells. Moreover, when GNPs are infected with Myc and
DNp53 viruses, they lose expression of GNP lineage markers
during the course of transformation. These results demonstrate
that stem cells and GNPs can both serve as cells of origin
for MYC-driven MB, and suggest that lineage commitment is
not required for (and in fact, may be incompatible with)
transformation.
Molecular Phenotype of MP TumorsIn addition to highlighting the similarities between MP tumors
and human MYC-driven MB, our gene expression analysis also
revealed that genes overexpressed in MP tumors are similar to
those expressed by embryonic and pluripotent stem cells. The
association between pluripotency and cancer has been noted
in a number of other systems. For example, in breast cancer,
glioblastoma and bladder carcinoma, an ES-like signature is
associated with aggressive, poorly differentiated tumors and is
a predictor of poor prognosis (Ben-Porath et al., 2008). Likewise,
a pluripotency signature is associated with transformation of
follicular lymphoma to diffuse large B cell lymphoma (Gentles
et al., 2009). There has been some debate about whether this
signature reflects true acquisition of pluripotent characteristics
or simply activation of a MYC-driven gene expression profile
(Kim et al., 2010). In the case of MP tumors, there is no question
that a Myc-driven transcriptional program is active and plays
a significant role in driving tumor growth. However, it is worth
noting that the genes identified as differentially expressed in
MP tumors also resemble those associated with pluripotency
induced by Oct4 and Klf4, suggesting that the pluripotency
program in our cells is not purely a consequence ofMyc overex-
pression. It is also notable that MP tumors express lower levels
of neural differentiation markers compared to not only Ptch1
tumors (which consist of neuronal progenitor-like cells) but
also normal neural stem cells, from which they were derived.
These findings suggest that transformation of NSCs may involve
dedifferentiation to a more pluripotent state.
Among the most important results of our analysis was the
observation that MP tumors have increased expression of genes
associated with PI3K/AKT/mTOR signaling and decreased
expression of Foxo target genes. FOXO proteins have been
shown to inhibit expression of MYC targets (Bouchard et al.,
2004), and MYC-induced transformation requires inactivation
of FOXO proteins (Bouchard et al., 2007). Importantly, AKT has
been shown to phosphorylate FOXO proteins and thereby
prevent them from entering the nucleus (Bouchard et al.,
2004). Although the cause of PI3K pathway activation in MP
tumors is unclear, it seems likely that this activation interferes
with Foxo activity and thereby synergizes with Myc overexpres-
sion to promote transformation. PI3K signaling has also been
shown to increase Myc protein stability (Kumar et al., 2006)
and to enhance Myc function by promoting degradation of its
antagonist Mad1 (Zhu et al., 2008). Thus, the PI3K pathway
may be a critical regulator of transformation in MP tumors.
In light of the above findings, we hypothesized that inhibition of
PI3K signaling might block growth of MP tumors. Whereas

Cancer Cell
Modeling MYC-Driven Medulloblastoma
inhibition of the SHH pathway had little effect on growth of these
cells, treatment with the PI3K/mTOR inhibitors BEZ-235 and
BKM-120 had a potent inhibitory effect on tumor growth both in-
vitro and in vivo. Several studies have documented activation of
PI3K signaling in human MB (Castellino et al., 2010; Hartmann
et al., 2006). In particular, genomic analysis suggests that
MYC-driven MBs frequently exhibit loss of chromosome 10q
(where PTEN is located) (Northcott et al., 2011). Consistent
with this, our CMAP analysis (Table S6) suggests that MYC-
driven tumors have elevated expression of genes that are regu-
lated by PI3K and mTOR inhibitors. Together, these findings
suggest that targeting the PI3K/mTOR pathway may be useful
for treatment of human MB. Further studies using this model of
MYC-driven MB will shed light on the biology of this disease
and open up new targets for therapy.
EXPERIMENTAL PROCEDURES
Animals
C57BL/6J mice used as a source of stem cells and immunocompromised
(NOD-scid IL2Rgammanull or NSG) mice used for transplantation were
purchased from Jackson Labs (Bar Harbor, ME). Mice were maintained in
the Cancer Center Isolation Facility at Duke University and in the Animal
Facility at Sanford-Burnham. All experiments were performed in accordance
with national guidelines and regulations, and with the approval of the animal
care and use committees at each institution.
Orthotopic Transplantation and Tumor Formation
Before transplantation, cerebellar stem cells (Prom1+Lin� cells) or GNPs
(GFP+ cells FACS-sorted from Math1-GFP transgenic mice) were infected
withMyc and DNp53 retroviruses for 20 hr. Either 13 105 stem cells in Neuro-
cult medium or 13 106 GNPs suspended in Neurobasal mediumwere injected
into the cerebella of NSG mice (6–8 weeks old) using a stereotaxic frame with
a mouse adaptor (David Kopf Instruments), as described previously (Yang
et al., 2008). Animals were monitored weekly, and sacrificed when they
showed symptoms of MB.
To generate tetracycline (Tet)-regulatable tumors, stem cells were infected
with Tet-inducible Myc lentivirus and DNp53 retrovirus. The Tet-inducible
vector (pICUE-mycT58A) consisted of a Tet-response element (TRE2) control-
ling expression of turbo red fluorescent protein (tRFP) and Myc-T58A and
a constitutive promoter controlling expression of the reverse tetracycline
transactivator (rtTA3) and eGFP (Meerbrey et al., 2011). Infected cells were im-
planted into cerebella of NSG mice, and mice were maintained on DOX-con-
taining food. When mice became symptomatic, they were sacrificed and
tumor cells were retransplanted into secondary NSG mice. These mice were
separated into three groups. Group 1 (n = 14) was continually fed DOX-con-
taining food, Group 2 (n = 14) was fed DOX-food for one week and normal
food thereafter; and Group 3 (n = 12) was not fed DOX-food at all. Mice
were subjected to bioluminescent imaging at 1, 2, and 3weeks andwere sacri-
ficed at the onset of symptoms. At the time of sacrifice, brains were removed,
paraffin-embedded, sectioned, and stained with H&E.
In Vivo Bioluminescent Imaging
Mice were given intraperitoneal injections of 150 ng/g D-Luciferin (Caliper Life
Sciences, cat#12279) and anesthetized with 2.5% isoflurane. At 7–8 min after
injection, animals were imaged using the Xenogen Spectrum (IVIS-200)
imaging system.
In Vivo Inhibitor Treatment
To study effects of the PI3-kinase antagonist BKM-120 on tumor growth
in vivo, we retransplanted 500 MP tumor cells into the cerebella of secondary
NSG mice. Seven days after transplantation, mice were randomly separated
into two groups: Group 1 was given vehicle (0.5%methyl-cellulose) and Group
2 was given 30 mg/kg BKM-120 by oral gavage once daily until symptom
onset. BKM-120 was dissolved in 0.5% methylcellulose and sonicated using
C
an ultrasonicator (Misonix) at an amplitude of 20 for 12 min. Survival was
defined as the time from transplantation until symptom onset.
ACCESSION NUMBERS
Microarray data have been deposited in theGEOpublic database (http://www.
ncbi.nlm.nih.gov/geo/), with accession number GSE34126.
SUPPLEMENTAL INFORMATION
Supplemental Information includes six figures, six tables, and Supplemental
Experimental Procedures and can be found with this article online at
doi:10.1016/j.ccr.2011.12.021.
ACKNOWLEDGMENTS
We dedicate this paper to the memory of Cameron Jackson. In addition, we
would like to thank Jack Dutton and Adriana Charbono for assistance with
animal colony maintenance and screening; Beth Harvat, Lynn Martinek,
Mike Cook, Amy Cortez, and Yoav Altman for help with flow cytometry;
Zhengzheng Wei for processing and analysis of microarrays; Irina Leiss for
performing immunohistochemistry; and Daisuke Kawauchi and Martine Rous-
sel for helpful discussions. This work was supported by funds from the Alex-
ander and Margaret Stewart Trust and the Duke Comprehensive Cancer
Center (R.W.R.), the Southeastern Brain Tumor Foundation (R.W.R.), Alex’s
Lemonade Stand Foundation (R.W.R.), Pediatric Brain Tumor Foundation
(R.E.M. and R.W.R.), NCI grants CA122759 (R.W.R.) and CA159859 (M.D.T.
and R.W.R.). C.R.M. is a Damon Runyon-Genentech Clinical Investigator sup-
ported in part by a grant (CI-45-09) from the Damon Runyon Cancer Research
Foundation. R.W.R. is supported by a Leadership Award (LA1-01747) from the
California Institute of Regenerative Medicine.
Received: July 7, 2011
Revised: November 21, 2011
Accepted: December 22, 2011
Published: February 13, 2012
REFERENCES
Ben-Porath, I., Thomson, M.W., Carey, V.J., Ge, R., Bell, G.W., Regev, A., and
Weinberg, R.A. (2008). An embryonic stem cell-like gene expression signature
in poorly differentiated aggressive human tumors. Nat. Genet. 40, 499–507.
Bild, A.H., Yao, G., Chang, J.T., Wang, Q., Potti, A., Chasse, D., Joshi, M.B.,
Harpole,D., Lancaster, J.M.,Berchuck,A., et al. (2006).Oncogenicpathwaysig-
natures inhumancancersasaguide to targeted therapies.Nature439, 353–357.
Bouchard, C., Lee, S., Paulus-Hock, V., Loddenkemper, C., Eilers, M., and
Schmitt, C.A. (2007). FoxO transcription factors suppress Myc-driven lympho-
magenesis via direct activation of Arf. Genes Dev. 21, 2775–2787.
Bouchard, C., Marquardt, J., Bras, A., Medema, R.H., and Eilers, M. (2004).
Myc-induced proliferation and transformation require Akt-mediated phos-
phorylation of FoxO proteins. EMBO J. 23, 2830–2840.
Bowman, T., Symonds, H., Gu, L., Yin, C., Oren, M., and Van Dyke, T. (1996).
Tissue-specific inactivation of p53 tumor suppression in the mouse. Genes
Dev. 10, 826–835.
Boxer, R.B., Jang, J.W., Sintasath, L., and Chodosh, L.A. (2004). Lack of sus-
tained regression of c-MYC-induced mammary adenocarcinomas following
brief or prolonged MYC inactivation. Cancer Cell 6, 577–586.
Castellino, R.C., Barwick, B.G., Schniederjan, M., Buss, M.C., Becher, O.,
Hambardzumyan, D., Macdonald, T.J., Brat, D.J., and Durden, D.L. (2010).
Heterozygosity for Pten promotes tumorigenesis in a mouse model of medul-
loblastoma. PLoS ONE 5, e10849.
Chang, D.W., Claassen, G.F., Hann, S.R., and Cole, M.D. (2000). The c-Myc
transactivation domain is a direct modulator of apoptotic versus proliferative
signals. Mol. Cell. Biol. 20, 4309–4319.
Cho, Y.J., Tsherniak, A., Tamayo, P., Santagata, S., Ligon, A., Greulich, H.,
Berhoukim, R., Amani, V., Goumnerova, L., Eberhart, C.G., et al. (2011).
ancer Cell 21, 155–167, February 14, 2012 ª2012 Elsevier Inc. 165

Cancer Cell
Modeling MYC-Driven Medulloblastoma
Integrative genomic analysis of medulloblastoma identifies a molecular
subgroup that drives poor clinical outcome. J. Clin. Oncol. 29, 1424–1430.
Delpuech, O., Griffiths, B., East, P., Essafi, A., Lam, E.W., Burgering, B.,
Downward, J., and Schulze, A. (2007). Induction of Mxi1-SR alpha by
FOXO3a contributes to repression of Myc-dependent gene expression. Mol.
Cell. Biol. 27, 4917–4930.
Eberhart, C.G., and Burger, P.C. (2003). Anaplasia and grading inmedulloblas-
tomas. Brain Pathol. 13, 376–385.
Eberhart, C.G., Chaudhry, A., Daniel, R.W., Khaki, L., Shah, K.V., and Gravitt,
P.E. (2005). Increased p53 immunopositivity in anaplastic medulloblastoma
and supratentorial PNET is not caused by JC virus. BMC Cancer 5, 19.
Elson, A., Deng, C., Campos-Torres, J., Donehower, L.A., and Leder, P. (1995).
The MMTV/c-myc transgene and p53 null alleles collaborate to induce T-cell
lymphomas, but not mammary carcinomas in transgenic mice. Oncogene
11, 181–190.
Frank, A.J., Hernan, R., Hollander, A., Lindsey, J.C., Lusher, M.E., Fuller, C.E.,
Clifford, S.C., and Gilbertson, R.J. (2004). The TP53-ARF tumor suppressor
pathway is frequently disrupted in large/cell anaplastic medulloblastoma.
Brain Res. Mol. Brain Res. 121, 137–140.
Gentles, A.J., Alizadeh, A.A., Lee, S.I., Myklebust, J.H., Shachaf, C.M.,
Shahbaba, B., Levy, R., Koller, D., and Plevritis, S.K. (2009). A pluripotency
signature predicts histologic transformation and influences survival in follicular
lymphoma patients. Blood 114, 3158–3166.
Gibson, P., Tong, Y., Robinson, G., Thompson, M.C., Currle, D.S., Eden, C.,
Kranenburg, T.A., Hogg, T., Poppleton, H., Martin, J., et al. (2010). Subtypes
of medulloblastoma have distinct developmental origins. Nature 468, 1095–
1099.
Gilbertson, R.J., and Ellison, D.W. (2008). The origins of medulloblastoma
subtypes. Annu. Rev. Pathol. 3, 341–365.
Grotzer, M.A., Hogarty, M.D., Janss, A.J., Liu, X., Zhao, H., Eggert, A., Sutton,
L.N., Rorke, L.B., Brodeur, G.M., and Phillips, P.C. (2001). MYC messenger
RNA expression predicts survival outcome in childhood primitive neuroecto-
dermal tumor/medulloblastoma. Clin. Cancer Res. 7, 2425–2433.
Hanel, W., and Moll, U.M. (2012). Links between mutant p53 and genomic
instability. J. Cell. Biochem. 113, 433–439. 10.1002/jcb.23400.
Harrington, E.A., Bennett, M.R., Fanidi, A., and Evan, G.I. (1994). c-Myc-
induced apoptosis in fibroblasts is inhibited by specific cytokines. EMBO J.
13, 3286–3295.
Hartmann, W., Digon-Sontgerath, B., Koch, A., Waha, A., Endl, E., Dani, I.,
Denkhaus, D., Goodyer, C.G., Sorensen, N., Wiestler, O.D., and Pietsch, T.
(2006). Phosphatidylinositol 30-kinase/AKT signaling is activated in medullo-
blastoma cell proliferation and is associated with reduced expression of
PTEN. Clin. Cancer Res. 12, 3019–3027.
Hemann, M.T., Bric, A., Teruya-Feldstein, J., Herbst, A., Nilsson, J.A., Cordon-
Cardo, C., Cleveland, J.L., Tansey, W.P., and Lowe, S.W. (2005). Evasion of
the p53 tumour surveillance network by tumour-derived MYC mutants.
Nature 436, 807–811.
Hermeking, H., and Eick, D. (1994). Mediation of c-Myc-induced apoptosis by
p53. Science 265, 2091–2093.
Hoshida, Y., Brunet, J.P., Tamayo, P., Golub, T.R., and Mesirov, J.P. (2007).
Subclass mapping: identifying common subtypes in independent disease
data sets. PLoS ONE 2, e1195.
Huang, M.J., Cheng, Y.C., Liu, C.R., Lin, S., and Liu, H.E. (2006). A small-mole-
cule c-Myc inhibitor, 10058-F4, induces cell-cycle arrest, apoptosis, and
myeloid differentiation of human acute myeloid leukemia. Exp. Hematol. 34,
1480–1489.
Jain, M., Arvanitis, C., Chu, K., Dewey, W., Leonhardt, E., Trinh, M., Sundberg,
C.D., Bishop, J.M., and Felsher, D.W. (2002). Sustained loss of a neoplastic
phenotype by brief inactivation of MYC. Science 297, 102–104.
Kawamura, T., Suzuki, J., Wang, Y.V., Menendez, S., Morera, L.B., Raya, A.,
Wahl, G.M., and Izpisua Belmonte, J.C. (2009). Linking the p53 tumour
suppressor pathway to somatic cell reprogramming. Nature 460, 1140–1144.
166 Cancer Cell 21, 155–167, February 14, 2012 ª2012 Elsevier Inc.
Kim, J., Woo, A.J., Chu, J., Snow, J.W., Fujiwara, Y., Kim, C.G., Cantor, A.B.,
and Orkin, S.H. (2010). A Myc network accounts for similarities between
embryonic stem and cancer cell transcription programs. Cell 143, 313–324.
Kool, M., Koster, J., Bunt, J., Hasselt, N.E., Lakeman, A., van Sluis, P., Troost,
D., Meeteren, N.S., Caron, H.N., Cloos, J., et al. (2008). Integrated genomics
identifies five medulloblastoma subtypes with distinct genetic profiles,
pathway signatures and clinicopathological features. PLoS ONE 3, e3088.
Kumar, A., Marques, M., and Carrera, A.C. (2006). Phosphoinositide 3-kinase
activation in late G1 is required for c-Myc stabilization and S phase entry. Mol.
Cell. Biol. 26, 9116–9125.
Kupershmidt, I., Su, Q.J., Grewal, A., Sundaresh, S., Halperin, I., Flynn, J.,
Shekar, M., Wang, H., Park, J., Cui, W., et al. (2010). Ontology-based meta-
analysis of global collections of high-throughput public data. PLoS ONE 5,
e13066.
Lamb, J., Crawford, E.D., Peck, D., Modell, J.W., Blat, I.C., Wrobel, M.J.,
Lerner, J., Brunet, J.P., Subramanian, A., Ross, K.N., et al. (2006). The
Connectivity Map: using gene-expression signatures to connect small mole-
cules, genes, and disease. Science 313, 1929–1935.
Lee, A., Kessler, J.D., Read, T.A., Kaiser, C., Corbeil, D., Huttner, W.B.,
Johnson, J.E., and Wechsler-Reya, R.J. (2005). Isolation of neural stem cells
from the postnatal cerebellum. Nat. Neurosci. 8, 723–729.
Leonard, J.R., Cai, D.X., Rivet, D.J., Kaufman, B.A., Park, T.S., Levy, B.K., and
Perry, A. (2001). Large cell/anaplastic medulloblastomas and medullomyo-
blastomas: clinicopathological and genetic features. J. Neurosurg. 95, 82–88.
Lumpkin, E.A., Collisson, T., Parab, P., Omer-Abdalla, A., Haeberle, H., Chen,
P., Doetzlhofer, A., White, P., Groves, A., Segil, N., and Johnson, J.E. (2003).
Math1-driven GFP expression in the developing nervous system of transgenic
mice. Gene Expr. Patterns 3, 389–395.
Meerbrey, K.L., Hu, G., Kessler, J.D., Roarty, K., Li, M.Z., Fang, J.E.,
Herschkowitz, J.I., Burrows, A.E., Ciccia, A., Sun, T., et al. (2011). The
pINDUCER lentiviral toolkit for inducible RNA interference in vitro and in vivo.
Proc. Natl. Acad. Sci. USA 108, 3665–3670.
Meletis, K., Wirta, V., Hede, S.M., Nister, M., Lundeberg, J., and Frisen, J.
(2006). p53 suppresses the self-renewal of adult neural stem cells.
Development 133, 363–369.
Nagao, M., Campbell, K., Burns, K., Kuan, C.Y., Trumpp, A., and Nakafuku, M.
(2008). Coordinated control of self-renewal and differentiation of neural stem
cells by Myc and the p19ARF-p53 pathway. J. Cell Biol. 183, 1243–1257.
Northcott, P.A., Korshunov, A., Witt, H., Hielscher, T., Eberhart, C.G.,Mack, S.,
Bouffet, E., Clifford, S.C., Hawkins, C.E., French, P., et al. (2011).
Medulloblastoma comprises four distinct molecular variants. J. Clin. Oncol.
29, 1408–1414. Published online September 7, 2010. 10.1200/JCO.2009.27.
4324.
Palmer, S.L., Reddick,W.E., andGajjar, A. (2007). Understanding the cognitive
impact on children who are treated for medulloblastoma. J. Pediatr. Psychol.
32, 1040–1049.
Pelengaris, S., Rudolph, B., and Littlewood, T. (2000). Action of Myc in vivo -
proliferation and apoptosis. Curr. Opin. Genet. Dev. 10, 100–105.
Pfister, S., Remke, M., Benner, A., Mendrzyk, F., Toedt, G., Felsberg, J.,
Wittmann, A., Devens, F., Gerber, N.U., Joos, S., et al. (2009). Outcome
prediction in pediatric medulloblastoma based on DNA copy-number aberra-
tions of chromosomes 6q and 17q and theMYC andMYCN loci. J. Clin. Oncol.
27, 1627–1636.
Polkinghorn, W.R., and Tarbell, N.J. (2007). Medulloblastoma: tumorigenesis,
current clinical paradigm, and efforts to improve risk stratification. Nat. Clin.
Pract. Oncol. 4, 295–304.
Remke, M., Hielscher, T., Northcott, P.A., Witt, H., Ryzhova, M., Wittmann, A.,
Benner, A., von Deimling, A., Scheurlen, W., Perry, A., et al. (2011). Adult
medulloblastoma comprises three major molecular variants. J. Clin. Oncol.
29, 2717–2723.
Schuller, U., Heine, V.M., Mao, J., Kho, A.T., Dillon, A.K., Han, Y.G., Huillard,
E., Sun, T., Ligon, A.H., Qian, Y., et al. (2008). Acquisition of granule neuron
precursor identity is a critical determinant of progenitor cell competence to
form Shh-induced medulloblastoma. Cancer Cell 14, 123–134.

Cancer Cell
Modeling MYC-Driven Medulloblastoma
Shakhova, O., Leung, C., van Montfort, E., Berns, A., and Marino, S. (2006).
Lack of Rb and p53 delays cerebellar development and predisposes to large
cell anaplastic medulloblastoma through amplification of N-Myc and Ptch2.
Cancer Res. 66, 5190–5200.
Soucek, L., Whitfield, J., Martins, C.P., Finch, A.J., Murphy, D.J., Sodir, N.M.,
Karnezis, A.N., Swigart, L.B., Nasi, S., and Evan, G.I. (2008). Modelling Myc
inhibition as a cancer therapy. Nature 455, 679–683.
Stavrou, T., Bromley, C.M., Nicholson, H.S., Byrne, J., Packer, R.J., Goldstein,
A.M., and Reaman, G.H. (2001). Prognostic factors and secondary malignan-
cies in childhood medulloblastoma. J. Pediatr. Hematol. Oncol. 23, 431–436.
Stearns, D., Chaudhry, A., Abel, T.W., Burger, P.C., Dang, C.V., and Eberhart,
C.G. (2006). c-myc overexpression causes anaplasia in medulloblastoma.
Cancer Res. 66, 673–681.
Subramanian, A., Tamayo, P., Mootha, V.K., Mukherjee, S., Ebert, B.L.,
Gillette, M.A., Paulovich, A., Pomeroy, S.L., Golub, T.R., Lander, E.S., and
Mesirov, J.P. (2005). Gene set enrichment analysis: a knowledge-based
approach for interpreting genome-wide expression profiles. Proc. Natl.
Acad. Sci. USA 102, 15545–15550.
Sutter, R., Shakhova, O., Bhagat, H., Behesti, H., Sutter, C., Penkar, S.,
Santuccione, A., Bernays, R., Heppner, F.L., Schuller, U., et al. (2010).
Cerebellar stem cells act as medulloblastoma-initiating cells in a mouse model
and a neural stem cell signature characterizes a subset of humanmedulloblas-
tomas. Oncogene 29, 1845–1856.
Swartling, F.J., Grimmer, M.R., Hackett, C.S., Northcott, P.A., Fan, Q.W.,
Goldenberg, D.D., Lau, J., Masic, S., Nguyen, K., Yakovenko, S., et al.
C
(2010). Pleiotropic role for MYCN in medulloblastoma. Genes Dev. 24, 1059–
1072.
Tabori, U., Baskin, B., Shago, M., Alon, N., Taylor, M.D., Ray, P.N., Bouffet, E.,
Malkin, D., and Hawkins, C. (2010). Universal poor survival in children with
medulloblastoma harboring somatic TP53 mutations. J. Clin. Oncol. 28,
1345–1350.
Thompson, M.C., Fuller, C., Hogg, T.L., Dalton, J., Finkelstein, D., Lau, C.C.,
Chintagumpala, M., Adesina, A., Ashley, D.M., Kellie, S.J., et al. (2006).
Genomics identifies medulloblastoma subgroups that are enriched for specific
genetic alterations. J. Clin. Oncol. 24, 1924–1931.
Wang, J., Wang, H., Li, Z., Wu, Q., Lathia, J.D., McLendon, R.E., Hjelmeland,
A.B., and Rich, J.N. (2008). c-Myc is required formaintenance of glioma cancer
stem cells. PLoS ONE 3, e3769.
Yang, Z.J., Ellis, T., Markant, S.L., Read, T.A., Kessler, J.D., Bourboulas, M.,
Schuller, U., Machold, R., Fishell, G., Rowitch, D.H., et al. (2008).
Medulloblastoma can be initiated by deletion of Patched in lineage-restricted
progenitors or stem cells. Cancer Cell 14, 135–145.
Zheng, H., Ying, H., Yan, H., Kimmelman, A.C., Hiller, D.J., Chen, A.J., Perry,
S.R., Tonon, G., Chu, G.C., Ding, Z., et al. (2008). p53 and Pten control neural
and glioma stem/progenitor cell renewal and differentiation. Nature 455, 1129–
1133.
Zhu, J., Blenis, J., and Yuan, J. (2008). Activation of PI3K/Akt and MAPK
pathways regulates Myc-mediated transcription by phosphorylating and
promoting the degradation of Mad1. Proc. Natl. Acad. Sci. USA 105, 6584–
6589.
ancer Cell 21, 155–167, February 14, 2012 ª2012 Elsevier Inc. 167
Cancer Cell
Article
A Mouse Model of the Most Aggressive Subgroupof Human MedulloblastomaDaisuke Kawauchi,1,7 Giles Robinson,2,7 Tamar Uziel,1,8 Paul Gibson,5 Jerold Rehg,3 Cuilan Gao,4 David Finkelstein,4
Chunxu Qu,6 Stanley Pounds,4 David W. Ellison,3 Richard J. Gilbertson,5,* and Martine F. Roussel1,*1Department of Tumor Cell Biology2Department of Oncology3Department of Pathology4Department of Biostatistics5Department of Developmental Neurobiology6Department of Information SciencesSt. Jude Children’s Research Hospital, 262 Danny Thomas Place, Memphis, TN 38105, USA7These authors contributed equally to this work8Present address: Global Pharmaceutical Research and Development—Cancer Research, Abbott Laboratories, 100 Abbott Park Road,
Building AP-10, Room 201, Abbott Park, IL 60064, USA*Correspondence: [email protected] (M.F.R.), [email protected] (R.J.G.)
DOI 10.1016/j.ccr.2011.12.023
SUMMARY
Medulloblastomas that display a large cell/anaplastic morphology and overexpress the cellular c-MYC geneare highly aggressive and carry a very poor prognosis. This so-called MYC-subgroup differs in its histopa-thology, gene expression profile, and clinical behavior from other forms of medulloblastoma. We generateda mouse model of MYC-subgroup medulloblastoma by transducing Trp53-null cerebellar progenitor cellswith Myc. The cardinal features of these mouse medulloblastomas closely mimic those of human MYC-subgroup tumors and significantly differ from mouse models of the Sonic-Hedgehog- and WNT-diseasesubgroups. This mouse model should significantly accelerate understanding and treatment of the mostaggressive form of medulloblastoma and infers distinct roles for MYC and MYCN in tumorigenesis.
INTRODUCTION
Medulloblastoma (MB)—the most common malignant pediatric
brain tumor—includes at least four clinically and molecularly
distinct subgroups (Cho et al., 2011; Kool et al., 2008; Northcott
et al., 2011; Thompson et al., 2006). Sonic Hedgehog (SHH)-
subgroup MB most frequently results from inactivating muta-
tions of PTCH1 (the SHH receptor) or suppressor of fused
(a downstream signal transducer). SHH signaling ultimately
activates GLI family transcription factors that upregulate
pro-proliferative genes, such as MYCN, CCND1, and CCND2
(cyclins D1 and D2), and lead to the reduced expression of
inhibitors of cyclin-dependent kinases (CDKs), including
p27KIP1 and p18INK4c (Roussel and Hatten, 2011). About 50%
Significance
MYC-subgroup medulloblastoma (MB) is one of the most aggcombination surgery, radiotherapy, and chemotherapy and kMouse models of the Sonic Hedgehog and WNT forms of MBof these disease subgroups. In contrast, the absence of preclinthis important tumor. Here, we describe the MYC-driven mouhistopathology, and clinical behavior of human MYC-subgrouto develop therapeutic modalities and determine the origin of
168 Cancer Cell 21, 168–180, February 14, 2012 ª2012 Elsevier Inc.
of SHH-subgroup MBs exhibit a desmoplastic/nodular
histology and carry an intermediate prognosis in patients who
receive contemporary surgical intervention and chemotherapy
(Cho et al., 2011; Ellison et al., 2011a; Lam et al., 1999; North-
cott et al., 2011; Raffel et al., 1997). In contrast, the WNT-
subgroup disease has an excellent prognosis, exhibits a
‘‘classic’’ morphology, and is frequently triggered by mutations
in the WNT pathway effector CTNNB1 (b-catenin; Cho et al.,
2011; Ellison et al., 2005; Gajjar et al., 2006; Kool et al., 2008;
Northcott et al., 2011; Thompson et al., 2006). An interesting
distinction between SHH- and WNT-driven MBs is their
anatomic location, with SHH tumors arising laterally in the
cerebellum and WNT MBs arising in the midline close to the
brainstem; recent results indicate that these features reflect
ressive pediatric brain tumors. This disease is resistant toills most affected children within three years of diagnosis.have advanced understanding of the biology and treatmentical models of MYC-driven MB has limited understanding ofse model of MB that accurately mimics the transcriptome,p disease. This model should significantly advance effortsthis deadly childhood cancer.

Cancer Cell
MYC-Subgroup of Medulloblastoma
the different cells of origin of the two MB subgroups (Gibson
et al., 2010).
Modeling both the SHH- and WNT-subgroups of MB in the
mouse (Wu et al., 2011) has been instrumental in providing
insights into the cellular origins of these different disease forms
and paving the way for therapeutic development (Romer et al.,
2004). SHH-subgroup MBs arise within the cerebellum from
committed, SHH-dependent granule neuron precursors (GNPs;
Schuller et al., 2008; Yang et al., 2008). Very recently, we demon-
strated that WNT-subgroup MBs arise outside of the cerebellum
from progenitor cells in the lower rhombic lip (Gibson et al.,
2010). Thus, subgroups of MB are likely to reflect intrinsically
different diseases with distinct origins and driver mutations.
In contrast to the SHH- and WNT-subgroups, very little is
known about the molecular aberrations that drive two other
subgroups of the disease. Non-SHH/WNT tumors include the
most aggressive form of the disease (MYC-subgroup) that
exhibits frequent amplification and/or overexpression of MYC,
portends a dismal prognosis, and generates a high proportion
of aggressive and invasive tumors with large cell/anaplastic
(LC/A) histology (Cho et al., 2011; Ellison et al., 2011a; Northcott
et al., 2011; Pfister et al., 2009).
Mycn is a critical mediator of SHH signals in GNPs (Kenney
et al., 2003) and is absolutely required for normal cerebellar
development; however, much less is known about the function
of Myc in the mouse hindbrain (Knoepfler et al., 2002; Zindy
et al., 2006). Myc is not normally expressed in GNPs (Zindy
et al., 2006), and overexpression of MYC and MYCN is mutually
exclusive and associated with distinct subgroups of humanMBs
(Cho et al., 2011; Northcott et al., 2011). High-level expression
and amplification of MYCN are observed across the various
subgroups of human MB. Aberrant activation of Mycn expres-
sion in the developing mouse cerebellum initiates a variety of
MBs, including both classic and LC/A tumors (Swartling et al.,
2010). In contrast, the highest levels of MYC expression and
MYC amplification are found almost exclusively in the aggressive
MYC-subgroup disease (Cho et al., 2011; Northcott et al., 2011).
Thus, whereas MYCN may play a role in the pathogenesis of
a variety of MBs,MYCmay drive a specific aggressive subgroup
of the disease. This may seem somewhat counterintuitive,
because it is widely thought that the biochemical transcriptional
functions of different MYC-family genes are similar.
Here, we assessed the role of MYC and MYCN in medullo-
blastoma development in the absence of TRP53.
RESULTS
Enforced Expression of Myc but Not Mycn inTrp53-Deficient Cerebellar Neuronal ProgenitorsInduces Aggressive MBWe showed previously that GNP-enriched cell isolates from the
cerebella of postnatal day (P)6–P7 Cdkn2c�/�, Ptch1+/� or
Cdkn2c�/�, Trp53�/� mice, but not from Cdkn2c�/� or wild-
type mice, generate SHH-subgroup MBs when transduced
with a retroviral vector expressing Mycn but not a control virus
(Zindy et al., 2007). To test if Myc might similarly transform
Cdkn2c�/�, Trp53�/� GNPs, we isolated proliferating GNPs
from Cdkn2c�/�, Trp53�/�, Atoh1-GFP mice, which are marked
by co-expression of green fluorescent protein (GFP; Lumpkin
C
et al., 2003). Enrichment of GNPs showed that, on average, we
obtained 91.9% of GFP-positive (+) GNPs and 8.1% of GFP-
negative (�) progenitor cells per preparation and found that the
sorted GFP-expressing population contained 1.1% of GFP-
cells, and, conversely, the GFP- population contained 1.7% of
GFP+ cells. We transduced these cells with viruses either encod-
ing Myc and co-expressing red fluorescent protein (RFP) or
expressing Mycn in lieu of Myc. Fluorescence-activated cell
sorting (FACS) of Myc- and Mycn-transduced cells confirmed
comparable infection efficiencies by the two retroviral vectors
(45.9 ± 11.7% of GFP+/RFP+ for Myc-RFP and 51.6 ± 2.1%
of GFP+/RFP+ for Mycn-RFP). Cells transduced with either
Myc or Mycn (2 3 106 per mouse) were injected separately into
the cerebral cortices of naıve recipient CD-1 nu/nu mice. Myc-
transduced cells formed aggressive tumors that killed mice
significantly faster than GNPs transduced with Mycn (median
survival = 33 days forMyc vs. 48 days forMycn, p < 0.0001, Fig-
ure 1A). Immunoblotting demonstrated significant levels of
ectopic Myc or Mycn protein expression within the two tumor
subsets (Figures S1A and S1B available online). Myc-derived
tumors generated from P6–P7 cerebellar cells of either
Cdkn2c�/�, Trp53�/�, or Trp53�/� mice occurred with similar
latency (median survival = 39 days for Cdkn2c�/�, Trp53�/� vs.
39 days for Trp53�/�, p = 0.7096), indicating that the loss of
Cdkn2c was not required for Myc expression to induce MB in
the absence of Trp53 (Figure S1C). Myc-tumors displayed
a consistent morphology that was strikingly similar to human
MBs of the MYC-subgroup (Figure 1B). Morphometric and
terminal deoxynucleotidyl transferase dUTP nick end labeling
(TUNEL) assays of mouse MBs revealed a much larger cell size
and apoptotic rate in Myc-tumors than did mouse models of
the WNT- (Gibson et al., 2010) or SHH-subgroups disease
(Ptch-tumors; Uziel et al., 2005), which typically show a classic
morphology (Figures 1B and 1C). Thus, Myc-induced mouse
MBs resemble the human LC/A MB phenotype reported previ-
ously (McManamy et al., 2003), andMyc andMycn drive distinct
tumors that appear to recapitulate aggressive LC/A and classic
forms of human MB, respectively.
Myc-engineered Murine MBs Have a DistinctTranscriptome that Mimics HumanMYC-Subgroup TumorsThe decreased latency and LC/A morphology ofMyc-generated
tumors suggested that these were distinct from classic MBs
induced by Mycn. We compared gene expression profiles of
Myc-tumors with those of Mycn-tumors, as well as profiles
generated from previously characterized mouse models of
WNT- and SHH-subgroup MB (Gibson et al., 2010; Uziel et al.,
2005). In addition, we compared these tumor profiles with those
of FACS-sorted Atoh1-GFP-expressing GNPs obtained from the
cerebellum of normal P6 mice lacking both Trp53 and p18Ink4c
protein expression [Cdkn2c�/�, Trp53�/�, Atoh1-GFP] mice
(designated GNPs; Figure 2A). The transcriptome of Myc-tumors
was distinct from those of the other mouse MBs (Figure 2A).
Unsupervised hierarchical clustering co-segregated the
gene expression profiles of mouse Mycn-tumors and those of
mouse models of SHH-subgroup disease. In contrast, transcrip-
tomes of Myc-tumors and the mouse WNT-subgroup model
formed two separate clusters. The Mycn/SHH/GNP profiles
ancer Cell 21, 168–180, February 14, 2012 ª2012 Elsevier Inc. 169

Figure 1. MBs Derived from Orthotopic Transplants in the Cortices
of Naive Recipient Mice of Cerebellar Progenitors Overexpressing
Myc and Mycn
(A) Kaplan-Meier survival curves of mice transplanted with cerebellar cells
purified from [Cdkn2c�/�, Trp53�/�, Atoh1-GFP] mice infected with Myc-RFP
(red line), Mycn-RFP (blue line), or RFP empty vector (orange line).
Cancer Cell
MYC-Subgroup of Medulloblastoma
170 Cancer Cell 21, 168–180, February 14, 2012 ª2012 Elsevier Inc.
were characterized by high expression of knownmembers of the
SHH pathway and signature genes of SHH-subgroup MB (Fig-
ure 2B). This observation was confirmed by quantitative RT-
PCR (qRT-PCR), including analysis of Atoh1, Gli1, Sfrp1, and
Boc1 (Figures 2C and 2D). In contrast, Myc and Npr3, which
are specifically expressed in the human MYC-subgroup (North-
cott et al., 2011), were highly expressed in the mouse Myc-
derived MBs (Figure 2B). Immunohistochemical analysis
confirmed that Npr3 is expressed selectively in mouse MYC-
subgroup MBs (Figure S2A). Myc-induced tumors also exhibited
high levels of transcription of Prom1 and Lgr5 (Figure 2B), which
are frequently expressed in stem-cell-like progenitor cells
(Barker et al., 2007; Lee et al., 2005; Zhu et al., 2009). In addition,
high expression of Nanog and Oct4 proteins, considered to be
canonical markers of embryonic pluripotency (Silva and Smith,
2008), was observed in mouse MYC-subgroup and SHH-
subgroup MBs (Figures S2B–S2P). On the other hand, putative
markers of brain tumor stem cells (Rich, 2009) exhibited various
expression levels among the three distinct tumor subgroups
(Figure S2Q).
As a further test of the degree to which mouse Myc-derived
tumors resemble the MYC-subgroup of human MB, we com-
pared the expression of mouse genes with orthologs previously
shown to specifically distinguish the human WNT-, SHH-, and
MYC-subgroup tumors (Cho et al., 2011; Northcott et al., 2011;
Thompson et al., 2006). Thirty-one of 52 orthologs (60%) that ex-
hibited increased expression in the human MYC-subgroup were
similarly upregulated in themouseMyc-tumors (Figure 3A). Forty
of 54 orthologs (74%) with increased expression in the human
WNT-subgroup were similarly increased in the mouse WNT-
tumors (Figure 3B). Thirty-one of 53 orthologs (58%) upregulated
in the human SHH-subgroup were increased in the mouse Ptch-
tumors (Figure 3C). Thus, mouse Myc-induced tumors express
signature genes remarkably similar to those reported for human
MYC-subgroup MB, whereas the mouse Mycn, Ptch, and Trp53
tumors resemble the human SHH-subgroup, and WNT mouse
tumors recapitulate human WNT-subgroup MBs, as reported
previously (Gibson et al., 2010). Furthermore, cross-species
comparison of human and mouse MB transcriptomes (Johnson
et al., 2010) revealed a statistically significant match between
mouse and human MYC-subgroups (Figure S3A). Overall, 56%
of 14,261 ortholog probe pairs showed agreement in gene
expression (upregulation or downregulation) between the human
MYC-subgroup andmouseMyc-tumors (p = 0.009 and p = 0.079
by permutation of the human and mouse data, respectively;
(B) Pathology of human and mouse MBs (H&E): (a) a human tumor withMYCN
amplification and classic morphological features, and (b) a human anaplastic
tumor with MYC amplification. Note the difference in nuclear pleomorphism
between classic and anaplastic tumors. The anaplastic tumor also shows
a paving stone-like pattern of cell molding and contains abundant apoptotic
cells, a hallmark of this variant. Mycn-tumors with a classic morphology of
round cells (c, e) contrast with Myc-tumors that show an anaplastic
morphology with cell molding and abundant mitotic figures and apoptotic
bodies (d, f). Scale bar = 50 mm.
(C) Myc-tumor cells are significantly larger and more likely to undergo
apoptosis than are their SHH- and WNT-subgroups counterparts. Error bars
indicate standard deviation. *p < 0.05 for SHH- and WNT-subgroup tumors
compared to the MYC-subgroup. See also Figure S1.
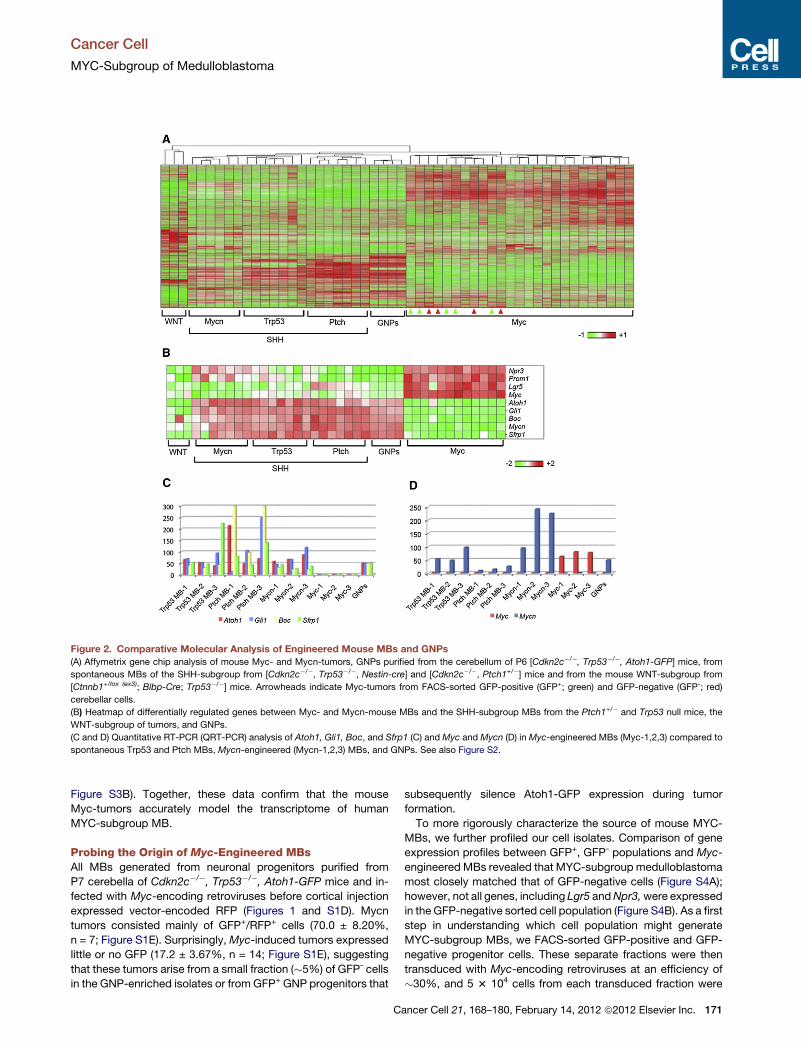
Figure 2. Comparative Molecular Analysis of Engineered Mouse MBs and GNPs
(A) Affymetrix gene chip analysis of mouse Myc- and Mycn-tumors, GNPs purified from the cerebellum of P6 [Cdkn2c�/�, Trp53�/�, Atoh1-GFP] mice, from
spontaneous MBs of the SHH-subgroup from [Cdkn2c�/�, Trp53�/�, Nestin-cre] and [Cdkn2c�/�, Ptch1+/�] mice and from the mouse WNT-subgroup from
[Ctnnb1+/lox (ex3); Blbp-Cre; Trp53�/�] mice. Arrowheads indicate Myc-tumors from FACS-sorted GFP-positive (GFP+; green) and GFP-negative (GFP-; red)
cerebellar cells.
(B) Heatmap of differentially regulated genes between Myc- and Mycn-mouse MBs and the SHH-subgroup MBs from the Ptch1+/� and Trp53 null mice, the
WNT-subgroup of tumors, and GNPs.
(C and D) Quantitative RT-PCR (QRT-PCR) analysis of Atoh1, Gli1, Boc, and Sfrp1 (C) and Myc and Mycn (D) in Myc-engineered MBs (Myc-1,2,3) compared to
spontaneous Trp53 and Ptch MBs, Mycn-engineered (Mycn-1,2,3) MBs, and GNPs. See also Figure S2.
Cancer Cell
MYC-Subgroup of Medulloblastoma
Figure S3B). Together, these data confirm that the mouse
Myc-tumors accurately model the transcriptome of human
MYC-subgroup MB.
Probing the Origin of Myc-Engineered MBsAll MBs generated from neuronal progenitors purified from
P7 cerebella of Cdkn2c�/�, Trp53�/�, Atoh1-GFP mice and in-
fected with Myc-encoding retroviruses before cortical injection
expressed vector-encoded RFP (Figures 1 and S1D). Mycn
tumors consisted mainly of GFP+/RFP+ cells (70.0 ± 8.20%,
n = 7; Figure S1E). Surprisingly,Myc-induced tumors expressed
little or no GFP (17.2 ± 3.67%, n = 14; Figure S1E), suggesting
that these tumors arise from a small fraction (�5%) of GFP- cells
in the GNP-enriched isolates or from GFP+ GNP progenitors that
C
subsequently silence Atoh1-GFP expression during tumor
formation.
To more rigorously characterize the source of mouse MYC-
MBs, we further profiled our cell isolates. Comparison of gene
expression profiles between GFP+, GFP- populations and Myc-
engineered MBs revealed that MYC-subgroup medulloblastoma
most closely matched that of GFP-negative cells (Figure S4A);
however, not all genes, including Lgr5 andNpr3,were expressed
in the GFP-negative sorted cell population (Figure S4B). As a first
step in understanding which cell population might generate
MYC-subgroup MBs, we FACS-sorted GFP-positive and GFP-
negative progenitor cells. These separate fractions were then
transduced with Myc-encoding retroviruses at an efficiency of
�30%, and 5 3 104 cells from each transduced fraction were
ancer Cell 21, 168–180, February 14, 2012 ª2012 Elsevier Inc. 171

Figure 3. Comparison of the Gene Expression Signature of Human MYC-, SHH-, and WNT-Subgroup MB with that of Mouse MBs Reveals
Three Representative Murine Models of the Human Disease
Signature genes that specifically distinguish the human WNT-, SHH-, and MYC-subgroup tumors by their broad subgroup overexpression relative to the others
were compiled from three recent publications on subgroups of MB (Cho et al., 2011; Northcott et al., 2011; Thompson et al., 2006). 52 signature genes relatively
overexpressed by the human MYC-subgroup, 54 by the human WNT-subgroup, and 53 by the human SHH-subgroup were found to have corresponding mouse
orthologs on the Affymetrix 430v2 chip. Shown here are representative heat maps columnswhich compare mean average expression of the orthologs in the three
mouse medulloblastoma models (Myc, Shh, and Wnt). Red indicates a log scale relative increase of expression, whereas green signifies a log scale relative
decrease of expression. The ortholog name and the corresponding first author of the study fromwhich the signature gene was described are listed in the columns
immediately to the right of the heat map.
(A) Thirty-one of 52 orthologs (60%) with increased expression in the human MYC-medulloblastoma subgroup and in the mouse Myc-tumors.
(B) Forty of 54 orthologs (74%) with increased expression in the human WNT-subgroup and in the mouse WNT-tumors.
(C) Thirty-one of 53 orthologs (58%) with increased expression in the human SHH-subgroup and mouse Ptch-tumors. See also Figure S3.
Cancer Cell
MYC-Subgroup of Medulloblastoma
then separately implanted into the cortices of recipient mice.
BothMyc-transduced population generated tumors in the cortex
of naıve recipient animals (Table 1). Histopathological analysis of
tumors revealed that all medulloblastomas derived from GFP+
FACS-sorted cells infected with Myc-encoding viruses (5/8)
showed LC/A characteristics (Table 1 and Figure S4C). In
contrast, tumors occurring after transplants of GFP-negative
cells infected with Myc-expressing retroviruses included two
T-cell lymphomas (2/8), as well as a range of CNS embryonal
tumors—high-grade neuroepithelial tumor with dominant PNET
and focal glial phenotype (3/8) and MBs with LC/A features
(3/8; Table 1). All LC/A MBs expressed low levels of Atoh1
when compared to that of normal GNPs percoll-purified from
the cerebella of P7 wild-type mice (Figure S4D). Comparative
gene expression analysis showed that the MYC-subgroup
MBs derived from Myc-transduced FACS sorted GFP-positive
and GFP-negative cerebellar cell populations had similar
gene profiles as do Myc-tumors derived from unsorted cere-
172 Cancer Cell 21, 168–180, February 14, 2012 ª2012 Elsevier Inc.
bellar cells (Figure 2A). These observations suggest that both
GFP+ and GFP- populations contain cells that can form MYC-
subgroup MBs.
Myc-Engineered MBs Contain NumerousTumor-Propagating Cells with HighProliferative PotentialHumanMYC-typeMBs are the most aggressive of all subgroups
(Cho et al., 2011; Northcott et al., 2011), and consistent with clin-
ical data, mouse Myc-induced tumors developed faster than did
Mycn-MBs (Figure 1A). One possible feature of MYC tumors that
could explain their aggressiveness is that MYC-subgroup MBs
contain a greater fraction of tumor-propagating cells than do
tumors of other subgroups. To estimate the numbers of cells
capable of initiating MBs, cells were purified from mouse MBs
of the SHH- and MYC-subgroups, and different numbers of
tumor cells were injected into the cortices of recipient nude
mice (Figure 4A). Limited dilution experiments revealed that

Table 1. Orthotopic Transplants of FACS sorted Cerebellar Progenitor Cells before Infection with Myc-Encoding Retroviruses
Myc-Infected
FACS-Sorted Population
Transplanted Cells
(Number) Tumor Latency (Days) Phenotype
GFP+ (n = 8) 5 3 104 52, 55, 98, 113, 75 LC/A, MYC-subgroup
GFP� (n = 8) 34, 37 T cell lymphoma
5 3 104 51, 53, 69 High-grade neuroepithelial tumor with dominant PNET
and focal glial phenotype
60, 68, 60 LC/A, MYC-subgroup
Neuronal progenitors were purified from the cerebella of postnatal day P7 Cdkn2c�/�; Trp53�/�; Atoh1-GFP mice and sorted for GFP-positive and
GFP-negative cell populations. Sorted cells were infected with vectors co-expressing both Myc and RFP, and 5 3 104 cells were transplanted into
the cortices of naıve recipient animals. Data were obtained from three independent experiments. Tumor latency represents the time at which mice
become moribund (median survival = 105.5 days for GFP-positive population and 56.5 days for GFP-negative population). See also Figure S4.
Cancer Cell
MYC-Subgroup of Medulloblastoma
equal to more than 2 3 105 purified SHH-subgroup tumor cells
were required for secondary tumor formation (Figure S5), consis-
tent with previous reports (Read et al., 2009). Unlike SHH-
subgroup MB cells, only 1 3 102 Myc-induced tumor cells
were required to generate secondary tumors (5/5; Figure 4A).
Histological analysis confirmed that secondary tumors shared
similar immunohistological characteristics with the parental
primary tumor (Figures 4B–4K).
CD133/Prom1-positive tumor-propagating cells from human
MBs expand in vitro to form ‘‘neurosphere’’ colonies when
plated under conditions that prevent their attachment to the
culture dish (Singh et al., 2004). Given that mouse MYC-
subgroup tumors upregulated Prom1, we tested whether these
tumor cells could similarly form neurospheres. Purified cells
from Myc-tumors were plated on an ultra-low attachment dish
at a density of 53 104 cells/ml in culture medium supplemented
at 3-day intervals with basic fibroblast growth factor (FGF) and
epidermal growth factor (EGF). One week later, spheres were
harvested, dissociated with trypsin, and the total number of
cells per plate was enumerated. Dissociated cells were replated
at the same initial density, cultured under the same conditions,
and sequentially passaged multiple times. Six to seven days
after their first plating, single RFP-positive Myc-derived tumor
cells generated macroscopic red colonies (Figure 5A), the
overall numbers of which had increased more than 20-fold
(Figure 5B, passage 1). Thus, on average, sphere-forming cells
underwent 5–6 population doublings in the first 7-day period.
More cells were recovered at passages 2 and 3, after which
the doubling time of the population slowed down; however,
a consistent proliferative rate approximately equal to 4 popula-
tion doublings in the succeeding 7-day intervals was maintained
from passages 5 to 10 (Figure 5B). In stark contrast, spheres
derived from canonical SHH-subgroup MBs that arose in
Cdkn2c�/�, Ptch1+/� mice could not be serially passaged at
all under the same culture conditions (Figure S6). Immunohisto-
chemical analysis (Figure 5C) and qRT-PCR (Figure 5D) re-
vealed that neurospheres from Myc-induced MBs expressed
several markers identified in stem/progenitor cells, including
Nanog, Oct4, Sox2, and Lgr5, as well as Nestin and Npr3
(Figure 5C).
To examine whether tumor spheres could be transplanted and
would recapitulate primary Myc-induced MBs, we injected
spheres at passages 2 and 6 into the cortices of recipient
mice. Interestingly, 2 3 105 cells formed tumors with a similar
latency as the secondary MBs generated from cells purified
C
from Myc-engineered tumors (7/7, median latency = 22 days;
Figure 6A). Primary and secondary tumors shared the same
pathology and expressed similar immunohistochemical markers
(Figure 6B). Gene profiling of primary and secondary MBs
confirmed that the tumors were distinct from the SHH-subgroup
tumors used as a control (Figure 6C). Thus, tumor spheres reca-
pitulate MYC- subgroup MBs after transplantation.
Myc-Engineered MB Cells Are Resistant to SHHSignaling InhibitorsSmoothened inhibitors, including cyclopamine and HhAntag,
inhibit the proliferation and induce the differentiation of SHH-
subgroup MB in vitro and in vivo (Berman et al., 2002; Romer
et al., 2004). Similarly, BMP4 antagonizes SHH signaling,
induces the neuronal differentiation of GNPs (Rios et al.,
2004), extinguishes protein Atoh1 expression, and inhibits the
proliferation of MBs of the SHH-subgroup (Zhao et al., 2008).
Because human MYC-subgroup MBs lack an active SHH
gene expression signature and do not contain activating muta-
tions in SHH pathway genes, we reasoned that mouse MYC-
subgroup tumors might resist smoothened antagonists. Purified
GNPs from cerebella of P7 wild-type mice, from MYC-subgroup
MB, and from a SHH-subgroup MB derived from Cdkn2c�/�,Trp53Fl/Fl, Nestin-Cre mice were cultured for 3 days, either in
the presence of cyclopamine, BMP4, or a vehicle control. Cells
were then labeled with BrdU and analyzed by FACS with an anti-
body to BrdU. Cyclopamine or BMP4 reduced the S phase frac-
tion of Cdkn2c�/�, Trp53Fl/Fl, Nestin-Cre ‘‘primary’’ tumor cells
by 35% to 85% (Figure 7A). In contrast, tumor cells isolated
from 3 independently derived mouse MYC-subgroup tumors
were insensitive to cyclopamine or BMP4 treatment (Fig-
ure 7A), consistent with the finding that MYC-tumors were
associated with low expression of SHH signature genes (Fig-
ure 7B). Similarly, we saw no inhibition of proliferation of neuro-
spheres from MYC-tumors plated in the constant presence of
SHH signaling inhibitors in the culture medium for 2 weeks
(Figure 7C).
DISCUSSION
Enforced expression of Myc, but not Mycn, in concert with the
loss of Trp53 in GNP-enriched mouse cerebellar progenitor cells
gives rise to tumors that recapitulate themost aggressive form of
human MB. These tumors exhibited neither of the characteristic
gene expression signatures previously ascribed to the SHH- or
ancer Cell 21, 168–180, February 14, 2012 ª2012 Elsevier Inc. 173

Figure 4. Mouse MYC-Subgroup MBs before and after Orthotopic
Transplants
(A) Kaplan-Meier survival curve of mice subjected to orthotopic cranial injec-
tion of decreasing number of Myc- primary tumor cells.
(B–K) Sections of tumors were immunostained with H&E (B and G), Ki67,
a marker of proliferating cells (C and H), cleaved Caspase-3, a marker of
apoptosis (D and I), GFAP, thatmarks glial and neural progenitor cells (E and J),
and synaptophysin that characterizes mature neurons (F and K). Scale bar =
50 mm. See also Figure S5.
Cancer Cell
MYC-Subgroup of Medulloblastoma
WNT-subgroups of the disease (Cho et al., 2011; Northcott et al.,
2011; Thompson et al., 2006). Instead, multitiered analysis of
data comparing the murine tumors with the human MYC-
subgroup revealed convincing similarities in histology, clinical
174 Cancer Cell 21, 168–180, February 14, 2012 ª2012 Elsevier Inc.
behavior, and gene expression between the tumors of both
species.
Marker proteins, including Prom1, Lgr5, Oct4 and Nanog,
found either in embryonic or adult tissue stem cells, as well as
in some ‘‘cancer stem cells,’’ were highly expressed as part of
the defining gene expression signature of Myc-engineered
tumors. Prom1 is a marker of tumor-initiating cells in many
cancers (Curley et al., 2009; Reya et al., 2001; Singh et al.,
2004; Todaro et al., 2010), and Lgr5 is expressed in mitotically
dividing stem cells within the colon and intestinal crypts but
not in their proliferating transient amplifying progeny (Barker
et al., 2007; Zhu et al., 2009). Oct4 and Nanog are considered
markers of pluripotency; although distinct from the ‘‘MYC
expression module’’ (Kim et al., 2010), they can collaborate
with MYC in reprogramming somatic cells to induced pluripotent
stem cells (Takahashi and Yamanaka, 2006). Like those cells
with stem cell characteristics, whose frequencies correlate
with poor prognosis in other cancers (Ben-Porath et al., 2008),
cells from mouse MYC-subgroup MBs could be sequentially
and continuously propagated as cultured neurospheres through
many ex vivo passages. These cells retained tumor-propagating
potential after transplantation into the cortices of recipient mice
and re-induced MBs with the same robust efficiency and
defining cardinal features as the primary MYC-subgroup MBs
from which they were derived. In contrast, tumor cells explanted
from MBs of the SHH-subgroup tend to undergo spontaneous
differentiation in culture, and neurospheres generated from
these tumors rapidly lose their self-renewal capacity when
sequentially passaged (Read et al., 2009; Figure S5). Given
that standard front line therapies fail in children with MYC-
subgroup MBs and such tumors in the mouse are unaffected
by SHH inhibitors now being incorporated into human clinical
trials, the ability to maintain tumor-propagating cells in cultures
from mouse MYC-subgroup MBs may prove useful in establish-
ing a platform for identifying therapeutic drugs.
The generation of an entirely unique subgroup of MB in the
mouse after Myc transduction into Trp53-deficient GNPs (irre-
spective ofCdkn2c loss) was unexpected. In fact, upon embark-
ing on these experiments, a reasonable hypothesis might have
been that ectopically enforced overexpression of Myc would
have had the same effect as overexpression of Mycn, given
that Myc-family proteins bind to the same canonical DNA
consensus sequences (Grandori and Eisenman, 1997) and
interact with similar dimerization partners, co-activators, and
corepressors (Blackwood and Eisenman, 1991; Grandori et al.,
2000). Indeed, despite the fact that Mycn and Myc genes are
differentially expressed in the hindbrain (Zindy et al., 2006) and
that Mycn, but not Myc, is a target of SHH signaling (Kenney
et al., 2003), genetic experiments showed that Mycn can func-
tionally replace Myc in mouse development, proliferation, and
differentiation (Malynn et al., 2000), implying many interchange-
able functions.
The gene expression pattern of the human SHH-subgroup MB
resembles that of GNP cells (Lee et al., 2003) and that of the
WNT-subgroup MB resembles cells derived from the dorsal
brainstem (Gibson et al., 2010), but the gene expression pattern
of the MYC-subgroup of MB, either in mouse or humans, is quite
distinct. This suggests that the latter tumors might arise from
a class of MYC-responsive progenitor cells that differ from those
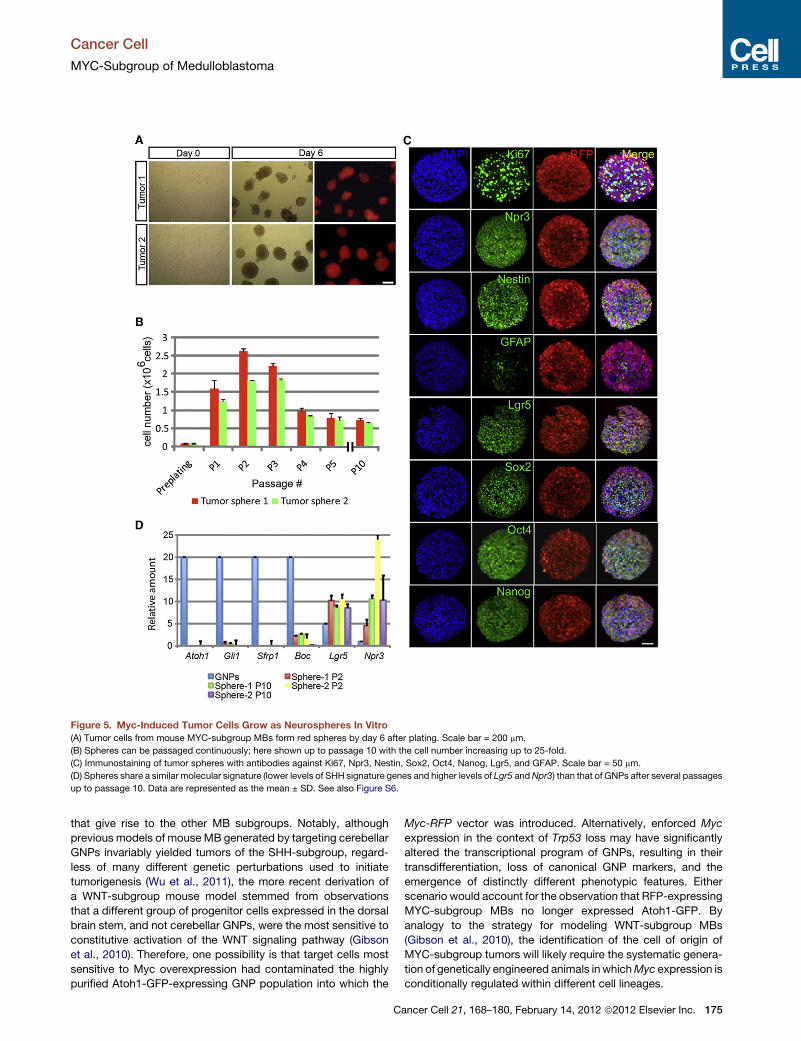
Figure 5. Myc-Induced Tumor Cells Grow as Neurospheres In Vitro
(A) Tumor cells from mouse MYC-subgroup MBs form red spheres by day 6 after plating. Scale bar = 200 mm.
(B) Spheres can be passaged continuously; here shown up to passage 10 with the cell number increasing up to 25-fold.
(C) Immunostaining of tumor spheres with antibodies against Ki67, Npr3, Nestin, Sox2, Oct4, Nanog, Lgr5, and GFAP. Scale bar = 50 mm.
(D) Spheres share a similar molecular signature (lower levels of SHH signature genes and higher levels of Lgr5 andNpr3) than that of GNPs after several passages
up to passage 10. Data are represented as the mean ± SD. See also Figure S6.
Cancer Cell
MYC-Subgroup of Medulloblastoma
that give rise to the other MB subgroups. Notably, although
previous models of mouse MB generated by targeting cerebellar
GNPs invariably yielded tumors of the SHH-subgroup, regard-
less of many different genetic perturbations used to initiate
tumorigenesis (Wu et al., 2011), the more recent derivation of
a WNT-subgroup mouse model stemmed from observations
that a different group of progenitor cells expressed in the dorsal
brain stem, and not cerebellar GNPs, were the most sensitive to
constitutive activation of the WNT signaling pathway (Gibson
et al., 2010). Therefore, one possibility is that target cells most
sensitive to Myc overexpression had contaminated the highly
purified Atoh1-GFP-expressing GNP population into which the
C
Myc-RFP vector was introduced. Alternatively, enforced Myc
expression in the context of Trp53 loss may have significantly
altered the transcriptional program of GNPs, resulting in their
transdifferentiation, loss of canonical GNP markers, and the
emergence of distinctly different phenotypic features. Either
scenario would account for the observation that RFP-expressing
MYC-subgroup MBs no longer expressed Atoh1-GFP. By
analogy to the strategy for modeling WNT-subgroup MBs
(Gibson et al., 2010), the identification of the cell of origin of
MYC-subgroup tumors will likely require the systematic genera-
tion of genetically engineered animals in whichMyc expression is
conditionally regulated within different cell lineages.
ancer Cell 21, 168–180, February 14, 2012 ª2012 Elsevier Inc. 175

Figure 6. Tumor Sphere Cells Contain Tumor-
Propagating Cells
(A) Myc-engineered MBs form after transplant of purified
tumor cells or tumor sphere cells at passage 2 (2 3 105
cells) into the cortices of recipient mice.
(B) Comparison of the expression of RFP, GFP, Ki67,
Npr3, Nestin, Sox2, Oct4, Nanog, and Lgr5 by immuno-
histochemistry between primary MB (Primary MB) and
those induced after transplant of spheres (SecondaryMB).
Scale bar = 50 mm.
(C) Comparison of gene signature among Trp53 tumors,
Myc-primary tumors, and Myc-secondary tumors.
Cancer Cell
MYC-Subgroup of Medulloblastoma
Recent studies have more clearly identified the subgroup of
human MBs that feature highMYC expression and/or amplifica-
tion and carry a dismal prognosis (Cho et al., 2011; Ellison et al.,
2011b; Northcott et al., 2011). Both amplification and overex-
pression ofMYC orMYCN have been associated with poor prog-
nosis in human MB (Pfister et al., 2009). However, in a large
cohort of children studied in the SIOP/PNET3 clinical trial, Ellison
et al. (2011b) recently concluded that amplification of MYC,
rather than MYCN, is associated with the poorest outcome. In
agreement with the latter findings, Myc-induced mouse MBs
were more anaplastic and aggressive than were their Mycn-
induced counterparts, contained a several log-fold higher frac-
tion of tumor-propagating cells, and initiated tumors after
a significantly shorter latency period.
Whereas our finding that Mycn overexpression results in MBs
of the SHH-subgroup seems contradictory to the finding pub-
lished in a recent study by Swartling et al. (2010), which ascribes
Mycn overexpression to the production of a variety of MBs, we
176 Cancer Cell 21, 168–180, February 14, 2012 ª2012 Elsevier Inc.
feel that there are distinctions in the two models
that may explain this discrepancy. The Swar-
tling model links Mycn to a Glt-1 promoter.
Glt-1 is a gene that is not widely expressed by
cells in the external granule layer (EGL) of the
cerebellum, and it is likely that, via Glt-1, Mycn
is influencing a developing cerebellar cell pool
that is distinct from that of the EGL. On the
contrary, in our study Mycn is transfected into
a highly concentrated pool of GNP cells. It
stands to reason that the introduction of
a SHH pathway target member, like Mycn into
GNP/EGL cells, which are particularly sensitive
to SHH stimulated growth, may favor the induc-
tion of SHH-subgroup MB. On the other hand,
MYC—probably because it is not a direct target
of the SHH pathway—appears to have a very
unique and specific effect when transduced
into a similar pool of cerebellar precursor cells.
Mutations of the TP53 gene are found in
human LC/A MBs together withMYC amplifica-
tion (Aldosari et al., 2002; Frank et al., 2004;
Pfister et al., 2009). Although TP53 is frequently
disrupted in LC/A MBs, its loss of function is
observed only infrequently across other
subgroups (Pfaff et al., 2010; Thompson et al.,
2006). Under the conditions used in our mouse
modeling experiments, concurrent deregulation of both Myc
and Trp53 was required to induce MYC-subgroup tumors,
whereas neither was effective alone. The genetic interaction
between MYC and TP53 is known to be important in many
different cancers. Whereas Trp53 represses Myc expression
transcriptionally, miss-regulation ofMyc abrogates Trp53-medi-
ated cell cycle arrest through the repression of inhibitors of CDKs
(Hoffman and Liebermann, 2008). Overexpression of Myc also
induces Trp53-dependent apoptosis (Hermeking and Eick,
1994; Wagner et al., 1994), but when accompanied by either
Trp53 mutation or bi-allelic Arf deletion, Myc can readily
generate immortalized tumor cells (Eischen et al., 1999; Hemann
et al., 2005; Zindy et al., 1998).
Sublethal ionizing irradiation of Trp53 null mice at P5–P7 is
sufficient to induce MBs of the SHH-subgroup with very high
penetrance, implying that in this setting, the primary function of
Trp53 is to eliminate rapidly proliferating GNPs that have sus-
tained DNA damage (Uziel et al., 2005). Inactivation of Trp53

Figure 7. Myc-Tumor Cells Are Resistant to SHHSignaling Inhibitors
(A) GNPs purified from the cerebellum from 7-day-old pups and purified tumor
cells were grown in serum-free medium in the absence (Control, black square)
Cancer Cell
MYC-Subgroup of Medulloblastoma
C
similarly accelerates MB formation in Ptch1 heterozygous mice,
a context in whichArf deletion has no such effect (Wetmore et al.,
2001). Although Arf is induced by high-signaling thresholds
conveyed by constitutively activated oncogenes, including
Myc (Zindy et al., 1998),Arf is not induced by acute DNA damage
(Kamijo et al., 1997). Moreover, Atoh1-expressing, proliferating
GNPsnormally express relatively high levels of Bmi1, a polycomb
protein suppressor of the Ink4a/Arf locus (Bruggeman et al.,
2005). If the cell of origin of Myc-induced tumors is not an
Atoh1-expressing GNP, this begs the question of whether Arf
null mice, like those lacking Trp53, might be predisposed to
MYC-subgroup MB formation. Conceivably, other mutations in
the Trp53 signaling network might also substitute for inactivation
of Trp53 itself. Next-generation sequencing and comprehensive
analysis of the methylome of primary MYC-subgroup human
MBs should shed light on this issue.
In summary, the generation of a mouse model of MYC-
subgroup MB is of particular importance, because it mimics
the most aggressive subgroup of human MBs that remain the
least responsive to therapy (Ellison et al., 2011b). The model
provides an opportunity to further explore the identity of the
progenitor cells from which these tumors arise and screen for
molecules that may offer improved therapeutic impact.
EXPERIMENTAL PROCEDURES
A detailed description of the Experimental Procedures utilized in this work can
be found in the Supplemental Experimental Procedures (available online).
Mouse Strains and Animal Husbandry
Cdkn2c�/�, Trp53�/�, Atoh1-GFP mice were generated by breeding
Cdkn2c�/�; Trp53�/� animals (Uziel et al., 2005) with Atoh1-GFP trans-
genic mice (Lumpkin et al., 2003). Other mice used in this study were
Cdkn2c�/�; Ptch1+/� (Uziel et al., 2005), Cdkn2c�/�; Trp53Fl/Fl; Nestin-Cre,and CTNNB1+/lox (ex3); BLBP-Cre; Trp53Fl/Fl (Gibson et al., 2010). All animal
work was performed under established guidelines and supervision by the St.
Jude Children’s Research Hospital’s Institutional Animal Care and Use
Committee, as required by the United States Animal Welfare Act and the
National Institutes of Health’s policy to ensure proper care and use of labora-
tory animals for research.
GNP Culture, Retrovirus Production, and Infection
Purification of GNPs and other progenitor populations, retrovirus production,
infections, and orthotopic transplants were performed as previously described
(Ayrault et al., 2010). Mouse stem cell virus (MSCV)-based retroviruses encode
the red fluorescent protein (RFP) in cis expressed from an internal ribosomal
entry site. These viruses either express RFP alone or co-express mouse
Myc or Mycn cDNA inserted downstream of the MSCV-LTR. Infection effi-
ciency was analyzed using FACS for RFP and GFP expression. In some exper-
iments, 2 days after plating, infected GNPs were harvested and transplanted
into the cerebella or cortices of CD-1 nu/nu mice (Charles River Laboratories,
Wilmington, MA, USA). In other experiments, GNP-enriched cerebellar cells
or the presence of cyclopamine (light gray square) or BMP4 (dark gray square).
Proliferation was assessed by FACS by calculating the percent of BrdU
positive cells. Proliferation index was defined as the ratio of the percentage of
BrdU-incorporated cells with SHH signaling antagonists to that of control.
(B) GNPs and tumor cells were analyzed by qRT-PCR for specific gene
expression to validate the expression of genes in the SHH signaling pathway.
(C) Treatment of MYC-tumor sphere cells with or without SHH signaling
antagonists under neurosphere culture conditions. Proliferation index repre-
sents the ratio of cell number of cultured neurosphere cells with SHH signaling
antagonists to that of control, 6 and 12 days after plating. Data in graphs A and
C represent the mean ± SD.
ancer Cell 21, 168–180, February 14, 2012 ª2012 Elsevier Inc. 177

Cancer Cell
MYC-Subgroup of Medulloblastoma
were sorted by FACS based on GFP expression immediately after purification.
GFP+ and GFP- populations were independently infected with Myc-carrying
retroviruses, and 5 3 104 infected cells from each population were trans-
planted into the cortices of mice 2 days after infection.
Orthotopic Transplants
Transplantation of infected GNP-enriched cerebellar cells into the cortices or
cerebellum of nude recipient mice was performed essentially as described
previously (Ayrault et al., 2010). After transplant of virus-infected progenitor
cells, mice were examined daily for symptoms of sickness (doming of the
head or ataxia or reduced activity). In some instances, purified MB cells or
cultured tumor sphere cells from MYC-tumors were injected back into the
cortices of naıve nu/nu recipient animals.
Tumor Cell Culture and BrdU Analysis
We analyzed progenitors purified from P7 wild-type mice and tumor cells from
three independently derivedMyc-engineered MBs andMBs arising spontane-
ously inCdkn2c�/�; Trp53Fl/Fl;Nestin-Cremice. Purified GNPs and tumor cells
were plated at 83 105 cells/well on a Matrigel-coated 24-well plate and grown
as previously described (Zhao et al., 2008). GNPs were treated with SHH,
whereas tumor cells were not. Both cell populations were cultured in the pres-
ence or absence of SHH signaling inhibitors, 2.5 mM cyclopamine (LC Labora-
tories, Woburn, MA, USA), or 100 ng/ml BMP4 (R&D Systems). The medium
was changed every 24 hr. Three days after initiation of culture, BrdU was
added to the culture medium at a final concentration of 10 mM, and cells
were harvested 2.5 hr later. Cells that incorporated BrdU were stained with
an anti-BrdU antibody using a BrdU-APC flow kit (BD Bioscience, San Jose,
CA, USA) and analyzed by FACS.
Histopathology, Immunohistochemistry, and Immunoblotting
For histopathology, samples of murine MBs (three separate tumors for each
genotype) were formalin-fixed, paraffin-embedded, and sectioned at 5 mm
thickness. For each sample, a section was stained using a standard hematox-
ylin and eosin (H&E) protocol; a second section was stained for apoptotic cells,
using the ApopTag kit (Millipore, Billerica, MA, USA) with peroxidase detection
of TUNEL labeling. Representative images of each sample/stain combination
were captured (under oil immersion at 403 original magnification) and
analyzed using Axiovision software (Carl Zeiss Microscopy, Thornwood, NY,
USA). A single observer scored each tumor for apoptotic index (percentage
of positive cells following ApopTag labeling) and nuclear area as previously
described (McManamy et al., 2003).
For immunoblotting, purified GNPs from the cerebellum of P7 wild-type
mice or Myc- and Mycn-engineered MB cells were lysed and proteins sub-
jected to immunoblotting as described previously (Zindy et al., 2007).
Procedures and antibodies used for immunohistochemistry and antibodies
for immunoblotting are provided in the Supplemental Experimental
Procedures.
Affymetrix Microarray Analysis
RNA from GNPs or tumor cells were subjected to hybridization using Affyme-
trix Mouse Genechips 430 (version 2; e.g., Figures 2 and 3). For comparative
gene expression analysis between primary and secondary Myc-engineered
tumors, we used Affymetrix Mouse Genechips HT430PM (e.g., Figure 7C).
Microarray results were validated by qRT-PCR using PCR primers shown in
the Supplemental Experimental Procedures.
Neurosphere Assays
Tumor cells were cultured under conditions described previously (Taylor et al.,
2005). Briefly, cells from Myc-engineered tumors were purified and plated on
an ultra-low attachment dish at 53 104 cells/ml or 13 105 cells/well per 6-well
plate. Human recombinant basic FGF and EGF (Peprotech, Rocky Hill, NJ,
USA) were added into the culture medium every 3 days. One week later, tumor
spheres were harvested, pooled, and dissociated with trypsin (Invitrogen,
Grand Island, NY, USA), and total cell numbers were determined. In parallel,
1 3 105 of the dissociated cells were plated again and cultured under the
same conditions. Total RNA was extracted from the reminder of the cultured
cells followed by qRT-PCR analysis of selected RNAs. To test the role of
178 Cancer Cell 21, 168–180, February 14, 2012 ª2012 Elsevier Inc.
SHH-antagonists, Myc-engineered tumor cells were cultured in the presence
of 2.5 mM cyclopamine or 100 ng/ml BMP4.
ACCESSION NUMBERS
Affymetrix data for mouseMBs using 430V2 and HT430PM chips can be found
in the GenBank database numbers GSE33199 and GSE33200, respectively.
SUPPLEMENTAL INFORMATION
Supplemental Information includes six figures and Supplemental Experimental
Procedures and can be found with this article online at doi:10.1016/j.ccr.2011.
12.023.
ACKNOWLEDGMENTS
We thank Dr. Robert Eisenman for helpful suggestions; Dr. Charles J. Sherr for
editing of the manuscript; Dr. Frederique Zindy for mice; Shelly Wilkerson,
Sarah Gayso, and Jennifer Craig for excellent technical assistance; John
Morris for Affymetrix microarrays; Drs. Richard Ashmun and Ann-Marie
Hamilton-Easton for FACS analysis; Dr. Chris Calabrese, John Killmar, and
Melissa Johnson for orthotopic transplants; and Pamela Johnson and Dorothy
Bush for immunohistochemistry of tumor tissues. This work was funded in part
by the National Institutes of Health (grant CA-096832 to M.F.R. and CA-21765
to R.J.G. and M.F.R.), the American Brain Tumor Association (T.U.), the
Mochida Foundation (D.K.), the Anderson fellowship (D.K.), and the American
Lebanese Syrian Associated Charities of St. Jude Children’s Research
Hospital.
Received: July 8, 2011
Revised: November 2, 2011
Accepted: December 20, 2011
Published: February 13, 2012
REFERENCES
Aldosari, N., Bigner, S.H., Burger, P.C., Becker, L., Kepner, J.L., Friedman,
H.S., and McLendon, R.E. (2002). MYCC and MYCN oncogene amplification
in medulloblastoma. A fluorescence in situ hybridization study on paraffin
sections from the Children’s Oncology Group. Arch. Pathol. Lab. Med. 126,
540–544.
Ayrault, O., Zhao, H., Zindy, F., Qu, C., Sherr, C.J., and Roussel, M.F. (2010).
Atoh1 inhibits neuronal differentiation and collaborates with Gli1 to generate
medulloblastoma-initiating cells. Cancer Res. 70, 5618–5627.
Barker, N., van Es, J.H., Kuipers, J., Kujala, P., van den Born, M., Cozijnsen,
M., Haegebarth, A., Korving, J., Begthel, H., Peters, P.J., and Clevers, H.
(2007). Identification of stem cells in small intestine and colon by marker
gene Lgr5. Nature 449, 1003–1007.
Ben-Porath, I., Thomson, M.W., Carey, V.J., Ge, R., Bell, G.W., Regev, A., and
Weinberg, R.A. (2008). An embryonic stem cell-like gene expression signature
in poorly differentiated aggressive human tumors. Nat. Genet. 40, 499–507.
Berman, D.M., Karhadkar, S.S., Hallahan, A.R., Pritchard, J.I., Eberhart, C.G.,
Watkins, D.N., Chen, J.K., Cooper, M.K., Taipale, J., Olson, J.M., and Beachy,
P.A. (2002). Medulloblastoma growth inhibition by hedgehog pathway
blockade. Science 297, 1559–1561.
Blackwood, E.M., and Eisenman, R.N. (1991). Max: a helix-loop-helix zipper
protein that forms a sequence-specific DNA-binding complex with Myc.
Science 251, 1211–1217.
Bruggeman, S.W., Valk-Lingbeek, M.E., van der Stoop, P.P., Jacobs, J.J.,
Kieboom, K., Tanger, E., Hulsman, D., Leung, C., Arsenijevic, Y., Marino, S.,
and van Lohuizen, M. (2005). Ink4a and Arf differentially affect cell proliferation
and neural stem cell self-renewal in Bmi1-deficient mice. Genes Dev. 19,
1438–1443.
Cho, Y.J., Tsherniak, A., Tamayo, P., Santagata, S., Ligon, A., Greulich, H.,
Berhoukim, R., Amani, V., Goumnerova, L., Eberhart, C.G., et al. (2011).

Cancer Cell
MYC-Subgroup of Medulloblastoma
Integrative genomic analysis of medulloblastoma identifies a molecular
subgroup that drives poor clinical outcome. J. Clin. Oncol. 29, 1424–1430.
Curley, M.D., Therrien, V.A., Cummings, C.L., Sergent, P.A., Koulouris, C.R.,
Friel, A.M., Roberts, D.J., Seiden, M.V., Scadden, D.T., Rueda, B.R., and
Foster, R. (2009). CD133 expression defines a tumor initiating cell population
in primary human ovarian cancer. Stem Cells 27, 2875–2883.
Eischen, C.M., Weber, J.D., Roussel, M.F., Sherr, C.J., and Cleveland, J.L.
(1999). Disruption of the ARF-Mdm2-p53 tumor suppressor pathway in Myc-
induced lymphomagenesis. Genes Dev. 13, 2658–2669.
Ellison, D.W., Onilude, O.E., Lindsey, J.C., Lusher, M.E., Weston, C.L., Taylor,
R.E., Pearson, A.D., and Clifford, S.C.; United Kingdom Children’s Cancer
Study Group Brain Tumour Committee. (2005). beta-Catenin status predicts
a favorable outcome in childhood medulloblastoma: the United Kingdom
Children’s Cancer Study Group Brain Tumour Committee. J. Clin. Oncol. 23,
7951–7957.
Ellison, D.W., Dalton, J., Kocak, M., Nicholson, S.L., Fraga, C., Neale, G.,
Kenney, A.M., Brat, D.J., Perry, A., Yong, W.H., et al. (2011a).
Medulloblastoma: clinicopathological correlates of SHH, WNT, and non-
SHH/WNT molecular subgroups. Acta Neuropathol. 121, 381–396.
Ellison, D.W., Kocak, M., Dalton, J., Megahed, H., Lusher, M.E., Ryan, S.L.,
Zhao, W., Nicholson, S.L., Taylor, R.E., Bailey, S., and Clifford, S.C. (2011b).
Definition of disease-risk stratification groups in childhood medulloblastoma
using combined clinical, pathologic, and molecular variables. J. Clin. Oncol.
29, 1400–1407.
Frank, A.J., Hernan, R., Hollander, A., Lindsey, J.C., Lusher, M.E., Fuller, C.E.,
Clifford, S.C., and Gilbertson, R.J. (2004). The TP53-ARF tumor suppressor
pathway is frequently disrupted in large/cell anaplastic medulloblastoma.
Brain Res. Mol. Brain Res. 121, 137–140.
Gajjar, A., Chintagumpala, M., Ashley, D., Kellie, S., Kun, L.E., Merchant, T.E.,
Woo, S., Wheeler, G., Ahern, V., Krasin, M.J., et al. (2006). Risk-adapted cra-
niospinal radiotherapy followed by high-dose chemotherapy and stem-cell
rescue in children with newly diagnosed medulloblastoma (St Jude
Medulloblastoma-96): long-term results from a prospective, multicentre trial.
Lancet Oncol. 7, 813–820.
Gibson, P., Tong, Y., Robinson, G., Thompson, M.C., Currle, D.S., Eden, C.,
Kranenburg, T.A., Hogg, T., Poppleton, H., Martin, J., et al. (2010). Subtypes
of medulloblastoma have distinct developmental origins. Nature 468, 1095–
1099.
Grandori, C., and Eisenman, R.N. (1997). Myc target genes. Trends Biochem.
Sci. 22, 177–181.
Grandori, C., Cowley, S.M., James, L.P., and Eisenman, R.N. (2000). The Myc/
Max/Mad network and the transcriptional control of cell behavior. Annu. Rev.
Cell Dev. Biol. 16, 653–699.
Hemann, M.T., Bric, A., Teruya-Feldstein, J., Herbst, A., Nilsson, J.A., Cordon-
Cardo, C., Cleveland, J.L., Tansey, W.P., and Lowe, S.W. (2005). Evasion of
the p53 tumour surveillance network by tumour-derived MYC mutants.
Nature 436, 807–811.
Hermeking, H., and Eick, D. (1994). Mediation of c-Myc-induced apoptosis by
p53. Science 265, 2091–2093.
Hoffman, B., and Liebermann, D.A. (2008). Apoptotic signaling by c-MYC.
Oncogene 27, 6462–6472.
Johnson, R.A., Wright, K.D., Poppleton, H., Mohankumar, K.M., Finkelstein,
D., Pounds, S.B., Rand, V., Leary, S.E., White, E., Eden, C., et al. (2010).
Cross-species genomics matches driver mutations and cell compartments
to model ependymoma. Nature 466, 632–636.
Kamijo, T., Zindy, F., Roussel, M.F., Quelle, D.E., Downing, J.R., Ashmun, R.A.,
Grosveld, G., and Sherr, C.J. (1997). Tumor suppression at the mouse INK4a
locus mediated by the alternative reading frame product p19ARF. Cell 91,
649–659.
Kenney, A.M., Cole, M.D., and Rowitch, D.H. (2003). Nmyc upregulation by
sonic hedgehog signaling promotes proliferation in developing cerebellar
granule neuron precursors. Development 130, 15–28.
C
Kim, J., Woo, A.J., Chu, J., Snow, J.W., Fujiwara, Y., Kim, C.G., Cantor, A.B.,
and Orkin, S.H. (2010). A Myc network accounts for similarities between
embryonic stem and cancer cell transcription programs. Cell 143, 313–324.
Knoepfler, P.S., Cheng, P.F., and Eisenman, R.N. (2002). N-myc is essential
during neurogenesis for the rapid expansion of progenitor cell populations
and the inhibition of neuronal differentiation. Genes Dev. 16, 2699–2712.
Kool, M., Koster, J., Bunt, J., Hasselt, N.E., Lakeman, A., van Sluis, P., Troost,
D., Meeteren, N.S., Caron, H.N., Cloos, J., et al. (2008). Integrated genomics
identifies five medulloblastoma subtypes with distinct genetic profiles,
pathway signatures and clinicopathological features. PLoS ONE 3, e3088.
Lam, C.W., Xie, J., To, K.F., Ng, H.K., Lee, K.C., Yuen, N.W., Lim, P.L., Chan,
L.Y., Tong, S.F., and McCormick, F. (1999). A frequent activated smoothened
mutation in sporadic basal cell carcinomas. Oncogene 18, 833–836.
Lee, A., Kessler, J.D., Read, T.A., Kaiser, C., Corbeil, D., Huttner, W.B.,
Johnson, J.E., and Wechsler-Reya, R.J. (2005). Isolation of neural stem cells
from the postnatal cerebellum. Nat. Neurosci. 8, 723–729.
Lee, Y., Miller, H.L., Jensen, P., Hernan, R., Connelly, M., Wetmore, C., Zindy,
F., Roussel, M.F., Curran, T., Gilbertson, R.J., and McKinnon, P.J. (2003). A
molecular fingerprint for medulloblastoma. Cancer Res. 63, 5428–5437.
Lumpkin, E.A., Collisson, T., Parab, P., Omer-Abdalla, A., Haeberle, H., Chen,
P., Doetzlhofer, A., White, P., Groves, A., Segil, N., and Johnson, J.E. (2003).
Math1-driven GFP expression in the developing nervous system of transgenic
mice. Gene Expr. Patterns 3, 389–395.
Malynn, B.A., de Alboran, I.M., O’Hagan, R.C., Bronson, R., Davidson, L.,
DePinho, R.A., and Alt, F.W. (2000). N-myc can functionally replace c-myc in
murine development, cellular growth, and differentiation. Genes Dev. 14,
1390–1399.
McManamy, C.S., Lamont, J.M., Taylor, R.E., Cole, M., Pearson, A.D., Clifford,
S.C., and Ellison, D.W.; United Kingdom Children’s Cancer Study Group.
(2003). Morphophenotypic variation predicts clinical behavior in childhood
non-desmoplastic medulloblastomas. J. Neuropathol. Exp. Neurol. 62,
627–632.
Northcott, P.A., Korshunov, A.,Witt, H., Hielscher, T., Eberhart, C.G.,Mack, S.,
Bouffet, E., Clifford, S.C., Hawkins, C.E., French, P., et al. (2011).
Medulloblastoma comprises four distinct molecular variants. J. Clin. Oncol.
29, 1408–1414.
Pfaff, E., Remke, M., Sturm, D., Benner, A., Witt, H., Milde, T., von Bueren,
A.O., Wittmann, A., Schottler, A., Jorch, N., et al. (2010). TP53 mutation is
frequently associated with CTNNB1 mutation or MYCN amplification and is
compatible with long-term survival in medulloblastoma. J. Clin. Oncol. 28,
5188–5196.
Pfister, S., Remke, M., Benner, A., Mendrzyk, F., Toedt, G., Felsberg, J.,
Wittmann, A., Devens, F., Gerber, N.U., Joos, S., et al. (2009). Outcome
prediction in pediatric medulloblastoma based on DNA copy-number aberra-
tions of chromosomes 6q and 17q and theMYC andMYCN loci. J. Clin. Oncol.
27, 1627–1636.
Raffel, C., Jenkins, R.B., Frederick, L., Hebrink, D., Alderete, B., Fults, D.W.,
and James, C.D. (1997). Sporadic medulloblastomas contain PTCH muta-
tions. Cancer Res. 57, 842–845.
Read, T.A., Fogarty, M.P., Markant, S.L., McLendon, R.E., Wei, Z., Ellison,
D.W., Febbo, P.G., and Wechsler-Reya, R.J. (2009). Identification of CD15
as a marker for tumor-propagating cells in a mouse model of medulloblas-
toma. Cancer Cell 15, 135–147.
Reya, T., Morrison, S.J., Clarke, M.F., and Weissman, I.L. (2001). Stem cells,
cancer, and cancer stem cells. Nature 414, 105–111.
Rich, J.N. (2009). Brain Tumor Stem Cell Markers (New York: Humana Press).
Rios, I., Alvarez-Rodrıguez, R., Martı, E., and Pons, S. (2004). Bmp2 antago-
nizes sonic hedgehog-mediated proliferation of cerebellar granule neurones
through Smad5 signalling. Development 131, 3159–3168.
Romer, J.T., Kimura, H., Magdaleno, S., Sasai, K., Fuller, C., Baines, H.,
Connelly, M., Stewart, C.F., Gould, S., Rubin, L.L., and Curran, T. (2004).
Suppression of the Shh pathway using a small molecule inhibitor eliminates
medulloblastoma in Ptc1(+/-)p53(-/-) mice. Cancer Cell 6, 229–240.
ancer Cell 21, 168–180, February 14, 2012 ª2012 Elsevier Inc. 179

Cancer Cell
MYC-Subgroup of Medulloblastoma
Roussel, M.F., and Hatten, M.E. (2011). Cerebellum development and medul-
loblastoma. Curr. Top. Dev. Biol. 94, 235–282.
Schuller, U., Heine, V.M., Mao, J., Kho, A.T., Dillon, A.K., Han, Y.G., Huillard,
E., Sun, T., Ligon, A.H., Qian, Y., et al. (2008). Acquisition of granule neuron
precursor identity is a critical determinant of progenitor cell competence to
form Shh-induced medulloblastoma. Cancer Cell 14, 123–134.
Silva, J., and Smith, A. (2008). Capturing pluripotency. Cell 132, 532–536.
Singh, S.K., Hawkins, C., Clarke, I.D., Squire, J.A., Bayani, J., Hide, T.,
Henkelman, R.M., Cusimano, M.D., and Dirks, P.B. (2004). Identification of
human brain tumour initiating cells. Nature 432, 396–401.
Swartling, F.J., Grimmer, M.R., Hackett, C.S., Northcott, P.A., Fan, Q.W.,
Goldenberg, D.D., Lau, J., Masic, S., Nguyen, K., Yakovenko, S., et al.
(2010). Pleiotropic role for MYCN in medulloblastoma. Genes Dev. 24, 1059–
1072.
Takahashi, K., and Yamanaka, S. (2006). Induction of pluripotent stem cells
from mouse embryonic and adult fibroblast cultures by defined factors. Cell
126, 663–676.
Taylor, M.D., Poppleton, H., Fuller, C., Su, X., Liu, Y., Jensen, P., Magdaleno,
S., Dalton, J., Calabrese, C., Board, J., et al. (2005). Radial glia cells are candi-
date stem cells of ependymoma. Cancer Cell 8, 323–335.
Thompson, M.C., Fuller, C., Hogg, T.L., Dalton, J., Finkelstein, D., Lau, C.C.,
Chintagumpala, M., Adesina, A., Ashley, D.M., Kellie, S.J., et al. (2006).
Genomics identifiesmedulloblastoma subgroups that are enriched for specific
genetic alterations. J. Clin. Oncol. 24, 1924–1931.
Todaro, M., Francipane, M.G., Medema, J.P., and Stassi, G. (2010). Colon
cancer stem cells: promise of targeted therapy. Gastroenterology 138,
2151–2162.
Uziel, T., Zindy, F., Xie, S., Lee, Y., Forget, A., Magdaleno, S., Rehg, J.E.,
Calabrese, C., Solecki, D., Eberhart, C.G., et al. (2005). The tumor suppressors
Ink4c and p53 collaborate independently with Patched to suppress medullo-
blastoma formation. Genes Dev. 19, 2656–2667.
180 Cancer Cell 21, 168–180, February 14, 2012 ª2012 Elsevier Inc.
Wagner, A.J., Kokontis, J.M., and Hay, N. (1994). Myc-mediated apoptosis
requires wild-type p53 in a manner independent of cell cycle arrest and the
ability of p53 to induce p21waf1/cip1. Genes Dev. 8, 2817–2830.
Wetmore, C., Eberhart, D.E., and Curran, T. (2001). Loss of p53 but not ARF
accelerates medulloblastoma in mice heterozygous for patched. Cancer
Res. 61, 513–516.
Wu, X., Northcott, P.A., Croul, S., and Taylor, M.D. (2011). Mouse models of
medulloblastoma. Chin J Cancer 30, 442–449.
Yang, Z.J., Ellis, T., Markant, S.L., Read, T.A., Kessler, J.D., Bourboulas, M.,
Schuller, U., Machold, R., Fishell, G., Rowitch, D.H., et al. (2008).
Medulloblastoma can be initiated by deletion of Patched in lineage-restricted
progenitors or stem cells. Cancer Cell 14, 135–145.
Zhao, H., Ayrault, O., Zindy, F., Kim, J.H., and Roussel, M.F. (2008). Post-tran-
scriptional down-regulation of Atoh1/Math1 by bone morphogenic proteins
suppresses medulloblastoma development. Genes Dev. 22, 722–727.
Zhu, L., Gibson, P., Currle, D.S., Tong, Y., Richardson, R.J., Bayazitov, I.T.,
Poppleton, H., Zakharenko, S., Ellison, D.W., and Gilbertson, R.J. (2009).
Prominin 1 marks intestinal stem cells that are susceptible to neoplastic trans-
formation. Nature 457, 603–607.
Zindy, F., Eischen, C.M., Randle, D.H., Kamijo, T., Cleveland, J.L., Sherr, C.J.,
and Roussel, M.F. (1998). Myc signaling via the ARF tumor suppressor regu-
lates p53-dependent apoptosis and immortalization. Genes Dev. 12, 2424–
2433.
Zindy, F., Knoepfler, P.S., Xie, S., Sherr, C.J., Eisenman, R.N., and Roussel,
M.F. (2006). N-Myc and the cyclin-dependent kinase inhibitors p18Ink4c and
p27Kip1 coordinately regulate cerebellar development. Proc. Natl. Acad.
Sci. USA 103, 11579–11583.
Zindy, F., Uziel, T., Ayrault, O., Calabrese, C., Valentine, M., Rehg, J.E.,
Gilbertson, R.J., Sherr, C.J., and Roussel, M.F. (2007). Genetic alterations in
mouse medulloblastomas and generation of tumors de novo from primary
cerebellar granule neuron precursors. Cancer Res. 67, 2676–2684.

Cancer Cell
Article
VEGF-D Promotes Tumor Metastasisby Regulating Prostaglandins Producedby the Collecting Lymphatic EndotheliumTara Karnezis,1,2,4,10 Ramin Shayan,1,2,4,5,6,10 Carol Caesar,1,2,4 Sally Roufail,1,2,4 Nicole C. Harris,1,2,4,5
Kathryn Ardipradja,1,2,4 You Fang Zhang,1,2,4 Steven P. Williams,1,2,4,5 Rae H. Farnsworth,1,2,4 Ming G. Chai,7
Thusitha W.T. Rupasinghe,3 Dedreia L. Tull,3 Megan E. Baldwin,8 Erica K. Sloan,7 Stephen B. Fox,2,9 Marc G. Achen,1,2,4
and Steven A. Stacker1,2,4,*1Tumour Angiogenesis Program, Peter MacCallum Cancer Centre, East Melbourne, Victoria 3002, Australia2Sir Peter MacCallum Department of Oncology3Metabolomics Australia, Bio21 Institute for Molecular Science and Biotechnology
The University of Melbourne, Parkville, Victoria 3010, Australia4Ludwig Institute for Cancer Research, Royal Melbourne Hospital, Parkville, Victoria 3050, Australia5Department of Surgery, Royal Melbourne Hospital6Jack Brockhoff Reconstructive Plastic Surgery Research Unit, Royal Melbourne Hospital and Department of Anatomy and Cell Biology
The University of Melbourne, Parkville, Victoria 3050, Australia7Monash Institute of Pharmaceutical Sciences, Monash University, Parkville, Victoria 3052, Australia8Circadian Technologies Limited, Vegenics Pty Ltd., Toorak, Victoria 3142, Australia9Department of Pathology, Peter MacCallum Cancer Centre, East Melbourne, Victoria 3002, Australia10These authors contributed equally to this work*Correspondence: [email protected]
DOI 10.1016/j.ccr.2011.12.026
SUMMARY
Lymphatic metastasis is facilitated by lymphangiogenic growth factors VEGF-C and VEGF-D that aresecreted by some primary tumors. We identified regulation of PGDH, the key enzyme in prostaglandin catab-olism, in endothelial cells of collecting lymphatics, as a key molecular change during VEGF-D-driven tumorspread. The VEGF-D-dependent regulation of the prostaglandin pathway was supported by the findingthat collecting lymphatic vessel dilation and subsequent metastasis were affected by nonsteroidal anti-inflammatory drugs (NSAIDs), known inhibitors of prostaglandin synthesis. Our data suggest a control pointfor cancer metastasis within the collecting lymphatic endothelium, which links VEGF-D/VEGFR-2/VEGFR-3and the prostaglandin pathways. Collecting lymphatics therefore play an active and important role inmetastasis and may provide a therapeutic target to restrict tumor spread.
INTRODUCTION
The lethality of cancer is primarily associated with metastasis,
the spread of cancer cells from a primary site to distant organs
(Liotta, 1992). The spread of tumor cells to lymph nodes (LNs)
is an important prognostic indicator for disease staging, and
thus the lymphatic vasculature is considered a route of meta-
Significance
The lymphangiogenic growth factor VEGF-D promotes cancElevated VEGF-D levels in human tumors correlate with lympnisms underlying lymphogenous spread to lymph nodes remadraining primary tumors to sentinel lymph nodes identified a liVEGF-D modulates prostaglandin levels to regulate collectingkey interaction between lymphangiogenic factors and prostaglfor tumor cell dissemination, and a mechanism by which NSAvessels may therefore constitute a therapeutic target for preve
C
static spread (Achen and Stacker, 2008). However, it is note-
worthy that systemic metastasis can occur independently of
LN spread highlighting the complex nature of the process of
systemic disease (Sleeman et al., 2011).
Some tumors secrete lymphangiogenic growth factors that act
on the lymphatic vasculature to facilitate metastasis. These
factors can induce lymphangiogenesis, that is, the formation of
er spread via the lymphatics, a crucial step in metastasis.h node metastasis and poor patient prognosis, yet mecha-in elusive. Transcriptional profiling of collecting lymphaticsnk between VEGF-D-signaling and prostaglandin pathways.lymphatic vessel dilation, an effect blocked by NSAIDs. Thisandins reveals a mechanism for preparing collecting vesselsIDs reduce lymphogenous metastasis. Collecting lymphaticntion and treatment of metastatic disease.
ancer Cell 21, 181–195, February 14, 2012 ª2012 Elsevier Inc. 181

A B C
D
F G
H I
J K
L
M NO P
E
Figure 1. Lymphangiogenic Growth Factors Induce Collecting Lymphatic Vessel Dilation
(A) Representative image of the skin-flank 293EBNA tumor model, indicating primary tumor and the CLV (white dashed arrow) draining to the SLN.
(B and C) Representative images of flank skin containing the tumor-draining CLV stained for the lymphatic marker podoplanin, from mice bearing metastatic
VEGF-D-293EBNA tumors (B) and nonmetastatic 293EBNA tumors (C). A, artery; CLV, collecting lymphatic vessel (arrowheads in C); V, vein. Scale bars: 200 mm.
(D and E) Hematoxylin and eosin (H&E) staining of LNs containing afferent CLVs. A dilated afferent CLV (arrowhead) can be seen in a patient with VEGF-D-positive
metastatic breast carcinoma, (D) compared to a nonmetastatic control LN, which has a nondilated afferent collecting lymphatic (arrowhead) (E). CLV, collecting
lymphatic vessel. Scale bars: 100 mm.
(F) Representative images of flank skin highlightingCLVs (black arrows) frommice bearing nonmetastatic andmetastatic 66cl4mammary adenocarcinoma. Scale
bars: 1 mm.
(G) Quantitative analysis of CLV diameter inmice bearing nonmetastatic andmetastatic 66cl4mammary adenocarcinoma. Data aremean ± SEM; nR 5. *p < 0.05
by t test.
Cancer Cell
PGs Regulate Metastasis in Collecting Lymphatics
182 Cancer Cell 21, 181–195, February 14, 2012 ª2012 Elsevier Inc.

Cancer Cell
PGs Regulate Metastasis in Collecting Lymphatics
new lymphatics from preexisting vessels, in regions within or
immediately adjacent to, a primary tumor (Tammela and Alitalo,
2010). They can affect vessels beyond the tumor environ-
ment, such as those within the sentinel lymph node (SLN)
(Farnsworth et al., 2011) and can modulate immune responses
to the tumor (Tammela and Alitalo, 2010). Despite its clinical
implications, the mechanisms underpinning metastasis via the
lymphatic network are not well understood.
Lymphaniogenic growth factors include two vascular endo-
thelial growth factor (VEGF) family members, VEGF-C and
VEGF-D, which act through the cell surface-localized receptor
tyrosine kinases VEGFR-2 and VEGFR-3 (Joukov et al., 1996;
Achen et al., 1998; Makinen et al., 2001). There is a strong
association between elevated tumor expression of VEGF-C or
VEGF-D, increased tumor lymphatic vessel density and
enhanced rates of metastasis to LNs (Achen and Stacker, 2008).
The VEGF-C- or VEGF-D-signaling axes are pivotal in control-
ling lymphangiogenesis during cancer. Tumor models demon-
strate that inhibiting this signaling may block lymphogenous
cancer spread by restricting lymphatic vessel formation (Stacker
et al., 2001; He et al., 2005; Hoshida et al., 2006). In addition,
other VEGF-independent signaling pathways may operate in
lymphatic endothelial cells (LECs) or associated cells such as
mural cells or pericytes (Cao et al., 2004; Achen and Stacker,
2006).
The lymphatic network is a well-characterized hierarchy of
vessels, beginning as initial lymphatics in the superficial dermis
that drain into deep dermal precollecting lymphatic vessels,
which, in turn, drain into subcutaneous collecting lymphatic
vessels (CLVs) (Oliver and Alitalo, 2005). Individual lymphatic
vessel subtypes perform distinct, specialized functions; the
smaller initial lymphatics perform an absorptive role, whereas
precollector vessels guide lymph down to CLVs, a conduit to
the draining LN basin (Shayan et al., 2006). These features are
reflected in their respective morphologies. Unlike the initial
lymphatics, the CVLs have circumferential smooth muscle cells
(SMCs) and regular intraluminal valves to help propel a unidirec-
tional flow of fluid (Shayan et al., 2006).
Determining the step(s) in metastatic spread regulated by
lymphangiogenic growth factors is critical for developing optimal
therapeutic strategies to control metastasis. Recently, the focus
of much research has been to understand the mechanisms
underlying the effects of tumor-derived VEGF-C or VEGF-D
on initial lymphatics within and around the primary tumor
(Mandriota et al., 2001; Skobe et al., 2001; Stacker et al., 2001;
Bjorndahl et al., 2005; Hoshida et al., 2006; Roberts et al.,
2006; Kopfstein et al., 2007). However, the influence of these
factors on lymphatic vessels distal to the primary tumor, for
(H–K) Representative images of flank skin containing CLVs draining 293EBNA
nonmetastatic control (H) or VEGF-A-overexpressing tumors (I), or metastatic tu
(L) Quantitative analysis of CLV diameter in mice bearing 293EBNA nonmetastati
VEGF-D tumors. Data are mean ± SEM; n R 10. **p < 0.01 by t test.
(M and N) Representative images of flank skin highlighting collecting lymphatics
treated with an isotype control antibody (M) or VD1, a neutralizing antibody agai
(O) Quantitative analysis of CLV diameter in mice bearing nonmetastatic 293EBN
VD1. Data are mean ± SEM; n R 4. *p < 0.05 by t test.
(P) Quantification of the relative percentage of BrdU-positive nuclei per CLV in m
Data are the mean of six sections/mouse ± SEM; n R 3.
See also Figure S1.
C
example, the CLVs draining the primary tumor to the SLN,
remains elusive. Historically, CLVs were considered passive
conduits that drain defined tissue areas to LNs (Sappy, 1874).
However, recent observations in tumor models of VEGF-C-
driven lymphogenous spread indicate that CLVs may play an
active role in metastasis by increasing lymph flow through vessel
dilation (He et al., 2005; Hoshida et al., 2006).
In this study, we investigated how CLVs are altered during
VEGF-D-driven metastasis and how the CLVs are prepared to
facilitate tumor spread.
RESULTS
Lymphangiogenic Growth Factors Induce Dilationof Collecting Lymphatic VesselsWe examined the mechanism(s) by which VEGF-D could regu-
late CLVs that drain primary metastatic tumors using VEGF-
D-expressing tumor models (Figure 1A). Our xenograft model
of lymphogenous spread is based on the nonmetastatic
293EBNA cell line, which has negligible baseline expression of
VEGF family members (Figures S1A–S1D available online). Lym-
phogenous spread occurs when lymphangiogenic growth
factors are overexpressed (Stacker et al., 2001), allowing us to
examine any changes to collecting lymphatic vessels exposed
to tumor-secreted VEGF familymembers. Immunohistochemical
staining of skin sections containing the CLVs draining primary
VEGF-D-293EBNA metastatic tumors revealed them to be
dilated compared to the same vessels from the nonmetastatic
control animals (Figures 1B and 1C). The correlation between
VEGF-D and dilated collecting lymphatics could also be
observed in clinical specimens. The afferent CLVs were dilated
in a patient with VEGF-D-positive metastatic breast cancer
compared to the matched patient sample with nonmetastatic
breast cancer (Figures 1D and 1E; Figures S1E and S1F).
To examine the breadth of these findings, we assessed addi-
tional tumor cell lines for endogenous levels of VEGF family
members, in particular, VEGF-D. Expression analysis revealed
both breast cancer cell lines 66c14 and MDA-MB-435 express
endogenous levels of VEGF-D compared to other cell lines
such as the prostate tumor cell line PC3 and the poorly meta-
static breast cancer cell line MDA-MB-231 (Figures S1G–S1K).
Therefore, in addition to our VEGF-D-overexpressing 293EBNA
model, the 66c14 and MDA-MB-435 tumor cell lines were em-
ployed for subsequent manipulations.
We interrogated CLVs in our orthotopic model of breast
cancer involving 66cl4 mammary adenocarcinoma cells (Sloan
et al., 2010). This model of metastasis is associated with an
upregulation of vegf-A and vegf-D but not vegf-C within the
tumors, highlighting collecting lymphatics (white arrowheads) from mice with
mors overexpressing VEGF-C (J) or VEGF-D (K) . Scale bars: 1 mm.
c or overexpressing VEGF-A tumors, or metastatic overexpressing VEGF-C or
(white arrowheads) from mice bearing metastatic VEGF-D-293EBNA tumors
nst VEGF- D (N). Scale bars: 1 mm.
A or metastatic VEGF-D-293EBNA tumors treated with an isotype control and
ice bearing nonmetastatic 293EBNA or metastatic VEGF-D-293EBNA tumors.
ancer Cell 21, 181–195, February 14, 2012 ª2012 Elsevier Inc. 183

I
0
1
2
3
4
LYV
E-1
Pro
x-1
VE
GF
R-3
VE
GF
R-2
Pec
am-1
Eph
rinB
2
VE
-cad
herin
0Rel
ativ
e E
xpre
ssio
n
podo
plan
in
CD
45
20
40
60
80
100
120
A B
Podoplanin
Cou
nts
x40
x40
x4x4x4x40x404040004004000000000000000000004000000000000000000000000000000000000000000000000000000000000000
x40
Podoplanin/SMC-actin
Unp
urifi
edcL
EC
enr
ichm
ent
Podoplanin/SMC actin
LYVE-1 Prox-1
C D
F G H
Rel
ativ
e E
xpre
ssio
n
E
Figure 2. Purification and Characterization of Collecting Lymphatic
Endothelial Cells
(A) Representative images of the microdissection procedure and a fully
dissected CLV following identification with Patent Blue V. The ruler depicted
indicates 1 mm graduation marks.
(B) Single-color flow cytometric analysis of unpurified single-cell suspension
prepared from CLVs, stained with podoplanin (green) or an isotype-matched
control (filled purple).
(C) Representative bright field image of unpurified cells following CLV harvest
and culture. Scale bar: 10 mm.
(D and E) Immunofluorescence of single-cell suspension culture from CLVs
stained for podoplanin (green) and SMC-actin (red). Scale bar: 50 mm. The
boxed area in (D) is a magnified area from the original image to highlight the
SMC-actin positive-staining cells and depicted as (E). Scale bar: 10 mm. Nuclei
were counterstained with DAPI.
(F–H) Immunofluorescence of the enriched podoplanin-positive cLEC fraction
fromCLVs. Cells were stained with podoplanin (green) and SMC-actin (red) (F),
LYVE-1 (green) (G) and Prox-1 (green) (H). Scale bars: 10 mm.
(I) Relative expression of lymphatic-specific genes following purification of
cLECs from CLVs analyzed by qRT-PCR. Gene expression was normalized to
b-actin. Data are mean ± SEM; n R 5.
Cancer Cell
PGs Regulate Metastasis in Collecting Lymphatics
184 Cancer Cell 21, 181–195, February 14, 2012 ª2012 Elsevier Inc.
primary tumor, increased tumor-associated lymphatic vessels,
and subsequent LN and distant organ metastasis (Figures
S1L–S1N). Tracking of collecting lymphatics in mice bearing
66c14 breast tumors revealed that CLVs were dilated in animals
bearing metastatic tumors in which VEGF-D was upregulated,
compared to nonmetastatic controls (Figures 1F and 1G).
To ascertain the specific contribution of VEGF-D to collecting
lymphatic dilation, we utilized variants of the 293EBNA model
that overexpress VEGF-A, VEGF-C, or VEGF-D. When com-
pared to nonmetastatic controls, mice bearing metastatic
VEGF-D-expressing tumors had enlarged CLV diameters
(Figures 1H, 1K, and 1L) consistent with observations made
during VEGF-C-driven tumor spread (Figures 1J and 1L; He
et al., 2005). This dilation was reversed when mice bearing
VEGF-D tumors were treated with VD1, a neutralizing VEGF-D
antibody (Figures 1M–1O). Collecting lymphatic dilation was
not observed in mice bearing VEGF-A-expressing tumors
(Figures 1I and 1L), suggesting that VEGF-A has little effect on
collecting lymphatic dilation. Previous studies showed that
lymphatic vessels have the capacity to functionally adapt by
dilating in response to VEGF-C, and this was attributed to hyper-
plasia of the endothelium (Jeltsch et al., 1997; He et al., 2005).
In contrast, we found no significant increase in the number of
BrdU-positive endothelial cells in dilated collecting lymphatics
from mice bearing LN metastasis in VEGF-D-secreting tumors,
compared with nonmetastatic controls (Figure 1P; p = 0.327).
These data suggest that VEGF-D drives morphological changes
in CLVs that correlate with metastasis, and are not due to endo-
thelial cell proliferation.
Isolation and Characterization of Collecting LymphaticEndothelial Cells during Cancer SpreadTo define the molecular mechanisms driving the morphological
changes in collecting lymphatics during metastasis, we devel-
oped a method to isolate CLVs draining primary tumors. Large
subcutaneous CLVs were visualized using Patent Blue V and
separated from blood vessels and surrounding skin tissue by
microdissection (Figure 2A).
LYVE-1 is strongly expressed on smaller caliber lymphatic
vessels, namely, the initial and precollector lymphatics, whereas
it is weakly expressed on collecting vessels (Makinen et al.,
2005). In contrast, podoplanin is expressed strongly on all
lymphatic vessel subtypes (Makinen et al., 2005), and podopla-
nin-positive selection was therefore used to isolate collecting
lymphatic endothelial cells (cLECs). Flow cytometry of cell
suspensions prepared from microdissected CLVs prior to purifi-
cation showed that approximately 75% of cells were positive for
podoplanin (Figures 2B and 2C) and immunofluorescence re-
vealed the presence of podoplanin-positive cells interspersed
with smooth muscle actin (SMA)-positive cells, a marker for
mural cells (Figures 2D and 2E). The presence of SMA is consis-
tent with in vivo observations of the association of mural cells
with CLVs (Makinen et al., 2005). To allow molecular character-
ization of cLECs, podoplanin-positive cells were isolated. Immu-
nofluoresence of the cLEC-enriched fraction revealed cells that
stained weakly for the lymphatic markers, LYVE-1 and Prox-1
(Kriehuber et al., 2001), and contaminating SMC were not de-
tected (Figures 2F–2H). The cLEC-enriched fraction was not
contaminated by immune cells, as indicated by negligible levels
Cancer Cell
PGs Regulate Metastasis in Collecting Lymphatics
of the pan-immune marker CD45 (Figure 2I). Quantitative real-
time (qRT)-PCR revealed expression of other lymphatic markers,
such as VEGFR-3 (Podgrabinska et al., 2002). In addition,
VEGFR-2, recently shown to be expressed on dermal microvas-
cular LECs (Podgrabinska et al., 2002), was expressed by cLECs
(Figure 2I). Other endothelial and LECmarkers such as Pecam-1,
VE-cadherin, and EphrinB2 (Kriehuber et al., 2001; Makinen
et al., 2005; Baluk et al., 2007) were also detected (Figure 2I).
Collectively, these data confirm the endothelial nature of the
purified cLEC population that can be used to investigate the
molecular pathways in collecting lymphatics necessary for tumor
spread.
Collecting Lymphatic Vessels Alter Their GeneSignature during VEGF-D-Driven MetastasisTo understand the molecular mechanisms underlying morpho-
logical changes in CLVs, we compared the molecular signature
of cLECs harvested fromCLVs from animals with VEGF-D-driven
metastasis to that from animals with nonmetastatic disease
(Figure 3A). Whole-genome profiling revealed reproducible
gene expression patterns observed among replicates, and
distinct and unique molecular signatures that differentiated
between cLECs from animals with metastatic disease to those
with nonmetastatic tumors (Figure 3B).
Several key genes that were differentially expressed between
these groups could be arranged according to their cellular roles:
cell surface receptors, secreted factors, transcription factors
and cytoskeletal or extracellular matrix remodeling genes
(Figure 3C). The cell surface geneswere those important in adhe-
sion and inflammation; many of the secreted factors were also
modulators of inflammatory responses such as IL-11. Interest-
ingly, the majority of the differentially expressed genes fell into
the cytoskeletal or extracellular matrix modulatory group, which
is consistent with observation of dilated collecting lymphatics.
Within this gene group was pgdh, encoding 15-hydroxyprosta-
glandin dehydrogenase (PGDH), an enzyme whose key function
is degradation of prostaglandins (PGs), which are small lipid-
based molecules that can act as potent vasodilators. PGDH
was of interest as it has been identified as a tumor suppressor
in colorectal cancers (Myung et al., 2006).
The Tumor Suppressor, PGDH, Is Downregulatedin Collecting Lymphatics during VEGF-D-DrivenMetastasisTo validate differential pgdh expression levels, qRT-PCR was
employed, revealing a 20-fold reduction in the level of pgdh
gene expression in CLVs from metastatic VEGF-D-293EBNA
tumors compared to those draining nonmetastatic tumors (Fig-
ure 4A), consistent with the whole-genome profiling. To test for
the specificity of VEGF-D regulation of PGDH expression, we
evaluated the influence of the related lymphangiogenic factor,
VEGF-C, during metastasis. Collecting lymphatics from mice
bearing metastatic VEGF-C-293EBNA tumors did not reveal
a statistically significant change in pgdh expression (Figure 4A).
PGDH is a component of the catabolic arm of the PG pathway
whereas the COX proteins are key biosynthetic enzymes (Gupta
and Dubois, 2001). Studies have shown a correlation between
VEGF-C and COX-2 expression in metastatic cancers (Di et al.,
2009; Liu et al., 2010). To determine if VEGF-D could also regu-
C
late the biosynthetic arm of the PGpathway, we assessed VEGF-
D regulation of cox-2 expression (Figure 4A). In contrast to the
VEGF-C control, VEGF-D had no effect on cox-2 levels in collect-
ing lymphatics (Figure 4A). To confirm the specific effect of
VEGF-D and to eliminate any possible effects of tumor-secreted
VEGF family members or other tumor factors on pgdh expres-
sion levels, cLECs harvested from nontumor bearing mice
were stimulated in vitro with VEGF-A, VEGF-C, or VEGF-D
(Figure 4B). qRT-PCR revealed that pgdh expression was not
altered by VEGF-A, in keeping with the lack of collecting
lymphatic dilation observed in our nonmetastatic VEGF-A-over-
expressing xenograft tumors (Figure 1L). Likewise, VEGF-C
stimulation in vitro had little effect on pgdh expression in cLECs.
Conversely, pgdh was significantly downregulated in cells
stimulated with VEGF-D compared with unstimulated control
cells (Figure 4B), suggesting that VEGF-D has a specific effect
on pgdh expression in cLECs.
We previously showed that cLECs express both VEGFR-2 and
VEGFR-3 (Figure 2I). To determine which of these receptors
mediates the downregulation of pgdh, selective blockade of
VEGFR-2 or VEGFR-3 was performed. VEGF-D stimulation of
cLECs following pretreatment with neutralizing antibodies
against VEGFR-2 or VEGFR-3 (Figures S2A and S2B) prevented
VEGF-D-induced downregulation of pgdh (Figure 4C).
Immunoblot analysis of cellular lysates prepared from CLVs
from mice bearing metastatic VEGF-D-293EBNA tumors
(Figure 4D) demonstrated that PGDH protein levels were down-
regulated. To assess the distribution and expression pattern of
PGDH with respect to lymphatic vessel subtypes, skin sections
containing major longitudinal CLVs from non-tumor-bearing
mice were stained with antibodies against PGDH. These showed
cytosolic protein expression in nondilated CLVs, the identity of
which was confirmed by positive staining with the lymphatic
marker, podoplanin (Figures 4E and 4H). In animals with VEGF-
D-driven metastatic disease, however, PGDH expression in the
dilated CLVs was reduced (Figures 4G and 4J) compared to
the CLVs in mice bearing nonmetastatic 293EBNA tumors
(Figures 4F and 4I). In combination with the microarray data,
these results suggest that VEGF-Dmediates the downregulation
of pgdh expression in dilated CLVs during VEGF-D-driven lym-
phogenous spread, and that this process requires the actions
of both VEGFR-2 and VEGFR-3.
VEGF-D/VEGFR-2/VEGFR-3-Signaling Axes ModulateProstaglandins Produced by Collecting LymphaticVessels during MetastasisTo maintain homeostasis of PGs in tissues, there is a balance
between PG synthesis and degradation. We rationalized that
the downregulation of the PG degrading enzyme, PGDH, may
alter PG levels secreted by the collecting lymphatics, in partic-
ular PGE2, which is the main target for PGDH activity (Cha and
DuBois, 2007). Since the lymphatic vasculature eventually drains
into the circulatory system, we reasoned that local, continual
secretion of PGs by endothelial cells may be detected in the
plasma (Challis et al., 1976; Albuquerque et al., 2009). We tested
the plasma of mice exposed to VEGF-D for the PGs previously
shown to have vasodilatory effects (Olsson and Carlson, 1976;
Whorton et al., 1978) and found that PG levels, specifically
PGE2, in mice with VEGF-D-driven metastasis were elevated
ancer Cell 21, 181–195, February 14, 2012 ª2012 Elsevier Inc. 185

Biofunctions
Cell surface
markers
Secreted factors
Cytoskeletal and
ECM modulation
Transcription
factors
up
down
up
down
up
down
down
Gene name
IL-1rI1ICAM-1
Ramp2
C1qtnf3Sema3cCxCl14IL-11
Dkk2
TncSerpina3c
PgdhCol6a3Lmo7AspnDspAdam12
HoxA9
Genebank
accession number
NM_008362NM_010493
NM_019511
NM_030888NM_013657NM_019568NM_008350
NM_020265
NM_011607NM_008458
NM_008278AF034136NM_201529NM_025711NM_023842NM_007400
NM_010456
Log fold2
change
-3.6-3.2
3.6
-4.2-3.3-3.2-3.2
5.3
-3.8-3.3
4.211.63.73.83.53.1
4.1
P value
0.0130.040
0.038
0.0100.0220.0220.034
0.010
0.0380.046
0.0140.0190.0200.0400.0400.046
0.013
A
B
Enriched collecting endothelialcell population
Microarray comparison (metastatic vs non-metastatic)
Candidate genes
Microdissection of collecting lymphatic vessel
Non-metastatic
tumor
Collectinglymphatic
vessel
Metastatic
VEGF-D
secreting tumor
Collectinglymphatic
vessel SLN SLN
C
Metastatic
Tumors
Non-Metastatic
Tumors
Metastatic VEGF-DTumor Replicate 1
Metastatic Tumor Replicate 2
VEGF-D
Non-metastaticTumor Replicate1
Non-mTumor Replicate 2
etastatic
Figure 3. Collecting Lymphatic Vessels from Metastatic VEGF-D Tumors Have Distinct Gene Signature
(A) Schematic representation of experimental paradigm used to identify gene expression signatures in CLVs during VEGF-D-driven metastatic disease. This
involvedmicrodissection of the CLVs draining primary tumors to the SLN, purification of cLECs andmicroarray analysis (tumor cells: orange; collecting lymphatic
vessels and SLN: blue).
(B) Microarray analysis of cLECs isolated from mice bearing metastatic VEGF-D-293EBNA or nonmetastatic 293EBNA tumors from four independent experi-
ments. Data were visualized using Partek Genomics Suite software, by displaying a hierarchical cluster with average linkage analysis of normalized gene
Cancer Cell
PGs Regulate Metastasis in Collecting Lymphatics
186 Cancer Cell 21, 181–195, February 14, 2012 ª2012 Elsevier Inc.

Cancer Cell
PGs Regulate Metastasis in Collecting Lymphatics
compared to those with nonmetastatic control or nonmetastatic
VEGF-A-secreting tumors (Figures S3A and S3B). A similar trend
regarding PGE2 was also observed in collecting lymphatic
tissues harvested from the same animals (Figure S3C). Next,
we assessed the ability of cLECs as an isolated cell type to
produce PGs in vitro and to determine whether there is a causal
relationship between VEGF-D signaling and modulation of PG
production by cLECs. Upon VEGF-D stimulation of cLECs, there
was an increase in PG levels (Figure 5A), further supporting the
notion that VEGF-D modulates tissue-specific PG production
by downregulating the PG degrading enzyme, pgdh (Figures
4A and 4B).
We endeavored to understand the VEGFR-2/VEGFR-3-
signaling mechanism necessary for VEGF-D-dependent PG
modulation by CLVs. Stimulation with VEGF-D led to phosphor-
ylation of VEGFR-2 in cLECs, which could be blocked by
pretreatment with neutralizing antibodies against either
VEGFR-2 or VEGFR-3 (Figure 5B). Likewise, phosphorylation
of VEGFR-3 was also blocked by both neutralizing antibodies
(Figure 5B), which is consistent with our observation that either
anti-VEGFR-2 or anti-VEGFR-3 antibody blocked the reduction
in PGDH expression induced by VEGF-D (Figure 4C). Next, we
assessed whether attenuation of VEGF-D signaling by blocking
VEGFR-2/VEGFR-3 activation would affect PG production by
cLECs. We found a significant reduction in PGs secreted by
cLECs that had been pretreated with either neutralizing anti-
VEGFR-2 or anti-VEGFR-3 antibodies (Figure 5C). Finally, we
investigated the effects of attenuating VEGF-D signaling in vivo
by blocking VEGFR-2 and VEGFR-3 activity, and hence PG
production by cLECs, on dilation of CLVs draining tumors.
CLVs in animals bearing metastatic VEGF-D-293EBNA tumors
treated with either VEGFR-2 or VEGFR-3 neutralizing antibodies
were not dilated (Figures 5D, 5E, and 5H) in contrast to dilated
collectors found in the isotype-treated and nonmetastatic
controls (Figures 5F–5H). Collectively, these data suggest that
VEGF-D—via the activities of both VEGFR-2 and VEGFR-3—is
able to regulate the levels of vasodilatory PGs produced by
collecting lymphatic vessel endothelium.
Anti-inflammatory Drugs Reduce VEGF-D-DrivenMetastasis by Reversing the Morphological Changesin Collecting Lymphatic VesselsThe discovery that the lymphangiogenic molecule VEGF-D
modulates the morphology of collecting lymphatics via a
tissue-specific regulation of PG activity led us to investigate
whether pharmacologically manipulating this pathway would
reverse the effect of VEGF-D on metastasis. NSAIDs are a class
of commonly used analgesic and anti-inflammatory drugs and
are prototypical inhibitors of COX enzymes. To address whether
PGs contribute to ‘‘preparing’’ the collecting lymphatics that
drain the primary tumor for spread to the SLN, we sought to
shut down COX-2 and thereby ablate PG production. We
reasoned that a VEGF-D-mediated increase in PG production
by cLECs could be reduced concomitantly by inhibiting the
expression (>1.5-fold change, adjusted p values < 0.05). These data illustrate d
cLECs during metastatic disease compared to those from nonmetastatic tumor
(C) Selected genes whose expression was up- or downregulated in cLECs d
significance corresponds to p < 0.05 by HOLMS test.
C
biosynthetic arm of the PG pathway by treatment with a COX-
2 inhibitor, Etodolac (Glaser et al., 1995). After testing the effi-
cacy of this drug in vitro (Figure S4A), we monitored its effects
on metastasis in the VEGF-D-293EBNA model. It has been
shown that NSAID treatment can reduce the levels of VEGFs
in some tumor models (Iwata et al., 2007), yet we found no
difference in plasma VEGF-D levels during NSAID treatment
(Figure S4B).
In addition, we employed the metastatic MDA-MB-435 breast
cancer model, which was shown to express endogenous VEGF-
D (Figures S1H–S1K). Primary tumor growth was not significantly
affected by NSAIDs in either VEGF-D-293EBNA or MDA-MB-
435 models (Figure 6A), in contrast to previous studies (Green-
hough et al., 2009).
The COX biosynthetic pathway has been shown to promote
metastasis by stimulating tumor-associated angiogenesis and
lymphangiogenesis (Iwata et al., 2007;Williams et al., 2000; Tsujii
et al., 1998). We found no significant difference in the density of
tumor-associated lymphatic or blood vessels between the
NSAID-treated and vehicle control groups in either VEGF-D-
293EBNA or MDA-MB-435 metastatic models (Figures 6B–6G;
Figures S4C–S4H). When we assessed dilation of collecting
lymphatics that drain the primary tumors in these models, we
found a compelling reduction in vessel diameter in NSAID-
treated mice in both tumor models (Figures 6I, 6L, and 6M)
compared with the nonmetastatic and vehicle control groups
(Figures 6H, 6J, 6K, and 6M). Cox-2-derived PGE2 promotes
tumor progression and metastasis and is significantly increased
in malignant tissue (Jaffe et al., 1971, Rigas et al., 1993). The
chemoprotective effects of NSAIDs are mediated by reducing
PGE2 levels (Hansen-Petrik et al., 2002). Treatment with
Etodolac significantly reduced PGE2 levels in both the VEGF-
D-293EBNA and the MDA-MB-435 breast cancer model, sug-
gesting that the dilation observed during metastasis may, in
part, be attributed to PGE2 (Figure 6N). PGs exert their biological
actions, such as vasodilation, by engaging specific receptors
(Amano et al., 2003). Protein expression of PGE receptors on
CLVs was found at low levels (Figure S4I), with a differential
expression pattern during metastasis and upregulation of EP3,
the receptor commonly engaged by PGE2 (Figure S4J).
To ascertain whether NSAID-mediated reversal of CLV dilation
affects metastasis, we examined the SLN (Kerjaschki et al.,
2011). In both the VEGF-D-EBNA293 andMDA-MB-435models,
we found a reduction of tumor cells in LNs from NSAID-treated
animals compared to the vehicle control (Figures 6O–6U).
Further, in the MDA-MB-435 model which displays systemic
metastasis to the lung, micrometastatic deposits in both the
pleural and subpleural area of lung sections could not be de-
tected in NSAID treated animals compared to those readily
observed in the vehicle control animals (Figures 6V and 6W; Fig-
ure S4K). NSAIDs have been shown to have antiproliferative,
proapoptotic, and antiangiogenesis effects (Cha and DuBois,
2007), yet we found no statistically significant differences in the
proliferation/apoptosis index or blood vessel density in LNs
ifferentially upregulated (red/orange) or downregulated genes (purple/blue) in
bearing mice. The gene expression patterns are consistent among replicates.
uring VEGF-D-driven metastatic disease in the 293EBNA model. Statistical
ancer Cell 21, 181–195, February 14, 2012 ª2012 Elsevier Inc. 187
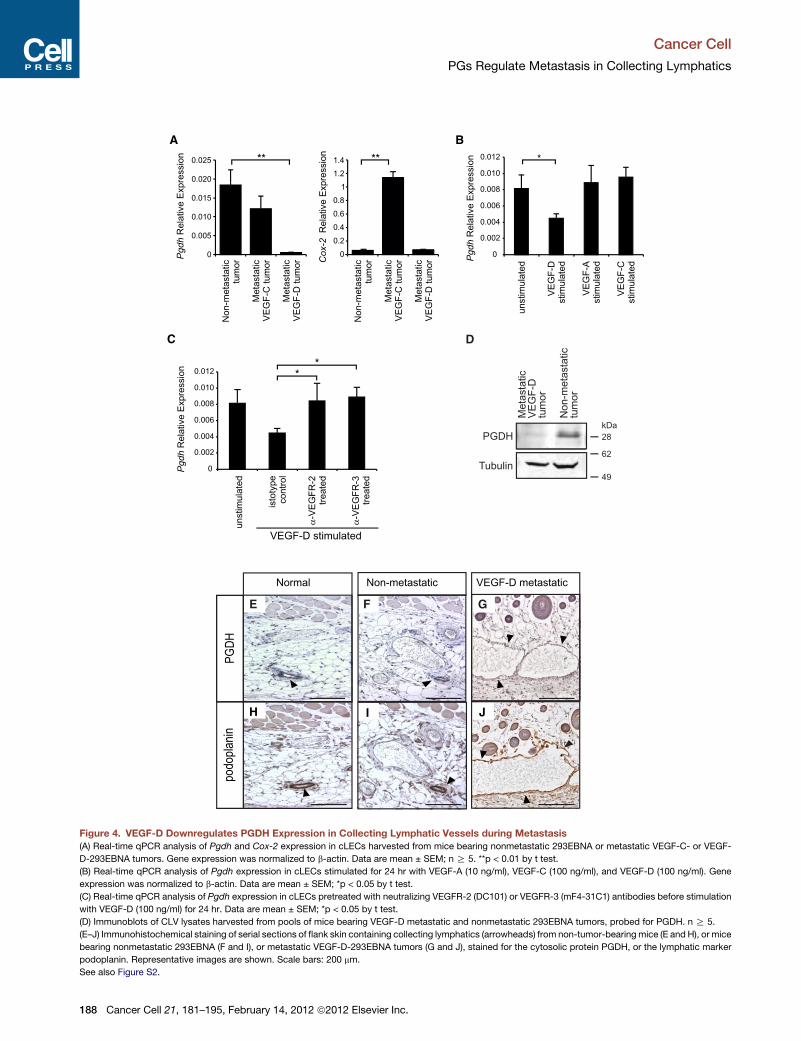
podo
plan
inPG
DH
I JH
GE F
A
Met
asta
ticV
EG
F-D
tu
mor
Tubulin
PGDH
Non
-met
asta
tictu
mor
49
28kDa
62
Non
-met
asta
tic tu
mor
Non
-met
asta
tic tu
mor
**
0
0.005
0.010
0.015
0.020
0.025
Met
asta
tic
VE
GF
-C tu
mor
Met
asta
tic
VE
GF
-D tu
mor
Pg
dh
Rel
ativ
e E
xpre
ssio
n
0
0.2
0.4
0.6
0.8
1
1.2
1.4
Met
asta
tic
VE
GF
-C tu
mor
Met
asta
tic
VE
GF
-D tu
morC
ox-2
R
elat
ive
Exp
ress
ion **
B
C
0
0.002
0.004
0.006
0.008
0.010
0.012
unst
imul
ated
isto
type
con
trol
α-V
EG
FR
-2tr
eate
d
0
0.002
0.004
0.006
0.008
0.010
0.012
unst
imul
ated
VE
GF
-Dst
imul
ated
VE
GF
-Ast
imul
ated
VE
GF
-Cst
imul
ated
*
**
Pg
dh
Rel
ativ
e E
xpre
ssio
n
α-V
EG
FR
-3tr
eate
d
VEGF-D stimulated
D
Pg
dh
Rel
ativ
e E
xpre
ssio
n
Non-metastaticNormal VEGF-D metastatic
Figure 4. VEGF-D Downregulates PGDH Expression in Collecting Lymphatic Vessels during Metastasis
(A) Real-time qPCR analysis of Pgdh and Cox-2 expression in cLECs harvested from mice bearing nonmetastatic 293EBNA or metastatic VEGF-C- or VEGF-
D-293EBNA tumors. Gene expression was normalized to b-actin. Data are mean ± SEM; n R 5. **p < 0.01 by t test.
(B) Real-time qPCR analysis of Pgdh expression in cLECs stimulated for 24 hr with VEGF-A (10 ng/ml), VEGF-C (100 ng/ml), and VEGF-D (100 ng/ml). Gene
expression was normalized to b-actin. Data are mean ± SEM; *p < 0.05 by t test.
(C) Real-time qPCR analysis of Pgdh expression in cLECs pretreated with neutralizing VEGFR-2 (DC101) or VEGFR-3 (mF4-31C1) antibodies before stimulation
with VEGF-D (100 ng/ml) for 24 hr. Data are mean ± SEM; *p < 0.05 by t test.
(D) Immunoblots of CLV lysates harvested from pools of mice bearing VEGF-D metastatic and nonmetastatic 293EBNA tumors, probed for PGDH. n R 5.
(E–J) Immunohistochemical staining of serial sections of flank skin containing collecting lymphatics (arrowheads) from non-tumor-bearing mice (E and H), or mice
bearing nonmetastatic 293EBNA (F and I), or metastatic VEGF-D-293EBNA tumors (G and J), stained for the cytosolic protein PGDH, or the lymphatic marker
podoplanin. Representative images are shown. Scale bars: 200 mm.
See also Figure S2.
Cancer Cell
PGs Regulate Metastasis in Collecting Lymphatics
188 Cancer Cell 21, 181–195, February 14, 2012 ª2012 Elsevier Inc.

Cancer Cell
PGs Regulate Metastasis in Collecting Lymphatics
from either NSAID or vehicle-treated groups, suggesting that the
reduction of tumor cells in LNs of NSAID-treated animals was not
due to changes in proliferation, apoptosis, or angiogenesis
within the LN (Figures S4L and S4M) or primary tumor (data
not shown). Collectively, these data suggest that NSAIDs can
affect VEGF-D-regulated PG production by the collecting
lymphatic endothelium. This in turn may provide an antimeta-
static effect by preventing critical morphological alterations to
CLVs that are necessary to facilitate tumor cell spread to the
SLN (Figure 7).
DISCUSSION
Entry of tumor cells into the lymphatic system and subsequent
dissemination to LN and distant organ sites is an important event
in the metastasis of many solid tumors. In contrast to our knowl-
edge of the influence of lymphangiogenic factors on initial
lymphatics within and surrounding the primary tumor (Koukour-
akis et al., 2000; Pepper, 2001; Stacker et al., 2004; Sleeman and
Thiele, 2009), the effect of these factors on lymphatics beyond
the tumor environment is only beginning to emerge.
Isolation of endothelial cells from normal and tumor samples
has identified genes that are important during tumor-associated
angiogenesis and lymphangiogenesis (St Croix et al., 2000;
Clasper et al., 2008). We have isolated LECs from vessels
beyond the tumor microenvironment and have investigated the
molecular regulation that occurs in collecting lymphatics during
the metastatic process. Transcriptional profiling of cLECs from
CLVs draining metastatic VEGF-D-secreting tumors identified
gene signatures that are implicated in tissue remodeling and
inflammation. These studies found that VEGF-D regulates the
structure of the tumor-draining CLVs through a PG-dependent
mechanism, consistent with the elevated levels of inflammatory
mediators, such as PGs (Mantovani et al., 2008). In contrast,
tumor-associated initial lymphatics differentially expressed
genes encoding components of endothelial junctions, subendo-
thelial matrix, and vessel growth/patterning (Clasper et al., 2008).
Such variation between gene signatures may reflect the different
responses that lymphatic vessel subtypes exhibit to lymphan-
giogenic growth factors and the roles they perform during the
course of lymphogenous spread.
As an initial step toward evaluating mechanisms of metastasis
and potential therapeutic targets by which to restrict metastatic
disease, we focused on pgdh, which catalyzes the rate-limiting
step in the catabolism of PGs (Pichaud et al., 1997) and has
been identified as a tumor suppressor (Myung et al., 2006).
Endothelial-derived PGs are potent regulators of vasodilation,
attenuating or amplifying the response of blood vessels to
modulate vascular tone during normal and pathological states
(Messina et al., 1974; Gupta and Dubois, 2001). We extend this
finding to the CLVs, with ‘‘tissue-specific’’ regulation of PGs by
these vessels when exposed to VEGF-D. The importance of
PGDH during blood vessel dilation was initially demonstrated
in PGDH null mice, which have increased tissue PGE2 levels,
and as a consequence, a patent blood vessel shunt between
the lungs and heart, causing them to die soon after birth (Coggins
et al., 2002). It will be interesting to assess the lymphatic vascu-
lature in PGDH heterozygous mice during normal and patholog-
ical states.
C
PGs are produced in tissues by COX enzymes and levels are
balanced by the degrading activities of PGDH (Gupta and
Dubois, 2001). Clinically, high COX-2 expression in some tumors
is associated with poor patient prognosis and survival (Ristimaki
et al., 1997). The protumorigenic effects of COX-2 are believed to
be largely attributed to its role in synthesizing PGE2 (Pugh and
Thomas, 1994). Similarly, reduced PGDH expression and
a consequential rise in PGE2 levels enhance tumor growth in
colon, gastrointestinal, and breast cancers (Backlund et al.,
2005a; Backlund et al., 2005b;Wolf et al., 2006). Our data extend
this knowledge by demonstrating that reduced PGDH expres-
sion and elevated levels of PGE2 are important in lymphatic
endothelial cells beyond the tumor microenvironment, possibly
‘‘preparing’’ the CLVs to promote tumor spread.
It is not apparent at this stage whether lymphatic endothe-
lium-derived PGs act in an autocrine or paracrine manner to
modulate the overall tone of the CLVs during metastasis. The
actions of prostaglandins such as PGE2 are mediated by
engagement with their cognate receptors, EP1-4 (Greenhough
et al., 2009), with EP3 signaling shown to contribute to tumor
lymphangiogenesis (Kubo et al., 2010). In collecting lymphatics,
cLEC-derived PGs may activate SMCs associated with the
vessel walls; PG ligation of receptors on SMCs may induce
vessel wall relaxation to accommodate expansions in vessel
size (Tang and Vanhoutte, 2008). This effect is akin to that of
nitric oxide- and PG-dependent modulation of blood vessel
tone (Fukumura et al., 2006).
Lymphangiogenic growth factor modulation of PGs in CLVs is
mediated by both VEGFR-2 and VEGFR-3 signaling, possibly via
heterodimers. Recently published data showed that VEGF-D
stimulation of endothelial cells promotes the formation of
VEGFR-2/VEGFR-3 heterodimers (Nilsson et al., 2010). Consis-
tent with these findings, anti-VEGFR-2 or anti-VEGFR-3 thera-
peutic agents were shown to block CLV dilation, which corre-
lated with decreased lymph flow rates and consequently,
a reduction in the number of tumor cells reaching the SLN (He
et al., 2005; Hoshida et al., 2006). Based on data presented in
this study, it is feasible that the mechanism of metastatic
suppression by VEGFR-2 and VEGFR-3 blockade is, in part,
due to attenuation of PG levels in the collecting endothelium.
Since lymphatics are a conduit for immune cells, it cannot be
excluded that VEGF-D-induced dilation of collecting lymphatics
may contribute to metastasis by altering the traffic and behavior
of immune cells in the SLN, consequently modulating metastatic
burden.
NSAIDs are commonly used for the treatment of inflammatory
disease and can restrict the development of colon cancer
(Thun and Heath, 1995; Mantovani et al., 2008; Hirsch et al.,
2010) and tumor spread in breast and prostate cancer patients
(Holmes et al., 2010; Leitzmann et al., 2002), yet the precise
antimetastatic mechanism is unclear. Emerging evidence
suggests that COX-2 overexpression and high PGE2 levels are
associated with tumor angiogenesis and lymphangiogenesis,
processes crucial for metastasis (Iwata et al., 2007; Amano
et al., 2003; Tsujii et al., 1998). Recently, the effect of NSAIDs
on the lymphatic vasculature has been assessed within tumors,
where it was shown that treatment with a COX-2 inhibitor
reduced tumoral lymphangiogenesis, in turn, leading to
decreased metastasis to the SLN (Iwata et al., 2007). Evidence
ancer Cell 21, 181–195, February 14, 2012 ª2012 Elsevier Inc. 189

A
0
200
400
600
800
1000
1200
1400
PG
I (p
g/m
L)2
0
20
40
60
80
100
120
PG
E2
(pg/
mL)
0
20
40
60
80
100
120
PG
E1
(pg/
mL)
+VEGF-D +VEGF-D +VEGF-D
** *
0
1000
2000
3000
4000
lortnoC Is
otyp
e co
ntro
l2-R
FG
EV
ydobi nt agni kcol b
3-R
FG
EV
ydobi nt agni kcol b
C
PG
I (p
g/m
L)2
0
100
200
300
400
500
600
PG
E2
(pg/
mL)
l ort noC Is
otyp
e co
ntro
l2-R
FG
EV
ydobi nt agni kcol b
3-R
FG
EV
ydobi nt agni kcol b
0
20
40
60
80
PG
E1
(pg/
mL)
l ort noC
epyt osI cont
rol2-
RFG
EV
ydobi nt agni kcol b
3-RF
GE
Vydobi nt a
gni kcol b
-VEGF-D+VEGF-D
-VEGF-D+VEGF-D
***
**
****
188
98
188IP: VEGFR-3
αR2 - - + -αR3 - - - + VEGF-D - + + +
αR2 - - + -αR3 - - - + VEGF-D - + + +
IP: VEGFR-3
D
Isotype control
B
Non-metastatic
H
0
50
100
150
200
250
300
L(
retemai dl essev
cit ahpmy
μm)
2-R
FG
EV
gni kcol bydobit na
3-R
FG
EV
gni kcol bydobit na
non- cit at sat e
m
****
-VEGF-D -VEGF-D -VEGF-D
E
WB: pY
WB: VEGFR-3
188
98
188IP: VEGFR-2WB: pY
IP: VEGFR-2WB: VEGFR-2
-VEGF-D+VEGF-D
Isot
ype
cont
rol
kDakDa
VEGF-D metastatic tumor
FF FG
α-VEGFR-2 α-VEGFR-3
Figure 5. VEGF-D/VEGFR-2/VEGFR-3 Signaling Regulates Prostaglandins Produced by cLECs during Metastasis
(A) PG levels in supernatants of cLECs stimulated with VEGF-D (100 ng/ml) for up to 7 days. Assays were performed in triplicate. Data are mean ± SEM; *p < 0.05
by t test.
(B) VEGF-D-mediated activation of VEGFR-2 and VEGFR-3 in cLECs. cLECswere pretreated for 1 hr with neutralizing VEGFR-2 (DC101) or VEGFR-3 (mF4-31C1)
antibodies before stimulation with VEGF-D (100 ng/ml) for 10 min. VEGFR-2 and VEGFR-3 were immunoprecipitated from cLEC lysates and immunoblots were
probed for phosphorylation of VEGFR-2 and VEGFR-3.
(C) PG levels in supernatants of cLECs were measured by ELISA. cLECs were pretreated for 1 hr with neutralizing VEGFR-2 (DC101) or VEGFR-3 (mF4-31C1)
antibodies before stimulationwith VEGF-D (100 ng/ml) for up to 7days. Assayswere performed in triplicate.Data aremean±SEM; *p<0.05 and **p< 0.01 by t test.
Cancer Cell
PGs Regulate Metastasis in Collecting Lymphatics
190 Cancer Cell 21, 181–195, February 14, 2012 ª2012 Elsevier Inc.

Cancer Cell
PGs Regulate Metastasis in Collecting Lymphatics
presented in the current study indicates an additional mecha-
nism for the antimetastatic effects of NSAID treatment beyond
the tumor environment, one that involves normalizing the
diameter of CLVs that facilitate tumor cell trafficking to the
SLN (Figure 7B).
An emerging ‘‘subtypes-based’’ model for lymphogenous
spread suggests that lymphangiogenic growth factors have
two modalities. The first consists of proliferation or alteration of
tumor-associated initial lymphatics that enables tumor cells to
access to the lymphatic network (Figure 7A); the second involves
dilation of the CLVs beyond the tumor, which facilitates traf-
ficking to the SLN (Figure 7B). Understanding the functionally
important effects that VEGF-C and VEGF-D have on lymphatic
vessel subtypes may provide one of the missing links in the
metastatic process, and further refine our knowledge of the
complex nature of lymphogenous spread. These insights may
assist with the design of additional therapeutic avenues for
cancer patients and/or enhance current approaches to antilym-
phangiogenic therapies, such as blocking or neutralizing anti-
bodies in combination with other treatments such as NSAIDs.
EXPERIMENTAL PROCEDURES
Mice
Female SCID/NOD (IMVS, Adelaide, Australia) or Balb/c (ARC, Perth) mice
6�8 weeks of age were used for tumor studies and/or isolation of cLECs.
Ethics for approval for research using animals was obtained from the Ludwig
Institute for Cancer Research, Peter MacCallum Cancer Centre and Monash
University Animal Ethics Committees, in accordance with National Health
and Medical Research Council of Australia guidelines.
Human Tissue Specimens
Tissues were collected following surgical resection at the Peter MacCallum
Cancer Center. Ethics approval for research using human tissue was obtained
from the Peter MacCallum Cancer Centre (approval number 10/16) and
includes a waiver for consent. A tissue microarray from basal-like breast
carcinoma was constructed from a series of breast tumors screened for ER,
PR, HER2, EGFR, and cytokeratin 5 (ck5). Those tumors that were triple
negative (ER, PR, and her2) and ck5-positive and EGFR-positive were consid-
ered basal-type. 1 mm cores of tissue were punched from donor blocks.
Tissue microarrays were immunostained with anti-human VEGF-D antibody
(R&D Systems).
Metastatic and Nonmetastatic Xenograft Models
Stably transfected 293EBNA-1 cell lines expressing full-length human VEGF-D
(VEGF-D-293EBNA), human VEGF-C (VEGF-C-293EBNA) andmouse VEGF-A
(VEGF-A-293EBNA), vector alone (293EBNA), or MDA-MB-453-expressing
endogenous VEGF-D were established in SCID/NOD mice as described
(Stacker et al., 2001).
Orthotopic Metastasis Model
Six-week-old female Balb/c mice (ARC, Perth) were housed under PC2
barrier conditions. 66cl4 mammary adenocarcinoma cells were transduced
with the FUhlucW lentiviral vector containing firefly luciferase under control
of the ubiquitin-C promoter and were inoculated as previously described
(Sloan et al., 2010). See Supplemental Experimental Procedures for full
methods.
(D–G) Representative images of CLVs filled with Patent Blue V from mice bear
(DC101) (D), VEGFR-3 (mF4-31C1) (E), or isotype control antibody (F) and nonm
(H) Quantification of CLV diameter in mice bearing nonmetastatic and metas
VEGFR-3 (mF4-31C1), or isotype control antibodies. Data are mean ± SEM; n R
See also Figure S3.
C
Treatment of Tumors with Neutralizing Antibodies and NSAIDs
Mice bearing VEGF-D-expressing tumors received thrice weekly, beginning
5 days post-tumor inoculation, intraperitoneal injections of 800 mg of neutral-
izing anti-VEGFR-2 antibody (DC101; ImClone) or VD1 (Achen et al., 2000);
1 mg of neutralizing anti-VEGFR-3 antibody (mF4-31C1; ImClone); or isotype
matched antibody/PBS as vehicle control. For NSAID treatment, mice were
treated daily by oral gavage with 5 mg/kg of Etodolac (Sigma-Aldrich) (Iwata
et al., 2007) dissolved in 5% (w/v) carboxymethylcellulose, beginning 5 days
post-tumor inoculation and continued daily until tumors reached a size of
1,500–2,000 mm3 (typically 3�4 weeks).
Collection of tissue and isolation of cLECs used for various analyses
including immunohistochemistry, flow cytometry, BrdU analysis, prosta-
glandin assays, RNA purification, microarray analysis, and qRT-PCR are
described in detail in the Supplemental Experimental Procedures.
Harvest of Collecting Lymphatic Vessels
0.25% (w/v) Patent Blue V dye (Sigma-Aldrich) was injected postmortem into
hindlimb footpads of normal SCID/NODmice, or intratumorally in mice bearing
tumors, and massaged to promote uptake by the collecting lymphatics. Col-
lecting lymphatics thus identified were microdissected using a Zeiss OPMI
MDI dissecting microscope.
Isolation of Endothelial Cells from Collecting Lymphatic Vessels
Single-cell suspensions of cLECs were prepared by digestion of freshly
dissected CLVs with a cocktail of Blendzyme III (Roche) and DNase (Sigma-
Aldrich) for 1.5–2 hr at 37�C. Cells were either seeded on fibronectin (5 mg/ml;
Sigma-Aldrich)-coated dishes for in vitro expansion, or subjected to immunoi-
solation by MACS (Miltenyi Biotec) using rabbit anti-mouse podoplanin anti-
body (30 mg/ml, Sigma-Aldrich). See Supplemental Experimental Procedures
for full method.
Flow Cytometry and Immunofluorescence
See Supplemental Experimental Procedures for full method.
Immunoprecipitation and Western Blotting
See Supplemental Experimental Procedures for full methods.
Immunohistochemistry and BrdU Incorporation
Mouse tissues were fixed in 4% paraformaldehyde before paraffin embedding
for analysis. See Supplemental Experimental Procedures for full methods.
RNA Isolation and Microarray Analysis
RNA was isolated using the RNeasy kit as per manufacturer’s instructions
(QIAGEN). See Supplemental Experimental Procedures for full methods.
Quantitative PCR
See Supplemental Experimental Procedures for a list of primers.
Quantification and Statistical Analysis
Images were quantified using Metamorph software. Student’s t test (Minitab
for Windows, MiniTab Inc) and HOLMS test were used for statistical analyses
where indicated.
ACCESSION NUMBERS
Microarray data were deposited in NCBI’s Gene Expression Omnibus; series
accession number GSE34135. (http://www.ncbi.nlm.nih.gov/geo/query/acc.
cgi?acc=GSE34135).
ing metastatic VEGF-D-293EBNA tumors treated with neutralizing VEGFR-2
etastatic tumor control (G). Scale bars: 1 mm.
tatic VEGF-D-293EBNA tumors treated with neutralizing VEGFR-2 (DC101),
4. **p < 0.01 by t test.
ancer Cell 21, 181–195, February 14, 2012 ª2012 Elsevier Inc. 191

A
B C D
E F
G
M
JIH
K L
N
U
V W
QPO
R S T
Figure 6. NSAIDs Reverse Collecting Lymphatic Vessel Dilation during Metastatic Disease and Suppress Tumor Spread
(A) Measurement of subcutaneous VEGF-D-293EBNA and MDA-MB-435 tumors in mice undergoing treatment with NSAID, (Etodolac). Data are presented as
mean tumor volume (mm3) ± SEM. Tumor volumes are shown as a function of time (in days); n R 6.
(B–F) Immunohistochemical staining for the lymphatic marker LYVE-1 from mice bearing metastatic VEGF-D-293EBNA (B and C) and MDA-MB-435 (E and F)
tumors treated with NSAID (B and E), vehicle (C and F), or nonmetastatic 293EBNA tumor control (D). Arrows indicate vessels. Representative images are
depicted. Scale bars: 200 mm.
(G) Tumoral lymphatic vessel density (LYVE-1) in VEGF-D-293EBNA and MDA-MB-435 breast tumors frommice treated with either NSAID or the vehicle control.
Data are the mean of three sections/mouse ± SEM; n R 6.
(H–L)Macroscopic appearance of CLVs filledwith Patent Blue V frommice bearingmetastatic VEGF-D-293EBNA tumors (H and I) orMDA-MB-435 breast tumors
(K and L) treated with either vehicle (H and K) or NSAID (I and L), compared to the nonmetastatic 293EBNA tumor control (J). Scale bars: 1 mm.
(M) Diameter of CLVs in mice bearing metastatic VEGF-D-293EBNA or MDA-MB-435 breast tumors treated with either NSAID or vehicle. Data are mean ± SEM;
n R 6. *p < 0.05 and **p < 0.01 by t test.
(N) PGE2 levels in plasma from mice bearing metastatic VEGF-D-293EBNA or MDA-MB-435 breast tumors treated with either NSAID or vehicle. Assay was
performed in triplicate. Data are mean ± SEM; n R 5. *p < 0.05 by t test.
Cancer Cell
PGs Regulate Metastasis in Collecting Lymphatics
192 Cancer Cell 21, 181–195, February 14, 2012 ª2012 Elsevier Inc.

A B
Figure 7. Schematic Overview of VEGF-D Effects in Tumor Metastasis
VEGF-D secreted by tumor cells promotes LN metastasis by (A) facilitating entry of tumor cells into initial lymphatics and (B) altering CLV dilation to facilitate
transit of tumor cells to the SLN. This is modulated by downregulation of PGDH, resulting in high levels of PGs secreted by cLECs as depicted in (I). Inhibitors
targeting the VEGF-D/VEGFR-2/VEGFR-3 or PG pathways in cLECs are likely to reduce PG levels and thereby restore vessel tone, suppressing metastasis as
shown in (II).
Cancer Cell
PGs Regulate Metastasis in Collecting Lymphatics
SUPPLEMENTAL INFORMATION
Supplemental Information includes four figures and Supplemental Experi-
mental Procedures and can be found with this article online at doi:10.1016/j.
ccr.2011.12.026.
ACKNOWLEDGMENTS
The authors thank Dr. Maria Macheda for critically reviewing the manuscript,
Ms. Janna Taylor for assistance in generating figures, Dr. Bronislaw Pytow-
ski for providing neutralizing VEGFR-2 and VEGFR-3 antibodies, and
Dr. Matthias Francois for helpful discussion. This work was funded partly
by a Program Grant from the National Health and Medical Research Council
of Australia (NHMRC) and by funds from the Operational Infrastructure
Support Program provided by the Victorian Government, Australia. S.A.S.
and M.G.A. are supported by Senior Research Fellowships from the
NHMRC. S.A.S. would like to acknowledge the support of the Pfizer
Australia Fellowship. R.S. is supported by the Raelene Boyle Sporting
Chance Foundation and Royal Australasian College of Surgeons (RACS)
Foundation Scholarship, and the RACS Surgeon Scientist Program.
S.P.W. is supported by a National Breast Cancer Foundation Doctoral
Research Scholarship. N.C.H. and R.H.F. are supported by a Melbourne
Research Scholarship from the University of Melbourne, Australia. E.K.S.
is supported by a National Breast Cancer Foundation early career award
and an NHMRC grant (1008865).
(O–T) Macroscopic appearance of LN from VEGF-D-293EBNA tumor bearing mic
and T) of LN sections frommice bearing VEGF-D-293EBNA (P and S) or MDA-MB
Dotted lines indicate micrometastatic foci within the LN. Scale bars: 200 mm.
(U) Quantification of metastatic burden in LNs frommice bearing metastatic VEGF
or the nonmetastatic 293EBNA tumor control. Data are mean ± SEM; n R 6. **p
(V andW) H&E staining of lung tissue frommice bearing metastatic MDA-MB-435
lines indicate micrometastatic foci. Scale bars: 100 mm.
See also Figure S4.
C
Received: January 28, 2011
Revised: October 10, 2011
Accepted: December 23, 2011
Published: February 13, 2012
REFERENCES
Achen, M.G., and Stacker, S.A. (2006). Tumor lymphangiogenesis and meta-
static spread-new players begin to emerge. Int. J. Cancer 119, 1755–1760.
Achen, M.G., and Stacker, S.A. (2008). Molecular control of lymphatic metas-
tasis. Ann. N Y Acad. Sci. 1131, 225–234.
Achen, M.G., Jeltsch, M., Kukk, E., Makinen, T., Vitali, A., Wilks, A.F., Alitalo,
K., and Stacker, S.A. (1998). Vascular endothelial growth factor D (VEGF-D)
is a ligand for the tyrosine kinases VEGF receptor 2 (Flk1) and VEGF receptor
3 (Flt4). Proc. Natl. Acad. Sci. USA 95, 548–553.
Achen, M.G., Roufail, S., Domagala, T., Catimel, B., Nice, E.C., Geleick, D.M.,
Murphy, R., Scott, A.M., Caesar, C.,Makinen, T., et al. (2000). Monoclonal anti-
bodies to vascular endothelial growth factor-D block its interactions with both
VEGF receptor-2 and VEGF receptor-3. Eur. J. Biochem. 267, 2505–2515.
Albuquerque, R.J., Hayashi, T., Cho, W.G., Kleinman, M.E., Dridi, S., Takeda,
A., Baffi, J.Z., Yamada, K., Kaneko, H., Green, M.G., et al. (2009). Alternatively
spliced vascular endothelial growth factor receptor-2 is an essential endoge-
nous inhibitor of lymphatic vessel growth. Nat. Med. 15, 1023–1030.
e treated with vehicle (O) or NSAID (R) Scale bars: 1 mm. H&E staining (P, Q, S,
A-435 tumors (Q and T), treated with either NSAID (S and T) or vehicle (P and Q).
-D-293EBNA or MDA-MBA-435 tumors and treated with the NSAID or vehicle,
< 0.01 by t test.
breast tumors from animals treated with either vehicle (V) or NSAID (W). Dotted
ancer Cell 21, 181–195, February 14, 2012 ª2012 Elsevier Inc. 193

Cancer Cell
PGs Regulate Metastasis in Collecting Lymphatics
Amano, H., Hayashi, I., Endo, H., Kitasato, H., Yamashina, S., Maruyama, T.,
Kobayashi, M., Satoh, K., Narita, M., Sugimoto, Y., et al. (2003). Host prosta-
glandin E(2)-EP3 signaling regulates tumor-associated angiogenesis and
tumor growth. J. Exp. Med. 197, 221–232.
Backlund, M.G., Mann, J.R., and Dubois, R.N. (2005a). Mechanisms for the
prevention of gastrointestinal cancer: the role of prostaglandin E2. Oncology
69 (Suppl 1 ), 28–32.
Backlund, M.G., Mann, J.R., Holla, V.R., Buchanan, F.G., Tai, H.H., Musiek,
E.S., Milne, G.L., Katkuri, S., and DuBois, R.N. (2005b). 15-
Hydroxyprostaglandin dehydrogenase is down-regulated in colorectal cancer.
J. Biol. Chem. 280, 3217–3223.
Baluk, P., Fuxe, J., Hashizume, H., Romano, T., Lashnits, E., Butz, S.,
Vestweber, D., Corada, M., Molendini, C., Dejana, E., and McDonald, D.M.
(2007). Functionally specialized junctions between endothelial cells of
lymphatic vessels. J. Exp. Med. 204, 2349–2362.
Bjorndahl, M.A., Cao, R., Burton, J.B., Brakenhielm, E., Religa, P., Galter, D.,
Wu, L., and Cao, Y. (2005). Vascular endothelial growth factor-a promotes
peritumoral lymphangiogenesis and lymphatic metastasis. Cancer Res. 65,
9261–9268.
Cao, R., Bjorndahl, M.A., Religa, P., Clasper, S., Garvin, S., Galter, D., Meister,
B., Ikomi, F., Tritsaris, K., Dissing, S., et al. (2004). PDGF-BB induces intratu-
moral lymphangiogenesis and promotes lymphatic metastasis. Cancer Cell 6,
333–345.
Cha, Y.I., and DuBois, R.N. (2007). NSAIDs and cancer prevention: targets
downstream of COX-2. Annu. Rev. Med. 58, 239–252.
Challis, J.R., Dilley, S.R., Robinson, J.S., and Thorburn, G.D. (1976).
Prostaglandins in the circulation of the fetal lamb. Prostaglandins 11, 1041–
1052.
Clasper, S., Royston, D., Baban, D., Cao, Y., Ewers, S., Butz, S., Vestweber,
D., and Jackson, D.G. (2008). A novel gene expression profile in lymphatics
associated with tumor growth and nodal metastasis. Cancer Res. 68, 7293–
7303.
Coggins, K.G., Latour, A., Nguyen, M.S., Audoly, L., Coffman, T.M., and Koller,
B.H. (2002). Metabolism of PGE2 by prostaglandin dehydrogenase is essential
for remodeling the ductus arteriosus. Nat. Med. 8, 91–92.
Di, J.M., Zhou, J., Zhou, X.L., Gao, X., Shao, C.Q., Pang, J., Sun, Q.P., Zhang,
Y., and Ruan, X.X. (2009). Cyclooxygenase-2 expression is associated with
vascular endothelial growth factor-C and lymph node metastases in human
prostate cancer. Arch. Med. Res. 40, 268–275.
Farnsworth, R.H., Karnezis, T., Shayan, R., Matsumoto, M., Nowell, C.J.,
Achen, M.G., and Stacker, S.A. (2011). A role for bone morphogenetic
protein-4 in lymph node vascular remodeling and primary tumor growth.
Cancer Res. 71, 6547–6557.
Fukumura, D., Kashiwagi, S., and Jain, R.K. (2006). The role of nitric oxide in
tumour progression. Nat. Rev. Cancer 6, 521–534.
Glaser, K., Sung, M.L., O’Neill, K., Belfast, M., Hartman, D., Carlson, R., Kreft,
A., Kubrak, D., Hsiao, C.L., and Weichman, B. (1995). Etodolac selectively
inhibits human prostaglandin G/H synthase 2 (PGHS-2) versus human
PGHS-1. Eur. J. Pharmacol. 281, 107–111.
Greenhough, A., Smartt, H.J., Moore, A.E., Roberts, H.R., Williams, A.C.,
Paraskeva, C., and Kaidi, A. (2009). The COX-2/PGE2 pathway: key roles in
the hallmarks of cancer and adaptation to the tumour microenvironment.
Carcinogenesis 30, 377–386.
Gupta, R.A., and Dubois, R.N. (2001). Colorectal cancer prevention and treat-
ment by inhibition of cyclooxygenase-2. Nat. Rev. Cancer 1, 11–21.
Hansen-Petrik, M.B., McEntee, M.F., Jull, B., Shi, H., Zemel, M.B., and
Whelan, J. (2002). Prostaglandin E(2) protects intestinal tumors from nonste-
roidal anti-inflammatory drug-induced regression in Apc(Min/+) mice.
Cancer Res. 62, 403–408.
He, Y., Rajantie, I., Pajusola, K., Jeltsch, M., Holopainen, T., Yla-Herttuala, S.,
Harding, T., Jooss, K., Takahashi, T., and Alitalo, K. (2005). Vascular endothe-
lial cell growth factor receptor 3-mediated activation of lymphatic endothelium
is crucial for tumor cell entry and spread via lymphatic vessels. Cancer Res. 65,
4739–4746.
194 Cancer Cell 21, 181–195, February 14, 2012 ª2012 Elsevier Inc.
Hirsch, H.A., Iliopoulos, D., Joshi, A., Zhang, Y., Jaeger, S.A., Bulyk, M.,
Tsichlis, P.N., Shirley Liu, X., and Struhl, K. (2010). A transcriptional signature
and common gene networks link cancer with lipid metabolism and diverse
human diseases. Cancer Cell 17, 348–361.
Holmes, M.D., Chen, W.Y., Li, L., Hertzmark, E., Spiegelman, D., and
Hankinson, S.E. (2010). Aspirin intake and survival after breast cancer.
J. Clin. Oncol. 28, 1467–1472.
Hoshida, T., Isaka, N., Hagendoorn, J., di Tomaso, E., Chen, Y.L., Pytowski,
B., Fukumura, D., Padera, T.P., and Jain, R.K. (2006). Imaging steps of
lymphatic metastasis reveals that vascular endothelial growth factor-C
increases metastasis by increasing delivery of cancer cells to lymph nodes:
therapeutic implications. Cancer Res. 66, 8065–8075.
Iwata, C., Kano, M.R., Komuro, A., Oka, M., Kiyono, K., Johansson, E.,
Morishita, Y., Yashiro, M., Hirakawa, K., Kaminishi, M., and Miyazono, K.
(2007). Inhibition of cyclooxygenase-2 suppresses lymph node metastasis
via reduction of lymphangiogenesis. Cancer Res. 67, 10181–10189.
Jaffe, B.M., Parker, C.W., and Philpott, G.W. (1971). Immunochemical
measurement of prostaglandin or prostaglandin-like activity from normal and
neoplastic cultured tissue. Surg. Forum 22, 90–92.
Jeltsch, M., Kaipainen, A., Joukov, V., Meng, X., Lakso, M., Rauvala, H.,
Swartz, M., Fukumura, D., Jain, R.K., and Alitalo, K. (1997). Hyperplasia of
lymphatic vessels in VEGF-C transgenic mice. Science 276, 1423–1425.
Joukov, V., Pajusola, K., Kaipainen, A., Chilov, D., Lahtinen, I., Kukk, E.,
Saksela, O., Kalkkinen, N., and Alitalo, K. (1996). A novel vascular endothelial
growth factor, VEGF-C, is a ligand for the Flt4 (VEGFR-3) and KDR (VEGFR-2)
receptor tyrosine kinases. EMBO J. 15, 290–298.
Kerjaschki, D., Bago-Horvath, Z., Rudas, M., Sexl, V., Schneckenleithner, C.,
Wolbank, S., Bartel, G., Krieger, S., Kalt, R., Hantusch, B., et al. (2011).
Lipoxygenase mediates invasion of intrametastatic lymphatic vessels and
propagates lymph nodemetastasis of humanmammary carcinoma xenografts
in mouse. J. Clin. Invest. 121, 2000–2012.
Kopfstein, L., Veikkola, T., Djonov, V.G., Baeriswyl, V., Schomber, T.,
Strittmatter, K., Stacker, S.A., Achen, M.G., Alitalo, K., and Christofori, G.
(2007). Distinct roles of vascular endothelial growth factor-D in lymphangio-
genesis and metastasis. Am. J. Pathol. 170, 1348–1361.
Koukourakis, M.I., Giatromanolaki, A., Thorpe, P.E., Brekken, R.A., Sivridis, E.,
Kakolyris, S., Georgoulias, V., Gatter, K.C., and Harris, A.L. (2000). Vascular
endothelial growth factor/KDR activated microvessel density versus CD31
standard microvessel density in non-small cell lung cancer. Cancer Res. 60,
3088–3095.
Kriehuber, E., Breiteneder-Geleff, S., Groeger, M., Soleiman, A., Schoppmann,
S.F., Stingl, G., Kerjaschki, D., and Maurer, D. (2001). Isolation and character-
ization of dermal lymphatic and blood endothelial cells reveal stable and func-
tionally specialized cell lineages. J. Exp. Med. 194, 797–808.
Kubo, H., Hosono, K., Suzuki, T., Ogawa, Y., Kato, H., Kamata, H., Ito, Y.,
Amano, H., Kato, T., Sakagami, H., et al. (2010). Host prostaglandin EP3
receptor signaling relevant to tumor-associated lymphangiogenesis.
Biomed. Pharmacother. 64, 101–106.
Leitzmann,M.F., Stampfer, M.J.,Ma, J., Chan, J.M., Colditz, G.A.,Willett,W.C.,
and Giovannucci, E. (2002). Aspirin use in relation to risk of prostate cancer.
Cancer Epidemiol. Biomarkers Prev. 11, 1108–1111.
Liu, H., Yang, Y., Xiao, J., Lv, Y., Liu, Y., Yang, H., and Zhao, L. (2010). COX-2-
mediated regulation of VEGF-C in association with lymphangiogenesis and
lymph node metastasis in lung cancer. Anat. Rec. (Hoboken) 293, 1838–1846.
Liotta, L.A. (1992). Cancer cell invasion and metastasis. Sci. Am. 266, 54–59,
62–63.
Makinen, T., Jussila, L., Veikkola, T., Karpanen, T., Kettunen, M.I., Pulkkanen,
K.J., Kauppinen, R., Jackson, D.G., Kubo, H., Nishikawa, S., et al. (2001).
Inhibition of lymphangiogenesis with resulting lymphedema in transgenic
mice expressing soluble VEGF receptor-3. Nat. Med. 7, 199–205.
Makinen, T., Adams, R.H., Bailey, J., Lu, Q., Ziemiecki, A., Alitalo, K., Klein, R.,
and Wilkinson, G.A. (2005). PDZ interaction site in ephrinB2 is required for the
remodeling of lymphatic vasculature. Genes Dev. 19, 397–410.

Cancer Cell
PGs Regulate Metastasis in Collecting Lymphatics
Mandriota, S.J., Jussila, L., Jeltsch, M., Compagni, A., Baetens, D., Prevo, R.,
Banerji, S., Huarte, J., Montesano, R., Jackson, D.G., et al. (2001). Vascular
endothelial growth factor-C-mediated lymphangiogenesis promotes tumour
metastasis. EMBO J. 20, 672–682.
Mantovani, A., Allavena, P., Sica, A., and Balkwill, F. (2008). Cancer-related
inflammation. Nature 454, 436–444.
Messina, E.J., Weiner, R., and Kaley, G. (1974). Microcirculatory effects of
prostaglandins E1, E2, and A1 in the rat mesentery and cremaster muscle.
Microvasc. Res. 8, 77–89.
Myung, S.J., Rerko, R.M., Yan,M., Platzer, P., Guda, K., Dotson, A., Lawrence,
E., Dannenberg, A.J., Lovgren, A.K., Luo, G., et al. (2006). 15-
Hydroxyprostaglandin dehydrogenase is an in vivo suppressor of colon tumor-
igenesis. Proc. Natl. Acad. Sci. USA 103, 12098–12102.
Nilsson, I., Bahram, F., Li, X., Gualandi, L., Koch, S., Jarvius, M., Soderberg,
O., Anisimov, A., Kholova, I., Pytowski, B., et al. (2010). VEGF receptor 2/-3
heterodimers detected in situ by proximity ligation on angiogenic sprouts.
EMBO J. 29, 1377–1388.
Oliver, G., and Alitalo, K. (2005). The lymphatic vasculature: recent progress
and paradigms. Annu. Rev. Cell Dev. Biol. 21, 457–483.
Olsson, A.G., and Carlson, L.A. (1976). Clinical, hemodynamic and metabolic
effects of intraarterial infusions of prostaglandin E1 in patients with peripheral
vascular disease. Adv. Prostaglandin Thromboxane Res. 1, 429–432.
Pepper, M.S. (2001). Lymphangiogenesis and tumor metastasis: myth or
reality? Clin. Cancer Res. 7, 462–468.
Pichaud, F., Roux, S., Frendo, J.L., Delage-Mourroux, R., Maclouf, J., de
Vernejoul, M.C., Moukhtar, M.S., and Jullienne, A. (1997). 1,25-dihydroxyvita-
min D3 induces NAD(+)-dependent 15-hydroxyprostaglandin dehydrogenase
in human neonatal monocytes. Blood 89, 2105–2112.
Podgrabinska, S., Braun, P., Velasco, P., Kloos, B., Pepper, M.S., and Skobe,
M. (2002). Molecular characterization of lymphatic endothelial cells. Proc. Natl.
Acad. Sci. USA 99, 16069–16074.
Pugh, S., and Thomas, G.A. (1994). Patients with adenomatous polyps and
carcinomas have increased colonic mucosal prostaglandin E2. Gut 35,
675–678.
Rigas, B., Goldman, I.S., and Levine, L. (1993). Altered eicosanoid levels in
human colon cancer. J. Lab. Clin. Med. 122, 518–523.
Ristimaki, A., Honkanen, N., Jankala, H., Sipponen, P., and Harkonen, M.
(1997). Expression of cyclooxygenase-2 in human gastric carcinoma.
Cancer Res. 57, 1276–1280.
Roberts, N., Kloos, B., Cassella, M., Podgrabinska, S., Persaud, K., Wu, Y.,
Pytowski, B., and Skobe, M. (2006). Inhibition of VEGFR-3 activation with
the antagonistic antibody more potently suppresses lymph node and distant
metastases than inactivation of VEGFR-2. Cancer Res. 66, 2650–2657.
Sappy, P.C. (1874). Anatomy, Physiology and Pathology of Lymphatic Vessels
in Man and Vertebrates (Paris: DeLahaye, A).
C
Shayan, R., Achen, M.G., and Stacker, S.A. (2006). Lymphatic vessels in
cancer metastasis: bridging the gaps. Carcinogenesis 27, 1729–1738.
Skobe, M., Hawighorst, T., Jackson, D.G., Prevo, R., Janes, L., Velasco, P.,
Riccardi, L., Alitalo, K., Claffey, K., and Detmar, M. (2001). Induction of tumor
lymphangiogenesis by VEGF-C promotes breast cancermetastasis. Nat. Med.
7, 192–198.
Sleeman, J.P., and Thiele, W. (2009). Tumor metastasis and the lymphatic
vasculature. Int. J. Cancer 125, 2747–2756.
Sleeman, J.P., Nazarenko, I., and Thiele, W. (2011). Do all roads lead to Rome?
Routes to metastasis development. Int. J. Cancer 128, 2511–2526.
Sloan, E.K., Priceman, S.J., Cox, B.F., Yu, S., Pimentel, M.A.,
Tangkanangnukul, V., Arevalo, J.M., Morizono, K., Karanikolas, B.D., Wu, L.,
et al. (2010). The sympathetic nervous system induces a metastatic switch
in primary breast cancer. Cancer Res. 70, 7042–7052.
St Croix, B., Rago, C., Velculescu, V., Traverso, G., Romans, K.E.,
Montgomery, E., Lal, A., Riggins, G.J., Lengauer, C., Vogelstein, B., and
Kinzler, K.W. (2000). Genes expressed in human tumor endothelium.
Science 289, 1197–1202.
Stacker, S.A., Caesar, C., Baldwin, M.E., Thornton, G.E., Williams, R.A., Prevo,
R., Jackson, D.G., Nishikawa, S., Kubo, H., and Achen, M.G. (2001). VEGF-D
promotes the metastatic spread of tumor cells via the lymphatics. Nat. Med. 7,
186–191.
Stacker, S.A., Williams, R.A., and Achen, M.G. (2004). Lymphangiogenic
growth factors as markers of tumor metastasis. APMIS 112, 539–549.
Tang, E.H., and Vanhoutte, P.M. (2008). Gene expression changes of prosta-
noid synthases in endothelial cells and prostanoid receptors in vascular
smooth muscle cells caused by aging and hypertension. Physiol. Genomics
32, 409–418.
Tammela, T., and Alitalo, K. (2010). Lymphangiogenesis: molecular mecha-
nisms and future promise. Cell 140, 460–476.
Thun, M.J., and Heath, C.W., Jr. (1995). Aspirin use and reduced risk of gastro-
intestinal tract cancers in the American Cancer Society prospective studies.
Prev. Med. 24, 116–118.
Tsujii, M., Kawano, S., Tsuji, S., Sawaoka, H., Hori, M., and DuBois, R.N.
(1998). Cyclooxygenase regulates angiogenesis induced by colon cancer
cells. Cell 93, 705–716.
Whorton, A.R., Smigel, M., Oates, J.A., and Frolich, J.C. (1978). Regional
differences in prostacyclin formation by the kidney. Prostacyclin is a major
prostaglandin of renal cortex. Biochim. Biophys. Acta 529, 176–180.
Williams, C.S., Tsujii, M., Reese, J., Dey, S.K., and DuBois, R.N. (2000).
Host cyclooxygenase-2 modulates carcinoma growth. J. Clin. Invest. 105,
1589–1594.
Wolf, I., O’Kelly, J., Rubinek, T., Tong, M., Nguyen, A., Lin, B.T., Tai, H.H.,
Karlan, B.Y., and Koeffler, H.P. (2006). 15-Hydroxyprostaglandin dehydro-
genase is a tumor suppressor of human breast cancer. Cancer Res. 66,
7818–7823.
ancer Cell 21, 181–195, February 14, 2012 ª2012 Elsevier Inc. 195

Cancer Cell
Article
Aurora Kinase-A Inactivates DNA Damage-InducedApoptosis and Spindle Assembly CheckpointResponse Functions of p73Hiroshi Katayama,1 Jin Wang,1 Warapen Treekitkarnmongkol,1 Hidehiko Kawai,2 Kaori Sasai,1 Hui Zhang,1 Hua Wang,3
Henry P. Adams,4 Shoulei Jiang,1 Sandip N. Chakraborty,1 Fumio Suzuki,2 Ralph B. Arlinghaus,1 Jinsong Liu,3
James A. Mobley,5,7 William E. Grizzle,6,7 Huamin Wang,3 and Subrata Sen1,*1Department of Molecular Pathology, The University of Texas M.D. Anderson Cancer Center, Houston, TX 77054, USA2Department of Molecular Radiobiology, Research Institute for Radiation Biology and Medicine, Hiroshima University,
Hiroshima 734-8553, Japan3Department of Pathology4Department of GeneticsThe University of Texas M.D. Anderson Cancer Center, Houston, TX 77030, USA5Department of Surgery6Department of Pathology7Comprehensive Cancer CenterUniversity of Alabama at Birmingham, Birmingham, AL 35294, USA
*Correspondence: [email protected]
DOI 10.1016/j.ccr.2011.12.025
SUMMARY
Elevated Aurora kinase-A expression is correlated with abrogation of DNA damage-induced apoptoticresponse and mitotic spindle assembly checkpoint (SAC) override in human tumor cells. We report thatAurora-A phosphorylation of p73 at serine235 abrogates its transactivation function and causes cytoplasmicsequestration in a complex with the chaperon protein mortalin. Aurora-A phosphorylated p73 also facilitatesinactivation of SAC through dissociation of the MAD2-CDC20 complex in cells undergoing mitosis. Cellsexpressing phosphor-mimetic mutant (S235D) of p73 manifest altered growth properties, resistance tocisplatin- induced apoptosis, as well as premature dissociation of the MAD2-CDC20 complex, and acceler-ated mitotic exit with SAC override in the presence of spindle damage. Elevated cytoplasmic p73 in Aurora-Aoverexpressing primary human tumors corroborates the experimental findings.
INTRODUCTION G2/M progression, centrosome maturation-separation, bipola
Aurora kinase-A (also called STK15/BTAK; hereinafter referred to
as Aurora-A), a key regulator of the mitotic cell division cycle, is
overexpressed in many human tumors and is associated with
abrogation of DNA damage-induced apoptotic response and
spindle assembly checkpoint (SAC) override in cancer cells.
Aurora-A, a cancer susceptibility gene (Ewart-Toland et al., 2003),
plays essential roles in the commitment of proliferating cells to
Significance
Resistance to DNA and spindle-damaging chemotherapeutictions in human cancer. Elevated Aurora kinase-A expression isdeterminant of chemosensitivity in tumor cells. Our findings dinactivation of its DNA damage and spindle assembly checkpochromatin-binding affinity, is sequestered in the cytoplasm,assembly checkpoint complex. Elucidation of the molecularDNA and spindle targeted therapeutic agents in Aurora-A ovtherapeutic regimens.
196 Cancer Cell 21, 196–211, February 14, 2012 ª2012 Elsevier Inc.
r
spindle formation, and spindle damage recovery (Marumoto
et al., 2005; Katayama et al., 2008; Mac�urek et al., 2008; Seki
et al., 2008). We and others have previously identified functional
inactivation of p53 tumor suppressor protein after Aurora-A phos-
phorylation at serine 315and serine 215 residues; the former facil-
itates Mdm2-mediated degradation, and the latter causes loss of
DNA-binding ability in human cells (Katayama et al., 2004; Liu
et al., 2004). Aurora-A phosphorylation of BRCA1 at serine 308
drugs is a major challenge to effective therapeutic interven-correlated with chemotherapy resistance, and p73 is a majoremonstrate that p73 phosphorylation by Aurora-A results inint response functions. Aurora-A-phosphorylated p73 losesand facilitates dissociation of the MAD2-CDC20 spindlemechanisms underlying the development of resistance toerexpressing tumors should help us design more effective

Cancer Cell
Aurora-A Regulation of p73 Checkpoint Function
is correlatedwith silencing ofDNAdamage-inducedG2/Mcheck-
point (Ouchi et al., 2004). Furthermore, overexpression of Aurora-
A makes HeLa cells resistant to taxol-induced cell death due to
mitotic SAC override (Anand et al., 2003). A recent study found
that treatment of p53-deficient cells with Aurora-A small molecule
inhibitors activates p73 transactivation function with upregulation
of its downstream target genes during induction of cell death (Dar
et al., 2008). However, the molecular mechanisms underlying the
observed effects have not been elucidated.
The role of p73 in tumorigenesis has been debated because
loss of function mutations in the gene is rare. However, recently
developed transactivation-competent (TA) p73-specific gene-
knockout mice have a high incidence of spontaneous and
carcinogen-induced tumors (Tomasini et al., 2008). In addition,
oocytes and cells lacking TAp73 exhibit abnormal spindle struc-
ture and mitotic slippage with spindle poisons, indicating partic-
ipation of TAp73 in the SAC pathway (Tomasini et al., 2009).
More recent studies have demonstrated that TAp73 interacts
with SAC proteins Bub1, Bub3, and BubR1. TAp73-deficient or
knockdown cells reveal mislocalization of Bub1 and BubR1 at
the kinetochore and reduced BubR1 kinase activity, associated
with aneuploidy and chromosome instability (Tomasini et al.,
2009; Vernole et al., 2009). Together with proapoptotic function
of TAp73 in response to genotoxic stress, these results suggest
that p73 is directly involved in maintaining genomic stability and
regulating SAC pathway.
In view of Aurora-A overexpression reported to induce resis-
tance to DNA damage-mediated apoptosis response and SAC
override, we investigated the possible role of Aurora-A functional
interaction with p73 and the underlying molecular mechanisms
involved in the development of these phenotypes.
RESULTS
Aurora-A Phosphorylates p73We hypothesized that direct phosphorylation of p73 by Aurora-A
negatively regulates p73 transactivation function and conse-
quential activation of apoptosis response. Because p73 is
reported to be phosphorylated in mitosis (Fulco et al., 2003),
we treated nocodazole- and taxol-arrested mitotic Cos-1 cells
with Aurora-A-specific inhibitor MLN8054 and proteasome
inhibitor MG132 to detect Aurora-A-specific posttranslational
p73 modification. p73 from inhibitor-treated mitotic cells
migrated faster than that from untreated cells, whereas p73
from exponentially growing cells had intermediate mobility (Fig-
ure 1A). The slower migrating form was seen in cells with active
Aurora-A, detected with anti-phospho T288 antibody. To deter-
mine whether slower mobility of p73 was due to phosphorylation
and whether Aurora-A is directly involved in p73 phosphoryla-
tion, we treated cell extracts with lPPase, with or without
Aurora-A inhibitor. While inhibitor treatment alone resulted in
minimal increase in mobility, lPPase treatment, both with or
without Aurora-A inhibitor, led to similar yet markedly faster
migration in p73. These results indicate that slower mobility
was due to multiple phosphorylations, possibly catalyzed by
several kinases, including Aurora-A. Aurora-A inhibition alone
resulted in aminor downward shift in gel mobility due to selective
interference with Aurora-A phosphorylation, but the more
rapidly migrating form was due to complete dephosphorylation
C
with lPPase (Figure 1A). To determine direct involvement of
Aurora-A in p73 phosphorylation in vivo, we performed p73
immunoprecipitation, followed by immunoblotting with the
anti-phospho-PKA substrate antibody, which recognizes the
Aurora-A consensus phosphorylation motif in substrate proteins
(Katayama et al., 2007; Plotnikova et al., 2011). We observed
clear phosphor-PKA signal in immunoprecipitated p73 from
nocodazole-treated mitotic cells, which was diminished in inhib-
itor-treated samples. In exponentially growing cells, the phos-
phor-PKA signal changed little after treatment (Figure 1B). These
findings further verified the involvement of Aurora-A in p73 phos-
phorylation in vivo (Figures 1C and 1D).
We next performed an in vitro kinase assay of p73, with or
without wild-type (WT) or kinase-dead (KD) Aurora-A, with the
closely related paralog Aurora-B as a control. Aurora-A-WT phos-
phorylated p73, but Aurora-A-KD did not (Figure 1E). Complete
absence of phosphorylation signal on p73 with Aurora-B further
validated Aurora-A as the bona fide kinase of p73. We next iden-
tified the specific Aurora-A phosphorylated amino acid residue
in p73 using site-directed mutants in Aurora kinase consensus
phosphorylation motifs and subjecting them to in vitro kinase
assays. Theserine235alanine (S235A)mutant ofp73had reduced
phosphorylation than p73-WT, indicating that S235 is phosphory-
latedbyAurora-A (Figure1F).We furtherconfirmed thisphosphor-
ylation using an anti-phospho-PKA substrate-specific antibody.
p73-WT phosphorylation was evident in cells coexpressing
Aurora-A but not those expressing the empty vector. Phosphory-
lation was significantly diminished in cells expressing the S235A
mutant, demonstrating that serine 235 in p73 is phosphorylated
by Aurora-A (Figure 1G). It is intriguing that transactivation-defec-
tive DNp73 showed minimal loss of phosphorylation in the SA
mutant of the conserved motif and appeared to bind the WT and
the phosphor-mimetic (S235D) mutant of p73 with similar effi-
ciency (Figures S1A and S1B available online).
We determined in vivo interaction between Aurora-A and p73
by immunoprecipitation of 293T cells cotransfected with Flag-
Aurora-A and GFP-p73. Anti-Flag antibody revealed a specific
interaction between p73 and Aurora-A (Figure 1H). Anti-Flag
antibody immunoprecipitations also detected enriched pres-
ence of p73-S235D mutant in the immune complex compared
with S235A mutant (Figure S1C). To determine the interaction
between endogenous Aurora-A and p73, we used synchronized
mitotic cells for reciprocal immunoprecipitation experiments,
which revealed p73 andAurora-A in the same complex (Figure 1I)
that was absent in the p73 knockdown cells (Figure 1J). This
interaction was also detected in human nontumorigenic MCF-
10A mammary epithelial cells and p53-deficient H1299 lung
carcinoma cells (Figures S1D and S1E). Cell cycle dependence
of this interaction was analyzed in synchronized cells after
double thymidine block and release. Consistent with published
data (Fulco et al., 2003), p73 expression was uniform through
the cell cycle. The amount of Aurora-A bound to p73 progres-
sively increased, peaking at mitosis, which was also evident in
nocodazole-treated cells (Figure 1K).
Aurora-A Phosphorylated p73 Loses DNA Binding andTransactivation ActivityBecause the Aurora-A phosphorylation site is located in the
DNA-binding domain, we determined the effect of Aurora-A
ancer Cell 21, 196–211, February 14, 2012 ª2012 Elsevier Inc. 197

A B
DC
EF G
HI
J K
Figure 1. Aurora A Phosphorylates and Interacts with p73
(A) Cos-1 cells, grown with or without nocodazole or taxol for 20 hr, were cultured with or without Aurora-A inhibitor MLN8054 in the presence of MG132
for 4 hr. Whole cell extracts (WCE) were incubated with (+) or without (�) lPPase for 30 min. Samples were analyzed by immunoblotting with the indicated
antibodies.
(B) WCE prepared in (Figure 1A) were immunoprecipitated with anti-p73 antibody and subjected to immunoblotting with anti-pPKA substrate (top) and anti-p73
(bottom) antibodies. The pPKA signal was normalized by the amount of precipitated HA-p73, and the relative pPKA signal was quantified.
(C) HA-p73awas cotransfectedwith empty vector, Flag-WTAurora-A (WT), or Flag-KDAurora-A (KD) into Cos-1 cells. Twenty-four hours later, cells were cultured
with (+) or without (�) Aurora-A inhibitor for 4 hr. WCE were subjected to immunoblotting with anti-HA (top) and anti-Flag (bottom) antibodies.
(D) WCE prepared in (Figure 1C) were treated without (�) or with (+) lPPase for 30 min and analyzed as in (Figure 1C). The middle shows the differential migration
of HA-p73a.
Cancer Cell
Aurora-A Regulation of p73 Checkpoint Function
198 Cancer Cell 21, 196–211, February 14, 2012 ª2012 Elsevier Inc.

Cancer Cell
Aurora-A Regulation of p73 Checkpoint Function
phosphorylation on DNA binding and transactivation activity of
p73. Electrophoretic mobility shift assay (EMSA) revealed that
DNA binding of S235D mutant was markedly inhibited, whereas
S235A mutant had weaker DNA-binding ability compared with
WT (Figure 2A). We next evaluated the transactivation function
of p73 phosphor mutants using a p21 promoter-driven luciferase
assay in H1299 cells. S235D mutant had minimal transactivation
of the p21 promoter, whereas S235A mutant had activity similar
to that of WT (Figure 2B). Endogenous p21 protein levels in cells
expressing p73-WT and phosphor mutants were consistent with
the p73 transcriptional activity detected by luciferase assay. p21
levels were low in S235D mutant cells, compared with WT and
S235A mutant cells (Figure 2C). Similarly, p73-S235D mutant
cells demonstrated diminished expression of p73 target genes
Puma, Bax, and Noxa, compared with p73-WT and S235A
mutant cells (Figure 2D).
We determined whether p73 activity depends on Aurora-A
kinase activity and whether S235A mutant is insensitive to this
activity. Luciferase assay revealed that p73-WT activity was in-
hibited by Aurora-A-WT but not by the KD mutant, whereas
S235A mutant was not inhibited by Aurora-A (Figure 2E). Endog-
enous p21 expression levels in these cells were consistent with
the results of luciferase assay (Figure 2F). Similar transactivation
activity and endogenous target gene levels in the WT and S235A
mutant cells appear to be the result of Aurora-A’s inhibitory
phosphorylation interfering with p73-WT’s transactivation func-
tion in vivo. To investigate this, we transfected p73-WT and
S235A mutant in MCF7 cells, which naturally express high levels
of active Aurora-A (Figure 2G). The results revealed distinctly
elevated p21 protein levels in cells expressing S235A mutant
compared with that in cells expressing WT (Figure 2H). Aurora-
A inhibitor treatment of H1299 cells transfected with empty
vector revealed upregulation of p73 target PUMA mRNA,
whereas S235D interfered with transactivation in a dominant-
negative manner (Figure 2I). These results demonstrate that
Aurora-A phosphorylation of p73 at serine 235 negatively regu-
lates p73 transactivation.
Aurora-A Regulates p73 Subcellular LocalizationProtein fractionation experiments revealed marked accumula-
tion of S235D mutant in the cytoplasmic fraction, whereas accu-
mulation was predominantly nuclear in the WT and S235A
(E) Anti-Flag M2 antibody immunoprecipitates from nocodazole-treated mitotic 2
B-WT, or Flag-Aurora-B-KD were incubated with GST-p73a in the presence of [
ography (left) and Pon-S staining (right). Immunoprecipitated Aurora-A and Auro
(F) Immunoprecipitates with anti-Aurora-A antibody from nocodazole-treated mit
the presence of [g32p]ATP. GST-p73 protein was resolved and visualized as in (F
(G) HA-p73a-WT or -SA were cotransfected with either empty vector or Flag-Au
cipitated with anti-HA antibody, followed by immunoblotting with anti-pPKA subs
with anti-Flag (bottom) antibody. The pPKA signal was normalized by the amoun
(H) GFP-p73a was cotransfected with empty vector or Flag-Aurora-A in 293T
antibody, followed by immunoblotting with indicated antibodies (top and middle
antibody (bottom).
(I) Cos-1 cells were immunoprecipitated with anti-p73 (right) or anti-Aurora-A (
subjected to immunoblotting with anti-p73 and anti-Aurora-A antibodies. Input in
(J) Cos-1 cells were transfected with control siRNA (�) or p73 siRNA (+) for 48
immunoblotting with anti-p73 (top) and anti-Aurora-A (middle) antibodies, respec
(K) Cos-1 cells synchronized by double thymidine block and release were imm
indicated antibodies.
See also Figure S1.
C
mutant cells (Figure 3A). Similar results were found on immuno-
fluorescence microscopy (Figure 3B) and in different cell lines,
such as HeLa, H1299, and MCF7 (data not shown). We next
analyzed whether the cytoplasmic distribution of S235D mutant
was due to its accelerated export from the nucleus or interfer-
ence with its nuclear translocation by treating cells with leptomy-
cin B, an inhibitor of nuclear export of proteins. Protein fraction-
ations revealed cytoplasmic localization of S235D mutant,
regardless of leptomycin B treatment, and more nuclear
accumulation of WT (Figure 3C), indicating that phosphorylated
p73 at serine 235 is tethered in the cytoplasm. Similar results
were observed for S215D mutant of p53 (Figure S2A). Enrich-
ment of the phosphor-mimetic mutant of p73 in the cytoplasmic
fraction was also observed in nocadazole-arrested mitotic cells
with high Aurora-A activity, possibly coinciding with nuclear
envelope breakdown (Figures S2B and S2C). Because proteins
with aberrant conformations are preferentially transported to
the cytoplasm to be degraded, we determined whether cyto-
plasmic distribution of S235D mutant reflected a conformational
change using a glutaraldehyde-based protein cross-linking
assay. Since p73 is a tetramer in its natural state, and if S235
phosphorylation does not affect monomeric p73 structure,
a slower migrating p73 tetramer would still be detectable on
SDS-PAGE. High-MW S235D and S235A mutants migrated
near the tetrameric form of p73-WT (Figure 3D), indicating that
p73 phosphorylation status at serine 235 does not cause confor-
mational changes.
To determine whether endogenous p73 is distributed in the
cytoplasm with Aurora-A, we performed immunofluorescence
microscopy with anti-p73 antibody. Cells overexpressing
Aurora-A showed evenly diffused endogenous p73 staining in
the cytoplasm and nucleus, which were reversed with Aurora-A
inhibitor (Figures 3E and 3F). Protein fractionation experiments
further confirmed these findings (Figure 3G). p73 is localized in
the cytoplasm of MCF-7 breast cancer cell line and Panc-1
pancreatic cancer cell line, both express elevated Aurora-A
levels (Sen et al., 1997; Li et al., 2003). Inhibitor treatment of
these cell lines resulted in p73 nuclear localization (Figure 3H),
confirming that cytoplasmic distribution of p73 is influenced by
Aurora-A kinase activity. Protein fractionation experiments in
Panc-1 cells also supported this observation (Figure 3I). Similar
results were observed in Aurora-A inhibitor treated MCF-7 cells
93T cells transfected with Flag-Aurora-A-WT, Flag-Aurora-A-KD, Flag-Aurora-
g32p]ATP. GST-p73a was resolved by SDS-PAGE and visualized by autoradi-
ra-B were detected with anti-Flag M2 antibody (bottom right).
otic 293T cells were incubated with GST-p73a-WT or GST-p73a-S235A (SA) in
igure 1E).
rora-A-WT into Cos-1 cells. Twenty-four hours later, WCE were immunopre-
trate (top) and anti-HA (middle) antibodies. WCE were directly immunoblotted
t of precipitated HA-p73, and the relative pPKA signal was quantified.
cells. Twenty-four hours later, cells were immunoprecipitated with anti-Flag
). Aliquots of the same cell lysates were directly immunoblotted with anti-GFP
left) antibodies or normal immunoglobulin G (NIG). Immunoprecipitates were
dicates the immunoblot of WCE.
hr and subjected to immunoprecipitation with anti-p73 antibody, followed by
tively. WCE were directly immunoblotted with anti-Aurora-A (bottom) antibody.
unoprecipitated with anti-p73 antibody followed by immunoblotting with the
ancer Cell 21, 196–211, February 14, 2012 ª2012 Elsevier Inc. 199

A D
E
B
C
I
H
G
F
Figure 2. Aurora-A Inhibits DNA Binding and Transactivation Activity of p73
(A) DNA-binding activities of in vitro transcribed and translated proteins of HA-p73a WT, S235A (SA), S235D (SD), and empty vector (emp) were analyzed by
EMSA with a [g32p]ATP-labeled p53/p73 binding consensus oligonucleotide probe. A competition assay was performed with 50-fold molar excess amounts of
unlabeled probe (cold). Buffer was used as a negative control. The reaction was separated by a native polyacrylamide gel (top). The amount of proteins used was
analyzed by immunoblotting with anti-HA antibody (bottom).
(B) H1299 cells were cotransfected with GFP-empty or GFP-p73a-WT or -mutants with luciferase reporter construct containing p21 promoter and Renilla
luciferase reporter internal control plasmid. Twenty-four hours later, cells were subjected to a reporter assay. Data represent mean values ± SD from three
independent experiments.
(C) Protein expression of p21 in cells transfected with GFP-empty and GFP-p73a constructs used in (Figure 2B). Proteins were detected by immunoblotting with
the indicated antibodies.
(D) mRNA expression of p73 target genes in cells used in (Figure 2B), analyzed by semiquantitative RT-PCR.
Cancer Cell
Aurora-A Regulation of p73 Checkpoint Function
200 Cancer Cell 21, 196–211, February 14, 2012 ª2012 Elsevier Inc.

Cancer Cell
Aurora-A Regulation of p73 Checkpoint Function
(data not shown). These results validated that Aurora-A phos-
phorylation of p73 negatively regulates its nuclear localization.
Mortalin Tethers Phospho-p73 in the CytoplasmTo identify the proteins bound to phospho-p73, we immunopre-
cipitated protein complexes with WT and S235D mutant of p73.
A protein band of approximately 80 kD MW was detected only
in the immune complex of the S235Dmutant but not theWT (Fig-
ure 4A). Mass spectrometry identified this protein as mortalin,
amember of the hsp70 family that is implicated in immortalization
and tumorigenesis (Deocaris et al., 2007). Gel filtration column
chromatography revealed that p73 and mortalin existed in high-
MW complexes, distributed over a wide size range. It is inter-
esting that theS235Dmutant andmortalin-containing complexes
were significantly more enriched at >2-megadalton-sized frac-
tions than were the p73-WT andmortalin complexes (Figure 4B).
Enrichment of S235Dmutant andmortalin in the highermolecular
complex was also evident in cell extracts resolved on native gels
immunoblotted with anti-p73 and mortalin antibodies (Fig-
ure S3A). We cotransfected WT or deletion mutant of mortalin
(mot del-BD) lacking the p53binding domain (aa 253–282),
described earlier (Ma et al., 2006), with WT or phosphor mutants
of p73 to determine whether mortalin interaction with the S235D
mutant, tethered in the cytoplasm, was mediated through the
same domain involved in p53 binding. WT and mutant p73 did
not interact with themortalin deletionmutant, but full-lengthmor-
talin’s interaction was enhanced with S235D mutant compared
with WT and S235A mutant (Figure 4C). Similar results were
seen in p53 co-immunoprecipitation experiments (Figure S3B).
These results demonstrate that Aurora-A phosphorylation of
p73 and p53 positively regulates their interactions with mortalin,
mediated through the same binding domain.
Immunoprecipitation experiments revealed enhanced interac-
tion of p73 with mortalin in nocodazole-treated mitotic cell
extracts, compared with extracts from exponentially growing
cells, indicating the importance of p73 phosphorylation in
mitosis for mortalin binding. The specificity of this interaction
was verified by immunoprecipitating the extracts from p73
knockdown cells (Figure 4D). The interaction between Aurora-A
and p73 was not affected by mortalin deletion mutant
(Figure S3C).
To further validate the role of Aurora-A phosphorylation in
regulating p73 binding to mortalin, coimmunoprecipitation of
the two proteins was performed with or without Aurora-A inhib-
itor-treated cells transfected with empty vector or Aurora-A
expression vector. Less mortalin bound to p73 in treated cells
than in untreated cells. A similar effect was seen in empty-
vector-transfected cells, reflecting the effects of endogenous
Aurora-A kinase activity on the binding of p73 to mortalin (Fig-
ure 4E). This finding was corroborated in MCF-7 and Panc-1
(E) GFP-p73a-WT or -SA mutant was cotransfected with empty vector, Flag-Auro
Data represent mean values with ± SD from three independent experiments.
(F) Protein expression of p21 and transfected GFP-p73a and Flag-Aurora-A in c
antibodies.
(G) Expression analysis of active-Aurora-A (pT288) and total Aurora-A in H1299 a
(H) MCF-7 cells transfected with empty vector, HA-p73a-WT, or -SA mutant for
(I) H1299 cells transfected with empty vector or HA-p73a, cultured without (�) or w
by semiquantitative RT-PCR.
C
cells (Figure 4F). Ectopic expression of Aurora-A-KD mutant
demonstrated that mortalin protein stability is not affected by
Aurora-A kinase activity (Figure S3D). Decreased binding of
ectopically expressed and endogenous Aurora-A to p73 in inhib-
itor-treated cells verified that the interaction between Aurora-A
and p73 is kinase activity dependent (Figures 4E and 4F).
To determine the effect of mortalin binding on subcellular
localization of phosphor-mimetic p73, S235D mutant was
cotransfected with the mortalin deletion mutant or an empty
vector in Cos-1 cells. In cells with mutant mortalin, the p73
S235D mutant translocated into the nucleus more than in the
empty-vector-transfected cells (Figures 5A and 5B). Protein frac-
tionation experiments also revealed enhanced nuclear accumu-
lation of S235D mutant in mortalin deletion mutant cells than
in control cells (Figure 5C). To determine whether loss of mortalin
expression had a similar effect on p73 localization, S235D
mutant was expressed in cells transfected with control or
mortalin targeting siRNAs. Protein fractionation revealed that
the nuclear:cytoplasmic ratio was relatively higher in mortalin-
siRNA-transfected cells than in control cells, indicating mortalin
involvement in cytoplasmic sequestration of p73 (Figures 5D and
5E). We next analyzed endogenous cytoplasmic p73 in MCF7
and Panc-1 cells after ectopic expression of mortalin deletion
mutant. Nuclear stainingwas detected in 36%ofmortalinmutant
MCF-7 and Panc-1 cells (n = 100) versus 2% of empty vector
cells (Figure 5F). p73 was also enriched in the nuclear fraction
in mortalin mutant cells, whereas it was localized in the cyto-
plasm in empty vector cells (Figure 5G). Aurora-A was also
distributed in the nucleus in mortalin mutant cells, but its nuclear
accumulation was lower than p73 (Figure S4). The microscopy
and fractionation experiments demonstrated a positive correla-
tion between nuclear p73 localization and mutant mortalin
expression. Moreover, mortalin-siRNA-transfected Panc-1 cells
revealed reduced cytoplasmic localization (Figures 5H and 5I)
and phosphorylation of p73 along with increased p21 expression
(Figure 5H and 5J), suggesting that mortalin regulates Aurora-A
phosphorylation of p73 and its transactivation function. Immuno-
precipitation of p73 from empty-vector-transfected cells demon-
strated interaction between p73 and mortalin. This interaction
was weakened in the presence of Aurora-A inhibitor, which
correlated with positive nuclear p73 staining and loss of
Aurora-A interaction with p73. These results point toward an
important role for mortalin in cytoplasmic sequestration of p73
after phosphorylation by Aurora-A.
Aurora-A Phosphorylation of p73 Abrogates Cell GrowthInhibition and DNA Damage-Induced Cell DeathResponseWe determined the physiological effects of Aurora-A phosphor-
ylated p73 on cell growth and DNA damage-induced cell death
ra-A-WT, and Flag-Aurora-A-KD in H1299 cells and analyzed as in (Figure 2B).
ells described in (Figure 2E), analyzed by immunoblotting with the indicated
nd MCF-7 cells.
24 hr were analyzed by immunoblotting with the indicated antibodies.
ith (+) Aurora-A inhibitor for 24 hr, and analyzed for mRNA expression of Puma
ancer Cell 21, 196–211, February 14, 2012 ª2012 Elsevier Inc. 201

AE
B
F
C
G
D
H
I
Figure 3. Aurora-A Regulates Subcellular Localization of p73
(A) H1299 cells transfected with GFP-p73a expression plasmids for 24 hr were fractionated into cytosolic (Cyto) and nuclear (Nuc) fractions and analyzed by
immunoblotting with anti-GFP antibody. The purity of Cyto and Nuc fractions was confirmed by immunoblotting with anti-a-tubulin and anti-PARP antibodies,
respectively. WCE, whole cell extracts.
(B) H1299 cells transfected with GFP-p73a expression plasmids were analyzed for subcellular localization of GFP fusion p73 by immunofluorescencemicroscopy
and counterstained for DNA with DAPI. Scale bar corresponds to 20 mm.
(C) GFP-p73a-WT or -S235D mutant was transfected into H1299 cells. Twenty-four hours later, cells were further cultured with (+) or without (�) leptomycin B for
6 hr and subjected to subcellular fractionation as in (Figure 3A).
Cancer Cell
Aurora-A Regulation of p73 Checkpoint Function
202 Cancer Cell 21, 196–211, February 14, 2012 ª2012 Elsevier Inc.

A B
C E
FD
Figure 4. Mortalin Interaction with Aurora-A Phos-
phorylated p73
(A) Flag-empty vector (emp), Flag-p73a-WT, or -SD
mutant was transfected into HeLa cells. Twenty-four hours
later, cells were immunoprecipitated with anti-Flag anti-
body conjugated protein-A sepharose and immunopre-
cipitates were eluted with Flag peptide. Eluted proteins
were subjected to SDS-PAGE, and the gel was stained
with Coomassie Brilliant Blue (CBB). Arrow in red shows
mortalin, identified as the p73-interacting protein from this
experiment.
(B) WCE, prepared as in (Figure 4A), were subjected to gel
filtration column chromatography, and an equal volume of
eluted proteins in each fraction was analyzed by immu-
noblotting with the indicated antibodies.
(C) Full-length Flag-mortalin (Full) or p53-binding domain
deletion mutant of Flag-mortalin (del-BD) were co-
transfected with GFP-p73a�WT, -SA, or -SD in HeLa
cells. Twenty-four hours later, cells were subjected to
immunoprecipitation with anti-Flag antibody, followed by
immunoblotting with the indicated antibodies (top and
bottom). WCE were directly immunoblotted with anti-GFP
antibody (middle).
(D) Cos-1 cells were transfected with control siRNA (�)
or p73 siRNA (+) for 48 hr and grown with or without
nocodazole for 16 hr. Cells were subjected to immuno-
precipitation with anti-p73 antibody, followed by immunoblotting with the indicated antibodies (top and middle). WCE were directly immunoblotted with anti-
mortalin antibody (bottom).
(E) Cos-1 cells were transfectedwith Flag-empty vector (�) or with Flag-Aurora-A-WT (+).Twenty-four hours later, cells were cultured for 6 hr with (+) or without (�)
MLN8054. Cells were then subjected to immunoprecipitation with anti-p73 antibody or normal IgG (NIG), followed by immunoblotting with the indicated anti-
bodies. Input shows immunoblotting of WCE.
(F) MCF-7 and Panc-1 cells were cultured for 6 hr with (+) or without (�) MLN8054, subjected to immunoprecipitation, and analyzed as in (Figure 4E).
See also Figure S3.
Cancer Cell
Aurora-A Regulation of p73 Checkpoint Function
response in p53 null Saos-2 and H1299 cells. WT and S235A
mutant significantly inhibited colony formation, compared with
S235D mutant (Figure 6A). Because p73 is a critical regulator
of the DNA damage-induced cell death pathway, we determined
whether p73’s phosphorylation status in H1299 cells influenced
cisplatin-induced cell death. Consistent with the expected
induction of proapoptotic genes by p73, cells expressing
WT and S235A mutant showed higher apoptosis than did
the vector-transfected cells, whereas S235D mutant made
cells least sensitive to cisplatin-induced cell death (Figure 6B).
These results demonstrate that Aurora-A phosphorylation
compromises the p73-mediated DNA damage-induced cell
death response. Next, we determined the plausible differential
activation of Aurora-A, p73 phosphorylation, and its nuclear-
cytoplasmic distribution, with or without DNA damage. DNA
damage-inducing cisplatin treatment resulted in loss of Aurora-A
activation and reduced p73 phosphorylation in empty-vector-
(D) WCE prepared as in (Figure 3A) were incubated with (+) or without (�) 0.01
followed by immunoblotting with anti-GFP antibody.
(E) Cos-1 cells were transfected with GFP-empty vector or with GFP-Aurora-AWT
MLN8054 and immunostained with anti-p73 antibody (red). DNAwas counterstain
to 20 mm.
(F) Subcellular distribution of p73 in GFP-positive cells in (Figure 3E) was analyzed
from two independent experiments (n = 100).
(G) Distribution of the proteins in cellular fractions from samples prepared as in (
(H) MCF-7 and Panc-1 cells were incubated with or without MLN8054 for 6 hr an
20 mm.
(I) Protein distribution in cellular fractions from samples prepared in (Figure 3H),
See also Figure S2.
C
transfected cells, but in the presence of ectopic Aurora-A
overexpression, minimal differences in Aurora-A activation, p73
phosphorylation, and nuclear cytoplasmic distribution were
found between untreated and treated cells (Figure 6C). Empty
vector cells showed elevated nuclear distribution of p73 after
treatment (Figure 6D).
Aurora-A Phosphorylation Inactivates Mitotic SACFunction of p73SAC is impaired without p73; thus, we investigated whether
Aurora-A phosphorylation of p73 affects SAC response. We
ectopically expressed mCherry fusion construct of p73 phos-
phor mutants in HeLa cells in which the chromatin was
labeled with stably expressing GFP-tagged histone H2B protein.
Time-lapse microscopy revealed that the duration from nuclear
envelope breakdown to anaphase was shorter in S235D mutant
cells than in controls and S235A mutant cells. S235A mutant
% glutaraldehyde for 15 min, and the products were resolved in SDS-PAGE,
. Twenty-four hours later, cells were grown for an additional 6 hr with or without
ed with DAPI (blue). Arrow indicates GFP-positive cells. Scale bar corresponds
and quantified for nuclear and cytoplasmic localization. Mean values ± SD are
Figure 3E), analyzed by immunoblotting with the indicated antibodies.
d subjected to immunostaining as described in (E). Scale bar corresponds to
analyzed by immunoblotting with the indicated antibodies.
ancer Cell 21, 196–211, February 14, 2012 ª2012 Elsevier Inc. 203

A B
C DE
FG
HI J
Figure 5. Mortalin Interaction Regulates Cytoplasmic Distribution of p73
(A) HA-p73a-SD was cotransfected with GFP-empty vector or GFP-mortalin-del-BD into Cos-1 cells. Twenty-four hours later, cells were immunostained with
anti-HA antibody (red) and counterstained for DNAwith DAPI (blue). Arrow showsGFP-positive cells with nuclear staining of HA-p73a-SD. Scale bar corresponds
to 20 mm.
(B) Subcellular distribution of HAp73a SD in GFP-positive Cos-1 cells prepared as in (Figure 5A) was analyzed and quantified. Mean values ± SD are from three
independent experiments (n = 100).
(C) Cos-1 cells prepared as in (Figure 5A) were fractionated into cytosolic (Cyto) and nuclear (Nuc) fractions and analyzed by immunoblotting with anti-HA and
anti-Flag antibodies. The purity of Cyto and Nuc fractions was confirmed by immunoblotting for anti-a-tubulin and anti-PARP antibodies, respectively.
(D) Cos-1 cells were transfected with control siRNA (�) or mortalin siRNA (+) for 48 hr and subjected to immunoblotting with anti-mortalin (top) and anti-b-actin
(bottom) antibodies, respectively.
(E) Cos-1 cells transfected with control or mortalin siRNA for 24 hr were transfected with GFP-p73a-SD. Twenty-four hours later, cells were subjected to
fractionations, followed by immunoblotting, as in (Figure 5C).
(F) MCF-7 and Panc-1 cells were transfected with GFP-mortalin-del-BD for 24 hr, immunostained with anti-p73 antibody (red), and counterstained for DNA with
DAPI (blue). Arrow indicates GFP-positive cells. Scale bar corresponds to 20 mm.
(G) Panc-1 cells were transfected with Flag-empty vector or Flag-mortalin-del-BD. Twenty-four hours later, cells were subjected to fractionation, followed by
immunoblotting as in (Figure 5C).
(H) Panc-1 cells were transfected with control siRNA (�) or mortalin siRNA (+) for 48 hr and subjected to immunoblotting with anti-mortalin (top) and anti-b-actin
(bottom) antibodies, respectively.
(I) Panc-1 cells prepared in (Figure 5H) were subjected to fractionations, followed by immunoblotting as in (Figure 5C).
(J) WCE prepared in (Figure 5H) were immunoprecipitated with anti-p73 antibody, followed by immunoblotting with the indicated antibodies (top and second).
WCE were directly immunoblotted with the indicated antibodies also (third and bottom).
See also Figure S4.
Cancer Cell
Aurora-A Regulation of p73 Checkpoint Function
204 Cancer Cell 21, 196–211, February 14, 2012 ª2012 Elsevier Inc.

A
B
C D
Figure 6. Role of Phospho-p73 Mutant in Cell Growth and Response to DNA Damage-Induced Cell Death
(A) Colony formation assay in SAOS-2 cells grown for 3 weeks under G418 selection after transfection with the indicated p73 expression constructs. Repre-
sentative photos of culture plates from one experiment are shown (top). Mean colony numbers ± SD from three independent experiments are shown in the graphs
(bottom).
(B) H1299 cells were transfected with the indicated expression constructs. Twenty-four hours later, untreated cells (�) and cells treated with cisplatin (+) for 24 or
36 hr were subjected to annexin-V assay. The graph represents the mean annexin-V-positive apoptotic cells ± SD from two independent experiments.
(C) Flag-empty vector or Flag-Aurora-A cells, transfected for 24 hr, were treated with cisplatin (50 mM) for 6 hr. Cells were subjected to immunoprecipitation with
anti-p73 antibody, followed by immunoblotting with the indicated antibodies (top and second). WCE were directly immunoblotted with antibodies, as shown.
(D) Cells prepared as in (C) were subjected to fractionations, followed by immunoblotting with the indicated antibodies.
Cancer Cell
Aurora-A Regulation of p73 Checkpoint Function
cells took the longer to transition into anaphase (Figure 7A).
S235D mutant cells had no abnormal chromosome alignment
but had frequent chromosome bridges in anaphase-telophase
cells, reflecting defects in the chromosome segregation process.
To determine whether this resulted from aberrant SAC function,
we grew cells expressing p73 phosphor mutants, with or without
nocodazole, and quantified them in terms of mono- and multinu-
cleation, presence in mitosis, or apoptosis induction (Figure 7B).
Nocodazole treatment of empty vector and S235A mutant cells
C
had similar effects, with 48.8 ± 1.9% and 46.2 ± 0.4%, respec-
tively, in mitosis and 14 ± 2.4% and 19.4 ± 1.4%, respectively,
displaying multinucleation. In contrast, nocodazole treatment
resulted in fewer S235D mutant cells in mitosis (31.3 ± 1.3%)
andmore multinucleation (41 ± 2.2%). Increasedmultinucleation
was also seen in untreated S235D mutant cells, compared with
untreated empty vector and S235Amutant cells (Figure 7B), indi-
cating that Aurora-A phosphorylation of p73 has a role in inacti-
vating the SAC response. Furthermore, p73 phosphor cells were
ancer Cell 21, 196–211, February 14, 2012 ª2012 Elsevier Inc. 205

C
Mitotic duration (min)
Cells with Abnormal chromosome
segregation/separation (%)
control(n=160) 73.8±0.03 2.5
SA (n=39) 84.3±3.4 0
SD (n=37) 55.1±4.1 14
A
B
SD
SA
control
0:050:00 0:10 0:20 0:30 0:40 0:50 1:00 1:10 1:20 1:25
IP
p73 CDC20 NIG
IBCdc20
20.8 100
MAD210015.6
Aur-A100138.5
p73100 25.2
IP:emp SA SD
CDC20emp SA SD
NIGemp SA SD
Direct IB
Mad2 GFP DAPI merged
GFP-empty
GFP-p73 SD
E
G
F
w/o Noc
apoptotic cellsmononucleated
cellmitotic cellsmultinucleated
cells
0
10
20
30
40
50
60
70
80
90
100
apoptotic cellsmultinucleated cellsmitotic cellsmononucleated cells
empSDSAemp
% o
f ce
lls/t
ota
l
SA SD
w Noc
D
IB: mortalin
IB: Cyc B
IB: β-actin
HA-p73:
IB: HA
SA SDSASD
siRNA: Cont mortalin
IB: Mad2
IB: HA
IB: Cdc20
HA-p73:
MG132IB: Cyc B
IB: Hsp90
IB: GFP
+emp
+WT
+SA
+SDGFP-p73:
Figure 7. Effects of Aurora-A Phosphorylated p73 on Mitosis and SAC Complex
(A) HeLa/GFP-H2B cells were transfected with mCherry-p73a-SA or -SD mutant. Twenty-four hours later, cells were monitored by time-lapse microscopy using
a low level of light intensity to determine the duration from nuclear envelope breakdown to anaphase. Mock-transfected cells were used as the control. The table
represents mean mitotic durations ± SD and percentages of cells with defects in chromosome segregation or separation (top). Selected still frames from time-
lapse microscopy of transfected cells at time intervals of minutes and seconds are shown (bottom). Scale bar corresponds to 10 mm.
(B) HeLa/GFP-H2B cells transfected with mCherry-empty vector, p73a-SA, or -SD mutant for 24 hr were cultured with (w Noc) or without (w/o Noc)
nocodazole. Eighteen hours later, cells were fixed, and the fate of mCherry-positive cells was analyzed by fluorescence microscopy and quantified. The
percentage values of cells in mitosis, with the indicated nuclear phenotypes from three independent experiments (n = 200), are shown. Scale bar corresponds
to 10 mm.
Cancer Cell
Aurora-A Regulation of p73 Checkpoint Function
206 Cancer Cell 21, 196–211, February 14, 2012 ª2012 Elsevier Inc.

Cancer Cell
Aurora-A Regulation of p73 Checkpoint Function
treated with nocodazole, with or without MG132, a proteasome
inhibitor that blocks E3 ubiquitin ligase anaphase-promoting
complex/cyclosome (APC/C) involved in cyclin B1 degradation.
Cyclin B1 levels in S235D mutant cells were lower than in empty
vector and S235A mutant cells without MG132 but with MG132,
cyclin B1 levels were similar in these cells, demonstrating that
S235D mutant expression impairs nocodazole-induced mitotic
arrest (Figure 7C). Nocodazole-treated p73-knockdown cells,
however, had reduced cyclin B1 levels, compared with levels
in control cells (Figure S5A).
We next investigated whether Aurora-A phosphorylation of
p73 is a normal physiological event in cells with basal Aurora-A
expression or an unnatural event in Aurora-A-overexpressing
tumor cells. For the purpose, Aurora-A phosphorylation of
p73 was evaluated in synchronized MCF-10A and Cos-1 at
prophase; metaphase and anaphase stages. Western blotting
of immunoprecipitated p73 with anti-phospho-PKA substrate
antibody revealed that p73 phosphorylation progressively
peaked at metaphase but was barely detectable in anaphase,
when both amount and activity of Aurora-A were significantly
reduced (Figure S5B). These findings indicate that Aurora-A
phosphorylation of p73 has a role in regulating SAC during
normal mitosis in cells with basal Aurora-A expression. It
is conceivable that elevated Aurora-A expression weakens
the SAC due to precocious phosphorylation of p73 in tumor
cells. Interestingly, co-transfection of S235D mutant with
mortalin siRNA failed to override mitotic arrest, as evident
from the similar expression levels of cyclin B1 in control and
mortalin siRNA transfected cells (Figure 7D), suggesting that
silencing of mortalin can rescue phosphor-p73-mediated SAC
inactivation.
Coimmunoprecipitation with anti-p73 and anti-CDC20 anti-
bodies revealed complex formation of p73 with Mad2, CDC20,
and Aurora-A (Figure 7E). Thus, we determined the effect of
p73-S235D mutant expression on these protein-protein interac-
tions in cells treated with nocodazole and MG132. Coimmuno-
precipitation experiments with anti-CDC20 antibody revealed
a marked reduction in the interaction of both S235D mutant
and MAD2 with CDC20, compared with that in empty vector
and S235A mutant cells, whereas BubR1’s interaction with
CDC20 was not affected in S235D mutant cells (Figure 7F;
data not shown). Immunoprecipitation with BubR1 and MAD2
antibodies did not reveal the two proteins in the same complex
from nocodazole-treated cell extracts (data not shown), indi-
cating that the two checkpoint proteins form independent
complexes with CDC20, as reported earlier (Fang, 2002). Immu-
nofluorescence microscopy revealed that kinetochore-localized
Mad2 is not affected by ectopic expression of S235D mutant
(C) 293T cells transfected for 24 hr with GFP-empty vector, p73a-WT, -SA, or -SD
with (+) or without (�) MG132 for 4 hr and subjected to immunoblotting with the
(D) HeLa/GFP-H2B cells transfected with control or mortalin siRNA for 24 hr
constructs. Twelve hours later, cells were cultured with nocodazole for 18 hr and
(E) WCE from nocodazole-treated 293T cells were immunoprecipitated with norm
subjected to immunoblotting with the indicated antibodies.
(F) 293T cells transfected with the indicated expression constructs for 24 hr we
subjected to immunoprecipitation with normal IgG (NIG) or anti-CDC20 antibody
(G) Saos-2 cells were transfected with the GFP-empty vector or GFP-p73a-SD m
Mad2 antibody (red) and counterstained for DNA with DAPI (blue). Scale bar cor
See also Figure S5.
C
(Figure 7G). These results demonstrate that p73 is involved in
the formation of a cytoplasmic ternary complex with MAD2
and CDC20. Aurora-A phosphorylation of p73 in this complex
releases p73 and the inhibitory complex between MAD2 and
CDC20, with the released CDC20 expected to facilitate activa-
tion of APC/C, leading to mitotic exit.
Aurora-A Overexpressing Primary Pancreatic CancerShows High Cytoplasmic p73 DistributionTo determine whether cytoplasmic sequestration of p73, conse-
quent to Aurora-A phosphorylation, is reflected in cytoplasmic
p73 distribution in Aurora-A-overexpressing tumors, we per-
formed immunohistochemical analyses of p73 and Aurora-A in
two sets of primary human pancreatic cancer tissues—114
pancreatic ductal adenocarcinoma (PDAC) samples from M.D.
Anderson and 20 from the University of Alabama at Birmingham
(UAB). p53 localization was also determined because Aurora-A
phosphor-mimetic p53-S215D mutant demonstrated cyto-
plasmic localization and preferential interaction with mortalin
(Figures S2A and S3B). Fifty-one (44.7%) PDAC samples
showed high Aurora-A expression. Cytoplasmic p73 staining
was clearly detected, but positive cytoplasmic p53 staining
was almost undetectable. Among 51 tumors, 37 (72.5%) had
high cytoplasmic staining of p73 and 22 (43%) had nuclear stain-
ing of p53. Among the remaining 63 Aurora-A low tumors, only 18
(28.6%) had strong cytoplasmic p73 staining and 40 (63%) had
nuclear p53 staining (Figure 8). These results reveal a relationship
between Aurora-A expression and cytoplasmic p73 localization
and between Aurora-A expression and nuclear p53 localization
in primary PDAC tissue. A similar trend between Aurora-A
expression and p73 distribution was also found in the UABCC
tissue set (data not shown). Nuclear localized mutant p53 is
reported in 50%–75% of PDAC; thus, the predominant p53
nuclear distribution was not unexpected. The relationship
between high Aurora-A expression and low p53 nuclear staining
suggests that Aurora-A overexpression is correlated with p53
gene mutations in PDAC, whereas p53-WT remains undetect-
able in the cytoplasm, possibly because of enhanced protein
degradation after Aurora-A phosphorylation, as previously
described (Katayama et al., 2004; Morton et al., 2010).
DISCUSSION
Aurora-A overexpression is detected in various tumor types and
confers resistance to chemotherapeutic drugs and irradiation
(Zhou et al., 1998; Marumoto et al., 2002; Yang et al., 2006).
We present evidence that the p73 tumor suppressor protein is
a direct downstream target of Aurora-A, which influences cell
mutant were cultured with nocodazole. Sixteen hours later, cells were grown
indicated antibodies.
were subsequently transfected with HA-p73a-SA or -SD mutant expression
subjected to immunoblotting with the indicated antibodies.
al IgG (NIG) or with anti-p73 or anti-CDC20 antibody. Immunoprecipitates were
re incubated with nocodazole for 20 hr and then MG132 for 4 hr. Cells were
, followed by immunoblotting with the indicated antibodies.
utant construct. Twenty-four hours later, cells were immunostained with anti-
responds to 10 mm.
ancer Cell 21, 196–211, February 14, 2012 ª2012 Elsevier Inc. 207

B
Hig
h A
uro
ra-A
Low
Au
rora
-A
Aurora-A p73 p53
Cyt
op
lasm
ic p
73 s
tain
ing
Aur-A expressionLow High
0
10
20
30
40
50
60
70
80p73-lowp73-high
P<0.0001N
ucl
ear
p53
sta
inin
g
Aur-A expression
Low High0
10
20
30
40
50
60
70p53-lowp53-high
C
A
Figure 8. Correlation of Aurora-A Expression Levels with p73 and p53 Localization in Human PDAC
(A) Representative micrographs of PDAC tissues with varying levels of Aurora-A, p73, and p53 expression. Scale bar corresponds to 50 mm.
(B and C) Bar graph representation of relative cytoplasmic p73 expression and nuclear p53 expression in relation to high or low Aurora-A expression in the tissue
microarray containing 114 PDAC tissue samples. Aurora-A expression was correlated significantly with cytoplasmic p73 expression (p < 0.0001). Nuclear p53
staining showed a trend towards being inversely corerlated with the levels of Aurora-A expression in these PDAC tissue samples.
Cancer Cell
Aurora-A Regulation of p73 Checkpoint Function
fate after chemotherapeutic drug-induced DNA and spindle
damage in tumor cells. Aurora-A phosphorylation of p73 at
serine 235 is critical in Aurora-A overexpression-mediated abro-
gation of apoptotic response and mitotic checkpoint override.
Aurora-A Inhibits p73 and p53 TransactivationFunctions through a Common Molecular MechanismWe, as well as others, have reported that Aurora-A phosphoryla-
tion of p53 compromises its apoptosis response function
induced after cisplatin and irradiation treatment, whereas
Aurora-A knockdown sensitizes cells to DNA damage-induced
p53-dependent apoptosis (Katayama et al., 2004; Liu et al.,
2004). The current findings reveal that Aurora-A phosphoryla-
tions abrogate DNA damage response functions of both p53
and p73 consequent to their interactions with mortalin and cyto-
plasmic sequestration. It also appears that, with progressively
increasing Aurora-A kinase activity during mitosis, p53 and p73
remain localized in the cytoplasm coincidentally with nuclear
envelope breakdown. Phosphorylation-mediated binding to
mortalin, promoting nuclear exclusion of p53 and p73, may be
common in tumor cells (Walker et al., 2006; Walker and Bottger,
208 Cancer Cell 21, 196–211, February 14, 2012 ª2012 Elsevier Inc.
2008) and consistent with the earlier observations that p53-
binding domain on mortalin (Kaul et al., 2001) negatively regu-
lates transcriptional activity, inhibits nuclear translocation of
p53, and abolishes p53-dependent suppression of centrosome
duplication (Wadhwa et al., 1998; Walker et al., 2006; Ma et al.,
2006). Because the mortalin-binding domain of p53 at its C
terminus (Kaul et al., 2001;Wadhwa et al., 2002) is not conserved
in p73, it is worth investigating whether Aurora-A phosphoryla-
tion of p53 and p73 creates a mortalin-binding site or recruits
a mortalin interaction factor in a phosphorylation-dependent
manner. Complex formation between mortalin and p53 has
been detected in the mitochondria during p53-induced
apoptosis, with and without DNA damage (Marchenko et al.,
2000), implicating involvement of mortalin-p53 complex in the
transactivation-independent apoptotic signaling pathway. How-
ever, the molecular mechanisms regulating activation of this
pathway remains to be elucidated. WWOX, a putative tumor
suppressor protein, interacts with p53 and p73, regulating
their subcellular distribution and apoptosis response functions
elicited in mitochondria (Chang et al., 2003; Chang et al., 2005;
Aqeilan et al., 2004). On the basis of the current findings, it

Cancer Cell
Aurora-A Regulation of p73 Checkpoint Function
may be suggested that Aurora-A phosphorylation-induced mor-
talin binding influences interactions of p53 and p73 with WWOX
and/or proapoptotic mitochondria proteins. Further investigation
is needed to understand these pathways.
Molecular Mechanism of Aurora-A-MediatedInactivation of Mitotic SAC Function of p73Aurora-A overexpression has been shown to override mitotic
SAC and induce aberrant chromosome segregation, resulting
in aneuploidy (Anand et al., 2003). However, the underlying
molecular mechanism of this effect has remained unclear. We
found that p73 was involved in the inhibitory mitotic checkpoint
complex of Mad2 and CDC20, preventing activation of the E3
ubiquitin ligase APC/C, and that Aurora-A phosphorylation of
p73 caused dissociation of the Mad2-CDC20 complex, facili-
tating mitotic exit. Because p73 is detected in large macromo-
lecular complexes including mortalin, further studies are needed
to determine their functional significance in the regulation of the
Mad2-CDC20 containing SAC complex.
We observed no specific localization of WT or phosphor-
mimetic p73 mutants at the mitotic apparatuses or an effect of
phosphor-mimetic mutant on Mad2 mislocalizations at the
kinetochore. However, immunostaining with anti-p73 antibody
revealedcytoplasmic andmitotic spindle p73 localization.Mitotic
SACgenerates a diffusible wait signal atmicrotubule-unattached
kinetochores that inhibits CDC20-mediated APC activation.
MAD2 and BubR1 are the two most critical proteins of this signal
(Shah et al., 2004; Peters, 2006), which form separate inactive
complexes with CDC20 (Fang, 2002). Although evidence sug-
gests that the soluble MAD2-CDC20 complex acts as a transient
precursor to the BubR1-CDC20 inhibitory complex (Kulukian
et al., 2009), the exact mechanism is still not well understood.
Failure of BubR1 to rescue SAC dysfunction in cells expressing
a mutant CDC20 allele that does not bind MAD2 (Li et al., 2009)
clearly illustrates a critical, nonredundant role of Mad2 in SAC
activation. Aurora-A phosphorylation of p73 dissociated the
MAD2-CDC20 complex, providing evidence that Aurora-A nega-
tively regulates a critical step in the SAC activation pathway.
Unlike its effect on Mad2-CDC20 interaction, phosphor-mimetic
mutant p73 did not affect the interaction of BubR1 with CDC20.
Progressively increasing Aurora-A phosphorylation of p73 from
prophase through metaphase, followed by a sharp decline at
anaphase and telophase in synchronized nontumorigenic MCF-
10A cells, with basal Aurora-A expression, suggests that this
phosphorylation has a role in inactivating SAC during the meta-
phase–anaphase transition of normal mitosis. Constitutively
phosphorylated p73-expressing cells underwent an early transi-
tion to anaphase and overrode the mitotic checkpoint, indicating
that Aurora-A-overexpressing cells are predisposed to abrogate
the checkpoint response because of precocious p73 phosphor-
ylation. Our findings do not reveal how this phosphorylation is
temporally regulated to coincidewith SAC inactivation after chro-
mosome biorientation in normal mitosis. Structural studies have
revealed that an open conformation of MAD2 prevents associa-
tion with MAD1 or CDC20 (Musacchio and Hardwick, 2002).
Thus, it will be interesting to determine whether Mad2-bound
p73 phosphorylation induces open conformation changes in
the latter, leading to its dissociation from CDC20. Our findings
indicate that p73 is a critical regulator of the cytoplasmic
C
MAD2-CDC20 checkpoint protein complex. Additional studies
are required to unravel the details of thesemolecular interactions.
p73-deficient mice have a high incidence of spontaneous
tumors (Tomasini et al., 2008) and loss of function is correlated
with induction of chromosomal instability (Talos et al., 2007).
Evidence supports a role for p73 in mitosis (Fulco et al., 2003;
Merlo et al., 2005), including SAC regulation (Tomasini et al.,
2009). Thus, p73 plays an important role in faithful chromosome
segregation and maintenance of genomic stability. p73 is upre-
gulated during the transformation process in response to aber-
rant Rb pathway expression, and a genetic alteration with a
dominant negative effect is required to block tumor suppressor
function of p73. Published data indicate that overexpression of
the dominant negative p73 protein DNp73 compromises tumor
suppressor function of p73 in premalignant stages (Oswald and
Stiewe, 2008).DNp73 overexpressionmay disrupt the stochastic
balance of Aurora-A-mediated p73 SAC function because the
two isoforms, despite forming a heterotetramer, do not share
the predominant site of Aurora-A phosphorylation in p73.
Our findings demonstrate that elevated Aurora-A expression,
a common oncogenic event in human cancers, has the dominant
negative effect of inactivating p73 function through increased
phosphorylation of the protein sequestered in the cytoplasm.
The positive correlation between Aurora-A overexpression and
cytoplasmic p73 localization in human pancreatic cancer
tissue corroborate the experimental findings and indicates that
these tumors have weakened or inactivated DNA and spindle
damage-induced apoptosis and SAC pathways, making them
refractory to conventional radiation and chemotherapeutic regi-
mens. Detailed analyses of p73 phosphorylation profiles of these
tumors together with chemosensitivities and radiosensitivities
would help resolve the issue and future design of appropriately
targeted therapies.
In conclusion, we uncovered a signaling pathway of Aurora-A-
p73 axis in which Aurora-A phosphorylation inactivates p73
function in both DNA damage-induced cell death and mitotic
SAC pathways. Further in-depth studies of Aurora-A involve-
ment in both signaling pathways will improve our understanding
of oncogenic function of Aurora-A in cancer biology and help us
develop more effective strategies for cancer prevention and
treatment.
EXPERIMENTAL PROCEDURES
All cell lines were obtained from ATCC. Immunohistochemical staining for
Aurora-A, p73, and p53 was performed on 4-mm unstained sections from
tissue microarray blocks consisting of 114 PDAC and 20 pancreatic tumor
tissues from patients who had undergone pancreaticoduodenectomy at
M.D. Anderson and UAB, respectively. The studies were approved by both
institutional review boards.
Detailed experimental procedures are available in the Supplemental Exper-
imental Procedures.
Transfection, Luciferase Assay, and siRNA
For transfection, Fugene 6 transfection reagent (Roche), oligofectamine, and
lipofectamine 2000 (Invitrogen) were used according to manufacturer’s
instructions. For luciferase assays, H1299 or Saos-2 cells were cotransfected
with the same amount of WT or mutant pEGFPp73a (100–200 ng), luciferase
reporter construct (100 ng), and internal control Renilla luciferase expression
plasmid (10 ng), with or without increasing amounts of Flag-Aurora-A WT
or KD expression plasmids. The total amount of plasmid DNA was kept
ancer Cell 21, 196–211, February 14, 2012 ª2012 Elsevier Inc. 209

Cancer Cell
Aurora-A Regulation of p73 Checkpoint Function
constant (1 ug) at pcDNA3. We measured luciferase activities 24 hr after
transfection using a dual-luciferase reporter assay kit (Promega). The siRNA
sequences were as follows: p73, 50-CGGAUUCCAGCAUGGACGUdTdT-30
(Basu et al., 2003); mortalin, 50-CCGUCUCGUGGGCGCCGCAdTdT-30
(Ma et al., 2006). Additional siRNAs for both genes from Santa-Cruz
Biotechnology (Catalog Nos. sc-35520 for mortalin and sc-36167 for p73)
were also used.
Cell Fractionation, Cross-Linking Assay, In Vitro Kinase Assay,
Semiquantitative RT-PCR, Immunoprecipitation, Western Blotting,
and Immunofluorescence Microscopy
Biochemical protein fractionation of cells was performed according to the
manufacturer’s protocol (Pierce). Whole cell extracts were prepared in RIPA
buffer. All other experimental procedures, conditions, and primer sequences
for semiquantitative RT-PCR have been described (Kawai et al., 2007;
Katayama et al., 2007, 2008; Li et al., 2007).
EMSA
p73 proteins, produced by an in vitro transcription and translation kit
(Promega), were incubated with 32P-labeled p21 probe containing the p53
DNA-binding site (50-TACAGAACATGTCTAAGCATGCTGGGG-30 ) in the bind-
ing buffer (20 mM HEPES, pH 7.9, 1 mM MgCl2, 10 mM ZnCl2, 1 mM DTT, 5%
glycerol, 670 ng/ml BSA, and 0.5 mg/ml poly(dI-dC) at room temperature for
20 min. For the competition assay, 1 mg of unlabeled probe was added to
the reaction. The protein-DNA complexes were resolved by electrophoresis
through 4.5% polyacrylamide gel at 4�C.
lPPase Treatment
Whole cell extracts were incubated with 20 units of lPPase (New England Bio-
labs) or glycerol (solvent) in the supplemented buffer for 30 min at 30�C. Thereaction was terminated by adding SDS sample buffer and subjected to
SDS-PAGE.
Gel Filtration Column Chromatography
Gel filtration column chromatography was carried out as described previously
(Samanta et al., 2010). In brief, 3 mg of whole cell extracts prepared in column
elution buffer (30 mMHEPES, pH 7.4, containing 150 mMNaCl and 10% glyc-
erol, and 0.5%NP-40, 1mMmicrocystin LR, protease inhibitor cocktail [Roche])
were loaded on the columnpackedwith Superose 6 prep grade gel (GEHealth-
care), and 500 ml of elution was collected in each fraction. Equal volumes of
eluted fractions were subjected to immunoblotting. The mixture of protein
markers containing keyhole limpet hemocyanin (KLH; MW 8.5 million Da),
blue dextran (MW 2 million Da), b-amylase (MW 200 kDa), BSA (MW 66 kDa),
and cytochrome C (MW 12.4 kDa) was used as the MW standard.
Time-Lapse Microscopy
We performed time-lapse microscopy using a Perkin Elmer UltraVIEW ERS
spinning disc confocal microscope equipped with an environmental control
chamber that maintained the cells at 37�C in a humidified stream of 5%
CO2. Individually tagged image format files were imported into Photoshop
(Adobe) for analysis.
Colony Formation Assay and Drug Treatment
Saos-2 cells (transfected with pEGFP-empty vector, WT, and mutants of
pEGFP-p73a) were cultured inmedia containing 200 mg/ml ofG418 for 3weeks
and stained with crystal violet. Colonies of 1 mm diameter were counted.
H1299 cells transfected for 24 hr were treated with cisplatin at 50 mM for
24 hr and 36 hr. Annexin V-FITC assay was performed according to the manu-
facturer’s protocol (BD PharMingen). Nocodazole was used at 50 ng/ml for
GFP-H2B HeLa, 350 ng/ml for 293T, 500 ng/ml for MCF-7 and Panc-1, and
1 mg/ml for Cos-1 cells. Aurora-A inhibitor MLN8054 was used at 0.5 mM
with or without 20 mM of MG132 for 4–6 hr.
SUPPLEMENTAL INFORMATION
Supplemental Information includes five figures and Supplemental Experi-
mental Procedures and can be found with this article online at doi:10.1016/
j.ccr.2011.12.025.
210 Cancer Cell 21, 196–211, February 14, 2012 ª2012 Elsevier Inc.
ACKNOWLEDGMENTS
The authors thank Dr. Zhi-Min Yuan for the GFP-tagged p73 expression
construct and luciferase reporter constructs, Dr. Elsa Flores for the HA-tagged
p73 expression constructs, Dr. Kenji Fukasawa for the mortalin expression
constructs, Dr. Richard Behringer for the mCherry vector, and Dr. Mei Leng
for the GFP-H2B-expressing HeLa cells. We acknowledge the technical
assistance of Ms. Yvette Gonzales and Ms. Aimee LeBlanc. Editorial help of
Ms Amy Sutton from the Department of Scientific Publications is acknowl-
edged. This study was supported by grants awarded to S.S. from the National
Institutes of Health (R01CA089716 and NCI/EDRN UO1CA111302), the
University Cancer Foundation, and the M.D. Anderson Cancer Center. The
DNA analysis facility used in the study is supported by Cancer Center Support
Grant CA16672. UABPancreatic SPORE (5P50CA0101955) supportedW.E.G.
and J.A.M.
Received: March 11, 2010
Revised: September 21, 2011
Accepted: December 23, 2011
Published: February 13, 2012
REFERENCES
Anand, S., Penrhyn-Lowe, S., and Venkitaraman, A.R. (2003). AURORA-A
amplification overrides the mitotic spindle assembly checkpoint, inducing
resistance to Taxol. Cancer Cell 3, 51–62.
Aqeilan, R.I., Pekarsky, Y., Herrero, J.J., Palamarchuk, A., Letofsky, J., Druck,
T., Trapasso, F., Han, S.Y., Melino, G., Huebner, K., and Croce, C.M. (2004).
Functional association between Wwox tumor suppressor protein and p73,
a p53 homolog. Proc. Natl. Acad. Sci. USA 101, 4401–4406.
Basu, S., Totty, N.F., Irwin, M.S., Sudol, M., and Downward, J. (2003). Akt
phosphorylates the Yes-associated protein, YAP, to induce interaction with
14-3-3 and attenuation of p73-mediated apoptosis. Mol. Cell 11, 11–23.
Chang, N.S., Doherty, J., Ensign, A., Lewis, J., Heath, J., Schultz, L., Chen,
S.T., and Oppermann, U. (2003). Molecular mechanisms underlying WOX1
activation during apoptotic and stress responses. Biochem. Pharmacol. 66,
1347–1354.
Chang, N.S., Doherty, J., Ensign, A., Schultz, L., Hsu, L.J., and Hong, Q.
(2005). WOX1 is essential for tumor necrosis factor-, UV light-, staurospor-
ine-, and p53-mediated cell death, and its tyrosine 33-phosphorylated form
binds and stabilizes serine 46-phosphorylated p53. J. Biol. Chem. 280,
43100–43108.
Dar, A.A., Belkhiri, A., Ecsedy, J., Zaika, A., and El-Rifai, W. (2008). Aurora
kinase A inhibition leads to p73-dependent apoptosis in p53-deficient cancer
cells. Cancer Res. 68, 8998–9004.
Deocaris, C.C., Widodo, N., Ishii, T., Kaul, S.C., and Wadhwa, R. (2007).
Functional significance of minor structural and expression changes in stress
chaperone mortalin. Ann. N Y Acad. Sci. 1119, 165–175.
Ewart-Toland, A., Briassouli, P., de Koning, J.P., Mao, J.H., Yuan, J., Chan, F.,
MacCarthy-Morrogh, L., Ponder, B.A., Nagase, H., Burn, J., et al. (2003).
Identification of Stk6/STK15 as a candidate low-penetrance tumor-suscepti-
bility gene in mouse and human. Nat. Genet. 34, 403–412.
Fang, G. (2002). Checkpoint protein BubR1 acts synergistically with Mad2 to
inhibit anaphase-promoting complex. Mol. Biol. Cell 13, 755–766.
Fulco, M., Costanzo, A., Merlo, P., Mangiacasale, R., Strano, S., Blandino, G.,
Balsano, C., Lavia, P., and Levrero, M. (2003). p73 is regulated by phosphor-
ylation at the G2/M transition. J. Biol. Chem. 278, 49196–49202.
Katayama, H., Sasai, K., Kawai, H., Yuan, Z.M., Bondaruk, J., Suzuki, F., Fujii,
S., Arlinghaus, R.B., Czerniak, B.A., and Sen, S. (2004). Phosphorylation by
aurora kinase A induces Mdm2-mediated destabilization and inhibition of
p53. Nat. Genet. 36, 55–62.
Katayama, H., Sasai, K., Czerniak, B.A., Carter, J.L., and Sen, S. (2007).
Aurora-A kinase phosphorylation of Aurora-A kinase interacting protein (AIP)
and stabilization of the enzyme-substrate complex. J. Cell. Biochem. 102,
1318–1331.

Cancer Cell
Aurora-A Regulation of p73 Checkpoint Function
Katayama, H., Sasai, K., Kloc, M., Brinkley, B.R., and Sen, S. (2008). Aurora
kinase-A regulates kinetochore/chromatin associated microtubule assembly
in human cells. Cell Cycle 7, 2691–2704.
Kaul, S.C., Reddel, R.R., Mitsui, Y., and Wadhwa, R. (2001). An N-terminal
region of mot-2 binds to p53 in vitro. Neoplasia 3, 110–114.
Kawai, H., Lopez-Pajares, V., Kim, M.M., Wiederschain, D., and Yuan, Z.M.
(2007). RING domain-mediated interaction is a requirement for MDM2’s E3
ligase activity. Cancer Res. 67, 6026–6030.
Kulukian, A., Han, J.S., and Cleveland, D.W. (2009). Unattached kinetochores
catalyze production of an anaphase inhibitor that requires a Mad2 template to
prime Cdc20 for BubR1 binding. Dev. Cell 16, 105–117.
Li, D., Zhu, J., Firozi, P.F., Abbruzzese, J.L., Evans, D.B., Cleary, K., Friess, H.,
and Sen, S. (2003). Overexpression of oncogenic STK15/BTAK/Aurora A
kinase in human pancreatic cancer. Clin. Cancer Res. 9, 991–997.
Li, M., Fang, X., Wei, Z., York, J.P., and Zhang, P. (2009). Loss of spindle
assembly checkpoint-mediated inhibition of Cdc20 promotes tumorigenesis
in mice. J. Cell Biol. 185, 983–994.
Li, X., Lee, Y.K., Jeng, J.C., Yen, Y., Schultz, D.C., Shih, H.M., and Ann, D.K.
(2007). Role for KAP1 serine 824 phosphorylation and sumoylation/desumoy-
lation switch in regulating KAP1-mediated transcriptional repression. J. Biol.
Chem. 282, 36177–36189.
Liu, Q., Kaneko, S., Yang, L., Feldman, R.I., Nicosia, S.V., Chen, J., and Cheng,
J.Q. (2004). Aurora-A abrogation of p53 DNA binding and transactivation
activity by phosphorylation of serine 215. J. Biol. Chem. 279, 52175–52182.
Ma, Z., Izumi, H., Kanai, M., Kabuyama, Y., Ahn, N.G., and Fukasawa, K.
(2006). Mortalin controls centrosome duplication via modulating centrosomal
localization of p53. Oncogene 25, 5377–5390.
Mac�urek, L., Lindqvist, A., Lim, D., Lampson,M.A., Klompmaker, R., Freire, R.,
Clouin, C., Taylor, S.S., Yaffe, M.B., and Medema, R.H. (2008). Polo-like
kinase-1 is activated by aurora A to promote checkpoint recovery. Nature
455, 119–123.
Marchenko, N.D., Zaika, A., andMoll, U.M. (2000). Death signal-induced local-
ization of p53 protein to mitochondria. A potential role in apoptotic signaling.
J. Biol. Chem. 275, 16202–16212.
Marumoto, T., Hirota, T., Morisaki, T., Kunitoku, N., Zhang, D., Ichikawa, Y.,
Sasayama, T., Kuninaka, S., Mimori, T., Tamaki, N., et al. (2002). Roles of
aurora-A kinase in mitotic entry and G2 checkpoint in mammalian cells.
Genes Cells 7, 1173–1182.
Marumoto, T., Zhang, D., and Saya, H. (2005). Aurora-A - a guardian of poles.
Nat. Rev. Cancer 5, 42–50.
Merlo, P., Fulco, M., Costanzo, A., Mangiacasale, R., Strano, S., Blandino, G.,
Taya, Y., Lavia, P., and Levrero, M. (2005). A role of p73 in mitotic exit. J. Biol.
Chem. 280, 30354–30360.
Morton, J.P., Timpson, P., Karim, S.A., Ridgway, R.A., Athineos, D., Doyle, B.,
Jamieson, N.B., Oien, K.A., Lowy, A.M., Brunton, V.G., et al. (2010). Mutant
p53 drivesmetastasis and overcomes growth arrest/senescence in pancreatic
cancer. Proc. Natl. Acad. Sci. USA 107, 246–251.
Musacchio, A., and Hardwick, K.G. (2002). The spindle checkpoint: structural
insights into dynamic signalling. Nat. Rev. Mol. Cell Biol. 3, 731–741.
Oswald, C., and Stiewe, T. (2008). In good times and bad: p73 in cancer. Cell
Cycle 7, 1726–1731.
Ouchi, M., Fujiuchi, N., Sasai, K., Katayama, H., Minamishima, Y.A.,
Ongusaha, P.P., Deng, C., Sen, S., Lee, S.W., and Ouchi, T. (2004). BRCA1
C
phosphorylation by Aurora-A in the regulation of G2 to M transition. J. Biol.
Chem. 279, 19643–19648.
Peters, J.M. (2006). The anaphase promoting complex/cyclosome: a machine
designed to destroy. Nat. Rev. Mol. Cell Biol. 7, 644–656.
Plotnikova, O.V., Pugacheva, E.N., and Golemis, E.A. (2011). Aurora A kinase
activity influences calcium signaling in kidney cells. J. Cell Biol. 193, 1021–
1032.
Samanta, A.K., Chakraborty, S.N., Wang, Y., Schlette, E., Reddy, E.P., and
Arlinghaus, R.B. (2010). Destabilization of Bcr-Abl/Jak2 Network by a Jak2/
Abl Kinase Inhibitor ON044580 Overcomes Drug Resistance in Blast Crisis
Chronic Myelogenous Leukemia (CML). Genes Cancer 1, 346–359.
Seki, A., Coppinger, J.A., Jang, C.Y., Yates, J.R., and Fang, G. (2008). Bora
and the kinase Aurora a cooperatively activate the kinase Plk1 and control
mitotic entry. Science 320, 1655–1658.
Sen, S., Zhou, H., and White, R.A. (1997). A putative serine/threonine kinase
encoding gene BTAK on chromosome 20q13 is amplified and overexpressed
in human breast cancer cell lines. Oncogene 14, 2195–2200.
Shah, J.V., Botvinick, E., Bonday, Z., Furnari, F., Berns, M., and Cleveland,
D.W. (2004). Dynamics of centromere and kinetochore proteins; implications
for checkpoint signaling and silencing. Curr. Biol. 14, 942–952.
Talos, F., Nemajerova, A., Flores, E.R., Petrenko, O., and Moll, U.M. (2007).
p73 suppresses polyploidy and aneuploidy in the absence of functional p53.
Mol. Cell 27, 647–659.
Tomasini, R., Tsuchihara, K., Wilhelm,M., Fujitani, M., Rufini, A., Cheung, C.C.,
Khan, F., Itie-Youten, A., Wakeham, A., Tsao, M.S., et al. (2008). TAp73
knockout shows genomic instability with infertility and tumor suppressor
functions. Genes Dev. 22, 2677–2691.
Tomasini, R., Tsuchihara, K., Tsuda, C., Lau, S.K., Wilhelm, M., Ruffini, A.,
Tsao, M.S., Iovanna, J.L., Jurisicova, A., Melino, G., and Mak, T.W. (2009).
TAp73 regulates the spindle assembly checkpoint by modulating BubR1
activity. Proc. Natl. Acad. Sci. USA 106, 797–802.
Vernole, P., Neale, M.H., Barcaroli, D., Munarriz, E., Knight, R.A., Tomasini, R.,
Mak, T.W., Melino, G., and De Laurenzi, V. (2009). TAp73alpha binds the
kinetochore proteins Bub1 and Bub3 resulting in polyploidy. Cell Cycle 8,
421–429.
Wadhwa, R., Takano, S., Robert, M., Yoshida, A., Nomura, H., Reddel, R.R.,
Mitsui, Y., and Kaul, S.C. (1998). Inactivation of tumor suppressor p53 by
mot-2, a hsp70 family member. J. Biol. Chem. 273, 29586–29591.
Wadhwa, R., Yaguchi, T., Hasan, M.K., Mitsui, Y., Reddel, R.R., and Kaul, S.C.
(2002). Hsp70 family member, mot-2/mthsp70/GRP75, binds to the cyto-
plasmic sequestration domain of the p53 protein. Exp. Cell Res. 274, 246–253.
Walker, C., Bottger, S., and Low, B. (2006). Mortalin-based cytoplasmic
sequestration of p53 in a nonmammalian cancer model. Am. J. Pathol. 168,
1526–1530.
Walker, C.W., and Bottger, S.A. (2008). A naturally occurring cancer with
molecular connectivity to human diseases. Cell Cycle 7, 2286–2289.
Yang, H., He, L., Kruk, P., Nicosia, S.V., and Cheng, J.Q. (2006). Aurora-A
induces cell survival and chemoresistance by activation of Akt through a
p53-dependent manner in ovarian cancer cells. Int. J. Cancer 119, 2304–2312.
Zhou, H., Kuang, J., Zhong, L., Kuo, W.L., Gray, J.W., Sahin, A., Brinkley, B.R.,
and Sen, S. (1998). Tumour amplified kinase STK15/BTAK induces centro-
some amplification, aneuploidy and transformation. Nat. Genet. 20, 189–193.
ancer Cell 21, 196–211, February 14, 2012 ª2012 Elsevier Inc. 211

Cancer Cell
Article
TEM8/ANTXR1 Blockade Inhibits PathologicalAngiogenesis and Potentiates Tumoricidal Responsesagainst Multiple Cancer TypesAmit Chaudhary,1 Mary Beth Hilton,1,2 Steven Seaman,1 Diana C. Haines,3 Susan Stevenson,4 Peter K. Lemotte,4
William R. Tschantz,4 Xiaoyan M. Zhang,4,5 Saurabh Saha,4,5 Tony Fleming,4 and Brad St. Croix1,*1Tumor Angiogenesis Section,MouseCancerGenetics Program,National Cancer Institute (NCI), National Institutes of Health (NIH), Frederick,
MD 21702, USA2Basic Research Program3Veterinary Pathology Section, Pathology/Histotechnology Laboratory
Science Applications International Corporation (SAIC), NCI, NIH, Frederick, MD 21702, USA4Novartis Institutes for BioMedical Research, Cambridge, MA 02139, USA5Present address: BioMed Valley Discoveries, Kansas City, MO 64111, USA
*Correspondence: [email protected]
DOI 10.1016/j.ccr.2012.01.004
SUMMARY
Current antiangiogenic agents used to treat cancer only partially inhibit neovascularization and cause normaltissue toxicities, fueling the need to identify therapeutic agents that aremore selective for pathological angio-genesis. Tumor endothelial marker 8 (TEM8), also known as anthrax toxin receptor 1 (ANTXR1), is a highlyconserved cell-surface protein overexpressed on tumor-infiltrating vasculature. Here we show that geneticdisruption of Tem8 results in impaired growth of human tumor xenografts of diverse origin including mela-noma, breast, colon, and lung cancer. Furthermore, antibodies developed against the TEM8 extracellulardomain blocked anthrax intoxication, inhibited tumor-induced angiogenesis, displayed broad antitumoractivity, and augmented the activity of clinically approved anticancer agents without added toxicity. Thus,TEM8 targeting may allow selective inhibition of pathological angiogenesis.
INTRODUCTION and agents that target the VEGF/VEGFR2 axis have been clini-
Solid tumors have an insidious ability to nourish their own expan-
sive growth by evoking the sprouting of new blood vessels, or
angiogenesis, from nearby vessels of neighboring nonmalignant
tissues. Upon vascularization, tumor blood vessels supply tumor
cells with vital oxygen and nutrients needed to support their
continued growth, and provide a key escape route for metas-
tasis. Due to their critical role in promoting tumor growth and
metastasis, tumor blood vessels have become a major target
of current anticancer therapy (Kerbel, 2008). Vascular endothe-
lial growth factor (VEGF) and its receptor, VEGFR2, represent
the most advanced targets of current antiangiogenic therapy,
Significance
Inhibiting angiogenesis has become an important adjunct toagents, including VEGF/VEGFR2 pathway inhibitors, disrupt nincreasing number of adverse side effects. TEM8 is an appebecause it is functionally required for optimal tumor angiogeand physiological angiogenesis. Function-blocking antibodiesological angiogenesis and tumor growth and augmented theVEGFR inhibitors. Thus, targeting TEM8 on tumor vasculaturcancer and other diseases dependent on pathological angiog
212 Cancer Cell 21, 212–226, February 14, 2012 ª2012 Elsevier Inc.
cally approved to treat patients with colon, lung, brain, and
kidney cancer (Brastianos and Batchelor, 2010; Kerbel, 2008).
Although therapies targeting VEGF/VEGFR2 have improved the
efficacy of current anticancer treatment strategies, angiogenesis
is seldom completely halted, and both angiogenesis and tumor
growth inevitably progress in the face of continued therapy.
Furthermore, in addition to its well-known role in physiological
angiogenesis of the adult, for example, during menstruation,
ovulation, and wound healing, VEGF is also widely expressed
in nonangiogenic normal adult tissues, where it plays critical
roles in normal adult physiology (Maharaj and D’Amore, 2007).
For example, it is required for normal kidney filtration (Eremina
traditional anticancer therapy, but current antiangiogenicormal physiological processes and are associated with analing target for selective inhibition of tumor angiogenesisnesis and growth but dispensable for normal developmentspecific to the extracellular domain of TEM8 blocked path-activity of various classes of anticancer agents, includinge may provide opportunities for the selective blockade ofenesis.

Cancer Cell
Anti-TEM8 Antibodies Inhibit Tumor Growth
et al., 2006), preventing neural degeneration (Oosthuyse et al.,
2001), and maintaining functional hematopoietic, endocrine,
and skeletal systems (Sung et al., 2010). Given the pleiotropic
activities of the VEGF pathway, it is not surprising that anti-
VEGF/VEGFR2 therapies are associated with a number of toxic-
ities, such as hypertension, proteinuria, hypothyroidism, diar-
rhea, deep vein thromboses, fatigue, and surgical wound healing
complications (Verheul and Pinedo, 2007). VEGF-blocking
agents have also been associated with some rare, more serious,
side effects including life-threatening thromboembolic events
and severe bleeding complications (Chen and Cleck, 2009; Ver-
heul and Pinedo, 2007). Antiangiogenic therapies need to be
administered for months to years and may eventually prove
useful in long-term adjuvant therapy for the prevention of recur-
rent disease, raising further concerns about long-term toxicities.
Thus, drugs that can selectively target pathological host vascu-
lature with minimal side effects are urgently needed.
Tumor endothelial marker 8 (TEM8) is a highly conserved
single-pass cell-surface glycoprotein that was originally identi-
fied based on its overexpression in the endothelial cells (ECs)
that line the tumor vasculature of human colorectal cancer (St.
Croix et al., 2000). Although our understanding of its physiolog-
ical function is limited, TEM8 has been found to bind to collagens
and promotemigration of ECs in vitro (Nanda et al., 2004;Werner
et al., 2006). TEM8 was also identified as an anthrax toxin
receptor (ANTXR1) (Bradley et al., 2001), and it shares 58%
amino acid identity with CMG2, a second receptor for anthrax
toxin protein (ANTXR2) (Scobie et al., 2003). TEM8 is upregulated
on tumor vessels of various tumor types in both mice and hu-
mans (Carson-Walter et al., 2001; Fernando and Fletcher,
2009; Nanda et al., 2004), and in some tumors is also expressed
by the tumor cells themselves (Carson-Walter et al., 2001; Jinnin
et al., 2008; Yang et al., 2011b). TEM8 was unique among the
original TEMs identified in that it could not be detected in the
angiogenic corpus luteum of human ovaries (Nanda et al.,
2004; St. Croix et al., 2000), and developmental angiogenesis
and wound healing are unperturbed in Tem8 knockout (KO)
mice (Cullen et al., 2009). Indeed, aside frommisaligned incisors,
adult Tem8 KOmice are overtly normal in appearance. However,
murine B16 melanoma tumor growth was impaired in Tem8 KO
versus wild-type mice, demonstrating that host-derived TEM8
can promote tumor growth on an immunocompetent back-
ground (Cullen et al., 2009). Furthermore, previous studies
have shown that a soluble TEM8-Fc trap, TEM8 vaccines, or
sublethal doses of anthrax toxin can inhibit angiogenesis, slow
tumor growth, and prolong survival (Duan et al., 2007; Felicetti
et al., 2007; Liu et al., 2008; Rouleau et al., 2008; Ruan et al.,
2009; Yang et al., 2010). Taken together, these studies suggest
that TEM8may be required for tumor angiogenesis but not phys-
iological angiogenesis. Here we sought to develop anti-TEM8
antibodies that can block TEM8 function in an effort to selectively
block pathological angiogenesis.
RESULTS
TEM8 Functions in Pathological but Not PhysiologicalAngiogenesisTo obtain further evidence that TEM8 is selectively associated
with pathological angiogenesis, we compared the Tem8 expres-
C
sion pattern between tumor ECs and adult regenerating liver
ECs. Following 70% partial hepatectomy, the remaining liver
grows rapidly in a highly regulated angiogenesis-dependent
process (Drixler et al., 2002; Seaman et al., 2007). In this model,
quiescent ECs enter the cell cycle synchronously at around 24 hr
postsurgery and cease proliferation about 72 hr later. To
examine gene expression, we performed quantitative RT-PCR
(QPCR) on ECs purified from tumor xenografts derived from
DLD1, HCT116, or LS174T cells, or ECs isolated from quiescent
resting liver (0 hr) or regenerating liver taken at various postsur-
gical time points (6, 18, 48, 72, or 96 hr). Although markers of
proliferation, such as Ki67, protein regulator of cytokinesis 1
(Prc1), and thymidine kinase (TK) were highly induced in liver
ECs by 48 hr postpartial hepatectomy, Tem8 expression levels
remained baseline in regenerating liver ECs. In contrast, Tem8
was expressed 32- to 55-fold higher in each of the tumor EC frac-
tions compared to resting liver ECs (Figure 1A). The peak expres-
sion levels of the cell-cycle genes in regenerating liver ECs were
higher than that in tumor ECs, presumably because of the
synchronous nature of the proliferating liver EC population.
To investigate whether Tem8 is expressed by tumor-associ-
ated inflammatory cells, such as CD11b+ myeloid cells or other
bone marrow-derived cells that have been shown to promote
tumor angiogenesis and may be involved in the refractoriness
of tumors to VEGF inhibition (Du et al., 2008; Shojaei et al.,
2007), we examined its expression in CD45+ (pan hematopoi-
etic), CD11b+ (myeloid), and CD105+ (endothelial) cells isolated
from tumors. Tem8 was highly expressed only in the endothelial
fraction (Figure S1A available online). To determine potential
tumor microenvironmental factors that induce TEM8 expression
on tumor vasculature, we examined cultured human microvas-
cular endothelial cells (HMECs) in response to several condi-
tions. Neither coculture with tumor cells nor exposure to
hypoxia induced TEM8 (Figures S1B and S1C). However,
upon serum starvation, TEM8 levels steadily increased in these
cells, which normally express low endogenous TEM8 levels, re-
sulting in a 4-fold increase in TEM8 mRNA (Figure 1B) and
a 5-fold increase in TEM8 protein (Figure 1C) by day 10. In
contrast, TEM8 levels remained low in cells maintained in
complete medium, and the slight increase in TEM8 expression
noted at later time points (Figures 1B and 1C) may have been
due to rapid growth factor depletion caused by increasing cell
numbers (Figure 1D, top). The increase in TEM8 expression
upon growth factor starvation was not influenced by the amount
of cell-cell contact, based on comparisons of sparse versus
confluent cells wherein the cell numbers were held constant
but the surface area was altered (data not shown). Importantly,
TEM8 elevation in growth factor-starved cells could be inhibited
by fibroblast growth factor (FGF), VEGF, or serum treatment,
and the combination of all three resulted in the lowest TEM8
levels (Figures 1E and 1F; Figure S1D). Thus, TEM8 may be
part of a compensatory angiogenic or survival pathway that is
activated, at least in part, by insufficient local angiogenic growth
factors.
Host-Derived TEM8 Promotes the Growth of HumanTumor XenograftsTo determine whether TEM8 could promote the growth of human
tumor xenografts, we generated Tem8 KO mice on an
ancer Cell 21, 212–226, February 14, 2012 ª2012 Elsevier Inc. 213

Figure 1. TEM8 Is Selectively Upregulated on Tumor Vasculature and Is Elevated in Cultured HMECs in Response to Growth Factor Depri-
vation
(A) QPCR was used to evaluate the expression of the indicated genes in ECs isolated from resting adult liver (0 hr), regenerating liver taken 6, 18, 48, 72, or 96 hr
following 70% partial hepatectomy, or DLD1, HCT116, or LS174T colon cancer xenografts.
(B) TEM8mRNA levels over the course of 10 days in HMECs grown in endothelial basal medium (EBM-2) or in complete medium (EBM-2 supplemented with FGF
[F], VEGF [V], and 5% fetal bovine serum [S]).
(C) TEM8 protein levels over the course of 10 days in HMECs grown in basal medium or in complete medium. The media are the same as in (B).
(D) The appearance of the cells used in (B) and (C) is shown. Note that HMECs became confluent by day 6 in complete medium but formed only small colonies by
day 10 in basal medium. The media are the same as in (B). The scale bar represents 100 mm.
(E and F) Effect of supplementation of basal growthmediumwith FGF, VEGF, or serum alone or all three together on the expression of TEM8 protein (E) andmRNA
(F) (*p < 0.05). Values in (A), (B), and (F) represent mean ± SD.
See also Figure S1.
Cancer Cell
Anti-TEM8 Antibodies Inhibit Tumor Growth
immunocompromised athymic nude background. Tumor growth
was inhibited in the Tem8 KO mice compared to WT littermate
controls when challenged with various tumor types including
melanoma (UACC and LOX), breast (MDA-MB-231), lung (NCI-
H460), and colon cancer (SW620, HCT116, and DLD1) (Figure 2).
The MDA-MB-231 breast tumors were grown orthotopically in
the mammary fat pad, whereas the melanoma and other tumor
214 Cancer Cell 21, 212–226, February 14, 2012 ª2012 Elsevier Inc.
types were grown subcutaneously. Tumor growth was consis-
tently slower in Tem8 KO versus WT mice, and SW620 tumors
required over 100 days to reach an average size of 800 mm3,
compared to only 35 days for WT littermates (Figure 2G). Thus,
host-derived TEM8 functions to promote the subcutaneous
and orthotopic growth of human tumor xenografts of diverse
origin.
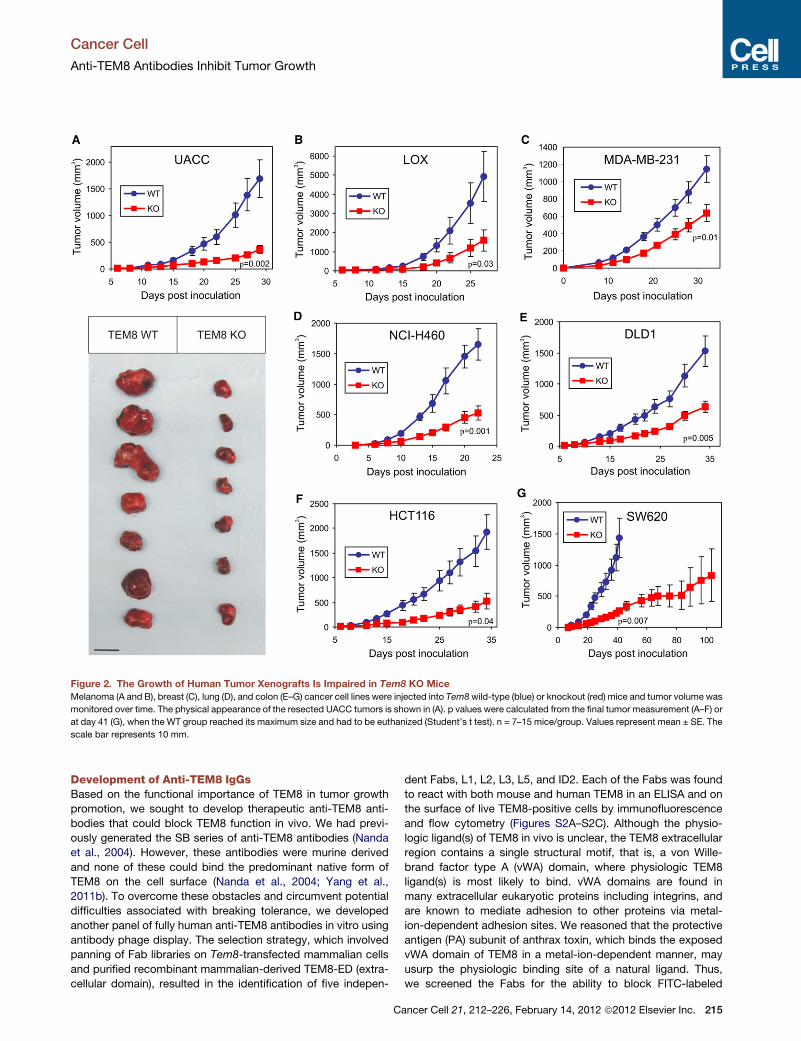
Figure 2. The Growth of Human Tumor Xenografts Is Impaired in Tem8 KO Mice
Melanoma (A and B), breast (C), lung (D), and colon (E–G) cancer cell lines were injected into Tem8wild-type (blue) or knockout (red) mice and tumor volume was
monitored over time. The physical appearance of the resected UACC tumors is shown in (A). p values were calculated from the final tumor measurement (A–F) or
at day 41 (G), when the WT group reached its maximum size and had to be euthanized (Student’s t test). n = 7–15 mice/group. Values represent mean ± SE. The
scale bar represents 10 mm.
Cancer Cell
Anti-TEM8 Antibodies Inhibit Tumor Growth
Development of Anti-TEM8 IgGsBased on the functional importance of TEM8 in tumor growth
promotion, we sought to develop therapeutic anti-TEM8 anti-
bodies that could block TEM8 function in vivo. We had previ-
ously generated the SB series of anti-TEM8 antibodies (Nanda
et al., 2004). However, these antibodies were murine derived
and none of these could bind the predominant native form of
TEM8 on the cell surface (Nanda et al., 2004; Yang et al.,
2011b). To overcome these obstacles and circumvent potential
difficulties associated with breaking tolerance, we developed
another panel of fully human anti-TEM8 antibodies in vitro using
antibody phage display. The selection strategy, which involved
panning of Fab libraries on Tem8-transfected mammalian cells
and purified recombinant mammalian-derived TEM8-ED (extra-
cellular domain), resulted in the identification of five indepen-
C
dent Fabs, L1, L2, L3, L5, and ID2. Each of the Fabs was found
to react with both mouse and human TEM8 in an ELISA and on
the surface of live TEM8-positive cells by immunofluorescence
and flow cytometry (Figures S2A–S2C). Although the physio-
logic ligand(s) of TEM8 in vivo is unclear, the TEM8 extracellular
region contains a single structural motif, that is, a von Wille-
brand factor type A (vWA) domain, where physiologic TEM8
ligand(s) is most likely to bind. vWA domains are found in
many extracellular eukaryotic proteins including integrins, and
are known to mediate adhesion to other proteins via metal-
ion-dependent adhesion sites. We reasoned that the protective
antigen (PA) subunit of anthrax toxin, which binds the exposed
vWA domain of TEM8 in a metal-ion-dependent manner, may
usurp the physiologic binding site of a natural ligand. Thus,
we screened the Fabs for the ability to block FITC-labeled
ancer Cell 21, 212–226, February 14, 2012 ª2012 Elsevier Inc. 215

Figure 3. L2 and L5 IgGs React Selectively with TEM8 and Block Binding and Toxicity of Anthrax Toxin Proteins
(A) L2 and L5 antibodies were used for flow cytometry staining of 293 cells stably transfected with mouse Tem8 (293-mTEM8) or a FLAG-tagged human TEM8
(293-Flag-hTEM8).
(B)L2andL5wereused forflowcytometrystainingofCHO/PR230 (CHO)cells (ananthrax toxin receptor-deficientcell line) thathadbeenstably transfectedwithhuman
TEM8 (CHO-TEM8) or human CMG2 (CHO-CMG2). FITC-labeled protective antigen (PA-FITC), which binds both TEM8 and CMG2, was used as a positive control.
Cancer Cell
Anti-TEM8 Antibodies Inhibit Tumor Growth
216 Cancer Cell 21, 212–226, February 14, 2012 ª2012 Elsevier Inc.

Cancer Cell
Anti-TEM8 Antibodies Inhibit Tumor Growth
anthrax toxin PA binding to the surface of cells expressing
TEM8. Each of the Fabs blocked FITC-PA binding in a dose-
dependent manner (Figure S2D). Thus, we identified five human
anti-TEM8 Fabs that were positive in all screens and that con-
tained a unique variable domain.
Fabs have a relatively short half-life in vivo (several hours)
compared to full IgGs (several days). To enhance their stability
in vivo, two of the Fabs, L2 and L5, were selected for reformatting
to full IgG. For preclinical testing inmice, the constant domains of
mouse IgG2a (CH1, CH2, CH3, and CL) were fused to the human
variable domains (VH and VL) in order to minimize immunoge-
nicity, resulting in human-mouse chimeric antibodies. After refor-
matting, both L2 and L5 IgGs maintained their activity against
TEM8 in the same screens used to test the Fabs, and were
specific because they failed to react with mouse or human
CMG2, the closest homolog of TEM8 (Figures 3A–3D and data
not shown). Upon titration and comparison at nonsaturating
concentrations, L2 bound TEM8-expressing cells with 7-fold
higher affinity than L5 (EC50 0.4 and 2.8 nM, respectively; see
Figure S2E). Similarly, L2 was �4-fold more potent at blocking
the binding of FITC-labeled protective antigen and �9-fold
more potent at preventing cytotoxicity caused by anthrax lethal
toxin (Figures 3E–3G).
Anti-TEM8 IgGs Inhibit Tumor Growth but Do Not DelayWound HealingWe tested the L2and L5antibodies for their activity against UACC,
HCT116, and DLD1 colon tumor xenografts in athymic nudemice.
In these studies, mice were treated with L2 or L5 once tumors
reachedanaverage sizeof 50mm3. For each tumor typeanalyzed,
a marked tumor growth inhibition was observed in each of the
treated groups compared to vehicle (PBS) alone (Figures 4A–4E).
Theantitumoractivitywascomparable to thatofanti-VEGFR2anti-
bodies (Figure 4C). When L2 and L5 were compared in a dose-
escalation study to determine the amount of antibody required
for optimal tumor growth inhibition, L2 showed superior activity.
A partial growth inhibition was observed when mice were given
2mg/kg of L2, whereasmaximum growth inhibition was observed
with 15 mg/kg (Figure 4E). L5, on the other hand, only showed
partial growth inhibition at 15 mg/kg, similar to that observed in
the 2mg/kg L2 treatment group, and in each tumor study required
30–40mg/kg to achieve its optimal biologic dose (OBD). Although
L5 required a higher dose than L2 to achievemaximumefficacy, at
their OBDs the two antibodies showed similar antitumor activity.
Taken together, these studies demonstrate a marked in vivo anti-
tumor activity of two independent anti-TEM8 antibodies. Because
the full IgG of L2 appeared more potent than L5 both in vitro and
in vivo, we focused on L2 for the remainder of our studies.
The aforementioned studies were conducted in immunocom-
promised mice. To determine whether L2 could suppress tumor
(C) Western blot analysis was used to evaluate the expression of TEM8 and CM
(D) L2 antibodies were used for cell-surface immunofluorescence labeling of CH
(E) The ability of L2 and L5 antibodies to block binding of PA-FITC to CHO-TEM
(F) The viability of CHO and CHO-TEM8 cells was evaluated 48 hr posttreatmen
(G) The ability of L2 and L5 antibodies to protect cells from toxicity following treatm
was 1.9 and 16.6 nM, respectively. Values in (F) and (G) represent mean ± SE.
See also Figure S2.
C
growth in the presence of an intact immune system, we in-
jected murine B16 melanoma cells into syngeneic C57BL/6
mice and began treating mice with L2 at a tumor size of
50 mm3. The L2-treated group had a 60% reduction in tumor
growth by the end of the study (Figure 4F). Midway through
the therapeutic course, we also inflicted 6-mm-diameter
wounds into each of the tumor-bearing mice to determine
whether L2 treatment would interfere with wound healing.
Wound closure rates were not significantly altered by L2 (Fig-
ure 4G), despite its clear antitumor activity in the same mice.
Immunofluorescence staining for CD31 showed no alteration
in the amount of vasculature present within the healing wound
granulation tissue (Figure 4H). Matrigel-induced vascularization
was also unaffected by L2 treatment (Figure 4I). Thus, L2 anti-
bodies inhibited chronic pathological tumor growth while not
interfering with normal healing processes dependent on physi-
ological angiogenesis.
L2 Has No Detectable ToxicityTwo types of toxicology studies were conducted to determine
how well the L2 anti-TEM8 antibody was tolerated. The first
study involved dose escalation, wherein mice were administered
20, 50, or 100 mg/kg of L2 every other day for a total of three
treatments and then analyzed 24 hr later. All serum chemistry
and blood cell counts in the group treated with 100 mg/kg L2
were similar to that of the control group, and no dose-dependent
alterations were observed (Table 1; data not shown). Treated
mice consumed food and socialized similarly to control animals,
and both body and organ weights were unchanged (Figures S3A
and S3B). A comprehensive histopathologic analysis of 44
organs or tissues derived from 6 mice/group failed to reveal
any abnormalities (data not shown). The second toxicology
study involved treatment of mice with 20 mg/kg of L2 three times
per week for up to 6 weeks, followed by an analysis of the same
toxicology parameters. Again, no abnormalities were noted (Fig-
ure S3C; data not shown).
L2 Targets Tumor Vasculature In VivoTo determine the specificity of L2 for TEM8 in vivo, we decided to
treat tumor-bearing Tem8 WT and KO mice with L2, reasoning
that L2 should only have activity against tumors in Tem8 WT
mice if the tumor cells employed do not themselves express
endogenous TEM8. TEM8 expression varied among cultured
tumor cell lines, among which DLD1 tumor cells expressed
undetectable TEM8 both in cell culture and following purification
from established tumors in vivo (Figures S4A and S4B). There-
fore, to test the specificity of the L2 antibody in vivo, Tem8 WT
and KO mice were challenged with DLD1 cells and treated with
L2 or control IgG (Figure 5A). As expected, tumors grew more
slowly in Tem8 KO compared to Tem8 WT mice treated with
G2 in stably transfected CHO-TEM8 and CHO-CMG2 cells.
O and CHO-TEM8 cells.
8 cells was measured by flow cytometry.
t with lethal toxin.
ent with 1 mg of lethal toxin was evaluated. In this assay, the EC50 for L2 and L5
ancer Cell 21, 212–226, February 14, 2012 ª2012 Elsevier Inc. 217

Figure 4. Anti-TEM8 Antibodies Inhibit Tumor Growth but Do Not Delay Wound Healing
(A–F) Melanoma (A, B, and E: UACC; F: B16) or colon cancer (C: LS174T; D: HCT116) tumor cells were inoculated subcutaneously into athymic nude (UACC,
LS174T, HCT116) or C57BL/6 (B16) mice and tumor growth wasmonitored. Treatments with PBS (vehicle), anti-VEGFR2 antibodies, or anti-TEM8 antibodies (L2
or L5) were administered three times per week andwere initiated when tumors reached a size of 50mm3 (arrows). A Student’s t test was used to calculate p values
between the vehicle and L2 treatment groups at the final tumormeasurement. Tumors were excised at the end of the study to calculate final tumor weights (insets
in B–D). *p = 0.00005, **p = 0.002, ***p = 0.02.
(A) The physical appearance of the UACC melanoma tumors at the end of the study following surgical excision. The scale bar represents 10 mm.
(B) L2 inhibition of UACC melanoma tumor growth.
(C) L2 and DC101 (anti-VEGFR2) inhibition of LS174T tumor growth.
(D) L5 inhibition of HCT116 tumor growth.
(E) L2 and L5 dose-dependent inhibition of UACC tumor growth.
(F) L2 inhibition of B16 melanoma tumor growth.
Cancer Cell
Anti-TEM8 Antibodies Inhibit Tumor Growth
218 Cancer Cell 21, 212–226, February 14, 2012 ª2012 Elsevier Inc.

Table 1. Selected Toxicological Results and Organ Weights
Control
100 mg/kg
L2 Anti-TEM8
Selected Parameters
White blood cells (K/ml) 5.9 ± 2.5 6.3 ± 2.4
Red blood cells (M/ml) 9.5 ± 0.4 9.6 ± 0.4
Albumin (g/dl) 4.0 ± 0.4 3.9 ± 0.1
Alanine aminotransferase (U/l) 52.7 ± 10.1 51.9 ± 27.4
Total bilirubin (mg/dl) %0.2 %0.2
Creatine (mg/dl) %0.2 %0.2
Hemoglobin (g/dl) 13.9 ± 0.6 13.9 ± 0.4
Total protein (g/dl) 5.6 ± 0.2 5.7 ± 0.4
Blood urea nitrogen (mg/dl) 19.7 ± 2.0 17.5 ± 3.4
Selected Organ Weights (mg)
Brain 462 ± 19 465 ± 15
Heart 137 ± 15 155 ± 21
Kidney 312 ± 58 308 ± 63
Liver 1,173 ± 180 1,152 ± 271
Lung 153 ± 20 168 ± 34
Spleen 80 ± 13 83 ± 15
Represented toxicological data and organ weights from mice (n = 6/
group) dosed i.p. every second day with saline (control) or 100 mg/kg
anti-TEM8 mAb. Values are mean ± SD.
See also Figure S3.
Cancer Cell
Anti-TEM8 Antibodies Inhibit Tumor Growth
control IgG. When the L2 antibody was administered to Tem8
WT mice, tumor growth was inhibited relative to the IgG control
group but was indistinguishable from that in the Tem8 KO group.
Importantly, L2 treatment of Tem8 KO tumor-bearing mice did
not result in any further tumor growth inhibition. Taken together,
these results indicate that TEM8 is the sole target of L2 in vivo,
and supports the hypothesis that L2 is a function-blocking
monoclonal antibody.
The previously described expression of TEM8 in tumor endo-
thelium (Fernando and Fletcher, 2009; Nanda et al., 2004; St.
Croix et al., 2000) suggests that the target tissue of L2 in vivo
may be the tumor-associated vasculature. To assess this, we
performed CD31 vessel staining of the human DLD1 colon
cancer xenografts and found a reduced number of vessels in
tumors derived from Tem8 KO or L2-treated mice (Figure 5B).
Quantification of the number of CD31-positive ECs in tumors
using flow cytometry revealed significantly lower EC numbers
following both pharmacologic and genetic ablation of TEM8 (Fig-
ure 5C). We reasoned that TEM8 may promote proliferation of
tumor ECs, based on previous studies that showed a role for
CMG2 in promoting endothelial proliferation (Reeves et al.,
2010). However, endothelial proliferation in DLD1 tumors was
not altered in response to L2 treatment (Figure S4C), although
the number of apoptotic ECs was significantly increased (p <
0.02; Figure S4D).
To further assess the specificity of L2 in vivo, L2 was labeled
with FITC and then intravenously injected into DLD1 tumor-
bearing mice. Immunofluorescence analysis revealed localiza-
tion of TEM8 selectively in tumor-associated vasculature but
not in any of the normal control tissues analyzed including brain,
heart, intestine, liver, muscle, spleen, and stomach (Figure 5D).
Some tumor-associated perivascular stromal cells, including
pericytes based on their adjacent proximity to endothelium,
were also positive. However, stromal cell staining was confined
to the tumor region in Tem8 WT mice and was absent from the
tumors in Tem8 KO mice, confirming the specificity of antibody
staining (Figure 5E).
L2 Can Elicit NK-Mediated and Complement-MediatedCytotoxicityWe reasoned that the antitumor activity of L2 in vivo may involve
multiple mechanisms, and that antibody-dependent cellular
cytotoxicity (ADCC) and/or complement-dependent cytotoxicity
(CDC) could contribute to this activity. To determine whether
TEM8 could potentially function as a target of ADCC, we mixed
effector natural killer cells with TEM8-expressing 293 target cells
at various ratios and found that L2, but not control IgG, was able
to elicit cytotoxicity that was dependent on both the antibody
and effector cell concentration (Figures 5F and 5G). Similarly,
L2 elicited CDC in both an antibody- and complement-depen-
dent manner (Figures 5H and 5I). Although these in vitro studies
support a role for ADCC and CDC, further work is required to
(G) Wound closure rates following treatment with L2 or vehicle (PBS) alone. In this
in (F).
(H) CD31 immunofluorescence staining of granulation tissue vasculature in co
experiment (n = 6 wounds/group).
(I) Matrigel plug vascularization was assessed following treatment with nonspecifi
per group. Values in (B)–(I) represent mean ± SE. The scale bars (H and I) repres
C
determine whether these mechanisms contribute to the anti-
tumor activity of L2 in vivo.
L2 Potentiates Tumoricidal ResponsesThe delayed tumor growth in Tem8 KO mice and the encour-
aging antitumor activity of L2 against relatively small established
50 mm3 tumors prompted us to explore the activity of L2 against
larger tumors. Importantly, even tumors that were 200 mm3 in
size prior to L2 treatment showed a significant response to the
antibody such that when the control tumors reached an average
size of 2,000 mm3, treated tumors had an average size of
1,288 mm3 (Figure 6A). However, because the L2-mediated
growth inhibition was less effective against relatively large
(200 mm3) preestablished tumors compared to small (50 mm3)
tumors (compare L2-treated group in Figure 6A with that in Fig-
ure 4B), we determined whether the combination of L2 with other
types of anticancer agents would result in enhanced antitumor
efficacy. When L2 treatment was combined with the anti-
VEGFR2 antibody DC101, which prevents VEGF from binding
VEGFR2, L2 significantly enhanced the activity of DC101 against
UACC melanoma (p < 0.05; Figure 6A). Furthermore, the combi-
nation of L2 with DMXAA (ASA404), a vascular targeting agent
that has shown promising activity in early clinical trials against
lung cancer (Baguley and McKeage, 2010), proved highly
experiment, wounds were generated in the same tumor-bearingmice as shown
ntrol and L2-treated groups. Control mice received nonspecific IgG in this
c IgG or L2 anti-TEM8 antibodies. Vessel areas were calculated from six plugs
ent 100 mm.
ancer Cell 21, 212–226, February 14, 2012 ª2012 Elsevier Inc. 219

Figure 5. L2 Targets Tumor Vasculature In Vivo and Engages ADCC and CDC In Vitro
(A) Nonspecific antibodies (IgG control) or L2 anti-TEM8 antibodies were administered to Tem8 wild-type (T8-WT) or Tem8 knockout (T8-KO) mice at 20 mg/kg
mice three times per week beginning 1 day post-subcutaneous inoculation of TEM8-negative DLD1 tumor cells. At day 30 (asterisk), the tumors in the T8-WT +
IgG control groupwere significantly larger than those in each of the other three groups (p < 0.0001), but therewas no difference in tumor size between the T8-KO +
IgG, T8-WT + L2, and T8-KO + L2 groups (one-way ANOVA with Bonferroni posttest) (n = 12 mice/group).
(B) Immunofluorescence vessel staining of Tem8 WT and KO mice following treatment with L2 or IgG. Right: quantification of CD31-positive vessel area. p <
0.0001 between each of the groups and the IgG WT control group (one-way ANOVA). The scale bar represents 200 mm.
Cancer Cell
Anti-TEM8 Antibodies Inhibit Tumor Growth
220 Cancer Cell 21, 212–226, February 14, 2012 ª2012 Elsevier Inc.

Cancer Cell
Anti-TEM8 Antibodies Inhibit Tumor Growth
effective against NCI-H460 lung cancer xenografts (Figure 6B).
Both L2 and DMXAA significantly delayed tumor growth, but
the combination was evenmore efficacious than either treatment
alone (p < 0.001; DMXAA + L2 versus DMXAA alone). Finally,
when L2 was combined with 5-fluorouracil (5FU) and irinotecan
(IRT), chemotherapeutic agents that are currently used to treat
patients with colorectal cancer, L2 significantly enhanced their
efficacy against HCT116 tumors (p < 0.0001, 5FU + L2 versus
5FU; p < 0.02, IRT + L2 versus IRT; Figures 6C and 6D). L2
also enhanced the efficacy of irinotecan against SW620 (p <
0.02, IRT + L2 versus IRT; Figure 6E), another colon cancer tumor
model, demonstrating the generality of this response. Combina-
tion of L2 with IRTwas highly efficacious, such that tumors in 5 of
11 mice in the HCT116 study and 4 of 11 mice in the SW620
study had completely regressed by 100 days postinoculation,
and thesemice remained tumor free for the duration of the study,
an additional 7 months (Figures 6D and 6E). No complete tumor
responses were observed in any of the monotherapy treatment
arms. To further assess the inhibitory activity of L2 + IRT
following long-term therapy, treatment was discontinued after
100 days, which resulted in rapid expansion of the remaining
tumors that had not completely regressed. Analysis of body
weights, food consumption, serum chemistry, and hematolog-
ical profiles in these combination drug trials failed to reveal
a change in toxicity caused by the addition of L2 to the chemo-
therapeutic agent (Figure 6F; Table S1). Taken together, these
studies demonstrate that L2 treatment can enhance the anti-
tumor responses of a wide variety of anticancer agents without
added toxicity.
L2 Binds Human Tumor VasculatureTo examine the specificity of L2 binding in human tumors, in situ
immunofluorescence staining with L2 was performed on colo-
rectal tumors or adjacent normal colonic mucosa derived from
six cases of late-stage colorectal cancer, four of which were
patientmatched. Although stainingwas undetectable in all cases
of normal colonic mucosa, in each of the tumor samples L2-FITC
strongly labeled the tumor stroma, including von Willebrand
factor (vWF)-positive ECs as well as some perivascular stromal
cells that, based on morphology, appeared to include pericytes
and possibly fibroblasts (Figure 7). Although the intensity of
stromal staining was variable in different regions of the tumor,
the staining was considered specific because it was completely
blocked by the addition of unlabeled L2 but not isotype-matched
(C) Flow cytometry staining of dispersed tumor tissues was used to determine th
(WT-L2), IgG-treated tumors from Tem8 KOmice (KO-IgG), and IgG-treated tumo
for each of the groups, and the bar graph displays the average percentage of
significantly fewer cells than the WT-IgG group, as determined by a one-way AN
(D) L2 localization in vivo was assessed by immunofluorescence staining of vario
mice. An overlay of the L2 image (green) with the endothelial marker image (Mec
merge). The scale bar represents 50 mm.
(E) The specificity of L2-FITC for TEM8 in vivo was assessed by comparing the sta
bar represents 50 mm.
(F) NK-mediated toxicity against TEM8-expressing target cells was measured i
experiment was 25:1.
(G) The impact of increasing E:T cell ratios on L2-mediated ADCC was evaluated
(H) Complement-dependent cytotoxicity was assessed with varying amounts of
(I) To evaluate complement dependency, variable amounts of complement were
See also Figure S4.
C
control IgG. Thus, in tumors derived from both patients and
mouse xenografts, TEM8 is found in tumor-associated vascula-
ture and tumor-associated perivascular stromal cells.
DISCUSSION
These studies demonstrate that TEM8 is critical for promoting
pathological angiogenesis evoked by a variety of tumor types,
and that antibody-mediated targeting of TEM8 provides
a rational strategy for combating cancer. Most angiogenesis
regulators that have been discovered to date cannot distin-
guish physiological and pathological angiogenesis. In immuno-
competent mice, L2 inhibited tumor growth but had no effect
on wound healing in the same mice, consistent with earlier
studies demonstrating no difference in wound healing between
Tem8 WT and KO mice (Cullen et al., 2009). TEM8 was also
dispensable for developmental angiogenesis and normal phys-
iological angiogenesis of the corpus luteum (Cullen et al., 2009;
Nanda et al., 2004; St. Croix et al., 2000). A function for TEM8 in
these normal physiological processes could potentially be
masked through compensation by another molecule. However,
CMG2 is the only other protein that shares significant amino
acid identity with TEM8 and, aside from misaligned incisors,
Cmg2/Tem8 double-mutant mice, like Tem8 KO mice, appear
to develop normally (Liu et al., 2009). These results support
the conclusion that physiological and pathological angiogen-
esis are distinct and that antibody-mediated targeting of
TEM8 can selectively inhibit pathological tumor growth while
sparing normal healing processes that also require
vascularization.
Based on our results, we propose that TEM8 overexpression
in tumor vasculature may be caused, at least in part, by local
decreases in the availability of stromal growth factors, such
as VEGF and FGF. At first, this might seem counterintuitive,
given the overall proangiogenic nature of tumors. However,
blood flow through the tortuous vessels in tumors is known to
be slow, erratic, and often static, which could contribute to
the rapid local depletion of angiogenic growth factors. Tumor
ECs may also have to compete for growth factors with tumor
cells that often express VEGF and/or FGF receptors themselves
and can sometimes utilize angiogenic growth factors for their
own growth (Dallas et al., 2007; Masood et al., 2001). Finally,
hypoxia, a well-known inducer of VEGF gene transcription,
may also lead to overexpression of the high-affinity VEGFR1
e percentage of CD31-positive cells in L2-treated tumors from Tem8 WT mice
rs from Tem8wild-type mice (WT-IgG). The dot plots show representative data
CD31-positive cells (n = 6/group). Both the WT-L2 and KO-IgG groups had
OVA.
us tissues following i.v. injection of FITC-labeled L2 into DLD1 tumor-bearing
a-32 or CD31, red) was used to assess colocalization with vasculature (yellow,
ining of tumor stroma from Tem8wild-type and Tem8 knockout mice. The scale
n the presence of L2 or control IgG. The effector:target (E:T) cell ratio in this
.
L2 or control IgG.
added to the CDC assay. Values in (A)–(C) and (F)–(I) represent mean ± SE.
ancer Cell 21, 212–226, February 14, 2012 ª2012 Elsevier Inc. 221

Figure 6. L2 Anti-TEM8 Antibodies Augment the Efficacy of Various Classes of Anticancer Agents
(A) UACC tumor growthwas compared following treatment with vehicle (PBS), nonspecific mouse IgG (20mg/kg), L2 anti-TEM8 (20mg/kg), anti-VEGFR2 (40mg/
kg), or a combination of L2 (20 mg/kg) and anti-VEGFR2 (40 mg/kg). Treatments were administered three times per week (arrows) beginning 15 days post-tumor
cell inoculation when tumors reached a size of 200 mm3.
Cancer Cell
Anti-TEM8 Antibodies Inhibit Tumor Growth
222 Cancer Cell 21, 212–226, February 14, 2012 ª2012 Elsevier Inc.

Figure 7. L2 Anti-TEM8 Antibodies Bind to the Vasculature of Human Colorectal Cancer
FITC-conjugated L2 (green) was used for immunofluorescence labeling of human colorectal tumors and normal colonic mucosa. The vasculature was costained
with antibodies against von Willebrand factor (red), a pan endothelial marker, and overlapping immunofluorescence is shown in the merged image (yellow). The
normal and tumor samples shownwere patient-matched and processed in parallel. To prevent nonspecific binding, immunofluorescence staining was performed
in the presence of a 50-fold excess of isotype-matched (human-mouse chimeric) control IgG that was generated against a foreign antigen (cyclosporine A). The
staining was abolished by blocking the samples with unlabeled L2 (bottom) prior to adding L2-FITC. The middle and bottom panels were taken from serial
sections. The scale bar represents 100 mm.
Cancer Cell
Anti-TEM8 Antibodies Inhibit Tumor Growth
(Gerber et al., 1997) or its soluble splice variant sVEGFR1 that
can act as decoy receptors, limiting VEGF bioavailability (Lams-
zus et al., 2003; Yamaguchi et al., 2007; Yang et al., 2011a).
(B) NCI-H460 tumor growth was compared following treatment with vehicle, L2 an
tumor inoculation when tumors reached an average size of 100mm3. In this experi
duration of the study, whereas DMXAA was administered at a high dose of 25 m
(C) HCT116 tumor growth was compared following treatment with vehicle, L2 ant
beginning 11 days post-tumor inoculation when tumors reached an average size
arrows), whereas 5FU was administered once a week for 3 weeks (black arrows
(D) HCT116 tumor growth was compared following treatment with vehicle, L2 anti
beginning 11 days post-tumor inoculation when tumors reached a size of 100mm3
100 days postinoculation. Tomaximize efficacy without excessive toxicity andmim
treatment per week for 3 weeks; black arrows) that were separated by a 2 week
conducted simultaneously and contain the same vehicle and L2 groups, which w
(E) SW620 tumor growth was compared following treatment with vehicle, L2 anti-
beginning 14 days post-tumor inoculation when tumors reached a size of 100 mm
above. IRT caused tumor regression in many of the treated mice. A decrease in tu
during the second cycle of IRT treatment. During the subsequent 2 week rest per
tumors in the combination group (IRT + L2) regressed again, whereas the larger tu
the error bars are shown in (D) and (E).
(F) Bodyweights inHCT116 tumor-bearingmice from the 5FUstudy (upper, corres
from the start of therapy until the tumors in the control groups reached their maxim
The SD ranged from 2% to 8%and error bars are omitted for clarity. The apparent
treatments (black arrows) were nonsignificant and were not altered by L2 treatme
C
Elevated TEM8 expression in tumor ECs in response to growth
factor deprivation and possibly other unidentified microenviron-
mental stressors may be part of a survival pathway that helps
ti-TEM8, DMXAA, or a combination of L2 and DMXAA beginning 15 days post-
ment, L2 (20mg/kg) was administered three times per week (red arrows) for the
g/kg (black arrows), followed by 5 mg/kg/day the following 2 days.
i-TEM8 (20 mg/kg), 5-fluorouracil (100 mg/kg), or a combination of L2 and 5FU
of 100 mm3. In this experiment, L2 was administered three times per week (red
).
-TEM8 (20 mg/kg), irinotecan (80 mg/kg), or a combination of L2 and irinotecan
. In this experiment, L2was administered three times per week (red arrows) until
ic the clinical situation, IRT was administered in three cycles (where 1 cycle = 1
rest period to allow recovery. The HCT116 tumor studies in (C) and (D) were
ere duplicated for ease of comparison.
TEM8 (20 mg/kg), irinotecan (80 mg/kg), or a combination of L2 and irinotecan3. The treatments in this study were the same as those described for HCT116
mor size caused by IRT is readily observed in both IRT arms (IRT and IRT + L2)
iod the tumors rapidly rebounded. Following the last cycle of IRT, many of the
mors in the control group did not respond. For ease of comparison, only half of
ponding toC) or the irinotecan study (lower, corresponding toD)weremonitored
um allowable size andmice had to be euthanized. Data represent mean values.
reduction inmean body weight observed following 5-fluorouracil and irinotecan
nt (red arrows). Values in (A)–(E) represent mean ± SE. See also Figure S5.
ancer Cell 21, 212–226, February 14, 2012 ª2012 Elsevier Inc. 223

Cancer Cell
Anti-TEM8 Antibodies Inhibit Tumor Growth
ECs cope during suboptimal growth conditions. Tem8 KO mice
provide a valuable tool for assessing the role of TEM8 in path-
ological angiogenesis. For most pharmacological angiogenesis
inhibitors, it is difficult to find animal models completely lacking
the drug target because the target proteins are usually required
for developmental angiogenesis, and temporally induced dele-
tion of a conditional ‘‘floxed’’ target gene in adult mice using
cre-lox technology is often incomplete. Importantly, by treating
Tem8 WT or KO mice with L2 anti-TEM8 antibody, we could
verify that TEM8 is the target of this antibody in vivo, and that
L2 treatment inhibits tumor growth to a level similar to complete
genetic ablation. Further evidence for antibody specificity was
obtained using FITC-labeled L2 that selectively reacted with
the tumor vessels in Tem8 WT but not KO mice.
Multiple mechanisms could potentially contribute to the anti-
tumor activity of L2 in vivo, but so far the evidence suggests
that the antibodies work primarily by blocking TEM8 function
and that ADCC and CDC may play a more limited role. The
extent of tumor growth delay observed in Tem8 KO mice was
found to vary depending on the tumor type employed, but
the same tumor-type-dependent responses were observed
following L2 blockade. For example, UACC tumors consistently
displayed the most pronounced growth delay in Tem8 KO
versus WT mice, and were also the most responsive to L2.
Indeed, the tumor growth patterns observed in Tem8 KO
mice were found to be indistinguishable from those observed
in the L2-treated Tem8 WT mice, provided that L2 treatment
began immediately following tumor cell inoculation (for
example, see Figure 5A). It is currently unclear why some tumor
types rely more on host-derived TEM8 than others, but the
degree of TEM8 dependence does not appear to correlate
with the tumor cells’ ability to evoke TEM8 expression in nearby
tumor-associated ECs. For example, in Tem8 WT mice, tumor
ECs isolated from LLC tumors expressed four times more
Tem8 than those isolated from B16 tumors, yet comparisons
of tumor growth in Tem8 WT and KO mice revealed that B16
tumors are more dependent on host-derived TEM8 than LLC
cells (Cullen et al., 2009). We expect that if ADCC and CDC
were the major mechanisms governing tumor responses in vivo,
then tumor responsiveness would have correlated with TEM8
expression levels in tumor ECs, because ADCC and CDC
both depend on target antigen expression levels. Therefore,
further studies are required to establish whether ADCC and
CDC contribute significantly to L2’s activity in vivo. Neverthe-
less, affinity maturation of the variable domain and modifica-
tions to the Fc domain that enhance ADCC and CDC activity
(Natsume et al., 2009) could lead to further enhancement of
antitumor efficacy.
Although anti-TEM8 antibodies inhibited tumor growth as
a monotherapy, based on our results we predict that TEM8 anti-
bodies may be most useful in combination with other agents.
TEM8 antibodies were completely nontoxic and displayed effi-
cacy when combined with various classes of anticancer agents.
That anti-TEM8 antibodies augment the activity of VEGFR2-
neutralizing antibodies suggests that signaling pathways
involving TEM8 may be responsible, at least in part, for angio-
genesis that persists following VEGF/VEGFR2 inhibition.
Although human-mouse chimeric antibodies were employed in
the preclinical studies described here, reengineering of the Fc
224 Cancer Cell 21, 212–226, February 14, 2012 ª2012 Elsevier Inc.
domain can be used to make the IgG fully human for future clin-
ical development.
In summary, we report the development of anti-TEM8 anti-
bodies that retard tumor growth by inhibiting tumor angiogen-
esis. Anti-TEM8 antibodies were nontoxic and maintained effi-
cacy in combination with various classes of anticancer agents.
Thus, anti-TEM8 antibodies provide a rationally designed tool
for selectively inhibiting pathological angiogenesis with impor-
tant ramifications for the management of angiogenesis-depen-
dent diseases.
EXPERIMENTAL PROCEDURES
Antibody Production and Purification
In vitro selection of the Morphosys HuCAL Gold phage library involved two
rounds of sequential panning on biotinylated, purified recombinant
TEM8(ED)-Fc fusion proteins, prepared as described in Supplemental Experi-
mental Procedures, andone roundofpanningonHEK293cells transfectedwith
human TEM8 (293/Flag-hTEM8). DNA inserts for the Fab heavy and light chains
were subcloned and expressed, and bivalent Fabs were evaluated for TEM8
binding by ELISA (see Supplemental Experimental Procedures). Two of the
TEM8-binding clones (L2 and L5) were reformatted to generate mouse-human
chimeric full IgGs. Anti-TEM8 antibodies were collected from HEK293T culture
supernatants and purified by protein A and size exclusion chromatography.
Western Blotting
Western blotting was performed using antibodies against TEM8 (clone SB5;
Nanda et al., 2004), CMG2 (a kind gift from Stephen Leppla), actin (Chemicon),
or HIF-1a (Novus Biologicals) as previously described (Cullen et al., 2011).
Animal and Tumor Studies
To derive Tem8KOmice on an immunodeficient background, Tem8KOmice on
aC57BL/6background (Cullenetal., 2009)werecrossedwithathymicNCr-nu/nu
mice, and only Tem8 WT and KO littermates derived from Tem8 heterozygous
intercrosses were used for comparison. Tumors were measured with a caliper,
and tumor volumes were calculated using the formula length 3 width2 3 0.5
and presented as the mean ± SE. All animal studies were carried out in accor-
dance with protocols approved by the NCI Animal Care and Use Committee.
Immunofluorescence
For in vivo target identification, FITC-labeled L2 was coinjected with nonspe-
cific mouse IgG intraperitoneally into DLD1 tumor-bearing Tem8 WT and KO
mice. Frozen sections were labeled with rat anti-PV-1 (Meca-32) or rat anti-
CD31 (BD Pharmingen) antibodies. For immunofluorescence staining of
human normal colonic mucosa or colorectal cancer, frozen tissue sections
were blocked with nonspecific mouse-human chimeric IgG antibodies (mouse
Fc/human Fab) generated against cyclosporine A and detected with L2-
labeled FITC. The anonymized human colon tissue samples were obtained
from the Cooperative Human Tissue Network with approval from the NIH
Office of Human Subject Research. Further details regarding the immunofluo-
rescence staining can be found in Supplemental Experimental Procedures.
Statistical Analysis
A Student’s t test was used to calculate differences in tumor volumes or
weights between two groups (for example, Tem8 WT and KO mice) at the
time when the WT (or control) group reached its maximum size and had to
be euthanized. For comparisons between multiple tumor groups, a one-way
ANOVA was used with a Bonferroni posttest. A one-way ANOVA was used
for comparisons of microvascular densities and the fraction of CD31-positive
cells by flow cytometry. p values < 0.05 were considered significant.
SUPPLEMENTAL INFORMATION
Supplemental Information includes four figures, one table, and Supplemental
Experimental Procedures and can be found with this article online at doi:10.
1016/j.ccr.2012.01.004.
Cancer Cell
Anti-TEM8 Antibodies Inhibit Tumor Growth
ACKNOWLEDGMENTS
We thank Drs. Bert Vogelstein, Terry Van Dyke, Lino Tessarollo, and Isaiah J.
Fidler for helpful suggestions.We thank Rou-Fun Kwong for help with the initial
selection and characterization of anti-TEM8 antibodies. We thank Dr. Stephen
H. Leppla, National Institute of Allergy and Infectious Diseases, NIH, for the
CHO, CHO/TEM8, and CHO/CMG2 cells, recombinant PA, and lethal factor,
and Dr. Arthur E. Frankel for the AF334 hybridoma. This work was supported
in part by a Cooperative Research and Development Agreement between
the Novartis Institutes for BioMedical Research and the intramural research
program of the NCI, NIH, Department of Health and Social Services (DHSS),
and with federal funds from the NCI under contract no. HHSN261200800001E.
The content of this publication does not necessarily reflect the views or poli-
cies of the DHSS nor does mention of trade names, commercial products,
or organizations imply endorsement by the U.S. government.
Received: May 12, 2011
Revised: September 19, 2011
Accepted: January 5, 2012
Published: February 13, 2012
REFERENCES
Baguley, B.C., and McKeage, M.J. (2010). ASA404: a tumor vascular-disrupt-
ing agent with broad potential for cancer therapy. Future Oncol. 6, 1537–1543.
Bradley, K.A., Mogridge, J., Mourez, M., Collier, R.J., and Young, J.A. (2001).
Identification of the cellular receptor for anthrax toxin. Nature 414, 225–229.
Brastianos, P.K., and Batchelor, T.T. (2010). Vascular endothelial growth factor
inhibitors in malignant gliomas. Target. Oncol. 5, 167–174.
Carson-Walter, E.B., Watkins, D.N., Nanda, A., Vogelstein, B., Kinzler, K.W.,
and St. Croix, B. (2001). Cell surface tumor endothelial markers are conserved
in mice and humans. Cancer Res. 61, 6649–6655.
Chen, H.X., and Cleck, J.N. (2009). Adverse effects of anticancer agents that
target the VEGF pathway. Nat. Rev. Clin. Oncol. 6, 465–477.
Cullen, M., Seaman, S., Chaudhary, A., Yang, M.Y., Hilton, M.B., Logsdon, D.,
Haines, D.C., Tessarollo, L., and St. Croix, B. (2009). Host-derived tumor endo-
thelial marker 8 promotes the growth of melanoma. Cancer Res. 69, 6021–
6026.
Cullen, M., Elzarrad, M.K., Seaman, S., Zudaire, E., Stevens, J., Yang, M.Y., Li,
X., Chaudhary, A., Xu, L., Hilton, M.B., et al. (2011). GPR124, an orphan G
protein-coupled receptor, is required for CNS-specific vascularization and
establishment of the blood-brain barrier. Proc. Natl. Acad. Sci. USA 108,
5759–5764.
Dallas, N.A., Fan, F., Gray, M.J., Van Buren, G., II, Lim, S.J., Xia, L., and Ellis,
L.M. (2007). Functional significance of vascular endothelial growth factor
receptors on gastrointestinal cancer cells. Cancer Metastasis Rev. 26,
433–441.
Drixler, T.A., Vogten, M.J., Ritchie, E.D., van Vroonhoven, T.J., Gebbink, M.F.,
Voest, E.E., and Borel Rinkes, I.H. (2002). Liver regeneration is an angiogen-
esis-associated phenomenon. Ann. Surg. 236, 703–711, discussion 711–712.
Du, R., Lu, K.V., Petritsch, C., Liu, P., Ganss, R., Passegue, E., Song, H.,
Vandenberg, S., Johnson, R.S., Werb, Z., and Bergers, G. (2008). HIF1a
induces the recruitment of bone marrow-derived vascular modulatory cells
to regulate tumor angiogenesis and invasion. Cancer Cell 13, 206–220.
Duan, H.F., Hu, X.W., Chen, J.L., Gao, L.H., Xi, Y.Y., Lu, Y., Li, J.F., Zhao, S.R.,
Xu, J.J., Chen, H.P., et al. (2007). Antitumor activities of TEM8-Fc: an engi-
neered antibody-like molecule targeting tumor endothelial marker 8. J. Natl.
Cancer Inst. 99, 1551–1555.
Eremina, V., Cui, S., Gerber, H., Ferrara, N., Haigh, J., Nagy, A., Ema, M.,
Rossant, J., Jothy, S., Miner, J.H., and Quaggin, S.E. (2006). Vascular endo-
thelial growth factor A signaling in the podocyte-endothelial compartment is
required for mesangial cell migration and survival. J. Am. Soc. Nephrol. 17,
724–735.
Felicetti, P., Mennecozzi, M., Barucca, A., Montgomery, S., Orlandi, F.,
Manova, K., Houghton, A.N., Gregor, P.D., Concetti, A., and Venanzi, F.M.
C
(2007). Tumor endothelial marker 8 enhances tumor immunity in conjunction
with immunization against differentiation Ag. Cytotherapy 9, 23–34.
Fernando, S., and Fletcher, B.S. (2009). Targeting tumor endothelial marker 8
in the tumor vasculature of colorectal carcinomas in mice. Cancer Res. 69,
5126–5132.
Gerber, H.P., Condorelli, F., Park, J., and Ferrara, N. (1997). Differential tran-
scriptional regulation of the two vascular endothelial growth factor receptor
genes. Flt-1, but not Flk-1/KDR, is up-regulated by hypoxia. J. Biol. Chem.
272, 23659–23667.
Jinnin, M., Medici, D., Park, L., Limaye, N., Liu, Y., Boscolo, E., Bischoff, J.,
Vikkula, M., Boye, E., and Olsen, B.R. (2008). Suppressed NFAT-dependent
VEGFR1 expression and constitutive VEGFR2 signaling in infantile heman-
gioma. Nat. Med. 14, 1236–1246.
Kerbel, R.S. (2008). Tumor angiogenesis. N. Engl. J. Med. 358, 2039–2049.
Lamszus, K., Ulbricht, U., Matschke, J., Brockmann, M.A., Fillbrandt, R., and
Westphal, M. (2003). Levels of soluble vascular endothelial growth factor
(VEGF) receptor 1 in astrocytic tumors and its relation to malignancy, vascu-
larity, and VEGF-A. Clin. Cancer Res. 9, 1399–1405.
Liu, S., Wang, H., Currie, B.M., Molinolo, A., Leung, H.J., Moayeri, M., Basile,
J.R., Alfano, R.W., Gutkind, J.S., Frankel, A.E., et al. (2008). Matrix metallopro-
teinase-activated anthrax lethal toxin demonstrates high potency in targeting
tumor vasculature. J. Biol. Chem. 283, 529–540.
Liu, S., Crown, D., Miller-Randolph, S., Moayeri, M., Wang, H., Hu, H., Morley,
T., and Leppla, S.H. (2009). Capillary morphogenesis protein-2 is the major
receptor mediating lethality of anthrax toxin in vivo. Proc. Natl. Acad. Sci.
USA 106, 12424–12429.
Maharaj, A.S., and D’Amore, P.A. (2007). Roles for VEGF in the adult.
Microvasc. Res. 74, 100–113.
Masood, R., Cai, J., Zheng, T., Smith, D.L., Hinton, D.R., and Gill, P.S. (2001).
Vascular endothelial growth factor (VEGF) is an autocrine growth factor for
VEGF receptor-positive human tumors. Blood 98, 1904–1913.
Nanda, A., Carson-Walter, E.B., Seaman, S., Barber, T.D., Stampfl, J., Singh,
S., Vogelstein, B., Kinzler, K.W., and St. Croix, B. (2004). TEM8 interacts with
the cleaved C5 domain of collagen a 3(VI). Cancer Res. 64, 817–820.
Natsume, A., Niwa, R., and Satoh, M. (2009). Improving effector functions of
antibodies for cancer treatment: enhancing ADCC and CDC. Drug Des.
Devel. Ther. 3, 7–16.
Oosthuyse, B., Moons, L., Storkebaum, E., Beck, H., Nuyens, D.,
Brusselmans, K., Van Dorpe, J., Hellings, P., Gorselink, M., Heymans, S.,
et al. (2001). Deletion of the hypoxia-response element in the vascular endo-
thelial growth factor promoter causes motor neuron degeneration. Nat.
Genet. 28, 131–138.
Reeves, C.V., Dufraine, J., Young, J.A., and Kitajewski, J. (2010). Anthrax toxin
receptor 2 is expressed in murine and tumor vasculature and functions in
endothelial proliferation and morphogenesis. Oncogene 29, 789–801.
Rouleau, C., Menon, K., Boutin, P., Guyre, C., Yoshida, H., Kataoka, S.,
Perricone, M., Shankara, S., Frankel, A.E., Duesbery, N.S., et al. (2008). The
systemic administration of lethal toxin achieves a growth delay of humanmela-
noma and neuroblastoma xenografts: assessment of receptor contribution.
Int. J. Oncol. 32, 739–748.
Ruan, Z., Yang, Z., Wang, Y., Wang, H., Chen, Y., Shang, X., Yang, C., Guo, S.,
Han, J., Liang, H., and Wu, Y. (2009). DNA vaccine against tumor endothelial
marker 8 inhibits tumor angiogenesis and growth. J. Immunother. 32, 486–491.
Scobie, H.M., Rainey, G.J., Bradley, K.A., and Young, J.A. (2003). Human
capillary morphogenesis protein 2 functions as an anthrax toxin receptor.
Proc. Natl. Acad. Sci. USA 100, 5170–5174.
Seaman, S., Stevens, J., Yang, M.Y., Logsdon, D., Graff-Cherry, C., and St.
Croix, B. (2007). Genes that distinguish physiological and pathological angio-
genesis. Cancer Cell 11, 539–554.
Shojaei, F., Wu, X., Malik, A.K., Zhong, C., Baldwin, M.E., Schanz, S., Fuh, G.,
Gerber, H.P., and Ferrara, N. (2007). Tumor refractoriness to anti-VEGF treat-
ment is mediated by CD11b+Gr1+ myeloid cells. Nat. Biotechnol. 25, 911–920.
St. Croix, B., Rago, C., Velculescu, V., Traverso, G., Romans, K.E.,
Montgomery, E., Lal, A., Riggins, G.J., Lengauer, C., Vogelstein, B., and
ancer Cell 21, 212–226, February 14, 2012 ª2012 Elsevier Inc. 225

Cancer Cell
Anti-TEM8 Antibodies Inhibit Tumor Growth
Kinzler, K.W. (2000). Genes expressed in human tumor endothelium. Science
289, 1197–1202.
Sung, H.K., Michael, I.P., and Nagy, A. (2010). Multifaceted role of vascular
endothelial growth factor signaling in adult tissue physiology: an emerging
concept with clinical implications. Curr. Opin. Hematol. 17, 206–212.
Verheul, H.M., and Pinedo, H.M. (2007). Possible molecular mechanisms
involved in the toxicity of angiogenesis inhibition. Nat. Rev. Cancer 7, 475–485.
Werner, E., Kowalczyk, A.P., and Faundez, V. (2006). Anthrax toxin receptor 1/
tumor endothelium marker 8 mediates cell spreading by coupling extracellular
ligands to the actin cytoskeleton. J. Biol. Chem. 281, 23227–23236.
Yamaguchi, T., Bando, H., Mori, T., Takahashi, K., Matsumoto, H., Yasutome,
M., Weich, H., and Toi, M. (2007). Overexpression of soluble vascular endothe-
226 Cancer Cell 21, 212–226, February 14, 2012 ª2012 Elsevier Inc.
lial growth factor receptor 1 in colorectal cancer: association with progression
and prognosis. Cancer Sci. 98, 405–410.
Yang, F., Jin, C., Jiang, Y.J., Li, J., Di, Y., and Fu, D.L. (2011a). Potential role of
soluble VEGFR-1 in antiangiogenesis therapy for cancer. Expert Rev.
Anticancer Ther. 11, 541–549.
Yang, M.Y., Chaudhary, A., Seaman, S., Dunty, J., Stevens, J., Elzarrad, M.K.,
Frankel, A.E., and St. Croix, B. (2011b). The cell surface structure of tumor
endothelial marker 8 (TEM8) is regulated by the actin cytoskeleton. Biochim.
Biophys. Acta 1813, 39–49.
Yang, X., Zhu, H., and Hu, Z. (2010). Dendritic cells transduced with TEM8 re-
combinant adenovirus prevents hepatocellular carcinoma angiogenesis and
inhibits cells growth. Vaccine 28, 7130–7135.

Cancer Cell
Article
Inhibition of PI3K/mTOR Leadsto Adaptive Resistancein Matrix-Attached Cancer CellsTaru Muranen,1 Laura M. Selfors,1,3 Devin T. Worster,1,3 Marcin P. Iwanicki,1 Loling Song,1 Fabiana C. Morales,2
Sizhen Gao,1 Gordon B. Mills,2 and Joan S. Brugge1,*1Department of Cell Biology, Harvard Medical School, 240 Longwood Avenue, Boston, MA 02115, USA2Department of Systems Biology, M.D. Anderson Cancer Center, Houston, TX 77030, USA3These authors contributed equally to this work
*Correspondence: [email protected]
DOI 10.1016/j.ccr.2011.12.024
SUMMARY
The PI3K/mTOR-pathway is the most commonly dysregulated pathway in epithelial cancers and representsan important target for cancer therapeutics. Here, we show that dual inhibition of PI3K/mTOR in ovariancancer-spheroids leads to death of inner matrix-deprived cells, whereas matrix-attached cells are resistant.This matrix-associated resistance is mediated by drug-induced upregulation of cellular survival programsthat involve both FOXO-regulated transcription and cap-independent translation. Inhibition of any one ofseveral upregulated proteins, including Bcl-2, EGFR, or IGF1R, abrogates resistance to PI3K/mTOR inhibi-tion. These results demonstrate that acute adaptive responses to PI3K/mTOR inhibition in matrix-attachedcells resemble well-conserved stress responses to nutrient and growth factor deprivation. Bypass ofthis resistance mechanism through rational design of drug combinations could significantly enhancePI3K-targeted drug efficacy.
INTRODUCTION
The most prevalent forms of cancer are of epithelial origin.
Normal epithelial cells form well-organized polarized cell layers
under the influence of extracellular matrix (ECM), and attach-
ment to ECM is required for the control of normal epithelial cell
proliferation, differentiation, and survival (Debnath and Brugge,
2005). However, during cancer progression, the normal epithelial
organization is disrupted and malignant cells proliferate and
survive outside their normal niches (Chiarugi and Giannoni,
2008). This process is not well recapitulated in two-dimensional
(2D) cell cultures and may explain, in part, the failure of many
therapeutic approaches in clinical trials. Thus, there is a need
and opportunity to explore mechanisms of drug response and
resistance under culture conditions that more closely mimic
the in vivo environment.
Significance
To fulfill the promise of PI3K/mTOR-pathway inhibition in cadevelop therapies to overcome it. Here, we show that resisassociated with upregulation of an evolutionarily well-conservtranslation of IRES-containing mRNAs previously associated wto upregulation of prosurvival proteins, and inhibition of thisbreast and ovarian cancer cells and ovarian cancer xenograftsof effective drug combinations through the use of three-dimeproteomics approaches and identify drug combinations for fu
C
Three-dimensional (3D) cell culture models have been widely
utilized in epithelial cancer research to probe mechanisms
involved in tumor initiation and progression (Debnath and
Brugge, 2005; Weigelt and Bissell, 2008; Yamada and Cukier-
man, 2007). Nontransformed epithelial cells cultured in reconsti-
tuted basement membrane form hollow, growth-arrested,
polarized 3D structures that recapitulate many features of
epithelial cells in vivo. Survival of 3D spheroid structures is
dependent on attachment to ECM; inner cells, lacking ECM
attachment, undergo apoptosis, generating a hollow lumen
(Chiarugi and Giannoni, 2008; Debnath and Brugge, 2005).
However, cells that harbor alterations that inhibit apoptosis are
still compromised in their survival because of metabolic impair-
ment caused by ECM deprivation leading to decreased growth
factor signaling, mostly due to loss of nutrient uptake (Schafer
et al., 2009). These findings suggest that survival of tumor cells
ncer, it is critical to identify mechanisms of resistance andtance of matrix-attached cells to PI3K/mTOR-inhibitors ised program that resembles nutrient deprivation, leading toith cellular stress responses. This adaptive response leadsprogram abrogates resistance to PI3K/mTOR-inhibition in. These studies provide a platform for rational developmentnsional (3D) model systems together with high-throughputrther analysis as cancer therapeutics.
ancer Cell 21, 227–239, February 14, 2012 ª2012 Elsevier Inc. 227

Cancer Cell
Adaptive Resistance to PI3K/mTOR Inhibition
outside their natural matrix niches may require alterations that
allow them to escape both apoptosis and metabolic impairment.
Introduction of oncogenes into nontumorigenic cells in 3D can
result in the formation of solid, filled structures that resemble
tumor cells grown in 3D as well as the filled alveoli characteristic
of ductal carcinoma in situ, a noninvasive form of breast cancer
(Debnath and Brugge, 2005). Oncogenic alterations in the phos-
phatidylinositol 3-kinase (PI3K) pathway have been shown to
rescue matrix-deprived cells from apoptosis and metabolic
impairment and to cause filling of the luminal space in 3D
cultures (Debnath et al., 2003b; Isakoff et al., 2005).
In epithelial cancers, the signaling pathway most frequently
activated by genetic alterations is the PI3K pathway (Engelman,
2009; Samuels and Velculescu, 2004; Yuan and Cantley, 2008)
and can be activated by multiple mechanisms, including altered
DNA copy number and mutations of several of the components
of this pathway (Carpten et al., 2007; Gewinner et al., 2009; Li
et al., 1997; Samuels et al., 2004). Thus, this pathway presents
an attractive candidate for targeted therapeutics. In recent
years, many small molecule inhibitors targeting PI3K, AKT, and
the downstream effector mTOR, have been developed; several
are in clinical trials, and some (specifically, rapamycin analogs
targeting mTOR) have been approved for therapy (Baselga,
2011; Courtney et al., 2010). Most initial in vitro studies of these
inhibitors were performed in 2D monolayer cell cultures where it
is not feasible to examine the effects of the targeted therapeutics
on tumor-specific phenotypes such as loss of polarity and
survival without ECM attachment. However, in studies using
3D cultures, the effects of PI3K inhibition on tumor growth in vivo
correlated with effects on cell proliferation in 3D cultures more
accurately than in 2D cultures, suggesting that 3D cultures better
reflect drug sensitivity in vivo (Howes et al., 2007; Polo et al.,
2010). In addition, other studies have shown that signaling
pathway activation and drug responses in 3D cultures differ
substantially from 2D cultures (Kenny et al., 2007; Liu et al.,
2004; Weigelt et al., 2010), emphasizing the potential use of 3D
culture to ascertain underlying mechanisms of sensitivity and
resistance to targeted therapeutics as well as to predict effective
drug combinations.
Inhibition of PI3K/AKT can lead to upregulation and activation
of receptor tyrosine kinases (RTKs) through engagement of
several homeostatic feedback loops aimed at maintaining the
PI3K pathway in equilibrium. This includes a FOXO-dependent
pathway (Chandarlapaty et al., 2011; Garrett et al., 2011), as
well as compensatory activation of the MAPK pathway (Carra-
cedo et al., 2008; Engelman et al., 2008; Serra et al., 2011).
Inhibition of upstream components of the PI3K pathway has
been shown to lead to compensatory activation of HER3 (Ser-
gina et al., 2007). In addition, inhibition of mTORC1 by allosteric
inhibitors (e.g., rapamycin family) relieves a negative feedback
loop from S6K to IRS1, among others, leading to activation of
IGF1R, PI3K, and AKT (Cloughesy et al., 2008; Harrington
et al., 2004; O’Reilly et al., 2006). Activation of compensatory
pathways in response to PI3K/mTOR inhibition may limit the
efficacy of drugs targeting this pathway, leading to paradoxical
responses and possibly contributing to emergence of drug-
resistant clones.
In this report, we examined the response of ovarian and breast
tumor cells in 3D spheroid cultures to PI3K and mTOR inhibitors
228 Cancer Cell 21, 227–239, February 14, 2012 ª2012 Elsevier Inc.
in order to monitor drug-induced phenotypic changes that could
not be assayed in standard 2D cultures.
RESULTS
Dichotomous Response to PI3K Pathway Inhibitionin Tumor SpheroidsTo examine how ovarian cancer cells cultured as 3D spheroids in
reconstituted basement membrane (Matrigel) respond to inhibi-
tion of the PI3K/mTOR pathway, we treated several ovarian
cancer cell lines with BEZ235, a dual-specificity PI3K/mTOR
inhibitor (Maira et al., 2008). In 3D culture, OV2008, SKOV3,
and OVCA432 cell lines form spheroid structures with a constitu-
tive low level of proliferation (marked by Ki67 staining) localized
predominantly in the outer matrix-attached cell layer (Figure 1A).
A small number of apoptotic cells, marked by cleaved caspase-3
staining, were detected almost exclusively in the middle of the
structures. Treatment of 6-day-old spheroids with BEZ235
induced a striking dichotomy in the induction of apoptosis
between outer and inner cells, with apoptosis being exclusively
localized in the inner region of the spheroids (Figure 1B; Fig-
ure S1A available online). MCAS cells, which form structures
with hollow lumens, were largely resistant to apoptosis. Although
apoptosis was restricted to inner cells, BEZ235 treatment sup-
pressed proliferation throughout the structures (data not shown).
OV2008 cells were treated cells with a wider selection of PI3K or
mTOR inhibitors (Rapamycin, LY294002, GDC0941, and PIK-90)
to determine the generality of this response. All inhibitors
induced a similar dichotomy in apoptosis between the drug-
resistant matrix-attached outer cells and the inner matrix-
deprived cells (Figure S1B).
Multiple Signaling Pathways Are Upregulatedby PI3K/mTOR InhibitionOuter 3D tumor spheroid cells could be intrinsically drug resis-
tant, or drug treatment could induce resistance. To examine
these possibilities, we performed reverse phase protein array
(RPPA) analysis of �120 proteins and phosphoproteins repre-
senting many major signaling pathways (Figure 2A). As ex-
pected, BEZ235 treatment decreased phosphorylation of
proteins downstream of PI3K and mTOR (p-FOXO3a, p-4E-
BP1) and reduced cell proliferation markers (PCNA, cyclinB1,
cyclinE1) (Figure 2A). However, BEZ235 also induced upregula-
tion and/or activation of multiple prosurvival proteins (Figure 2A),
including several RTKs (EGFR, HER2, c-Kit, and IGF1R), cyto-
plasmic kinases (p-p90RSK, p-SrcY), antiapoptotic proteins
(Bcl-2, XIAP1), and transcription factors (p-STAT3, p-STAT6,
p-c-Jun, p-SMAD3). This response was not unique to 3D cell
cultures, as 2D cultures treated with BEZ235 displayed similar
responses, with multiple survival pathways being activated by
BEZ235 (Figure 2A). A comparable response was also observed
in BEZ235-treated MCAS spheroids and monolayer cultures
(Figures S2A and S2B), with upregulation of Bcl-2, IGF1Rb,
p-STAT3, p-STAT6, p-c-Jun, p-SMAD3, p-p90RSK, EGFR,
and p-HER2; however, Bcl-xL and p-Erk were also upregulated
in MCAS cells.
RPPA results were validated by western blot for Bcl-2,
p-IGF1Rb, c-Jun, p-p90RSK, p-EGFR, p-S6, and p-4E-BP1
(Figures 2B; Figure S2B). While detectable changes in total

Figure 1. Ovarian Cancer Cell Lines Form Acinilike Structures in
Reconstituted Basement Membrane and Matrix-Attached Cells
Show Resistance to BEZ235-Induced Apoptosis
(A) Ovarian cancer cell lines (PIK3CA mutations indicated in parentheses)
MCAS (H1047R), SKOV3 (H1047R), OVCA432 (unknown) and OV2008 (E545K)
were cultured in Matrigel for 6 days and stained for Ki67 (red) or cleaved
caspase-3 (red) and counterstained with DAPI (blue). (Mutation information
was provided by S. Jones and V. Velculescu, personal communication.) One
representative phase or confocal section is shown.
(B) OV2008, MCAS, and OVCA432 cells were cultured in Matrigel for 4 days
and 1 mM BEZ235 was added for 48 hr before the cells were fixed, stained for
cleaved caspase-3 (red) and DAPI (blue) and imaged by confocal microscopy.
Confocal scale bar, 50 mm; phase contrast scale bar, 200 mm. See also
Figure S1.
Cancer Cell
Adaptive Resistance to PI3K/mTOR Inhibition
IGF1Rb and p-AKTS473 were modest by RPPA, we reproducibly
detected up- or downregulation, respectively, upon BEZ235
treatment by western blotting. Total protein levels of 4E-BP1
inversely correlated with those of p-4E-BP1 as previously re-
ported (Yamaguchi et al., 2008). Furthermore, we confirmed
that p-Erk was unaffected by BEZ235 treatment (Figure 2B).
To examine whether the proteins induced by BEZ235 were
specifically induced in matrix-attached outer cells, we per-
formed immunofluorescence analysis of Bcl-2 and Bcl-xL in
C
BEZ235-treated OV2008 and MCAS cells. Indeed, upregulation
of Bcl-2 and Bcl-xL was strongly enriched in outer, ECM-
attached cells (Figure S2C). As ECM contact activates integrins,
we addressed whether blocking integrin signaling could inhibit
the adaptive response of the matrix-attached outer cells. Down-
regulation of b1-integrin, b4-integrin, FAK, or ILK alone did not
abrogate Bcl-2 or IGF1R upregulation; however, inhibition of
several integrin-pathway components in parallel, prevented up-
regulation of these proteins (Figure S2H). These results suggest
that multiple integrins may contribute to the adaptive program;
this possibility was supported by the evidence that additional
integrins are induced at the transcriptional level by BEZ235 treat-
ment (Figure S2I).
Inhibition of Bcl-2, IGF1R, or EGFR in Combination withBEZ235 Abrogates Matrix ProtectionAs BEZ235 treatment induced upregulation of several cell
survival pathways, we assessed whether these pathways are
critical for the resistance of matrix-attached cells. Given the crit-
ical role of Bcl-2 family members in regulation of cell survival
(Walensky, 2006), we first examined the effects of inhibiting
Bcl-2 family proteins in combination with BEZ235. Treatment
with the Bcl-2 family inhibitor ABT-737, which targets Bcl-2,
Bcl-xL, and Bcl-w (Oltersdorf et al., 2005), induced apoptosis
of inner spheroid cells but did not affect survival of outer cells
(Figure 2C). However, combined treatment with ABT-737 and
BEZ235 induced massive disintegration of the spheroids. Immu-
nostaining for cleaved caspase-3 confirmed extensive apoptosis
throughout the entire spheroid structure (Figure 2C). Similar
effects were observed using the structurally distinct Bcl-2 inhib-
itor, HA-14.1 (Figure S2D). Analysis of four additional ovarian
cancer cell lines revealed similar synthetic lethality of ABT-737
and BEZ235 (Figure S2E).
We also examined whether the BEZ235-induced RTKs EGFR
and IGF1R are essential for survival of BEZ235-treated cells.
BEZ235 treatment together with EGFR inhibitors PD168393 or
Gefitinib caused marked cell death (Figure S2F). In addition,
downregulation of IGF1R with shRNAs caused death of ECM-
attached cells treated with BEZ235 (Figure S2G). To address
whether inhibition of other antiapoptotic signaling proteins that
were not induced in the ECM-attached cells by BEZ235 would
synergize with BEZ235, we incubated BEZ235-treated cells
with inhibitors of MEK, PKC, PKA, Jak, or IKK. Inhibition of these
proteins in combination with BEZ235 did not enhance death of
outer, ECM-attached cells (Figure S2D; data not shown). These
results imply that BEZ235-treatment selectively induces expres-
sion of several prosurvival proteins in ECM-attached cells and
indicate that some of these induced proteins, such as Bcl-2,
EGFR, and IGF-1R, are required for cancer cell survival. Our
studies also validate RPPA as an efficient tool in identifying
drug resistance proteins and pathways.
Many Induced Proteins Are Upregulated at the mRNALevel through FOXO-Dependent TranscriptionTo address whether BEZ235-induced protein upregulation
reflects changes in mRNA expression, we performed mRNA mi-
croarray analyses on drug-treated OV2008 and MCAS cells
cultured in 3D. Several genes, such as IGF1R, EGFR, BCL2,
IRS1, and SMAD3, displayed increased mRNA expression,
ancer Cell 21, 227–239, February 14, 2012 ª2012 Elsevier Inc. 229

Figure 2. RPPA Reveals Multiple Proteins Upregulated in BEZ235-Treated Cells
(A) OV2008 and SKOV3 cells were cultured in Matrigel (3D) or monolayer (2D) and treated with BEZ235 or DMSO, and the protein lysates were analyzed by RPPA
(red, increased signal; and green, decreased signal, upon BEZ235 treatment). Samples are normalized against DMSO-treated controls. Proteins with significant
differences (p < 0.05, Student’s t test) between BEZ235- and DMSO-treated OV2008 cells in an experiment performed in triplicate are shown for all experiments.
(B) Several of the up- and downregulated proteins from OV2008 RPPA were validated by western blot analysis.
(C) Bcl-2 inhibition abrogates outer cell resistance to PI3K/mTOR inhibition. MCAS and OV2008 cell lines were cultured in 3D and treated with DMSO, BEZ235, or
ABT737 alone or in combination for 48 hr. Cells were imaged by phase contrast, fixed, stained for cleaved caspase-3 (red), and imaged by phase contrast or
confocal microscopy. Confocal scale bar, 50 mm; phase contrast scale bar, 200 mm. See also Figure S2.
Cancer Cell
Adaptive Resistance to PI3K/mTOR Inhibition
indicating that a subset of the RPPA results reflect, at least in
part, changes in mRNA levels (Figure 3A).
Inhibition of PI3K prevents activation of AKT1/2/3, which
phosphorylates FOXO family transcription factors, preventing
their nuclear translocation (Brunet et al., 1999; Kops et al.,
1999). Because FOXO family members were recently demon-
230 Cancer Cell 21, 227–239, February 14, 2012 ª2012 Elsevier Inc.
strated to induce transcription of several RTKs upon AKT inhibi-
tion (Chandarlapaty et al., 2011), we analyzed the mRNA expres-
sion array for FOXO targets. A significant enrichment of known
FOXO target genes were upregulated after BEZ235 treatment
(p = 0.00335, hypergeometric probability distribution), including
CDKN1B (p27Kip1), TSC1, IRS2, and FOXO1/3 (Figure 3B).
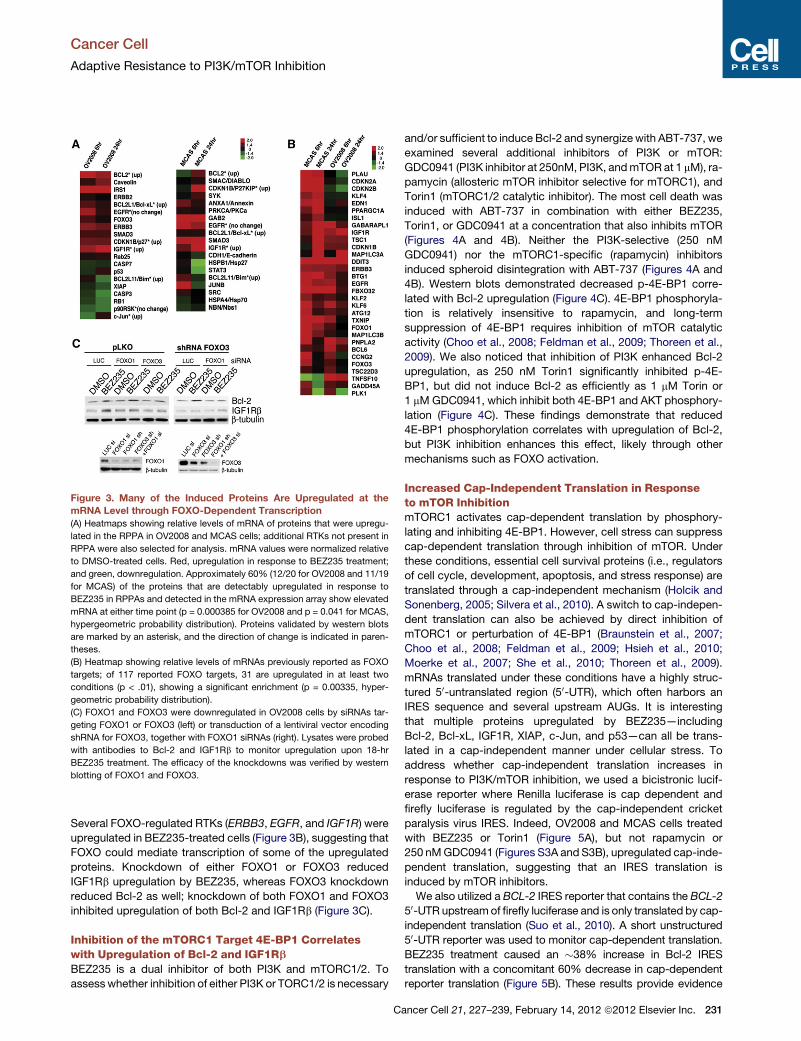
Figure 3. Many of the Induced Proteins Are Upregulated at the
mRNA Level through FOXO-Dependent Transcription
(A) Heatmaps showing relative levels of mRNA of proteins that were upregu-
lated in the RPPA in OV2008 and MCAS cells; additional RTKs not present in
RPPA were also selected for analysis. mRNA values were normalized relative
to DMSO-treated cells. Red, upregulation in response to BEZ235 treatment;
and green, downregulation. Approximately 60% (12/20 for OV2008 and 11/19
for MCAS) of the proteins that are detectably upregulated in response to
BEZ235 in RPPAs and detected in the mRNA expression array show elevated
mRNA at either time point (p = 0.000385 for OV2008 and p = 0.041 for MCAS,
hypergeometric probability distribution). Proteins validated by western blots
are marked by an asterisk, and the direction of change is indicated in paren-
theses.
(B) Heatmap showing relative levels of mRNAs previously reported as FOXO
targets; of 117 reported FOXO targets, 31 are upregulated in at least two
conditions (p < .01), showing a significant enrichment (p = 0.00335, hyper-
geometric probability distribution).
(C) FOXO1 and FOXO3 were downregulated in OV2008 cells by siRNAs tar-
geting FOXO1 or FOXO3 (left) or transduction of a lentiviral vector encoding
shRNA for FOXO3, together with FOXO1 siRNAs (right). Lysates were probed
with antibodies to Bcl-2 and IGF1Rb to monitor upregulation upon 18-hr
BEZ235 treatment. The efficacy of the knockdowns was verified by western
blotting of FOXO1 and FOXO3.
Cancer Cell
Adaptive Resistance to PI3K/mTOR Inhibition
Several FOXO-regulated RTKs (ERBB3, EGFR, and IGF1R) were
upregulated in BEZ235-treated cells (Figure 3B), suggesting that
FOXO could mediate transcription of some of the upregulated
proteins. Knockdown of either FOXO1 or FOXO3 reduced
IGF1Rb upregulation by BEZ235, whereas FOXO3 knockdown
reduced Bcl-2 as well; knockdown of both FOXO1 and FOXO3
inhibited upregulation of both Bcl-2 and IGF1Rb (Figure 3C).
Inhibition of the mTORC1 Target 4E-BP1 Correlateswith Upregulation of Bcl-2 and IGF1RbBEZ235 is a dual inhibitor of both PI3K and mTORC1/2. To
assesswhether inhibition of either PI3K or TORC1/2 is necessary
C
and/or sufficient to induce Bcl-2 and synergize with ABT-737, we
examined several additional inhibitors of PI3K or mTOR:
GDC0941 (PI3K inhibitor at 250nM, PI3K, andmTOR at 1 mM), ra-
pamycin (allosteric mTOR inhibitor selective for mTORC1), and
Torin1 (mTORC1/2 catalytic inhibitor). The most cell death was
induced with ABT-737 in combination with either BEZ235,
Torin1, or GDC0941 at a concentration that also inhibits mTOR
(Figures 4A and 4B). Neither the PI3K-selective (250 nM
GDC0941) nor the mTORC1-specific (rapamycin) inhibitors
induced spheroid disintegration with ABT-737 (Figures 4A and
4B). Western blots demonstrated decreased p-4E-BP1 corre-
lated with Bcl-2 upregulation (Figure 4C). 4E-BP1 phosphoryla-
tion is relatively insensitive to rapamycin, and long-term
suppression of 4E-BP1 requires inhibition of mTOR catalytic
activity (Choo et al., 2008; Feldman et al., 2009; Thoreen et al.,
2009). We also noticed that inhibition of PI3K enhanced Bcl-2
upregulation, as 250 nM Torin1 significantly inhibited p-4E-
BP1, but did not induce Bcl-2 as efficiently as 1 mM Torin or
1 mMGDC0941, which inhibit both 4E-BP1 and AKT phosphory-
lation (Figure 4C). These findings demonstrate that reduced
4E-BP1 phosphorylation correlates with upregulation of Bcl-2,
but PI3K inhibition enhances this effect, likely through other
mechanisms such as FOXO activation.
Increased Cap-Independent Translation in Responseto mTOR InhibitionmTORC1 activates cap-dependent translation by phosphory-
lating and inhibiting 4E-BP1. However, cell stress can suppress
cap-dependent translation through inhibition of mTOR. Under
these conditions, essential cell survival proteins (i.e., regulators
of cell cycle, development, apoptosis, and stress response) are
translated through a cap-independent mechanism (Holcik and
Sonenberg, 2005; Silvera et al., 2010). A switch to cap-indepen-
dent translation can also be achieved by direct inhibition of
mTORC1 or perturbation of 4E-BP1 (Braunstein et al., 2007;
Choo et al., 2008; Feldman et al., 2009; Hsieh et al., 2010;
Moerke et al., 2007; She et al., 2010; Thoreen et al., 2009).
mRNAs translated under these conditions have a highly struc-
tured 50-untranslated region (50-UTR), which often harbors an
IRES sequence and several upstream AUGs. It is interesting
that multiple proteins upregulated by BEZ235—including
Bcl-2, Bcl-xL, IGF1R, XIAP, c-Jun, and p53—can all be trans-
lated in a cap-independent manner under cellular stress. To
address whether cap-independent translation increases in
response to PI3K/mTOR inhibition, we used a bicistronic lucif-
erase reporter where Renilla luciferase is cap dependent and
firefly luciferase is regulated by the cap-independent cricket
paralysis virus IRES. Indeed, OV2008 and MCAS cells treated
with BEZ235 or Torin1 (Figure 5A), but not rapamycin or
250 nMGDC0941 (Figures S3A and S3B), upregulated cap-inde-
pendent translation, suggesting that an IRES translation is
induced by mTOR inhibitors.
We also utilized a BCL-2 IRES reporter that contains the BCL-2
50-UTR upstreamof firefly luciferase and is only translated by cap-
independent translation (Suo et al., 2010). A short unstructured
50-UTR reporter was used to monitor cap-dependent translation.
BEZ235 treatment caused an �38% increase in Bcl-2 IRES
translation with a concomitant 60% decrease in cap-dependent
reporter translation (Figure 5B). These results provide evidence
ancer Cell 21, 227–239, February 14, 2012 ª2012 Elsevier Inc. 231

Figure 4. Inhibition of 4E-BP1 Phosphorylation Correlates with the Upregulation of Bcl-2 and IGF1R and Disintegration of 3D Spheroids
(A) OV2008 cells were grown in 3D cultures for 4 days and treatedwith indicated inhibitors targeting PI3K and/ormTOR in combination with ABT-737 for 48 hr. The
cells were fixed, stained for cleaved caspase-3 (red) andDAPI (blue), and imagedwith phase and confocalmicroscopy. Confocal scale bar, 50 mm; phase contrast
scale bar, 200 mm.
(B) OV2008 cells were grown in 3D culture and treated with indicated drugs and quantitated for structural integrity after a 48-hr drug treatment as described in
Experimental Procedures. Representative images of scored structures (intact, semidisintegrated, and disintegrated) are shown in the lower panel; scale bar,
100 mm.
(C) Lysates were harvested from structures cultured in 3D and analyzed for Bcl-2 and IGF1Rb, p-4E-BP1T37/46, p-S6S240, and p-AKTS473 expression after the
indicated 48-hr drug treatments.
Cancer Cell
Adaptive Resistance to PI3K/mTOR Inhibition
that BEZ235 treatment increases cap-independent Bcl-2 transla-
tion while cap-dependent translation is inhibited.
Phosphorylation of the eukaryotic translation initiation factor 2
alpha (eIF2a), a component of the ternary translation initiation
complex, selectively suppresses cap-dependent translation in
response to cellular stress (Holcik and Sonenberg, 2005; Raven
and Koromilas, 2008; Silvera et al., 2010; Wek et al., 2006).
BEZ235 treatment increased eIF2a phosphorylation over time,
reaching a plateau at 24 hr in OV2008 and 48 hr in MCAS cells
(Figure 5C). Additionally, of 23 significantly upregulated proteins
after BEZ235 treatment identified by RPPA, 10 have putative or
validated IRES motifs. This represents a significant enrichment
(p = 0.0083), as only 3%–5% of all mRNAs have potential IRES
sequences (Johannes et al., 1999).
232 Cancer Cell 21, 227–239, February 14, 2012 ª2012 Elsevier Inc.
Breast Tumor Cell Lines Also Display the AdaptiveResponse to BEZ235 and Are Sensitive to CombinedPI3K/mTOR and Bcl-2 InhibitionTo test whether the BEZ235 response is induced in other epithe-
lial tumors, we performed RPPA on BEZ235-treated breast
cancer cell lines harboring mutations in PIK3CA or deletions in
PTEN. While there were variations in individual proteins that
were affected by treatment, the adaptive response was strikingly
similar, with PI3K/mTOR inhibition causing an induction of RTKs
(HER3, IGF1Rb, HER2, and EGFR), as well as Bcl-2 and Bcl-xL
(Figure 6A). We also detected an adaptive response to BEZ235
in nontransformedMCF10A cells, although themost strongly up-
regulated proteins varied relative to the breast tumor cell lines.
This likely reflects the dominance of the EGFR-ERK signaling

Figure 5. Cap-Independent Translation Increases
in Response to BEZ235 Treatment
(A) A dual luciferase reporter (Renilla luciferase expression
mediated by cap-dependent translation and firefly lucif-
erase expression by CrPV IRES) was used to monitor
cap-independent translation in OV2008 andMCAS cells in
response to BEZ235 or Torin1 treatment. The fold increase
in the ratio of the firefly/Renilla luciferase levels was
calculated as described in Experimental Procedures. *p <
0.05; **p < 0.01; ***p < 0.001.
(B) BCL-2 IRES translational activity was monitored by
a reporter containing the BCL2 IRES sequence upstream
of firefly luciferase. Cap-dependent translation was
monitored with a reporter containing a short unstructured
50UTR fused to firefly luciferase. Luciferase expression
from both reporters was normalized to luciferase mRNA
expression and shown as fold change compared to DMSO
control. Cartoon modified from Suo et al., 2010.
(C) Upregulation of eIF2a phosphorylation was monitored
in response to BEZ235 treatment over time in OV2008
and MCAS cells. Error bars shown as ± SEM. See also
Figure S3.
Cancer Cell
Adaptive Resistance to PI3K/mTOR Inhibition
pathway in these cells (note upregulated p-EGFR, p-ERK,
p-BADS112, and downregulated Bim) (Figures 6A and 6D).
We also examined whether the breast tumor cell lines
would display enhanced cell death with combined inhibition of
PI3K/mTOR and Bcl-2 in 3D cultures. In contrast to the well-
organized ovarian cell lines, the breast cancer lines were less
organized, precluding detection of a clear dichotomy between
the outer and inner cell layers. However, as seen with ovarian
lines, inhibition of PI3K/mTOR or Bcl-2 family members alone
did not induce dramatic cell death, but combined treatment
caused significant structural disintegration and cell death in
MDA-MB-468 and HCC-1569 cells and, to a lesser extent, in
T-47D cells (Figure 6B). In contrast, the overall integrity of non-
transformed MCF-10A cell structures treated with both
BEZ235 and ABT-737 was not significantly affected, as cells in
contact with reconstituted matrix were resistant to apoptotic
effects of the combination (Figure 6C). Nontransformed, nonim-
mortalized human mammary epithelial cells (HMECs) also
showed no sensitivity to the dual treatment (Figure S4), indi-
cating that cancer cells are more sensitive to this treatment
than normal epithelial cells.
Mouse Xenografts and Primary Ovarian and BreastCancer Patient Samples Show Sensitivity to DualInhibition of PI3K/mTOR and Bcl-2To test the effectiveness of inhibiting PI3K/mTOR and/or the
Bcl-2 family in vivo, we performed xenograft studies with
Cancer Cell 21, 227
subcutaneous injection of MCAS and OV2008
cells. Tumors were treated with the PI3K/
mTOR inhibitor GNE493 (Sutherlin et al., 2010)
and ABT-737 either alone or in combination
every 24 hr for 7–9 days. Vehicle and ABT-
737-treated MCAS tumors showed similar
growth rates, whereas GNE493 significantly
decreased tumor growth. Remarkably, com-
bined treatment caused marked inhibition of
tumor cell growth relative to GNE493 alone (Fig-
ure 7A). Similar results were obtained with OV2008 xenograft
tumors (Figure 7A). Furthermore, hematoxylin and eosin (H&E)
staining of tumor sections revealed that combination treatment
induced increased cell death relative to single agents (Figure 7B).
Combination treatment caused weight loss during the 7-day
treatment (5% on average), and one mouse (of 23) showed
more significant weight loss (�20%) and died on Day 7 of treat-
ment, indicating that the combination may have some toxicity.
Lysates from GNE493-treated MCAS tumors showed the ex-
pected decrease in AKT, 4EBP1, and S6 phosphorylation, and
it is important to note that Bcl-2, Bcl-xL, and IGF1Rb were upre-
gulated in response to treatment (Figure 7C). These results
provide evidence that PI3K/mTOR inhibition in vivo induces
a similar adaptive response as in 3D spheroids and monolayer
culture in vitro and that Bcl-2 family inhibition can significantly
enhance the efficacy PI3K/mTOR inhibition in vivo.
To address whether primary patient samples are sensitive to
combination treatment, we isolated cancer cells from pleural
and peritoneal fluid exudates from two breast cancer patients
and two ovarian cancer patients. These samples were cultured
in reconstituted basement membrane for 8 days followed by
treatment with BEZ235, ABT-263 (BCL2 inhibitor similar to
ABT-737; Ackler et al., 2008), PD168393, and combinations for
48 hr. Single-agent inhibition did not show significant efficacy
in any of the treated patient samples (Figure 7D). The response
to dual inhibition of PI3K/mTOR and EGFR was heterogeneous,
only reaching significance in ovarian sample F44 (Figure 7D).
–239, February 14, 2012 ª2012 Elsevier Inc. 233
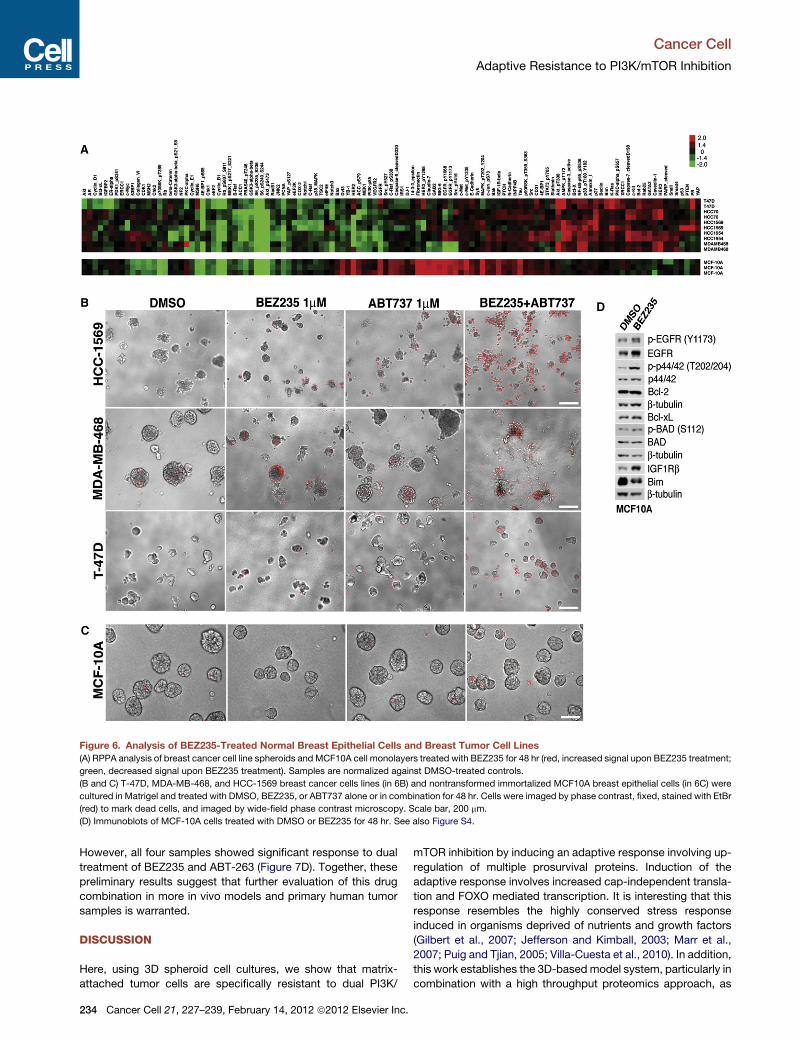
Figure 6. Analysis of BEZ235-Treated Normal Breast Epithelial Cells and Breast Tumor Cell Lines
(A) RPPA analysis of breast cancer cell line spheroids and MCF10A cell monolayers treated with BEZ235 for 48 hr (red, increased signal upon BEZ235 treatment;
green, decreased signal upon BEZ235 treatment). Samples are normalized against DMSO-treated controls.
(B and C) T-47D, MDA-MB-468, and HCC-1569 breast cancer cells lines (in 6B) and nontransformed immortalized MCF10A breast epithelial cells (in 6C) were
cultured in Matrigel and treated with DMSO, BEZ235, or ABT737 alone or in combination for 48 hr. Cells were imaged by phase contrast, fixed, stained with EtBr
(red) to mark dead cells, and imaged by wide-field phase contrast microscopy. Scale bar, 200 mm.
(D) Immunoblots of MCF-10A cells treated with DMSO or BEZ235 for 48 hr. See also Figure S4.
Cancer Cell
Adaptive Resistance to PI3K/mTOR Inhibition
However, all four samples showed significant response to dual
treatment of BEZ235 and ABT-263 (Figure 7D). Together, these
preliminary results suggest that further evaluation of this drug
combination in more in vivo models and primary human tumor
samples is warranted.
DISCUSSION
Here, using 3D spheroid cell cultures, we show that matrix-
attached tumor cells are specifically resistant to dual PI3K/
234 Cancer Cell 21, 227–239, February 14, 2012 ª2012 Elsevier Inc.
mTOR inhibition by inducing an adaptive response involving up-
regulation of multiple prosurvival proteins. Induction of the
adaptive response involves increased cap-independent transla-
tion and FOXO mediated transcription. It is interesting that this
response resembles the highly conserved stress response
induced in organisms deprived of nutrients and growth factors
(Gilbert et al., 2007; Jefferson and Kimball, 2003; Marr et al.,
2007; Puig and Tjian, 2005; Villa-Cuesta et al., 2010). In addition,
this work establishes the 3D-based model system, particularly in
combination with a high throughput proteomics approach, as

Figure 7. Dual Inhibition of Bcl-2 and PI3K/mTOR in an In Vivo Xenograft Model and in Primary Patient Samples Causes Decreased Tumor
Growth and Enhanced Cell Death
(A) MCAS and OV2008 cells were injected subcutaneously into female nod/scid mice and, after tumors were palpable, mice were treated every 24 hr with vehicle,
GNE493 (mTOR inhibitor, 7mg/kg), ABT-737 (70mg/kg), or a combination of both. Tumorsweremeasured on indicated days, and the data are reported as the fold
change relative to size of the same tumor on Day 1. The data, represented as the average ± SEM, were derived from experiments in which 72 tumors were
monitored in 43 mice for MCAS and 40 tumors were monitored in 20 mice for OV2008. ***p < 0.001; **p < 0.005.
(B) Tumor sections from MCAS xenografts were stained with H&E and imaged at 43. Representative images of tumors of similar size (�300mm3) for each
treatment are shown. Scale bar, 100 mm.
(C) Western blot analysis of vehicle- and GNE493-treatedMCAS tumors. Tumors were harvested 4 hr after the last dosing on Day 7 and probed with the indicated
antibodies. Numbers above each lane indicate tumor numbers.
(D) Tumor cells isolated from peritoneal or pleural fluid exudates were cultured in Matrigel for 8 days and treated with the indicated inhibitors (ABT-263, an
identical Bcl-2 inhibitor to ABT-737). Cell death was quantified by analysis of dead cells (as marked by EtBr) over total cell number (as analyzed by Hoechst stain).
*p < 0.05; **p < 0.01; ***p < 0.005. Red boxes indicate average data distribution, and highest and lowest value are indicated with connected red caps. Single blue
caps indicate SD and connected blue caps indicate ± SEM.
Cancer Cell
Adaptive Resistance to PI3K/mTOR Inhibition
a valuable approach for rational prediction of effective drug
combinations.
Although treatment of cancer cells in monolayer cultures with
PI3K/mTOR inhibitors suppresses cell proliferation, apoptosis is
not commonly observed. In contrast, these inhibitors are potent
inducers of apoptosis of inner cells within 3D spheroid cultures
that are not attached to matrix, whereas cells in 2D cultures
and the outer cells of tumor spheroids induce a strong survival
C
program and provide an explanation for the lack of toxicity of
PI3K/mTOR inhibitors in traditional 2D cultures. The enhanced
sensitivity of the inner cells of 3D spheroids to apoptosis infers
that PI3K activity is specifically required for survival of this
population of tumor cells. The inner cells in 3D spheroids lack
exposure to ECM components and likely rely on sustained
PI3K activity for anchorage-independent survival. Indeed, onco-
genic mutant variants of PI3K have been shown to rescue cells
ancer Cell 21, 227–239, February 14, 2012 ª2012 Elsevier Inc. 235

Cancer Cell
Adaptive Resistance to PI3K/mTOR Inhibition
from apoptosis caused by loss of matrix signaling (Isakoff et al.,
2005; Martin et al., 2006; Schafer et al., 2009). These studies,
together with our studies of spheroid cultures, highlight the crit-
ical role of the PI3K pathway in the survival of matrix-deprived
cells and raise the question whether human epithelial tumor cells
may display differential sensitivity to PI3K inhibitors depending
on their differential association with ECM components.
The matrix-attached tumor cells initiate a transcriptional and
translational program in response to PI3K/mTOR inhibition
involving expression of signaling proteins that regulate survival.
Whether the induction of this program by PI3K/mTOR inhibitors
is exclusively due to ECM attachment or is dependent on other
features of the outer cells (e.g., cell-cell adhesion or polarity)
remains to be established. Weaver and coworkers have shown
that a6/b4-integrin-dependent cell polarity controls responses
to apoptotic stimuli via NFkB activation in normal epithelial cells
(Friedland et al., 2007; Weaver et al., 2002); however, polarity
of the outer cells was not required for protection in this study,
and inhibition of NFkB signaling by expression of the NFkB
super-repressor did not induce cell death in OV2008 BEZ235-
treated cells. It has also been shown that b4-integrin signaling
can enhance RTK signaling, invasion, and metastasis through
c-Jun and STAT3 (Guo et al., 2006); however, expression of
dominant-negative c-Jun or downregulation of STAT3 did not
prevent the adaptive response to PI3K/mTOR inhibition in our
system (T.M., unpublished results). While integrins are likely crit-
ical for the induction of the adaptive response, wewere unable to
identify a specific integrin or downstream component that plays
a dominant role in the response, suggesting that this adaptive
response is robust and likely includes several components of
the integrin-signaling pathway.
Inhibition of PI3K pathway has been shown to relieve negative
feedback inhibition of upstream pathways. Recently, two reports
(Chandarlapaty et al., 2011; Garrett et al., 2011) described induc-
tion of expression of RTKs by FOXO transcription factors after
inhibition of HER2 or AKT. We also observed significant enrich-
ment in FOXO transcriptional targets after BEZ235 treatment,
suggesting a role for FOXO transcription factors in the induction
of the adaptive response at the mRNA level. However, our
studies involving amore comprehensive proteomic approach re-
vealed a much broader BEZ235-induced program involving
significant translational regulation. Several lines of evidence
support a role for cap-independent translation in the adaptive
response. First, decreased p-4E-BP1 correlated with upregula-
tion of Bcl-2 and IGF1Rb. Because 4E-BP1 is a potent inhibitor
of cap-dependent translation (Choo et al., 2008; Hsieh et al.,
2010; Thoreen et al., 2009), this evidence, together with the pres-
ence of predicted or validated IRES sequences in many of the
upregulated proteins, raised the possibility that cap-indepen-
dent translation contributes to this program. In addition, using
two reporters, we found that BEZ235 (but not rapamycin, which
does not inhibit 4E-BP1 significantly, or a selective PI3K inhibitor)
caused an increase in IRES-mediated translation and a signifi-
cant decrease in cap-dependent translation, supporting the utili-
zation of cap-independent translation in the context of mTOR
inhibition.
Cells downregulate global translation under stress and rely on
the less efficient cap-independent translation for production
of proteins critical for cell survival (Holcik and Sonenberg,
236 Cancer Cell 21, 227–239, February 14, 2012 ª2012 Elsevier Inc.
2005; Silvera et al., 2010). Our results suggest that cancer cells
may use a similar program to mediate survival under the stress
of PI3K/mTOR inhibition. PI3K pathway inhibition not only
reduces growth factor signaling but also inhibits nutrient uptake,
mimicking nutrient starvation. It is not surprising that the
adaptive response to PI3K/mTOR inhibition resembles the
highly conserved stress responses observed in lower eukaryots
in response to nutrient deprivation as well as endoplasmic
reticulum, irradiation, or oxidative stress (Fels and Koumenis,
2006; Sengupta et al., 2010; Wek et al., 2006). In Drosophila
melanogaster, nutrient deprivation leads to repression of cap-
dependent translation and dFoxO-mediated induction of insulin
receptor expression. Both dFoxO and insulin receptor can be
translated via IRES-mediated mechanisms and are required for
survival (Marr et al., 2007; Villa-Cuesta et al., 2010). A similar
response to dietary restriction is also observed inCaenorhabditis
elegans (Syntichaki et al., 2007). The adaptive response to
nutrient or amino acid starvation also requires eIF2a phosphory-
lation, which decreases translation initiation generally; however,
some IRES-containing mRNAs are preferentially translated
(Allam and Ali, 2010; Fernandez et al., 2002; Gerlitz et al.,
2002; Terenin et al., 2008). It is interesting that eIF2a phosphor-
ylation also contributes to cell survival upon glucose deficiency
and is associated with increased XIAP and Bcl-xL translation,
both of which have been shown to harbor IRES sequences
(Muaddi et al., 2010). Given that PI3K pathway inhibition
suppresses glucose and amino acid transport and that mTOR
inhibition suppresses cap-dependent translation (Choo et al.,
2008; Hsieh et al., 2010; Thoreen et al., 2009), the evidence
that combined PI3K/mTOR inhibitors elicit responses similar to
those induced by nutrient starvation is not surprising. However,
it has not been appreciated that targeted therapies would elicit
these types of responses and that these would be amenable to
rational therapeutic targeting.
Among the PI3K/mTOR inhibitor upregulated proteins, RTKs
and antiapoptotic Bcl-2 familymemberswere themost attractive
targets for combination therapies, given their known role in cell
survival. It is of interest that tamoxifen- or HER2/EGFR-resistant
tumors display upregulation of several of the same targets, such
as IGF1R, EGFR, and HER2 (Creighton et al., 2008; Massarweh
et al., 2008; Plati et al., 2011; Riggins et al., 2007), and chemore-
sistance in ovarian carcinomas is associated with upregulation
of Bcl-2 and Bcl-xL (Gimenez-Bonafe et al., 2009; Jain and
Meyer-Hermann, 2011; Plati et al., 2011; Walensky, 2006). In
addition, irradiation (Holcik et al., 1999; Holcik et al., 2000) and
hypoxia can both induce the switch to cap-independent transla-
tion (Braunstein et al., 2007), suggesting that upregulation of the
pathways that we observed in this study could represent amech-
anistic explanation of resistance to multiple types of cancer
therapy.
Although further studies are required, our initial in vivo xeno-
graft studies and analysis of breast and ovarian cancer patient
samples suggest that inhibition of both Bcl-2 and PI3K/mTOR
may bemore effective than either alone. Furthermore, the effects
of inhibition of Bcl-2 family members and PI3K/mTOR may be
more general than the combination of PI3K/mTOR and EGFR if
different RTKs are activated in tumor samples. It is interesting
that nontransformed epithelial cells were highly resistant to
combined treatment with BEZ235 and ABT737. We speculate

Cancer Cell
Adaptive Resistance to PI3K/mTOR Inhibition
that one contributing factor might be the proapoptotic protein
Bim, which is upregulated in the BEZ235-treated tumor cell lines
but not in MCF-10A cells.
The results presented here demonstrate that inhibition of
PI3K/mTOR in matrix-attached cancer cells initiates an evolu-
tionarily conserved cellular stress response, mediated by
FOXO transcription factors and preferential translation of IRES-
containing mRNAs. This response leads to upregulation of
signaling pathways required for cancer cell survival but only in
populations of tumor cells within a specific niche (i.e., matrix-
attached cells). It is possible that this stress response could
contribute to relapse after treatment and possibly to the devel-
opment of resistant tumor cells within matrix-associated niches
in human tumors exposed to PI3K/mTOR inhibitors.
EXPERIMENTAL PROCEDURES
Additional experimental procedures are described in detail in the Supple-
mental Experimental Procedures.
Antibodies and Reagents, Cell Culture, Cell Lines, and Virus
Production
These are described in the Supplemental Experimental Procedures.
In Vivo Xenograft Experiments
Onemillion cells (MCAS andOV2008) were injected per flank, subcutaneously,
into 10- to 12-week-old female Nod/Scid mice in a 1:1 mix of PBS and
Matrigel. Once tumors became palpable (�250 mm3), generally Day 8 postin-
jection for MCAS and Day 28 for OV2008, drugs were administered daily
intraperitoneally. GNE493 (70mg/kg) was dissolved in 0.5% methylcellulose/
0.2% Tween 80, and ABT-737 was dissolved in 30% propylene glycol/5%
Tween 80/65% D5W (5% dextrose in water). All animal studies were per-
formed according to protocols approved by the Institutional Animal
Care and Use Committee, the Standing Committee on Animals at Harvard
University.
Primary Patient Samples
Primary cells were obtained from patients at Brigham and Women’s Hospital
(BWH) who underwent paracentesis for malignant ascites. The protocol was
approved by the BWH Institutional Review Board (IRB), the Harvard Medical
School Office for Research Subject Protection, and the Partners Human
Research Committee. Consent from patients was obtained as per IRB guide-
lines. The fluid exudate samples were briefly centrifuged, and the cell pellet
was washed with PBS. Red blood cells were lysed with Hybri-Max red blood
cell lysis buffer (Sigma No. 7757), and the tumor cells were washed in PBS
and media and allowed to grow one passage in 2D culture before they were
used for the 3D assays. Media for the primary samples was same as for the
ovarian cell lines.
3D Acinar Morphogenesis Assay and Scoring of 3D Structures
Our previously reported MCF-10A 3D cell culture protocol (Debnath et al.,
2003a) (https://brugge.med.harvard.edu/) was modified in the following way
for 3D culture of ovarian cancer cell lines: Cells were grown in MCBD105:199
media (described in Supplemental Experimental Procedures) supplemented
with 2% inactivated calf serum that was replaced every 4 days. For protein
and mRNA, cells were grown on poly-HEMA-coated plates with 2% matrigel.
The 3D structures were scored according to 3D structure integrity based on
the resemblance to images shown in Figure 3B. Over 200 structures were
scored for each condition.
RPPA Assay
RPPA experiments were performed as previously described (Hennessy et al.,
2010).
C
ACCESSION NUMBERS
The data from the microarrays have been deposited in the GEO database with
accession number GSE28992.
SUPPLEMENTAL INFORMATION
Supplemental Information includes four figures and Supplemental Experi-
mental Procedures and can be found with this article online at doi:10.1016/j.
ccr.2011.12.024.
ACKNOWLEDGMENTS
We thank Joel Leverson and Steve Elmore from Abbott Laboratories and
Deepak Sampath from Genentech for ABT737 and GNE493 and for providing
helpful advice on the in vivo study design. We thank Ed Cibas for fluid
exudates; Nathanael Grey (Dana-Farber Cancer Institute) for Torin1; Dennis
Slamon and Gottfried Konecny (University of California, Los Angeles) for the
breast and ovarian cell lines; Yiling Lu (M.D. Anderson Cancer Center) for
help with RPPA; Jennifer Waters and the Nikon Imaging Center at Harvard
Medical School for microscopy; Gerhard Wagner (Harvard Medical School)
for the CrPV-IRES plasmid; Richard Lloyd (Baylor College of Medicine) for
the Bcl-2 IRES reporter; and Victor Velculescu for sharing PIK3CA mutation
status on the ovarian cancer cell lines before publication. We also thank David
Sabatini, Shomit Sengupta, Cheuk Leong, Alexandra Grassian, and Jonathan
Coloff for their critical review of the manuscript and helpful discussions.
These studies were supported by the Emil Aaltonen Foundation (T.M.), the
Academy of Finland (T.M.), Stand Up to Cancer (SU2C) (J.B., G.M.), Ovarian
SPORE Grant P50CA083639 (G.M.), the Dr. Miriam and Sheldon G. Adelson
Medical Research Foundation (J.B.), and National Cancer Institute Grant
CA105134 (J.B.).
Received: April 29, 2011
Revised: October 7, 2011
Accepted: December 20, 2011
Published: February 13, 2012
REFERENCES
Ackler, S., Xiao, Y., Mitten, M.J., Foster, K., Oleksijew, A., Refici, M.,
Schlessinger, S., Wang, B., Chemburkar, S.R., Bauch, J., et al. (2008). ABT-
263 and rapamycin act cooperatively to kill lymphoma cells in vitro and in vivo.
Mol. Cancer Ther. 7, 3265–3274.
Allam, H., and Ali, N. (2010). Initiation factor eIF2-independent mode of c-Src
mRNA translation occurs via an internal ribosome entry site. J. Biol. Chem.
285, 5713–5725.
Baselga, J. (2011). Targeting the phosphoinositide-3 (PI3) kinase pathway in
breast cancer. Oncologist 16 (Suppl. 1 ), 12–19.
Braunstein, S., Karpisheva, K., Pola, C., Goldberg, J., Hochman, T., Yee, H.,
Cangiarella, J., Arju, R., Formenti, S.C., and Schneider, R.J. (2007). A
hypoxia-controlled cap-dependent to cap-independent translation switch in
breast cancer. Mol. Cell 28, 501–512.
Brunet, A., Bonni, A., Zigmond, M.J., Lin, M.Z., Juo, P., Hu, L.S., Anderson,
M.J., Arden, K.C., Blenis, J., and Greenberg, M.E. (1999). Akt promotes cell
survival by phosphorylating and inhibiting a Forkhead transcription factor.
Cell 96, 857–868.
Carpten, J.D., Faber, A.L., Horn, C., Donoho, G.P., Briggs, S.L., Robbins,
C.M., Hostetter, G., Boguslawski, S., Moses, T.Y., Savage, S., et al. (2007).
A transforming mutation in the pleckstrin homology domain of AKT1 in cancer.
Nature 448, 439–444.
Carracedo, A., Ma, L., Teruya-Feldstein, J., Rojo, F., Salmena, L., Alimonti, A.,
Egia, A., Sasaki, A.T., Thomas, G., Kozma, S.C., et al. (2008). Inhibition of
mTORC1 leads to MAPK pathway activation through a PI3K-dependent feed-
back loop in human cancer. J. Clin. Invest. 118, 3065–3074.
Chandarlapaty, S., Sawai, A., Scaltriti, M., Rodrik-Outmezguine, V., Grbovic-
Huezo, O., Serra, V., Majumder, P.K., Baselga, J., and Rosen, N. (2011).
ancer Cell 21, 227–239, February 14, 2012 ª2012 Elsevier Inc. 237

Cancer Cell
Adaptive Resistance to PI3K/mTOR Inhibition
AKT inhibition relieves feedback suppression of receptor tyrosine kinase
expression and activity. Cancer Cell 19, 58–71.
Chiarugi, P., and Giannoni, E. (2008). Anoikis: a necessary death program for
anchorage-dependent cells. Biochem. Pharmacol. 76, 1352–1364.
Choo, A.Y., Yoon, S.-O., Kim, S.G., Roux, P.P., and Blenis, J. (2008).
Rapamycin differentially inhibits S6Ks and 4E-BP1 to mediate cell-type-
specific repression of mRNA translation. Proc. Natl. Acad. Sci. USA 105,
17414–17419.
Cloughesy, T.F., Yoshimoto, K., Nghiemphu, P., Brown, K., Dang, J., Zhu, S.,
Hsueh, T., Chen, Y., Wang, W., Youngkin, D., et al. (2008). Antitumor activity of
rapamycin in a Phase I trial for patients with recurrent PTEN-deficient glioblas-
toma. PLoS Med. 5, e8.
Courtney, K.D., Corcoran, R.B., and Engelman, J.A. (2010). The PI3K pathway
as drug target in human cancer. J. Clin. Oncol. 28, 1075–1083.
Creighton, C.J., Massarweh, S., Huang, S., Tsimelzon, A., Hilsenbeck, S.G.,
Osborne, C.K., Shou, J., Malorni, L., and Schiff, R. (2008). Development of
resistance to targeted therapies transforms the clinically associated molecular
profile subtype of breast tumor xenografts. Cancer Res. 68, 7493–7501.
Debnath, J., and Brugge, J.S. (2005). Modelling glandular epithelial cancers in
three-dimensional cultures. Nat. Rev. Cancer 5, 675–688.
Debnath, J., Muthuswamy, S.K., and Brugge, J.S. (2003a). Morphogenesis
and oncogenesis of MCF-10Amammary epithelial acini grown in three-dimen-
sional basement membrane cultures. Methods 30, 256–268.
Debnath, J., Walker, S.J., and Brugge, J.S. (2003b). Akt activation disrupts
mammary acinar architecture and enhances proliferation in an mTOR-depen-
dent manner. J. Cell Biol. 163, 315–326.
Engelman, J.A. (2009). Targeting PI3K signalling in cancer: opportunities, chal-
lenges and limitations. Nat. Rev. Cancer 9, 550–562.
Engelman, J.A., Chen, L., Tan, X., Crosby, K., Guimaraes, A.R., Upadhyay, R.,
Maira, M., McNamara, K., Perera, S.A., Song, Y., et al. (2008). Effective use of
PI3K and MEK inhibitors to treat mutant Kras G12D and PIK3CA H1047R
murine lung cancers. Nat. Med. 14, 1351–1356.
Feldman,M.E., Apsel, B., Uotila, A., Loewith, R., Knight, Z.A., Ruggero, D., and
Shokat, K.M. (2009). Active-site inhibitors of mTOR target rapamycin-resistant
outputs of mTORC1 and mTORC2. PLoS Biol. 7, e38.
Fels, D.R., and Koumenis, C. (2006). The PERK/eIF2alpha/ATF4 module of the
UPR in hypoxia resistance and tumor growth. Cancer Biol. Ther. 5, 723–728.
Fernandez, J., Yaman, I., Sarnow, P., Snider, M.D., and Hatzoglou, M. (2002).
Regulation of internal ribosomal entry site-mediated translation by phosphor-
ylation of the translation initiation factor eIF2alpha. J. Biol. Chem. 277, 19198–
19205.
Friedland, J.C., Lakins, J.N., Kazanietz, M.G., Chernoff, J., Boettiger, D., and
Weaver, V.M. (2007). alpha6beta4 integrin activates Rac-dependent p21-acti-
vated kinase 1 to drive NF-kappaB-dependent resistance to apoptosis in 3D
mammary acini. J. Cell Sci. 120, 3700–3712.
Garrett, J.T., Olivares, M.G., Rinehart, C., Granja-Ingram, N.D., Sanchez, V.,
Chakrabarty, A., Dave, B., Cook, R.S., Pao, W., McKinely, E., et al. (2011).
Transcriptional and posttranslational up-regulation of HER3 (ErbB3) compen-
sates for inhibition of the HER2 tyrosine kinase. Proc. Natl. Acad. Sci. USA 108,
5021–5026.
Gerlitz, G., Jagus, R., and Elroy-Stein, O. (2002). Phosphorylation of initiation
factor-2 alpha is required for activation of internal translation initiation during
cell differentiation. Eur. J. Biochem. 269, 2810–2819.
Gewinner, C., Wang, Z.C., Richardson, A., Teruya-Feldstein, J.,
Etemadmoghadam, D., Bowtell, D., Barretina, J., Lin, W.M., Rameh, L.,
Salmena, L., et al. (2009). Evidence that inositol polyphosphate 4-phosphatase
type II is a tumor suppressor that inhibits PI3K signaling. Cancer Cell 16,
115–125.
Gilbert, W.V., Zhou, K., Butler, T.K., and Doudna, J.A. (2007). Cap-indepen-
dent translation is required for starvation-induced differentiation in yeast.
Science 317, 1224–1227.
Gimenez-Bonafe, P., Tortosa, A., and Perez-Tomas, R. (2009). Overcoming
drug resistance by enhancing apoptosis of tumor cells. Curr. Cancer Drug
Targets 9, 320–340.
238 Cancer Cell 21, 227–239, February 14, 2012 ª2012 Elsevier Inc.
Guo, W., Pylayeva, Y., Pepe, A., Yoshioka, T., Muller, W.J., Inghirami, G., and
Giancotti, F.G. (2006). Beta 4 integrin amplifies ErbB2 signaling to promote
mammary tumorigenesis. Cell 126, 489–502.
Harrington, L.S., Findlay, G.M., Gray, A., Tolkacheva, T., Wigfield, S., Rebholz,
H., Barnett, J., Leslie, N.R., Cheng, S., Shepherd, P.R., et al. (2004). The TSC1-
2 tumor suppressor controls insulin-PI3K signaling via regulation of IRS
proteins. J. Cell Biol. 166, 213–223.
Hennessy, B., Lu, Y., Gonzalez-Angulo, A.M., Myhre, S., Carey, M., Ju, Z.,
Coombes, K., Liu, W., Meric-Bernstam, F., Bedrosian, I., et al. (2010). A tech-
nical assessment of the utility of reverse phase protein arrays for the study of
the functional proteome in non-microdissested human breast cancer. Clin.
Proteomics 6, 129–151.
Holcik, M., and Sonenberg, N. (2005). Translational control in stress and
apoptosis. Nat. Rev. Mol. Cell Biol. 6, 318–327.
Holcik, M., Lefebvre, C., Yeh, C., Chow, T., and Korneluk, R.G. (1999). A new
internal-ribosome-entry-site motif potentiates XIAP-mediated cytoprotection.
Nat. Cell Biol. 1, 190–192.
Holcik, M., Yeh, C., Korneluk, R.G., and Chow, T. (2000). Translational upregu-
lation of X-linked inhibitor of apoptosis (XIAP) increases resistance to radiation
induced cell death. Oncogene 19, 4174–4177.
Howes, A.L., Chiang, G.G., Lang, E.S., Ho, C.B., Powis, G., Vuori, K., and
Abraham, R.T. (2007). The phosphatidylinositol 3-kinase inhibitor, PX-866, is
a potent inhibitor of cancer cell motility and growth in three-dimensional
cultures. Mol. Cancer Ther. 6, 2505–2514.
Hsieh, A.C., Costa, M., Zollo, O., Davis, C., Feldman, M.E., Testa, J.R.,
Meyuhas, O., Shokat, K.M., and Ruggero, D. (2010). Genetic dissection of
the oncogenic mTOR pathway reveals druggable addiction to translational
control via 4EBP-eIF4E. Cancer Cell 17, 249–261.
Isakoff, S.J., Engelman, J.A., Irie, H.Y., Luo, J., Brachmann, S.M., Pearline,
R.V., Cantley, L.C., and Brugge, J.S. (2005). Breast cancer-associated
PIK3CA mutations are oncogenic in mammary epithelial cells. Cancer Res.
65, 10992–11000.
Jain, H.V., and Meyer-Hermann, M. (2011). The molecular basis of synergism
between carboplatin and ABT-737 therapy targeting ovarian carcinomas.
Cancer Res. 71, 705–715.
Jefferson, L.S., and Kimball, S.R. (2003). Amino acids as regulators of gene
expression at the level of mRNA translation. J. Nutr. 133 (6, Suppl 1),
2046S–2051S.
Johannes, G., Carter, M.S., Eisen, M.B., Brown, P.O., and Sarnow, P. (1999).
Identification of eukaryotic mRNAs that are translated at reduced cap binding
complex eIF4F concentrations using a cDNAmicroarray. Proc. Natl. Acad. Sci.
USA 96, 13118–13123.
Kenny, P.A., Lee, G.Y., Myers, C.A., Neve, R.M., Semeiks, J.R., Spellman,
P.T., Lorenz, K., Lee, E.H., Barcellos-Hoff, M.H., Petersen, O.W., et al.
(2007). The morphologies of breast cancer cell lines in three-dimensional
assays correlate with their profiles of gene expression. Mol. Oncol. 1, 84–96.
Kops, G.J., de Ruiter, N.D., De Vries-Smits, A.M., Powell, D.R., Bos, J.L., and
Burgering, B.M. (1999). Direct control of the Forkhead transcription factor AFX
by protein kinase B. Nature 398, 630–634.
Li, J., Yen, C., Liaw, D., Podsypanina, K., Bose, S., Wang, S.I., Puc, J.,
Miliaresis, C., Rodgers, L., McCombie, R., et al. (1997). PTEN, a putative
protein tyrosine phosphatase gene mutated in human brain, breast, and pros-
tate cancer. Science 275, 1943–1947.
Liu, H., Radisky, D.C., Wang, F., and Bissell, M.J. (2004). Polarity and prolifer-
ation are controlled by distinct signaling pathways downstream of PI3-kinase
in breast epithelial tumor cells. J. Cell Biol. 164, 603–612.
Maira, S.M., Stauffer, F., Brueggen, J., Furet, P., Schnell, C., Fritsch, C.,
Brachmann, S., Chene, P., De Pover, A., Schoemaker, K., et al. (2008).
Identification and characterization of NVP-BEZ235, a new orally available
dual phosphatidylinositol 3-kinase/mammalian target of rapamycin inhibitor
with potent in vivo antitumor activity. Mol. Cancer Ther. 7, 1851–1863.
Marr, M.T., 2nd, D’Alessio, J.A., Puig, O., and Tjian, R. (2007). IRES-mediated
functional coupling of transcription and translation amplifies insulin receptor
feedback. Genes Dev. 21, 175–183.

Cancer Cell
Adaptive Resistance to PI3K/mTOR Inhibition
Martin, M.J., Melnyk, N., Pollard, M., Bowden, M., Leong, H., Podor, T.J.,
Gleave, M., and Sorensen, P.H. (2006). The insulin-like growth factor I receptor
is required for Akt activation and suppression of anoikis in cells transformed by
the ETV6-NTRK3 chimeric tyrosine kinase. Mol. Cell. Biol. 26, 1754–1769.
Massarweh, S., Osborne, C.K., Creighton, C.J., Qin, L., Tsimelzon, A., Huang,
S., Weiss, H., Rimawi, M., and Schiff, R. (2008). Tamoxifen resistance in breast
tumors is driven by growth factor receptor signaling with repression of classic
estrogen receptor genomic function. Cancer Res. 68, 826–833.
Moerke, N.J., Aktas, H., Chen, H., Cantel, S., Reibarkh, M.Y., Fahmy, A.,
Gross, J.D., Degterev, A., Yuan, J., Chorev, M., et al. (2007). Small-molecule
inhibition of the interaction between the translation initiation factors eIF4E
and eIF4G. Cell 128, 257–267.
Muaddi, H., Majumder, M., Peidis, P., Papadakis, A.I., Holcik, M., Scheuner,
D., Kaufman, R.J., Hatzoglou, M., and Koromilas, A.E. (2010).
Phosphorylation of eIF2a at serine 51 is an important determinant of cell
survival and adaptation to glucose deficiency. Mol. Biol. Cell 21, 3220–3231.
O’Reilly, K.E., Rojo, F., She, Q.-B., Solit, D., Mills, G.B., Smith, D., Lane, H.,
Hofmann, F., Hicklin, D.J., Ludwig, D.L., et al. (2006). mTOR inhibition induces
upstream receptor tyrosine kinase signaling and activates Akt. Cancer Res.
66, 1500–1508.
Oltersdorf, T., Elmore, S.W., Shoemaker, A.R., Armstrong, R.C., Augeri, D.J.,
Belli, B.A., Bruncko, M., Deckwerth, T.L., Dinges, J., Hajduk, P.J., et al.
(2005). An inhibitor of Bcl-2 family proteins induces regression of solid
tumours. Nature 435, 677–681.
Plati, J., Bucur, O., and Khosravi-Far, R. (2011). Apoptotic cell signaling in
cancer progression and therapy. Integr. Biol. (Camb.) 3, 279–296.
Polo, M.L., Arnoni, M.V., Riggio, M., Wargon, V., Lanari, C., and Novaro, V.
(2010). Responsiveness to PI3K and MEK inhibitors in breast cancer. Use of
a 3D culture system to study pathways related to hormone independence in
mice. PLoS ONE 5, e10786.
Puig, O., and Tjian, R. (2005). Transcriptional feedback control of insulin
receptor by dFOXO/FOXO1. Genes Dev. 19, 2435–2446.
Raven, J.F., and Koromilas, A.E. (2008). PERK and PKR: old kinases learn new
tricks. Cell Cycle 7, 1146–1150.
Riggins, R.B., Schrecengost, R.S., Guerrero, M.S., and Bouton, A.H. (2007).
Pathways to tamoxifen resistance. Cancer Lett. 256, 1–24.
Samuels, Y., and Velculescu, V.E. (2004). Oncogenic mutations of PIK3CA in
human cancers. Cell Cycle 3, 1221–1224.
Samuels, Y., Wang, Z., Bardelli, A., Silliman, N., Ptak, J., Szabo, S., Yan, H.,
Gazdar, A., Powell, S.M., Riggins, G.J., et al. (2004). High frequency of muta-
tions of the PIK3CA gene in human cancers. Science 304, 554.
Schafer, Z.T., Grassian, A.R., Song, L., Jiang, Z., Gerhart-Hines, Z., Irie, H.Y.,
Gao, S., Puigserver, P., and Brugge, J.S. (2009). Antioxidant and oncogene
rescue of metabolic defects caused by loss of matrix attachment. Nature
461, 109–113.
Sengupta, S., Peterson, T.R., and Sabatini, D.M. (2010). Regulation of the
mTOR complex 1 pathway by nutrients, growth factors, and stress. Mol. Cell
40, 310–322.
Sergina, N.V., Rausch, M., Wang, D., Blair, J., Hann, B., Shokat, K.M., and
Moasser, M.M. (2007). Escape from HER-family tyrosine kinase inhibitor
therapy by the kinase-inactive HER3. Nature 445, 437–441.
Serra, V., Scaltriti, M., Prudkin, L., Eichhorn, P.J.A., Ibrahim, Y.H.,
Chandarlapaty, S., Markman, B., Rodriguez, O., Guzman, M., Rodriguez, S.,
et al. (2011). PI3K inhibition results in enhanced HER signaling and acquired
C
ERK dependency in HER2-overexpressing breast cancer. Oncogene 30,
2547–2557.
She, Q.-B., Halilovic, E., Ye, Q., Zhen, W., Shirasawa, S., Sasazuki, T., Solit,
D.B., and Rosen, N. (2010). 4E-BP1 is a key effector of the oncogenic activa-
tion of the AKT and ERK signaling pathways that integrates their function in
tumors. Cancer Cell 18, 39–51.
Silvera, D., Formenti, S.C., and Schneider, R.J. (2010). Translational control in
cancer. Nat. Rev. Cancer 10, 254–266.
Suo, J., Snider, S.J., Mills, G.B., Creighton, C.J., Chen, A.C., Schiff, R., Lloyd,
R.E., andChang, E.C. (2010). Int6 regulates both proteasomal degradation and
translation initiation and is critical for proper formation of acini by human
mammary epithelium. Oncogene 30, 724–736.
Sutherlin, D.P., Sampath, D., Berry, M., Castanedo, G., Chang, Z.,
Chuckowree, I., Dotson, J., Folkes, A., Friedman, L., Goldsmith, R., et al.
(2010). Discovery of (thienopyrimidin-2-yl)aminopyrimidines as potent, selec-
tive, and orally available pan-PI3-kinase and dual pan-PI3-kinase/mTOR inhib-
itors for the treatment of cancer. J. Med. Chem. 53, 1086–1097.
Syntichaki, P., Troulinaki, K., and Tavernarakis, N. (2007). eIF4E function in
somatic cells modulates ageing in Caenorhabditis elegans. Nature 445,
922–926.
Terenin, I.M., Dmitriev, S.E., Andreev, D.E., and Shatsky, I.N. (2008).
Eukaryotic translation initiation machinery can operate in a bacterial-like
mode without eIF2. Nat. Struct. Mol. Biol. 15, 836–841.
Thoreen, C.C., Kang, S.A., Chang, J.W., Liu, Q., Zhang, J., Gao, Y., Reichling,
L.J., Sim, T., Sabatini, D.M., and Gray, N.S. (2009). An ATP-competitive
mammalian target of rapamycin inhibitor reveals rapamycin-resistant func-
tions of mTORC1. J. Biol. Chem. 284, 8023–8032.
Villa-Cuesta, E., Sage, B.T., and Tatar, M. (2010). A role for Drosophila dFoxO
and dFoxO 50UTR internal ribosomal entry sites during fasting. PLoS ONE 5,
e11521.
Walensky, L.D. (2006). BCL-2 in the crosshairs: tipping the balance of life and
death. Cell Death Differ. 13, 1339–1350.
Weaver, V.M., Lelievre, S., Lakins, J.N., Chrenek, M.A., Jones, J.C.R.,
Giancotti, F., Werb, Z., and Bissell, M.J. (2002). beta4 integrin-dependent
formation of polarized three-dimensional architecture confers resistance to
apoptosis in normal and malignant mammary epithelium. Cancer Cell 2,
205–216.
Weigelt, B., and Bissell, M.J. (2008). Unraveling the microenvironmental
influences on the normal mammary gland and breast cancer. Semin. Cancer
Biol. 18, 311–321.
Weigelt, B., Lo, A.T., Park, C.C., Gray, J.W., and Bissell, M.J. (2010). HER2
signaling pathway activation and response of breast cancer cells to HER2-
targeting agents is dependent strongly on the 3D microenvironment. Breast
Cancer Res. Treat. 122, 35–43.
Wek, R.C., Jiang, H.-Y., and Anthony, T.G. (2006). Coping with stress: eIF2
kinases and translational control. Biochem. Soc. Trans. 34, 7–11.
Yamada, K.M., and Cukierman, E. (2007). Modeling tissue morphogenesis
and cancer in 3D. Cell 130, 601–610.
Yamaguchi, S., Ishihara, H., Yamada, T., Tamura, A., Usui, M., Tominaga, R.,
Munakata, Y., Satake, C., Katagiri, H., Tashiro, F., et al. (2008). ATF4-mediated
induction of 4E-BP1 contributes to pancreatic beta cell survival under endo-
plasmic reticulum stress. Cell Metab. 7, 269–276.
Yuan, T.L., and Cantley, L.C. (2008). PI3K pathway alterations in cancer:
variations on a theme. Oncogene 27, 5497–5510.
ancer Cell 21, 227–239, February 14, 2012 ª2012 Elsevier Inc. 239

Cancer Cell
Article
Tumorigenic Cells Are Common in Mouse MPNSTsbut Their Frequency Depends upon Tumor Genotypeand Assay ConditionsJohanna Buchstaller,1 Paul E. McKeever,2 and Sean J. Morrison1,3,*1Department of Internal Medicine, Life Sciences Institute, and Center for Stem Cell Biology2Department of Pathology
University of Michigan, Ann Arbor, MI 48109-2216, USA3Howard Hughes Medical Institute, Children’s Research Institute, Department of Pediatrics, University of Texas Southwestern Medical
Center, Dallas, TX 75390, USA
*Correspondence: [email protected]
DOI 10.1016/j.ccr.2011.12.027
SUMMARY
Tumor-initiating cells have been suggested to be rare in many cancers. We tested this in mouse malignantperipheral nerve sheath tumors (MPNSTs) and found that 18% of primary and 49% of passaged MPNSTcells from Nf1+/�; Ink4a/Arf�/� mice formed tumors upon transplantation, whereas only 1.8% to 2.6% ofMPNST cells from Nf1+/�; p53+/� mice did. MPNST cells of both genotypes require laminin binding to b1-integrin for clonogenic growth. Most MPNST cells from Nf1+/�; Ink4a/Arf�/� mice expressed laminin,whereas most MPNST cells from Nf1+/�; p53+/� mice did not. Exogenous laminin increased the percentageof MPNST cells from Nf1+/�; p53+/� but not Nf1+/�; Ink4a/Arf�/� mice that formed tumorigenic colonies.Tumor-forming potential is common among MPNST cells, but the assay conditions required to detect itvary with tumor genotype.
INTRODUCTION
The question of which cells contribute to cancer growth and
progression has fundamental implications for therapy. If tumor
growth and metastasis are driven primarily by rare, or at least
infrequent, cancer stem cells then cancer might be more effec-
tively treated by specifically targeting the cancer stem cells
(Reya et al., 2001; Pardal et al., 2003; Dick, 2008). On the other
hand, if many cancer cells are capable of driving tumor growth
and metastasis it will be necessary to eliminate most or all
cancer cells.
Evidence suggests that small populations of cancer stem
cells drive the growth and progression of a number of cancers,
including some germ lineage cancers (Kleinsmith and Pierce,
1964; Illmensee and Mintz, 1976), myeloid leukemias (Lapidot
et al., 1994; Bonnet and Dick, 1997; Yilmaz et al., 2006;
Oravecz-Wilson et al., 2009), breast cancers (Al-Hajj et al.,
2003), gliomas (Singh et al., 2004), and colon cancers (Dalerba
Significance
Our results demonstrate that mouse MPNSTs contain high freqplantation into immunocompetent or immunocompromised mision pattern, and therefore the dependence of MPNST cells othat could be detected in some assays. Although laminin bindlaminin could either be intrinsic or extrinsic to MPNST cells. Tuphenotype, can therefore require different assay conditions to
240 Cancer Cell 21, 240–252, February 14, 2012 ª2012 Elsevier Inc.
et al., 2007; O’Brien et al., 2007; Ricci-Vitiani et al., 2007;
Merlos-Suarez et al., 2011). In each case, transplantation of
cancer cells into highly immunocompromised mice revealed
a small, phenotypically distinct subpopulation of cells that
was uniquely capable of transferring disease and forming
phenotypically diverse nontumorigenic progeny. This suggests
that some cancers are hierarchically organized, with small
numbers of cancer stem cells that sustain tumor growth
by forming large numbers of cancer cells with limited prolif-
erative potential (Reya et al., 2001; Pardal et al., 2003; Dick,
2008).
In contrast to this model, human melanomas (Quintana et al.,
2008, 2010), mouse melanomas (Held et al., 2010), and some
mouse leukemias (Kelly et al., 2007; Williams et al., 2007) have
many cells with tumorigenic potential. For example, 30% of
single cells obtained directly from melanomas in patients and
over 50% of cells obtained from primary mouse melanomas
can form tumors in highly immunocompromised mice (Quintana
uencies of tumorigenic cells, which were similar upon trans-ce. However, tumor genotype influenced the laminin expres-n exogenous laminin and the frequency of tumorigenic cellsing to b1-integrin was important for clonogenic growth, themors of different genotypes, even with the same malignantdetect the full range of cells with tumorigenic potential.

Cancer Cell
Tumor-Initiating Cells Are Common in MPNSTs
et al., 2008; Held et al., 2010; Quintana et al., 2010). These results
raise three critical questions.
(1) Is melanoma unique among solid cancers in having
common tumorigenic cells?
(2) Can high frequencies of tumorigenic cells be detected in
immunocompetent recipients for some cancers or does
the immune system play such a central role in the control
of tumor-initiating cells that common tumorigenic cells
can only be detected in immunocompromised recipients?
To address this question it is necessary to examine
mouse models of cancer, which can be transplanted
into syngeneic recipients without a confounding xenoge-
neic immune barrier that rejects human cells by mecha-
nisms that are very different from the autologous immune
responses that can occur within patients.
(3) Finally, what other factors influence the frequency of
cancer cells that can form tumors?
Malignant peripheral nerve sheath tumors (MPNSTs) are
aggressive soft tissue sarcomas that arise within peripheral
nerves. Most MPNSTs arise in the context of Neurofibromatosis
type 1, a hereditary tumor syndrome caused bymutations inNF1
that encodes Neurofibromin, a GTPase-activating protein that
negatively regulates Ras signaling (Rubin and Gutmann, 2005).
About 30% of NF1 patients develop benign plexiform neurofi-
bromas, which can transform into MPNSTs. Plexiform neurofi-
bromas and MPNSTs arise from Schwann cells in peripheral
nerves (Zhu et al., 2002; Joseph et al., 2008; Zheng et al.,
2008). Beyond the loss of NF1 function, CDKN2A (p16Ink4a),
CDKN2D (p14Arf; the human ortholog of mouse p19Arf), and
TP53 are often inactivated in MPNSTs by deletion or promoter
hypermethylation (Menon et al., 1990; Perrone et al., 2003; Age-
sen et al., 2005). Mutations of these genes in mice also lead to
the development of MPNSTs. Thus, mice that are heterozygous
for a deletion of both Nf1 and p53 (Nf1+/�; p53+/�; Cichowski
et al., 1999; Vogel et al., 1999) and mice heterozygous for Nf1
and deficient for Ink4a/Arf (Nf1+/�; Ink4a/Arf�/�; Joseph et al.,
2008) develop MPNSTs.
We developed in vitro and in vivo assays to determine the
frequency of MPNST cells with tumorigenic potential in these
mouse models of MPNST.
RESULTS
More Tumorigenic Cells Were Detected among PrimaryMPNST Cells from Nf1+/–; Ink4a/Arf–/– MiceNf1+/�; Ink4a/Arf�/� and Nf1+/�; p53+/� mice were backcrossed
onto a C57BL/Ka background (at least six generations) and then
aged to monitor the development of MPNSTs. Approximately
25% to 50% of Nf1+/�; Ink4a/Arf�/� mice and Nf1+/�;p53+/� mice developed MPNSTs on the legs and abdomens,
typically between 4 and 7 months of age, as previously reported
(Cichowski et al., 1999; Joseph et al., 2008). Tumors of both
genotypes grew rapidly and at comparable rates (data not
shown). Three of four primary and four of four secondary
MPNSTs from Nf1+/�; p53+/� mice exhibited p16Ink4a and
p19Arf expression, whereas p16Ink4a and p19Arf were not de-
tected in MPNSTs from Nf1+/�; Ink4a/Arf�/� mice, as expected
C
(Figure S1 available online). p53 was not detected in most
MPNSTs from Nf1+/�; p53+/� mice, as expected (Vogel et al.,
1999), but was detected in most MPNSTs from Nf1+/�; Ink4a/Arf�/� mice (data not shown).
We sacrificed Nf1+/�; Ink4a/Arf�/� and Nf1+/�; p53+/� mice at
6.1 ± 0.9 or 5.3 ± 1.4 (mean ± SD)months of age, respectively, for
analysis. Tumors of both genotypes contained tightly packed
spindle cells with tapered nuclei arranged in a fascicular pattern
(Figures 1A–1F). Of 25 tumors analyzed, 24 were focally positive
for the Schwann cell marker S100b (Figures 1A and 1D). In
tumors of both genotypes, we observed frequent mitotic figures
(an average of 1.1 ± 0.7 in Nf1+/�; Ink4a/Arf�/� MPNSTs and
1.6 ± 0.6 in Nf1+/�; p53+/� MPNSTs per high power field, objec-
tive x ocular magnification = 4003) and a high frequency of Ki-67
positive cells (39 ± 16% for Nf1+/�; Ink4a/Arf�/� and 52 ± 9% for
Nf1+/�; p53+/� MPNSTs; Figures 1C, 1F, and 1G).
We also administered bromo-deoxyuridine (BrdU) to tumor-
bearing mice. After 6 hr of administration, 10% and 14% of cells
were BrdU+ in primary MPNSTs from Nf1+/�; Ink4a/Arf�/� and
Nf1+/�; p53+/� mice, respectively. Similar results were obtained
when secondary MPNSTs were analyzed: 9% and 10 ± 6%
of cells from MPNSTs obtained from Nf1+/�; Ink4a/Arf�/� and
Nf1+/�; p53+/� mice incorporated BrdU, respectively. After 5 or
10 days of administration, over 80% of cells were BrdU+ in
MPNSTs of both genotypes (Figure 1H). MPNSTs from both
Nf1+/�; Ink4a/Arf�/� andNf1+/�; p53+/�mice therefore contained
similarly high frequencies of rapidly dividing cells.
To obtain MPNST cells for experiments, primary tumors of
comparable size from mice of both genotypes were enzymati-
cally dissociated and stained with antibodies. Only tumors that
were confirmed to be MPNSTs by histopathology were included
in our analysis. The cells were sorted by flow cytometry to
exclude debris (based on light scatter), dead cells (40,6-diami-
dino-2-phenylindole+ (DAPI+)), hematopoietic cells (Ter119+ or
CD45+), and endothelial cells (CD31+; Figure 1I). Viable cells
that were negative for hematopoietic/endothelial markers were
used in all experiments. These cells comprised an average of
48 ± 17% and 44 ± 14% (mean ± SD) of nucleated cells in
MPNSTs from Nf1+/�; Ink4a/Arf�/� and Nf1+/�; p53+/� mice,
respectively.
We injected MPNST cells subcutaneously, into sciatic nerves,
or under the kidney capsules of wild-type C57BL/Ka mice. The
kidney capsule is a common site for heterologous cell grafting,
where many cell types are able to efficiently engraft. We rarely
observed the formation of tumors after subcutaneous injection,
even when we injected large numbers of cells, but transplanted
cells readily formed tumors in sciatic nerve and under the kidney
capsule at higher cell doses (Table S1). At lower cell doses the
cells engrafted more efficiently under the kidney capsule, where
the cells were retained after injection (Table S1). Injection of cells
into the endoneurial space increased pressure within nerves and
led to the ejection of the injected material through the needle
track, rendering the assay nonquantitative in peripheral nerve.
For this reason, subsequent experiments to quantify the
frequency of cells with tumorigenic potential were conducted
by transplanting cells under the kidney capsule.
We transplanted aliquots of 100 cells, ten cells, or single cells
from ten primary MPNSTs obtained from Nf1+/�; Ink4a/Arf�/�
mice and eight primary MPNSTs from Nf1+/�; p53+/� mice under
ancer Cell 21, 240–252, February 14, 2012 ª2012 Elsevier Inc. 241

Nf1
+/-; p
53
+/-
Nf1
+/-; In
k4
aA
rf -/-
% K
i-67
posi
tive
cells
S100β H&E Ki-67
Ki-67
B CA
D
20
40
E F
G
% B
rdU
pos
itive
cel
ls
H
80
40
5d 5d10d 10d
00
I
H&ES100β
Forward Scatter
Side
Sca
tter
DAPI Ter119
CD
31/4
5
MPNST cellsfor clonogenic assays
hematopoieticand endothelialcells
dead cellscellsdebris
Forw
ard
Scat
ter
6hrs 6hrsp p pss s s s s
100µm
Nf1+/-
; p53+/-
Nf1+/-
; Ink4aArf -/-
Nf1+/-
;
Ink4aArf-/-
Nf1+/-
;
p53+/-
Figure 1. Nf1+/–; Ink4a/Arf–/– and Nf1+/–;
p53+/– Mice Develop MPNSTs that Contain
a High Frequency of Proliferating Cells
(A–F) Paraffin sections of Nf1+/�; Ink4a/Arf�/� and
Nf1+/�; p53+/� MPNSTs were stained with anti-
bodies against S100b (A and D), hematoxylin and
eosin (B and E), and antibodies against Ki-67 (C
and F). Sections were counterstained with hema-
toxylin (blue) in (A), (D), (C), and (F). Each panel
reflects a different section.
(G) The percentage of MPNST cells that were Ki-
67-positive was determined for four tumors of
each genotype on at least 20 high-power fields
(4003 magnification, ocular x objective) for each
tumor.
(H) The percentage of MPNST cells (that stained
negatively for blood or endothelial markers) inmice
bearing primary (p) or secondary (transplanted into
wild-type mice; s) MPNSTs treated with BrdU
for either 6 hr or 5 or 10 days that were BrdU-
positive. The data reflect one primary and eight
secondary tumors from Nf1+/�; Ink4a/Arf�/� mice
and three primary and nine secondary tumors
from Nf1+/�; p53+/� mice. All statistics represent
mean ± SD.
(I) Isolation of MPNST cells from primary tumors
using flow cytometry.
See also Figure S1 and Tables S1 and S2.
Cancer Cell
Tumor-Initiating Cells Are Common in MPNSTs
the kidney capsule of C57BL/Ka mice. We monitored the mice
for at least 15 weeks after transplantation. When tumors became
evident by palpation or at the end of the experiment, the mice
were sacrificed for gross and histological examination. Sorted
events from the debris fraction (Figure 1I) did not form tumors
upon transplantation and cells from the fractions that stained
positively for hematopoietic or endothelial markers rarely formed
tumors (Table S2). When viable MPNST cells from the nonhema-
topoietic/nonendothelial fraction of Nf1+/�; Ink4a/Arf�/� mice
were injected, 28 of 29 mice (97%) injected with 100 cells, 28
of 39 mice (72%) injected with 10 cells, and 16 of 76 mice
(21%) injected with single cells formed MPNSTs (Table 1).
Almost all of these tumors were observed within ten weeks after
transplantation and appeared histologically similar to the primary
tumors from which they derived (Figure S2A). Limit dilution anal-
ysis indicated that 18 ± 14% (mean ± SD; range = 6% to 53%) of
cells from primary MPNST formed tumors after transplantation.
Tumorigenic cells were therefore common within primary
MPNSTs obtained from Nf1+/�; Ink4a/Arf�/� mice.
When nonhematopoietic/nonendothelial cells from primary
tumors obtained from 8 Nf1+/�; p53+/� mice were injected, 24
of 37 mice (65%) injected with 100 cells, 6 of 43 mice (14%) in-
jected with 10 cells, and 2 of 38 mice (5%) injected with single
cells formed MPNSTs (Table 1). All of these tumors were
observed within ten weeks after transplantation and appeared
242 Cancer Cell 21, 240–252, February 14, 2012 ª2012 Elsevier Inc.
histologically similar to the primary
tumors from which they derived (Fig-
ure S2B). Limit dilution analysis indicated
that an average of 1.8 ± 1.6% (mean ±SD;
range = 0.6% to 5.0%) of cells from
these MPNSTs formed tumors after
transplantation. The frequency of tumorigenic cells in MPNSTs
from Nf1+/�; p53+/� mice was therefore significantly lower
(10-fold, p = 0.008) in this assay than in MPNSTs from Nf1+/�;Ink4a/Arf�/�mice. This demonstrates that MPNST genetic back-
ground can affect tumorigenic cell frequency.
MPNSTs from Nf1+/–; Ink4a/Arf–/– Mice Retain HigherFrequencies of Tumorigenic Cells upon SecondaryTransplantationWe wondered whether the reduced frequency of tumorigenic
cells within primary MPNSTs from Nf1+/�; p53+/� mice reflected
increased infiltration of normal cells into these tumors as
compared to MPNSTs from Nf1+/�; Ink4a/Arf�/� mice. To test
this, we performed secondary transplants of dissociated cells
from tumors that arose under the kidney capsule of primary
recipient mice. Transplanted MPNST cells form focal masses
that are distinct from normal kidney tissue. We reasoned that
only cancer cells would proliferate extensively in primary recip-
ient mice, reducing or eliminating normal cells from the
passaged tumors. Therefore, if normal cells within primary
MPNSTs from Nf1+/�; p53+/� mice diluted the cancer cells,
then secondary transplantation of these MPNSTs should elimi-
nate the difference in tumorigenic cell frequency among
MPNSTs of different genotypes. When MPNST cells from eleven
first-generation grafts from five different primary MPNSTs from

Table 1. Tumor Formation by Primary MPNST Cells
Tumor
Injected Cell Dose
(No. of Tumors/
No. of Injections)Cells that
Formed
Tumors (%)
95%
CI (%)100 Cells 10 Cells 1 Cell
Nf1+/�; Ink4a/Arf�/� mice
10 3/3 nd 1/8 13 1.9–95
11 1/2 1/2 2/6 16 4.3–61
12 5/5 4/6 6/8 27 11–65
14 3/3 4/4 0/8 18 6.6–48
15 3/3 3/6 0/7 6.0 2.1–18
16 4/4 6/6 4/10 53 22–100
17 4/4 4/5 1/9 15 5.9–37
23 nd nd 1/10 10 nd
29 nd 2/5 1/10 6.2 1.9-20
35 5/5 4/5 nd 16 5.4–48
Total 28/29
(97%)
28/39
(72%)
16/76
(21%)
18 6.8–55
Nf1+/�; p53+/� mice
1 1/3 0/4 1/10 0.7 0.1–3.0
3 4/5 0/5 nd 1.3 0.5–3.6
4 4/5 2/5 1/10 2.6 1.0–6.8
5 4/5 1/5 0/10 1.7 0.6–4.3
6 2/4 0/5 0/8 0.6 0.1–2.2
7 5/5 3/8 nd 5.0 1.8–13
8 4/6 0/5 nd 1.0 0.3–2.6
9 0/4 0/6 nd nd nd
Total 24/37
(65%)
6/43
(14%)
2/38
(5%)
1.8** 0.5–4.0
Tumorigenic cell frequency significantly differed in this assay between
MPNSTs from Nf1+/�; Ink4a/Arf�/� and Nf1+/�; p53+/� mice (**p = 0.008).
nd, not determined; CI, confidence interval.
For tumor histology, see Figure S2.
Table 2. Tumor Formation after Secondary Transplantation of
MPNST Cells
Tumor
Injected Cell Dose Cells that
Formed
Tumors (%)
95%
CI (%)100 Cells 10 Cells 1 Cell
Nf1+/�; Ink4a/Arf�/� mice
9 (N = 1) nd nd 4/8 50 nd
10 (N = 1) nd nd 5/9 56 nd
11 (N = 3) nd 3/3 8/25 40 21–76
12 (N = 4) nd 11/12 15/38 40 24–65
17 (N = 2) nd nd 12/19 58 nd
Total nd 14/15
(93%)
44/99
(44%)
49 22–71
Nf1+/�; p53+/� mice
3 (N = 2) 7/9 2/11 1/10 1.8 0.9–3.6
4 (N = 2) 3/10 0/10 0/10 0.3 0.1–1.0
5 (N = 1) 4/4 1/5 2/10 5.7 1.9–17
8 (N = 1) 3/4 3/6 nd 2.5 0.9–7.1
Total 17/27
(63%)
6/32
(19%)
3/30
(10%)
2.6** 0.9–7.3
Tumorigenic cell frequency significantly differed in this assay between
MPNSTs from Nf1+/�; Ink4a/Arf�/� and Nf1+/�; p53+/� mice (**, p =
2 3 10�5).
nd, not determined; CI, confidence interval.
Cancer Cell
Tumor-Initiating Cells Are Common in MPNSTs
Nf1+/�; Ink4a/Arf�/� mice were injected into secondary recipi-
ents, 14 of 15 (93%) ten-cell injections and 44 of 99 (44%)
single-cell injections gave rise to tumors (Table 2). Virtually all
tumors became palpable within ten weeks of transplantation.
Limit dilution analysis indicated that 49 ± 8.6% (mean ± SD;
range = 40% to 58%) of cells from each of these serially trans-
planted MPNST formed tumors after transplantation. Thus,
approximately half of the cells within MPNSTs are capable of
forming tumors by the time the MPNSTs have been passaged
once.
When MPNST cells from six first-generation grafts from four
primary MPNSTs from Nf1+/�; p53+/� mice were injected into
secondary recipients, 6 of 32 (19%) injections of 10 cells and 3
of 30 (10%) injections of single cells gave rise to tumors (Table
2). All tumors became palpable within ten weeks of transplanta-
tion. Limit dilution analysis indicated that an average of 2.6 ±
2.3% (mean ± SD; range = 0.3% to 5.7%) of cells from each of
these serially transplanted MPNSTs formed tumors after trans-
plantation. Thus, MPNSTs from Nf1+/�; Ink4a/Arf�/� mice re-
tained a significantly (19-fold; p = 2 3 10�5) higher frequency
of tumorigenic cells than MPNSTs from Nf1+/�; p53+/� mice,
C
even upon secondary transplantation. This suggests that the
reduced frequency of tumorigenic cells within primary MPNSTs
from Nf1+/�; p53+/� mice did not reflect the presence of normal
cells in these tumors.
MPNSTs from Nf1+/–; Ink4a/Arf–/– Mice Retain HigherFrequencies of Tumorigenic Cells upon Transplantationinto NOD/SCID ILR2gnull MiceTo test whether MPNST cells from Nf1+/�; p53+/� mice were
more immunogenic than MPNST cells from Nf1+/�; Ink4a/Arf�/�
mice we transplanted dissociated cells from primary MPNSTs
into immunocompetent C57BL/Ka recipients or into highly
immunocompromised NOD/SCID ILR2gnull mice, which lack B,
T, and natural killer cells (Shultz et al., 2005). We found that
16%–20% of cells from two primary MPNSTs from Nf1+/�;Ink4a/Arf�/� mice formed tumors irrespective of whether they
were transplanted into C57BL/Ka or NOD/SCID ILR2gnull mice.
Similarly, 1%–5% of MPNST cells from Nf1+/�; p53+/� mice
formed tumors in C57BL/Ka recipients and 0.6%–2.5% formed
tumors in NOD/SCID ILR2gnull recipients (Table 3). These results
indicate that the recipient immune system has little effect on the
frequency of MPNST cells that form tumors after transplantation,
irrespective of genotype, and the reduced frequency of tumori-
genic MPNST cells from Nf1+/�; p53+/� mice cannot be ex-
plained by increased immunogenicity.
Higher Percentage of MPNST Cells from Nf1+/–; Ink4a/
Arf–/– Mice Formed Colonies in Nonadherent Culture asCompared to Nf1+/–; p53+/– MiceWe cultured primary mouse MPNST cells, 1 cell/well in 96 well
plates for 10–14 days in nonadherent conditions (Molofsky
et al., 2003). We found that 35 ± 20% (mean ± SD) of MPNST
ancer Cell 21, 240–252, February 14, 2012 ª2012 Elsevier Inc. 243

Table 3. Tumor Formation by Primary MPNST Cells in Immunocompetent C57BL/Ka Mice and Immunocompromised NOD/SCID
ILR2gnull Mice
Tumor Recipient Mice
Injected Cell Dose
Tumorigenic Cells (%) 95% CI100 Cells 10 Cells 5 Cells
Nf1+/�; Ink4a/Arf�/� (35) C57BL/Ka 5/5 4/5 16 5.4–48
Nf1+/�; Ink4a/Arf�/� (35) NOD/SCID IL2Rgnull 5/5 4/5 16 5.4–48
Nf1+/�; Ink4a/Arf�/� (40) C57BL/Ka 4/7 17 6.2–46
Nf1+/�; Ink4a/Arf�/� (40) NOD/SCID IL2Rgnull 5/8 20 7.9–49
Nf1+/�; p53+/� (7) C57BL/Ka 5/5 3/8 5.0 1.8–13
Nf1+/�; p53+/� (7) NOD/SCID IL2Rgnull 4/5 3/7 2.5 1.0–6.5
Nf1+/�; p53+/� (28) C57BL/Ka 3/5 1/8 1.0 0.4–2.8
Nf1+/�; p53+/� (28) NOD/SCID IL2Rgnull 2/5 1/8 0.6 0.2–2.1
The frequency of tumorigenic cells and the 95% confidence interval (CI) around this frequency were determined by extreme limiting dilution (ELDA)
software (see Experimental Procedures for software URL).
Cancer Cell
Tumor-Initiating Cells Are Common in MPNSTs
cells from 12 differentNf1+/�; Ink4a/Arf�/�mice formed colonies,
and 62% of these colonies (62 of 100) formed tumors after trans-
plantation under the kidney capsule of C57BL/Ka mice. In
contrast, only 4.1 ± 3.4% of MPNST cells from 12 Nf1+/�;p53+/� mice formed colonies, and 32% of these colonies (13 of
40) formed tumors after transplantation into C57BL/Ka mice
(Table 4). Averaging across tumors, 23 ± 21% of single MPNST
cells from Nf1+/�; Ink4a/Arf�/� mice and 2.0 ± 2.9% of MPNST
cells from Nf1+/�; p53+/� mice formed tumorigenic colonies.
This indicates that tumorigenic cells were also significantly less
common (11-fold, p = 0.02) in MPNSTs from Nf1+/�; p53+/�
mice as compared toNf1+/�; Ink4a/Arf�/�mice, evenwhen these
cells were initially propagated in culture instead of transplanting
uncultured cells directly in vivo (as in Tables 1, 2, 3).
The reduced colony formation by MPNST cells from Nf1+/�;p53+/� mice was largely attributable to increased cell death as
compared to MPNST cells from Nf1+/�; Ink4a/Arf�/� mice. Ten
to 14 days after adding MPNST cells to culture, we carefully
examined the wells. We found that 43 ± 2.4% of wells in which
we had plated single MPNST cells from Nf1+/�; Ink4a/Arf�/�
mice did not contain any cells, indicating that these cells must
have undergone cell death. In contrast, 69 ± 13% of wells in
which we had plated single MPNST cells from Nf1+/�; p53+/�
mice did not contain any cells. This suggests that a significantly
(p = 0.02) higher percentage of single MPNST cells from Nf1+/�;p53+/� mice underwent cell death after being added to culture.
The remaining wells that did not contain colonies but were not
empty contained small numbers of cells (<10), indicating that
these cells underwent a limited number of divisions.
We examined the number of apoptotic cells in MPNSTs in vivo
and in MPNST cells cultured under nonadherent conditions
(Figure S3). MPNST tumors in Nf1+/�; Ink4a/Arf�/� and Nf1+/�;p53+/�mice in vivo contained similar frequencies of cleaved cas-
pase-3 positive cells. In culture, we found that a significantly
higher percentage of cells from Nf1+/�; p53+/� mice compared
to Nf1+/�; Ink4a/Arf�/� mice expressed cleaved caspase-3 after
12 days of culture (5.8 ± 3.4% versus 2.2 ± 2.4; mean ± SD; p =
0.03). MPNST cells from Nf1+/�; Ink4a/Arf�/� mice are therefore
more likely to survive nonadherent culture than MPNST cells
from Nf1+/�; p53+/� mice, even though no difference in the
frequency of apoptotic cells was observed in tumors in vivo.
This suggests that differences in the rate of cell death between
244 Cancer Cell 21, 240–252, February 14, 2012 ª2012 Elsevier Inc.
MPNSTs from different genetic backgrounds are context-
dependent. We therefore decided to explore whether changes
in assay conditions could increase the frequency of clonogenic
MPNST cells.
Laminin Is Expressed by More MPNST Cells in Nf1+/–;
Ink4a/Arf–/– Mice than in Nf1+/–; p53+/– MiceOne commonway of improving the growth and survival of cells in
culture is by growing cells adherently on extracellular matrix,
rather than nonadherently, as described above. Adherent culture
on laminin, in particular, enhances the growth and survival of
neural stem/progenitor cells and glioma cells (Sun et al., 2008;
Pollard et al., 2009; Lathia et al., 2010). Because MPNST cells
from Nf1+/�; p53+/� mice did not exhibit increased cell death
in vivo, in contrast to what was observed in culture, wewondered
whether MPNST cells were exposed to laminin in the tumor envi-
ronment in vivo. We examined the expression of laminin-111/-
211 (laminin a1/b1/g1 and a2/b1/g1) on sections through
MPNSTs from Nf1+/�; Ink4a/Arf�/� and Nf1+/�; p53+/� mice
(Figures 2A–2D). In MPNSTs fromNf1+/�; Ink4a/Arf�/�mice lam-
inin-111/-211 was widely expressed by most tumor cells,
including cancer cells and vascular/perivascular stromal cells
(Figures 2B and 2D). In contrast, in MPNSTs from Nf1+/�;p53+/� mice laminin appeared to be expressed by many fewer
cells and to be mainly vascular/perivascular (Figures 2A and 2C).
We found that dissociated MPNST cells from Nf1+/�; Ink4a/Arf�/� mice exhibited much stronger laminin-111/211 staining
than MPNST cells from Nf1+/�; p53+/� mice (Figure 2E). Indeed,
70 ± 11% of MPNST cells from Nf1+/�; Ink4a/Arf�/� mice and
28 ± 22% of MPNST cells from Nf1+/�; p53+/� mice stained
with laminin by flow cytometry. This demonstrates that most
MPNST cells from Nf1+/�; Ink4a/Arf�/� mice carry laminin with
them after dissociation, whereas only a minority of MPNST cells
from Nf1+/�; p53+/� mice do so. If laminin promotes the survival
or proliferation of MPNST cells, then MPNST cells from Nf1+/�;p53+/� mice would be expected to depend more upon exoge-
nous laminin, as compared to MPNST cells from Nf1+/�; Ink4a/Arf�/� mice.
We administered a 6 hr pulse of BrdU to mice and then stained
sections through their MPNSTs with antibodies against BrdU
and laminin-111/211 to assess the localization of dividing cells
relative to laminin-expressing cells. BrdU+ cells tended to

Table 4. Colony Formation by Single Primary MPNST Cells
Cultured under Nonadherent Conditions and Tumor Formation by
These Colonies after Transplantation In Vivo
Tumor
Single Cells
that Formed
Colonies (%)
Tumors/
Colonies
Injected (%)
Single Cells that
Formed Tumorigenic
Colonies (%)
Nf1+/�; Ink4a/Arf�/� mice
6 26 2/9 (22) 5.8
7 47 4/5 (80) 38
8 39 2/7 (29) 11
9 14 5/11 (45) 6.2
10 22 5/10 (50) 11
11 34 8/13 (62) 21
12 66 12/13 (92) 60
14 11 4/5 (80) 8.7
15 7.6 2/7 (29) 2.2
16 38 9/11 (82) 31
17 66 9/10 (90) 59
23 55 nd nd
Mean ± SD 35 ± 20 62/100 (62) 23 ± 21
Nf1+/�; p53+/� mice
1 10 nd nd
2 3.1 nd nd
3 6.1 0/10 (0) 0.0
4 2.4 1/5 (20) 0.5
5 0.5 nd nd
6 8.3 4/4 (100) 8.3
7 0.5 nd nd
8 5.6 4/10 (40) 2.2
9 1.6 nd nd
12 0.5 1/1 (100) 0.5
13 8.1 1/6 (17) 1.4
14 2.9 2/4 (50) 1.5
Mean ± SD 4.1 ± 3.4** 13/40 (32) 2.0 ± 2.9*
For each tumor, we determined the percentage of cells that formed colo-
nies in culture and the percentage of these colonies that formed tumors
upon transplantation into C57BL/Ka mice. The last column represents
the product of these statistics, that is, the percentage of MPNST cells
that formed tumorigenic colonies.
**p = 3 3 10�5; *p = 0.02. All statistics represent mean ± SD.
nd, not determined.
For data on cell death in culture, see Figure S3.
Cancer Cell
Tumor-Initiating Cells Are Common in MPNSTs
localize adjacent to laminin-expressing cells and regions of the
tumor that lacked laminin staining also had fewer dividing cells.
MPNSTs from Nf1+/�; Ink4a/Arf�/� and Nf1+/�; p53+/� mice
included 9 ± 5 and 8 ± 2% (mean ± SD) BrdU+ cells, respectively
(Figures 2F–2H). InMPNSTs fromNf1+/�; Ink4a/Arf�/�mice, lam-
inin was widely expressed such that almost all cells (88 ± 18%),
including nearly all BrdU+ cells (97 ± 1%), were adjacent to lam-
inin-stained cells (Figures 2F and 2H). However, in MPNSTs from
Nf1+/�; p53+/� mice, laminin was more restricted in its expres-
sion such that only 39 ± 6% of MPNST cells were adjacent to
laminin-stained cells. Yet, most BrdU+ cells (83 ± 7%) remained
adjacent to laminin-stained cells in these tumors (Figures 2G and
C
2H). Therefore, BrdU+ cells were more than twice as likely as all
MPNST cells to localize adjacent to laminin-expressing cells in
MPNSTs from Nf1+/�; p53+/� mice. This is consistent with the
possibility that laminin may promote the proliferation of MPNST
cells, though laminin staining may also be associated with
vasculature that promotes proliferation through other
mechanisms.
MPNSTs from Nf1+/–; p53+/– but Not Nf1+/–; Ink4a/Arf–/–
Mice Form More Colonies on LamininIf laminin promotes clonogenic growth by MPNST cells and
MPNST cells from Nf1+/�; p53+/� mice are less likely to carry
laminin after dissociation (Figure 2E), then exogenous laminin
might stimulate clonogenic growth by MPNST cells from
Nf1+/�; p53+/� mice to a greater extent than MPNST cells from
Nf1+/�; Ink4a/Arf�/� mice. To test this, we compared colony
formation by singleMPNST cells from both genetic backgrounds
in nonadherent cultures and in adherent cultures on laminin-111
(Figure 3A). Adherent culture on laminin did not affect the
percentage of MPNST cells from Nf1+/�; Ink4a/Arf�/� mice that
formed colonies compared to nonadherent cultures (Figure 3A);
however, it significantly increased the percentage of MPNST
cells from Nf1+/�; p53+/� mice that formed colonies from 6.7 ±
9.8% to 25 ± 18% (p = 0.003; Figure 3A). Although the
percentage of cells that formed colonies varied between tumors,
the rate of colony formation on laminin was always at least as
high as in nonadherent cultures, and the effect was statistically
significant in a paired t test (p = 0.003). Adherent culture on fibro-
nectin or collagen may have enhanced the rate of tumor forma-
tion to some extent, but the effects were variable among tumors
and not statistically significant (Table S3). Exposure to laminin
thus increased colony-formation by MPNST cells from Nf1+/�;p53+/� mice but not Nf1+/�; Ink4a/Arf�/� mice, consistent with
the difference in endogenous laminin expression between these
genetic backgrounds.
Adherent colonies grown on laminin by MPNST cells from
Nf1+/�; p53+/� mice, but not Nf1+/�; Ink4a/Arf�/� mice, also
tended to be larger than those that grew in nonadherent cultures
(data not shown). Consistent with this, a significantly higher
frequency of cells within colonies fromNf1+/�; p53+/�mice incor-
porated a pulse of BrdUwhen cultured on laminin-111 compared
to nonadherent culture conditions, whereas adherent culture on
laminin did not significantly affect the rate of BrdU incorporation
into colonies cultured fromNf1+/�; Ink4a/Arf�/�mice (Figure 3B).
To assess the proliferative potential of MPNST cells that
formed colonies on laminin, we dissociated the colonies that
arose from single cells and replated them into secondary
cultures. Twenty-three of 24 (96%) colonies from three primary
MPNSTs obtained from Nf1+/�; p53+/� mice gave rise to
secondary colonies, yielding an average of 2573 ± 626
secondary colonies per primary colony. An average of 30 ±
10% of cells within the primary colonies formed secondary colo-
nies upon replating. These results suggest that many MPNST
cells from Nf1+/�; p53+/� mice have the potential to proliferate
extensively if assayed under permissive conditions.
To assess whether colony-forming MPNST cells from Nf1+/�;p53+/� mice had the potential to form tumors in vivo, we disso-
ciated individual colonies and injected the cells under the
kidney capsule of C57BL/Ka mice. In these experiments,
ancer Cell 21, 240–252, February 14, 2012 ª2012 Elsevier Inc. 245

CD31
laminin
laminin
CD31/laminin
CD31/laminin
DAPI
A
laminin DAPIMECA-32
2n
da
ry a
nti-
bo
dy co
ntro
l
MECA-32/laminin
MECA-32 lamininMECA-32/laminin DAPI la
min
in-1
11/2
11la
min
in-1
11/2
11
70 ± 11%
28 ± 22%
BrdU/laminin-111/211 DAPI/laminin-111/211
BCD31 DAPI
DAPIC
D
F BrdU/laminin-111/211 DAPI/laminin-111/211G
H
E
goat anti-rabbitgoat anti-rat
100µm100µm
100µm
100µm
100µm
100µm
100µm
Nf1
+/-;
In
k4
aA
rf -/-
Nf1
+/-; p
53
+/-
Nf1
+/-;
In
k4
aA
rf -/-
Nf1
+/-; p
53
+/-
Nf1
+/-;
In
k4
aA
rf -/-
Nf1
+/-; p
53
+/-
Nf1+/-
; Ink4aArf -/-
Nf1+/-
; p53+/-
Figure 2. Laminin Is Expressed by Most
MPNST Cells from Nf1+/–; Ink4a/Arf–/– Mice
but Only by a Subset of MPNST Cells from
Nf1+/–; p53+/– Mice
(A–D) MPNSTs from Nf1+/�; p53+/� (A and C) and
Nf1+/�; Ink4a/Arf�/� (B and D) mice were stained
with antibodies against laminin-111/211, CD31,
andMECA-32 (to label endothelial cells), as well as
DAPI to identify nuclei.
(E) Dissociated MPNST cells, after exclusion of
blood and endothelial cells, were stained with
antibodies against laminin-111/211 and analyzed
by flow cytometry. Numbers reflect the
percentage of cells that stainedmore strongly than
isotype control (3-5 MPNSTs/genotype, p = 0.02
between the two genotypes).
(F–H) Mice bearing MPNSTs were treated with
BrdU for 6 hr and cryosections were stained with
DAPI, as well as antibodies against laminin-111/
211 and BrdU. In MPNSTs from Nf1+/�; p53+/�
mice, BrdU+ cells were 2.1-fold more likely (p =
0.04) than the average MPNST cell to localize
adjacent to laminin (the data reflect three tumors/
genotype and 2,200–3,200 cells/tumor). All
statistics are mean ± SD.
Cancer Cell
Tumor-Initiating Cells Are Common in MPNSTs
25 ± 18% of the MPNST cells formed adherent colonies on
laminin-111 and 36 of 54 colonies formed tumors in vivo (Fig-
ure 3C). Thus, 19 ± 13% of single MPNST cells from Nf1+/�;p53+/� mice formed tumorigenic colonies in the presence of
laminin-111. The histological appearance of the tumors that
arose from transplanted colonies was similar to primary
MPNSTs (Figure S4).
Given the increased colony formation by MPNST cells on lam-
inin, we tested whether the tumorigenicity of uncultured primary
MPNST cells in vivo was increased by mixing the cells with Ma-
trigel (of which laminin is the main component; Kleinman and
Martin, 2005). Suspension of primary MPNST cells in Matrigel
prior to injection approximately doubled the frequency MPNST
cells from both genetic backgrounds that formed tumors
(Figures 3D and 3E). Limit dilution analysis indicated that 4.7%
of primary MPNST cells from Nf1+/�; p53+/� mice and 30% of
primary MPNST cells from Nf1+/�; Ink4a/Arf�/� mice formed
tumors when injected under the kidney capsule with Matrigel.
These results further emphasize that the frequency of tumorigenic
246 Cancer Cell 21, 240–252, February 14, 2012 ª2012 Elsevier Inc.
MPNST cells varies with tumor genotype
and assay conditions and that many
primary MPNST cells are capable of
forming tumors in immunocompetent
mice.
To test whether endogenous laminin
expression distinguishes intrinsically
tumorigenic from intrinsically nontumori-
genic subpopulations of MPNST cells,
we sorted laminin-positive and laminin-
negative MPNST cells from both genetic
backgrounds and transplanted them
under the kidney capsule of C57BL/Ka
mice. Both laminin-positive and laminin-
negative MPNST cells formed tumors, though the rate of tumor
formation by the laminin-positive cells was significantly higher
in both genetic backgrounds (2.2-fold difference, p = 0.02 for
cells from Nf1+/�; Ink4a/Arf�/� mice; 2.5-fold difference, p =
0.049 for Nf1+/�; p53+/� mice; Figures 3F and 3G). Because
6.6% and 1.3% of laminin negative MPNST cells from Nf1+/�;Ink4a/Arf�/� mice and Nf1+/�; p53+/� mice, respectively, formed
tumors in vivo, our data do not support the idea that laminin nega-
tive cells intrinsically lack tumor-forming capacity. Rather, the
data suggest that laminin increases the clonogenic potential of
MPNST cells but that it does not matter whether the laminin is
intrinsic or extrinsic to the cells. It remains possible there is a hier-
archy of tumorigenic and nontumorigenic MPNST cells that can
be identified with other markers. Thus, our data demonstrate
thatmanyMPNSTcells arecapableof forming tumors, depending
on assay conditions and genetic background, but the formal
question of whether MPNSTs exhibit a hierarchical organization
consistent with the cancer stem cell model is not addressed by
our study.

BA
% c
olon
y fo
rmat
ion
by
sing
le c
ells
0
20
10
**
non-adherent
non-adherent
adherent
laminin
adherent
laminin
*
% B
rdU
pos
itive
cel
ls
0
20
60
non-adherent
adherent
laminin
non-adherent
adherent
laminin
DC
E
30
40
F
G
Nf1+/-
; Ink4aArf -/-
Nf1+/-
; Ink4aArf -/-
Nf1+/-
; p53+/-
Nf1+/-
; p53+/-
Figure 3. MPNST Cells from Nf1+/–; p53+/– Mice Formed More Colonies When Plated Adherently on Laminin
(A) Single MPNST cells from Nf1+/�; Ink4a/Arf�/� (N = 6) and Nf1+/�; p53+/� mice (N = 7) were sorted into individual wells of 96-well plates and cultured either
nonadherently or adherently on laminin-111. **, p = 0.003 by paired t test between adherent and nonadherent cultures of cells from Nf1+/�; p53+/� mice.
(B) 10,000 MPNST cells from Nf1+/�; Ink4a/Arf�/� or Nf1+/�; p53+/� mice (three tumors each) were cultured nonadherently or adherently on laminin-111 for
1–3 days. Then a 3 hr pulse of BrdU was administered (*p < 0.05). Error bars in (A) and (B) represent SD.
(C) Adherent colonies from single MPNST cells fromNf1+/�; p53+/�mice grown on laminin-111 were trypsinized, injected under the kidney capsules of C57BL/Ka
mice, and then monitored for the ability to form tumors for 15 weeks. The last column represents the percentage of MPNST cells that formed adherent colonies
and that went on to form tumors upon transplantation of the colonies in vivo (the product of columns 1 and 2). nd, not determined.
(D and E) Freshly isolated MPNST cells from Nf1+/�; p53+/� (D) or Nf1+/�; Ink4a/Arf�/� (E) mice were transplanted under the kidney capsule of C57BL/Ka mice,
with or without Matrigel, and then monitored for tumor formation for at least 15 weeks.
(F and G) Freshly dissociated laminin-positive or laminin-negative MPNST cells from Nf1+/�; p53+/� (F) or Nf1+/�; Ink4a/Arf�/� (G) mice were transplanted under
the kidney capsule of C57BL/Ka mice. Cells that stained positively for laminin were more likely to form tumors in both genetic backgrounds (p = 0.02 for Nf1+/�;Ink4a/Arf�/� mice and p = 0.049 for Nf1+/�; p53+/� mice, paired t test).
See also Table S3 and Figure S4.
Cancer Cell
Tumor-Initiating Cells Are Common in MPNSTs
Cancer Cell 21, 240–252, February 14, 2012 ª2012 Elsevier Inc. 247

A
inte
grin
α 1
inte
grin
β 1
inte
grin
α 2
inte
grin
α 6
% c
olon
y fo
rmat
ion
% c
olon
y fo
rmat
ion
plasticplastic lamininlaminin collagencollagen
α−β1Iso Iso Iso
∗ ∗
inte
grin
α 1
inte
grin
α 2
inte
grin
α 6
inte
grin
β 1
10
5
0
15
20
F
α−β1 α−β1α−β1Iso Iso Isoα−β1 α−β1
10
5
0
15
20
B
plastic + laminin isotype + lamininanti β1 integrin+ laminin200 µm
E
% c
olon
y fo
rmat
ion
Iso Iso Isoα-α1
10
5
0
% c
olon
y fo
rmat
ion
C D
15
10
5
0
15
2020
α-α1 α-α1 Iso Iso Isoα-α6 α-α6 α-α6
pERK-1/2β-actin
NA ALAP NA ALAP
tumor #12 tumor #28 H
plastic laminin collagen plastic laminin collagen
G
Nf1
+/-; p
53
+/-
Nf1
+/-;
In
k4
aA
rf -/-
Nf1
+/-;
p5
3+
/-
Nf1+/-
; Ink4aArf -/-
Nf1+/-
; p53+/-
Nf1+/-
; p53+/-
Nf1+/-
; p53+/-
Figure 4. MPNST Cells Expressed Laminin
Receptors and Blocking Antibodies against
b1 Integrin Decreased Colony Formation on
Laminin
(A and B) Expression of indicated integrins by
MPNST cells from Nf1+/�; p53+/� (A) and Nf1+/�;Ink4a/Arf�/� (B) mice. Numbers reflect the
percentages of cells that stained more strongly
than isotype control.
(C and D) Colony formation by MPNST cells from
Nf1+/�; p53+/� mice on the indicated substrate
treated with function-blocking antibodies against
a1 (C) or a6 (D) integrin. (Iso means isotype control
antibody.)
(E) Representative pictures of colonies formed by
MPNST cells from Nf1+/�; p53+/� mice in the
presence of function blocking antibodies against
b1 integrin or isotype control.
(F and G) The effect of blocking antibody against
b1 integrin on the percentage of cells that formed
colonies. *, p = 0.02 for Nf1+/�; p53+/�mice (F) and
p = 0.05 for Nf1+/�; Ink4a/Arf�/� (G) on laminin. No
significant difference on plastic or collagen.
(H) Western blots of extracts from MPNSTs cells
obtained from Nf1+/�; p53+/� mice using anti-
bodies against phospho-ERK1/2. Cells were
cultured for three days under nonadherent condi-
tions (NA), adherently on plastic (AP), or adherently
on laminin-111 (AL). Error bars represent SD.
See also Figure S5.
Cancer Cell
Tumor-Initiating Cells Are Common in MPNSTs
Laminin Promotes the Survival and Proliferation ofMPNST Cells via b1 Integrina1b1, a2b1, a3b1, a6b1, a7b1, and a6b4 integrins are laminin
receptors (Miner and Yurchenco, 2004). By flow cytometry, we
found that integrins a2, a6, and b1 were widely expressed on
the surface of MPNST cells fromNf1+/�; Ink4a/Arf�/� andNf1+/�;p53+/�mice (Figure 4A). Integrins a1 (Figure 4A) and b4 (data not
shown) were rarely expressed at detectable levels. Thus,
MPNST cells appear to express multiple laminin receptors,
including a2b1 and a6b1. Laminin-111/211 is also strongly ex-
pressed by basement membranes under the kidney capsule
(Figure S5), just as in MPNSTs (Figure 2), potentially explaining
why the kidney capsule creates a permissive environment for
tumor formation by MPNST cells.
We examined whether antibodies that block the binding of
laminin-111 to integrin receptors would impede colony forma-
248 Cancer Cell 21, 240–252, February 14, 2012 ª2012 Elsevier Inc.
tion. We were unable to find a preserva-
tive-free antibody against a2-integrin
suitable for use in these experiments.
Addition of blocking antibodies against
a1-integrin (Figure 4C) or a6-integrin (Fig-
ure 4D) to culture did not affect the
percentage of MPNST cells from Nf1+/�;p53+/� mice that formed colonies or the
size of colonies. In contrast, addition of
blocking antibodies against b1-integrin
(Milner and Campbell, 2002) but not
isotype control antibody significantly
decreased the percentage of MPNST
cells from Nf1+/�; p53+/� mice (Figure 4F)
and Nf1+/�; Ink4a/Arf�/� mice (Figure 4G) that formed colonies
on laminin-111, as well as the size of these colonies (Figure 4E),
but did not affect the percentage of cells that formed adherent
colonies on uncoated plastic or collagen 1 (Figures 4F and 4G).
These data demonstrate that laminin binding to b1-integrin-
containing receptors increases the clonogenicity of MPNST cells
from both genetic backgrounds.
Laminin promotes the survival of Schwann cells (Yu et al.,
2005), and MPNSTs arise from Schwann cells (Zhu et al., 2002;
Joseph et al., 2008; Zheng et al., 2008). Integrin receptors signal
through the ERK pathway (Guo and Giancotti, 2004), and ERK
provides a survival and proliferation signal to Schwann lineage
cells (Newbern et al., 2011) and MPNST cells (Ambrosini et al.,
2008). We found that adherent culture on laminin-111 increased
the levels of phosphorylated ERK1/2 in MPNST cells from some
Nf1+/�; p53+/� mice compared to nonadherent culture or

Cancer Cell
Tumor-Initiating Cells Are Common in MPNSTs
adherent culture on plastic (Figure 4H). Laminin binding to b1-
integrin may therefore promote the survival and proliferation of
MPNST cells by increasing ERK signaling.
DISCUSSION
Our data demonstrate that cells with tumorigenic potential are
common in MPNSTs of both genotypes but that tumors with
different genotypes sometimes require different assay condi-
tions to read-out the full spectrum of cells with tumorigenic
potential. If tumor genotype commonly influences the assay
conditions that must be used to detect tumorigenic cells then
assay conditions that detect the full spectrum of tumorigenic
cells in one cancer patient may not detect the full spectrum of
tumorigenic cells in other patients with the same cancer type.
Studies of mouse lung cancers (Curtis et al., 2010), mouse
mammary cancers (Vaillant et al., 2008), and mouse myeloid
leukemias (Somervaille and Cleary, 2006; Kennedy et al., 2007)
have shown that cancers from different genetic backgrounds
have different frequencies of tumorigenic cells, differences in
the extent to which they follow a cancer stem cell model, or
tumorigenic cells that express different markers. Human acute
lymphoblastic leukemia samples that differ with respect to
CDKN2A/B genotype also display differences in leukemogenic
cell frequencies in immunocompromised mice (Notta et al.,
2011). We demonstrate here that tumors of different genotypes
can have similarly high frequencies of cells with tumorigenic
potential but can require different assay conditions to detect
these tumorigenic cells. Furthermore, we show that sarcomas
sometimes contain common tumorigenic cells.
Our data suggest that the binding of laminin to b1-integrin-
containing receptors promotes the survival and proliferation of
MPNST cells. MPNST cells from Nf1+/�; p53+/� and Nf1+/�;Ink4a/Arf�/� mice depended upon the binding of laminin to b1-
integrin for proliferation and survival (Figure 4), but MPNST cells
from Nf1+/�; Ink4a/Arf�/� mice did not require the addition of
exogenous laminin to culture (Figures 3A and 3B), presumably
because these cells were much more likely to carry endogenous
laminin as compared to MPNST cells from Nf1+/�; p53+/� mice.
Suspension of MPNST cells from either genetic background in
Matrigel doubled the frequency of cells that formed tumors
in vivo (Figures 3D and 3E), and dividing cells in primary MPNSTs
in vivo almost always had contact with laminin-expressing cells
(Figures 2F–2H). Thus, laminin appears to be one important
determinant of clonogenicity in MPNST cells, but it does not
appear to matter whether the laminin is intrinsic or extrinsic to
the MPNST cells.
Our results raise the possibility that the failure to restore critical
extracellular matrix cues after tumor dissociation may lead to
underestimates of the frequency of tumor-initiating cells. The
common use of sphere-formation assays in nonadherent
cultures to identify tumor-initiating cells may exacerbate this
problem by depriving dissociated cancer cells of extracellular
matrix.
Our data demonstrate that melanoma is not unique among
solid tumors in containing common cells with tumorigenic poten-
tial. We have demonstrated that at least 30% of human mela-
noma cells obtained directly from patients have the potential to
form tumors upon transplantation into NOD/SCID ILR2gnull
C
mice (Quintana et al., 2008, 2010). An even higher percentage
of single cells obtained from primary mouse melanomas can
form tumors upon transplantation (Held et al., 2010). Whereas
some cancers are likely to have only rare cells with the potential
to proliferate extensively, other cancers are likely to contain
common tumorigenic cells, and it remains uncertain what frac-
tion of cancers fall in each category. Some mouse leukemias
contain common leukemogenic cells (Somervaille and Cleary,
2006; Kelly et al., 2007; Williams et al., 2007). However, other
hematopoietic malignancies contain only rare leukemogenic
cells (Lapidot et al., 1994; Kennedy et al., 2007), even when
mouse leukemias are transplanted into histocompatible mice
(Yilmaz et al., 2006; Oravecz-Wilson et al., 2009). A recent study
discovered that human hematopoietic stem cells engraft more
efficiently in female as compared to male mice (Notta et al.,
2010), a variable that has rarely been taken into account in
xenotransplantation experiments. Thus, whereas many solid
cancers have appeared to contain only rare tumorigenic cells
(Ishizawa et al., 2010), an open question concerns the extent
to which existing assays underestimate the frequency of cells
with tumorigenic potential.
Our observation that approximately 20% of MPNST cells from
Nf1+/�; p53+/� and Nf1+/�; Ink4a/Arf�/� mice have the potential
to form tumors is likely an underestimate, because there are
likely to be important features of the tumor environment that
are not adequately modeled in the tumorigenesis assays we
used. For example, it is possible that tumor-associated fibro-
blasts or tumor-infiltrating inflammatory cells promote the
survival or proliferation of MPNST cells (Le et al., 2009; Staser
et al., 2010) in a way that is not initially replicated when we place
small numbers of dissociated MPNST cells in culture or under
the kidney capsule in vivo. More sophisticated models of this
tumor microenvironment could reveal even higher frequencies
of MPNST cells that have the potential to form tumors.
Although we found that cells with tumorigenic potential were
common in mouse MPNSTs, a separate question concerns the
spectrum of cells that are actually fated to contribute to disease
progression in vivo. Our data demonstrating that many cells
divide rapidly within MPNSTs (Figure 1H) suggests that many
cells contribute to tumor growth. However, it is also possible
that many of these cells divide only a limited number of times
and that only a small fraction of the cells with the potential to
proliferate extensively actually does so in vivo. Fate-mapping
studies will be required to assess whether many or few MPNST
cells actually contribute extensively to tumor growth or disease
progression in vivo.
The question of whether MPNSTs follow a cancer stem cell
model, in which cancer cells are hierarchically organized into
intrinsically different subpopulations of tumorigenic and nontu-
morigenic cells, also remains an open question. One possibility
is that MPNSTs contain common tumorigenic cells with no hier-
archical organization. Another possibility is that MPNSTs contain
a shallow hierarchy in which common tumorigenic cells differen-
tiate into nontumorigenic MPNST cells. Even if the latter is the
case, MPNST would be quite different from other cancers sug-
gested to follow the cancer stem cell model.
Our data demonstrate that cells with tumorigenic potential are
common in MPNSTs and that tumors from different genetic
backgrounds can require different assay conditions to read-out
ancer Cell 21, 240–252, February 14, 2012 ª2012 Elsevier Inc. 249

Cancer Cell
Tumor-Initiating Cells Are Common in MPNSTs
the full spectrum of cells with tumorigenic potential. This
suggests that efforts to quantify the frequency of tumorigenic
cells in human cancers may be complicated by confounding
effects of tumor genotype on assay conditions. As assays
improve it is likely that estimates of tumorigenic cell frequencies
will continue to increase in many cancers. It remains to be deter-
mined what fraction of cancers have only rare tumorigenic cells
and what fraction of cancers have common tumorigenic cells.
Determining which cancers fall in each category has funda-
mental implications for therapy as attempts to target small
subpopulations of cancer cells are not likely to improve the
treatment of cancers in which many cells can drive disease
progression.
EXPERIMENTAL PROCEDURES
Mice
Nf1+/� (Jacks et al., 1994)mice were bred with Ink4aArf�/�mice (Serrano et al.,
1996) to yield compoundmutantNf1+/�; Ink4a/Arf�/�mice (Joseph et al., 2008).
Nf1+/�; Ink4a/Arf�/�mice andNf1+/�; p53+/�mice (Cichowski et al., 1999) were
backcrossed on aC57BL/Kabackground for at least six generations. Genotyp-
ingwas performed as described by Joseph et al. (2008). All animal experiments
were performed in accordance with protocols approved by the University of
Michigan’s Committee on the Use and Care of Animals.
Dissociation of MPNSTs and Flow Cytometry
Tumors were harvested from mice and minced using a scalpel. Minced tissue
was washed in Ca2+ and Mg2+-free Hank’s buffered salt solution (HBSS; Invi-
trogen, Grand Island, NY, USA), centrifuged, and treated for 20 min at 37�Cwith a mixture of 25% Ca2+ and Mg2+-free HBSS, 25% Collagenase IV (Wor-
thington [Lakewood, NJ, USA]; resuspended to 2,000 U/ml in HBSS containing
Ca2+ and Mg2+, Invitrogen), and 50% Trypsin-EDTA solution (0.05%, Invitro-
gen) with constant agitation. The reaction was quenched with staining medium
consisting of L15 medium (Invitrogen), 1 mg/ml BSA (Sigma-Aldrich, St. Louis,
MO, USA), 10 mM HEPES (BioWhittaker # 17-738E), 1% penicillin/strepto-
mycin (Invitrogen), supplemented with DNase 1 (100 U/ml; Sigma), and filtered
through 70 mm nylon filter (Fisher Scientific, Ottawa, Ontario). The cells were
centrifuged, resuspended in staining medium, and then counted on a hemocy-
tometer. Cells were stained with antibodies against CD31 (BioLegend, San
Diego, CA, USA), CD45 (eBioscience, San Diego, CA, USA), and Ter119
(BioLegend) in 200 ml of staining medium for 20 min at 4�C. The cells were
then washed and resuspended in staining medium supplemented with DAPI
(10 mg/ml; Sigma). To evaluate the expression of laminin receptors, cells
were stained with antibodies against integrin a1 (BD Biosciences, San Diego,
CA, USA), a2 (BD Biosciences), a6 (eBioscience), and integrin b1 (BD Biosci-
ences), as well as appropriate secondary antibodies prior to staining with
blood lineage markers. Flow cytometry was performed with a FACSVantage
SE-dual laser, three-line flow cytometer, or with a FACSAria II (Becton Dickin-
son, Franklin Lakes, NJ, USA).
Cell Culture
Cells were typically cultured in 96-well tissue culture plates (Corning, Lowell,
MA, USA) at a density of 1 cell/well. For nonadherent cultures, ultra-low
binding plates (Corning) were used. For adherent cultures, plates were coated
with fibronectin (Biomedical Technologies, Stoughton, MA, USA), laminin-111
(Invitrogen), or collagen-1 (BD Bioscience), all at 50mg/ml. The culture medium
for both adherent and nonadherent cultures was based on a 5:3mixture of Dul-
becco’s modified eagle medium -low:Neurobasal medium (Invitrogen). The
medium was supplemented with 15% chick embryo extract (prepared as
described; Stemple and Anderson, 1992), 20 ng/ml recombinant human
bFGF (R&D Systems, Minneapolis, MN), 20 ng/ml IGF1 (R&D Systems), 1%
N2 supplement (Invitrogen), 2% B27 supplement (Invitrogen), 50 mM 2-mer-
captoethanol (Acros Organics), 35 ng/ml retinoic acid (Sigma), and 1% peni-
cillin/streptomycin (Invitrogen). In some cases, themediumwas supplemented
with laminin-111 or fibronectin, both at 50 mg/ml. All cultures were maintained
at 37�C in 6% CO2/balance air. For experiments using blocking antibodies,
250 Cancer Cell 21, 240–252, February 14, 2012 ª2012 Elsevier Inc.
cells were cultured at a density of 50–100 cells/well on 24-well plates on plastic
or laminin-111 (50 mg/ml) in the presence or absence of antibodies against
integrin a1 (BD Bioscience), a6 (clone GoH3; R&D Systems), or b1 (BD Biosci-
ence) or corresponding isotype controls (all at 10 mg/ml). Colony formationwas
assessed after 5–8 days.
Kidney Capsule Injections
MPNST cells were resuspended in 30 ml of sterile staining medium. Mice were
anesthetized by intraperitoneal injection of ketamine/xylazine. After shaving
the skin and prepping with betadine (Fisher Scientific), a 1 cm longitudinal
incision was made in the skin of the abdomen and in the body wall above
the kidney. Cell suspensions were injected under the capsule of the exposed
kidney using an insulin syringe with a 31G needle (BD Bioscience). In some
cases, 50% Matrigel (BD Bioscience) was added to the cell suspension. The
incisions were closed using absorbable suture (Tevdek, Genzyme Surgical
#7-734). Animals were given antibiotic water (1.1 g/l neomycin sulfate and
106 U/l polymixin B sulfate) and monitored closely. Tumor formation was
assessed by weekly palpation of the abdomen or by magnetic resonance
imaging for at least 15 weeks. The frequency of tumorigenic cells and the
95% confidence interval were calculated using extreme limiting dilution soft-
ware (http://bioinf.wehi.edu.au/software/elda/index.html).
SUPPLEMENTAL INFORMATION
Supplemental Information includes five figures, three tables, and Supple-
mental Experimental Procedures and can be found with this article online at
doi:10.1016/j.ccr.2011.12.027.
ACKNOWLEDGMENTS
This work was supported by the National Institute of Neurological Disorder and
Stroke (grant NS-040750), the Howard HughesMedical Institute, and the Liddy
Shriver Sarcoma Initiative. J.B. was supported by postdoctoral fellowships
from the Swiss National Foundation of Science and the Children’s Tumor
Foundation. Thanks to Kristina Harter for technical assistance. Thanks to
David Adams and Martin White for assistance with flow cytometry, which
was partially supported by the University of Michigan (UM) Comprehensive
Cancer Center (National Institutes of Health grant CA46592). Thanks to Maria
Ripberger, Alan Burgess, and Nancy McAnsh for paraffin embedding,
sectioning, and immunohistochemistry. Thanks to Amanda Welton in the UM
Center for Molecular Imaging for magnetic resonance imaging. Thanks to Tyler
Jacks for providingNf1 germline knockout mice, Tyler Jacks and Karlyne Reilly
for providing Nf1+/�; p53+/� mice, and Ron DePinho for providing Ink4a/Arf
mutant mice.
Received: December 7, 2010
Revised: October 12, 2011
Accepted: December 26, 2011
Published: February 13, 2012
REFERENCES
Agesen, T.H., Flørenes, V.A., Molenaar, W.M., Lind, G.E., Berner, J.M., Plaat,
B.E., Komdeur, R., Myklebost, O., van den Berg, E., and Lothe, R.A. (2005).
Expression patterns of cell cycle components in sporadic and neurofibroma-
tosis type 1-related malignant peripheral nerve sheath tumors.
J. Neuropathol. Exp. Neurol. 64, 74–81.
Al-Hajj, M., Wicha, M.S., Benito-Hernandez, A., Morrison, S.J., and Clarke,
M.F. (2003). Prospective identification of tumorigenic breast cancer cells.
Proc. Natl. Acad. Sci. USA 100, 3983–3988.
Ambrosini, G., Cheema, H.S., Seelman, S., Teed, A., Sambol, E.B., Singer, S.,
and Schwartz, G.K. (2008). Sorafenib inhibits growth and mitogen-activated
protein kinase signaling in malignant peripheral nerve sheath cells. Mol.
Cancer Ther. 7, 890–896.
Bonnet, D., and Dick, J.E. (1997). Human acute myeloid leukemia is organized
as a hierarchy that originates from a primitive hematopoietic cell. Nat. Med. 3,
730–737.

Cancer Cell
Tumor-Initiating Cells Are Common in MPNSTs
Cichowski, K., Shih, T.S., Schmitt, E., Santiago, S., Reilly, K., McLaughlin,
M.E., Bronson, R.T., and Jacks, T. (1999). Mouse models of tumor develop-
ment in neurofibromatosis type 1. Science 286, 2172–2176.
Curtis, S.J., Sinkevicius, K.W., Li, D., Lau, A.N., Roach, R.R., Zamponi, R.,
Woolfenden, A.E., Kirsch, D.G., Wong, K.K., and Kim, C.F. (2010). Primary
tumor genotype is an important determinant in identification of lung cancer
propagating cells. Cell Stem Cell 7, 127–133.
Dalerba, P., Dylla, S.J., Park, I.K., Liu, R., Wang, X., Cho, R.W., Hoey, T.,
Gurney, A., Huang, E.H., Simeone, D.M., et al. (2007). Phenotypic character-
ization of human colorectal cancer stem cells. Proc. Natl. Acad. Sci. USA
104, 10158–10163.
Dick, J.E. (2008). Stem cell concepts renew cancer research. Blood 112, 4793–
4807.
Guo, W., and Giancotti, F.G. (2004). Integrin signalling during tumour progres-
sion. Nat. Rev. Mol. Cell Biol. 5, 816–826.
Held, M.A., Curley, D.P., Dankort, D., McMahon, M., Muthusamy, V., and
Bosenberg, M.W. (2010). Characterization of melanoma cells capable of
propagating tumors from a single cell. Cancer Res. 70, 388–397.
Illmensee, K., and Mintz, B. (1976). Totipotency and normal differentiation of
single teratocarcinoma cells cloned by injection into blastocysts. Proc. Natl.
Acad. Sci. USA 73, 549–553.
Ishizawa, K., Rasheed, Z.A., Karisch, R., Wang, Q., Kowalski, J., Susky, E.,
Pereira, K., Karamboulas, C., Moghal, N., Rajeshkumar, N.V., et al. (2010).
Tumor-initiating cells are rare in many human tumors. Cell Stem Cell 7,
279–282.
Jacks, T., Shih, T.S., Schmitt, E.M., Bronson, R.T., Bernards, A., and
Weinberg, R.A. (1994). Tumour predisposition in mice heterozygous for a tar-
geted mutation in Nf1. Nat. Genet. 7, 353–361.
Joseph, N.M., Mosher, J.T., Buchstaller, J., Snider, P., McKeever, P.E., Lim,
M., Conway, S.J., Parada, L.F., Zhu, Y., and Morrison, S.J. (2008). The loss
of Nf1 transiently promotes self-renewal but not tumorigenesis by neural crest
stem cells. Cancer Cell 13, 129–140.
Kelly, P.N., Dakic, A., Adams, J.M., Nutt, S.L., and Strasser, A. (2007). Tumor
growth need not be driven by rare cancer stem cells. Science 317, 337.
Kennedy, J.A., Barabe, F., Poeppl, A.G., Wang, J.C., and Dick, J.E. (2007).
Comment on ‘‘Tumor growth need not be driven by rare cancer stem cells.’’
Science 318, 1722.
Kleinman, H.K., andMartin, G.R. (2005). Matrigel: basement membrane matrix
with biological activity. Semin. Cancer Biol. 15, 378–386.
Kleinsmith, L.J., and Pierce, G.B., Jr. (1964). Multipotentiality of single embry-
onal carcinoma cells. Cancer Res. 24, 1544–1551.
Lapidot, T., Sirard, C., Vormoor, J., Murdoch, B., Hoang, T., Caceres-Cortes,
J., Minden, M., Paterson, B., Caligiuri, M.A., and Dick, J.E. (1994). A cell initi-
ating human acute myeloid leukemia after transplantation into SCID mice.
Nature 367, 645–648.
Lathia, J.D., Gallagher, J., Heddleston, J.M., Wang, J., Eyler, C.E.,
Macswords, J., Wu, Q., Vasanji, A., McLendon, R.E., Hjelmeland, A.B., and
Rich, J.N. (2010). Integrin alpha 6 regulates glioblastoma stem cells. Cell
Stem Cell 6, 421–432.
Le, L.Q., Shipman, T., Burns, D.K., and Parada, L.F. (2009). Cell of origin and
microenvironment contribution for NF1-associated dermal neurofibromas.
Cell Stem Cell 4, 453–463.
Menon, A.G., Anderson, K.M., Riccardi, V.M., Chung, R.Y., Whaley, J.M.,
Yandell, D.W., Farmer, G.E., Freiman, R.N., Lee, J.K., Li, F.P., et al. (1990).
Chromosome 17p deletions and p53 gene mutations associated with the
formation of malignant neurofibrosarcomas in von Recklinghausen neurofibro-
matosis. Proc. Natl. Acad. Sci. USA 87, 5435–5439.
Merlos-Suarez, A., Barriga, F.M., Jung, P., Iglesias, M., Cespedes, M.V.,
Rossell, D., Sevillano, M., Hernando-Momblona, X., da Silva-Diz, V., Munoz,
P., et al. (2011). The intestinal stem cell signature identifies colorectal cancer
stem cells and predicts disease relapse. Cell Stem Cell 8, 511–524.
Milner, R., and Campbell, I.L. (2002). Cytokines regulate microglial adhesion to
laminin and astrocyte extracellular matrix via protein kinase C-dependent acti-
vation of the alpha6beta1 integrin. J. Neurosci. 22, 1562–1572.
C
Miner, J.H., and Yurchenco, P.D. (2004). Laminin functions in tissue morpho-
genesis. Annu. Rev. Cell Dev. Biol. 20, 255–284.
Molofsky, A.V., Pardal, R., Iwashita, T., Park, I.K., Clarke, M.F., and Morrison,
S.J. (2003). Bmi-1 dependence distinguishes neural stem cell self-renewal
from progenitor proliferation. Nature 425, 962–967.
Newbern, J.M., Li, X., Shoemaker, S.E., Zhou, J., Zhong, J., Wu, Y., Bonder,
D., Hollenback, S., Coppola, G., Geschwind, D.H., et al. (2011). Specific func-
tions for ERK/MAPK signaling during PNS development. Neuron 69, 91–105.
Notta, F., Doulatov, S., and Dick, J.E. (2010). Engraftment of human hemato-
poietic stem cells is more efficient in female NOD/SCID/IL-2Rgcnull recipients.
Blood 115, 3704–3707.
Notta, F., Mullighan, C.G., Wang, J.C., Poeppl, A., Doulatov, S., Phillips, L.A.,
Ma, J., Minden, M.D., Downing, J.R., and Dick, J.E. (2011). Evolution of human
BCR-ABL1 lymphoblastic leukaemia-initiating cells. Nature 469, 362–367.
O’Brien, C.A., Pollett, A., Gallinger, S., and Dick, J.E. (2007). A human colon
cancer cell capable of initiating tumour growth in immunodeficient mice.
Nature 445, 106–110.
Oravecz-Wilson, K.I., Philips, S.T., Yilmaz, O.H., Ames, H.M., Li, L., Crawford,
B.D., Gauvin, A.M., Lucas, P.C., Sitwala, K., Downing, J.R., et al. (2009).
Persistence of leukemia-initiating cells in a conditional knockin model of an im-
atinib-responsive myeloproliferative disorder. Cancer Cell 16, 137–148.
Pardal, R., Clarke, M.F., and Morrison, S.J. (2003). Applying the principles of
stem-cell biology to cancer. Nat. Rev. Cancer 3, 895–902.
Perrone, F., Tabano, S., Colombo, F., Dagrada, G., Birindelli, S., Gronchi, A.,
Colecchia, M., Pierotti, M.A., and Pilotti, S. (2003). p15INK4b, p14ARF, and
p16INK4a inactivation in sporadic and neurofibromatosis type 1-relatedmalig-
nant peripheral nerve sheath tumors. Clin. Cancer Res. 9, 4132–4138.
Pollard, S.M., Yoshikawa, K., Clarke, I.D., Danovi, D., Stricker, S., Russell, R.,
Bayani, J., Head, R., Lee, M., Bernstein, M., et al. (2009). Glioma stem cell lines
expanded in adherent culture have tumor-specific phenotypes and are suit-
able for chemical and genetic screens. Cell Stem Cell 4, 568–580.
Quintana, E., Shackleton, M., Sabel, M.S., Fullen, D.R., Johnson, T.M., and
Morrison, S.J. (2008). Efficient tumour formation by single human melanoma
cells. Nature 456, 593–598.
Quintana, E., Shackleton, M., Foster, H.R., Fullen, D.R., Sabel, M.S., Johnson,
T.M., and Morrison, S.J. (2010). Phenotypic heterogeneity among tumorigenic
melanoma cells from patients that is reversible and not hierarchically orga-
nized. Cancer Cell 18, 510–523.
Reya, T., Morrison, S.J., Clarke, M.F., and Weissman, I.L. (2001). Stem cells,
cancer, and cancer stem cells. Nature 414, 105–111.
Ricci-Vitiani, L., Lombardi, D.G., Pilozzi, E., Biffoni, M., Todaro, M., Peschle,
C., and De Maria, R. (2007). Identification and expansion of human colon-
cancer-initiating cells. Nature 445, 111–115.
Rubin, J.B., and Gutmann, D.H. (2005). Neurofibromatosis type 1 - a model for
nervous system tumour formation? Nat. Rev. Cancer 5, 557–564.
Serrano, M., Lee, H., Chin, L., Cordon-Cardo, C., Beach, D., and DePinho, R.A.
(1996). Role of the INK4a locus in tumor suppression and cell mortality. Cell 85,
27–37.
Shultz, L.D., Lyons, B.L., Burzenski, L.M., Gott, B., Chen, X., Chaleff, S., Kotb,
M., Gillies, S.D., King, M., Mangada, J., et al. (2005). Human lymphoid and
myeloid cell development in NOD/LtSz-scid IL2R gamma null mice engrafted
with mobilized human hemopoietic stem cells. J. Immunol. 174, 6477–6489.
Singh, S.K., Hawkins, C., Clarke, I.D., Squire, J.A., Bayani, J., Hide, T.,
Henkelman, R.M., Cusimano, M.D., and Dirks, P.B. (2004). Identification of
human brain tumour initiating cells. Nature 432, 396–401.
Somervaille, T.C., and Cleary, M.L. (2006). Identification and characterization
of leukemia stem cells in murine MLL-AF9 acute myeloid leukemia. Cancer
Cell 10, 257–268.
Staser, K., Yang, F.C., and Clapp, D.W. (2010). Mast cells and the neurofi-
broma microenvironment. Blood 116, 157–164.
Stemple, D.L., and Anderson, D.J. (1992). Isolation of a stem cell for neurons
and glia from the mammalian neural crest. Cell 71, 973–985.
ancer Cell 21, 240–252, February 14, 2012 ª2012 Elsevier Inc. 251

Cancer Cell
Tumor-Initiating Cells Are Common in MPNSTs
Sun, Y., Pollard, S., Conti, L., Toselli, M., Biella, G., Parkin, G., Willatt, L., Falk,
A., Cattaneo, E., and Smith, A. (2008). Long-term tripotent differentiation
capacity of human neural stem (NS) cells in adherent culture. Mol. Cell.
Neurosci. 38, 245–258.
Vaillant, F., Asselin-Labat,M.L., Shackleton, M., Forrest, N.C., Lindeman, G.J.,
and Visvader, J.E. (2008). Themammary progenitor marker CD61/beta3 integ-
rin identifies cancer stem cells in mouse models of mammary tumorigenesis.
Cancer Res. 68, 7711–7717.
Vogel, K.S., Klesse, L.J., Velasco-Miguel, S., Meyers, K., Rushing, E.J., and
Parada, L.F. (1999). Mouse tumor model for neurofibromatosis type 1.
Science 286, 2176–2179.
Williams, R.T., den Besten, W., and Sherr, C.J. (2007). Cytokine-dependent
imatinib resistance in mouse BCR-ABL+, Arf-null lymphoblastic leukemia.
Genes Dev. 21, 2283–2287.
252 Cancer Cell 21, 240–252, February 14, 2012 ª2012 Elsevier Inc.
Yilmaz, O.H., Valdez, R., Theisen, B.K., Guo, W., Ferguson, D.O., Wu, H., and
Morrison, S.J. (2006). Pten dependence distinguishes haematopoietic stem
cells from leukaemia-initiating cells. Nature 441, 475–482.
Yu, W.M., Feltri, M.L., Wrabetz, L., Strickland, S., and Chen, Z.L. (2005).
Schwann cell-specific ablation of laminin gamma1 causes apoptosis and
prevents proliferation. J. Neurosci. 25, 4463–4472.
Zheng, H., Chang, L., Patel, N., Yang, J., Lowe, L., Burns, D.K., and Zhu, Y.
(2008). Induction of abnormal proliferation by nonmyelinating schwann cells
triggers neurofibroma formation. Cancer Cell 13, 117–128.
Zhu, Y., Ghosh, P., Charnay, P., Burns, D.K., and Parada, L.F. (2002).
Neurofibromas in NF1: Schwann cell origin and role of tumor environment.
Science 296, 920–922.

Cancer Cell
Article
Adult Murine Prostate Basal and Luminal CellsAre Self-Sustained Lineages that Can Both Serveas Targets for Prostate Cancer InitiationNahyun Choi,1,4 Boyu Zhang,1,4 Li Zhang,1 Michael Ittmann,2,3 and Li Xin1,2,3,*1Department of Molecular and Cellular Biology2Department of Pathology and Immunology3Dan L. Duncan Cancer CenterBaylor College of Medicine, One Baylor Plaza, Houston, TX 77030, USA4These authors contributed equally to this work
*Correspondence: [email protected]
DOI 10.1016/j.ccr.2012.01.005
SUMMARY
The prostate epithelial lineage hierarchy and the cellular origin for prostate cancer remain inadequatelydefined. Using a lineage-tracing approach, we show that adult rodent prostate basal and luminal cells areindependently self-sustained in vivo. Disrupting the tumor suppressor Pten in either lineage led to prostatecancer initiation. However, the cellular composition and onset dynamics of the resulting tumors are distinc-tive. Prostate luminal cells are more responsive to Pten null-induced mitogenic signaling. In contrast, basalcells are resistant to direct transformation. Instead, loss of Pten activity induces the capability of basal cells todifferentiate into transformation-competent luminal cells. Our study suggests that deregulation of epithelialdifferentiation is a critical step for the initiation of prostate cancers of basal cell origin.
INTRODUCTION cancer remains unclear, partly because the prostate epithelia
Defining the cells of origin for cancer is of great value for accu-
rate tumor prognosis and efficient prevention and therapeutics
(Visvader, 2011). Previously, the identities of the cells of origin
for cancer were assumed based on histological characteriza-
tion of cancers. However, recent transcriptome studies have
revealed that molecular signatures of cancer cells do not
always match their histological appearance (Lim et al., 2009).
Therefore, it can be misleading to determine cells of origin in
the absence of functional lineage-tracing studies (Molyneux
et al., 2010).
Though prostate cancer is the second leading cause of
cancer-related death in males in the United States, it is still
mainly described by qualitative clinical measurements, including
the TNM system and the Gleason grading system (Iczkowski
and Lucia, 2011). The identity of the cellular origin for prostate
Significance
Understanding the cellular origin for cancer can help improvedirectly demonstrate that prostate cancer can initiate from bothcells are less susceptible than luminal cells to direct transforrequires oncogenic-signaling-induced differentiation of adult pphysiological conditions. These studies suggest that deregulais a critical step for initiation of human prostate cancer with a bathat induce basal-luminal differentiation may provide an efficie
C
l
lineage hierarchy per se has not been clearly characterized.
Prostate epithelia are composed of three types of epithelial
cells, luminal cells, basal cells, and neuroendocrine cells, of
which the latter are extremely rare (Abate-Shen and Shen,
2000). When prostate epithelial cells are cultured in vitro, a pop-
ulation of transit-amplifying cells is frequently observed (Litvinov
et al., 2006; Peehl, 2005). These transit-amplifying cells express
antigenic markers for both basal and luminal cells. Transit-
amplifying cells are abundant at the developmental stage but
are not detectable in vivo in adults under physiological condi-
tions (Wang et al., 2001).
Using a functional prostate regeneration assay, several inde-
pendent groups, including ours, have demonstrated that some
basal cells in human and murine prostates can generate all
three prostate epithelial cell lineages (Burger et al., 2005;
Goldstein et al., 2010; Lawson et al., 2007; Leong et al.,
disease prevention and therapeutics. Our genetic studiesthe basal and luminal cell lineages. However, prostate basal
mation. Instead, disease initiation from prostate basal cellsrostate basal cells into luminal cells, which is absent undertion of the normal-prostate epithelial differentiation programsal cell origin. Furthermore, suppressing signaling pathwaysnt approach to prevent prostate cancer initiation.
ancer Cell 21, 253–265, February 14, 2012 ª2012 Elsevier Inc. 253

Figure 1. Lineage Tracing Shows that Prostate Basal Cells Only Generate Basal Cells In Vivo
(A) Schematic illustration of the lineage-tracing strategy.
(B–D) Costaining of GFP with K5 and K8 (B), K5 and P63 (C), and synaptophysin (D) in tamoxifen-treated K14-mTmG mice. Arrowheads in (B) and (C) indicate
GFP-labeled basal cells. Arrowhead in (D) points to a neuroendocrine cell.
(E) Timeline for androgen deprivation and replacement experiments.
Cancer Cell
Cells of Origin for Prostate Cancer
254 Cancer Cell 21, 253–265, February 14, 2012 ª2012 Elsevier Inc.

Cancer Cell
Cells of Origin for Prostate Cancer
2008; Xin et al., 2005, 2007; Zhang et al., 2011). In addition,
Wang et al. discovered that a rare castration-resistant luminal
prostate cell population also possesses multipotent stem cell
activity (Wang et al., 2009). Of note, the conclusions of those
studies are based on experimental conditions involving cell
transplantation that do not reflect physiological conditions.
Therefore, it remains an open question whether the activities
measured in those assays reflect the obligate or facultative
function of prostate stem cells. Pertaining to this caveat, Liu
et al. recently showed by lineage tracing that prostate luminal
cells are derived from pre-existing luminal cells (Liu et al.,
2011). In addition, a very recent comprehensive lineage-tracing
study on the mammary gland epithelial lineage hierarchy
showed that in the postnatal mammary gland, distinct stem
cells contribute to the maintenance of the myoepithelial and
luminal cell lineages (Van Keymeulen et al., 2011). A similar
comprehensive study on prostate lineage hierarchy is required
to address these controversies.
Previously, prostate luminal cells, transit-amplifying cells, and
basal cells have all been implicated as the cells of origin for pros-
tate cancer (Lawson and Witte, 2007). Two distinct functional
approaches have been used recently to directly investigate the
identity of the cellular origin for prostate cancer. One approach
is to employ genetically engineered mouse models (Ellwood-
Yen et al., 2003; Foster et al., 1997; Iwata et al., 2010; Majumder
et al., 2003; Wang et al., 2003, 2009) to introduce oncogenic
signaling in different prostate cell lineages. Most of these studies
utilized two prostate-specific promoters (Probasin and Nkx3.1).
However, recently it has been shown that these promoters are
active in both luminal cells and some basal cells (Mulholland
et al., 2009; Wu et al., 2007; Zhang et al., 2011). Therefore, one
cannot determine definitively the identities of the cells of origin
for cancer using this approach. Wang et al. recently demon-
strated that some very rare NKX3.1-positive luminal cells in
castrated mice can serve as targets for transformation (Wang
et al., 2009), but it remains undetermined whether other luminal
cells also can serve as the cells of origin for cancer. A pros-
tate-specific antigen-CreERT2 model has recently been demon-
strated to mediate luminal-cell-specific gene expression, but to
date this model has not been extensively utilized (Liu et al.,
2011; Ratnacaram et al., 2008).
The other approach is to genetically modify different prospec-
tively isolated prostate epithelial cell lineages and investigate
their tumorigenic potential by in vivo transplantation assays.
Using this approach, we and others have demonstrated that
murine and human prostate basal cells, but not luminal cells,
can efficiently initiate prostate carcinogenesis in various onco-
genic contexts (Goldstein et al., 2010; Lawson et al., 2010; Xin
et al., 2005). However, a caveat for this approach is that luminal
cells by nature do not proliferate and regenerate prostate tissues
in the in vivo transplantation assay; hence, these studies cannot
exclude that luminal cells also serve as the cells of origin for
(F–H) Costaining of GFP with K5 and K8 (F), K5 and P63 (G), and synaptophys
Arrowheads in (F) and (G) indicate GFP-labeled basal cells. Arrowhead in (H) poi
(I) Bar graph shows the percentage of GFP-labeled basal cells in lateral prostate lo
cycles of epithelial regression-regeneration. Data represent the mean ± SD. Also
(J) GFP-labeled basal cells (arrowhead) incorporated BrdU.
See also Figure S1 and Table S1.
C
cancer in vivo. In summary, due to a lack of mouse models
that enable strict lineage targeting in the prostate, it has not
been comprehensively determined previously whether individual
cell lineages can serve as targets for transformation orthotopi-
cally in the prostate. This study aims to reveal how prostate basal
and luminal cell lineages are maintained and the roles of these
two lineages in prostate cancer initiation.
RESULTS
Lineage Tracing Shows that Prostate Basal CellsOnly Generate Basal Cells In VivoWe employed a lineage-tracing approach to determine in vivo
whether adult murine prostate basal epithelial cells would
generate all three prostate epithelial cell lineages. A K14-CreER
transgenic mouse line was generated previously (Vasioukhin
et al., 1999) in which CreER is driven by the promoter of Keratin
14, a prostate basal cell marker. CreER encodes a Cre recombi-
nase fused to a mutant estrogen ligand-binding domain so that
its activity is induced only in the presence of tamoxifen. To inves-
tigate whether CreER is specifically expressed in prostate basal
cells, K14-CreER transgenic mice were bred with mTmG
reporter mice to generate K14-CreERTg/Tg;mTmGTg/Tg mice
(hereafter referred to as the K14-mTmG mice). The mTmG
mouse line is a double fluorescent reporter line that replaces
the expression of a membrane-targeted Tomato-Red (mT)
protein with a membrane-targeted enhanced green fluores-
cence protein (mG) upon Cre-LoxP-mediated homologous
recombination (Muzumdar et al., 2007) (Figure 1A).
Tamoxifen was injected intraperitoneally (i.p.) into male K14-
mTmG bigenic mice. In contrast to the highly efficient Cre-medi-
ated recombination observed in the skin (Figure S1A available
online), the recombination efficiency in the prostate was lower
and varied among different prostate lobes. On average, 17%
of basal cells in lateral lobes were pulse-labeled with GFP (Table
S1). In contrast, rare and heterogeneously distributed GFP-posi-
tive basal cells were observed in other lobes, and these cells
were hard to quantify. The recombination frequencies among
lobes did not correlate with the K14 promoter activity (Fig-
ure S1B). All GFP-positive cells expressed the basal cell marker
keratin 5 (K5) (Figure 1B, Table S1; n = 2095 cells from five mice).
All of the observed cell nuclei of these GFP-positive cells were
positively stained with another nuclear-localized basal cell
marker, P63 (Figure 1C; n = 1952 cells). In contrast, none of
the examined GFP-positive cells expressed the luminal cell
marker keratin 8 (K8), or the neuroendocrine cell marker synap-
tophysin (Figures 1B and 1D). These data demonstrate that the
CreER expression is restricted to prostate basal cells in the
K14-CreER model.
Adult murine prostate epithelia turn over extremely slowly
under physiological conditions. To determine the fate of prostate
basal cells, we induced extensive epithelial turnover by a classic
in (H) in tamoxifen-treated K14-mTmG mice after induced epithelial turnover.
nts to a neuroendocrine cell.
bes of K14-mTmGmice 5 days after tamoxifen induction (6 weeks) and after 2
see Table S1.
ancer Cell 21, 253–265, February 14, 2012 ª2012 Elsevier Inc. 255

Cancer Cell
Cells of Origin for Prostate Cancer
prostate regression-regeneration model, as schematically illus-
trated in Figure 1E. In this model, prostate tissues atrophy and
regenerate repeatedly in response to fluctuating serum testos-
terone levels. Substantial epithelial cell turnover was induced
after two cycles of prostate regression-regeneration. Immuno-
histochemistry (IHC) analyses showed that all GFP-positive cells
remained basal cells because they expressed K5 but not K8 or
synaptophysin (n = 1295 cells from four mice, Figures 1F and
1H). In addition, the percentage of GFP-labeled basal cells in
lateral prostates did not change after induced epithelial turnover
(Figure 1I; Table S1), suggesting that either all basal cells
possess equal regenerative capacity or the unipotent basal
stem cells and differentiated basal cells are labeled at equal
frequency. The GFP-labeled basal cells have proliferated
because they incorporated BrdU (Figure 1J). Collectively, these
data demonstrate that during prostate regeneration, the GFP-
labeled basal cells proliferated but only gave rise to prostate
basal cells and did not differentiate or undergo lineage conver-
sion to generate other cell lineages.
Prostate Luminal Cell Lineage Is Self-Sustained In VivoWe generated a K8-CreERT2 mouse model via bacterial artificial
chromosome transgenesis (Zhang et al., 2012), in which CreERT2
is driven by the promoter of the prostate luminal cell marker
keratin 8. The same lineage-tracing approach was employed
using K8-CreERT2Wt/Tg;mTmGWt/Tg (hereafter referred to as
K8-mTmG) mice to determine how prostate luminal epithelial
cells are sustained. GFP was undetectable in vehicle-treated
K8-mTmG mouse prostates (data not shown), but was ex-
pressed abundantly in tamoxifen-treated mouse prostates (Fig-
ure S2A). All GFP-positive cells expressed K8, but not K5 or syn-
aptophysin [n = 31,319 from seven mice (Figures 2A and 2B)],
demonstrating that CreERT2 is only expressed by prostate
luminal epithelial cells in this model. The recombination effi-
ciency varied among different prostate lobes, with that in lateral
lobes the highest (Figures 2E and S2A; Tables S2 and S4). The
recombination frequencies did not correlate with the K8
promoter activity (CreER expression level) among lobes (Fig-
ure S2B). Therefore, the variation in recombination efficiency
may be due to differential local tamoxifen concentrations and
CreER activation status as a result of distinct blood vessel densi-
ties among these different lobes.
To determine how the prostate luminal cell lineage is main-
tained, we aged tamoxifen-treated K8-mTmGmice for 4months.
As shown in Figure 2E and Tables S2–S4, the percentage of
GFP-positive luminal cells in individual lobes did not change after
aging. Since prostate tissues gain weight significantly from
6 weeks to 24 weeks (Figure S2C), it is unlikely that the invariant
percentage of GFP-positive luminal cells after aging is due to
rare cellular turnover. Instead, this result suggests that the
luminal cell lineage may be self-sustained. To further interrogate
this possibility, tamoxifen-treated K8-mTmG mice were sub-
jected to two cycles of prostate regression-regeneration to
induce extensive epithelial turnover, as illustrated in Figure 1E.
IHC analyses showed that the percentages of GFP-positive
luminal cells were not statistically different before and after
induction of epithelial turnover (Figure 2E; Tables S2–S4). In
addition, all GFP-positive cells still expressed K8, but not K5 or
synaptophysin (Figures 2C and 2D), demonstrating that GFP-
256 Cancer Cell 21, 253–265, February 14, 2012 ª2012 Elsevier Inc.
labeled luminal cells only generate other luminal cells. Overall
these results imply that prostate luminal cells are not replenished
by stem/progenitor cells from other cell lineages during prostate
regeneration.
In addition, the approach illustrated in Figure 2F was em-
ployed to directly investigate the origin of newly formed prostate
luminal cells. Tamoxifen-treated K8-mTmGmice were subjected
to one cycle of prostate regression-regeneration to induce
extensive epithelial turnover. BrdU was administered to label
dividing cells during the period of regeneration. As shown in
Figures 2G and 2H and Tables S2–S4, the GFP+ new luminal
cells (BrdU+K8+) in individual prostate lobes were generated at
a frequency equal to that of the initial pulse-labeling (i.e., the
percentage of GFP+ luminal cells). These data suggest that if
the labeling efficiency of luminal cells is 100%, all new K8+
luminal cells will be GFP+, which means that they would all
come from cells in the luminal lineage existing at the time of
castration and androgen replacement. In summary, these data
directly demonstrate that the luminal cell lineage is self-
sustained.
Prostate Cancer Initiated from Basal-Cell-Specific Lossof Function of PTENTo determine the susceptibility of the prostate basal cell lineage
to transformation induced by the loss of function of the tumor
suppressor Pten, we generated K14-CreERTg/Tg;Ptenfl/fl (K14-
Pten) bigenic mice. Tamoxifen was administered to 5-week-old
K14-Pten mice so that Pten was specifically disrupted in pros-
tate basal cells. An ARR2PB-Cre;Ptenfl/fl mouse model for pros-
tate cancer was used as a control, in which Pten is disrupted in
both basal and luminal cells (Wang et al., 2006; Zhang et al.,
2011).
The disease progression status observed in all experimental
mice is summarized in Table 1. Tamoxifen-treated K14-Pten
mice displayed a shaggy fur phenotype (Figure S3A) with
complete penetrance, as reported previously (Backman et al.,
2004; Yao et al., 2006). Disrupting PTEN activity leads to phos-
phorylation of AKT that accumulates at the plasma membrane,
which serves as a reliable marker for PTEN loss. AKT phosphor-
ylation was uniformly detected in the epidermis (Figures S3B and
S3C), demonstrating an efficient Pten knockout in the skin. Aswe
showed previously, the activation of the CreER activity in K14-
Pten mouse prostate basal cells was less efficient (Figure 1),
but Pten was disrupted only in prostate basal cells, as demon-
strated by costaining pAKT with P63 (Figures 3A–3A00). Pten
deletion in prostate basal cells was further confirmed by PCR
genotyping in in vitro cultured prostate spheres derived from
basal cells in tamoxifen-treated K14-Pten mice (Mulholland
et al., 2009) (Figure S3D). Surprisingly, no abnormal epithelial
growth was noted in all the mice examined 1 month post tamox-
ifen treatment (Table 1). However, by 3 months post tamoxifen
treatment, focal hyperplastic growth (Figure 3B) was observed
in 4 out of 11 mice. Those prostatic intraepithelial neoplasia
(PIN) lesions were graded from PIN1 to PIN4 using the nomen-
clature and criteria developed by Park et al. (2002). The PIN
lesions, but not the adjacent normal tissues, expressed pAKT
(Figure 3C). They contained both K5 positive basal cells and
K8 positive luminal cells (Figures 3D and 3E). Luminal cells
expanded in the PIN lesions as measured by the ratio of basal

Figure 2. The Prostate Luminal Cell Lineage Is Self-Sustained In Vivo
(A and B) Costaining of GFP with K5 and K8 (A) and synaptophysin (B) in tamoxifen-treated K8-mTmG mice. Arrowheads and asterisks in (A) denote basal cells
that are not GFP-labeled and GFP-labeled luminal cells, respectively. Arrow in (B) points to a neuroendocrine cell.
(C and D) Costaining of GFPwith K5 and K8 (C) and synaptophysin (D) in tamoxifen-treated K8-mTmGmice after induced epithelial turnover. Arrowheads indicate
that all basal cells are GFP negative. Arrow points to a neuroendocrine cell.
(E) Bar graph shows the percentage of GFP-labeled luminal cells 5 days after tamoxifen induction (6 weeks, black bars), after 4-month aging (red bars), after the
first androgen deprivation (blue bars), and after two cycles of androgen deprivation-replacement experiments (green bars) in anterior (AP), ventral (VP), dorsal
(DP), and lateral (LP) prostate lobes. Data represent the mean ± SD. See Tables S2–S4 for more details.
(F) Timeline for investigating the origin of newly formed luminal cells by BrdU labeling.
(G) Bar graph shows that the frequency of newly formed GFP-positive luminal (GFP+K8+BrdU+/K8+BrdU+) cells reflects that of GFP-labeled luminal (GFP+K8+/
K8+) cells in all four prostate lobes. Data represent the mean ± SD. Also see Tables S2–S4.
(H) A representative image showing BrdU incorporated into luminal cells during prostate regeneration.
See also Figure S2 and Tables S2–S4.
Cancer Cell
Cells of Origin for Prostate Cancer
Cancer Cell 21, 253–265, February 14, 2012 ª2012 Elsevier Inc. 257

Table 1. Summary of Disease Progression in K14-Pten and
K8-Pten Mice
Month(s)
Post Tmx
Treatment
Tumor
Incidence
Disease Stage/
Numbers of Mice Mouse ID
K14-PTEN
1 0/5 Normal/5 321,322,323,324,411
3 4/11 Normal/6 293,504,505,509,544
PIN1/1 295
PIN2/1 294
PIN3/1 55
4 Normal/1 92
PIN4/1 91
6 29/31 Normal/2 711,713
PIN2/2 58,59
PIN3/2 52,712
PIN4/4 51,53,56,112
Early cancer/2 57,111
7 PIN3/1 50
PIN4/9 47,48,49,93,94,
95,98,456,460
8 PIN2/1 105
PIN3/2 100,102
PIN4/5 99,103,104,106,865
Early cancer/1 101
K8-PTEN
1 3/3 PIN1/1 89
PIN2/1 69
PIN3/1 146
2 9/9 Early cancer/2 159,924
3 PIN4/3 86,87,773
Early cancer/3 89,772,774
4 Early cancer/1 307
6 15/15 PIN4/1 374
Early cancer/12 226,229,237,375,
451,454,455,498,
499,503,876,898
Adenocarcinoma/2 456,903
Disease stage is defined by the most advanced foci observed in tissues,
most of which are within dorsolateral lobes.
Cancer Cell
Cells of Origin for Prostate Cancer
versus luminal cells in epithelia (Figure 3F). Figures 3G and 3H
show clearly that pAKT was also expressed in some basal cells,
further corroborating that Pten deletion has taken place in those
basal cells.
Six to eight months post tamoxifen induction, 29 out of 31
mice developed neoplastic foci at various stages (Table 1).
Figures 4A and 4A0 shows images of K14-Pten mouse prostate
glands 8 months after tamoxifen or vehicle treatment. The pros-
tate lobes appeared less transparent in tamoxifen-treated mice.
H&E staining revealedmultifocal lesions that developed in all four
lobes in this mouse (Figures 4B–4E). A majority of mice devel-
oped focal PIN4 and a few mice developed early prostate
cancer, most frequently in the dorsolateral prostate (DLP). In
most cases, the lumen of a few DLP lobes in individual mice
258 Cancer Cell 21, 253–265, February 14, 2012 ª2012 Elsevier Inc.
was filled with epithelial cells with nuclear pleomorphism and hy-
perchromasia displaying tufting and cribriform patterns. The
K14-Pten cancers were mainly composed of cells that were
either positive for K5 or K8 (Figures 4F and 4H), with a small
percentage of cells dual positive for K5 and K8. These double-
positive cells express pAKT, suggesting they were also derived
from Pten null basal cells (Figures S4A–S4C). In contrast, there
were many K5+K8+ cells within the ARR2PB-Pten tumors
(Figures 4G and 4H). Most of the K5 positive cells in K14-Pten
mice were also positive for P63 (Figures 4I and 4J). Cells within
the cancerous foci of K14-Pten mice express the androgen
receptor and display secretory function, as demonstrated by
the immunostaining of the secretory proteins of murine dorsolat-
eral lobes (mDLP) (Donjacour et al., 1990) (Figures S4D–S4G).
Finally, very few cells in K14-Pten tumors expressed the neuro-
endocrine cell marker synaptophysin (Figure 4K).
Sporadic basal cells that express pAKTwere observed in glan-
dular structures displaying normal histology (Figure 4L), suggest-
ing that ablating Pten in basal cells is not sufficient to initiate
prostate cancer. In contrast, cancer only initiated upon the emer-
gence of pAKT-expressing luminal cells, thus suggesting that
transition of basal cells into luminal cells may be both essential
and a limiting step for cancer initiation in this model. We found
that disease progression dynamics among experimental mice
varied, with some developing into PIN4 to early cancer; while
others remained as PIN2/3 even 6–8 months post tamoxifen
induction (Figure 4M–4O). This is probably because the transition
from basal cells to luminal cells occurred with different kinetics in
those mice. Overall, our study suggests that loss of function of
PTEN induces differentiation of prostate basal cells into luminal
cells, which is an essential step for disease initiation in thismodel.
To investigate whether K14-Pten tumor cells have functional
repopulating activity, we enzymatically dissociated primary
tumors into single cells, mixed them with embryonic urogenital
sinus mesenchymal cells, and transplanted them subcutane-
ously into immunodeficient host mice for 2 months, as done
previously using the PB-Pten mouse model (Mulholland et al.,
2009). Figure 4Q showed that K14-Pten tumor cells were
capable of regenerating hyperplastic prostate glandular struc-
tures. Those glands were composed of basal cells and luminal
cells that both expressed activated pAKT (Figures 4P–4S),
further confirming that they were Pten null.
Prostate Cancer Derived from Luminal-Cell-SpecificLoss of Function of PTENK8-CreERT2Tg/wt;Ptenfl/fl (K8-Pten) mice were generated to
determine whether prostate cancer initiates as a result of
luminal-cell-specific loss of function of Pten (Table 1). K8-Pten
mice developed low-grade PIN lesions in all lobes at full pene-
trance 1 month post tamoxifen treatment (Figures 5A–5A00).There were fewer pAKT-expressing cells in the anterior prostate
(AP) (data not shown), suggesting that the homologous recombi-
nation is less efficient in the AP.We showed that even when Pten
disruption was induced in very few luminal cells using a lower
dosage of tamoxifen, hyperplastic foci still formed 1 month
post tamoxifen induction (Figures S5A–S5G). This suggests
that the more rapid disease progression in the K8-Pten model,
compared with the K14-Pten model, is due to the intrinsic differ-
ential response of these two cell lineages to Pten ablation, but is

Figure 3. Prostate Cancer Initiated from Basal Cell-Specific Loss of Function of PTEN
(A-A00) Costaining of basal cell marker P63 (A0, A00) with pAKT (A, A00) in K14-Pten mice 1 month post tamoxifen induction. Arrowheads point to pAKT+P63+ cells.
(B) H&E staining of a K14-Pten prostate 3 months post tamoxifen induction reveals the formation of PIN lesions (asterisks).
(C) PIN lesions (asterisks), but not adjacent normal glands, express pAKT.
(D and E) PIN lesions contain both K5-expressing basal cells and K8-expressing luminal cells. Arrowheads indicate K5-expressing basal cells that encapsulate
glands.
(F) Quantification of the expansion of luminal cells in PIN lesions (region B) as compared in normal glands (region A). Data represent the mean ± SD.
(G and H) Pten is disrupted in some basal cells. Arrowheads in (G) and (G0 ) denote a P63-expressing basal cell that expresses pAKT. Arrowhead in (H) points to an
anatomically typical basal cell that expresses pAKT.
See also Figure S3.
Cancer Cell
Cells of Origin for Prostate Cancer
not likely because that Pten deletion was induced in more cells in
the K8-Ptenmodel. The prostate hyperplasia progressed to PIN4
or early cancers 2–4 months post treatment (Figures 5B–5B00).Mitotic figures and large atypical cells with enlarged nuclei,
prominent nucleoli, and hyperchromasia were observed. Early
cancer or even frank adenocarcinoma formed unanimously
6 months post tamoxifen induction (Figures 5C–5C00). More
than 95% of the glands in DLP and ventral prostate (VP) dis-
played a tufting and cribriform growth pattern, while the APs
were more histologically heterogeneous, consisting of both
normal and cancerous glands. This is probably due to the rela-
tively lower frequency of homologous recombination in AP, as
mentioned above.
The PIN lesions in ventral prostates were composed predomi-
nantly of K8 positive luminal cells, while K5-or P63-positive basal
cells were almost completely lost (Figure 5D). In comparison, in
the AP and DLP, there was a dramatic expansion of the cells
that were dual positive for K5 and K8 (Figures 5E and 5F), similar
to the double-positive cells observed in the ARR2PB-Ptenmodel
(Figure 4G). The K5 staining in these dual-positive cells was cyto-
plasmic, in sharp contrast to the typical K5 staining in basal cells
that highlights cellular contour. Since these double positive cells
expressed activated AKT, they should have been derived from
K8-positive luminal cells, presumably becoming putative
transit-amplifying cells through dedifferentiation (Figures 5H
and 5I) (Litvinov et al., 2006). They did not express P63 (Figures
5G–5I). In contrast, P63 was only expressed by the K5-positive
basal cells residing at the basement membrane and did not
express activated AKT (Figures 5J–5L), suggesting that these
C
P63-expressing cells were bona fide basal cells that did not
undergohomologous recombination. Thedifferential phenotypes
among lobes were observed consistently during the 6 months
post tamoxifen treatment. Cancer cells in all lobes express the
androgen receptor and mDLP, while synaptophysin-expressing
neuroendocrine cells were very rare in all lobes (Figures S5H–
S5N). The same observations were made when both Pten and
P53 were knocked out in luminal cells using K8-CreERT2Tg/Wt;
Ptenfl/fl;P53fl/fl (K8-Pten;P53) mice (data not shown).
Transplantation assays again were performed to determine
whether K8-Pten tumor cells were capable of functional repopu-
lation. H&E staining shows that the outgrowth tissues contained
both normal glandular structures and cancerous lesions (Figures
5M–5O). The normal prostate glandular structures were
composed of a single layer of epithelial cells encircling lumen
filled with eosinophilic secretions. Both prostate basal and
luminal cells were detected in those glands (Figure 5P). They
did not express pAKT (data not shown). We previously showed
that only prostate basal cells are capable of forming such pros-
tate glandular structures upon transplantation (Lawson et al.,
2007; Xin et al., 2005). These results suggest that those normal
glandswere derived fromprostate basal cells and further corrob-
orate that Pten was not disrupted in prostate basal cells in the
K8-Pten model. In contrast, the focal cancerous lesions were
composed of cells that were double-positive for K5 and K8
and expressed pAKT (Figures 5Q and 5R). They did not express
P63 (data not shown). This phenotype recapitulates that of the
original tumors in the AP and DLP, suggesting that those lesions
were derived from Pten-null luminal cells. Collectively, these
ancer Cell 21, 253–265, February 14, 2012 ª2012 Elsevier Inc. 259

Figure 4. Progression of Prostate Cancer in the
K14-Pten Model
(A and A0) Representative images of urogenital organs and
dissected prostate lobes from K14-Pten mice 8 months
after induction with vehicle (A0) or tamoxifen (A).
(B–E) Representative images of H&E staining of total
prostate (B), AP (C), DLP (D), and VP (E) lobes of a K14-
Pten mouse 8 months after tamoxifen treatment.
(F–H) Immunostaining of K5 and K8 of a K14-Pten mouse
3 months after tamoxifen treatment (F) and a 4-month old
ARR2PB-Pten mouse (G). (H) Quantification of the
percentage of K5+K8+ andK5+K8� cells in the twomodels.
(I and J) Immunostaining of K5 and P63 in K14-Pten mice
(I) and quantification of the percentage of K5+P63+ and
K5+P63� cells (J).
(K) Synaptophysin-expressing neuroendocrine cells
(arrow) are rare in K14-Pten prostate tumor. Arrowheads
point to P63-expressing basal cells.
(L–L00) Prostate basal cells in normal glands in tamoxifen-
treated K14-Pten mice express pAKT. Arrowheads point
to P63-expressing basal cells that express pAKT.
(M–O) Representative images of H&E staining show that
only mild focal PIN lesions (dot-circled and arrow-pointed
regions) are developed in many K14-Pten mice 6–8
months post tamoxifen treatment.
(P–S) Dissociated prostate cells from K14-Pten tumors are
capable of regenerating abnormal glandular structures. (P)
H&E staining of the outgrown tissues. (Q–S) Immuno-
staining of K5 (Q, arrow) and K8 (Q, arrowhead), P63 (R,
arrowhead), and pAKT (S, arrowhead). Insets in (S) indi-
cate that both basal (arrowhead) and luminal (arrow) cells
express pAKT.
See also Figure S4.
Cancer Cell
Cells of Origin for Prostate Cancer
data further support that disruption of Pten in prostate luminal
cells causes prostate cancer.
Castration-Resistant Prostate Cancer Cells Exist in K8-Pten Prostate TumorsTo investigate the response of K8-Pten tumors to androgen
deprivation, we castrated K8-Pten mice 4 months after tamox-
ifen induction. Seminal vesicles and prostate tumors shrunk
significantly after androgen ablation (Figure 6A and 6A0), which
demonstrated successful androgen ablation and corroborated
that many cancer cells were dependent on androgen for their
survival. Histological analysis confirmed substantial cell death
in the prostate 10 days and 2 months postcastration, as evi-
denced by significant apoptotic bodies inside tumor masses
and cellular debris inside prostate lumen (Figures 6B–6D). IHC
analysis showed that two months postcastration the remaining
VP tumors were composed predominantly of luminal cells (Fig-
ure 6E). The K5 and K8 double-positive cells decreased signifi-
cantly but still persisted in the AP and DLP tumors (Figures 6F
and 6G). These data demonstrate that these luminal cells survive
androgen deprivation and suggest that they may serve as the
cellular origin for castration-resistant prostate cancer.
Prostate Basal Cells Are Resistant to Direct OncogenicTransformationThe above studies showed that prostate basal cells were less
sensitive than luminal cells to mitogenic signals mediated by
260 Cancer Cell 21, 253–265, February 14, 2012 ª2012 Elsevier Inc.
Pten deletion. We wondered whether this was due to the insuffi-
cient oncogenic potency conferred by Pten loss or to the indo-
lent nature of basal cells to transformation. P53-dependent
PTEN-deletion-induced cellular senescence has been shown
to impede the rapid progression of fully developed prostate
adenocarcinoma in the Pten-null prostate cancer model
(Alimonti et al., 2010; Chen et al., 2005). We generated
K14-CreERTg/Tg;Ptenfl/fl;P53fl/fl (K14-Pten;P53) mice and sought
to determine whether prostate basal cells can be directly trans-
formed upon simultaneous deletion of Pten and P53. Two
months post tamoxifen induction, experimental mice developed
severe hyperplastic growth in facial skin, showed signs of
morbidity such as loss of weight and hunched postures, and
had to be euthanized (Figures S6A–S6D). Seminal vesicles and
prostates from tamoxifen-treated K14-Pten;P53 mice were
much smaller compared to the control mice, probably due to
morbidity (Figure S6E). H&E staining showed that prostate
epithelial cells packed tightly due to reduced cytoplasmic
volumes. There were no signs of hyperproliferation (Figures 7A
and 7B; N = 9 mice), which was corroborated by a lack of
Ki67-expressing cells (data not shown). The glandular structures
were mostly composed of K5-positive basal cells that encapsu-
lated K8-positive luminal cells (Figure 7C). Occasionally, basal
cells were reduced in number in some glands (Figure 7D). IHC
analyses showed clearly that pAKT was activated only in P63-
expressing basal cells, demonstrating that Pten was only disrup-
ted in basal cells (Figure 7E). PCR analysis confirmed that

Figure 5. Prostate Cancer Derived from Luminal-
Cell-Specific Disruption of PTEN
(A–C) H&E staining of AP (A0, B0, C0), VP (A, B, C), and DLP
(A00, B00, C00) lobes of K8-Pten mice at 1, 3, and 6 months
post tamoxifen induction. Arrows point to focal hyper-
plasia in AP.
(D–F) Immunostaining of K5 and K8 reveals a distinct
lineage composition among VP (D), AP (E), and DLP (F).
(G–I) P63-expressing basal cells (arrowheads) do not
express pAKT in VP (G), AP (H), and DLP (I).
(J–L) Only K5-expressing basal cells residing at the
basement membrane express P63 (arrowheads) in VP (J),
AP (K), and DLP (L).
(M–R) K8-Pten prostate tumor can repopulate. Repre-
sentative images of H&E staining of outgrown tissues from
dissociated K8-Pten tumor tissues (M–O). Immunostain-
ing of K5 and K8 (P and Q), and pAKT (R) of outgrown
tissues. Arrows indicate cancerous foci.
See also Figure S5.
Cancer Cell
Cells of Origin for Prostate Cancer
successful ablation of P53 (Figure S6F). We were able to keep
four K14-Pten;P53 mice for 3 months after tamoxifen treatment
and observed one PIN4 lesion in one mouse (Figure 7F, arrow),
which demonstrates that cancer can initiate from basal cells
with Pten and P53 deletion. The PIN4 lesion is mainly composed
of luminal cells expressing K8, with some cells expressing K5
Cancer Cell 21, 253
only or both K5 and K8 (Figure 7G). Some
P63-expressing basal cells expressed pAKT,
suggesting that Pten was disrupted in those
cells (Figure 7H). To exclude that the morbidity
of experimental mice interferes with disease
progression in the prostate, we collected intact
prostate lobes from K14-Pten;P53 mice
2 months post tamoxifen treatment and trans-
planted them under the kidney capsules of
immunodeficient male hosts. Only a few PIN1
lesions were noted in 7-week transplants
(Figures 7I–7K). In contrast, massive lesions at
the PIN4 or early cancer stages were observed
in 15-week transplants (Figures 7L–7N). Within
those cancerous regions, some P63-expressing
basal cells express pAKT while other do not,
suggesting that Pten was disrupted in only
a fraction of basal cells (Figures 7O–7P). Collec-
tively, these results imply that basal cells in situ
are by nature relatively resistant to direct trans-
formation by oncogenic stimuli, which partly
explains why prostate basal cell carcinoma is
so rare (Ali and Epstein, 2007).
DISCUSSION
Obligate versus Facultative Stem CellCapacity of the Prostate Basal CellsOur study demonstrates that adult murine pros-
tate basal and luminal cell lineages are indepen-
dently sustained. We and others also showed
previously, using a transplantation-based pros-
tate regeneration assay, that some prostate
basal cells in both humans and rodents are
capable of generating all three prostate epithelial cell lineages
(Burger et al., 2005; Goldstein et al., 2010; Lawson et al., 2007;
Leong et al., 2008; Xin et al., 2005; Zhang et al., 2011). These
two observations are not mutually contradictory since they
may illustrate the obligate versus facultative activities of stem
cells in the prostate basal cell lineage. In the prostate
–265, February 14, 2012 ª2012 Elsevier Inc. 261
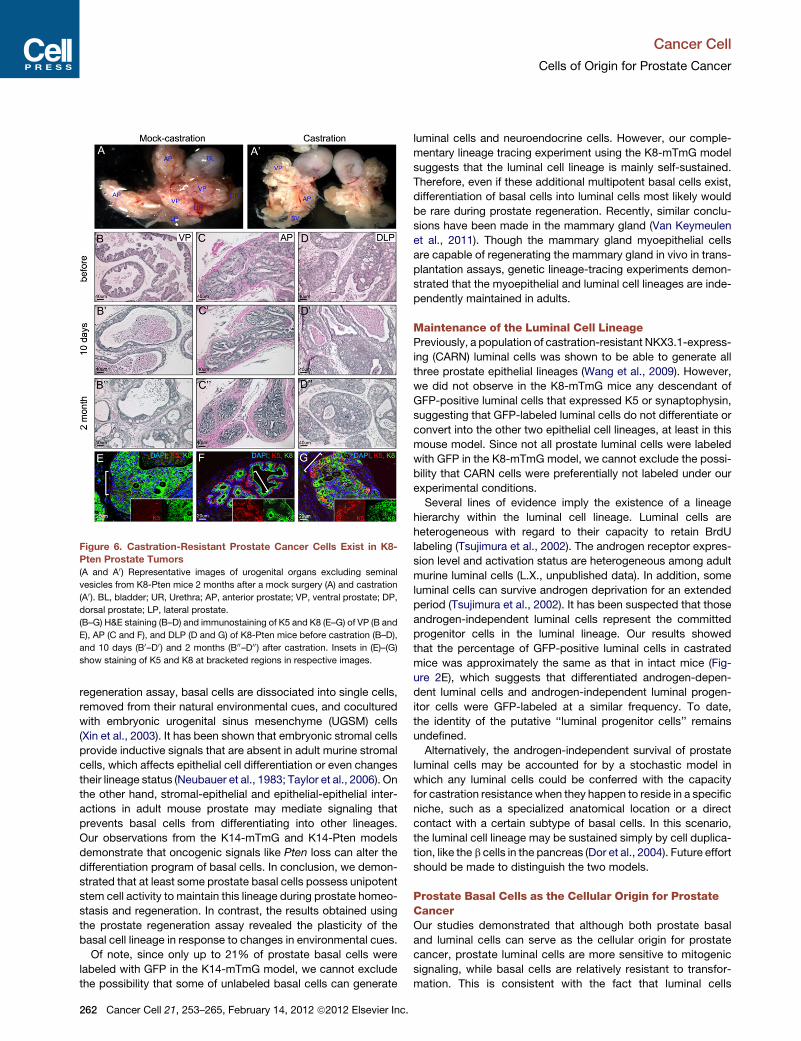
Figure 6. Castration-Resistant Prostate Cancer Cells Exist in K8-
Pten Prostate Tumors
(A and A0) Representative images of urogenital organs excluding seminal
vesicles from K8-Pten mice 2 months after a mock surgery (A) and castration
(A0). BL, bladder; UR, Urethra; AP, anterior prostate; VP, ventral prostate; DP,dorsal prostate; LP, lateral prostate.
(B–G) H&E staining (B–D) and immunostaining of K5 and K8 (E–G) of VP (B and
E), AP (C and F), and DLP (D and G) of K8-Pten mice before castration (B–D),
and 10 days (B0–D0) and 2 months (B00–D00) after castration. Insets in (E)–(G)
show staining of K5 and K8 at bracketed regions in respective images.
Cancer Cell
Cells of Origin for Prostate Cancer
regeneration assay, basal cells are dissociated into single cells,
removed from their natural environmental cues, and cocultured
with embryonic urogenital sinus mesenchyme (UGSM) cells
(Xin et al., 2003). It has been shown that embryonic stromal cells
provide inductive signals that are absent in adult murine stromal
cells, which affects epithelial cell differentiation or even changes
their lineage status (Neubauer et al., 1983; Taylor et al., 2006). On
the other hand, stromal-epithelial and epithelial-epithelial inter-
actions in adult mouse prostate may mediate signaling that
prevents basal cells from differentiating into other lineages.
Our observations from the K14-mTmG and K14-Pten models
demonstrate that oncogenic signals like Pten loss can alter the
differentiation program of basal cells. In conclusion, we demon-
strated that at least some prostate basal cells possess unipotent
stem cell activity to maintain this lineage during prostate homeo-
stasis and regeneration. In contrast, the results obtained using
the prostate regeneration assay revealed the plasticity of the
basal cell lineage in response to changes in environmental cues.
Of note, since only up to 21% of prostate basal cells were
labeled with GFP in the K14-mTmG model, we cannot exclude
the possibility that some of unlabeled basal cells can generate
262 Cancer Cell 21, 253–265, February 14, 2012 ª2012 Elsevier Inc.
luminal cells and neuroendocrine cells. However, our comple-
mentary lineage tracing experiment using the K8-mTmG model
suggests that the luminal cell lineage is mainly self-sustained.
Therefore, even if these additional multipotent basal cells exist,
differentiation of basal cells into luminal cells most likely would
be rare during prostate regeneration. Recently, similar conclu-
sions have been made in the mammary gland (Van Keymeulen
et al., 2011). Though the mammary gland myoepithelial cells
are capable of regenerating the mammary gland in vivo in trans-
plantation assays, genetic lineage-tracing experiments demon-
strated that the myoepithelial and luminal cell lineages are inde-
pendently maintained in adults.
Maintenance of the Luminal Cell LineagePreviously, a population of castration-resistant NKX3.1-express-
ing (CARN) luminal cells was shown to be able to generate all
three prostate epithelial lineages (Wang et al., 2009). However,
we did not observe in the K8-mTmG mice any descendant of
GFP-positive luminal cells that expressed K5 or synaptophysin,
suggesting that GFP-labeled luminal cells do not differentiate or
convert into the other two epithelial cell lineages, at least in this
mouse model. Since not all prostate luminal cells were labeled
with GFP in the K8-mTmG model, we cannot exclude the possi-
bility that CARN cells were preferentially not labeled under our
experimental conditions.
Several lines of evidence imply the existence of a lineage
hierarchy within the luminal cell lineage. Luminal cells are
heterogeneous with regard to their capacity to retain BrdU
labeling (Tsujimura et al., 2002). The androgen receptor expres-
sion level and activation status are heterogeneous among adult
murine luminal cells (L.X., unpublished data). In addition, some
luminal cells can survive androgen deprivation for an extended
period (Tsujimura et al., 2002). It has been suspected that those
androgen-independent luminal cells represent the committed
progenitor cells in the luminal lineage. Our results showed
that the percentage of GFP-positive luminal cells in castrated
mice was approximately the same as that in intact mice (Fig-
ure 2E), which suggests that differentiated androgen-depen-
dent luminal cells and androgen-independent luminal progen-
itor cells were GFP-labeled at a similar frequency. To date,
the identity of the putative ‘‘luminal progenitor cells’’ remains
undefined.
Alternatively, the androgen-independent survival of prostate
luminal cells may be accounted for by a stochastic model in
which any luminal cells could be conferred with the capacity
for castration resistance when they happen to reside in a specific
niche, such as a specialized anatomical location or a direct
contact with a certain subtype of basal cells. In this scenario,
the luminal cell lineage may be sustained simply by cell duplica-
tion, like the b cells in the pancreas (Dor et al., 2004). Future effort
should be made to distinguish the two models.
Prostate Basal Cells as the Cellular Origin for ProstateCancerOur studies demonstrated that although both prostate basal
and luminal cells can serve as the cellular origin for prostate
cancer, prostate luminal cells are more sensitive to mitogenic
signaling, while basal cells are relatively resistant to transfor-
mation. This is consistent with the fact that luminal cells

Figure 7. Prostate Basal Cells Are Resistant to Direct Oncogenic
Transformation(A and B) H&E staining of K14-Pten;P53 mouse prostates 2 months after
vehicle (A) or tamoxifen (B) induction. A0 and B0 show images of higher
magnification.
(C and D) Representative images of immunostaining of K5 and K8 of prostates
from K14-Pten;P53 mice 2 months post tamoxifen induction.
(E) Pten is disrupted only in basal cells in K14-Pten;P53mice, as demonstrated
by costaining of pAKT (E and E0 ) and P63 (E and E00). Arrowheads indicate
pAKT-expressing cells that also express P63.
(F–H) H&E (F) and immunostaining of K5/K8 (G) and pAKT/P63 (H) of K14-
Pten;P53 mouse prostates 3 months after tamoxifen induction. Arrow in F
points to a dot-circled PIN4 lesion. Arrowhead in H points to a basal cell
expressing pAKT.
(I–P) Two months after tamoxifen treatment, K14-Pten;P53 prostate glands
were transplanted under renal capsules of immunodeficient male hosts. H&E
staining (I, L, and M) and immunostaining of K5/K8 (J and N) and pAKT/P63
(K, O, and P) of 7-week (I–K) and 15-week (L–P) transplants. Arrowheads in O
and P denote P63-expressing cells that express and do not express pAKT,
respectively.
See also Figure S6.
Cancer Cell
Cells of Origin for Prostate Cancer
C
possess low levels of H2A.X and hence are more vulnerable to
oncogenic stress (Jaamaa et al., 2010). The distinctive
responses of these two cell lineages to oncogenic insults
explain why treatment-naive prostate cancers are mostly
composed of luminal cells, while prostate basal cell carcinoma
is very rare.
Intuitively, prostate basal cells would seem to be the preferred
cellular origin for cancer because they are more prone to accu-
mulating genetic alterations than luminal cells. They are less
well differentiated and proliferate more frequently (Bonkhoff
et al., 1994). Additionally, they are proposed to act as a natural
barrier to protect the luminal cell lineage from various insults.
Thus, they are exposed to a more ‘‘hostile’’ environment than
are luminal cells. For example, the basal cells are in closer
contact with various cancer-promoting cytokines generated by
the surrounding reactive stroma as a result of chronic inflamma-
tion (Tuxhorn et al., 2001). However, sincemost prostate cancers
display a luminal cell phenotype, differentiation of basal cells into
luminal cells becomes an essential and probably a rate-limiting
step for cancer initiation and progression, if the cellular origin
for cancer is of the basal cell lineage. This is supported by our
result from the K14-Pten model. Prostate cancer was initiated
in the K14-Pten model with an increased latency. Though Pten
was disrupted specifically only in the prostate basal cells, the
initiation of cancer did not start until the emergence of pAKT-
expressing luminal cells. Since direct differentiation of basal cells
to luminal cells is absent under physiological conditions based
on our lineage-tracing experiments, these results suggest that
deregulation of the normal prostate epithelial differentiation
program is a critical step for initiation of human prostate cancer
with a basal cell origin.
It should be noted that the most ideal way to investigate the
cells of origin for cancer is to perform lineage tracing in the
cancer models. However, we were not able to perform our study
in this way for two reasons. First, activation of CreERT2 by tamox-
ifen is transient. Therefore, homologous recombination may not
be achieved in all the cells that express CreERT2, as we have
shown in the K14-mTmG and K8-mTmG lineage-tracing experi-
ments (Figures 1 and 2). Second, the recombination efficiencies
at different genomic loci are not identical. As shown in Figures
S5O and S5P, GFP expression does not guarantee Pten deletion
in tamoxifen-treated K8-Ptenfl/fl-mTmG triple transgenic mice.
Nevertheless, we found that the specificities of the K14 and K8
promoters are not affected by the genetic background of the
experimental mice (Figures S5Q and S5R). In addition, we
confirmed lineage specific Pten deletion by costaining pAKT
with lineage markers in the K14-Pten and K8-Pten models.
Therefore, we can conclude that neoplasia and tumors in the
K14-Pten and K8-Pten models are derived from basal and
luminal cells, respectively.
A unique feature of prostate cancer is that the disease is
strictly age-dependent. Men under 35 seldom develop prostate
cancer. Our data showed that it takes at least 3 months for K14-
Ptenmouse prostate basal cells to differentiate into luminal cells,
which is almost equivalent to 10 years of human life, suggesting
that this is still an extremely lengthy and inefficient biological
process under certain genetic contexts. This may provide an
additional explanation for the strict age-dependent nature of
human prostate cancer.
ancer Cell 21, 253–265, February 14, 2012 ª2012 Elsevier Inc. 263

Cancer Cell
Cells of Origin for Prostate Cancer
Prostate Luminal Cells as the Cellular Origin for Primaryand Castration-Resistant Prostate CancerOur genetic model also supports that luminal cells can be the
cellular origin for prostate cancer. An intriguing observation
from our K8-Pten model is that the same genetic change causes
tumors with lobe-specific phenotypes with regard to their cellular
composition. The phenotype in VP resembles that of the human
disease because markers of basal cells are absent in prostate
carcinoma,which has servedasadiagnostic criterion for prostate
cancer. In comparison, tumors in the AP and DLP are composed
of cells that express both K5 and K8, and basal cells remain
largely unaffected. A previous study has revealed a compartmen-
talization of gene expression between prostate lobes and identi-
fied dozens of differentially expressed genes between prostate
lobes (Abbott et al., 2003). It is possible that the cellular context,
i.e., the intrinsic differences in gene expression between prostate
lobes, leads to the differential responses of the lobes to the onco-
genic insult. It will be interesting to investigate whether human
prostate luminal cells sharemore similaritywithmurineVP luminal
cells in terms of gene expression profiles. The mechanism by
which basal cells are depleted in the VP is also unknown. We
recently reported that dissociation of basal cells leads to cellular
apoptosis induced by activation of the RhoA/ROCK kinases
(Zhang et al., 2011). One potential mechanism, therefore, could
be that the basal cell layer in ventral prostate is less resilient to
cellular perturbations, so that when prostate glands are enlarged
and distorted due to excessive proliferation of prostate luminal
cells, the cellular contact between ventral prostate basal cells is
attenuated, which alters the signaling that regulates basal cell
survival, such as the RhoA/ROCK-mediated signaling.
Our study also demonstrates that castration-resistant cells in
prostate cancers may originate from luminal cells. This result
excludes the possibility that prostate basal cells are the only
cellular origin for castration-resistant disease. Since there is no
evidence that CARN cells (Wang et al., 2009) were genetically
manipulated by tamoxifen induction in the K8-CreERT2 model
(Figure 2), our study also suggests that CARN cells are not the
only cells of origin for prostate cancer in the luminal cell lineage,
and that castration resistance is not a unique feature of CARN
cells. This observation further highlights the need to identify
the androgen-independent prostate luminal progenitor cells
and to determine the essential signaling that confers the capacity
for androgen-independent survival to luminal cells.
EXPERIMENTAL PROCEDURES
Mouse Procedures
The sources of experimental mice and the genotyping strategies are described
in Supplemental Experimental Procedures. Castration, androgen replace-
ment, dissociation of primary prostate tumors, and tumor cell transplantation
were performed using standard techniques described in Supplemental Exper-
imental Procedures. Tamoxifen (Sigma-Aldrich, St. Louis, MO) was dissolved
into corn oil and was administrated i.p. into experimental mice at the age of
5 weeks once a day for four consecutive days. The dosages used for K14-
CreER and K8-CreERT2 mice were 9 mg/40 g and 2 mg/40 g, respectively.
All animal work were approved by and performed under the regulation of the
Institutional Animal Care Committee of the Baylor College of Medicine.
Histology, Immunohistochemical, and Immunofluorescent Analysis
The procedures for histological and IHC analyses and the information about
primary antibodies were described in Supplemental Experimental Procedures.
264 Cancer Cell 21, 253–265, February 14, 2012 ª2012 Elsevier Inc.
Paraffin-embedded sections were stained and counterstained with 4,6-diami-
dino-2-phenylindole (DAPI) (Sigma-Aldrich, St. Louis, MO). Secondary anti-
bodies were labeled with Alexa Fluro 488, 594, 633 (Invitrogen, Carlsbad,
CA). Immunofluorescence staining was imaged using an Olympus BX60 fluo-
rescence microscope or a Leica EL6000 confocal microscope. Cell counting
was performed either manually or via ImagePro Software.
Statistics
All experiments were performed using 4–10 mice in independent experiments.
Data are presented as mean ± SD. Student’s t test was used to determine
significance between groups. For all statistical tests, the 0.05 level of confi-
dence was accepted for statistical significance.
SUPPLEMENTAL INFORMATION
Supplemental Information includes six figures, four tables, and Supplemental
Experimental Procedures and can be found with this article online at doi:10.
1016/j.ccr.2012.01.005.
ACKNOWLEDGMENTS
We thank Dr. Larry Donhower for the P53 conditional mice, Dr. HongWu for the
Pten conditional mice, Dr. Gerald Cunha for antiserum against mDLP, Dr. Jef-
frey Rosen for critical comments, Dr. Michael Lewis for sharing the NOD/SCID
mouse colony. This work is supported by NIH R00CA125937, R01DK092202,
and U01CA141497.
Received: October 28, 2011
Revised: January 2, 2012
Accepted: January 6, 2012
Published: February 13, 2012
REFERENCES
Abate-Shen, C., and Shen, M.M. (2000). Molecular genetics of prostate
cancer. Genes Dev. 14, 2410–2434.
Abbott, D.E., Pritchard, C., Clegg, N.J., Ferguson, C., Dumpit, R., Sikes, R.A.,
and Nelson, P.S. (2003). Expressed sequence tag profiling identifies develop-
mental and anatomic partitioning of gene expression in the mouse prostate.
Genome Biol. 4, R79.
Ali, T.Z., and Epstein, J.I. (2007). Basal cell carcinoma of the prostate: a clinico-
pathologic study of 29 cases. Am. J. Surg. Pathol. 31, 697–705.
Alimonti, A., Nardella, C., Chen, Z., Clohessy, J.G., Carracedo, A., Trotman,
L.C., Cheng, K., Varmeh, S., Kozma, S.C., Thomas, G., et al. (2010). A novel
type of cellular senescence that can be enhanced inmousemodels and human
tumor xenografts to suppress prostate tumorigenesis. J. Clin. Invest. 120,
681–693.
Backman, S.A., Ghazarian, D., So, K., Sanchez, O., Wagner, K.U.,
Hennighausen, L., Suzuki, A., Tsao, M.S., Chapman, W.B., Stambolic, V.,
and Mak, T.W. (2004). Early onset of neoplasia in the prostate and skin of
mice with tissue-specific deletion of Pten. Proc. Natl. Acad. Sci. USA 101,
1725–1730.
Bonkhoff, H., Stein, U., and Remberger, K. (1994). The proliferative function of
basal cells in the normal and hyperplastic human prostate. Prostate 24,
114–118.
Burger, P.E., Xiong, X., Coetzee, S., Salm, S.N., Moscatelli, D., Goto, K., and
Wilson, E.L. (2005). Sca-1 expression identifies stem cells in the proximal
region of prostatic ducts with high capacity to reconstitute prostatic tissue.
Proc. Natl. Acad. Sci. USA 102, 7180–7185.
Chen, Z., Trotman, L.C., Shaffer, D., Lin, H.K., Dotan, Z.A., Niki, M., Koutcher,
J.A., Scher, H.I., Ludwig, T., Gerald, W., et al. (2005). Crucial role of p53-
dependent cellular senescence in suppression of Pten-deficient tumorigen-
esis. Nature 436, 725–730.
Donjacour, A.A., Rosales, A., Higgins, S.J., and Cunha, G.R. (1990).
Characterization of antibodies to androgen-dependent secretory proteins of
the mouse dorsolateral prostate. Endocrinology 126, 1343–1354.

Cancer Cell
Cells of Origin for Prostate Cancer
Dor, Y., Brown, J., Martinez, O.I., and Melton, D.A. (2004). Adult pancreatic
beta-cells are formed by self-duplication rather than stem-cell differentiation.
Nature 429, 41–46.
Ellwood-Yen, K., Graeber, T.G., Wongvipat, J., Iruela-Arispe, M.L., Zhang, J.,
Matusik, R., Thomas, G.V., and Sawyers, C.L. (2003). Myc-driven murine pros-
tate cancer shares molecular features with human prostate tumors. Cancer
Cell 4, 223–238.
Foster, B.A., Gingrich, J.R., Kwon, E.D., Madias, C., and Greenberg, N.M.
(1997). Characterization of prostatic epithelial cell lines derived from trans-
genic adenocarcinoma of the mouse prostate (TRAMP) model. Cancer Res.
57, 3325–3330.
Goldstein, A.S., Huang, J., Guo, C., Garraway, I.P., and Witte, O.N. (2010).
Identification of a cell of origin for human prostate cancer. Science 329,
568–571.
Iczkowski, K.A., and Lucia, M.S. (2011). Current perspectives on Gleason
grading of prostate cancer. Curr. Urol. Rep. 12, 216–222.
Iwata, T., Schultz, D., Hicks, J., Hubbard, G.K., Mutton, L.N., Lotan, T.L.,
Bethel, C., Lotz, M.T., Yegnasubramanian, S., Nelson, W.G., et al. (2010).
MYC overexpression induces prostatic intraepithelial neoplasia and loss of
Nkx3.1 in mouse luminal epithelial cells. PLoS ONE 5, e9427.
Jaamaa, S., Af Hallstrom, T.M., Sankila, A., Rantanen, V., Koistinen, H.,
Stenman, U.H., Zhang, Z., Yang, Z., De Marzo, A.M., Taari, K., et al. (2010).
DNA damage recognition via activated ATM and p53 pathway in nonproliferat-
ing human prostate tissue. Cancer Res. 70, 8630–8641.
Lawson, D.A., and Witte, O.N. (2007). Stem cells in prostate cancer initiation
and progression. J. Clin. Invest. 117, 2044–2050.
Lawson, D.A., Xin, L., Lukacs, R.U., Cheng, D., andWitte, O.N. (2007). Isolation
and functional characterization of murine prostate stem cells. Proc. Natl. Acad.
Sci. USA 104, 181–186.
Lawson, D.A., Zong, Y., Memarzadeh, S., Xin, L., Huang, J., and Witte, O.N.
(2010). Basal epithelial stem cells are efficient targets for prostate cancer initi-
ation. Proc. Natl. Acad. Sci. USA 107, 2610–2615.
Leong, K.G., Wang, B.E., Johnson, L., and Gao, W.Q. (2008). Generation of
a prostate from a single adult stem cell. Nature 456, 804–808.
Lim, E., Vaillant, F., Wu, D., Forrest, N.C., Pal, B., Hart, A.H., Asselin-Labat,
M.L., Gyorki, D.E., Ward, T., Partanen, A., et al; kConFab. (2009). Aberrant
luminal progenitors as the candidate target population for basal tumor devel-
opment in BRCA1 mutation carriers. Nat. Med. 15, 907–913.
Litvinov, I.V., Vander Griend, D.J., Xu, Y., Antony, L., Dalrymple, S.L., and
Isaacs, J.T. (2006). Low-calcium serum-free defined medium selects for
growth of normal prostatic epithelial stem cells. Cancer Res. 66, 8598–8607.
Liu, J., Pascal, L.E., Isharwal, S., Metzger, D., Ramos Garcia, R., Pilch, J.,
Kasper, S., Williams, K., Basse, P.H., Nelson, J.B., et al. (2011).
Regenerated luminal epithelial cells are derived from preexisting luminal
epithelial cells in adult mouse prostate. Mol. Endocrinol. 25, 1849–1857.
Majumder, P.K., Yeh, J.J., George, D.J., Febbo, P.G., Kum, J., Xue, Q., Bikoff,
R., Ma, H., Kantoff, P.W., Golub, T.R., et al. (2003). Prostate intraepithelial
neoplasia induced by prostate restricted Akt activation: the MPAKT model.
Proc. Natl. Acad. Sci. USA 100, 7841–7846.
Molyneux, G., Geyer, F.C., Magnay, F.A., McCarthy, A., Kendrick, H., Natrajan,
R., Mackay, A., Grigoriadis, A., Tutt, A., Ashworth, A., et al. (2010). BRCA1
basal-like breast cancers originate from luminal epithelial progenitors and
not from basal stem cells. Cell Stem Cell 7, 403–417.
Mulholland, D.J., Xin, L., Morim, A., Lawson, D., Witte, O., and Wu, H. (2009).
Lin-Sca-1+CD49fhigh stem/progenitors are tumor-initiating cells in the Pten-
null prostate cancer model. Cancer Res. 69, 8555–8562.
Muzumdar, M.D., Tasic, B., Miyamichi, K., Li, L., and Luo, L. (2007). A global
double-fluorescent Cre reporter mouse. Genesis 45, 593–605.
Neubauer, B.L., Chung, L.W., McCormick, K.A., Taguchi, O., Thompson, T.C.,
and Cunha, G.R. (1983). Epithelial-mesenchymal interactions in prostatic
development. II. Biochemical observations of prostatic induction by urogenital
sinus mesenchyme in epithelium of the adult rodent urinary bladder. J. Cell
Biol. 96, 1671–1676.
C
Park, J.H., Walls, J.E., Galvez, J.J., Kim, M., Abate-Shen, C., Shen, M.M., and
Cardiff, R.D. (2002). Prostatic intraepithelial neoplasia in genetically engi-
neered mice. Am. J. Pathol. 161, 727–735.
Peehl, D.M. (2005). Primary cell cultures as models of prostate cancer devel-
opment. Endocr. Relat. Cancer 12, 19–47.
Ratnacaram, C.K., Teletin, M., Jiang, M., Meng, X., Chambon, P., and
Metzger, D. (2008). Temporally controlled ablation of PTEN in adult mouse
prostate epithelium generates a model of invasive prostatic adenocarcinoma.
Proc. Natl. Acad. Sci. USA 105, 2521–2526.
Taylor, R.A., Cowin, P.A., Cunha, G.R., Pera, M., Trounson, A.O., Pedersen, J.,
and Risbridger, G.P. (2006). Formation of human prostate tissue from embry-
onic stem cells. Nat. Methods 3, 179–181.
Tsujimura, A., Koikawa, Y., Salm, S., Takao, T., Coetzee, S., Moscatelli, D.,
Shapiro, E., Lepor, H., Sun, T.T., and Wilson, E.L. (2002). Proximal location
of mouse prostate epithelial stem cells: a model of prostatic homeostasis.
J. Cell Biol. 157, 1257–1265.
Tuxhorn, J.A., Ayala, G.E., and Rowley, D.R. (2001). Reactive stroma in pros-
tate cancer progression. J. Urol. 166, 2472–2483.
VanKeymeulen,A.,Rocha,A.S.,Ousset,M.,Beck,B.,Bouvencourt,G.,Rock, J.,
Sharma,N.,Dekoninck, S., andBlanpain,C. (2011).Distinct stemcells contribute
to mammary gland development and maintenance. Nature 479, 189–193.
Vasioukhin, V., Degenstein, L., Wise, B., and Fuchs, E. (1999). The magical
touch: genome targeting in epidermal stem cells induced by tamoxifen appli-
cation to mouse skin. Proc. Natl. Acad. Sci. USA 96, 8551–8556.
Visvader, J.E. (2011). Cells of origin in cancer. Nature 469, 314–322.
Wang, S., Gao, J., Lei, Q., Rozengurt, N., Pritchard, C., Jiao, J., Thomas, G.V.,
Li, G., Roy-Burman, P., Nelson, P.S., et al. (2003). Prostate-specific deletion of
the murine Pten tumor suppressor gene leads to metastatic prostate cancer.
Cancer Cell 4, 209–221.
Wang, S., Garcia, A.J., Wu, M., Lawson, D.A., Witte, O.N., and Wu, H. (2006).
Pten deletion leads to the expansion of a prostatic stem/progenitor cell
subpopulation and tumor initiation. Proc.Natl. Acad. Sci. USA 103, 1480–1485.
Wang,X.,Kruithof-deJulio,M.,Economides,K.D.,Walker,D., Yu,H.,Halili,M.V.,
Hu, Y.P., Price, S.M., Abate-Shen,C., andShen,M.M. (2009). A luminal epithelial
stem cell that is a cell of origin for prostate cancer. Nature 461, 495–500.
Wang, Y., Hayward, S., Cao, M., Thayer, K., and Cunha, G. (2001). Cell differ-
entiation lineage in the prostate. Differentiation 68, 270–279.
Wu, C.T., Altuwaijri, S., Ricke, W.A., Huang, S.P., Yeh, S., Zhang, C., Niu, Y.,
Tsai, M.Y., and Chang, C. (2007). Increased prostate cell proliferation and
loss of cell differentiation inmice lacking prostate epithelial androgen receptor.
Proc. Natl. Acad. Sci. USA 104, 12679–12684.
Xin, L., Ide, H., Kim, Y., Dubey, P., and Witte, O.N. (2003). In vivo regeneration
of murine prostate from dissociated cell populations of postnatal epithelia and
urogenital sinus mesenchyme. Proc. Natl. Acad. Sci. USA 100 (Suppl 1 ),
11896–11903.
Xin, L., Lawson, D.A., and Witte, O.N. (2005). The Sca-1 cell surface marker
enriches for a prostate-regenerating cell subpopulation that can initiate pros-
tate tumorigenesis. Proc. Natl. Acad. Sci. USA 102, 6942–6947.
Xin, L., Lukacs, R.U., Lawson, D.A., Cheng, D., and Witte, O.N. (2007). Self-
renewal and multilineage differentiation in vitro from murine prostate stem
cells. Stem Cells 25, 2760–2769.
Yao, D., Alexander, C.L., Quinn, J.A., Porter, M.J., Wu, H., and Greenhalgh,
D.A. (2006). PTEN loss promotes rasHa-mediated papillomatogenesis via
dual up-regulation of AKT activity and cell cycle deregulation but malignant
conversion proceeds via PTEN-associated pathways. Cancer Res. 66,
1302–1312.
Zhang, L., Valdez, J.M., Zhang, B., Wei, L., Chang, J., and Xin, L. (2011). ROCK
inhibitor Y-27632 suppresses dissociation-induced apoptosis of murine pros-
tate stem/progenitor cells and increases their cloning efficiency. PLoS ONE 6,
e18271.
Zhang, L., Zhang, B., Han, S.J., Shore, A.M, Rosen, J.M., DeMayo, F.J., and
Xin, L. (2012). Targeting CreERT2 expression to Keratin 8-expressing
murine simple epithelia using bacterial artificial chromosome transgenesis.
Transgenic Research, in press.
ancer Cell 21, 253–265, February 14, 2012 ª2012 Elsevier Inc. 265

Cancer Cell
Article
Activation of p53 by SIRT1 Inhibition EnhancesElimination of CML Leukemia Stem Cellsin Combination with ImatinibLing Li,1 Lisheng Wang,1 Liang Li,1 Zhiqiang Wang,2 Yinwei Ho,1 Tinisha McDonald,1 Tessa L. Holyoake,3
WenYong Chen,2,4,* and Ravi Bhatia1,4,*1Division of Hematopoietic Stem Cell and Leukemia Research2Department of Cancer BiologyCity of Hope National Medical Center, Duarte, CA 91010, USA3Section of Experimental Haematology, Institute of Cancer Sciences, University of Glasgow, Glasgow, G12 8QQ Scotland, UK4These authors contributed equally to this work
*Correspondence: [email protected] (W.C.), [email protected] (R.B.)DOI 10.1016/j.ccr.2011.12.020
SUMMARY
BCR-ABL tyrosine kinase inhibitors (TKI) fail to eliminate quiescent leukemia stem cells (LSC) in chronicmyelogenous leukemia (CML). Thus, strategies targeting LSC are required to achieve cure. We show thatthe NAD+-dependent deacetylase SIRT1 is overexpressed in human CML LSC. Pharmacological inhibitionof SIRT1 or SIRT1 knockdown increased apoptosis in LSC of chronic phase and blast crisis CML and reducedtheir growth in vitro and in vivo. SIRT1 effects were enhanced in combination with the BCR-ABL TKI imatinib.SIRT1 inhibition increased p53 acetylation and transcriptional activity in CML progenitors, and the inhibitoryeffects of SIRT1 targeting on CML cells depended on p53 expression and acetylation. Activation of p53 viaSIRT1 inhibition represents a potential approach to target CML LSC.
INTRODUCTION
Chronic myelogenous leukemia (CML) results from malignant
transformation of a hematopoietic stem cell (HSC) by the BCR-
ABL oncogene. CML usually presents in a chronic phase (CP)
but progresses to an accelerated phase (AP) and a terminal blast
crisis (BC) (Sawyers, 1999). The BCR-ABL tyrosine kinase inhib-
itors (TKI) imatinib (IM), nilotinib, and dasatinib are effective in
inducing remissions and prolonging survival of CP CML patients
but is less effective against advanced phase CML (Eiring et al.,
2011). However, even in CP CML, primitive leukemia stem cells
(LSC) are retained in patients achieving remission with TKI
treatment (Chu et al., 2011). Primitive, quiescent CML LSC are
resistant to apoptosis following TKI treatment despite effective
inhibition of BCR-ABL kinase activity (Holtz et al., 2005; Corbin
et al., 2011), the mechanisms for which are not well understood.
Significance
BCR-ABL kinase inhibitors (TKI) are effective in the treatment oremain a potential source of recurrence. The NAD-dependentstress and functions as a tumor suppressor or tumor promoter doverexpressed in CML LSC and that SIRT1 inhibition selectiveland activation of the p53 tumor suppressor. These results areacetylation contributes to CML LSC survival and resistance toselectively target LSC that resist elimination by current treatm
266 Cancer Cell 21, 266–281, February 14, 2012 ª2012 Elsevier Inc.
Disease recurrence is usually seen following cessation of drug
treatment, even in patients with undetectable BCR-ABL expres-
sion by q-PCR (Mahon et al., 2010). These observations suggest
that ‘‘cure’’ may be elusive for most CML patients with TKI alone.
CML patients currently need to take TKI treatment indefinitely,
with risks of toxicity, lack of compliance, drug resistance,
relapse, and associated expense.
Recent studies from our group have shown that pan-histone
deacetylase (HDAC) inhibitors in combination with IM signifi-
cantly increase apoptosis in quiescent CML stem cells (Zhang
et al., 2010). However, toxicity of this approach to normal stem
cells remains a potential concern. Sirtuins are NAD-dependent
histone deacetylases that have been linked to longevity in lower
organisms and to mammalian metabolism (Bordone and Guar-
ente, 2005; Liu et al., 2009a). Sirtuin 1 (SIRT1) is a member of
the sirtuin family that regulates numerous processes, including
f CML but do not eliminate leukemia stem cells (LSC), whichdeacetylase SIRT1 is reported to protect stem cells againstepending on cellular context. Our studies show that SIRT1 isy reduces CML LSC survival and growth through acetylationimportant because they show that SIRT1-mediated p53 de-TKI treatment. SIRT1 inhibition is an attractive approach toents.

Figure 1. Increased SIRT1 Expression in CML
Patients Compared with Normal Stem/Progenitor
Cells
(A) Expression of SIRT1mRNA in CP CML (n = 5), BC CML
(n = 5), cord blood (CB) (n = 6), and PBSC (n = 6) CD34+
cells analyzed by Q-PCR.
(B) Expression of SIRT1 protein in CP CML (n = 11) and BC
CML (n = 5) compared with CB CD34+ cells (n = 10) and
PBSC CD34+ cells (n = 8) analyzed by intracellular labeling
with anti-SIRT1 antibody. Median fluorescence intensity
(MFI) of SIRT1 was expressed relative to IgG control.
(C) Expression of SIRT1 in CML (n = 11) and CB (n = 10)
CD34+CD38+ committed progenitors (right panel).
Representative results are shown in panel (D): CML (blue),
CB (green), IgG (red).
(E) Expression of SIRT1 in CML (n = 11) and CB (n = 10)
CD34+CD38� stem cells/primitive progenitors. Repre-
sentative results are shown in panel (F): CML (blue), CB
(green), IgG (red). Significance: *p < 0.05, **p < 0.01 for the
indicated comparisons. See also Figure S1 and Table S1.
Cancer Cell
SIRT1 Inhibition Targets CML Stem Cells
aging, DNA repair, cell cycle, metabolism, and cell survival under
stress conditions (Bordone and Guarente, 2005; Liu
et al.,2009a). In contrast to Class I, II, and IV HDACs, SIRT1
activity is not inhibited by pan-HDAC inhibitors (Liu et al.,
2009a). SIRT1 plays an important role inmaintaining self-renewal
and differentiation of murine embryonic stem cells (ESC) and
HSC, especially under conditions of stress (Han et al., 2008; Nar-
ala et al., 2008; Ou et al., 2011). Importantly, SIRT1 may have
a pathogenetic role in solid tumors and leukemias (Brooks and
Gu, 2009; Liu et al., 2009a). SIRT1 can potentially regulate the
acetylation of several transcription factors, including p53 (Luo
et al., 2001), Ku70, and FoxOs (Brooks and Gu, 2009). Despite
the clear inhibitory effect of increased SIRT1 expression on
tumor suppressors like p53 and FoxOs, other studies suggest
that SIRT1 may also have tumor-suppressive functions. In the
Apc+/� mouse model of colon cancer, increased SIRT1 expres-
sion resulted in reduced cell proliferation and tumor formation
(Firestein et al., 2008). Activation of SIRT1 by resveratrol can limit
cell growth and reduce tumor formation in BRCA1-deficient
tumor cells and in Trp53+/�;Sirt1+/� mice (Wang et al., 2008a,
2008b). The precise role of SIRT1 in cancer may depend on
Cancer Cell 21, 266
the specific cell or tumor type and the presence
or absence of p53 (Brooks and Gu, 2009).
Previous studies have shown that SIRT1
expression is increased in CML blast crisis
(BC) cell lines (Chen et al., 2005). Here we inves-
tigated the contribution of SIRT1 to the survival
and growth of CP and BC CML LSC and
progenitor cells and in LSC resistance to TKI
treatment. We also investigated the role of p53
in mediating the effects of SIRT1 inhibition on
CML progenitors.
RESULTS
SIRT1 Is Overexpressed in CML CD34+
CellsSIRT1 mRNA levels were significantly elevated
in CP and BC CML CD34+ cells (Table S1 avail-
able online) compared to CD34+ cells from cord blood (CB) or
normal peripheral blood stem cell collections (PBSC) (Figure 1A).
SIRT1 protein levels in CML and normal CD34+CD38+
committed progenitors and CD34+CD38� primitive progenitors
were measured by intracellular labeling with anti-SIRT1 antibody
and flow cytometry (Figure S1A). The ability of intracellular
labeling to reliably measure SIRT1 expression was confirmed
by western blotting (Figure S1B). SIRT1 protein levels were
significantly elevated in CMLCP and BCCD34+ cells (Figure 1B),
CML CP CD34+CD38+ (Figures 1C and 1D), and CD34+CD38�
cells (Figures 1E and 1F) compared to their normal counterparts.
SIRT1 Inhibition Using shRNA Reduces CML ProgenitorProliferation, Survival, and Colony GrowthTo investigate the functional role of SIRT1 in CML and normal
progenitors, CML and normal CD34+ cells were transduced
with lentivirus vectors coexpressing SIRT1 or control shRNAs
together with RFP. CD34+RFP+ cells were selected using flow
cytometry. Western blotting confirmed effective inhibition of
SIRT1 expression, whereas the expression of the related
SIRT2 was not affected (Figures 2A and 2B).
–281, February 14, 2012 ª2012 Elsevier Inc. 267

Figure 2. SIRT1 Knockdown Using Specific Anti-SIRT1 shRNA Increases Apoptosis and Inhibits Proliferation of CML Progenitors
(A) Western blotting of SIRT1 and b-actin in CB CD34+ and CML CD34+ cells transduced with SIRT1 shRNAs (ShSIRT1-1 and ShSIRT1-2) or with Ctrl shRNA.
(B) Western blotting for SIRT1, SIRT2, and b-actin in ShSIRT1-1, ShSIRT1-2, or CtrlShRNA transduced TF-1 cells. Results are representative of 3 independent
experiments.
Cancer Cell
SIRT1 Inhibition Targets CML Stem Cells
268 Cancer Cell 21, 266–281, February 14, 2012 ª2012 Elsevier Inc.

Cancer Cell
SIRT1 Inhibition Targets CML Stem Cells
CD34+ cells were labeled with carboxyfluorescein diacetate
succinimidyl ester (CFSE) followed by culture for 72 hr in low
growth factor concentrations. SIRT1 knockdown inhibited CML
progenitor proliferation as measured by reduction in CFSE fluo-
rescence. Treatment with IM resulted in further reduction of
proliferation (Figure 2C). SIRT1 knockdown inhibited prolifera-
tion of CB CD34+ cells to a lesser extent than CML CD34+ cells
(Figure 2D). Expression of ShSIRT1-1, which results in near
complete inhibition of SIRT1 expression, resulted in reduced
survival of CML CD34+ cells (Figure 2E). IM treatment signifi-
cantly increased apoptosis of SIRT1 knockdown cells, indicating
that SIRT1 inhibition enhanced sensitivity of CML progenitors to
IM-induced apoptosis (Figure 2E). Enhanced apoptosis of CML
CD34+ cells following SIRT1 knockdown, and further increase
in apoptosis with IM treatment, was confirmed by Wright-
Giemsa staining (Figure S2A), trypan blue staining (Figure S2B),
and activated caspase-3 labeling (Figure S2C). Interestingly,
SIRT1 knockdown did not affect survival of normal progenitors,
with or without IM treatment (Figure 2F). Primitive, quiescent
CML CD34+ cells are especially resistant to IM-induced
apoptosis (Holtz et al., 2005). Importantly, the combination of
SIRT1 inhibition and IM enhanced apoptosis of quiescent CML
progenitors identified on the basis of high CFSE fluorescence
(Figure 2G). In contrast, SIRT1 inhibition did not affect survival
of quiescent normal progenitors (Figure 2H). Expression of
both ShSIRT1-1 and ShSIRT1-2 significantly reduced CML
colony forming cell (CFC) frequency in methylcellulose progen-
itor assays, which was enhanced by IM (Figure 2I). Inhibition of
normal CFC growth was also seen, but was significantly less
than for CML progenitors (Figure 2J).
The increased effects of ShSIRT1-1, compared to ShSIRT1-2,
suggest that partial inhibition of SIRT1 expression is sufficient to
inhibit CML progenitor proliferation, but that near complete
knockdown is required to inhibit survival. To exclude the possi-
bility that these results were related to off-target effects, we
designed a SIRT1 construct resistant to ShSIRT1-1 (SIRT1-R)
(Figure S2D). Lentivirus-mediated expression of wild-type (WT)
or SIRT1-R resulted in enhanced SIRT1 protein levels in TF-1/
BCR-ABL cells transduced with ShSIRT1-1 (Figure S2E) and
abrogated the ability of ShSIRT1-1 to induce apoptosis and
inhibit growth (Figures S2F and S2G). These results indicate
that ShSIRT1-1 shRNA effects are related to SIRT1 knockdown,
rather than off-target effects, and confirm that near complete
SIRT1 suppression is required to induce apoptosis in CML cells.
Pharmacological Inhibition of SIRT1 Induces Apoptosisand Inhibits Proliferation of CML Stem/PrimitiveProgenitor CellsWe tested the effects of tenovin-6 (TV-6), a small-molecule inhib-
itor of SIRT1, on CML and normal stem/progenitor cells (Lain
et al., 2008). CFSE-labeled CML and normal CD34+CD38� and
(C–J) CML (n = 5) and normal CB (n = 5) CD34+ cells transduced with Ctrl ShRNA,
72 hr. Division of CML (C) and normal CD34+ (D) cells was analyzed according t
ModFit software. Relative proliferation was calculated normalized to untreated co
Annexin V-Cy5 labeling. Apoptosis of undivided (CFSEhigh) CML (G) and CBCD34+
on CML (I) and normal CD34+ (J) RFP+ cells after culture with or without IM (2.5
14 days. Results represent mean ± SEM of separate experiments. Significance
Figure S2.
C
CD34+CD38+ cells were cultured for 72 hr with TV-6, IM, or the
combination. TV-6 significantly increased apoptosis of CML
CD34+CD38� cells and CD34+CD38+ cells, but not normal cells
(Figures 3A–3D). A small increase in apoptosis of normal
CD34+CD38+ cells was seen with higher doses of TV-6 (Fig-
ure 3D). Normal progenitor apoptosis was significantly less
than for CML progenitors (p < 0.05). The combination of IM
and TV-6 increased apoptosis in CML progenitors compared
to either agent alone, and to a significantly greater extent than
normal progenitors (Figures 3A–3D). Importantly, TV-6 also re-
sulted in increased apoptosis of CFSEhigh undivided CML
CD34+CD38� and CD34+CD38+ cells, but did not increase
apoptosis of undivided normal cells (Figures 3E–3I). A small
increase in apoptosis of undivided normal cells was seen with
higher doses of TV-6 (Figure 3H), but was significantly less
than for CML cells (p < 0.05). Pretreatment with TV-6 for 72 hr
inhibited CFC production from CML CD34+CD38� and CD34+
CD38+ cells but not normal CD34+CD38� andCD34+CD38+ cells
(Figures 3J–3M). The combination of TV-6 with IM enhanced
inhibition of CML CFC growth compared to either agent alone,
but did not enhance inhibition of normal CFC. Similar results
were seen for cells exposed to TV-6 in methylcellulose for the
14-day duration of the CFC assay (Figures S3A and S3B). Expo-
sure to IM for 14 days markedly inhibited CML and normal CFC
growth (p < 0.01) compared to 14 days of exposure to TV-6
(Figures S3A and S3B). TV-6 also increased apoptosis in total
and undivided CD34+ cells from CML BC patients for whom IM
treatment failed, and inhibited growth of CD34+ cells in CFC
assays (Figures 3N and 3O). In addition, TV-6 inhibited BaF3
cells expressing the IM-resistant T315I BCR-ABL mutant
(BaF3/T315I) to a similar extent as BaF3 cells expressing wild-
type BCR-ABL (BaF3/BA) (Figure S3C).
The effects of SIRT1 deletion on BM progenitors from young
mice are apparent only when cells are grown at low O2 tensions
(Ou et al., 2011). We investigated whether selective effects of
SIRT1 inhibition on CML compared to normal cells were main-
tained at lowO2 tensions. TV-6-induced (2 mM) apoptosis of total
(Figures S3D–S3K) or undivided normal CD34+CD38+ cells was
increased in hypoxic compared to normoxic conditions (Figures
S3G and S3K). Inhibition of normal CD34+CD38+ cell prolifera-
tion and CFC formation was also increased in hypoxic conditions
(Figures S3O and S3S). On the other hand, the effects of
TV-6 on survival, proliferation, and colony formation of normal
CD34+CD38� cells (Figures S3E, S3I, S3M, and S3Q) or CML
CD34+CD38� cells (Figures S3D, S3H, S3L, and S3P) andCD34+
CD38+ cells were not significantly different in hypoxic versus nor-
moxic conditions (Figures S3F, S3J, S3N, and S3R).
TV-6 did not result in additional inhibition of proliferation of
SIRT1 knockdown TF-1/BCR-ABL cells (Figure S3T). In addition,
MEF from SIRT1 knockout mice (SIRT1-KO) cells were resistant
to TV-6 (data not shown). Finally, ectopic expression of SIRT1
ShSIRT1-1, or ShSIRT1-2 vectors were cultured with or without IM (2.5 mM) for
o reduction in CFSE intensity, and a proliferation index was determined using
ntrols. Apoptosis of CML (E) and normal (F) CD34+RFP+ cells was analyzed by
(H) cells was analyzed by Annexin V-Cy5 labeling. CFC assayswere performed
mM) for 72 hr. Erythrocytic and granulocytic colonies were enumerated after
: *p < 0.05, **p < 0.01, ***p < 0.001, compared with untreated cells. See also
ancer Cell 21, 266–281, February 14, 2012 ª2012 Elsevier Inc. 269

Cancer Cell
SIRT1 Inhibition Targets CML Stem Cells
270 Cancer Cell 21, 266–281, February 14, 2012 ª2012 Elsevier Inc.

Cancer Cell
SIRT1 Inhibition Targets CML Stem Cells
decreased the sensitivity of TF-1/BCR-ABL cells to TV-6 (IC50
2 mM in parental TF-1/BCR-ABL and 4.3 mM in ectopic SIRT1 ex-
pressing TF-1/BCR-ABL cells). These results suggest that TV-6
effects are indeed SIRT1 mediated.
SIRT1 Inhibition Impairs CML LSC Engraftmentin Immunodeficient MiceWe evaluated the effect of ex vivo treatment with TV-6 on CML
and normal CD34+ stem cells capable of engraftment in NOD/
SCID interleukin-2 receptor-g chain-deficient (NSG) mice (Shultz
et al., 2005) (Figure 4A). We observed reduced engraftment of
CML CD34+ cells treated with TV-6 (1 mM) for 72 hr at 4 weeks
(short-term engraftment) (p < 0.05) (Figure S4A) and 12 weeks
posttransplantation (longer term engraftment) (Figures S4C
and S4D). Engraftment of CD33+ and CD14+ myeloid cells was
decreased (Figures S4E and S4F). Q-PCR analysis confirmed
that engrafted human cells expressed BCR-ABL (Figure S4G),
and FISH analysis showed that 90% of engrafted human cells
were BCR-ABL+. These results show that SIRT1 inhibition by
TV-6 selectively targets primitive human CML cells with in vivo
engraftment capacity. We also compared the effect of IM
(2.5 mM), TV-6 (1 mM), or the combination on CML CD34+ cell
engraftment in NSG mice (Figures 4B–4G). CML cells treated
with IM alone (p = 0.06) and TV-6 alone (p < 0.05) demonstrated
reduced engraftment in BM at 12 weeks posttransplant
compared to untreated controls (Figure 4B). The combination
of IM and TV-6 resulted in further inhibition of CML CD34+ cell
engraftment compared to IM or TV-6 alone (Figures 4B–4D),
including reduced engraftment of myeloid cells (Figures 4E and
4F). Q-PCR analysis confirmed that engrafted cells expressed
BCR-ABL, and that BCR-ABL expression was reduced in cells
treated with IM and IM plus TV-6 (Figure 4G). Interestingly,
engraftment of CB CD34+ cells at both 4 weeks (Figure S4B)
and 12 weeks (Figures 4H–4K) was not reduced after treatment
with TV-6.
SIRT1 Inhibitor Treatment Reduces CML Stemand Progenitor Cell Growth In VivoThe low levels of longer term engraftment of CML CP cells in
NSG mice limits the use of this model to evaluate the effects of
treatments administered in vivo. An inducible BCR-ABL trans-
genic mouse model of CML provides a representative model of
CP CML that can be used for in vivo therapeutic studies (Zhang
et al., 2010). These BCR-ABLmicewere crossedwith GFP trans-
genic mice, and BM cells were obtained 4 weeks after BCR-ABL
induction. GFP-expressing cells selected using flow cytometry
Figure 3. Pharmacological Inhibition of SIRT1 Induces Apoptosis and
(A–D) CML CD34+CD38� (n = 6) (A), normal CD34+CD38� (n = 4, 2 CB and 2 PBSC
and 2 PBSC) cells (D) were exposed to TV-6 (0.5 mM [TV0.5] or 1 mM [TV1.0]), IM (2
labeling.
(E–H) Apoptosis of undivided CML CD34+CD38�CFSEhigh (E), normal CD34+CD
CFSEhigh cells (H) analyzed by Annexin V labeling.
(I) Representative flow cytometry plots showing Annexin V+ versus CFSE expres
(J–M) CML (J) or normal (K) CD34+ CD38� cells, and CML (L) or normal (M) C
combination for 72 hr, then were plated in methylcellulose progenitor culture, an
(N) Apoptosis of total or undivided CFSEhigh CML BC (n = 4) CD34+ cells expose
(O) CML BC (n = 4) CD34+ cells exposed to TV-6 (0.5, 1, or 2 mM) were plated in
were enumerated after 14 days. Results represent the mean ± SEM of separate
untreated controls. See also Figure S3.
C
were transplanted into wild-type FVB/N mice irradiated at 900
cGy. Following engraftment, mice were treated for 3 weeks
with IM (200 mg/kg/day by gavage), TV-6 (50 mg/kg/day intra-
peritoneally), the combination of TV-6 and IM, or vehicle
(controls) (Figure 5A). TV-6 treated mice demonstrated loss of
weight (data not shown) compared to control or IM-treated
mice. Leukemic GFP+ WBC and BMmyeloid cells were reduced
in TV-6 or IM treated mice, with further reduction with combina-
tion treatment (Figures 5B and 5C and Figure S5A). Flow cytom-
etry analysis (Figure 5D) showed that combined TV-6 and IM
treatment inhibited primitive GFP+Lin�Sca-1+Kit+ cells (LSK
cells) (Figure S5B), LTHSC (LSK Flt3�CD150+CD48� cells)
(Figures 5E and 5F), common myeloid progenitors (CMP) and
granulocytic-macrophage progenitors (GMP) in the BM of CML
mice to a greater extent than IM or TV-6 alone (Figure 5G and
Figure S5C). Similar results were observed for splenic cells (Fig-
ure 5H, Figure S5D, and data not shown). In vivo administration
of IM and TV-6 resulted in inhibition of LSK cell proliferation
measured by EdU and DAPI labeling (Figure 5I) and enhanced
LSK cells apoptosis (Figure 5J). Mice treated with the combina-
tion demonstrated significantly improved survival and main-
tained normal WBC counts with only small number of residual
GFP+ WBCs after discontinuation of treatment, compared to
control, IM and TV-6 treated mice (Figures 5K–5M).
Consistent with previous reports, BC CML cells demonstrate
robust engraftment in NSG mice with primitive CD34+ cells (Fig-
ure S5E–S5I), allowing evaluation of in vivo treatment with TV-6.
NSG mice engrafted with cells from an IM-resistant CML BC
patient were treated with TV-6 (50 mg/kg/day intraperitoneally)
or vehicle control for 3 weeks. TV-6 significantly reduced total
human cells (p < 0.01) (Figures S5F and S5G) and human
CD34+ cells and myeloid cells in the BM, spleen, and peripheral
blood (Figures S5H–S5K). TV-6 treatment also enhanced survival
of mice transplanted with BaF3/T315I cells that are resistant to
treatment with IM (Figure S5L), further demonstrating its in vivo
activity against IM-resistant cells.
SIRT1 Inhibition Enhances p53 Acetylation in CMLProgenitorsSIRT1 activity can be assessed by examining acetylation of p53
at K382, a known SIRT1 deacetylation site. SIRT1 knockdown
using shRNA resulted in an increase in acetylated p53 protein
levels in CP CML CD34+ cells (Figure 6A and Figure S6A).
Although increased p53 acetylation was detectable in SIRT1
knockdown cells in the absence of TSA (Figure S6A), it was
more clearly seen in cells in which classic HDAC activity was
Inhibits Proliferation of CML Stem/Primitive Progenitor Cells
) (B), CML CD34+CD38+ (n = 6) (C), and normal CD34+CD38+ cells (n = 4, 2 CB
.5 mM), or the combination for 72 hr. Apoptosis was analyzed by Annexin V-Cy5
38�CFSEhigh (F), CML CD34+CD38+CFSEhigh (G), and normal CD34+CD38+
sion.
D34+CD38� cells were cultured with TV-6 (0.5 or 1 mM), IM (2.5 mM), or the
d colonies were enumerated after 14 days.
d to TV-6 (0.5, 1, or 2 mM) for 72 hr analyzed by Annexin V-Cy5 labeling.
methylcellulose progenitor culture and erythrocytic, and granulocytic colonies
experiments. Significance: *p < 0.05, **p < 0.01, ***p < 0.001, compared with
ancer Cell 21, 266–281, February 14, 2012 ª2012 Elsevier Inc. 271

Figure 4. SIRT1 Inhibition Reduces Longer Term Engraftment of CML Stem Cells in Immunodeficient Mice
(A) CML or normal CD34+ cells were treated with TV-6, IM, or combination in vitro and were injected into sublethally irradiated (300 cGy) NSG mice. After 4 or
12 weeks, human cell engraftment was analyzed by flow cytometric assessment of human CD45+ cells.
(B and C) The number (B) and the percentage (C) of humanCD45+ cells engrafted in the BM12weeks after transplantation of CMLCD34+ cells (13 106 cells/mouse).
Cancer Cell
SIRT1 Inhibition Targets CML Stem Cells
272 Cancer Cell 21, 266–281, February 14, 2012 ª2012 Elsevier Inc.

Cancer Cell
SIRT1 Inhibition Targets CML Stem Cells
inhibited by TSA treatment (Luo et al., 2001; Cheng et al., 2003).
Exposure of CMLCP or BCCD34+ cells to TV-6 also significantly
enhanced acetylated p53 levels in both hypoxic and normoxic
conditions (Figures 6B and 6C and Figures S6B and S6C). TV-
6 treatment also increased total p53 levels, possibly by reducing
degradation (Lain et al., 2008). Cells pretreated with the MDM2
antagonist Nutlin-3 to stabilize p53 levels (Vassilev et al., 2004)
before the addition of TV-6 showed a rapid and marked increase
in p53 acetylationwithout a change in total p53 levels (Figure 6B).
In contrast, TV-6 did not increase acetylated p53 or total p53
levels in normal CD34+ cells (Figure S6D). Acetylated p53 signals
were increased and showed a nuclear distribution in SIRT1
knockdown cells (Figure 6D). A modest increase in acetylation
of the SIRT2 substrate a-tubulin (Lain et al., 2008) was also
seen after 48 hr, suggesting that prolonged TV-6 exposure
may also modestly inhibit SIRT2 activity (Figure S6E). However,
the more rapid and pronounced effect on p53 acetylation indi-
cates more efficient inhibition of SIRT1 compared to SIRT2
activity. Ectopic expression of BCR-ABL in CB CD34+ cells
also resulted in increased expression of SIRT1, which was asso-
ciated with reduced levels of acetylated p53 despite increased
levels of total p53 (Figure S6F).
Treatment with classic HDACs can reduce BCR-ABL expres-
sion in cell lines and BCCML cells (Fiskus et al., 2006). BCR-ABL
protein levels were not reduced in CP or BC CML CD34+ cells
after SIRT1 inhibition using either shRNA or TV-6 (Figures 6B,
6C, and 6E and Figures S6B and S6C). Treatment with IM
reduced tyrosine phosphorylation of the BCR-ABL substrate
CrkL in CML CD34+ cells, confirming inhibition of BCR-ABL
kinase activity (Figure 6A and Figure S6B). In contrast, SIRT1
inhibition did not reduce phosphorylation in CML CD34+ cells
(Figures 6A and 6C and Figures S6B and S6C). Therefore, the
effects of SIRT1 inhibition on CML CD34+ cells cannot be ex-
plained by inhibition of BCR-ABL expression or activity. Treat-
ment with IM resulted in modest reduction in SIRT1 levels and
in total p53 but not acetylated p53 levels (Figure 6A and
Figure S6B).
SIRT1 Inhibition Increases p53 Transcriptional ActivityIrradiation of CML CD34+ progenitors resulted in increased p53
levels (Figure 7A) and increased expression of p53 target genes,
including p21, Necdin (Ndn), Puma, and Bax (Figure 7B). Knock-
down of p53 in CML CD34+ cells using lentivirus vectors
expressing anti-p53 shRNA (Figure 7C) resulted in reduced
expression of p21 and Ndn (Figure 7D). These results indicate
that p53 signaling remains subject to activation in CP CML
CD34+ cells. To examine the effect of SIRT1 knockdown on
p53 transcriptional activity in BCR-ABL expressing cells, we
(D) The percentage of human CD45+ cells engrafted in the spleen at 12 weeks. Cel
one patient (n = 3 for untreated control and TV-6 treated cells, n = 4 for IM and c
(E) Engraftment of human CD34, CD33, CD11b, CD14, and CD19 subsets (no C
(F) Representative results for CD45 and CD33 expression.
(G) BCR-ABL mRNA levels in CD45+ cells engrafted in BM at 12 weeks were me
(H and I) The total number (H) and percentage (I) of human CD45+ cells engrafte
injected/mouse; n = 4 for untreated control; n = 7 for TV-6 treated cells).
(J) Engraftment of human CD34, CD33, CD11b, CD14, CD3, and CD19 cell subs
(K) Representative results for CD45 and CD19 expression. Results represent th
compared with untreated cells. See also Figure S4.
C
cotransfected a p53 expression vector and the BP-100 p53
reporter plasmid (MDM2 promoter cloned upstream of the lucif-
erase gene) (Dai et al., 2004) into the p53 null CML cell line K562
(Bi et al., 1992). SIRT1 knockdown resulted in increased p53
activity (p < 0.05) compared with controls (Figure 7E). SIRT1
knockdown also increased the activity of endogenous p53 in
293 cells (Figure S7A). Importantly, SIRT1 knockdown increased
expression of p53 target genes in CML CD34+ cells on Q-PCR
analysis, including Gfi-1, Ndn, and Bax (p < 0.05) (Figure 7F).
Although p21 is also a p53-regulated gene in CML CD34+ cells,
it was not further induced by SIRT1 knockdown.
Treatment with IM resulted in a modest reduction in p53 levels
in CMLCD34+ progenitors (Figures 6A and 7G) but did not signif-
icantly affect p53 acetylation or expression of p53 target genes
(Figure S7B). Knockdown of p53 in CML CD34+ cells using
anti-p53 shRNA did not affect the ability of IM to induce
apoptosis (Figure S7C) or inhibit proliferation (Figure S7D),
indicating that IM-mediated inhibition of CML progenitors is
independent of p53 expression. The combination of IM and
Nutlin-3 induced significantly more apoptosis than either agent
did alone (data not shown), indicating that p53 signaling can
be activated in IM-treated CML CD34+ cells. SIRT1 inhibition in
IM-treated CML CD34+ progenitors by anti-SIRT1 shRNA
expression resulted in increased expression of acetylated p53
(Figure 6A). Upregulation of p53 target genes was also seen
following SIRT1 knockdown in IM-treated cells (Figure 7H).
These observations indicate that SIRT1 knockdown can activate
p53 signaling in IM-treated CML cells.
Inhibition of CML Progenitor Survival by SIRT1Knockdown Requires p53 Expression and AcetylationTo determine the role of p53 in mediating the effects of SIRT1
inhibition on CML progenitors, we evaluated whether shRNA-
mediated p53 knockdown could mitigate the effects of SIRT1
inhibition on CML progenitors. CML CD34+ cells were cotrans-
duced with a lentivirus vector coexpressing SIRT1 shRNA and
RFP and a second vector coexpressing p53 shRNA and GFP,
followed by selection of cells expressing both RFP and GFP (Fig-
ure 8A). Inhibition of p53 expression significantly reduced
apoptosis (Figures 8A and 8B) and enhanced growth (Figure 8C)
of SIRT1-knockdown CML CD34+ cells. In addition, p53 knock-
down CML progenitors exposed to TV-6 showed reduced
apoptosis compared with control cells exposed to TV-6 (Fig-
ure 8D). These results confirm an important role for p53 in
SIRT1-mediated signaling in CML progenitors.
To determine the role of p53 acetylation in mediating SIRT1
effects, we expressed an acetylation-defective p53 mutant
(p53-8KR, with all eight potential acetylation sites mutated) in
ls from two patients were injected. The figure shows representative results from
ombination treatment).
D3-positive cells were seen).
asured by Q-PCR.
d in the BM of NSG mice receiving CB CD34+ cells at 12 weeks (1 3 105 cells
ets.
e mean ± SEM of separate experiments. Significance: *p < 0.05, **p < 0.01
ancer Cell 21, 266–281, February 14, 2012 ª2012 Elsevier Inc. 273

Figure 5. SIRT1 Inhibition Reduces In Vivo Growth of CML Stem Cells
(A) BCR-ABL mice were crossed with GFP transgenic mice and BM cells obtained 4 weeks after induction of BCR-ABL expression. GFP+ cells selected by flow
cytometry were transplanted into wild-type FVB/N mice irradiated at 900 cGy. Following engraftment, mice were treated for 3 weeks with IM (200 mg/kg/day by
gavage), TV-6 (5 0mg/kg/day intraperitoneally), the combination of TV-6 and IM, or vehicle (controls) (n = 6 mice each).
(B) GFP+ WBC counts 3 weeks after start of treatment.
Cancer Cell
SIRT1 Inhibition Targets CML Stem Cells
274 Cancer Cell 21, 266–281, February 14, 2012 ª2012 Elsevier Inc.

D
E
β-actin
BCR-ABL
ShSIRT1
Acetylated p53 p53 DAPI Merge
CtrlShRNA
CA B
Ac-p53
(K382)
β-actin
p-CrkL
p53
BCR-ABL
SIRT1
With Nutlin
SIRT1
Ac-p53
( K382)
p53
β-actin
BCR-ABL
p-CrkL
p-p53(ser15)
Ac-p53
(K382)
p53
SIRT1
β-actin
p-CrkL 210kD
145kD
210kD
145kD
Figure 6. Increased p53 Acetylation and
Nuclear Localization in SIRT1-Inhibited
CML CD34+ Cells
(A) Western blotting for acetylated p53 (K382),
total p53, p-p53 (ser 15), b-actin, SIRT1, and
p-CrkL in SIRT1 knockdown in CML CD34+ cells
cultured with TSA (0.1 mM) for 2 hr and exposed to
IM (2.5 mM) for 8 hr.
(B) Western blotting for acetylated p53 (K382),
total p53, b-actin, SIRT1, p-CrkL, and BCR-ABL in
CML CD34+ cells cultured with Nutlin-3 (10 mM) for
2 hr and exposed to TV-6 for 6 hr.
(C) Western blotting for acetylated p53 (K382),
total p53, b-actin, SIRT1, p-CrkL, and BCR-ABL in
CML BCCD34+ cells cultured with TV-6 (1 or 2 mM)
for 16 hr.
(D) Immunofluorescence analysis of Ac-p53 and
p53 in CD34+ cells. All scale bars represent a size
of 10 mm. Results are representative of 3 inde-
pendent experiments.
(E) Western blotting for BCR-ABL and b-actin in
SIRT1 knockdown CML CD34+ cells exposed to
IM 2.5 mM for 24 hr. See also Figure S6.
Cancer Cell
SIRT1 Inhibition Targets CML Stem Cells
p53 null K562 cells. Inhibition of SIRT1 using shRNA or TV-6 did
not inhibit growth or induce apoptosis in parental K562 cells (p >
0.05) (Figure S8). However, SIRT1 knockdown in K562 cells that
ectopically expressedWT p53 protein led to increased p53 acet-
ylation (Figure 8E) and significant growth inhibition and
apoptosis (p < 0.05) (Figures 8F and 8G). In contrast, ectopically
(C) GFP+ myeloid cells (Gr-1+Mac-1+) cells in the BM.
(D) Schema for analysis of LTHSC (E) GFP+ LTHSC in BM.
(F) Representative plot for BM LTHSC for vehicle control and combination.
(G) GFP+ GMP in BM.
(H) GFP+ LTHSC in spleen. Apoptosis and cell cycling in BM LSK cells was evaluated after 5 days of treatm
(I) Mice were injected intraperitoneally with EdU and were euthanized 2 hr later. The percentage of stem c
incorporation in BM LSK cells. Representative results from one of two experiments are shown.
(J) Apoptosis was evaluated by Annexin-V and DAPI labeling (n = 3 mice per group). Significance: *p < 0.05
(K) Mice were followed for survival for 85 days after discontinuation of treatment (n = 6 per group). Surv
significantly longer than that of mice receiving IM or TV-6 alone or vehicle-treated cohorts (p < 0.05, Wilcoxo
remained alive until day 85, when the experiment was terminated.
(L andM) The total WBC count (L) andGFP+WBC count (M) in PB ofmice 4weeks after discontinuation of treat
with IM. Results represent the mean ± SEM of separate experiments. See also Figure S5.
Cancer Cell 21, 266–281,
expressed p53-8KR was not acetylated
following SIRT1 knockdown (Figure 8H),
and K562 cells transfected with p53-
8KR did not show significant growth inhi-
bition or apoptosis following SIRT1
knockdown (Figures 8I and 8J). These
results indicate that p53 acetylation is
required for growth inhibition and
apoptosis following SIRT1 inhibition in
BCR-ABL-expressing cells.
DISCUSSION
Our results show that inhibition of SIRT1
deacetylase enhances targeting of LSC
from CML patients by TKI treatment via
activation of p53 signaling, indicating an
important role for SIRT1 in maintaining LSC growth and survival.
Both BCR-ABL kinase-dependent and kinase-independent
mechanisms contribute to increased SIRT1 activity in CML cells,
with the latter potentially including epigenetic silencing of HIC1,
a negative regulator of SIRT1, through methylation (Chen et al.,
2005), or altered miRNA regulation of SIRT1 expression (Strum
ent.
ells in S-phase was determined according to EdU
, **p < 0.01, compared with vehicle control.
ival of mice receiving combination treatment was
n test). Two mice receiving combination treatment
ment. Significance: *p < 0.05, **p < 0.01, compared
February 14, 2012 ª2012 Elsevier Inc. 275

Figure 7. Signaling through p53 Is Intact in CML Progenitors, Is Enhanced by SIRT1 Knockdown, and Is Not Affected by IM(A) Western blotting for p53 in CML CD34+ cells 6 hr after exposure to irradiation (3 Gy). Results are representative of 3 independent experiments.
(B) Q-PCR analysis of p53 target genes in CP CML and normal CD34+ cells 6 hr after irradiation (3 Gy) compared with nonirradiated control cells. b-2M was used
as an internal control.
(C) Western blotting for p53 expression in CML CD34+ cells transduced with an anti-p53 shRNA vector. Results are representative of 3 independent experiments.
(D) Q-PCR analysis of p53 target genes in p53 knockdown and control cells.
(E) SIRT1 knockdown or control K562 cells (n = 3) were cotransfected with plasmids expressing p53, a luciferase reporter for p53 transcription (BP100) and
b-galactosidase. Relative luciferase units are normalized to b-gal expression.
(F) Q-PCR analysis of p53 target genes in shSIRT1 compared with ctrl shRNA expressing CML CD34+ cells (n = 3).
(G) Western blotting for acetylated p53 (K382), total p53, p-CrkL, and b-actin in CML CD34+ cells treated with IM (2.5 mM), Nutlin-3, or the combination for 8 hr.
(H) Q-PCR analysis for p53 target genes in ShSIRT1 compared with control shRNA-transduced CML CD34+ cells treated with IM (2.5 mM) for 24 hr (n = 4).
Significance: *p < 0.05, **p < 0.01, compared with controls. Results shown represent the mean ± SEM of separate experiments. See also Figure S7.
Cancer Cell
SIRT1 Inhibition Targets CML Stem Cells
276 Cancer Cell 21, 266–281, February 14, 2012 ª2012 Elsevier Inc.

Cancer Cell
SIRT1 Inhibition Targets CML Stem Cells
et al., 2009). The selectivity of SIRT1 inhibition towardCML stem/
progenitor cells is maintained in hypoxic conditions, where
SIRT1 plays an important role in supporting normal hematopoi-
esis (Ou et al., 2011).
SIRT1 can deacetylate several lysine residues in the tumor
suppressor p53 (Luo et al., 2001; Brooks andGu, 2009). A variety
of posttranslational modifications that can regulate p53 activity,
including phosphorylation, acetylation, methylation, and sumoy-
lation, have been described (Vousden and Lane, 2007). Acetyla-
tion is reported to play an important role in stabilization, nuclear
localization, and transcriptional activation of p53 (Prives and
Manley, 2001) and can lead to p53 activation independently of
phosphorylation status (Tang et al., 2008). Although p53 muta-
tions may occur on progression to BC CML, they are rare in
CP CML (Prokocimer and Rotter, 1994). Our results indicate
that p53 remains responsive to stress-induced activation in
CML progenitors. SIRT1 inhibition increased p53 acetylation
and expression of several p53 target genes, including Bax,
Necdin, and Gfi-1, in CML CD34+ cells. Bax is an important pro-
apoptotic gene, andNecdin andGfi-1may be important for p53-
regulated quiescence of HSC (Liu et al., 2009b). Additional p53
target genes besides those identified here may also contribute
to the effects of SIRT1 inhibition. Although p21 expression was
reduced in CML progenitors after p53 knockdown, SIRT1 knock-
down did not increase expression of p21 in CML progenitors,
suggesting that other SIRT1-regulated pathways may coun-
teract the effects of p53 acetylation on p21 induction (Cheng
et al., 2003). BC CML cells also demonstrated increased p53
acetylation following SIRT1 inhibition, consistent with recent
reports that p53 can be activated in CML BC cells (Peterson
et al., 2011). Of note, the CML BC samples studied here did
not have p53 mutations (Table S1).
Although previous studies indicated that the p53 inactivation
by SIRT1 promotes cell survival during stress (Luo et al., 2001),
other studies have suggested that small-molecule SIRT1 inhibi-
tors do not affect cell survival (Solomon et al., 2006) and that
developmental defects in a SIRT1 knockout mouse strain are
not rescued by crossing to p53 null mice (Kamel et al., 2006).
The importance of p53 in mediating SIRT1 effects may depend
on the cellular context. SIRT1 deacetylates several other
proteins that regulate cell growth and survival besides p53.
The importance of individual SIRT1 targets may depend on the
cell process and cell type studied. Recent studies within our
group indicate an important role for SIRT1 regulation of Ku70
in DNA repair and mutagenicity of CML cells (unpublished
data). The role of other SIRT1 targets such as the FoxOs and
E2F1 transcription factors in regulating quiescence and survival
of CML stem and progenitor cells requires further evaluation.
There is considerable interest in restoring p53 function in
cancer cells as a means of inhibiting their proliferation, or
inducing senescence or apoptosis. Deacetylation of p53 via
SIRT1 may play an important role in preventing p53 activation
in TKI-treated CML progenitors. BCR-ABL kinase activity could
also modulate p53 in CML cells by upregulation of ARF (Williams
et al., 2006), phosphorylation and inactivation of MDM2 and
MDMX (Zuckerman et al., 2009), or increased translation of
MDM2 (Trotta et al., 2003). Despite the complex regulation of
p53 in CML cells, our studies show that enhanced p53 acetyla-
tion following SIRT1 inhibition is sufficient to increase p53
C
transcriptional activity in CML progenitor cells and that p53 de-
acetylation is an important protective mechanism for CML LSC
following TKI treatment. Therefore, p53 activation is a potential
strategy to enhance targeting of CML LSC, especially in combi-
nation with TKI.
SIRT1 inhibitors are being investigated as potential anticancer
treatments. We observed weight loss in mice during the course
of three-week TV-6 treatment, but it is unclear whether this
was related to SIRT1 inhibition or an off-target effect of this
agent. Although TV-6 itself may not be a candidate for drug
development, our observations support further investigation of
SIRT1 inhibition as an approach for targeting of CML stem/
progenitor cells in combination with TKI treatment. The potential
tumor suppressive effects of SIRT1 need to be kept inmindwhen
considering SIRT1 inhibitors for cancer treatment. Improved
understanding of mechanisms underlying the anticancer versus
tumor-promoting effects of SIRT1 inhibition in specific cell types
will aid the development of more selective, nontoxic approaches
for targeting LSCs in future. The results of the current studies
have broader implication to other leukemias, such as AML,
where SIRT1 overexpression is also observed and p53 muta-
tions are rare (Kojima et al., 2005).
EXPERIMENTAL PROCEDURES
Samples and Materials
CB samples were provided by StemCyte (Arcadia, CA). CP CML samples were
obtained from previously untreated patients at the City of Hope (COH) and the
University of Glasgow. CML BC samples were obtained from patients at COH
(Table S1). CD34+ cell isolation and CD3+ cell depletion were performed using
magnetic beads (StemCell Technologies, Vancouver, BC, Canada). Leuko-
pheresis samples were processed for CD34+ cell selection with CliniMACS
(Miltenyi Biotech, Germany). CD34+CD38� and CD34+CD38+ cells were ob-
tained by flow cytometry sorting. All subjects signed an informed consent
form. Sample acquisition was approved by the Institutional Review Boards
at the City of Hope, in accordance with an assurance filed with and approved
by the Department of Health and Human Services, and the North Glasgow
University Hospital Division of NHS Greater Glasgow and Clyde, and met all
requirements of the Declaration of Helsinki. Details of cell lines, drugs, and
DNA constructs are provided in the Supplemental Experimental Procedures.
Cell Transduction and Transfection
CD34+ cells were transduced with lentivirus vectors expressing SIRT1 shRNA
or p53 shRNA. TF-1/BCR-ABL (TF-1/BA) cells were transduced with PITA-
SIRT1-R, PITA-SIRT1-WT, and vector controls (PITA). Details of the transduc-
tion procedure are provided in the Supplemental Experimental Procedures.
Intracellular Staining for SIRT1
CD34+ cells were labeled with antibodies to CD34-PeCy7, Lin-APC-Cy7
(including CD2, CD7, CD10, CD11B, CD19, CD33, and CD235a), and CD38-
APC (e-Bioscience), followed by fixation and permeabilization (Cytofix/Cyto-
perm Kit, Beckman Coulter, Fullerton, CA). Cells were then labeled with rabbit
anti-human SIRT1 (Epitomics) followed by Alexa 488-conjugated goat anti-
rabbit antibodies (Molecular Probes) and were analyzed by flow cytometry.
Data were analyzed using FlowJo software (version 8.5.2; TreeStar, Ashland,
OR). For immunofluorescence analysis, cells were labeled with anti-p53-
FITC (DO-7, BD) and antiacetylated p53-K382-Alex647 (BD), as described in
the Supplemental Experimental Procedures.
Analysis of Proliferation, Apoptosis, and Colony Growth
CD34+ cells were labeled with CFSE (Molecular Probes, Eugene, OR),
labeled with CD34-PE-Cy7 and CD38-APC, and CD34+CD38� and
CD34+CD38+ cells with uniform CFSE labeling were selected by flow cytom-
etry (MoFlo; Cytomation, Fort Collins, CO). Cells were cultured with low
ancer Cell 21, 266–281, February 14, 2012 ª2012 Elsevier Inc. 277
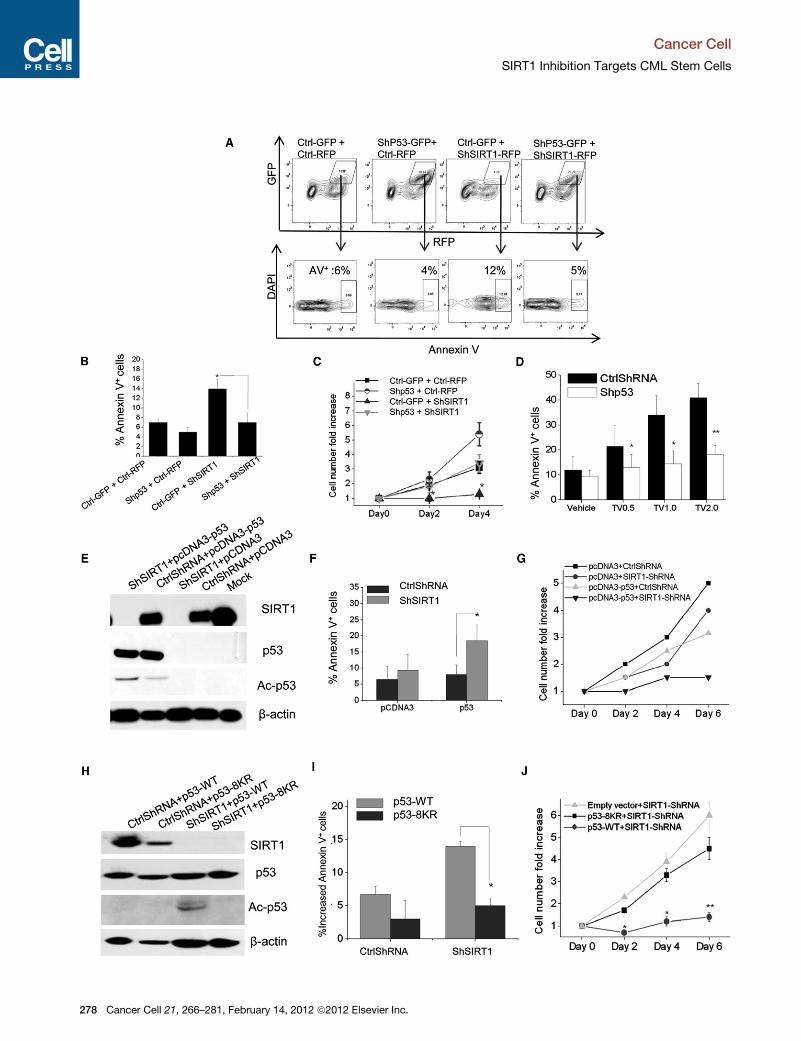
Cancer Cell
SIRT1 Inhibition Targets CML Stem Cells
278 Cancer Cell 21, 266–281, February 14, 2012 ª2012 Elsevier Inc.

Cancer Cell
SIRT1 Inhibition Targets CML Stem Cells
concentrations of growth factors at 37�C for up to 72 hr in normoxic condi-
tions (21% O2). For specific experiments, cells were cultured hypoxic condi-
tions (5% O2) as specifically indicated in the Results. Cells were analyzed
by flow cytometry for apoptosis by Annexin V labeling and for proliferation
by reduction in CFSE labeling. Committed progenitors or colony forming
cells (CFC) were evaluated in methylcellulose progenitor assays as previ-
ously described. Details are provided in Supplemental Experimental
Procedures.
Engraftment of Human Cells in Immunodeficient Mice
CML CD34+ cells (1 3 106 cells/ mouse) or CB CD34+ cells (1 3 105 cells/
mouse) were cultured for 72 hr with TV-6 (1 mM), IM (2.5 mM), or the
combination or without drug (control) and were transplanted via tail vein
injection into sublethally irradiated (300 cGy) 8-week-old NOD.Cg-
Prkdcscid IL2rgtm1Wjl /SzJ mice (NSG mice, Jackson Laboratory, Bar
Harbor, ME). Mice were euthanized after 4 or 12 weeks, and marrow
contents of femurs, spleen cells, and blood cells were obtained. For
CML BC samples, MNC depleted of CD3+ cells were transplanted via tail
vein injection (5 3 106 cells/mouse). Blood samples were obtained 4 weeks
after transplantation to confirm human CD45+ cells engraftment. Mice were
treated with TV-6 (50 mg/kg intraperitoneally daily for 21 days) (Lain et al.,
2008) or vehicle (control) for 3 weeks and were euthanized, and marrow
and spleen cells were obtained and analyzed as described in Supplemental
Experimental Procedures. Mouse care and experimental procedures were
performed in accordance with established institutional guidance and
approved protocols from the Institutional Animal Care and Use Committee
at COHNMC.
In Vivo Treatment of Transgenic BCR-ABL Mice
These experiments were performed using inducible, transgenic GFP-Scl-tTa-
BCR-ABL mice in the FVB/N background crossed with transgenic GFP-ex-
pressing mice (FVB.Cg-Tg [ACTB-EGFP] B5Nagy/J, Jackson Laboratories)
(Zhang et al., 2010). Mice were treated with IM (200 mg/kg daily by gavage
for 21 days), TV-6 (50 mg/kg body weight intraperitoneally daily for 21 days),
the combination, or vehicle alone (control). After 3 weeks of treatment,
animals were euthanized, and marrow and spleen cells were obtained. The
number of total nucleated cells, GFP-expressing cells, and GFP+ myeloid,
progenitor, and stem cell populations were measured by flow cytometry.
The effect of drug administration on apoptosis and cycling of stem cells
in vivo was evaluated. Another subset of mice was followed after discontin-
uation of treatment, and survival was monitored for 85 days, PB counts were
monitored for 28 days. Details are provided in the Supplemental Experi-
mental Procedures. Mouse care and experimental procedures were per-
formed in accordance with established institutional guidance and approved
protocols from the Institutional Animal Care and Use Committee at
COHNMC.
Figure 8. Effect of SIRT1 Inhibition in CML Progenitors Is Dependent o
(A–C) CML CD34+ cells were cotransduced with PLKO-GFP vectors expressing
control shRNA.
(A) CD34+GFP+RFP+ cells were analyzed for apoptosis by Annexin V labeling. A
(B) Cumulative results for apoptosis (n = 3).
(C) The total number of CD34+GFP+RFP+ cells normalized to ctrl ShRNA expres
(D) p53 knockdown or control CML progenitors were exposed to TV-6 for 48 hr, a
*p < 0.05, **p < 0.01, ***p < 0.001, compared with untreated cells.
(E–G) K562 cells transduced with HIV7-RFP vectors expressing anti-SIRT1 or co
(E) Western blotting for acetylated p53 (K382), total p53, SIRT1, and b-actin.
(F) Apoptosis was assessed after 48 hr by Annexin V labeling.
(G) The fold change in cell numbers was calculated at day 2, day 4, and day 6 re
(H–J) K562 cells expressing a tet transactivator gene (K562-TTA) were generate
RFP+ cells were selected and transfected with acetylation-defective (p53-8KR) an
by cotransfection with a b-gal plasmid.
(H) Western blotting for acetylated p53 (K382), total p53, SIRT1, and b-actin.
(I) Apoptosis was evaluated after 48 hrs by Annexin V labeling. Results are norm
(J) The fold change in cell numbers at day 2, day 4, and day 6 was calculated
Significance: *p < 0.05, **p < 0.01, compared with controls. See also Figure S8.
C
Luciferase Reporter Assays
K562 or 293 cells were transfected with reporter and internal control (b-gal
or Renilla-CMV) plasmids. Luciferase assays were performed after 48 hr in
triplicate using the luciferase reporter assay system (Promega).
Real-Time Q-PCR Analysis
Q-PCR analysis performedwith primers and probes for p21,Bax, Puma,Noxa,
Necdin, Gfi-1, and Sirt1, and BCR-ABL (B3A2) transcripts were measured
using a real-time TaqMan assay as previously described (Chu et al., 2011).
Details are provided in the Supplemental Experimental Procedures.
Western Blotting
Western blotting was performed for p53, acetylated p53, phospho-p53,
SIRT1, CrkL, phopho-CrkL, Bax, ABL, tubulin, and actin. Details are provided
in the Supplemental Experimental Procedures.
Statistics
Data from independent experiments were reported as the mean ± SEM.
Student’s t test analysis was performed to determine statistical significance.
SUPPLEMENTAL INFORMATION
Supplemental Information includes one table, eight figures, Supplemental
Experimental Procedures and can be found with this article online at
doi:10.1016/j.ccr.2011.12.020.
ACKNOWLEDGMENTS
This work was supported by the National Institutes of Health (grants R01
HL77847 and R01 CA95684), a research grant from the Samuel Waxman
Cancer Research Foundation, a Translational Research grant from the
Leukemia and Lymphoma Society (to R.B.), and a V Foundation translational
grant (to W.Y.C. and R.B.). W.Y.C. is supported by National Institutes of
Health grant R01 CA143421. T.L.H. is supported by Cancer Research UK Pro-
gramme grant C11074/A11008. We acknowledge the excellent technical
support of theCOHNMCAnalytical Cytometry, Synthetic Chemistry, andCyto-
genetics cores, and the Animal ResourcesCenter. We thank StemCyte for their
generous gift of CB samples, and Allen Lin for collection of patient samples.
This study was supported by the Glasgow Experimental Cancer Medicine
Centre (ECMC), which is funded by Cancer Research UK and by the Chief
Scientist’s Office (Scotland). We thank Dr. M.S. Dai (Oregon Health and
Sciences University) for the generous gift of the pcDNA3-p53 and mdm2-luc
(BP100) plasmids, and Dr. Wei Gu (Columbia University) for the generous gift
of the PTRE2-hyg-p53 and pTRE2-hyg-p53-8KR plasmids. Ling Li designed
and performed research, analyzed and interpreted data, and wrote the manu-
script. L.W. designed and performed experiments and reviewed the
n p53 Expression and Acetylation
anti-p53 or control shRNA and PHIV7-RFP vectors expressing anti-SIRT1 or
representative plot is shown.
sing cells (n = 3).
nd apoptosis was analyzed by Annexin V labeling (n = 3). Significance values:
ntrol shRNA were transfected with p53 expressing plasmids.
lative to day 0.
d and transduced with HIV7-RFP vectors expressing ShSIRT1 or Ctrl ShRNA.
dwild-type p53 constructs (n = 3). Similar transfection efficiencywas confirmed
alized to K562-RFP cells transfected with empty vector.
relative to day 0. Results represent mean ± SEM for separate experiments.
ancer Cell 21, 266–281, February 14, 2012 ª2012 Elsevier Inc. 279

Cancer Cell
SIRT1 Inhibition Targets CML Stem Cells
manuscript. Liang Li designed and performed experiments and reviewed the
manuscript. Z.W. designed and performed experiments and reviewed
the manuscript. Y.H. performed experiments and reviewed the manuscript.
T.M. performed experiments and reviewed the manuscript. T.H. provided
material, interpreted data, and reviewed the manuscript. W.Y.C. designed
the study, analyzed and interpreted data, and wrote the manuscript. R.B. de-
signed the study, analyzed and interpreted data, and wrote the manuscript.
Received: April 29, 2011
Revised: November 1, 2011
Accepted: December 20, 2011
Published: February 13, 2012
REFERENCES
Bi, S., Hughes, T., Bungey, J., Chase, A., de Fabritiis, P., and Goldman, J.M.
(1992). p53 in chronic myeloid leukemia cell lines. Leukemia 6, 839–842.
Bordone, L., and Guarente, L. (2005). Calorie restriction, SIRT1 and metabo-
lism: understanding longevity. Nat. Rev. Mol. Cell Biol. 6, 298–305.
Brooks, C.L., and Gu, W. (2009). How does SIRT1 affect metabolism, senes-
cence and cancer? Nat. Rev. Cancer 9, 123–128.
Chen, W.Y., Wang, D.H., Yen, R.C., Luo, J., Gu, W., and Baylin, S.B. (2005).
Tumor suppressor HIC1 directly regulates SIRT1 to modulate p53-dependent
DNA-damage responses. Cell 123, 437–448.
Cheng, H.L., Mostoslavsky, R., Saito, S., Manis, J.P., Gu, Y., Patel, P.,
Bronson, R., Appella, E., Alt, F.W., and Chua, K.F. (2003). Developmental
defects and p53 hyperacetylation in Sir2 homolog (SIRT1)-deficient mice.
Proc. Natl. Acad. Sci. USA 100, 10794–10799.
Chu, S., McDonald, T., Lin, A., Chakraborty, S., Huang, Q., Snyder, D.S., and
Bhatia, R. (2011). Persistence of leukemia stem cells in chronic myelogenous
leukemia patients in prolonged remission with imatinib treatment. Blood 118,
5565–5572.
Corbin, A.S., Agarwal, A., Loriaux, M., Cortes, J., Deininger, M.W., and Druker,
B.J. (2011). Human chronic myeloid leukemia stem cells are insensitive to
imatinib despite inhibition of BCR-ABL activity. J. Clin. Invest. 121, 396–409.
Dai, M.S., Zeng, S.X., Jin, Y., Sun, X.X., David, L., and Lu, H. (2004). Ribosomal
protein L23 activates p53 by inhibiting MDM2 function in response to ribo-
somal perturbation but not to translation inhibition. Mol. Cell. Biol. 24, 7654–
7668.
Eiring, A.M., Khorashad, J.S., Morley, K., and Deininger, M.W. (2011).
Advances in the treatment of chronic myeloid leukemia. BMC Med. 9, 99.
Fiskus, W., Pranpat, M., Balasis, M., Bali, P., Estrella, V., Kumaraswamy, S.,
Rao, R., Rocha, K., Herger, B., Lee, F., et al. (2006). Cotreatment with vorino-
stat (suberoylanilide hydroxamic acid) enhances activity of dasatinib (BMS-
354825) against imatinib mesylate-sensitive or imatinib mesylate-resistant
chronic myelogenous leukemia cells. Clin. Cancer Res. 12, 5869–5878.
Firestein, R., Blander, G.,Michan, S., Oberdoerffer, P., Ogino, S., Campbell, J.,
Bhimavarapu, A., Luikenhuis, S., de Cabo, R., Fuchs, C., et al. (2008). The
SIRT1 deacetylase suppresses intestinal tumorigenesis and colon cancer
growth. PLoS ONE 3, e2020.
Han,M.K., Song, E.K., Guo, Y., Ou, X., Mantel, C., and Broxmeyer, H.E. (2008).
SIRT1 regulates apoptosis and Nanog expression in mouse embryonic stem
cells by controlling p53 subcellular localization. Cell Stem Cell 2, 241–251.
Holtz, M.S., Forman, S.J., and Bhatia, R. (2005). Nonproliferating CML CD34+
progenitors are resistant to apoptosis induced by a wide range of proapoptotic
stimuli. Leukemia 19, 1034–1041.
Kamel, C., Abrol, M., Jardine, K., He, X., and McBurney, M.W. (2006). SirT1
fails to affect p53-mediated biological functions. Aging Cell 5, 81–88.
Kojima, K., Konopleva, M., Samudio, I.J., Shikami, M., Cabreira-Hansen, M.,
McQueen, T., Ruvolo, V., Tsao, T., Zeng, Z., Vassilev, L.T., and Andreeff, M.
(2005). MDM2 antagonists induce p53-dependent apoptosis in AML: implica-
tions for leukemia therapy. Blood 106, 3150–3159.
Lain, S., Hollick, J.J., Campbell, J., Staples, O.D., Higgins, M., Aoubala, M.,
McCarthy, A., Appleyard, V., Murray, K.E., Baker, L., et al. (2008). Discovery,
280 Cancer Cell 21, 266–281, February 14, 2012 ª2012 Elsevier Inc.
in vivo activity, and mechanism of action of a small-molecule p53 activator.
Cancer Cell 13, 454–463.
Liu, T., Liu, P.Y., and Marshall, G.M. (2009a). The critical role of the class III
histone deacetylase SIRT1 in cancer. Cancer Res. 69, 1702–1705.
Liu, Y., Elf, S.E., Miyata, Y., Sashida, G., Liu, Y., Huang, G., Di Giandomenico,
S., Lee, J.M., Deblasio, A., Menendez, S., et al. (2009b). p53 regulates hema-
topoietic stem cell quiescence. Cell Stem Cell 4, 37–48.
Luo, J., Nikolaev, A.Y., Imai, S., Chen, D., Su, F., Shiloh, A., Guarente, L., and
Gu, W. (2001). Negative control of p53 by Sir2alpha promotes cell survival
under stress. Cell 107, 137–148.
Mahon, F.X., Rea, D., Guilhot, J., Guilhot, F., Huguet, F., Nicolini, F., Legros, L.,
Charbonnier, A., Guerci, A., Varet, B., et al; Intergroupe Francais des
Leucemies Myeloıdes Chroniques. (2010). Discontinuation of imatinib in
patients with chronic myeloid leukaemia who have maintained complete
molecular remission for at least 2 years: the prospective, multicentre Stop
Imatinib (STIM) trial. Lancet Oncol. 11, 1029–1035.
Narala, S.R., Allsopp, R.C., Wells, T.B., Zhang, G., Prasad, P., Coussens, M.J.,
Rossi, D.J., Weissman, I.L., and Vaziri, H. (2008). SIRT1 acts as a nutrient-
sensitive growth suppressor and its loss is associated with increased AMPK
and telomerase activity. Mol. Biol. Cell 19, 1210–1219.
Ou, X., Chae, H.D., Wang, R.H., Shelley,W.C., Cooper, S., Taylor, T., Kim, Y.J.,
Deng, C.X., Yoder, M.C., and Broxmeyer, H.E. (2011). SIRT1 deficiency
compromises mouse embryonic stem cell hematopoietic differentiation, and
embryonic and adult hematopoiesis in the mouse. Blood 117, 440–450.
Peterson, L.F., Mitrikeska, E., Giannola, D., Lui, Y., Sun, H., Bixby, D., Malek,
S.N., Donato, N.J., Wang, S., and Talpaz, M. (2011). p53 stabilization induces
apoptosis in chronic myeloid leukemia blast crisis cells. Leukemia 25,
761–769.
Prives, C., and Manley, J.L. (2001). Why is p53 acetylated? Cell 107, 815–818.
Prokocimer, M., and Rotter, V. (1994). Structure and function of p53 in normal
cells and their aberrations in cancer cells: projection on the hematologic cell
lineages. Blood 84, 2391–2411.
Sawyers, C.L. (1999). Chronic myeloid leukemia. N. Engl. J. Med. 340, 1330–
1340.
Shultz, L.D., Lyons, B.L., Burzenski, L.M., Gott, B., Chen, X., Chaleff, S., Kotb,
M., Gillies, S.D., King, M., Mangada, J., et al. (2005). Human lymphoid and
myeloid cell development in NOD/LtSz-scid IL2R gamma null mice engrafted
with mobilized human hemopoietic stem cells. J. Immunol. 174, 6477–6489.
Solomon, J.M., Pasupuleti, R., Xu, L., McDonagh, T., Curtis, R., DiStefano,
P.S., and Huber, L.J. (2006). Inhibition of SIRT1 catalytic activity increases
p53 acetylation but does not alter cell survival following DNA damage. Mol.
Cell. Biol. 26, 28–38.
Strum, J.C., Johnson, J.H., Ward, J., Xie, H., Feild, J., Hester, A., Alford, A.,
and Waters, K.M. (2009). MicroRNA 132 regulates nutritional stress-induced
chemokine production through repression of SirT1. Mol. Endocrinol. 23,
1876–1884.
Tang, Y., Zhao, W., Chen, Y., Zhao, Y., and Gu, W. (2008). Acetylation is indis-
pensable for p53 activation. Cell 133, 612–626.
Trotta, R., Vignudelli, T., Candini, O., Intine, R.V., Pecorari, L., Guerzoni, C.,
Santilli, G., Byrom, M.W., Goldoni, S., Ford, L.P., et al. (2003). BCR/ABL acti-
vates mdm2 mRNA translation via the La antigen. Cancer Cell 3, 145–160.
Vassilev, L.T., Vu, B.T., Graves, B., Carvajal, D., Podlaski, F., Filipovic, Z.,
Kong, N., Kammlott, U., Lukacs, C., Klein, C., et al. (2004). In vivo activation
of the p53 pathway by small-molecule antagonists of MDM2. Science 303,
844–848.
Vousden, K.H., and Lane, D.P. (2007). p53 in health and disease. Nat. Rev.
Mol. Cell Biol. 8, 275–283.
Wang, R.H., Sengupta, K., Li, C., Kim, H.S., Cao, L., Xiao, C., Kim, S., Xu, X.,
Zheng, Y., Chilton, B., et al. (2008a). Impaired DNA damage response, genome
instability, and tumorigenesis in SIRT1 mutant mice. Cancer Cell 14, 312–323.
Wang, R.H., Zheng, Y., Kim, H.S., Xu, X., Cao, L., Luhasen, T., Lee, M.H., Xiao,
C., Vassilopoulos, A., Chen,W., et al. (2008b). Interplay among BRCA1, SIRT1,
and Survivin during BRCA1-associated tumorigenesis. Mol. Cell 32, 11–20.

Cancer Cell
SIRT1 Inhibition Targets CML Stem Cells
Williams, R.T., Roussel, M.F., and Sherr, C.J. (2006). Arf gene loss enhances
oncogenicity and limits imatinib response inmousemodels of Bcr-Abl-induced
acute lymphoblastic leukemia. Proc. Natl. Acad. Sci. USA 103, 6688–6693.
Zhang, B., Strauss, A.C., Chu, S., Li, M., Ho, Y., Shiang, K.D., Snyder, D.S.,
Huettner, C.S., Shultz, L., Holyoake, T., and Bhatia, R. (2010). Effective target-
ing of quiescent chronic myelogenous leukemia stem cells by histone deace-
C
tylase inhibitors in combination with imatinib mesylate. Cancer Cell 17,
427–442.
Zuckerman, V., Lenos, K., Popowicz, G.M., Silberman, I., Grossman, T.,
Marine, J.C., Holak, T.A., Jochemsen, A.G., and Haupt, Y. (2009). c-Abl phos-
phorylates Hdmx and regulates its interaction with p53. J. Biol. Chem. 284,
4031–4039.
ancer Cell 21, 266–281, February 14, 2012 ª2012 Elsevier Inc. 281