Embed Size (px)
Citation preview
World One Powerful Presentation Template
Allan Fogwill, CEO
Canadian Energy Research Institute June 2018
CANADIAN OIL SANDS AND CONVENTIONAL OIL AND GAS
PRODUCTION FORECAST, SUPPLY COSTS AND
EMISSIONS
Relevant • Independent • Objective www.ceri.ca

Canadian Energy Research Institute
Overview
Founded in 1975, the Canadian Energy Research Institute (CERI) is an independent,
registered charitable organization specializing in the analysis of energy economics and
related environmental policy issues in the energy production, transportation, and
consumption sectors.
Our mission is to provide relevant, independent, and objective economic research of
energy and environmental issues to benefit business, government, academia and the
public.
CERI publications include:
•Market specific studies
•Geopolitical analyses
•Commodity reports (crude oil, electricity and natural gas)
In addition, CERI hosts an annual Petrochemical Conference.

Canadian Energy Research Institute CERI receives financial support from its core funders which include
Natural Resources Canada, AB Energy and the Canadian Association
of Petroleum Producers.
In addition, the institute benefits from funds provided by donors which
include:
• AB’s Industrial Heartland
• Chemistry Industry Association of Canada
• Government of SK
• Ivey Foundation
• University of Calgary
• Canadian Energy Pipeline Association
CERI also receives in-kind support from the following contributors:
• AB Energy Regulator
• Lithuanian Energy Institute
• Deloitte Canada Ltd. • 360 Energy Inc.
• Atlantic Institute for Market Studies
• Petroleum Services Association of Canada
• Advisian Worley Parsons Group
• Bow Valley College
• Canadian Council for Aboriginal Business
Presentation Outline
Background
Production Outlook
Supply Costs
Emissions
Downstream Markets

Background

Changes in the oil market 2014-2018
Source: Bllomberg
• The WTI oil price rebounded to more than $70 just recently from $40s in September 2016
• OPEC compliance to cuts is 162% as of May 2018
• OECD inventories returned to 5 year averages

Imminent undersupply and price volatility?
Source: IEA
Towards the end of 2022 available spare production capacity will fall below 2 million b/d if there is no significant growth in investments (IEA, March 2017)
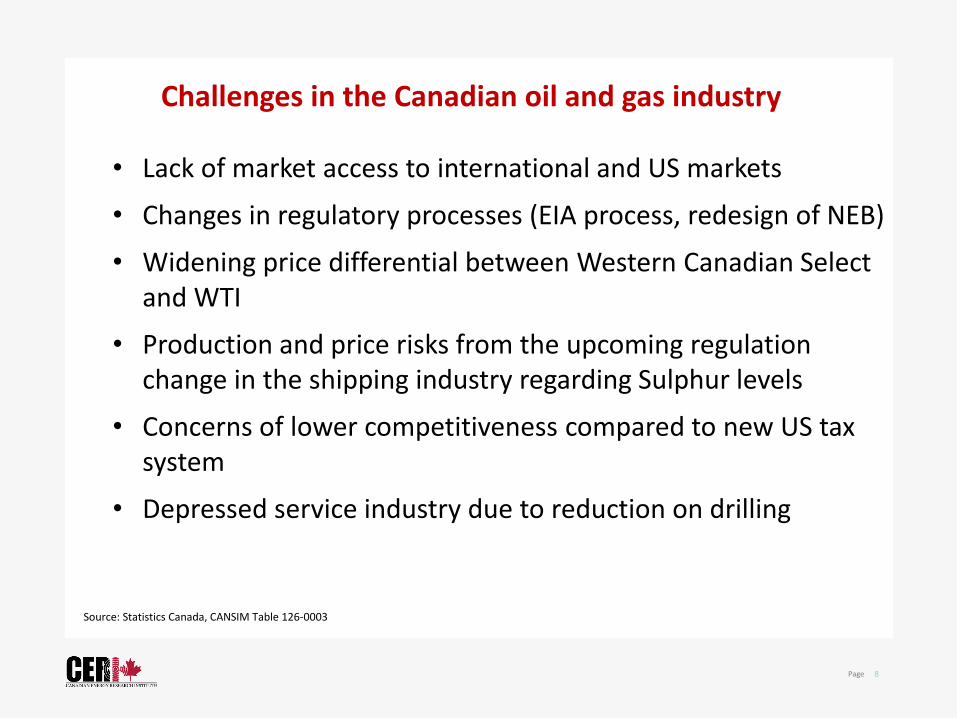
Challenges in the Canadian oil and gas industry
Source: Statistics Canada, CANSIM Table 126-0003
• Lack of market access to international and US markets
• Changes in regulatory processes (EIA process, redesign of NEB)
• Widening price differential between Western Canadian Select and WTI
• Production and price risks from the upcoming regulation change in the shipping industry regarding Sulphur levels
• Concerns of lower competitiveness compared to new US tax system
• Depressed service industry due to reduction on drilling

Total Canadian oil production
Source: Statistics Canada, CANSIM Table 126-0003
0
500
1000
1500
2000
2500
3000
3500
4000
4500
2009 2010 2011 2012 2013 2014 2015 2016 2017
(Mb
/d)
Atlantic ON MB SK AB AB -Bitumen & SCO BC NWT
11.1%

US Crude Imports from Canada
Source: US EIA
55% 57%59%
59%59%
60%62% 61% 66%
-
500
1,000
1,500
2,000
2,500
3,000
3,500
4,000
2009 2010 2011 2012 2013 2014 2015 2016 2017
(Mb
/d
)
Light Sweet Light Sour Medium Heavy Sweet Heavy Sour
18.7%

Market access and crude by rail
Source: JWN, NEB

Canada’s Gas Production, Exports and Imports
Source: JWN, NEB
15.88 16.62 16.81
17.91 18.30
7.63 7.22 7.19 7.99 8.12
2.50 2.11 1.92 2.11 2.51
5.14 5.11 5.27 5.88 5.60
-
2.00
4.00
6.00
8.00
10.00
12.00
14.00
16.00
18.00
20.00
2013 2014 2015 2016 2017
Canada's Gas Exports and Production, bcf/d
Gas Production Gas exports to US Gas imports (from US) Net exports

US Gas Industry Developments in 2017
Source: EIA

The Battle for the Central Canada Gas Market
Source: CERI, EIA
• Eastwards throughput of TransCanada Mainline (at the Prairie point) fell from 5.97 bcf/d in 2006 to 2.17 bcf/d in 2017 (-3.8 bcf/d)
• Imports from US increased for the same period (+1.6 bcf/d)
-63%
+170%
Dominion Hub minus Henry Hub

The Battle for the US Gas Market
Source: CERI, EIA
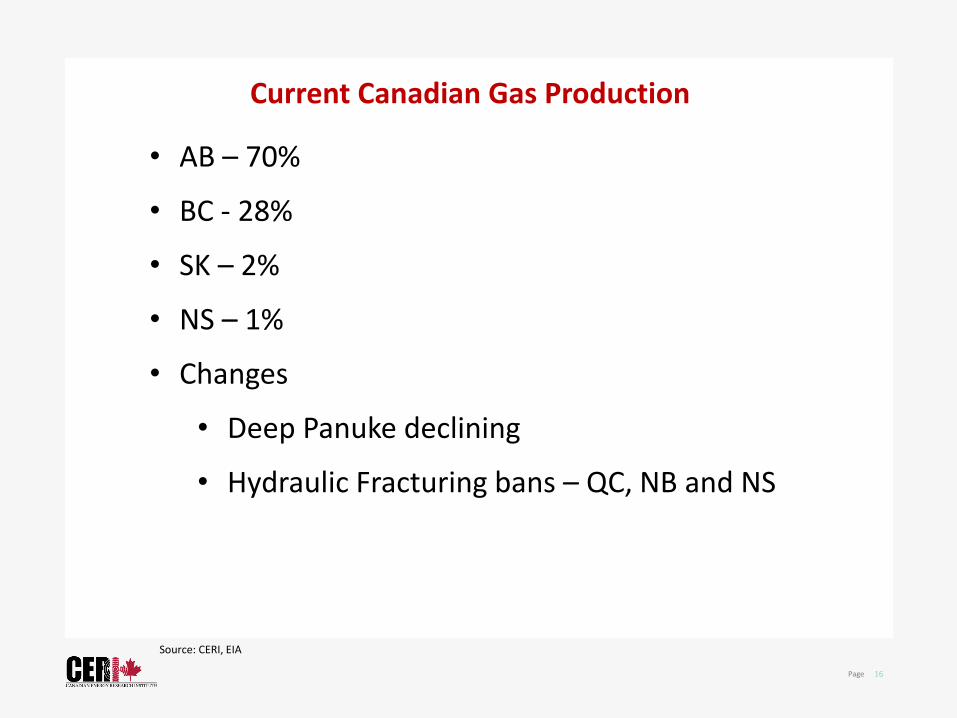
Current Canadian Gas Production
Source: CERI, EIA
• AB – 70%
• BC - 28%
• SK – 2%
• NS – 1%
• Changes
• Deep Panuke declining
• Hydraulic Fracturing bans – QC, NB and NS

Production Outlook

Canadian Oil Sands Production
Source: CERI, Canoils
0
1,000
2,000
3,000
4,000
5,000
6,000
7,000
8,0002
00
7
20
08
20
09
20
10
20
11
20
12
20
13
20
14
20
15
20
16
20
17
20
18
20
19
20
20
20
21
20
22
20
23
20
24
20
25
20
26
20
27
20
28
20
29
20
30
20
31
20
32
20
33
20
34
20
35
20
36
20
37
20
38
('0
00
bp
d)
Total Bitumen (Production, High Case) Total Bitumen (Production, Reference Case)
Total Bitumen (Production, Low Case)
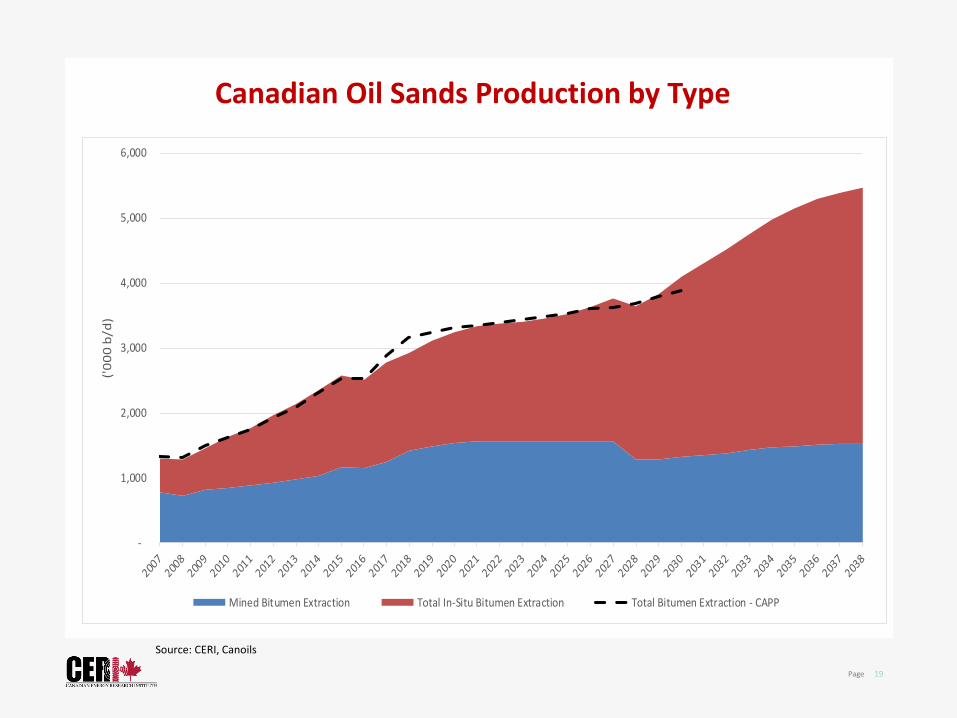
Canadian Oil Sands Production by Type
Source: CERI, Canoils
-
1,000
2,000
3,000
4,000
5,000
6,000
('0
00
b/d
)
Mined Bitumen Extraction Total In-Situ Bitumen Extraction Total Bitumen Extraction - CAPP

Canadian Conventional Crude Oil Production
Source: CERI, BCOGC, AER, Government of SK, Government of MB, CNLOPB, PSAC, CAPP
Source: CERI, BCOGC, AER, Government of SK, Government of MB, CNLOPB, PSAC, CAPP

Total Canadian Oil Production
Source: CERI, BCOGC, AER, Government of SK, Government of MB, CNLOPB, PSAC, CAPP
Source: CERI, BCOGC, AER, Government of SK, Government of MB, CNLOPB, PSAC, CAPP

Canadian Natural Gas Production
Source: CERI, BCOGC, AER, Government of SK, Government of MB, CNLOPB, PSAC, CAPP
Source: CERI, BCOGC, AER, Government of SK, Government of MB, CNLOPB, PSAC, CAPP

Production Costs
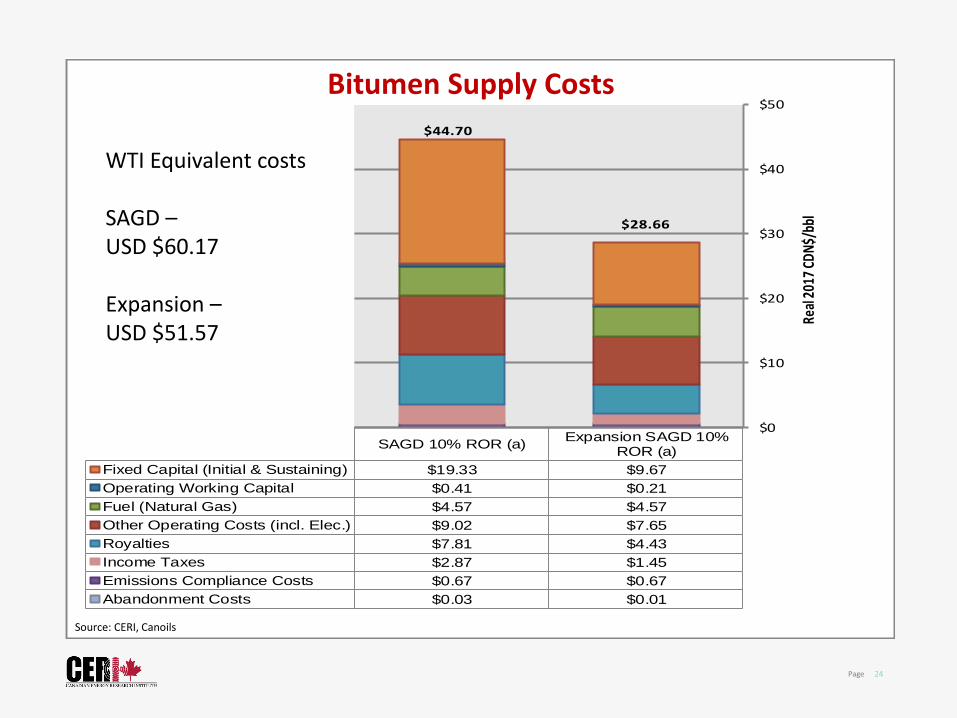
SAGD 10% ROR (a)Expansion SAGD 10%
ROR (a)
Fixed Capital (Initial & Sustaining) $19.33 $9.67
Operating Working Capital $0.41 $0.21
Fuel (Natural Gas) $4.57 $4.57
Other Operating Costs (incl. Elec.) $9.02 $7.65
Royalties $7.81 $4.43
Income Taxes $2.87 $1.45
Emissions Compliance Costs $0.67 $0.67
Abandonment Costs $0.03 $0.01
$0
$10
$20
$30
$40
$50
Real
201
7 CD
N$/
bbl
$44.70
$28.66
Source: CERI, Canoils
WTI Equivalent costs SAGD – USD $60.17 Expansion – USD $51.57
Bitumen Supply Costs

Conventional Oil Supply Costs ($/bbl)
$52
$80-$39 $73-$51
Horn River
Montney
Spirit River
Duvernay
Cardium
Viking
Bakken
$28
$43-$30 $58-$25
$32
$46
$45-$40
$59
$56-$20
$40-$32
Legend: $X (Vertical)-$Y (Horizontal)

Natural Gas Supply Costs ($/mmscf)
Horn River
Montney
Spirit River
Duvernay
Cardium
Viking
Bakken
Legend: $X (Vertical)-$Y (Horizontal)
$1.7-$2.9
$1.8
$1.8-$1.7
$1.7-$1.9
$1.8-$1.7
$1.4-$1.6 $2.2-$1.8
$2.5-$1.6
$2.7

Emissions
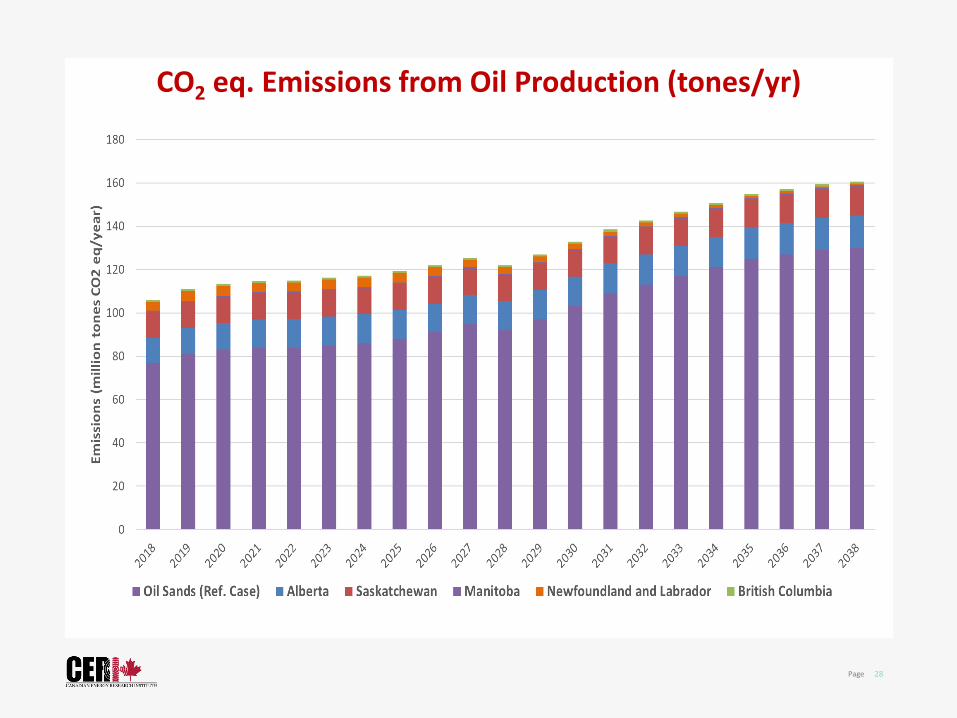
CO2 eq. Emissions from Oil Production (tones/yr)
Source: CERI, BCOGC, AER, Government of SK, Government of MB, CNLOPB, PSAC, CAPP

CO2 eq. Emissions from Gas Production (tones/yr)
Source: CERI, BCOGC, AER, Government of SK, Government of MB, CNLOPB, PSAC, CAPP

Downstream Markets
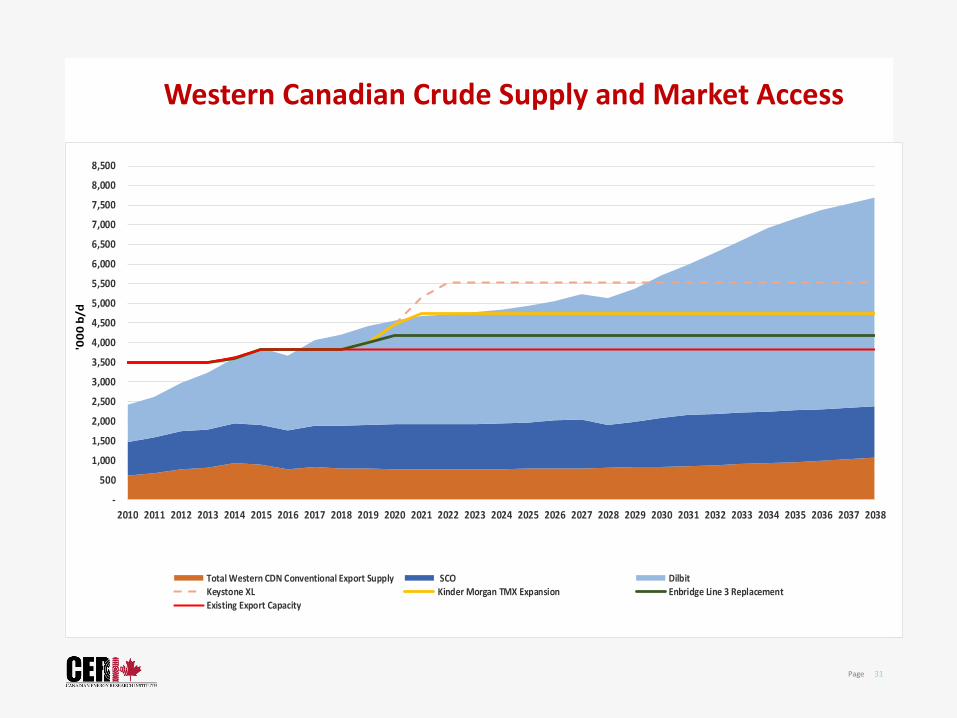
Western Canadian Crude Supply and Market Access
-
500
1,000
1,500
2,000
2,500
3,000
3,500
4,000
4,500
5,000
5,500
6,000
6,500
7,000
7,500
8,000
8,500
2010 2011 2012 2013 2014 2015 2016 2017 2018 2019 2020 2021 2022 2023 2024 2025 2026 2027 2028 2029 2030 2031 2032 2033 2034 2035 2036 2037 2038
'00
0 b
/d
Total Western CDN Conventional Export Supply SCO DilbitKeystone XL Kinder Morgan TMX Expansion Enbridge Line 3 ReplacementExisting Export Capacity

Conclusions • Reasonable growth expected in Oil Sands and
conventional oil in Canada
• Offshore NL will require new investment to maintain growth
• Growth in Western Canada challenged by Market Access
• Canadian Natural Gas will have to find new markets
• LNG remains the largest opportunity for NG
• NG market will affect NGLs and petrochemical investment
Thank You for Your Time
www.ceri.ca
CANADIAN ENERGY RESEARCH INSTITUTE
@CERI_CANADA
UPCOMING STUDIES:
Competitive Analysis of Canadian LNG
Carbon Management Impacts on Electricity Markets
An Economic Assessment Of The International Marine Organization Sulphur Regulations On Markets For Canadian Crude Oil