Embed Size (px)
Citation preview
Canadian Oil and Gas Industry
Fundamental Analysis and
Recommendations:
Suncor, Imperial Oil, Talisman

Presenters
Karen Ford– Industry Overview Aaron Cawker– Suncor Stephanie Cornell– Talisman Rahim Dhanji– Imperial Oil
Industry Overview Largest industry in the world Oil & gas trade surplus accounts 57% of
Canada’s merchandise trade balance in 2003 3.5 per cent share of the world market, since
1998 Employment near 500,000 in Canada Invest close to $24 billion
Overview…continued Payments to governments have averaged close to $8.5 billion per
year over the last 10 years
In 2003, the oil and gas industry contributed an estimated $16 billion to government revenues in the form of royalty payments, bonus payments and income taxes.
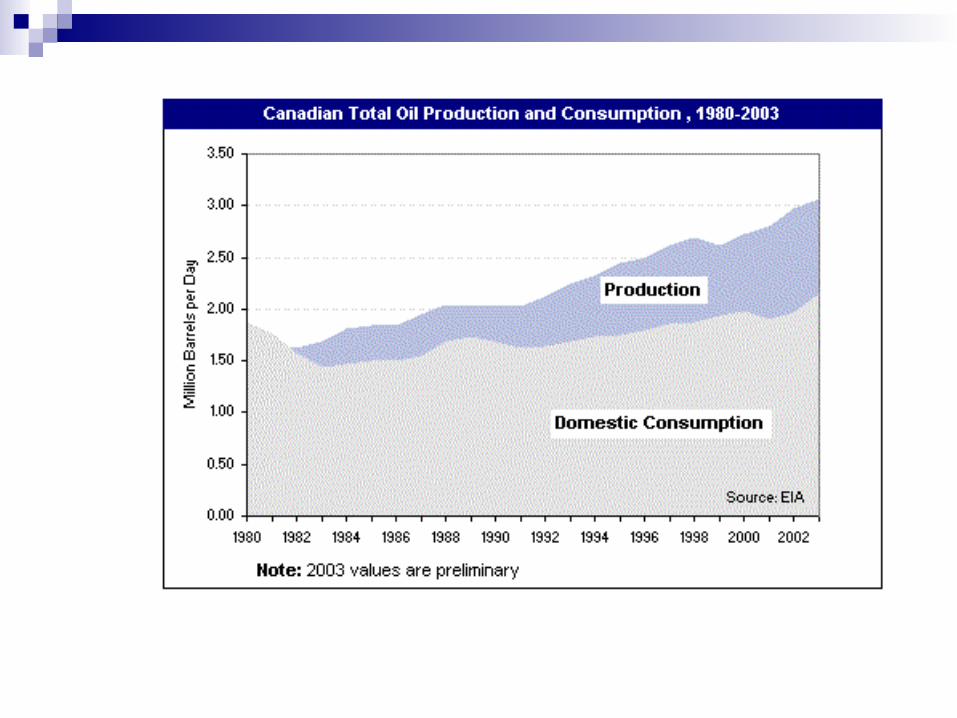
We produce more than 20% of North America’s crude oil and natural gas but account for only 10% of its consumption
Capital Spending 2003: Conventional $23.8 billion Oil Sands $5.0 billion Total $28.8 billion
Origins and History
Most crude oil and natural gas originate from plant and animal life millions of years ago: swamps and oceans.
Heat and pressure transformed the soft parts of the plants and animals into solid, liquid or gaseous hydrocarbons known as fossil fuels - coal, crude oil or natural gas
Located in sand oils and oil fields Found by drilling and creating wells
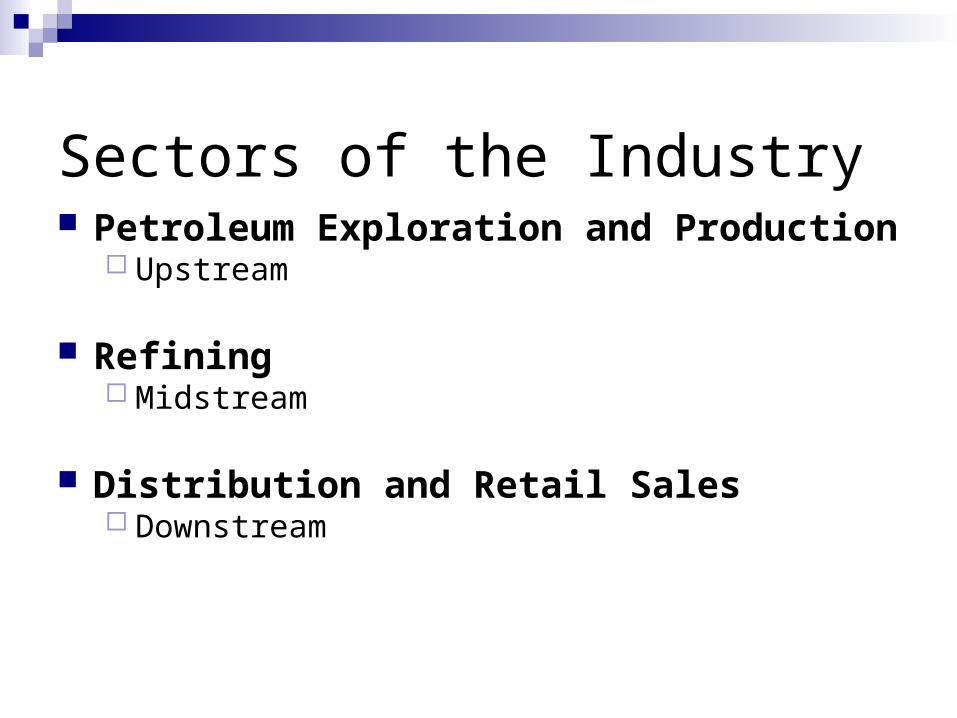
Sectors of the Industry Petroleum Exploration and Production
Upstream
Refining Midstream
Distribution and Retail Sales Downstream
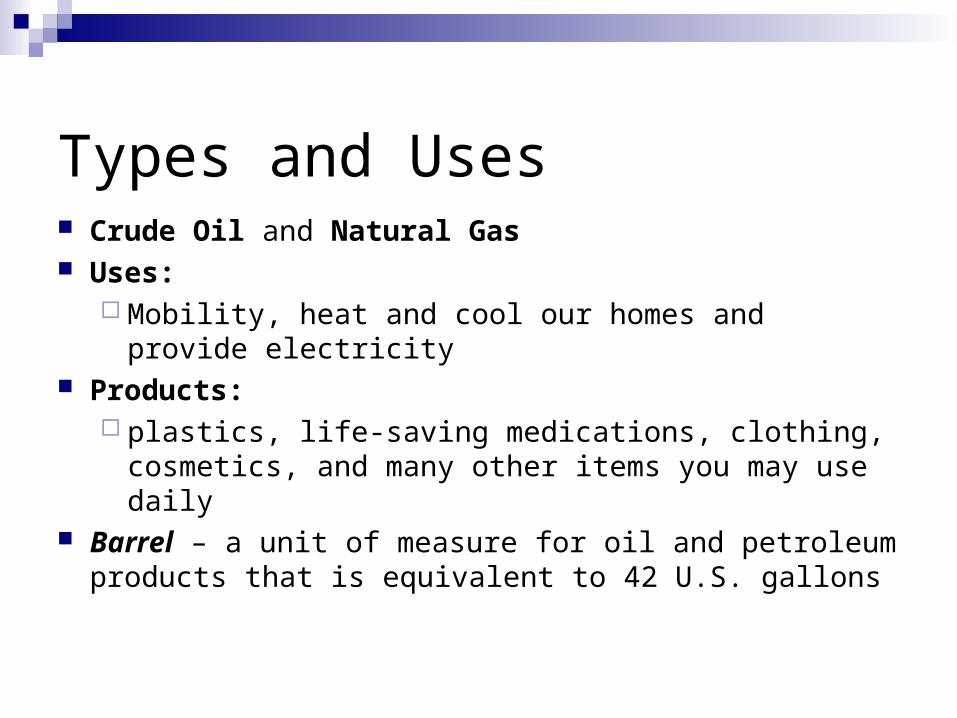
Types and Uses Crude Oil and Natural Gas Uses:
Mobility, heat and cool our homes and provide electricity
Products: plastics, life-saving medications, clothing, cosmetics,
and many other items you may use daily Barrel – a unit of measure for oil and petroleum products
that is equivalent to 42 U.S. gallons
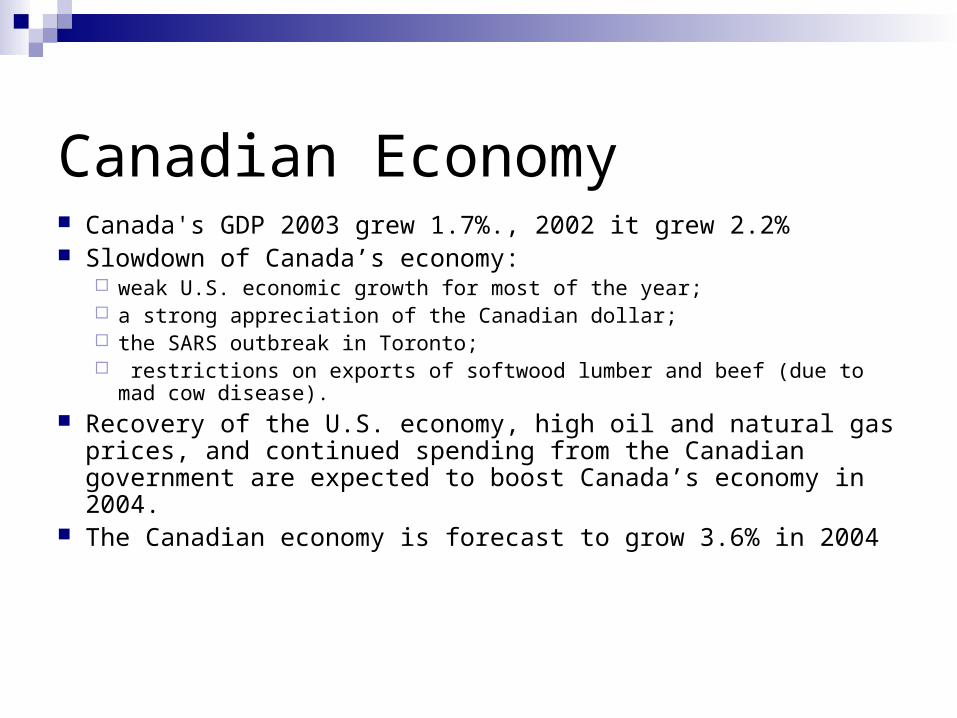
Canadian Economy Canada's GDP 2003 grew 1.7%., 2002 it grew 2.2% Slowdown of Canada’s economy:
weak U.S. economic growth for most of the year; a strong appreciation of the Canadian dollar; the SARS outbreak in Toronto; restrictions on exports of softwood lumber and beef (due to mad cow
disease). Recovery of the U.S. economy, high oil and natural gas prices,
and continued spending from the Canadian government are expected to boost Canada’s economy in 2004.
The Canadian economy is forecast to grow 3.6% in 2004

Situational Analysis Demand is increasing Oil and Natural Gas together provide the largest source
of energy (64%) in Canada Natural gas 39% and Oil 25% Hydro 20% Coal 11% Nuclear 5%
Prices have become volatile on the market Energy shares make up 17 percent of the value of the
S&P/TSX, the second-largest group in the index
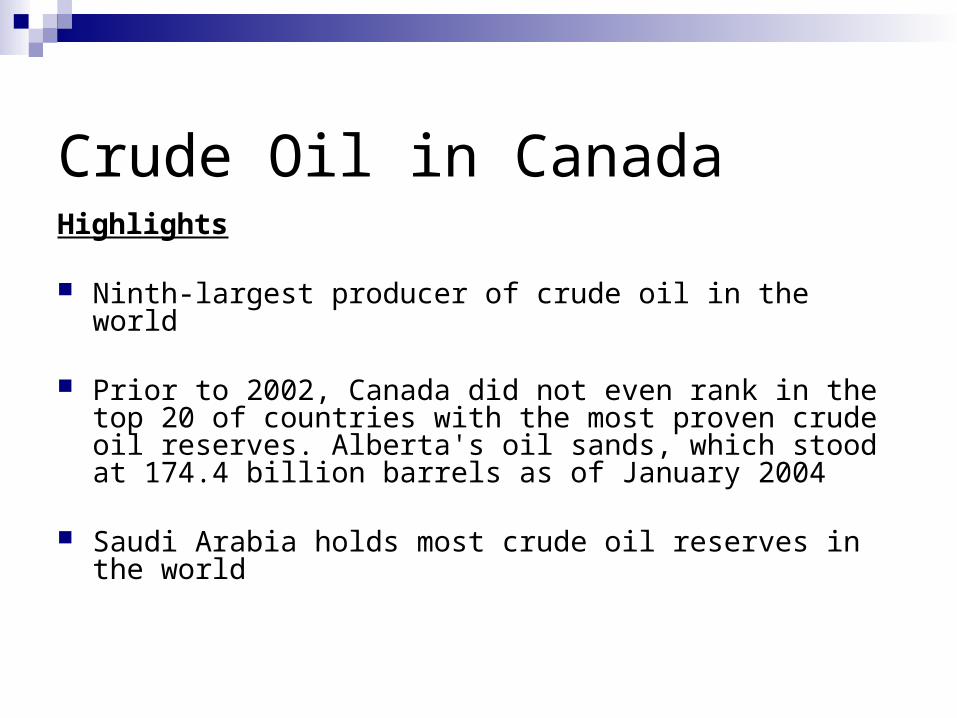
Crude Oil in CanadaHighlights
Ninth-largest producer of crude oil in the world
Prior to 2002, Canada did not even rank in the top 20 of countries with the most proven crude oil reserves. Alberta's oil sands, which stood at 174.4 billion barrels as of January 2004
Saudi Arabia holds most crude oil reserves in the world
Crude Oil…continued
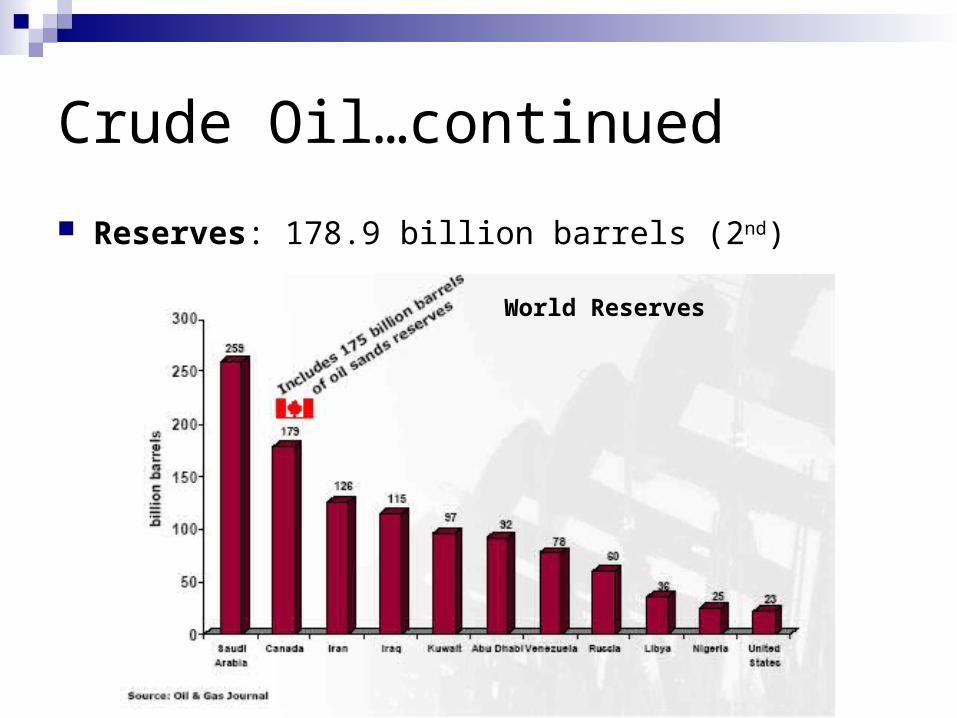
Reserves: 178.9 billion barrels (2nd)
World Reserves
Crude Oil…continued
Production: 3.1 million barrels per day (bbl/d) for 2003, an increase of
7% over 2002
Oil sands production is expected to increase significantly and to offset the decline in conventional crude oil production, becoming Canada's major source of oil supply
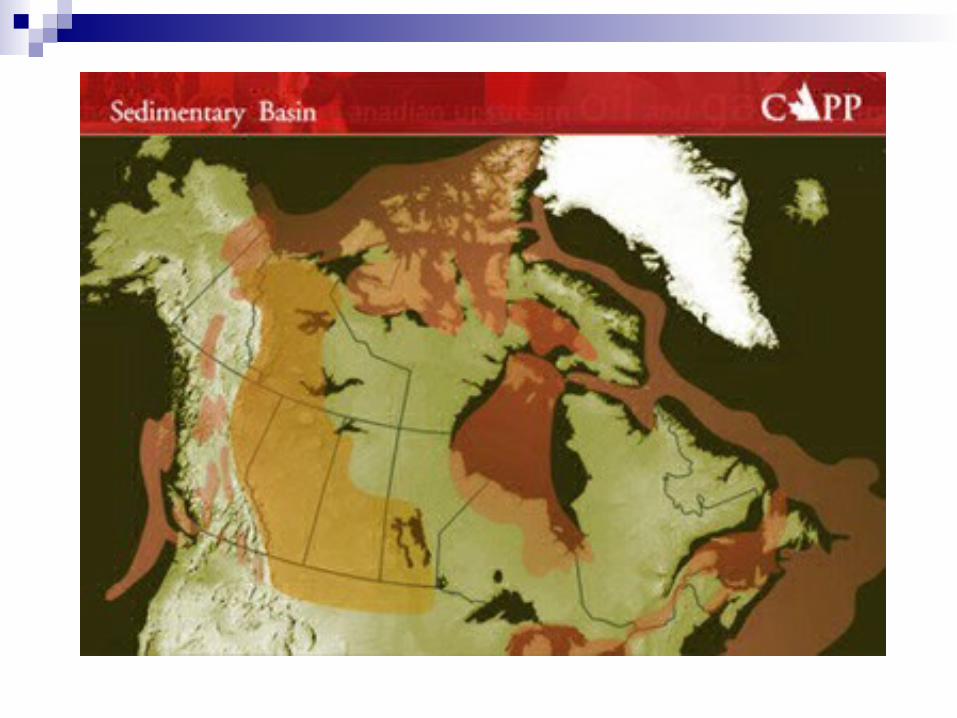
Western Canada Sedimentary Basin (WCSB), underlying most Alberta and parts of British Columbia, Saskatchewan, Manitoba and the Northwest Territories main source of oil

Crude Oil Continued… Wells Drilled: 4,845 Exports
US: 1.4 million barrels per day 3rd largest exporter of crude oil to the US Canada makes up 15% of total US oil imports Canada supplies 9% of US oil consumption
Imports 912,000 barrels per day
Crude Oil Prospects
Crude Oil Forecast
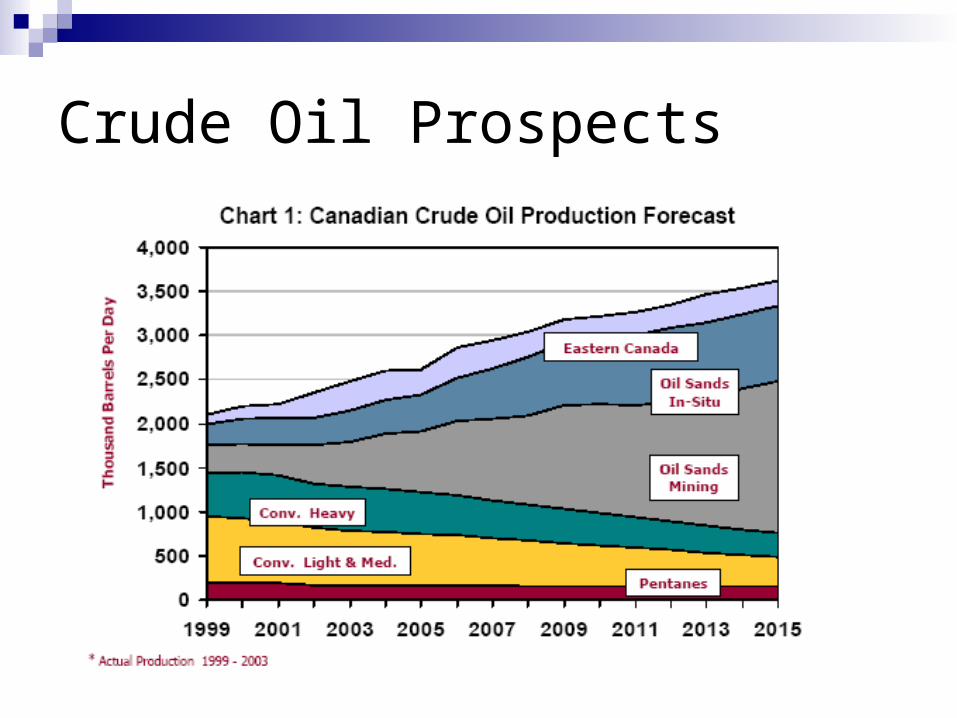
Significant potential for new crude oil production planned to come on stream over the next ten years
Canada’s crude oil production growth is driven by the development of oil sands in Alberta and to a lesser degree by offshore projects in eastern Canada
Crude Oil Prospects
Maturing basin being extended by technology Horizontal drilling 3D Seismic New drilling/recovery technology
Emerging basins Oil Sands Northern Canada Offshore East Coast
Technology is key Total Canadian production is projected to increase
from the current 2.6 million barrels per day to reach 3.6 million barrels per day (b/d) by 2015.
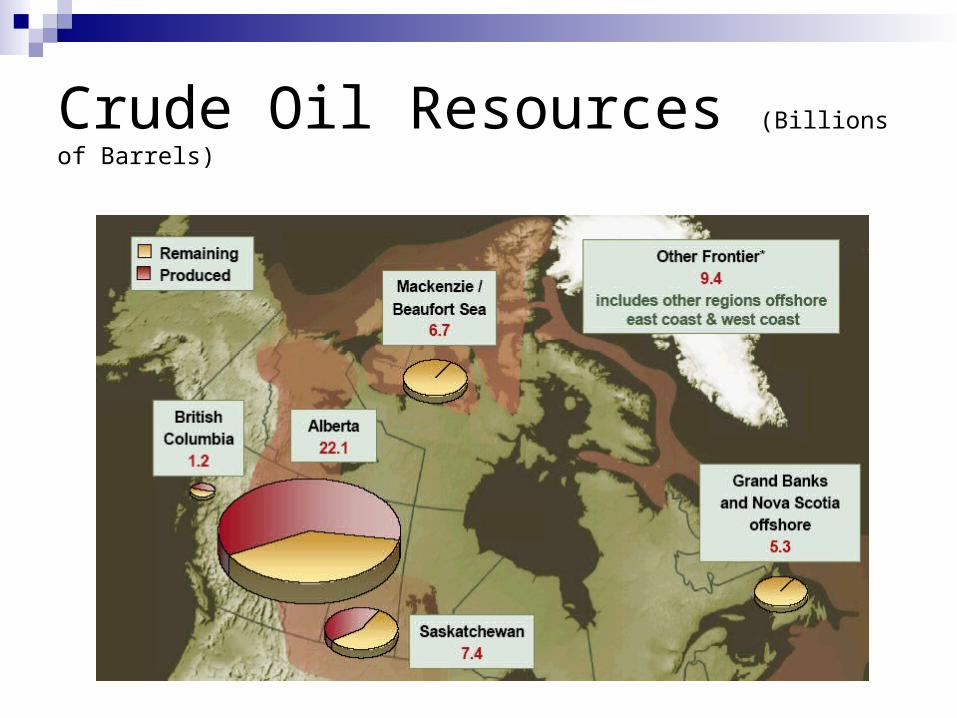
Crude Oil Resources (Billions of Barrels)

Crude Oil Supply Forecast
Natural Gas Highlights Canada is the third-largest producer of natural gas Production:
16.9 billion cubic feet per day Reserves:
59.1 Tcf (Jan. 2004) Wells Drilled in 2003: 12,951 Exports:
2nd largest exporter in world to US: 3.8 trillion cubic feet per year Largest exporter of natural gas to the US Canada makes up 94% of total US gas imports Canada supplies 17% of US gas consumption
No imports listed
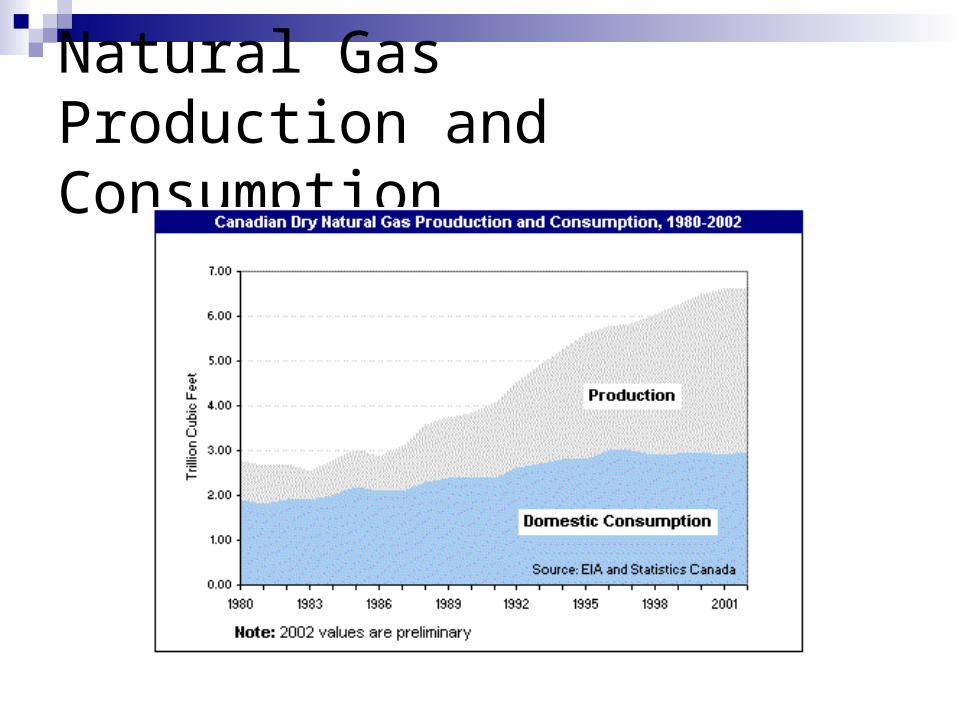
Natural Gas Production and Consumption

Natural Gas Outlook
Short-term outlook, natural gas production is expected to decline 3%, from 16.3 Bcf/d at the end of 2002, to 15.8 Bcf/d in 2005new fields coming onstream are small and
quickly depleted If prices stay high, incentive to exploit the many
small natural gas pools in the WCSB, as well as coalbead methane, of which the region holds considerable reserves
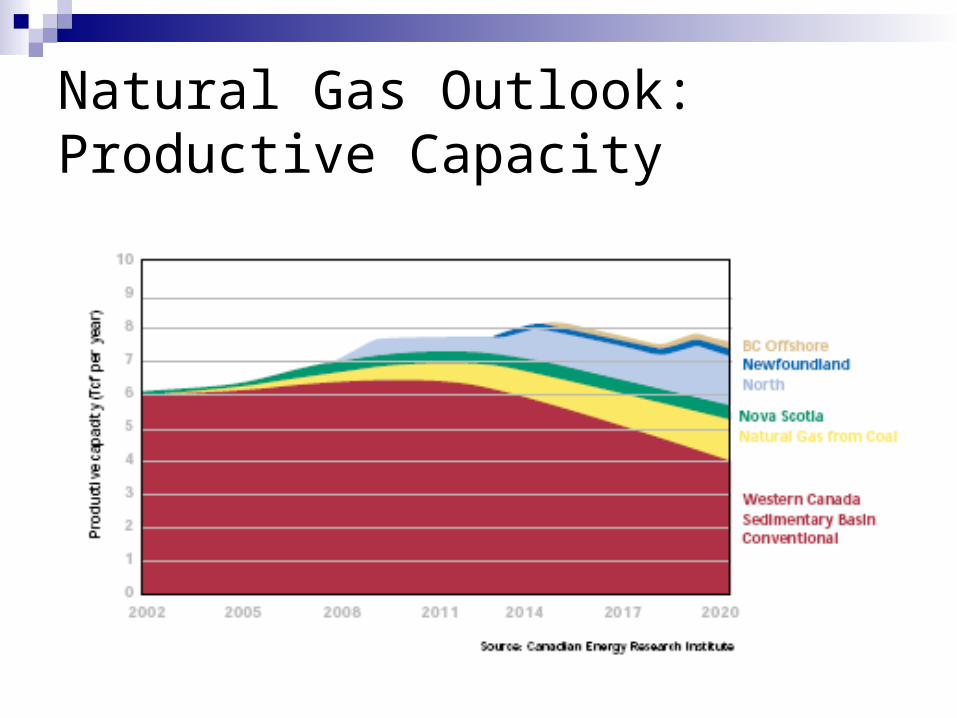
Natural Gas Outlook: Productive Capacity
Prospects of Natural Gas
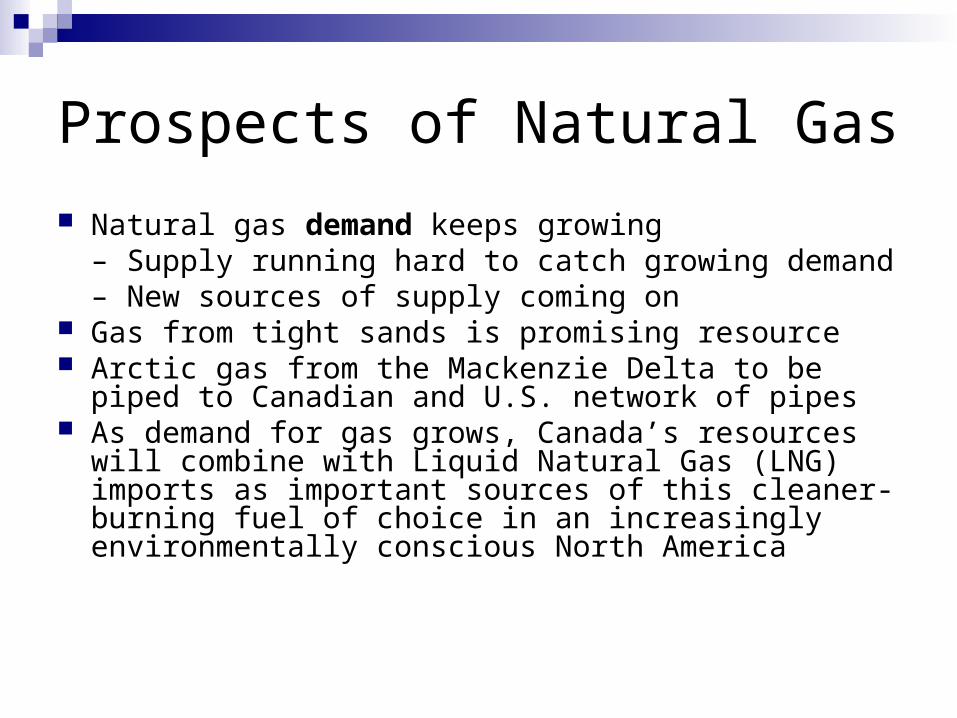
Natural gas demand keeps growing– Supply running hard to catch growing demand– New sources of supply coming on
Gas from tight sands is promising resource Arctic gas from the Mackenzie Delta to be piped to
Canadian and U.S. network of pipes As demand for gas grows, Canada’s resources will
combine with Liquid Natural Gas (LNG) imports as important sources of this cleaner-burning fuel of choice in an increasingly environmentally conscious North America
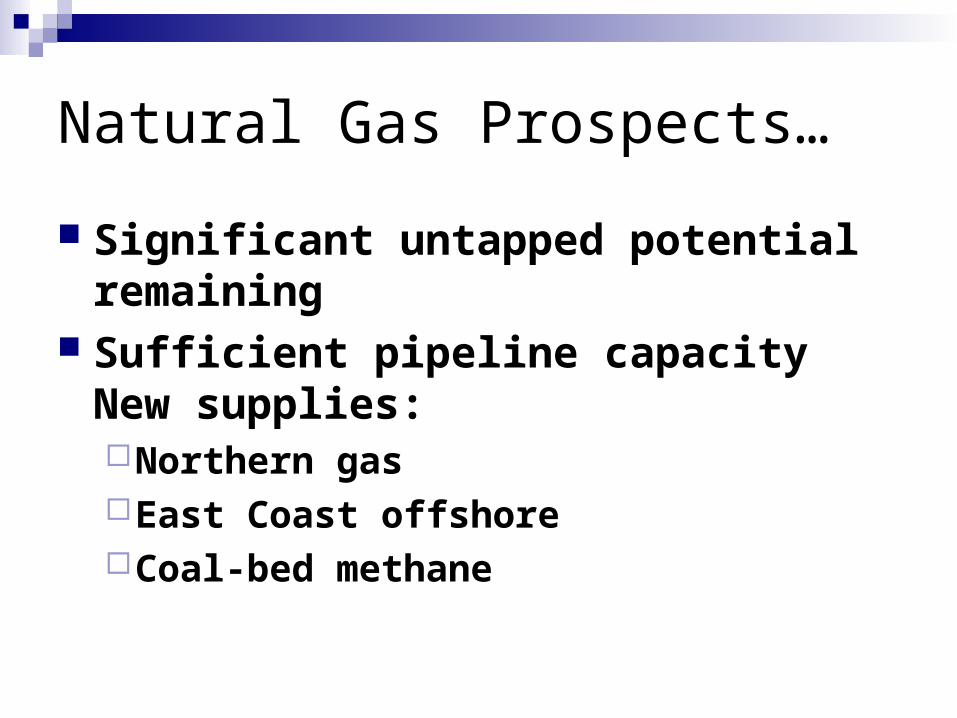
Natural Gas Prospects…
Significant untapped potential remaining
Sufficient pipeline capacity New supplies: Northern gasEast Coast offshoreCoal-bed methane

Potential of Natural Gas (TCF)
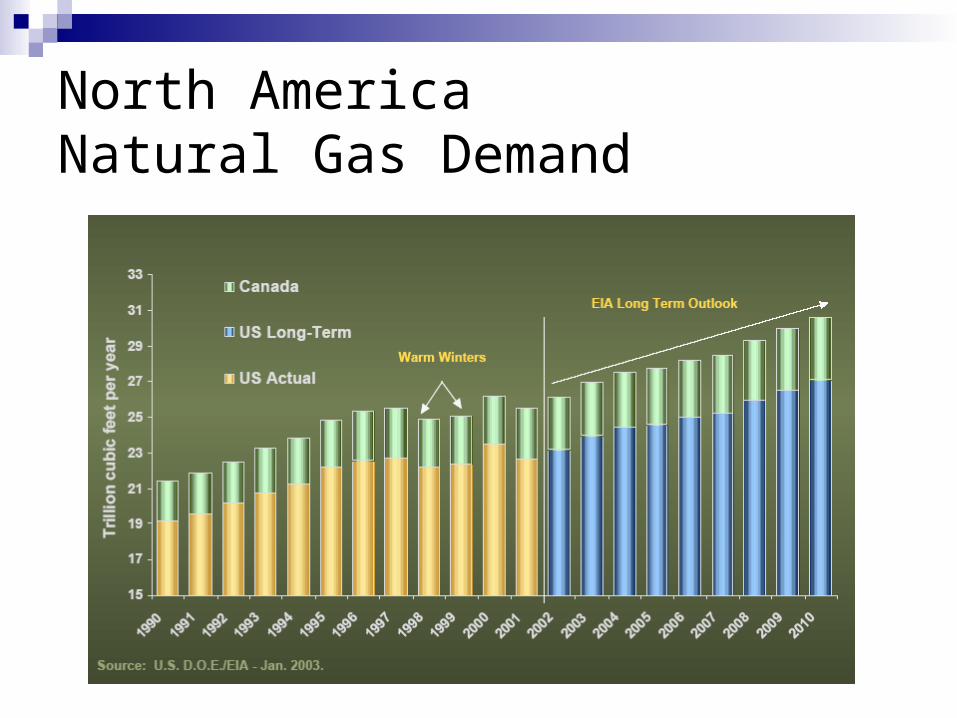
North America Natural Gas Demand
Strengths Size and number oil sands in Alberta Potential of Eastern and Northern Canada high-tech exploration cold-climate and offshore operations construction and operations of pipelines specialized controls and computer applications environmental protection technology and safety training innovative products and services that meet customer needs refining processes that produce quality petroleum-based
products while minimizing the impact on the environment.
Weaknesses Limited natural gas reserves Capacity for natural gas is forecasted to decrease Canada is one of the high-cost places in the world to find
and produce oil and gas Deep gas, natural gas from coal and developments
offshore, in the oil sands and the North are large, complex and expensive and have long lead times before they turn a profit
Challenges in meeting North America’s energy needs
Opportunities Exporting to the US Oils Sands Exploration of Northern and Eastern Canada World population is currently around 6 billion
people, but is expected to grow to approximately 7.6 billion by 2020.-- a huge increase in the demand for transportation fuels, electricity, and many other consumer products made from oil and natural gas.

Threats
Canada/US Foreign Exchange Rate

Threats
Price volatility High Development costs Environmental Issue
Especially Marine Life
SubstitutesAlternatives to oil and gas
Solar Power, Coal, Wind, Hydro, and Nuclear Power
Competitive RivalryTop Companies in Oil and Gas Producers
(Selected by Assets) EnCana Corp. Canadian Natural Resources Nexen Penn West Petroleum Western Oil Sands Inc Paramount Resources Compton Petroleum Bonavista Energy Trust PetroKazakhstan Inc.
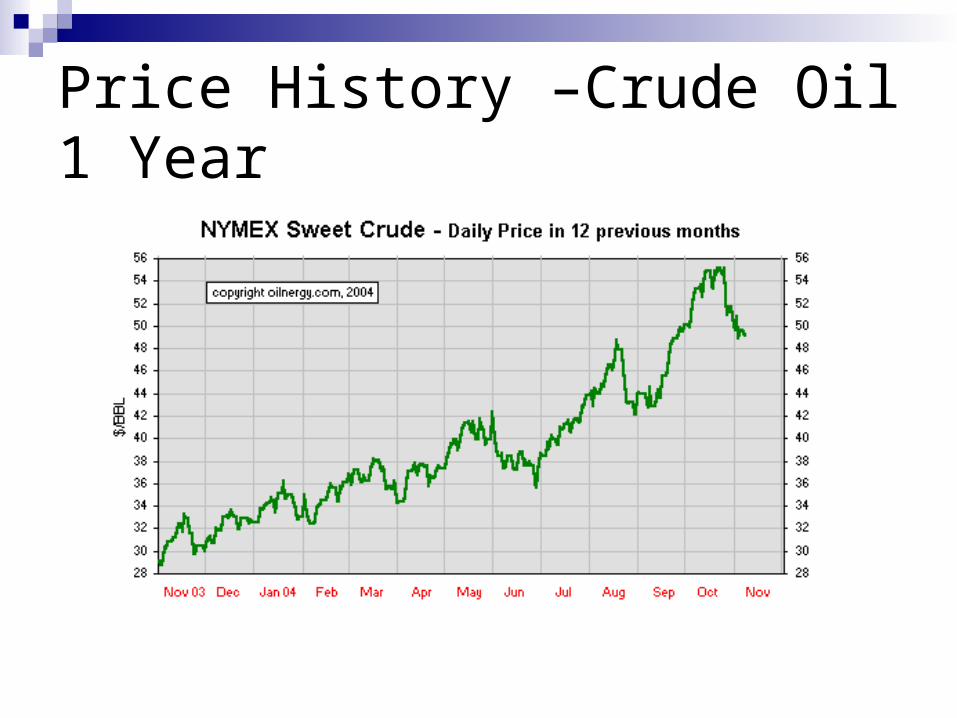
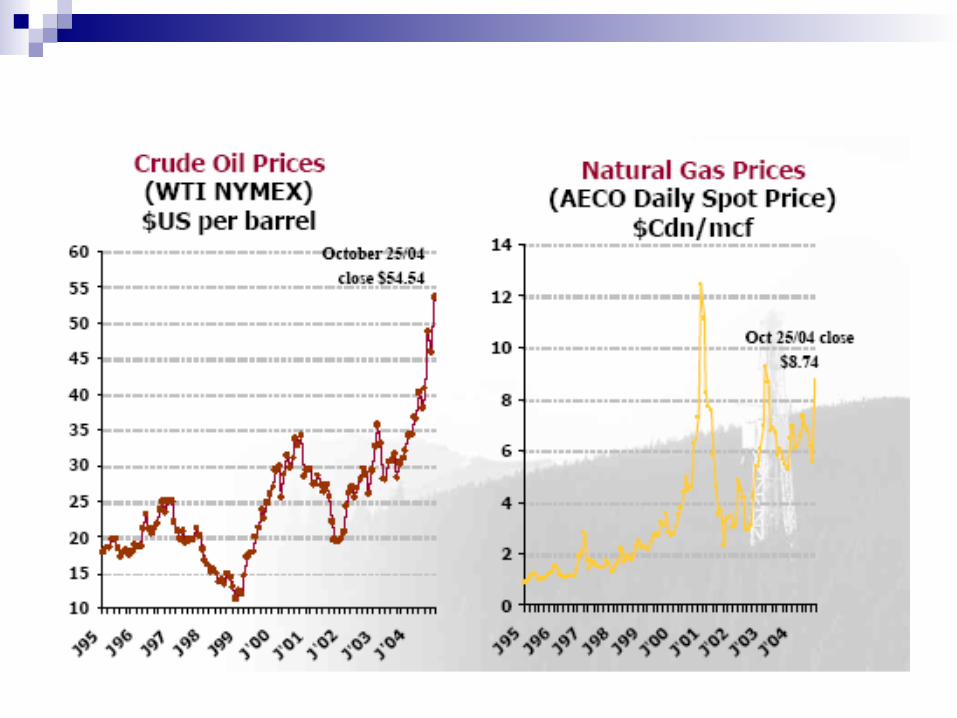
Price History –Crude Oil 1 Year
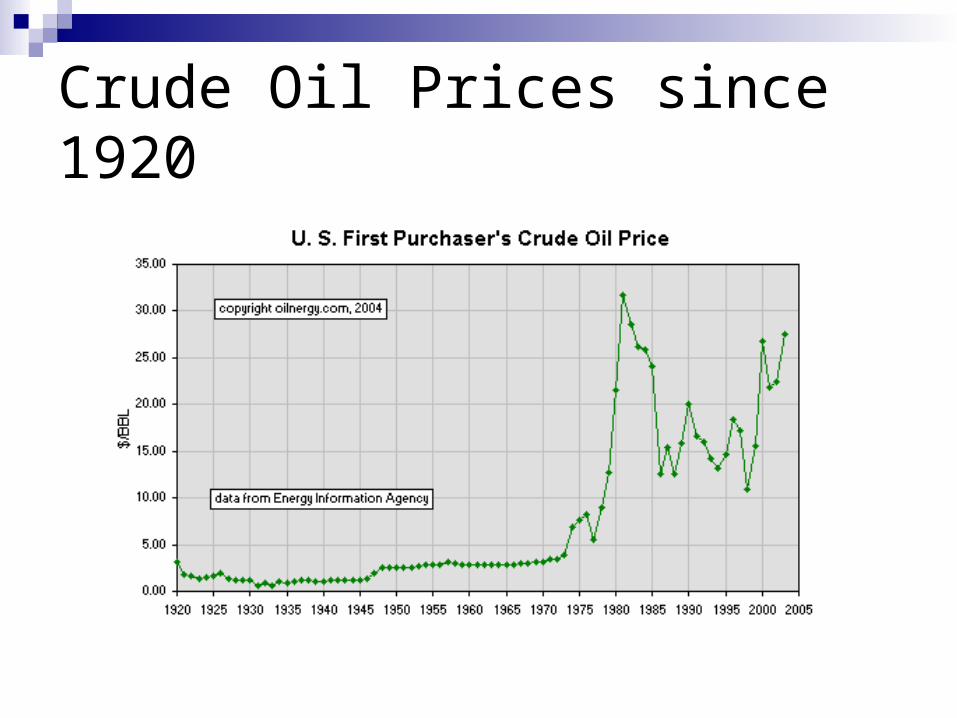
Crude Oil Prices since 1920
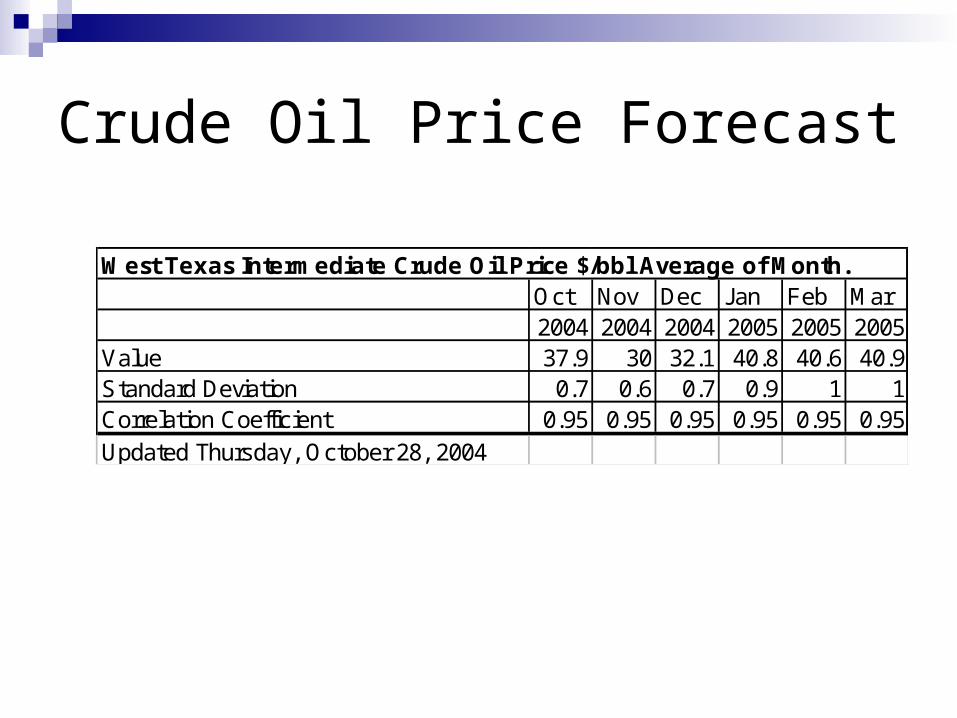
Crude Oil Price Forecast
West Texas Intermediate Crude Oil Price $/bbl Average of Month.Oct Nov Dec Jan Feb Mar2004 2004 2004 2005 2005 2005
Value 37.9 30 32.1 40.8 40.6 40.9Standard Deviation 0.7 0.6 0.7 0.9 1 1Correlation Coefficient 0.95 0.95 0.95 0.95 0.95 0.95Updated Thursday, October 28, 2004
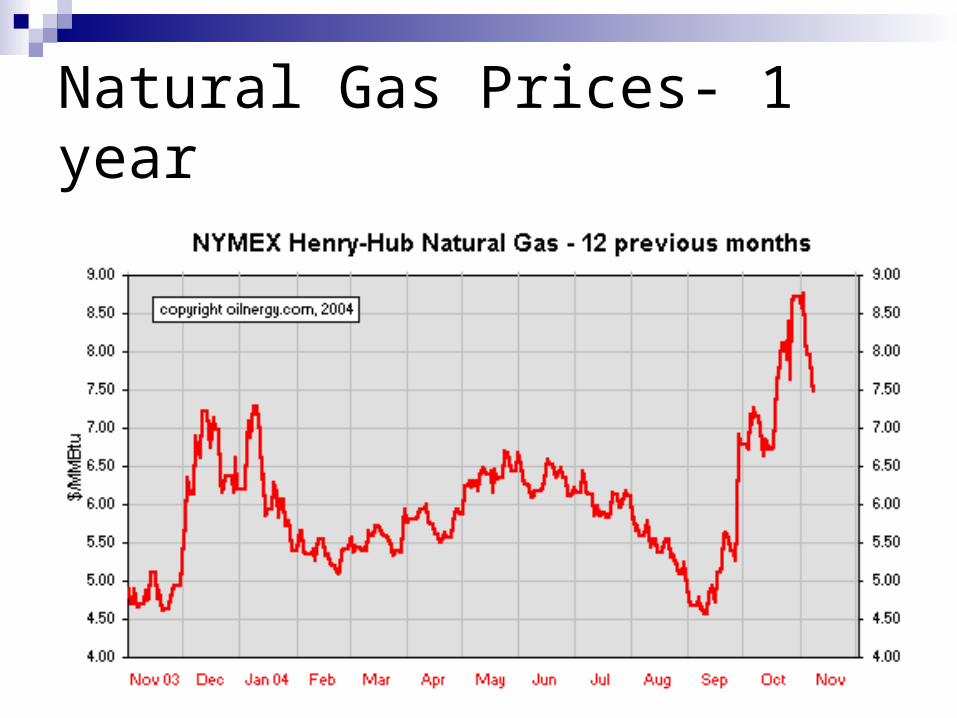
Natural Gas Prices- 1 year
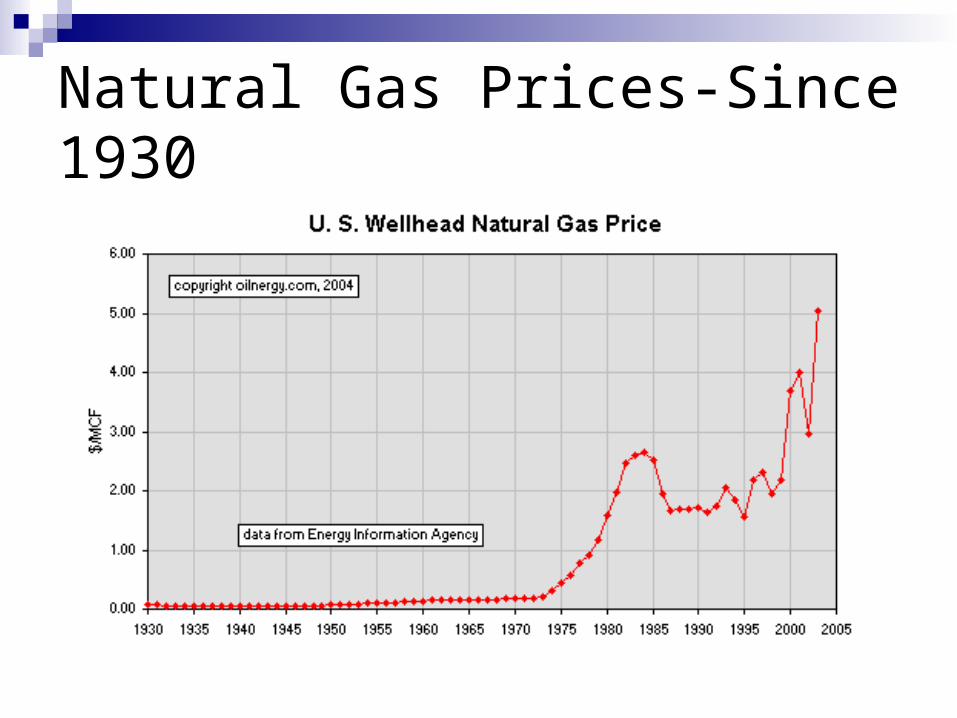
Natural Gas Prices-Since 1930
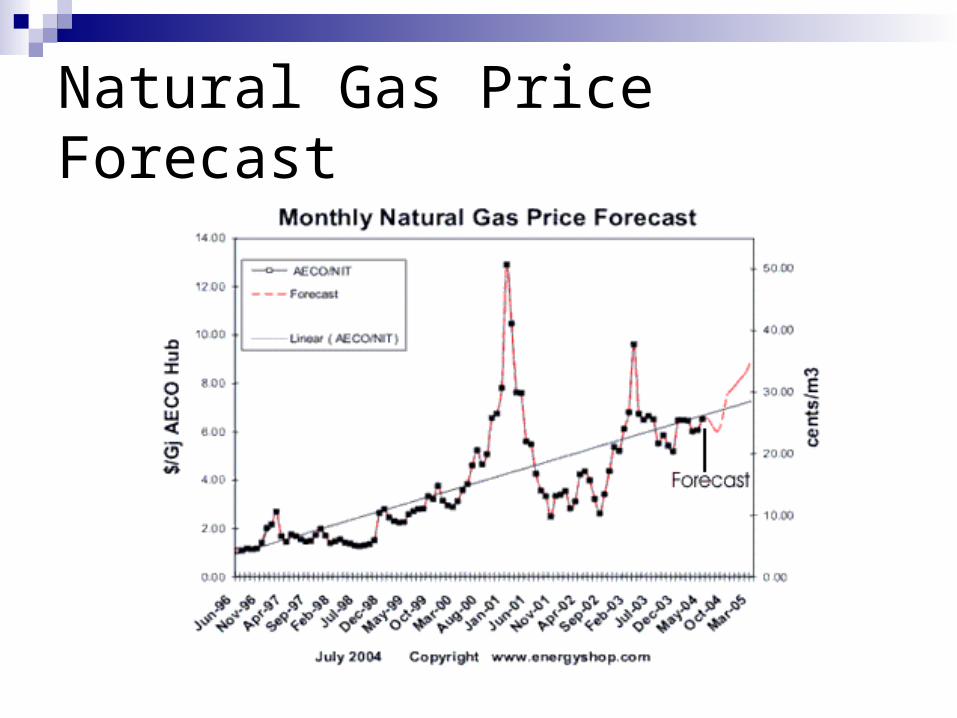
Natural Gas Price Forecast
Current Events
Despite high oil and gas prices, anticipated market volatility is preventing energy companies from increasing their rate of investment
Nov. 8 (Bloomberg) Canadian Stocks Fall as Oil Prices Slip; Suncor, Talisman Drop -- Canadian stocks fell, led by oil and gas producers such as Suncor Energy Inc., after crude oil prices declined. A rise in the Canadian dollar to 84 U.S. cents for the first time in more than 12 years weighed on the benchmark index. ``Oil and gas stocks in Canada are very sensitive to falling oil prices because of how high'' crude prices are
Tuesday, November 09, 2004
Crude oil futures tumbled below $48 (U.S.) a barrel Tuesday, closing at their lowest level in seven weeks, on rising expectations that the U.S. supply of transport and home-heating fuels will be adequate this winter.
Company Overview
Suncor Energy Inc. is an integrated energy company strategically focused on developing one of the world’s largest petroleum resource basins – Canada’s Athabasca oil sands.
Strong focus on technology 37 years of oil sands experience
Company Overview
Became a publicly traded company in 1992
Total returns to shareholders have averaged more than 25% per year.
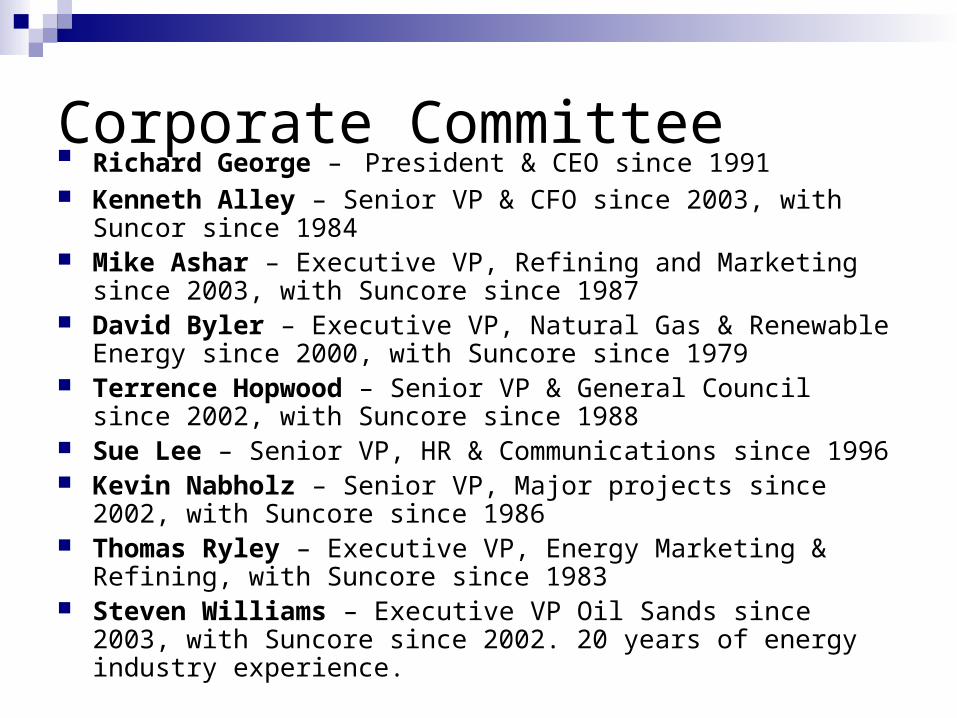
Corporate Committee Richard George – President & CEO since 1991 Kenneth Alley – Senior VP & CFO since 2003, with Suncor since
1984 Mike Ashar – Executive VP, Refining and Marketing since 2003,
with Suncore since 1987 David Byler – Executive VP, Natural Gas & Renewable Energy
since 2000, with Suncore since 1979 Terrence Hopwood – Senior VP & General Council since 2002,
with Suncore since 1988 Sue Lee – Senior VP, HR & Communications since 1996 Kevin Nabholz – Senior VP, Major projects since 2002, with
Suncore since 1986 Thomas Ryley – Executive VP, Energy Marketing & Refining, with
Suncore since 1983 Steven Williams – Executive VP Oil Sands since 2003, with
Suncore since 2002. 20 years of energy industry experience.
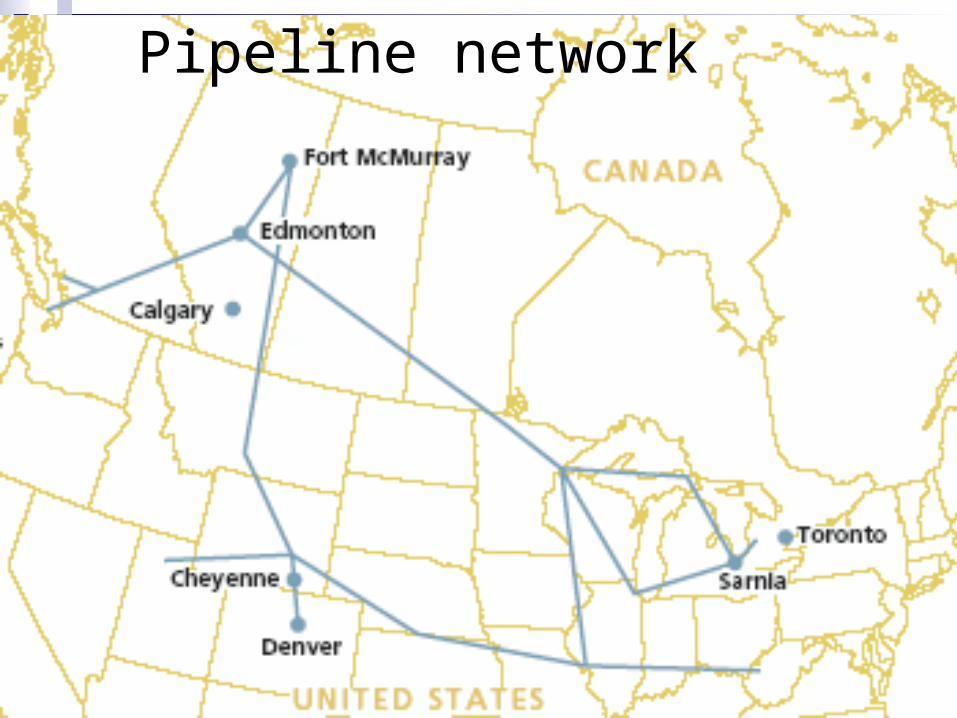
Pipeline network
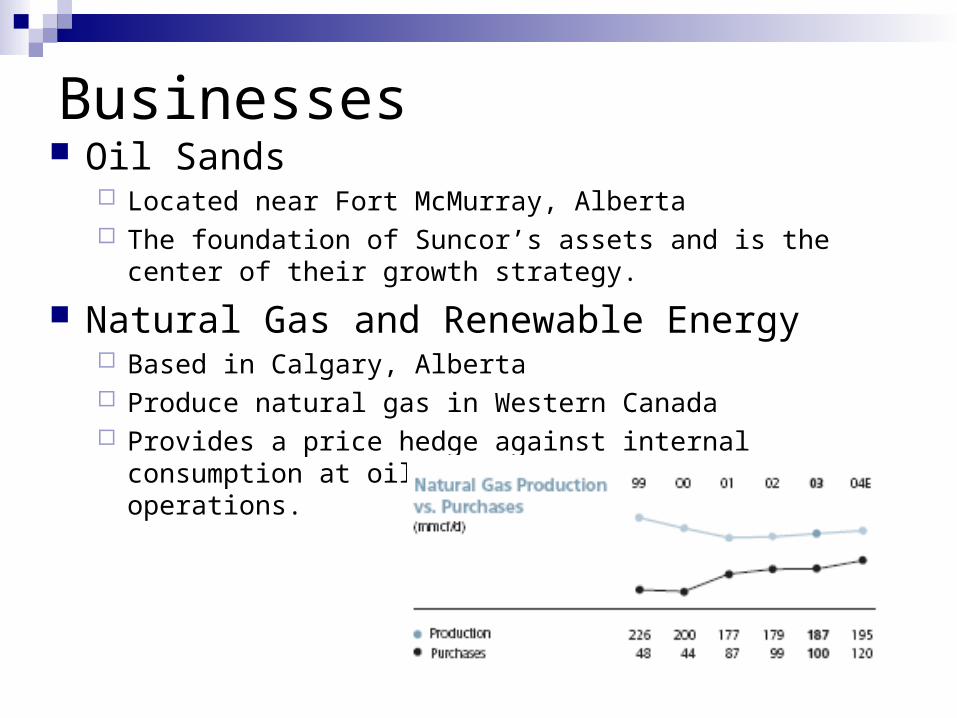
Businesses Oil Sands
Located near Fort McMurray, Alberta The foundation of Suncor’s assets and is the center of their
growth strategy.
Natural Gas and Renewable Energy Based in Calgary, Alberta Produce natural gas in Western Canada Provides a price hedge against internal consumption at oil sands
and refining operations.
Refining, Marketing and RetailCanada
Refinery feedstock and natural gas production are marketed to commercial and industrial consumers.
Products from the Sarnia refinery are sold to customers in Ontario, Quebec, and the Northeastern US, and to retail customers through approximately 500 Suncor-owned(Sunoco) and joint venture service stations in Ontario.
Businesses

United States In August 2003, acquired a Denver, Colorado
refinery along with 43 Phillips 66 retail stations. Expansion into the rocky Mountain States allows
easier movement of crude oil products to US markets.
Businesses
Business Strategy - growth
Develop multiple sources of supply from the oil sands resource base
Upgrade technology to increase production Use increase production to feed growing North
American energy market How to improve current model: make it bigger.

Short term Goals
Increase crude oil production to more than 500000 barrels per day by 2010-2012 from current level of 216600 bpd.
Reduce costs of production Provide superior shareholder returns while
providing social and economic benefits to stakeholders.
Reduce environmental impact of operations
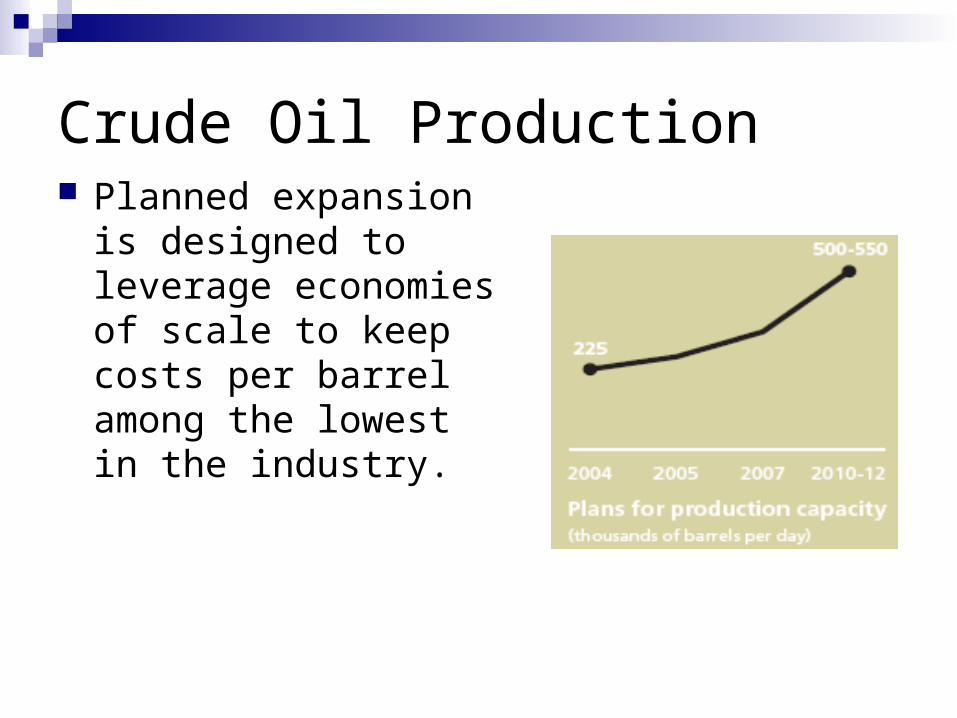
Crude Oil Production Planned expansion is
designed to leverage economies of scale to keep costs per barrel among the lowest in the industry.

Natural gas
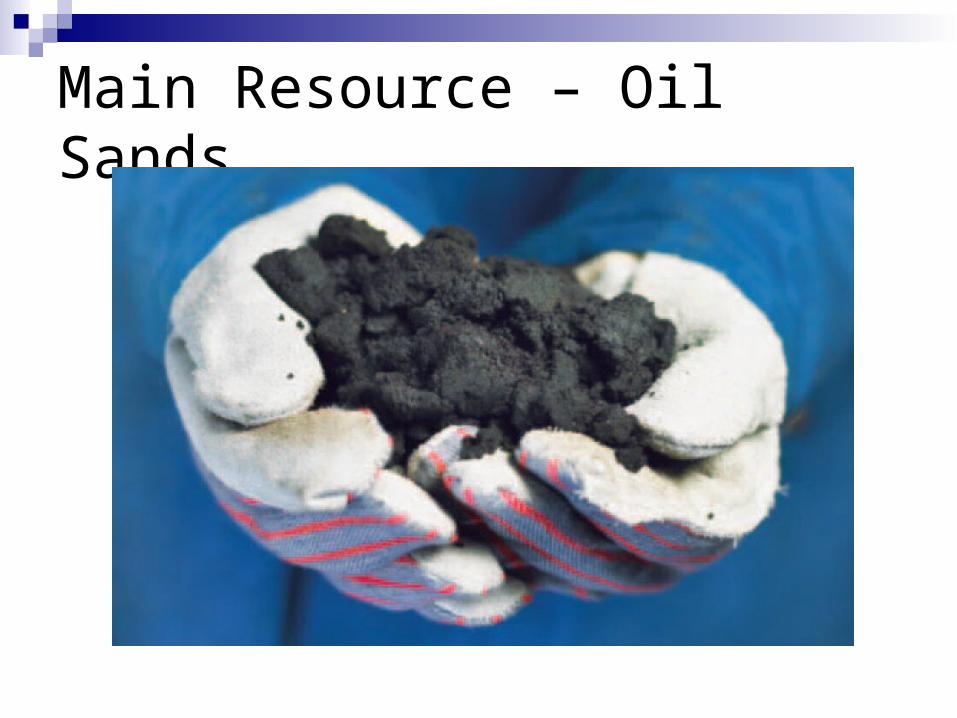
Main Resource – Oil Sands

Oil Sands
Suncor’s future is built on Canada’s oil sands
An estimated 175 billion barrels of crude oil reserves
First company to develop oil sands Leases contain an estimated 12 billion
barrels of bitumen reserves (heavy oil)

Oil Sands
With known resource base, Suncor doesn’t have risk and cost associated with conventional exploration.
12000 million barrels = (12000/0.5)1/365 = 65+ years of resources.
In the process of acquiring further leases
Supply of Bitumen
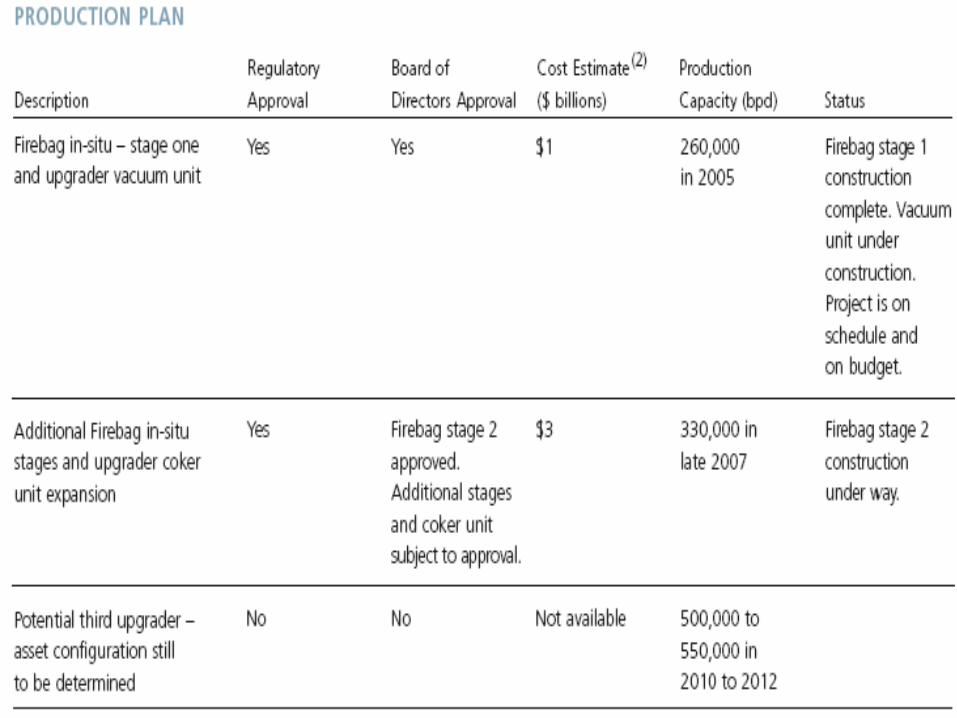
Mining – Surface mines supply majority of current production, plans to extend current mines with new operations planned to begin in 2010
In-situ – Firebag development uses steam assisted gravity drainage (SAGD) to heat the underground reservoir, allowing the bitumen to be pumped to the surface. Expected to be at full production in 2005.
Third Party Agreements – plan on providing a fee-for-service agreement to process 27000 barrels per day of 3rd party butimen (2008).
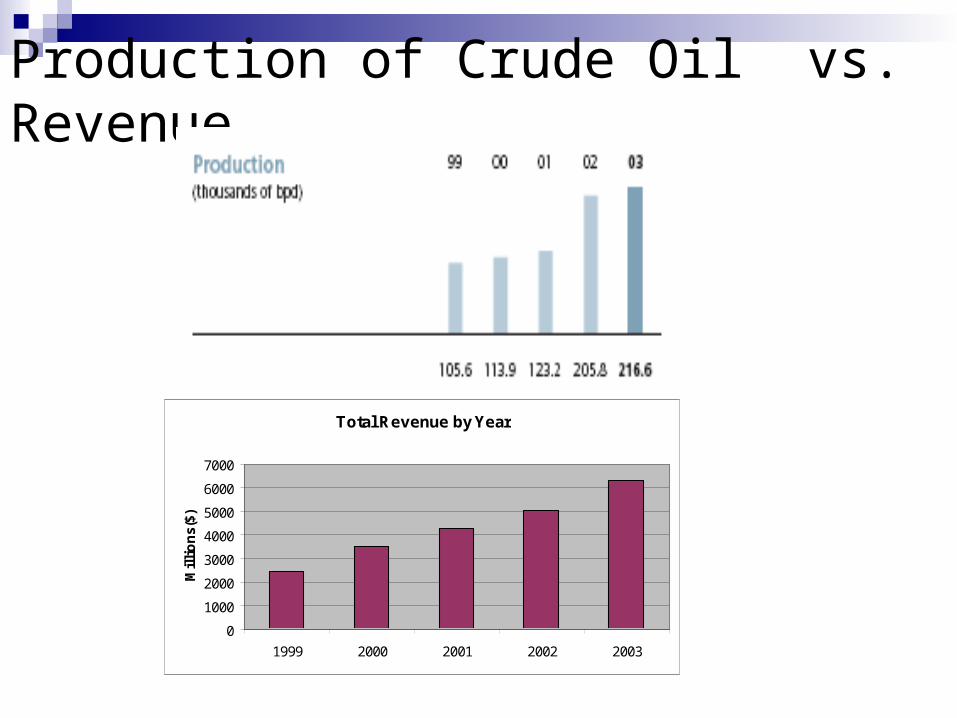
Production of Crude Oil vs. Revenue
Total Revenue by Year
0
1000
2000
3000
4000
5000
6000
7000
1999 2000 2001 2002 2003
Mil
lio
ns(
$)
Markets
Refining and marketing strategy builds on connections between the Oil sands production base and North American refiners and consumers.
This is the largest crude oil and refined product market in the world.
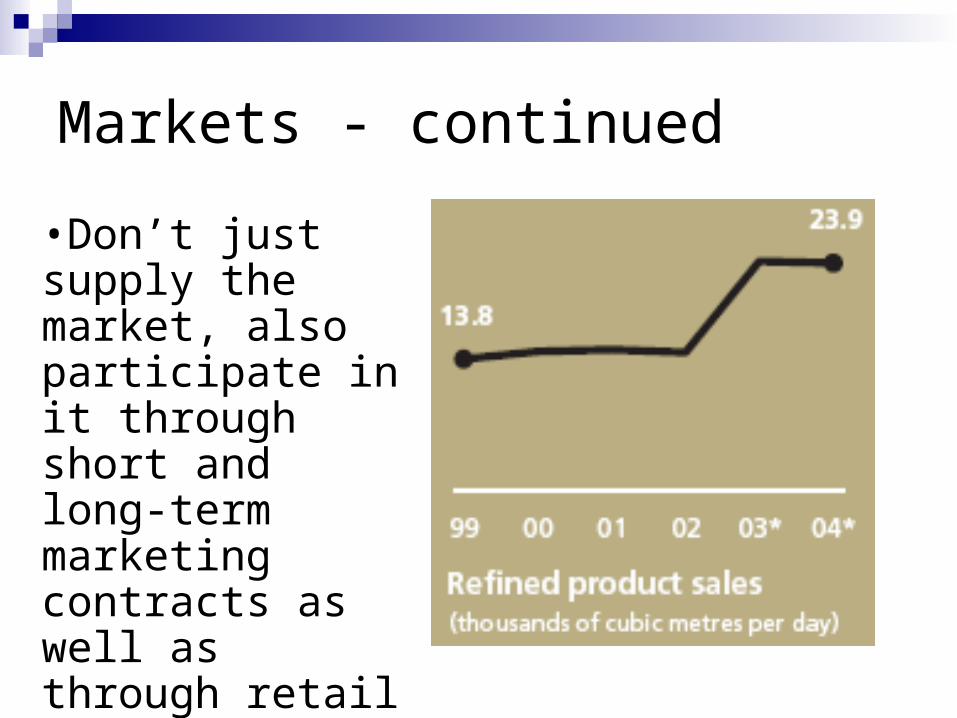
Markets - continued
•Don’t just supply the market, also participate in it through short and long-term marketing contracts as well as through retail distribution (Sunoco).

Retail operates nearly 300 Sunoco-branded retail
stations in Ontario and supplies to over 200 other stations through joint venture operations.
In 2003, purchased 43 Phillips 66 retail stations in Colorado and long-term supply contracts with nearly 150 more retailers.
Markets - continued

Breakdown of Businesses
Investments
Currently producing hydrocarbon fuels to meet today’s needs
Investing to supply new markets with renewable energy.
In 2003, they began the wind power project in southern Alberta, with partner EHN Wind Power Canada, Inc.
Stock Info.Price as of Nov. 10, 2004: $40.46
52 week low: $27.00
52 week high: $44.49
Average Daily Volume 1,500,000
Number of Shares Outstanding: 453,421,000
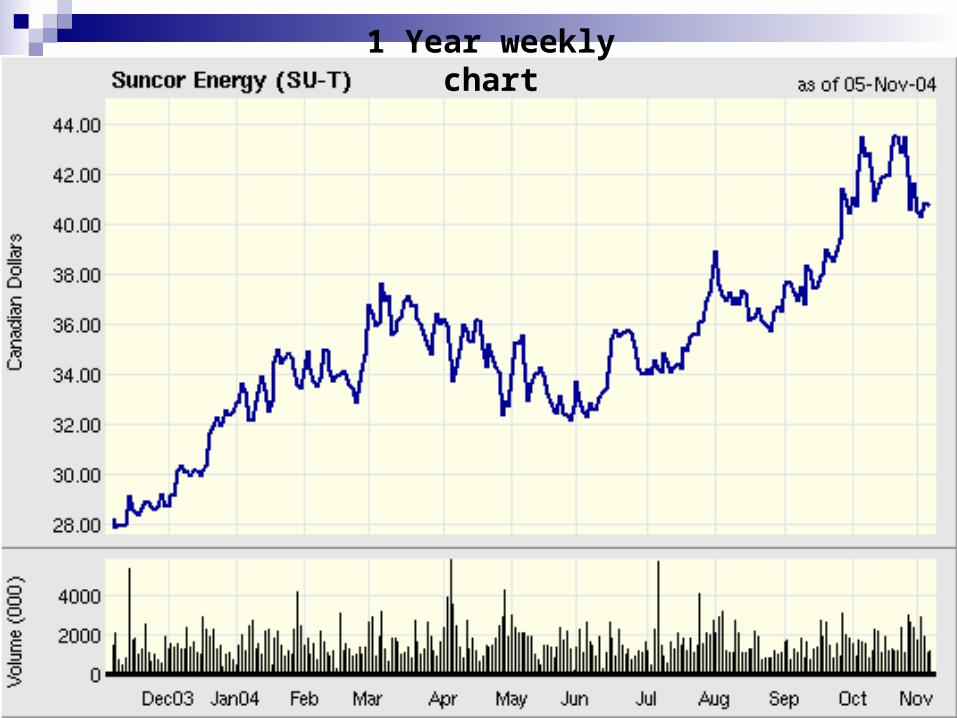
1 Year weekly chart
1 Year weekly chart
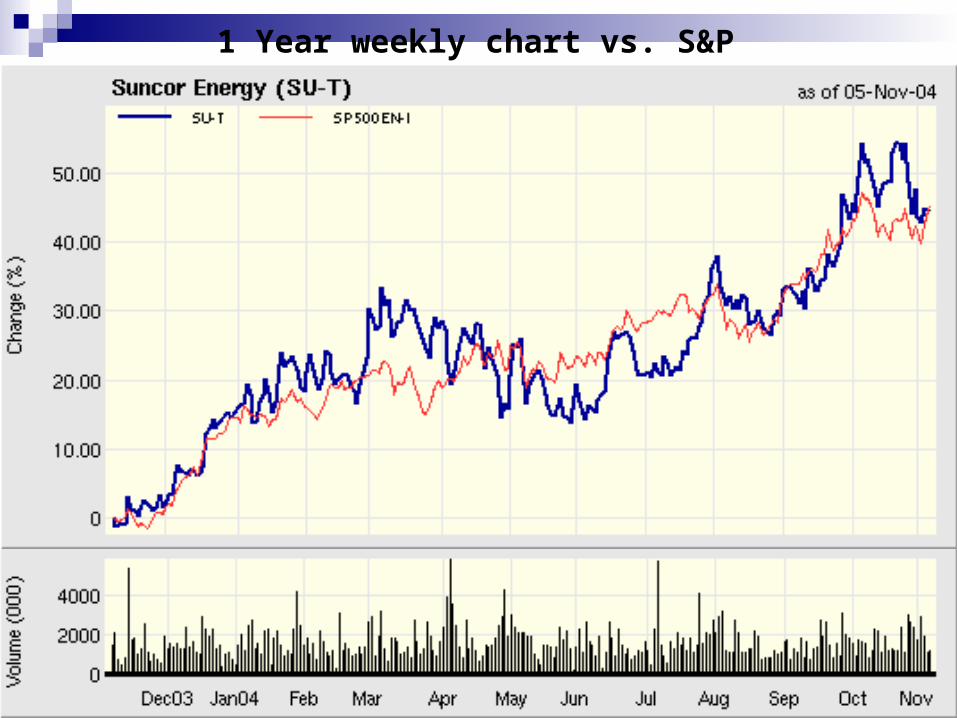
1 Year weekly chart vs. S&P Energy
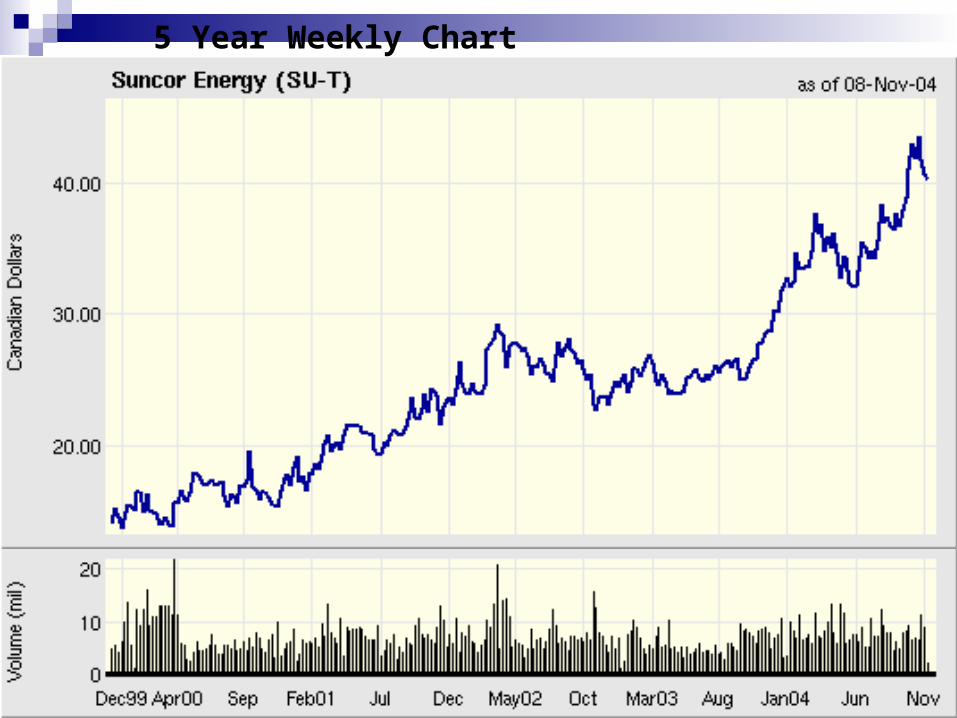
5 Year Weekly Chart
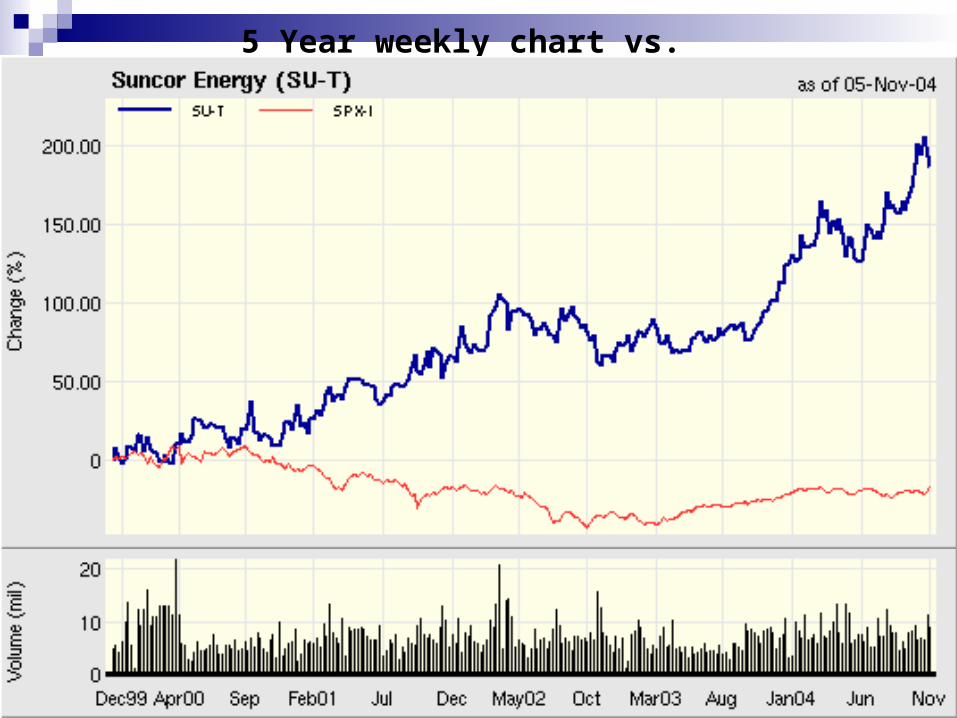
5 Year weekly chart vs. S&P 500

Company Analysis (Excel file)2004
(9 months) 2003 2002 2001 2000
Share Price (End of period): 40.69 32.5 24.7 26.2 19.15
Revenue($millions): 6311 6306 5032 4294 3484
Net Earnings($millions): 767 1,084 761 388 377
EBIT ($millions) 1186 1,804 1277 531 628
Total Assets($millions) 11362 10427 8683 8094 6833
Total Liabilities($millions): 6774 6002 5225 5317 4361
Total Debt($millions): 2347 2479 2686 3144 2256
Interest Expense($millions): 50 83 133 18 8
Equity($millions): 4588 4,588 3458 2777 2472
Shares Outstanding(EOP):453,000,00
0450,505,00
0448,839,00
0445,820,00
0443,546,00
0
Beta: 0.16 0.16 0.16 0.16 0.16
Operating Cash Flow($millions): 1562 2,081 1440 831 958
Capital Expenditures: 1174 1,316 877 1678 1998
Dividends: 0.17 0.1925 0.17 0.17 0.17
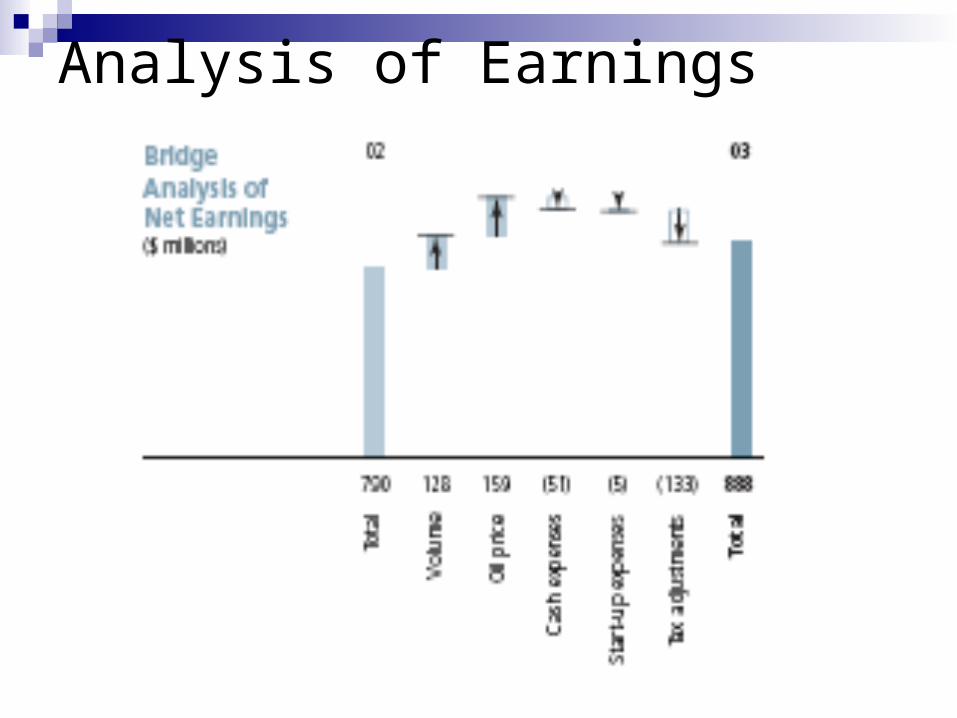
Analysis of Earnings
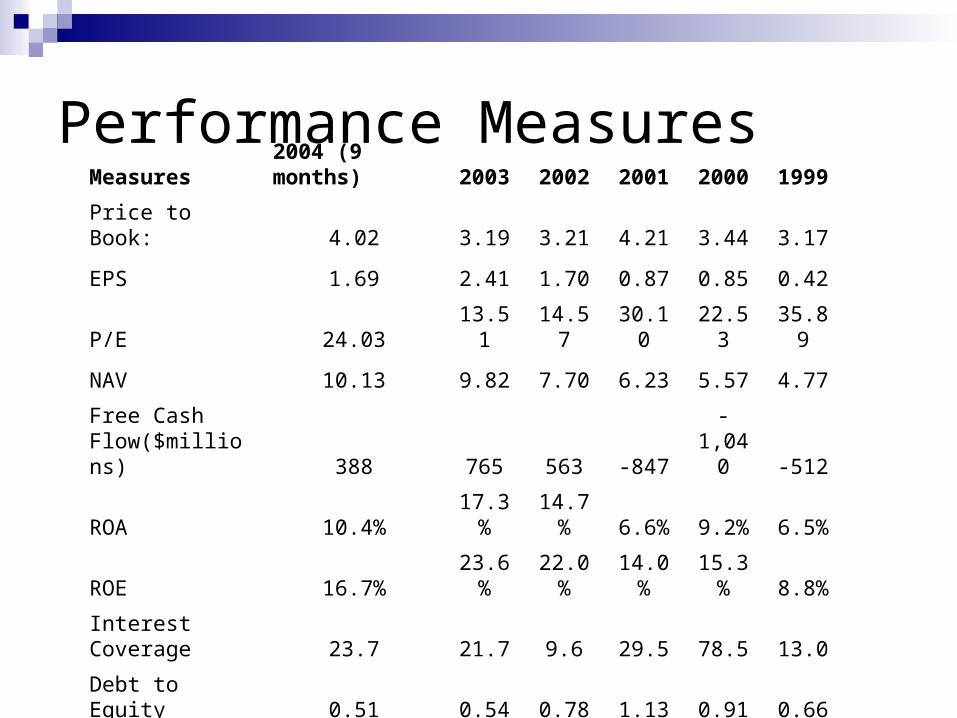
Performance MeasuresMeasures 2004 (9 months) 2003 2002 2001 2000 1999
Price to Book: 4.02 3.19 3.21 4.21 3.44 3.17
EPS 1.69 2.41 1.70 0.87 0.85 0.42
P/E 24.03 13.51 14.57 30.10 22.53 35.89
NAV 10.13 9.82 7.70 6.23 5.57 4.77
Free Cash Flow($millions) 388 765 563 -847 -1,040 -512
ROA 10.4% 17.3% 14.7% 6.6% 9.2% 6.5%
ROE 16.7% 23.6% 22.0% 14.0% 15.3% 8.8%
Interest Coverage 23.7 21.7 9.6 29.5 78.5 13.0
Debt to Equity 0.51 0.54 0.78 1.13 0.91 0.66
Dividend Yield 0.42% 0.59% 0.69% 0.65% 0.89% 1.13%
Market Cap.($millions) 18432 14641 11086 11680 8493 6674
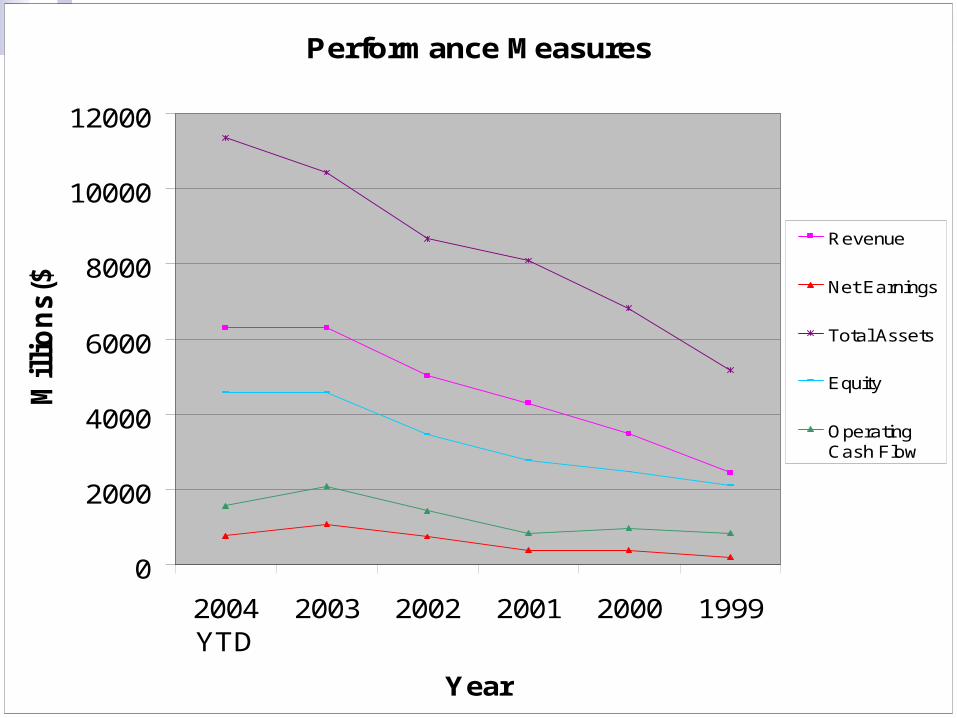
Performance Measures
0
2000
4000
6000
8000
10000
12000
2004YTD
2003 2002 2001 2000 1999
Year
Millio
ns($
)
Revenue
Net Earnings
Total Assets
Equity
OperatingCash Flow

Recent News
Oct 18: Suncor CEO Richard George told the downtown Toronto business
audience: American consumption of oil and gas is expected to increase almost 50
per cent by 2025, Domestic production is projected to remain flat. The United States is looking north to close the gap, and this represents
a big opportunity for Canada's energy industry. "The bottom line for Canada is that energy is not an obstacle to
economic growth. It's a key driver of economic growth," said George.
"This is not just an opportunity for Western Canada. Our energy industry is about Canada's opportunity, Canada's prosperity, and our role globally."
More news
Suncor profit climbs, but oil hedges limit gain
Suncor, known for its huge oil sands mining and synthetic crude operations, would have earned 25 percent more if over a third of its output not been sold forward at $22.50 a barrel. Oil averaged nearly $44 a barrel in the quarter.
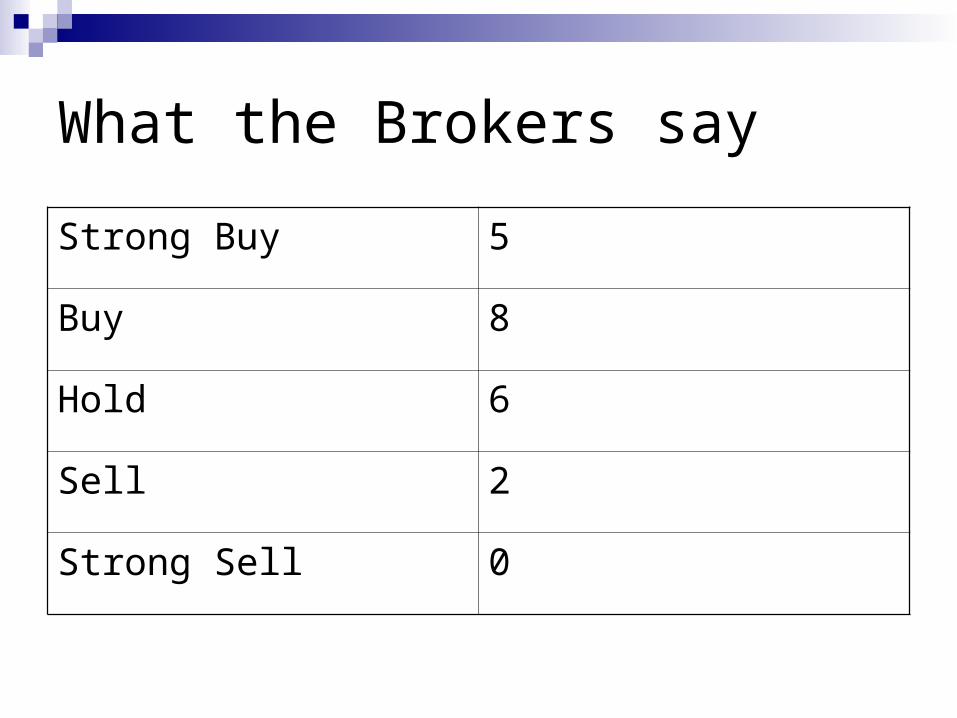
What the Brokers say
Strong Buy 5
Buy 8
Hold 6
Sell 2
Strong Sell 0
Value Drivers
Production of crude oil Since they are essentially price takers, the more
they produce, the more revenues increase The price of oil
This is the price of their product, and if price increases, earnings increase.
To a lesser extent the success of downstream operations
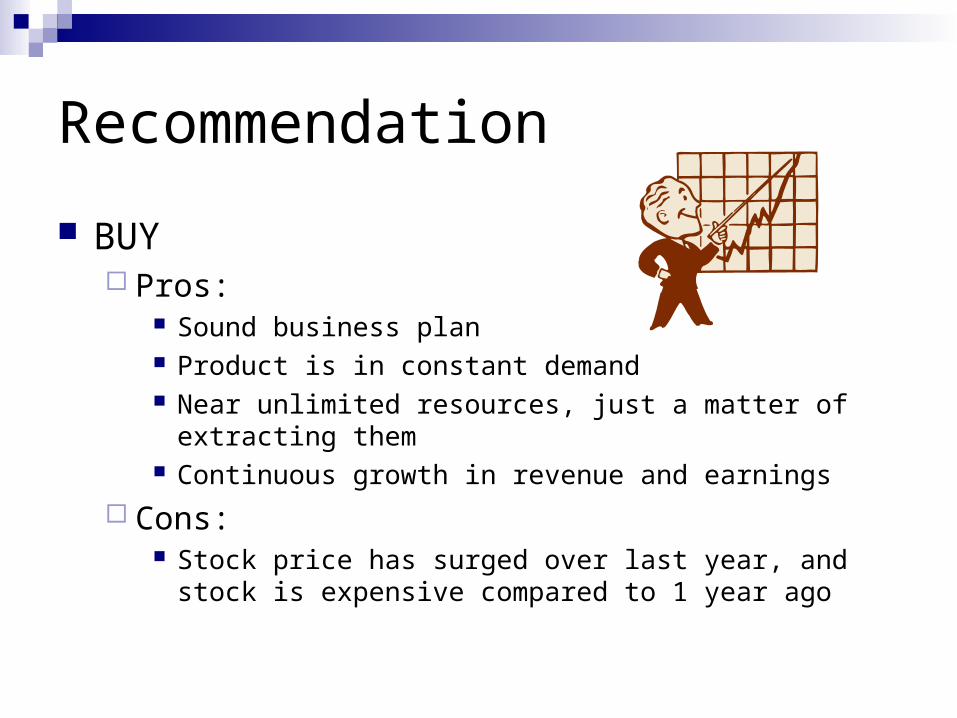
Recommendation
BUY Pros:
Sound business plan Product is in constant demand Near unlimited resources, just a matter of extracting them Continuous growth in revenue and earnings
Cons: Stock price has surged over last year, and stock is expensive
compared to 1 year ago
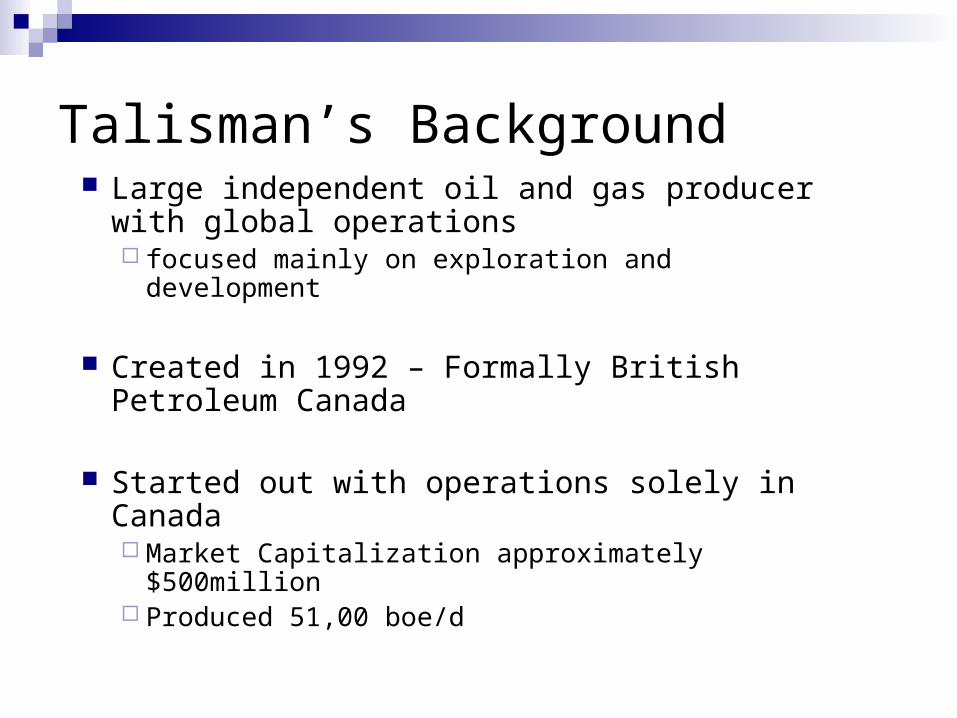
Talisman’s Background Large independent oil and gas producer with
global operations focused mainly on exploration and development
Created in 1992 – Formally British Petroleum Canada
Started out with operations solely in Canada Market Capitalization approximately $500million Produced 51,00 boe/d
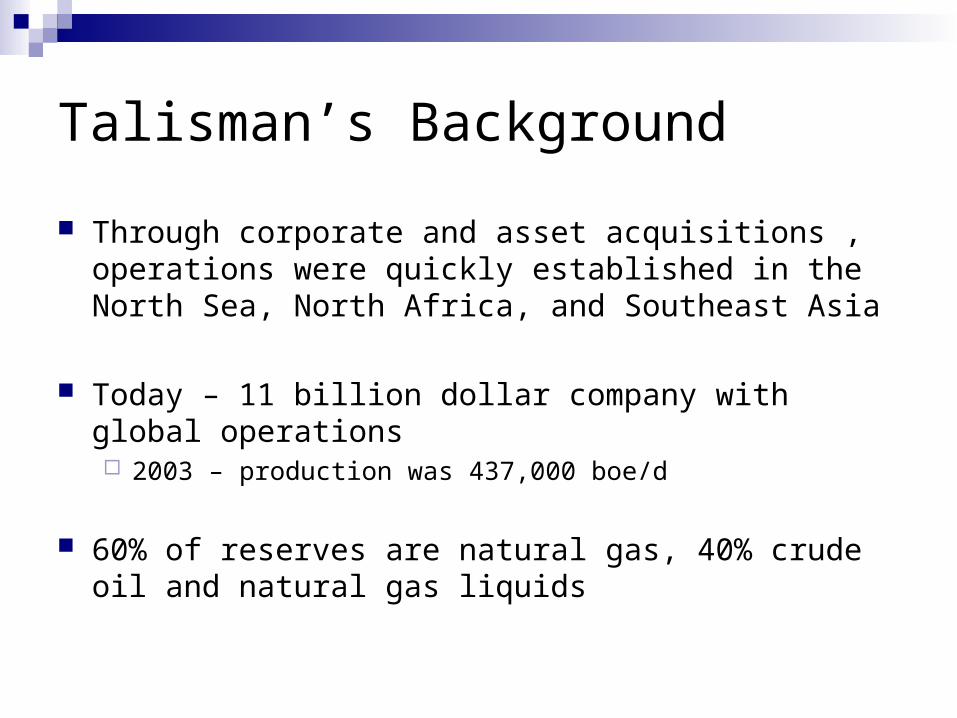
Talisman’s Background
Through corporate and asset acquisitions , operations were quickly established in the North Sea, North Africa, and Southeast Asia
Today – 11 billion dollar company with global operations 2003 – production was 437,000 boe/d
60% of reserves are natural gas, 40% crude oil and natural gas liquids
Mission Statement
“To create value for its shareholders in the upstream oil and gas business”
Goal
Committed to continuing production per share growth of at least 5-10% per annum for the next three years (2004, 2005, 2006) Most transparent measure of value creation
Continue to grow its large North American natural gas reserves while pursuing world scale international opportunities

Management Team James W. Buckee, President & CEO
o 1977-1991 British Petroleum Canada, 1991 appointed Chief operating officer of Talisman, 1993 became CEO of Talisman
Ron J. Eckhardt, Executive Vice President, North Americao 1986 – Joined Talisman (then British Petroleum Canada)
T.N.D. Hares, Executive Vice-President, Frontier & International Op.o 1972-1994 – Worked for British Petroleum, 1994 joined Talisman
Joseph Horler, Executive VP, Marketingo 1987 – Joined Talisman (BP Canada)
Michael D. McDonald, E.V.P. Finance and CFOo 1982 – Joined BP Canada
Robert M. Redgate, E.V.P., Corporate Serviceso 1978 – Joined Talisman (BP Canada)
Jacqueline Sheppard, E.V.P., Corporate and Legalo 1993 – Joined Talisman, prior to this she was a partner in a law firm
John ‘t Hart, E.V.P., Explorationo 1978 – Joined Talisman (BP Canada)
Competitors EnCana Penn West Petroleum Compton Petroleum Canadian Natural Resources Western Oil Sands Inc Bonavista Energy Trust Nexen Paramount Resources PetroKazakhstan Inc
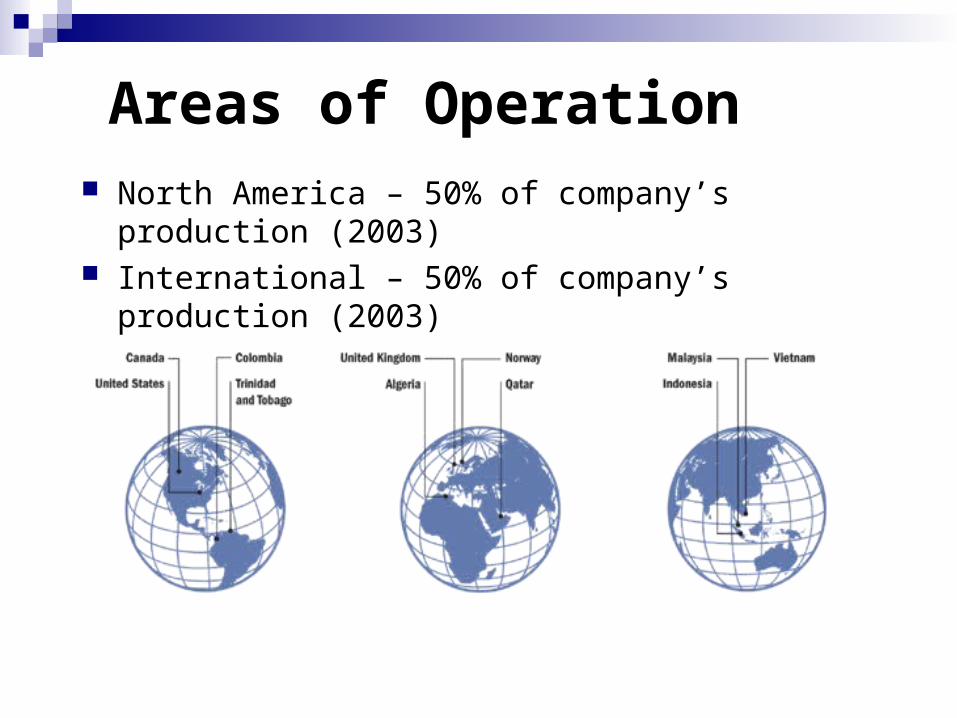
Areas of Operation North America – 50% of company’s production
(2003) International – 50% of company’s production (2003)
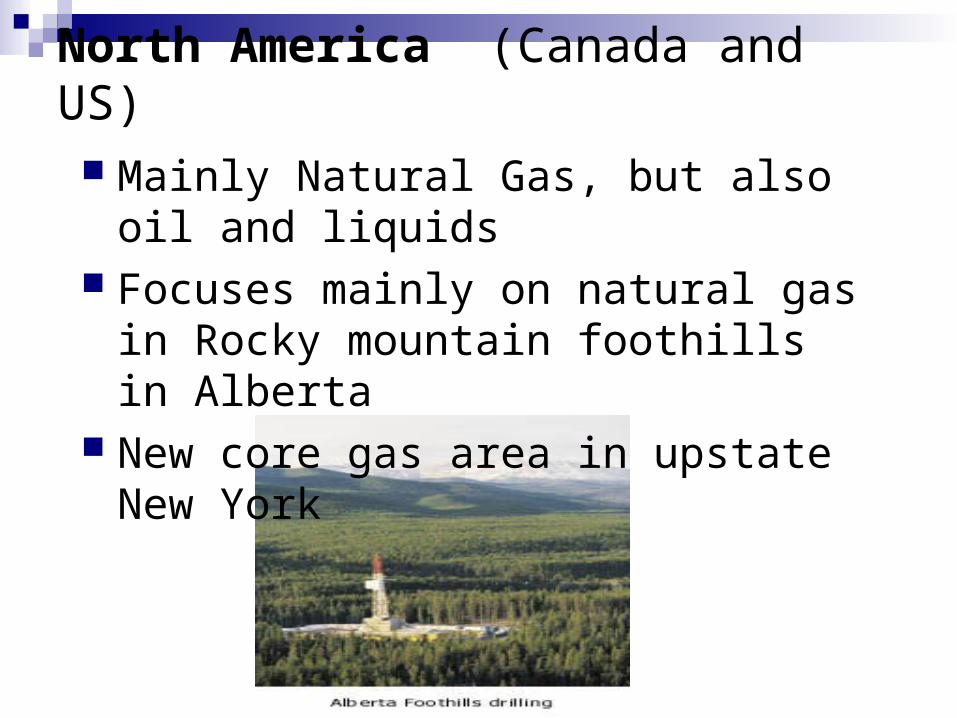
North America (Canada and US)
Mainly Natural Gas, but also oil and liquids
Focuses mainly on natural gas in Rocky mountain foothills in Alberta
New core gas area in upstate New York
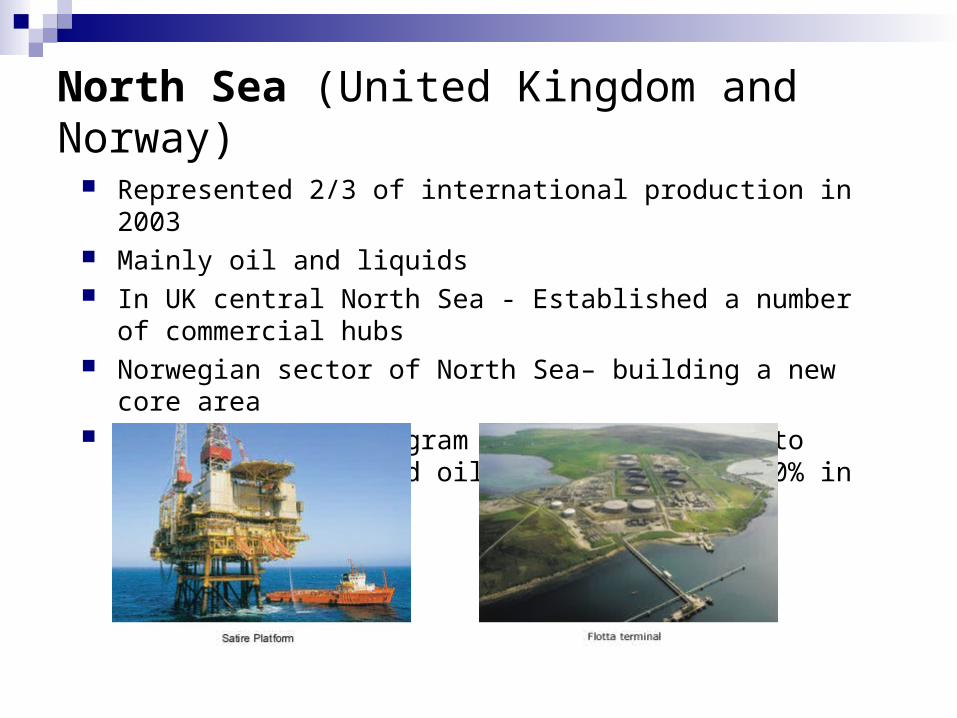
North Sea (United Kingdom and Norway)
Represented 2/3 of international production in 2003 Mainly oil and liquids In UK central North Sea - Established a number of commercial
hubs Norwegian sector of North Sea– building a new core area Large drilling program underway designed to increase liquid and
oil production by 5-10% in 2005

Malaysia/Vietnam (Malaysia, Vietnam, Indonesia)
2003 - Talisman completed a $1billion oil and gas development project on time and on budget

Southeast Asia
Large gas reserves in Indonesia Negotiating new gas sales and
transportation agreements
Caribbean and Latin America (Columbia, Trinidad and Tobago)
Working in a number of high exploration areas.
Trinidad – development of the Greater Angostura oil and gas project is underway
Columbia and Trinidad – exploration drilling programs
Africa and Middle East (Algeria, and Qatar)
March 2003 – completed sale of its indirectly held interest in the Greater Nile Oil project in Sudan $1.1 billion, gain of $296 million
Production and development interests in Algeria and exploration acreage in Qatar
Stock Information Share Price – $30.85 CAD (November 8, 2004)
Listed – Toronto and New York Stock exchanges
Ticker Symbol – TLM
Shares Outstanding – 384,105,983 (November 8, 2004)
Market Capitalization – $11,849,669,575.55 (384,105,983* $30.85)
52 Week low and High – $21.25 - $35.10
Dividends - June 30, 2004 - $.15 and Dec 31, 2004 - $.15
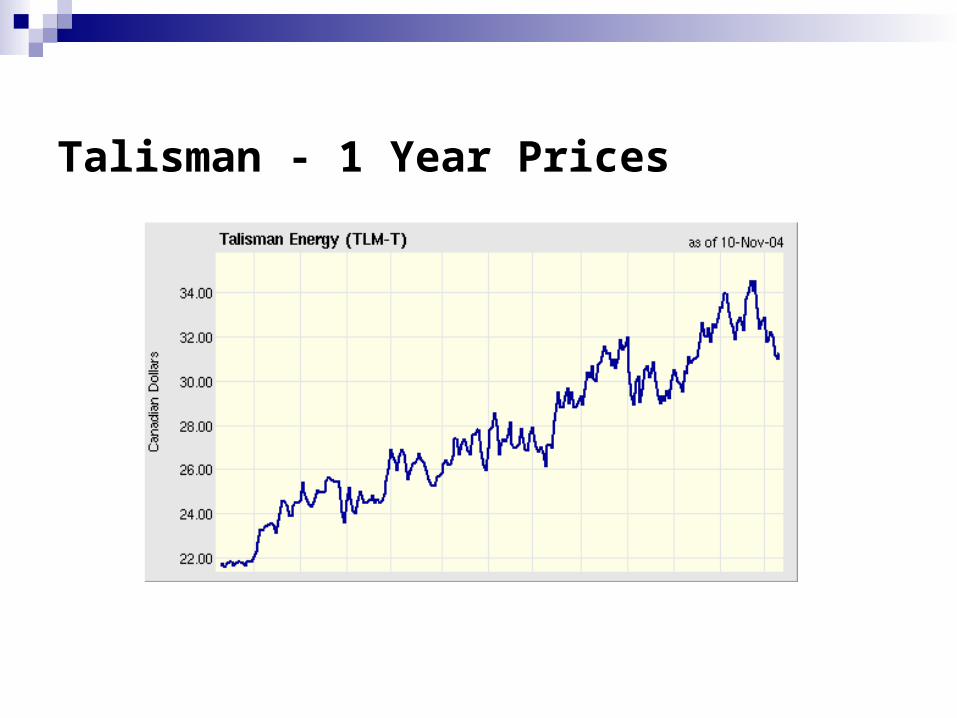
Talisman - 1 Year Prices
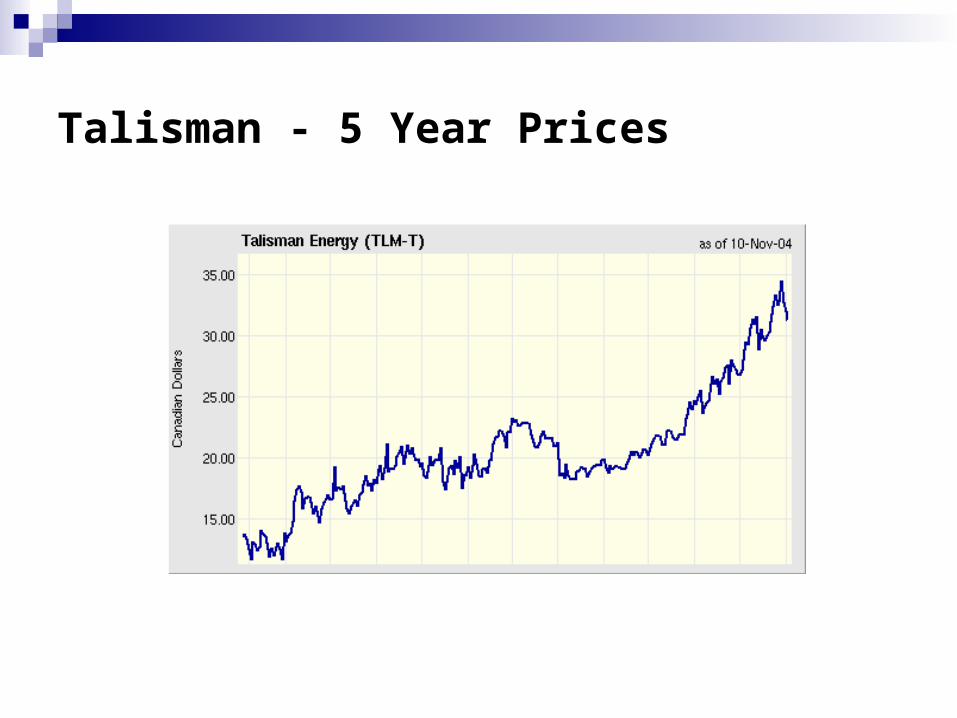
Talisman - 5 Year Prices
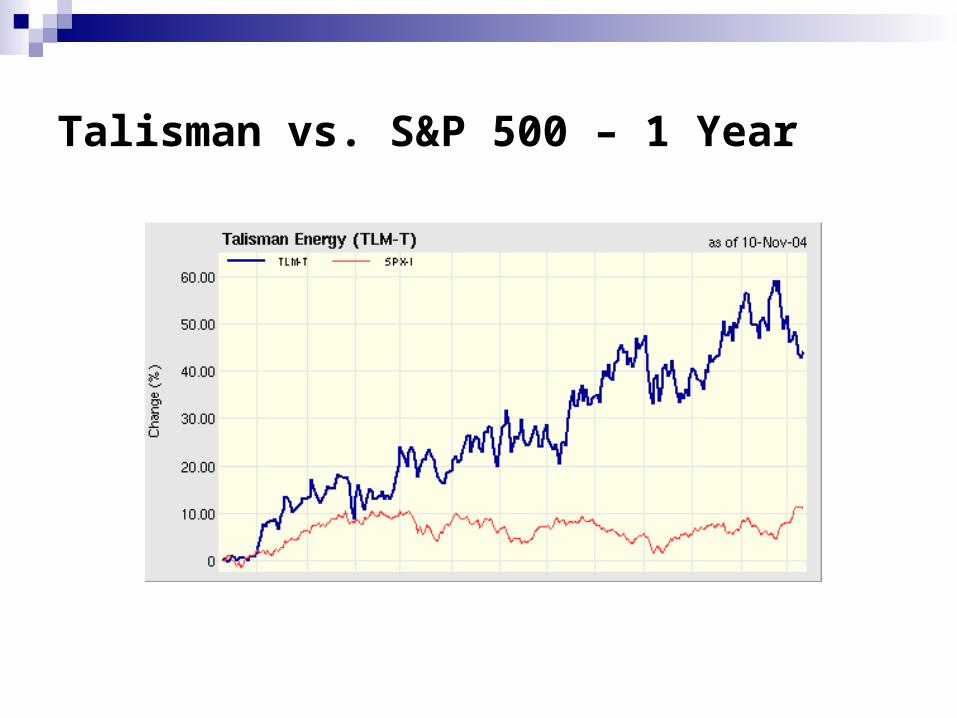
Talisman vs. S&P 500 – 1 Year
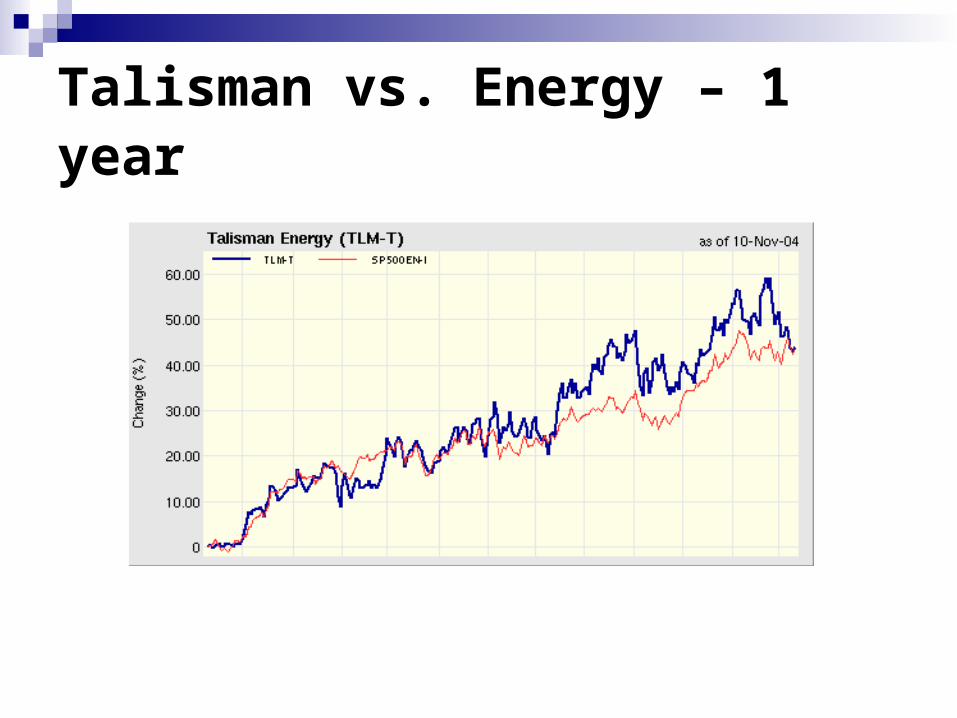
Talisman vs. Energy – 1 year
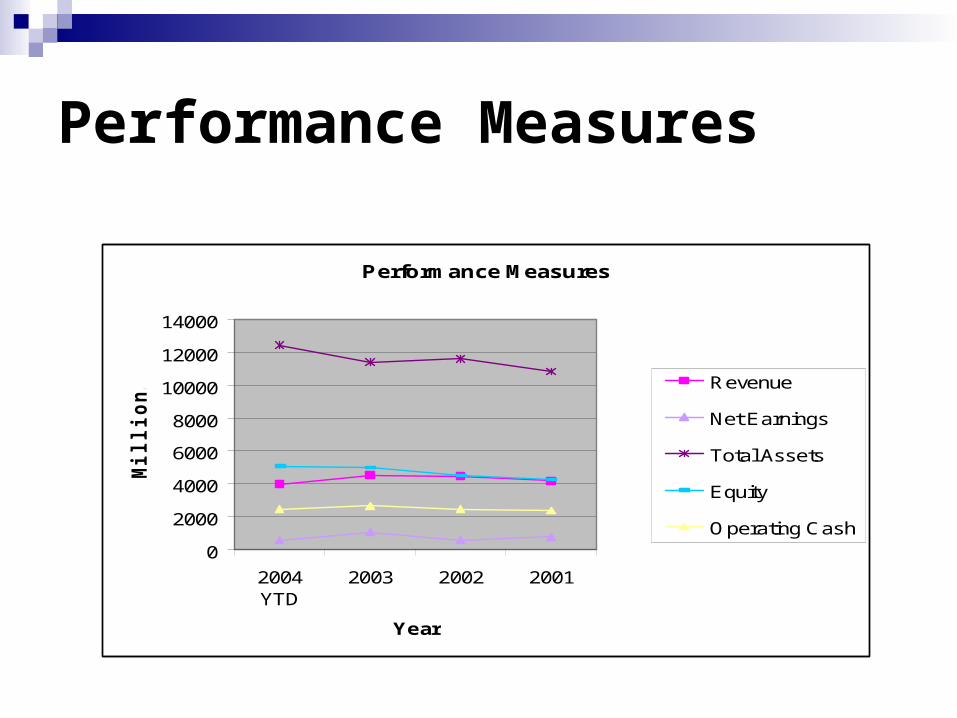
Performance Measures
Performance Measures
0
2000
4000
6000
8000
10000
12000
14000
2004YTD
2003 2002 2001
Year
Millio
ns (
$) Revenue
Net Earnings
Total Assets
Equity
Operating CashFlow
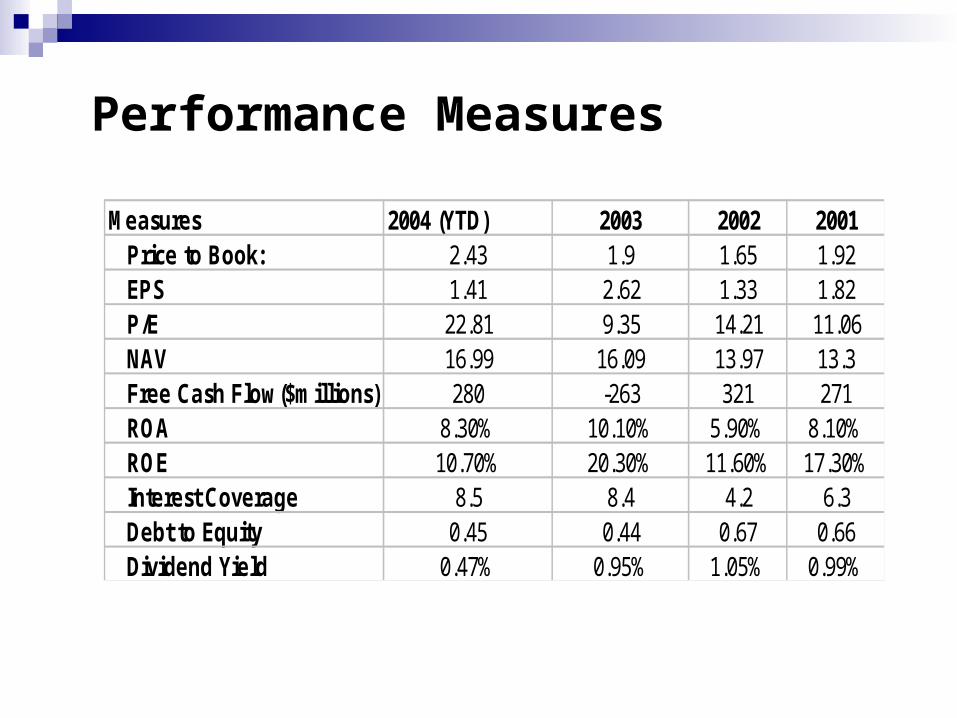
Performance Measures
Measures 2004 (YTD) 2003 2002 2001Price to Book: 2.43 1.9 1.65 1.92EPS 1.41 2.62 1.33 1.82P/E 22.81 9.35 14.21 11.06NAV 16.99 16.09 13.97 13.3Free Cash Flow($millions) 280 -263 321 271ROA 8.30% 10.10% 5.90% 8.10%ROE 10.70% 20.30% 11.60% 17.30%Interest Coverage 8.5 8.4 4.2 6.3Debt to Equity 0.45 0.44 0.67 0.66Dividend Yield 0.47% 0.95% 1.05% 0.99%

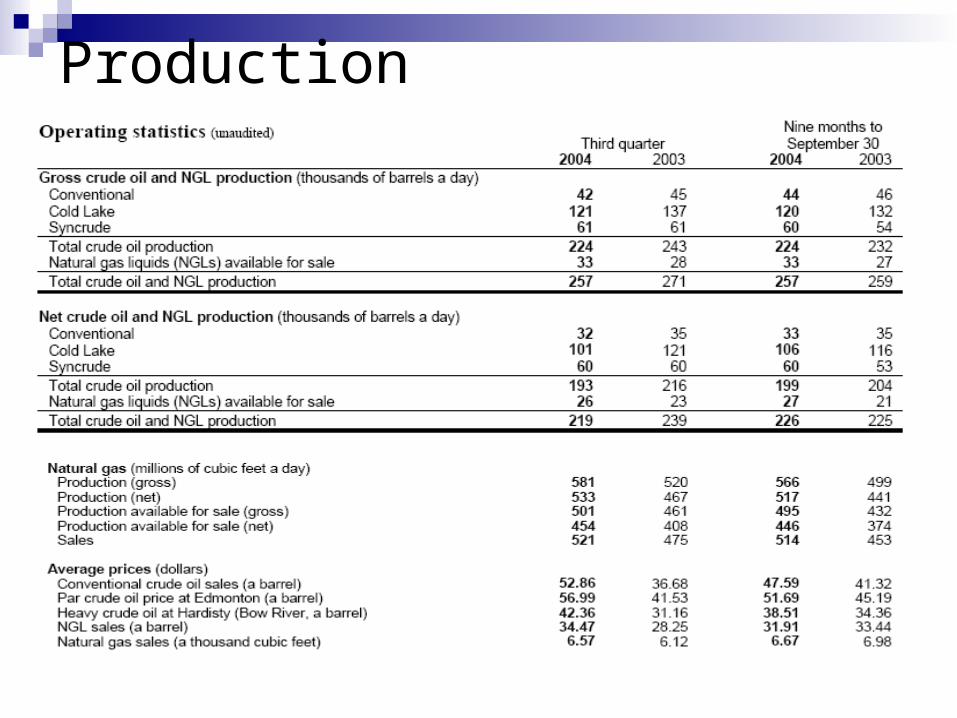
Production (daily average) Three months ended Nine months ended --------------------------------------September 30, 2004 2003 2004 2003--------------------------------------------------------------------Oil and liquids (bbls/d)North America 57,049 59,612 57,418 60,267North Sea 111,301 112,360 119,818 107,811Southeast Asia 36,047 22,241 35,853 22,170Algeria 14,044 7,795 12,935 4,839Sudan - - - 17,433-------------------------------------------------------------------- 218,441 202,008 226,024 212,520----------------------------------------------------------------------------------------------------------------------------------------Natural gas (mmcf/d)North America 892 853 884 863North Sea 98 91 111 106Southeast Asia 273 120 253 105-------------------------------------------------------------------- 1,263 1,064 1,248 1,074--------------------------------------------------------------------Total mboe/d (6mcf=1boe) 429 379 434 391
Production
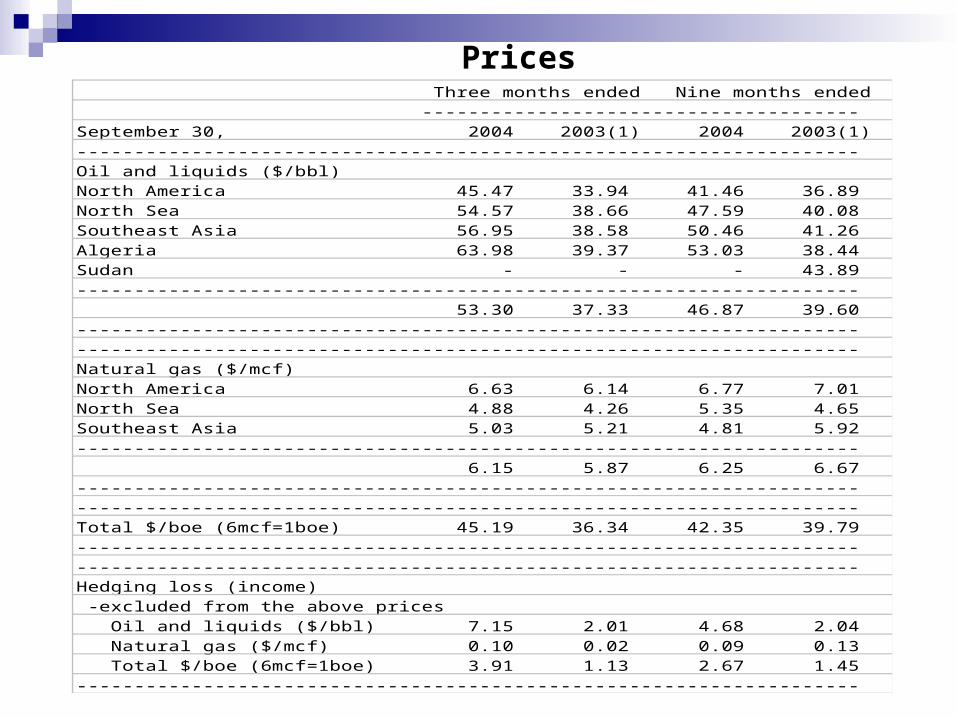
Three months ended Nine months ended --------------------------------------September 30, 2004 2003(1) 2004 2003(1)--------------------------------------------------------------------Oil and liquids ($/bbl)North America 45.47 33.94 41.46 36.89North Sea 54.57 38.66 47.59 40.08Southeast Asia 56.95 38.58 50.46 41.26Algeria 63.98 39.37 53.03 38.44Sudan - - - 43.89-------------------------------------------------------------------- 53.30 37.33 46.87 39.60----------------------------------------------------------------------------------------------------------------------------------------Natural gas ($/mcf)North America 6.63 6.14 6.77 7.01North Sea 4.88 4.26 5.35 4.65Southeast Asia 5.03 5.21 4.81 5.92-------------------------------------------------------------------- 6.15 5.87 6.25 6.67----------------------------------------------------------------------------------------------------------------------------------------Total $/boe (6mcf=1boe) 45.19 36.34 42.35 39.79----------------------------------------------------------------------------------------------------------------------------------------Hedging loss (income) -excluded from the above prices Oil and liquids ($/bbl) 7.15 2.01 4.68 2.04 Natural gas ($/mcf) 0.10 0.02 0.09 0.13 Total $/boe (6mcf=1boe) 3.91 1.13 2.67 1.45--------------------------------------------------------------------
Prices
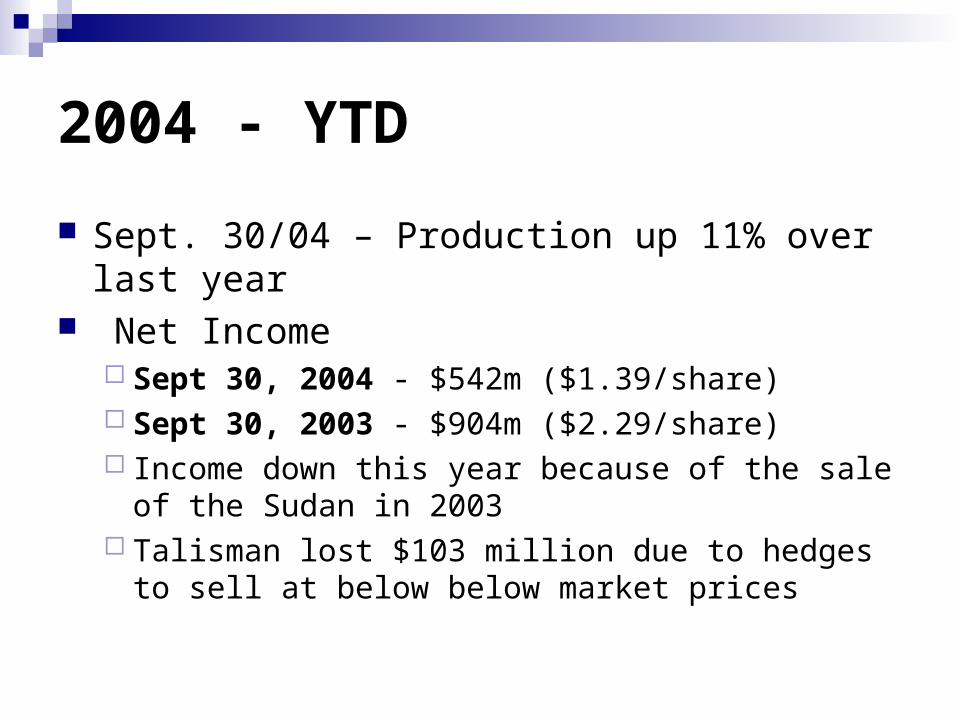
2004 - YTD
Sept. 30/04 – Production up 11% over last year Net Income
Sept 30, 2004 - $542m ($1.39/share) Sept 30, 2003 - $904m ($2.29/share) Income down this year because of the sale of the
Sudan in 2003 Talisman lost $103 million due to hedges to sell at
below below market prices

Breaking News – Nov. 9/04
Supply cushion – only about 1% of the 82.4 million barrels consumed daily
Two key exporters might be vulnerable to disruptions in the near future Iraq – US military have vowed to disrupt the country’s
oil exports, and a northern pipeline has been knocked out by saboteurs lowering supply
Nigeria – Oil workers are planning a general strike aimed at halting the country’s exports –
Nigeria is America’s fifth largest source of crude oil
Value Drivers
o Production o Oil and Gas Prices
Recommendations Sound business plan Product is always in demand Price of stock is down right now and is likely to
increase Company has increased production by 11% year
to date BUY!
Corporate Profile
Imperial Oil Limited has been a leading member of the Canadian energy industry for more than 120 years
One of the largest producers of crude oil and natural gas liquids in Canada and a major producer of natural gas
Canada’s largest refiner and marketer of petroleum products – sold primarily under the Esso brand name
Major producer of petrochemicals

Management Team
Imperial's 2003 Board of Directors (left to right) P. Des Marais II, B.J. Fischer, T.J. Hearn, R. Phillips, J.F. Shepard,
P.A. Smith, S.D. Whittaker, K.C. Williams, V.L. Young
•Majority of management team are from within Imperial Oil or Exxon/Mobil
•(Exxon has a 69.59% interest in Imperial)
Management Team
T.J. (Tim) Hearn has been a director of Imperial Oil since January 1, 2002. With the company since 1967 He is currently Imperial's chairman, president and CEO
P.A. (Paul) SmithMr. Smith has been a director of Imperial Oil since February 1, 2002.
He is currently controller and senior vice-president, finance and administration.
Joined Imperial Oil in 1980

Management cont…
B.J. (Brian) FischerMr. Fischer has been a director of Imperial since Sept. 1, 1992. He is currently senior vice-president of Imperial's products and
chemicals division Joined Imperial Oil in 1968
J. M. (Mike) YeagerMr. Yeager has been a director of Imperial Oil since August 1, 2004. He is currently senior vice-president, resources division, and president
and chief executive officer of Imperial Oil Resources He joined the company from Mobil
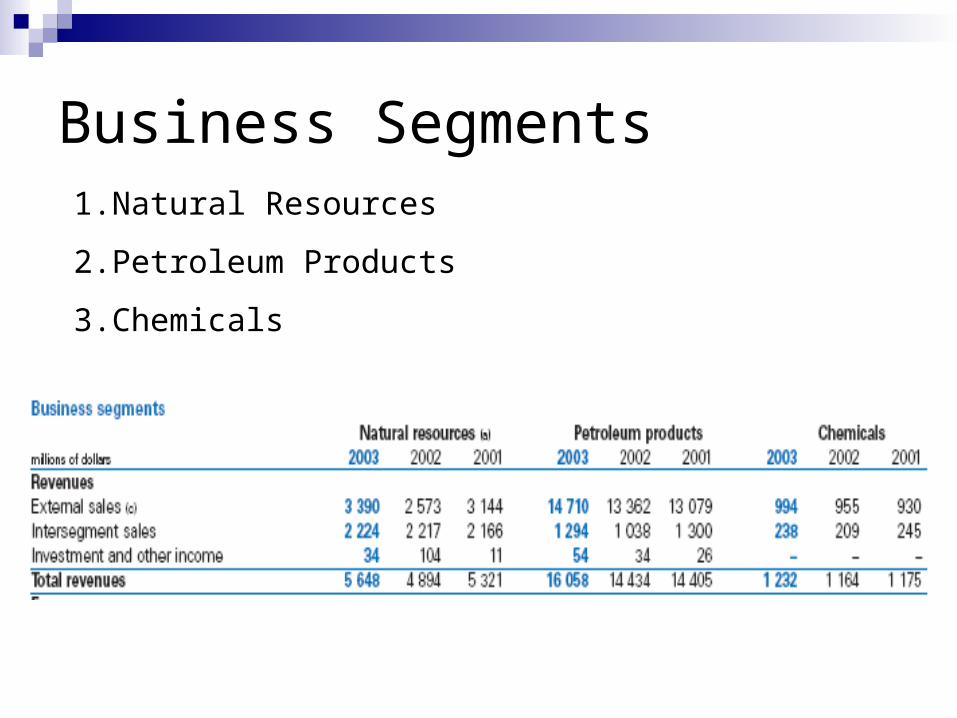
Business Segments1. Natural Resources
2. Petroleum Products
3. Chemicals
Natural Resources Segment
CRUDE OIL Wholly owned Cold Lake operation in Northern
Alberta 25 percent ownership position in Syncrude.
NATURAL GAS Wizard Lake Sable Offshore Energy Project Gwillim Field
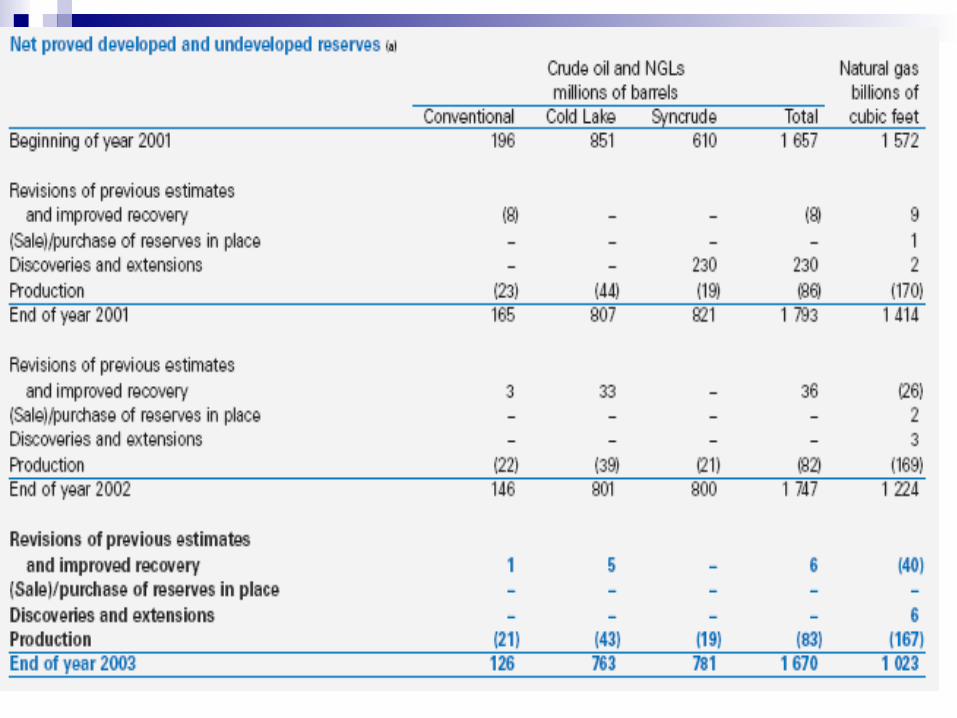
Crude Oil – Cold Lake
This is a long-life asset Net proved reserves were 760 MB at year-
end 2003 Additional untapped resource
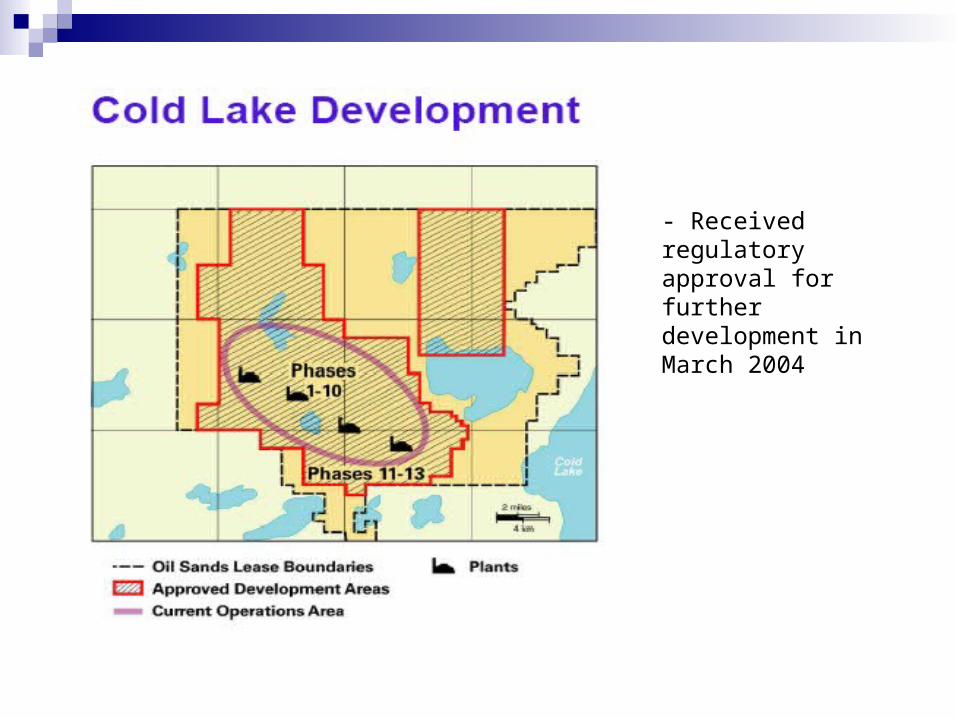
- Received regulatory approval for further development in March 2004
Crude Oil - Syncrude World's largest mineable oil sands
operation. Syncrude is the single largest crude oil
producer in Canada with net reserves of about 3 billion barrels and production of over 200 kbd in 2003.
Imperial was a founding member of Syncrude and has a 25 percent interest

Crude Oil – Syncrude (cont…)
Syncrude is currently progressing a major expansion for the operation -- one that will increase production by 50 percent and improve the quality and the sales price of the entire sales stream.
Total expected cost of $7.8 billion Disappointing cost and schedule
performance to date
Natural Gas Full production from the natural gas cap at Imperial’s Wizard Lake
oil field in Alberta began in July 2003. Production rates of about 180 million cubic feet a day will be achieved in
2004 once gas plant capacity is available and are expected to continue through 2006.
In November, the first natural gas was produced from the Gwillim field in northeastern BC. Additional development of this field is planned.
Natural gas production from 9% interest in the Sable offshore energy project averaged 40 million cubic feet a day before royalties. production began from a fourth Sable field, Alma, and construction was
started on facilities for a fifth field, South Venture.
Funding was also approved for a natural gas compression facility that will service production from all Sable fields by late 2006.
Natural Resources - Potential
Kearl Oil Sands (200k barrels/day) Mackenzie Gas Project
regulatory review process to take about 2 years design and construction should take 3-4 years potential for Mackenzie gas production by the end of the
decade Cree exploration well abandoned in the third
quarter Acquired 25% interest in Orphan Basin (Natural
Gas)
Production
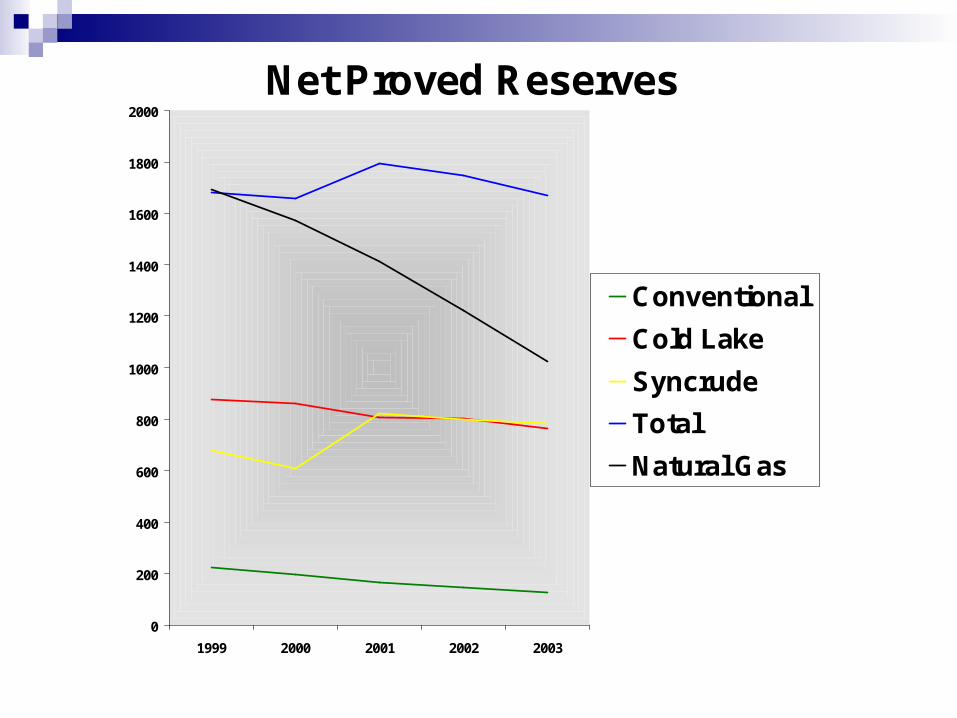
Net Proved Reserves
0
200
400
600
800
1000
1200
1400
1600
1800
2000
1999 2000 2001 2002 2003
Conventional
Cold Lake
Syncrude
Total
Natural Gas

Petroleum Products Segment
787 company-owned sites
Average productivity per site for 2003 was 5.2 million litres a year, up six percent from 2002.
650 Esso convenience stores across Canada, including On the Run and Tiger Express, was the second largest in Canada.
Convenience-store sales rose by about nine percent in 2003, well above the industry average.
400 sites with car-wash facilities is the largest in the industry.
Esso retail sites providing Tim Hortons food and refreshments had increased to more than 300 from 270 in 2002
Petroleum Products cont…
Points-Exchange alliances Market leader in finished lubricants Exclusive Canadian marketer of Mobil
products Quadrupled average productivity per site

Petroleum Products cont…
Focus on reducing working capital Decreased days inventory by 4% vs. 2002 Freed up more than $35 million in cash Over the last 10 years, this has been
reduced by about 25 percent.

Petroleum Products cont…
Capital Expenditures of $478 million in 2003Allowed them to meet specifications of 2004
model-year automobile technology Refineries have improved energy
efficiency by more than 40 percent over last 30 years
Chemicals Segment
Earnings of $37 million Cash flow from earnings of $66 million Sales of petrochemical products were
3,300 tonnes a day, down slightly from 2002.
N.A. demand was low in 2003, with high feedstock costs and soft sales volumes.

Chemicals cont…
One of Canada’s leading producers of chemical products
Largest market share in North America for polyethylene
Largest share of the Canadian market for solvents
Annual capacity of 450,000 tonnes
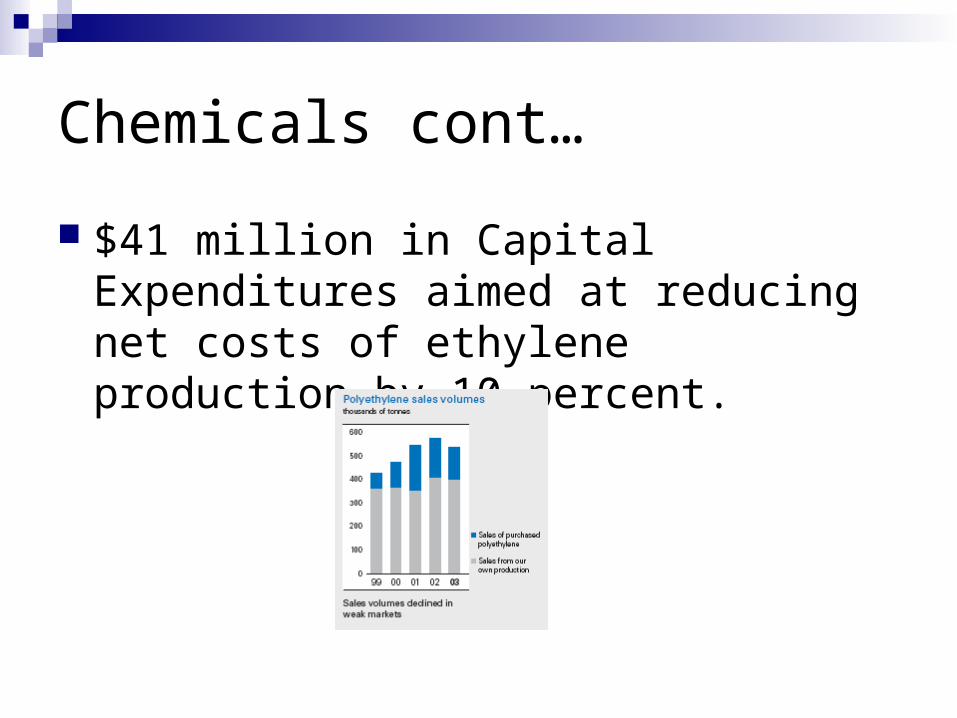
Chemicals cont…
$41 million in Capital Expenditures aimed at reducing net costs of ethylene production by 10 percent.

Financial Summary of Segments

Net Earnings by SegmentPetrolem Products
24%
Chemicals2%
Corporate6%
Natural Resources68%

Valuation Ratios
Measures Industry 2003 2002 2001 2000 1999
P/E 21.9 12.73 13.92 13.88 11.69 21.30
Price to Book: 3.70 3.71 3.27 4.03 3.92 3.09
Price to Sales 0.9 1.11 1.00 1.01 0.91 1.04
Price to CF 11.3 9.76 13.01 11.29 11.50 16.89
EPS $4.3 $4.52 $3.23 $3.19 $3.38 $1.46
Dividend Yield 1.90% 1.51% 1.87% 1.87% 1.98% 2.42%
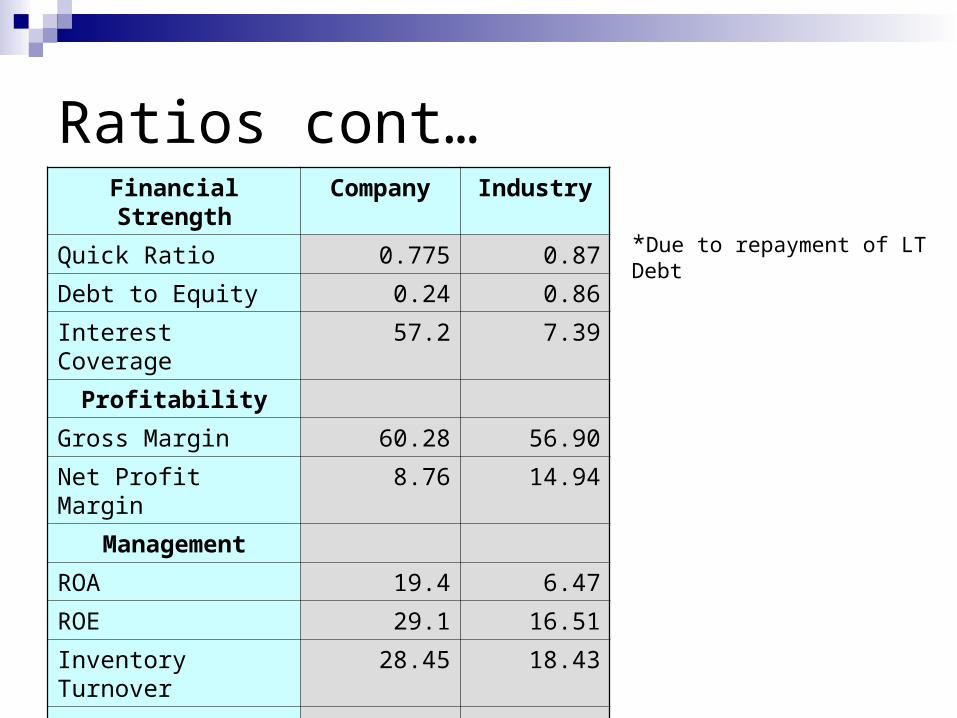
Ratios cont…Financial Strength Company Industry
Quick Ratio 0.775 0.87
Debt to Equity 0.24 0.86
Interest Coverage 57.2 7.39
Profitability
Gross Margin 60.28 56.90
Net Profit Margin 8.76 14.94
Management
ROA 19.4 6.47
ROE 29.1 16.51
Inventory Turnover 28.45 18.43
*Due to repayment of LT Debt
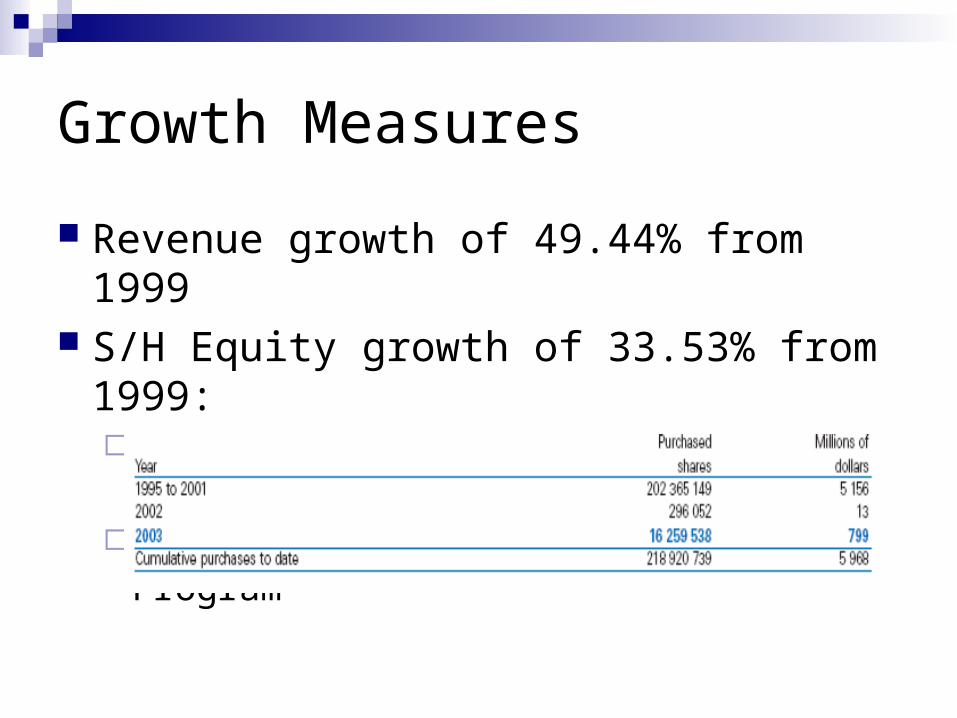
Growth Measures
Revenue growth of 49.44% from 1999 S/H Equity growth of 33.53% from 1999:
Increased due to increasing net earningsPartly offset by Share Repurchase Program
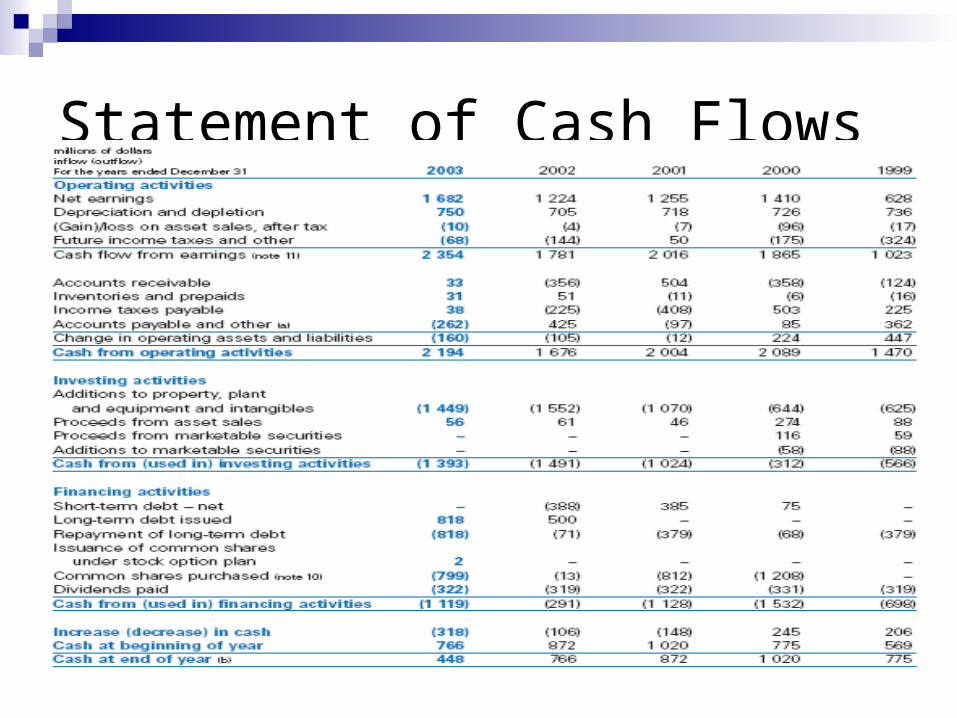
Statement of Cash Flows
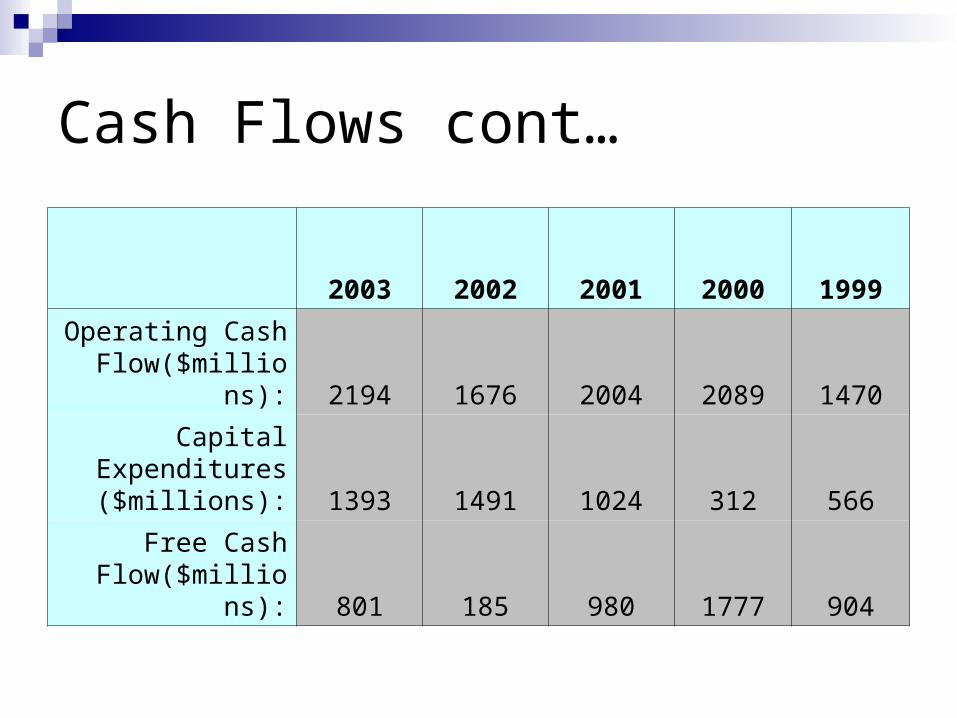
Cash Flows cont…
2003 2002 2001 2000 1999
Operating Cash Flow($millions): 2194 1676 2004 2089 1470
Capital Expenditures
($millions): 1393 1491 1024 312 566
Free Cash Flow($millions): 801 185 980 1777 904
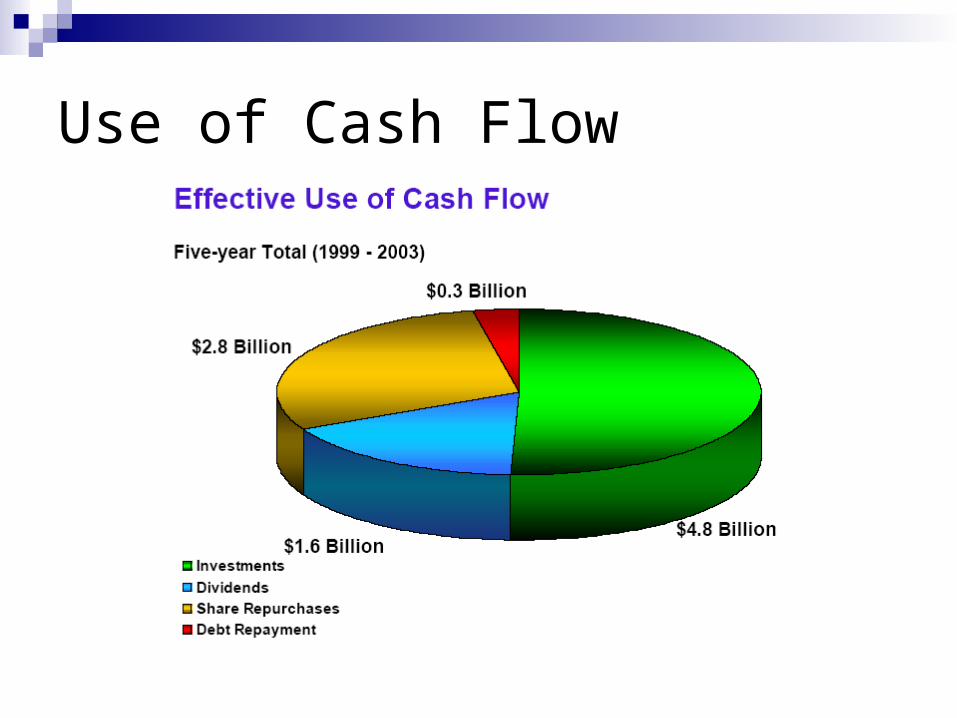
Use of Cash Flow
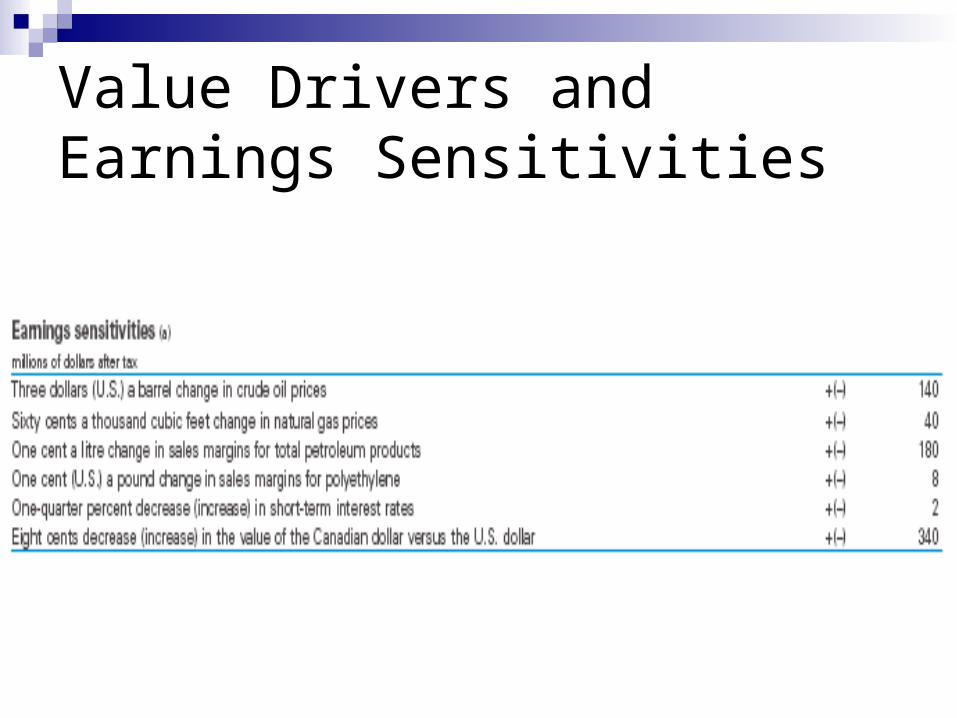
Value Drivers and Earnings Sensitivities

Stock Information
Ticker Symbols:(IMO-T) on TSX(IMO-A) on Amex
Market Capitalization(IMO-T) 24.79 Billion(IMO-A) 20.69 Billion
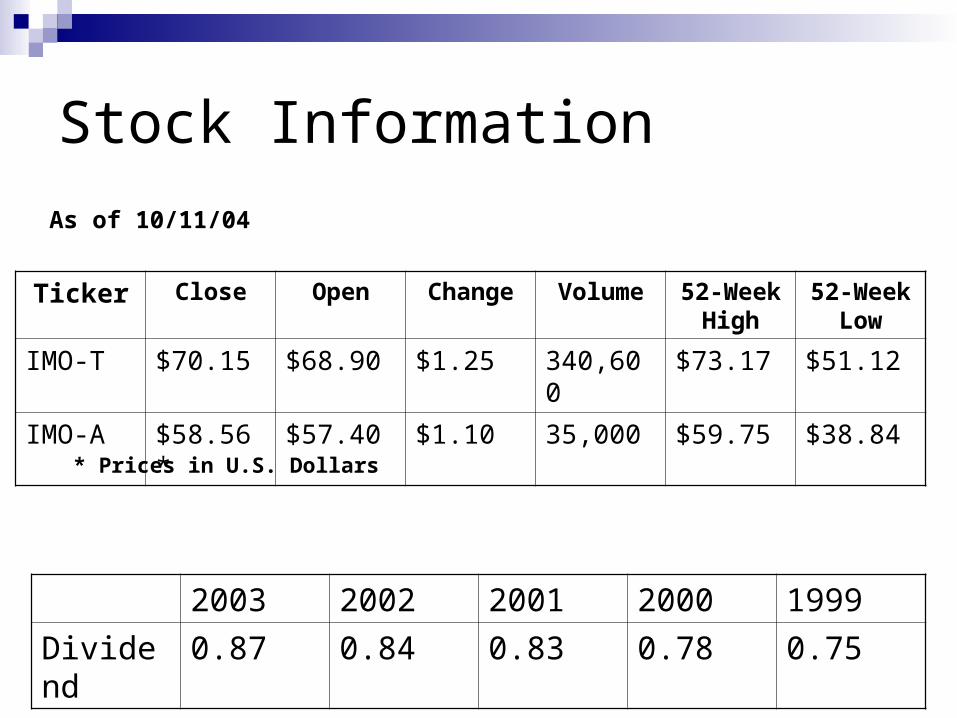
Stock Information
Ticker Close Open Change Volume 52-Week High
52-Week Low
IMO-T $70.15 $68.90 $1.25 340,600 $73.17 $51.12
IMO-A $58.56* $57.40 $1.10 35,000 $59.75 $38.84
* Prices in U.S. Dollars
As of 10/11/04
2003 2002 2001 2000 1999
Dividend 0.87 0.84 0.83 0.78 0.75
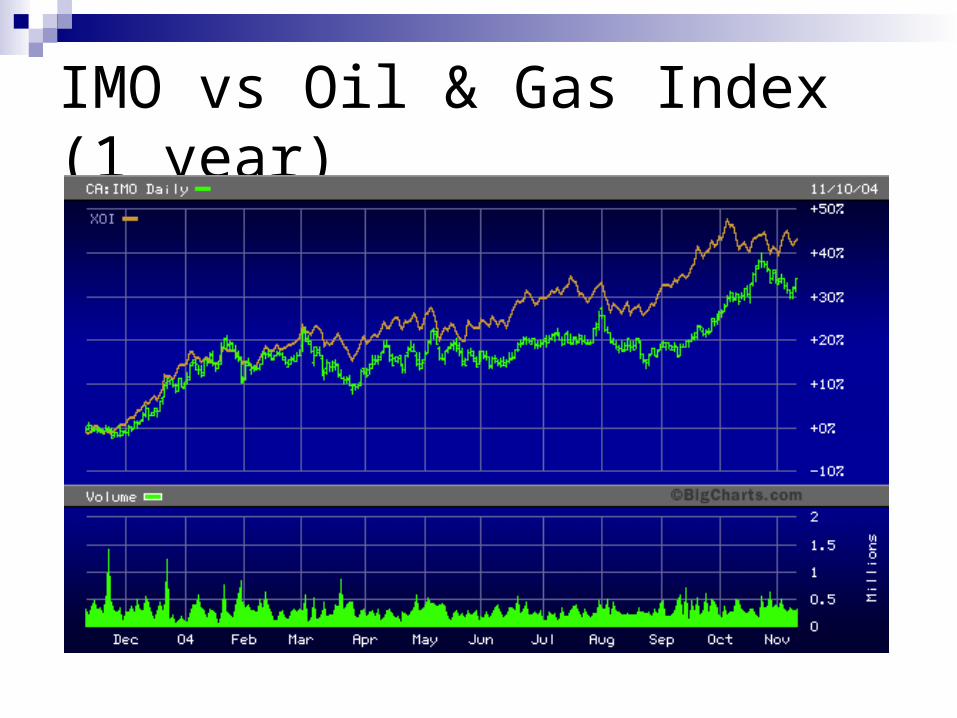
IMO vs Oil & Gas Index (1 year)
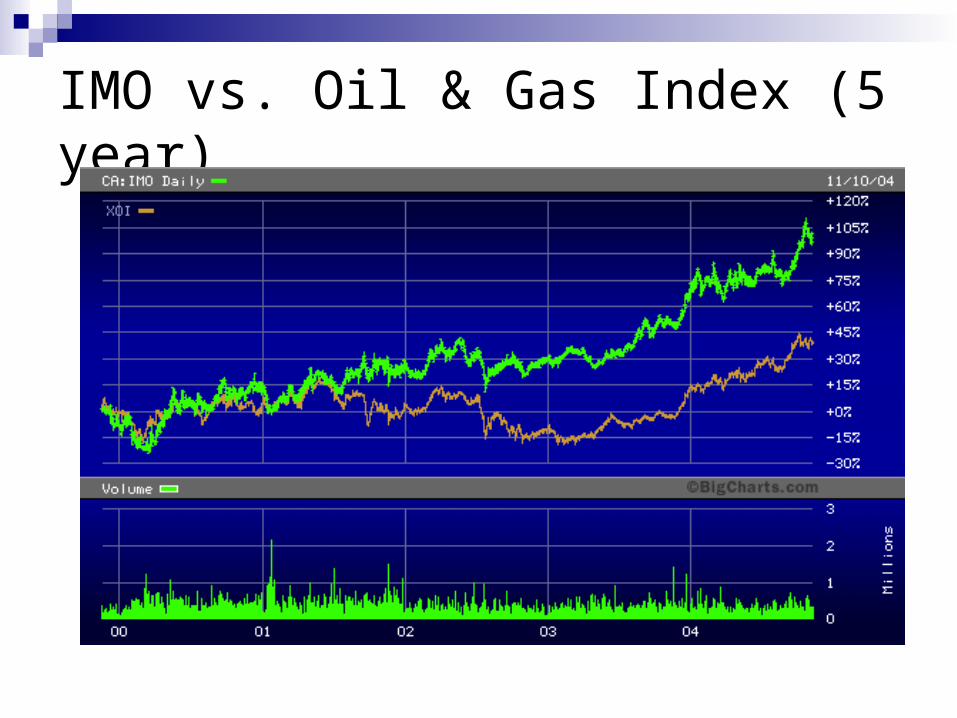
IMO vs. Oil & Gas Index (5 year)
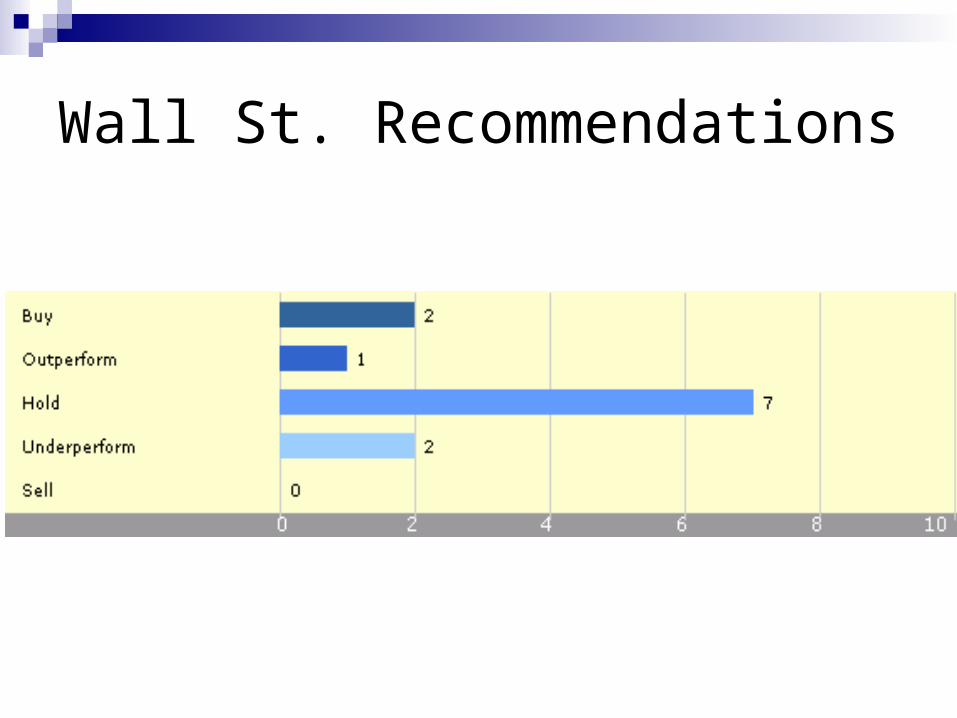
Wall St. Recommendations
Recommendation:
Strong sales and EPS growth High profitability compared to industry and S&P
500 High return ratios (ROE, ROA, ROI) Steady return potential for capital investments Strong dividend record and repurchase record
BUY