Embed Size (px)
Citation preview
Canadian Farm Income Outlook
Wayne Jones Agriculture Canada, Ottawa.
INTRODUCTION Since this is the first time an annual meeting of the Canadian Agricultural Eco- nomics and Farm Management Society has included an agricultural outlook ses- sion, there are no precedents for it. Hopefully this workshop session will generate sufficient interest to make outlook a permanent feature of the annual meeting. The idea of an outlook session is a good one, because forecasts are increasingly being used by governments and the private sector in formulating marketing strategies, in debating policy issues and in developing new programs. There is a strong demand for agricultural forecasts of increasing detail and longer time horizons.
Few agricultural statistics are quoted as often or misused so regularly as the farm income estimates and forecasts. Few areas raise as many fundamental ques- tions. Have farm incomes eroded over time, leaving today’s farmers worse off than previous generations? How dependent has the sector become on government assis- tance? Are the incomes of farm families comparable with those of other Canadian families? Why is there such a vast difference in income levels among similar farms?
There is a need to enhance the public’s understanding of the farm income situation in general and the interpretation and limitations of the income forecasts in particular. This paper attempts to address these concerns by providing highlights from Agriculture Canada’s current medium-term income forecast and by offering some observations on the interpretation of farm income data. First, however, a few comments on the department’s farm income outlook program may provide a useful background for what is to follow.
AGRICULTURE CANADA’S FARM INCOME OUTLOOK PROGRAM
Perhaps most importantly, the farm income forecast exercise is by no means a unilateral undertaking by Agriculture Canada. Statistics Canada and the provincial ministries of agriculture work closely with the department to reach a consensus forecast. In addition to improving the accuracy of the forecast, this tripartite approach ensures that key persons in every province are able to explain and inter- pret the forecast at the moment of release, that virtually all analysts and policy makers utilize the same forecast and that the forecast incorporates the most current data available from Statistics Canada.
The income forecast process itself involves translating national level farm commodity and input forecasts, provided by department market specialists through
Canadian Journal of Agricultural Economics 37 (1989) 1221-1230 1221

1222 CANADIAN JOURNAL OF AGRICULTURAL ECONOMICS
a coordinated forecast establishment process to ensure consistency, into provincial farm income statements. This involves a number of operations including:
determination of farmgate prices; allocation of marketings among provinces;
estimation of government program payments; and estimation of depreciation, income-in-kind and value of inventory change.
The level of commodity and input disaggregation and the extent of docu- mentation of the income forecast is extremely high, probably more so than in any other country. This attention to detail helps to improve accuracy but, even more importantly, it makes the forecast transparent, in that those responsible can identify and explain specific reasons for expected income shifts.
A number of recent changes to the income forecast format have been intro- duced in keeping with changes to the Statistics Canada historical farm income series. Starting with the second-quarter 1989 outlook report, producer market receipts from commodity sales are separated from government payments as distinct components of farm cash receipts. Similarly, operating expenses are presented both before and after government input cost rebates.
In addition, three different measures of farm income are presented. Net cash income is the sum of market receipts and total payments to producers less operating expenses, which is a measure of the cash available from farming for debt repay- ment, reinvestment and family living expenses. Realized net income includes an estimate of income-in-kind and an allowance for depreciation of farm buildings and equipment. Realized net income has been the traditional measure of farm income in Canada for many years. Total net income includes a further adjustment for changes in the value of on-farm inventory and therefore approaches an accrual income statement, which is a more accurate measure of the financial performance of the sector.
Other changes include a move from semiannual to quarterly short-term (one year) farm income forecasts and the introduction of a semiannual medium-term (five years) forecast of realized net income. At present, the medium-term forecast only disaggregates between East and West rather than by province.
A look at past forecasts relative to official Statistics Canada expost estimates provides some reference on the accuracy of recent income forecasts. It is important to note that farm income, as a small residual estimate, is subject to large fluctua- tions from very small movements in either cash receipts or farm expenses. For example, a 5% change in receipts would result in a 20-25% change in net farm income.
Table 1 shows percentage differences between Agriculture Canada’s Decem- ber forecasts of realized net income for the following year and official estimates by Statistics Canada for 1986 and 1987. The negative signs imply the forecast income level was below the official estimate. These data suggest the forecasts tend to be conservative, often because government ad hoc programs cannot be antici-

CANADIAN FARM INCOME OUTLOOK 1223
Table 1 . Accuracy of realized net farm income forecasts
1986 1987
Newfoundland Prince Edward Island Nova Scotia New Brunswick Quebec Ontario Manitoba Saskatchewan Alberta British Columbia
(%I -17.8 -16.3 -9.1 -12.8 +1 .5 -6.4
-14.0 -15.8 +1.4 +7.7 +1.9 -8.9 - 10.6 -34.8 -18.8 -15.1
-8 .1 -39.0 -18.4 -9.9
Canada -5.9 -14.2
pated. The provincial differences indicate that the level of accuracy is likely higher in Quebec and Ontario, where the farm sector is larger and more diverse. Although not shown in the table, the income forecasts in most cases correctly predict the direction of change.
MEDIUM-TERM FARM INCOME FORECAST
Agriculture Canada is currently in the process of preparing a revised medium-term forecast for release in August 1989. While the actual numbers may vary from these in this presentation, the basic message should not. Accordingly, the focus here is on the farm income highlights, rather than on specific numerical forecasts. There are three major aspects to the forecast worth noting:
grain and oilseed sector problems; and shifts in market receipts versus program payments.
East/West farm income prospects;
While the intention is to focus on the results of the forecast, a few comments about the underlying assumptions are necessary. In terms of the international set- ting, the underlying excess capacity problem in major world markets is expected to continue. No major changes in policies are assumed on the part of major pro- ducing nations. However, the agreement reached at multilateral trade negotiations under the General Agreement on Tariffs and Trade (GATT) in Geneva this spring to reduce trade-distorting policies in the long term and to freeze support measures at current levels until the end of negotiations in 1991 is expected to have an impact on the medium-term outlook. This influence is quite apart from the results of these negotiations, which are not presumed.
1224 CANADIAN JOURNAL OF AGRICULTURAL ECONOMICS
~ ~~
I 0 DIRECTPAYMENTS
81 tu 83 84 85 86 87 88 89 W 91 92 93
FORECASTS
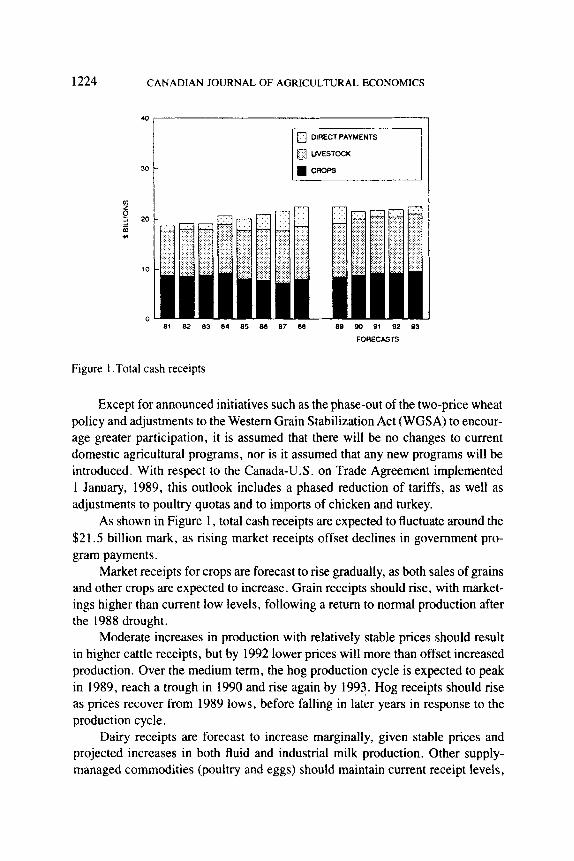
Figure 1 .Total cash receipts
Except for announced initiatives such as the phase-out of the two-price wheat policy and adjustments to the Western Grain Stabilization Act (WGSA) to encour- age greater participation, it is assumed that there will be no changes to current domestic agricultural programs, nor is it assumed that any new programs will be introduced. With respect to the Canada-U.S. on Trade Agreement implemented 1 January, 1989, this outlook includes a phased reduction of tariffs, as well as adjustments to poultry quotas and to imports of chicken and turkey.
As shown in Figure 1, total cash receipts are expected to fluctuate around the $21.5 billion mark, as rising market receipts offset declines in government pro- gram payments.
Market receipts for crops are forecast to rise gradually, as both sales of grains and other crops are expected to increase. Grain receipts should rise, with market- ings higher than current low levels, following a return to normal production after the 1988 drought.
Moderate increases in production with relatively stable prices should result in higher cattle receipts, but by 1992 lower prices will more than offset increased production. Over the medium term, the hog production cycle is expected to peak in 1989, reach a trough in 1990 and rise again by 1993. Hog receipts should rise as prices recover from 1989 lows, before falling in later years in response to the production cycle.
Dairy receipts are forecast to increase marginally, given stable prices and projected increases in both fluid and industrial milk production. Other supply- managed commodities (poultry and eggs) should maintain current receipt levels,

CANADIAN FARM INCOME OUTLOOK 1225
17
16
15 z 5 - m *) 14
13
12 81 82 83 84 85 86 87 88 89 90 91 92 93
FORECASTS
Figure 2. Total farm operating expenses
as production increases mitigate short-term price decreases in response to lower feed costs.
Forecast increases in total market receipts are, however, expected to be par- tially offset by lower program payments in the absence of new government initi- atives. The phasing-out of current ad hoc programs, such as the Special Canadian Grains Program and drought assistance, and lower payouts under WGSA in response to higher grain prices and a declining support base, suggests direct pay- ments to producers will drop from the record high levels of about $3.5 billion over the 1987-89 period to the $1.5 billion range through 1993.
Farm operating expenses, after posting two consecutive years of decline in 1986 and 1987 and a slight increase in 1988, are forecast to rise substantially in 1989 as a result of higher prices for virtually all farm inputs (Figure 2). A return to normal production levels after last year’s drought implies greater utilization of most crop-related inputs, particularly in the prairies. Through the remainder of the forecast period, total farm expenses are expected to increase by about 2% annually, which is somewhat less than the expected rate of inflation in the general economy.
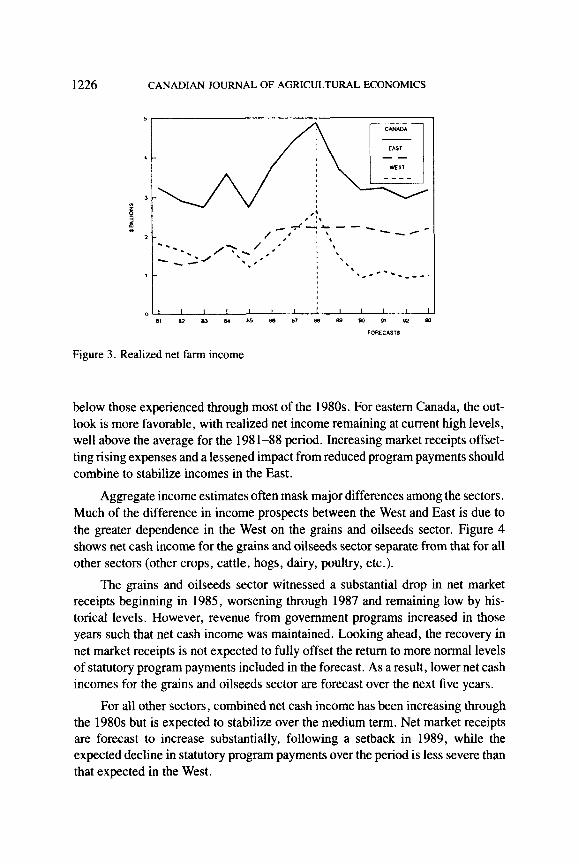
Over the 1989-93 period, realized net farm income is expected to decline from the record high 1988 level, with the annual average for the five years about $300 million or 8% below the 1981-88 average (Figure 3).
There are substantial differences in the medium-tern outlook between west- ern and eastern Canada. Prospects are for declines in realized net income in the West from a record high 1988 level, despite forecast higher market receipts. Rising operating expenses and lower program payments combine to drop income levels
1226 CANADIAN JOURNAL OF AGRICULTURAL ECONOMICS
5
. 3 : 2
1
Figure 3 . Realized net farm income
below those experienced through most of the 1980s. For eastern Canada, the out- look is more favorable, with realized net income remaining at current high levels, well above the average for the 198 1-88 period. Increasing market receipts offset- ting rising expenses and a lessened impact from reduced program payments should combine to stabilize incomes in the East.
Aggregate income estimates often mask major differences among the sectors. Much of the difference in income prospects between the West and East is due to the greater dependence in the West on the grains and oilseeds sector. Figure 4 shows net cash income for the grains and oilseeds sector separate from that for all other sectors (other crops, cattle, hogs, dairy, poultry, etc.).
The grains and oilseeds sector witnessed a substantial drop in net market receipts beginning in 1985, worsening through 1987 and remaining low by his- torical levels. However, revenue from government programs increased in those years such that net cash income was maintained. Looking ahead, the recovery in net market receipts is not expected to fully offset the return to more normal levels of statutory program payments included in the forecast. As a result, lower net cash incomes for the grains and oilseeds sector are forecast over the next five years.
For all other sectors, combined net cash income has been increasing through the 1980s but is expected to stabilize over the medium term. Net market receipts are forecast to increase substantially, following a setback in 1989, while the expected decline in statutory program payments over the period is less severe than that expected in the West.

CANADIAN FARM INCOME OUTLOOK 1227
GRAINS AND OILSEEDS
5
4 t
a1 82 05 04 85 86 87 w 89 W 91 92 93
FORECASTS
ALL OTHER COMMODITIES
5 ,
I 10 GOVERNMENT
81 82 (13 84 8s 86 87 8a 89 90 91 92 93
FORECASTS
Figure 4. Net farm cash income
SOME OBSERVATIONS ON INTERPRETING FARM INCOME ESTIMATES
The foregoing has shown that there are marked differences in the farm income situation and outlook across regions, among sectors, and between market condi- tions and total income after program payments. These differences are well under- stood, but there are other factors that should be considered when farm incomes are used as an indicator of well-being of farmers and their families.
1228 CANADIAN JOURNAL OF AGRICULTURAL ECONOMICS
175 1 1
71 73 75 77 79 81 83 85 87 89 91 93
FORECASTS
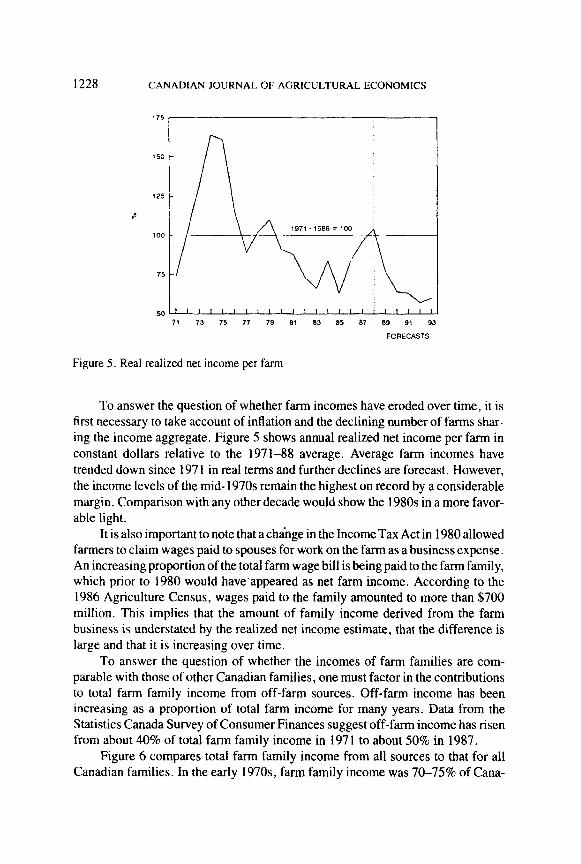
Figure 5. Real realized net income per farm
To answer the question of whether farm incomes have eroded over time, it is first necessary to take account of inflation and the declining number of farms shar- ing the income aggregate. Figure 5 shows annual realized net income per farm in constant dollars relative to the 1971-88 average. Average farm incomes have trended down since 197 1 in real terms and further declines are forecast. However, the income levels of the mid- 1970s remain the highest on record by a considerable margin. Comparison with any other decade would show the 1980s in a more favor- able light.
It is also important to note that a cha‘nge in the Income Tax Act in 1980 allowed farmers to claim wages paid to spouses for work on the farm as a business expense. An increasing proportion of the total farm wage bill is being paid to the farm family, which prior to 1980 would have’appeared as net farm income. According to the 1986 Agriculture Census, wages paid to the family amounted to more than $700 million. This implies that the amount of family income derived from the farm business is understated by the realized net income estimate, that the difference is large and that it is increasing over time.
To answer the question of whether the incomes of farm families are com- parable with those of other Canadian families, one must factor in the contributions to total farm family income from off-farm sources. Off-farm income has been increasing as a proportion of total farm income for many years. Data from the Statistics Canada Survey of Consumer Finances suggest off-farm income has risen from about 40% of total farm family income in 1971 to about 50% in 1987.
Figure 6 compares total farm family income from all sources to that for all Canadian families. In the early 1970s, farm family income was 70-75% of Cana-

CANADIAN FARM INCOME OUTLOOK 1229
Figure 6. Comparison of farm family income with the average for all families
dian family income. The gap has narrowed to the point where farm family incomes are about the same and in some years above the Canadian family average. This is likely the result of more and better off-farm income opportunities, a relatively larger number of “commercial-sized” farms with higher farm incomes and increased government support in years of depressed farm market receipts.
Finally, the unequal distribution of farm income among farms should be noted. Estimates of average farm income per farm based on income aggregates and total farm numbers seriously underestimate farm income of the larger commercial-sized farms. Canadian agriculture includes a large number of very small farms with virtually no contribution to aggregate net farm income. Fully one half of the esti- mated 293,000 census farms reported gross farm sales of under $31 ,OOO in 1985. The aggregate net cash income of these farms in 1985, as measured by the Agn- culture Census, was a negative $450 million. Most of these small farms survive on off-farm sources of income.
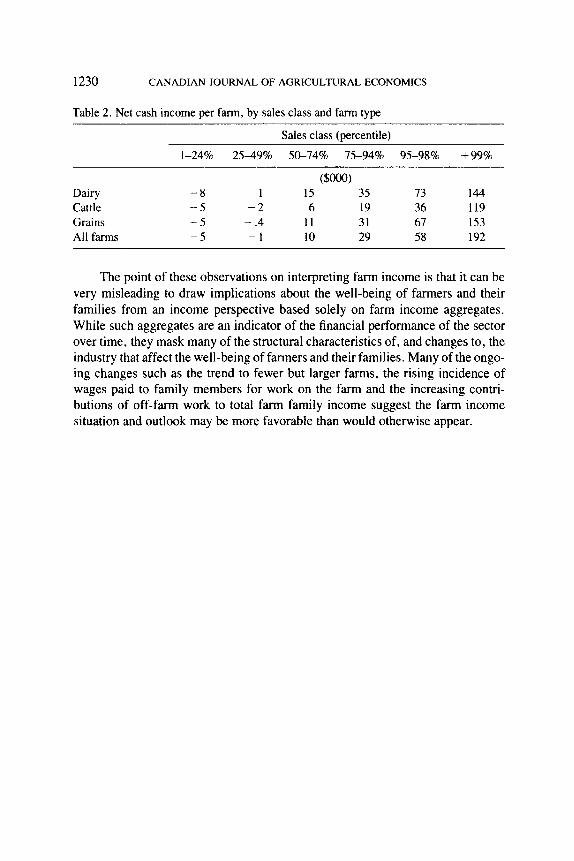
Table 2 shows 1985 average net cash income per farm for all farms and for selected farm types by gross farm sales percentiles; that is, farms are ranked from smallest to largest according to the amount of gross farm sales in 1985. One can see the wide variation in income levels across farm sizes. For the bottom two gross sales quartiles (50% of all farms), net cash income is generally negative. Cash income increases rapidly with farm size, from an average of about $lO,OOO for the third quartile to $192,OOO for the largest 1% of farms. Of course, net cash income is before depreciation or debt repayment, but clearly the large farms are capable of generating very high cash incomes.
1230 CANADIAN JOURNAL OF AGRICULTURAL ECONOMICS
Table 2. Net cash income per farm, by sales class and farm type
Sales class (percentile)
I-24% 2549% 5&74% 75-94% 95-98% +99%
($ooo) Dairy - 8 1 15 35 73 144 Cattle - 5 - 2 6 19 36 119 Grains - 5 - .4 1 1 31 67 153 All farms - 5 - 1 10 29 58 192
The point of these observations on interpreting farm income is that it can be very misleading to draw implications about the well-being of farmers and their families from an income perspective based solely on farm income aggregates. While such aggregates are an indicator of the financial performance of the sector over time, they mask many of the structural characteristics of, and changes to, the industry that affect the well-being of farmers and their families. Many of the ongo- ing changes such as the trend to fewer but larger farms, the rising incidence of wages paid to family members for work on the farm and the increasing contri- butions of off-farm work to total farm family income suggest the farm income situation and outlook may be more favorable than would otherwise appear.