Embed Size (px)
Citation preview
Canadian Bioenergy AssociationIEA Task 38 Workshop
Status of Forest Biomass StrategyVictoria, BC, Sept 15, 2004
Doug Bradley
President DirectorClimate Change Solutions CANBIO
15 Sept 2004 IEA Bioenergy Task 38 2
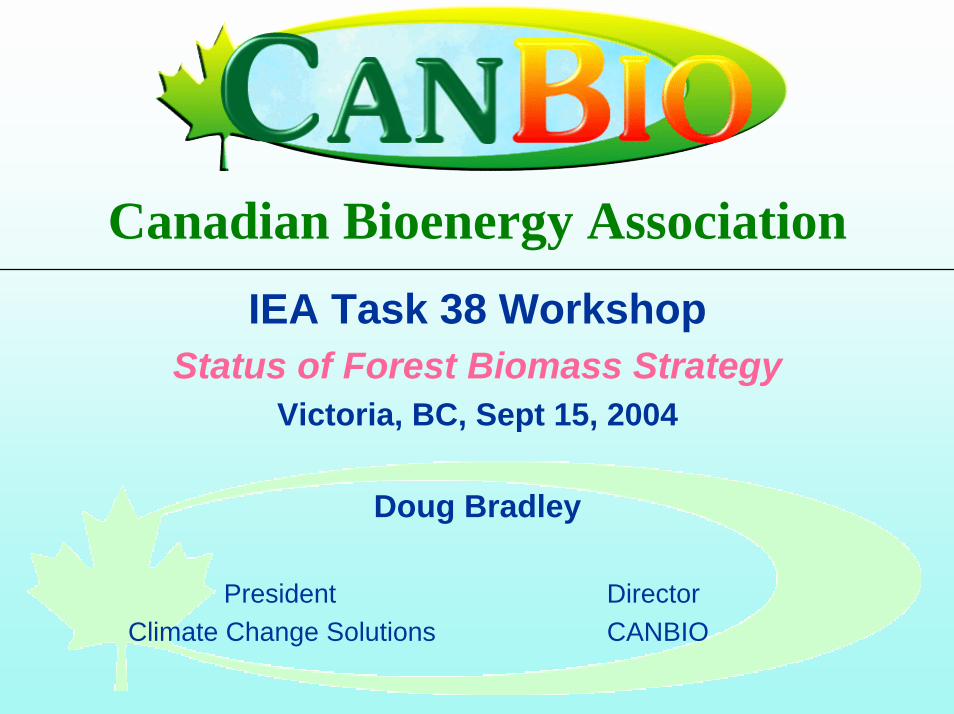
Topics
o CanBioo Bioenergy Issues
v Biomass volumes, costsv Technologiesv Financial Requirementsv Incentivesv Biotrade
o Bioenergy Strategy
15 Sept 2004 IEA Bioenergy Task 38 3
CanBio: National, industry driven, non-profit
o Objectivesv Promote bioenergy developmentv National voice for bioenergy industryv Develop national bioenergy strategyv Identify barriers, opportunitiesv Information exchange/ Educatev Influence policies, incentives
15 Sept 2004 IEA Bioenergy Task 38 4
Topics
o CanBioo Bioenergy Issues
v Biomass volumesv Technologiesv Financial Requirementsv Incentivesv Biotrade
o Bioenergy Strategy
15 Sept 2004 IEA Bioenergy Task 38 5
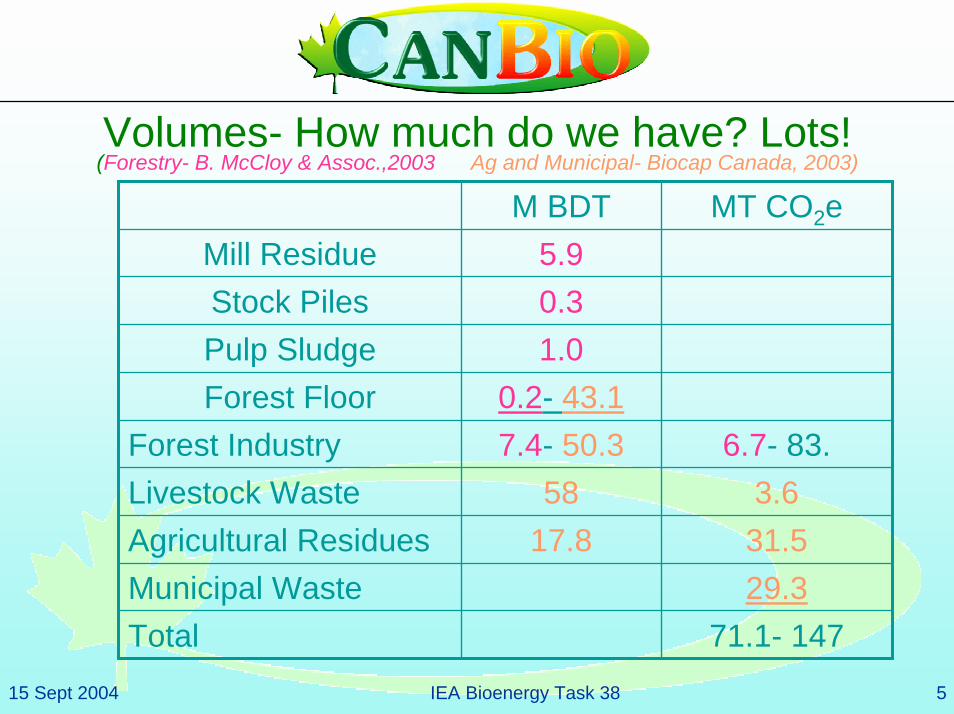
Volumes- How much do we have? Lots! (Forestry- B. McCloy & Assoc.,2003 Ag and Municipal- Biocap Canada, 2003)
M BDT MT CO2eMill Residue 5.9Stock Piles 0.3Pulp Sludge 1.0Forest Floor 0.2- 43.1
Forest Industry 7.4- 50.3 6.7- 83.Livestock Waste 58 3.6Agricultural Residues 17.8 31.5Municipal Waste 29.3Total 71.1- 147

15 Sept 2004 IEA Bioenergy Task 38 6
BC Interior- Mountain Pine Beetle
9 million ha infested- 108 million M3
15 Sept 2004 IEA Bioenergy Task 38 7
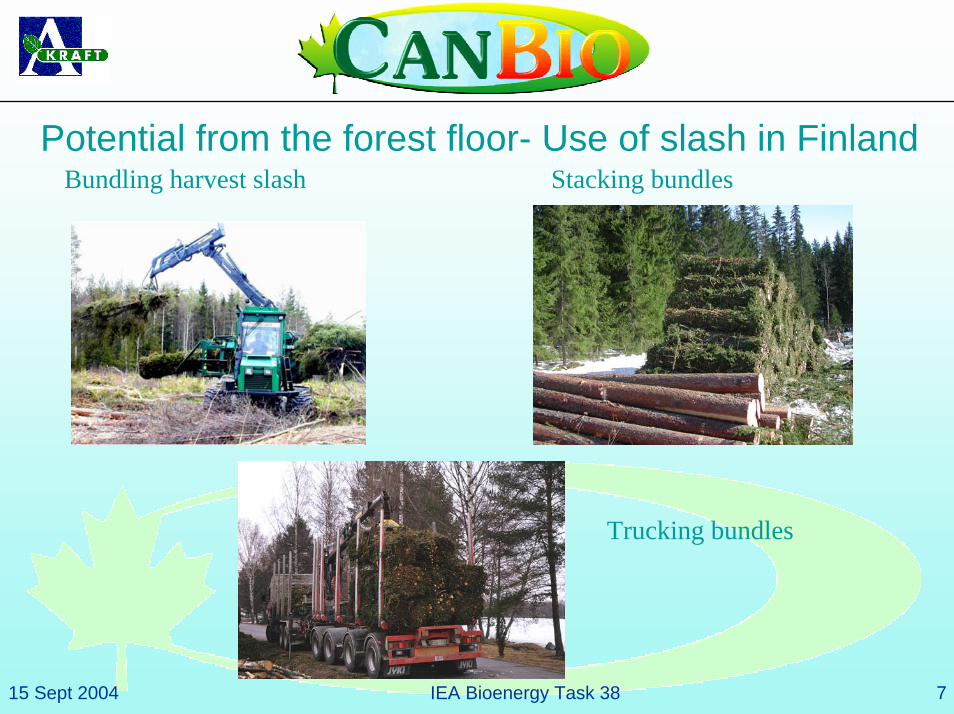
Bundling harvest slash Stacking bundlesPotential from the forest floor- Use of slash in Finland
Trucking bundles
15 Sept 2004 IEA Bioenergy Task 38 8
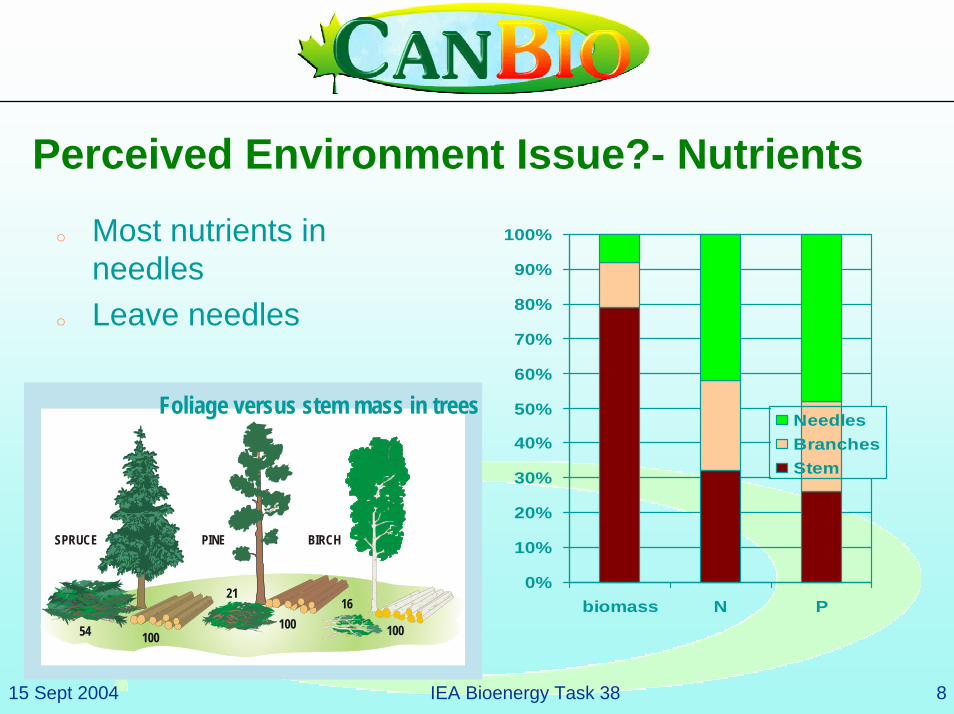
Perceived Environment Issue?- Nutrientso Most nutrients in
needleso Leave needles
0%
10%
20%
30%
40%
50%
60%
70%
80%
90%
100%
biomass N P
NeedlesBranchesStem
BIRCHPINESPRUCE
54
2116
100100 100
Foliage versus stem mass in trees
15 Sept 2004 IEA Bioenergy Task 38 9
Topics
o CanBioo Bioenergy Issues
v Biomass volumesv Technologies (Combustion, Bio-oil)v Financial Requirementsv Renewable Energy Incentivesv Biotrade
o Bioenergy Strategy
15 Sept 2004 IEA Bioenergy Task 38
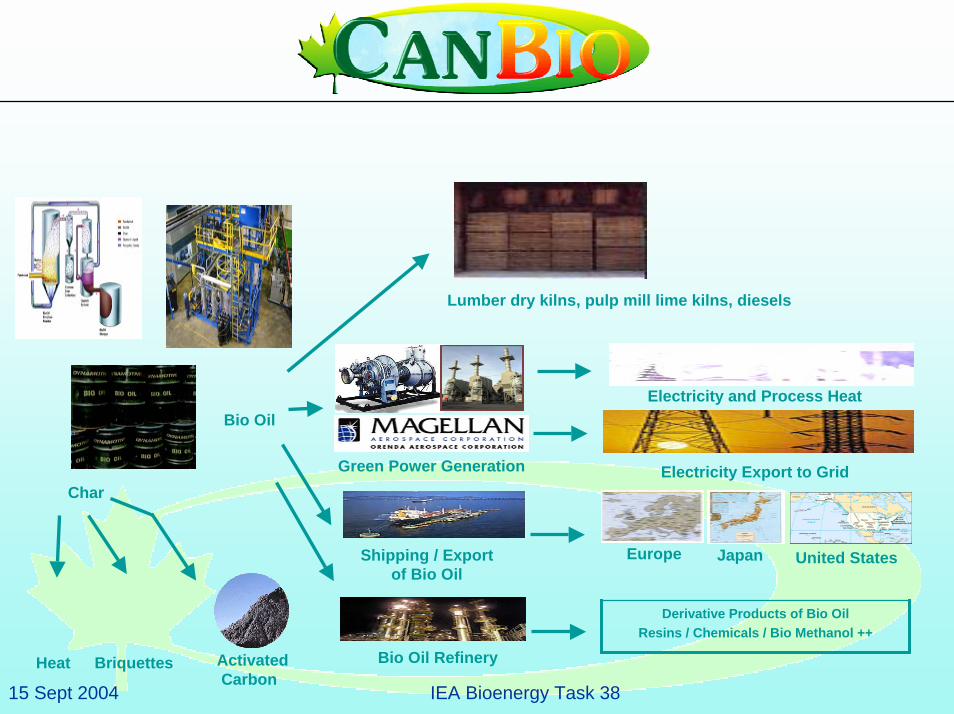
Electricity and Process Heat
Electricity Export to Grid
Lumber dry kilns, pulp mill lime kilns, diesels
Bio Oil
Bio Oil Refinery
Derivative Products of Bio OilResins / Chemicals / Bio Methanol ++
Europe Japan United States
Green Power Generation
Shipping / Export of Bio Oil
Char
Heat Briquettes ActivatedCarbon
15 Sept 2004 IEA Bioenergy Task 38
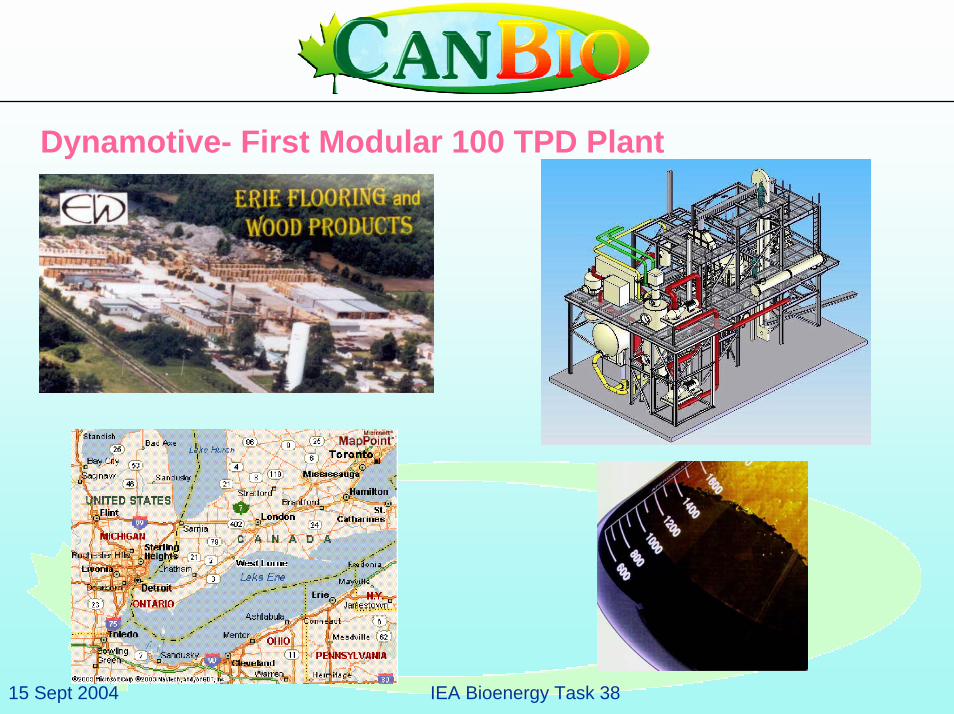
Dynamotive- First Modular 100 TPD Plant
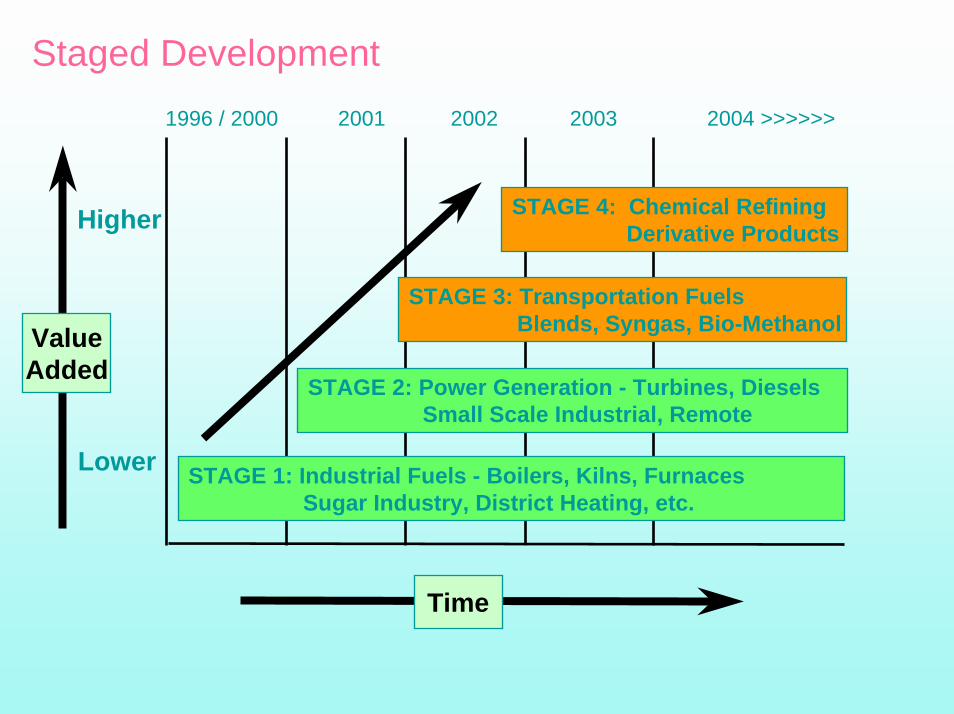
Staged Development
STAGE 1: Industrial Fuels - Boilers, Kilns, FurnacesSugar Industry, District Heating, etc.
STAGE 3: Transportation FuelsBlends, Syngas, Bio-Methanol
STAGE 2: Power Generation - Turbines, Diesels Small Scale Industrial, Remote
Higher
Lower
ValueAdded
STAGE 4: Chemical Refining Derivative Products
1996 / 2000 2001 2002 2003 2004 >>>>>>
Time
15 Sept 2004 IEA Bioenergy Task 38 13
Topics
o CanBioo Bioenergy Issues
v Biomass volumesv Technologiesv Financial Requirementsv Incentivesv Biotrade
o Bioenergy Strategy
15 Sept 2004 IEA Bioenergy Task 38 14
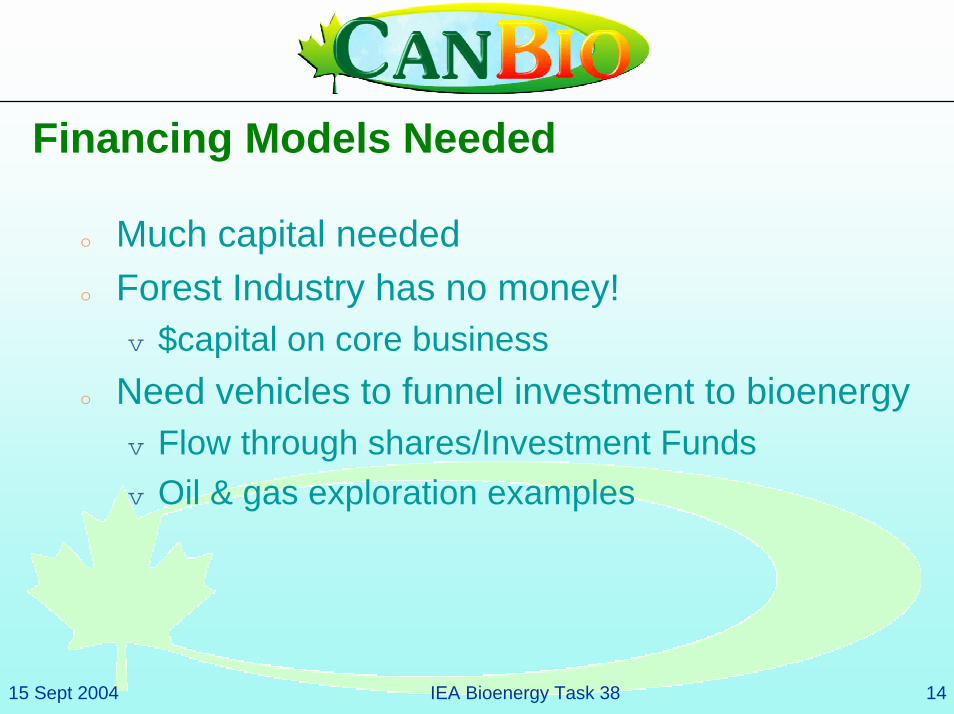
Financing Models Needed
o Much capital neededo Forest Industry has no money!
v $capital on core businesso Need vehicles to funnel investment to bioenergy
v Flow through shares/Investment Fundsv Oil & gas exploration examples
15 Sept 2004 IEA Bioenergy Task 38 15
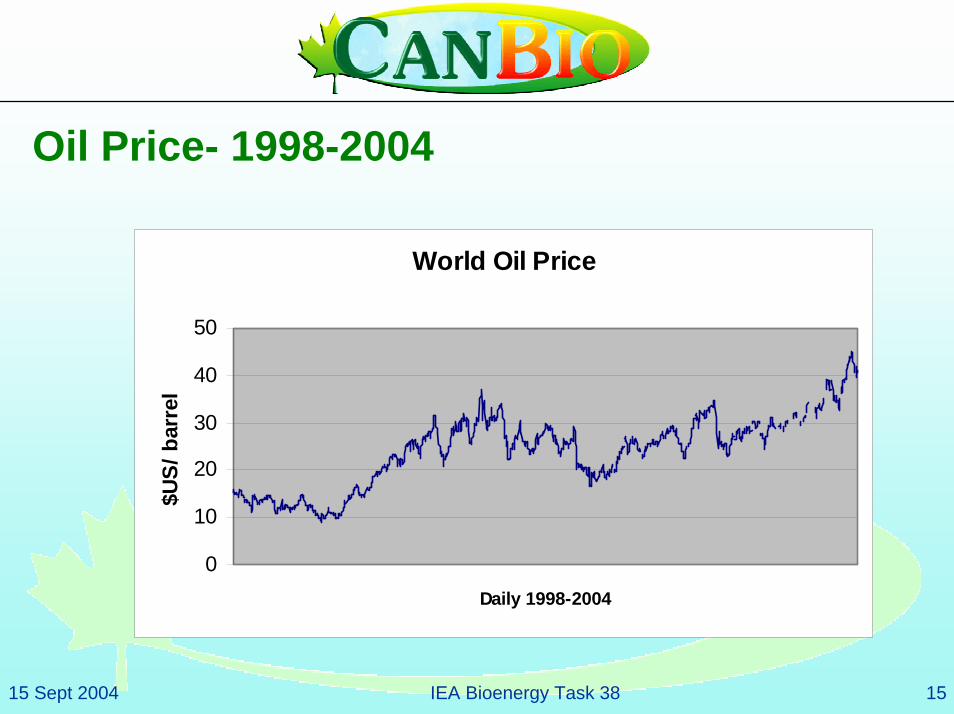
Oil Price- 1998-2004
World Oil Price
0
10
20
30
40
50
Daily 1998-2004
$US/
bar
rel
15 Sept 2004 IEA Bioenergy Task 38 16
Topics
o CanBioo Bioenergy Issues
v Biomass volumesv Technologiesv Financial Requirementsv Incentivesv Biotrade
o Bioenergy Strategy
15 Sept 2004 IEA Bioenergy Task 38 17
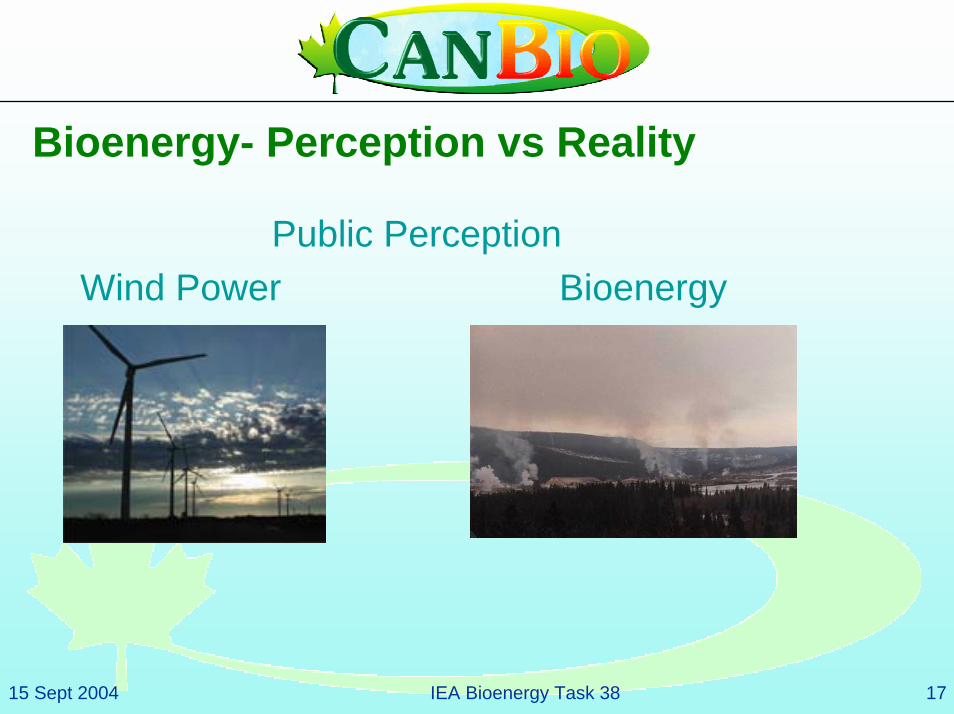
Bioenergy- Perception vs Reality
Public PerceptionWind Power Bioenergy
15 Sept 2004 IEA Bioenergy Task 38 18
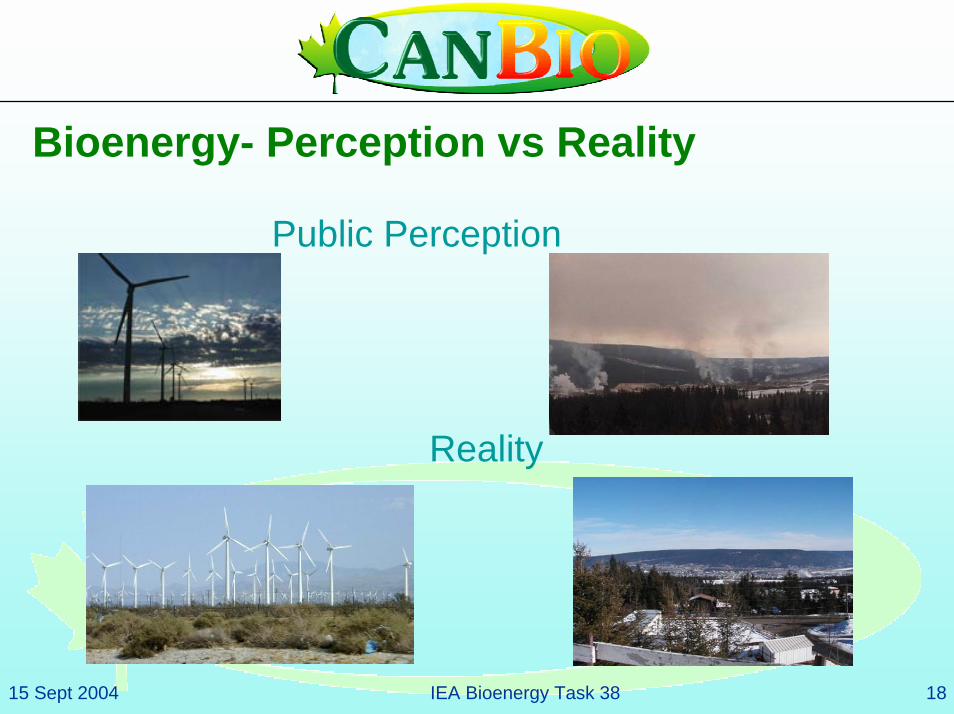
Bioenergy- Perception vs Reality
Public Perception
Reality
15 Sept 2004 IEA Bioenergy Task 38 19
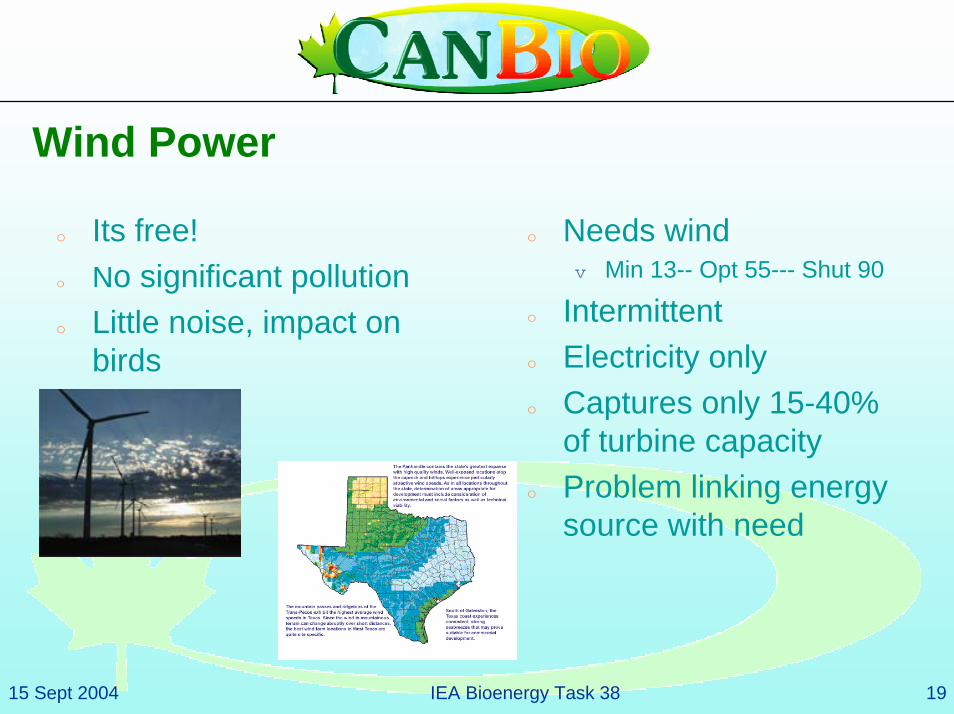
Wind Power
o Its free! o No significant pollutiono Little noise, impact on
birds
o Needs windv Min 13-- Opt 55--- Shut 90
o Intermittent o Electricity onlyo Captures only 15-40%
of turbine capacityo Problem linking energy
source with need
15 Sept 2004 IEA Bioenergy Task 38 20
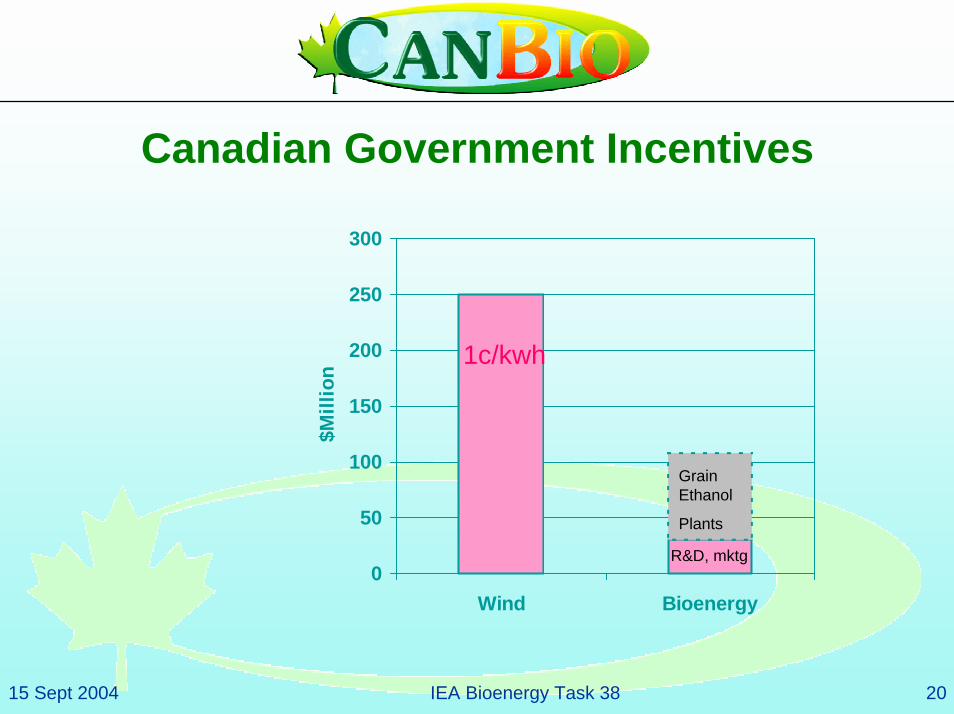
Canadian Government Incentives
0
50
100
150
200
250
300
Wind Bioenergy
$Mill
ion
1c/kwh
Grain Ethanol
Plants
R&D, mktg
15 Sept 2004 IEA Bioenergy Task 38 21
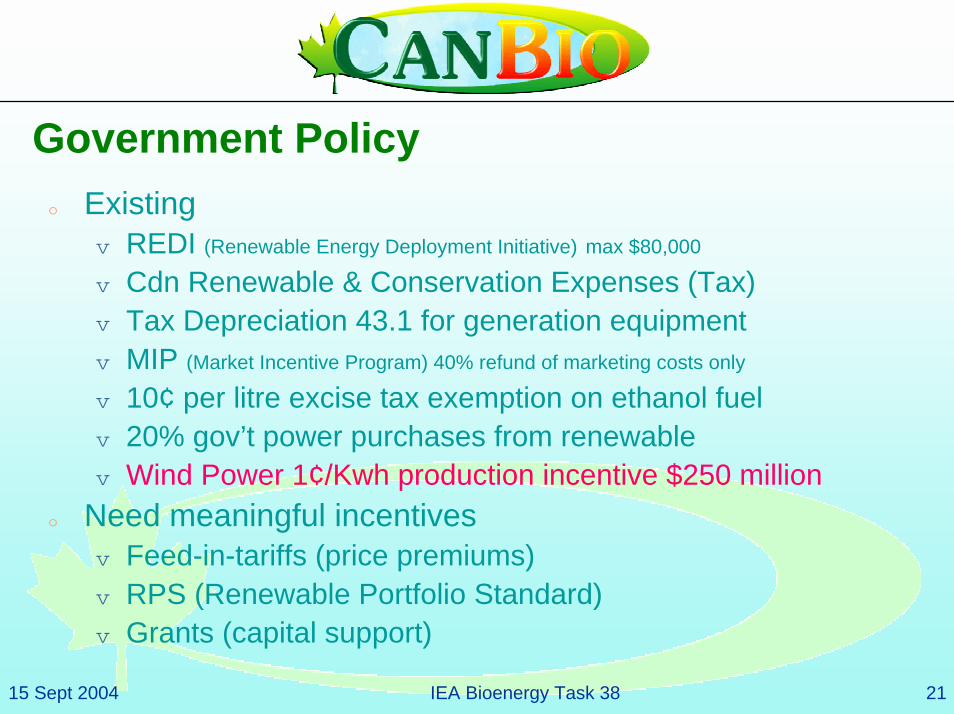
Government Policyo Existing
v REDI (Renewable Energy Deployment Initiative) max $80,000
v Cdn Renewable & Conservation Expenses (Tax)v Tax Depreciation 43.1 for generation equipmentv MIP (Market Incentive Program) 40% refund of marketing costs only
v 10¢ per litre excise tax exemption on ethanol fuel v 20% gov’t power purchases from renewablev Wind Power 1¢/Kwh production incentive $250 million
o Need meaningful incentivesv Feed-in-tariffs (price premiums)v RPS (Renewable Portfolio Standard)v Grants (capital support)
15 Sept 2004 IEA Bioenergy Task 38 22
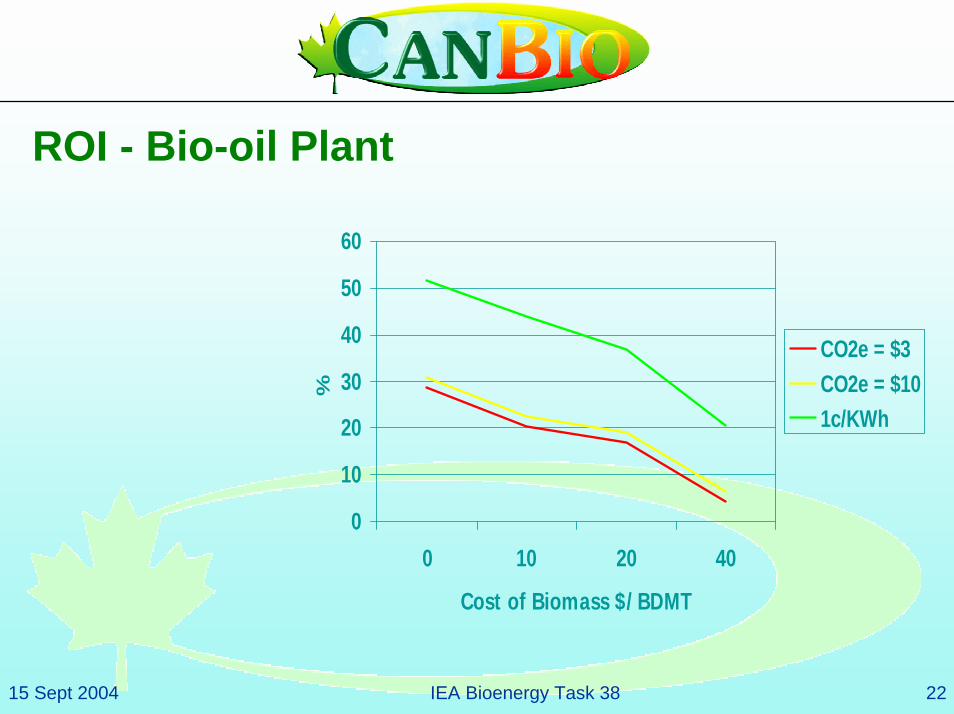
ROI - Bio-oil Plant
0
10
20
30
40
50
60
0 10 20 40
Cost of Biomass $/BDMT
%CO2e = $3CO2e = $101c/KWh
15 Sept 2004 IEA Bioenergy Task 38 23
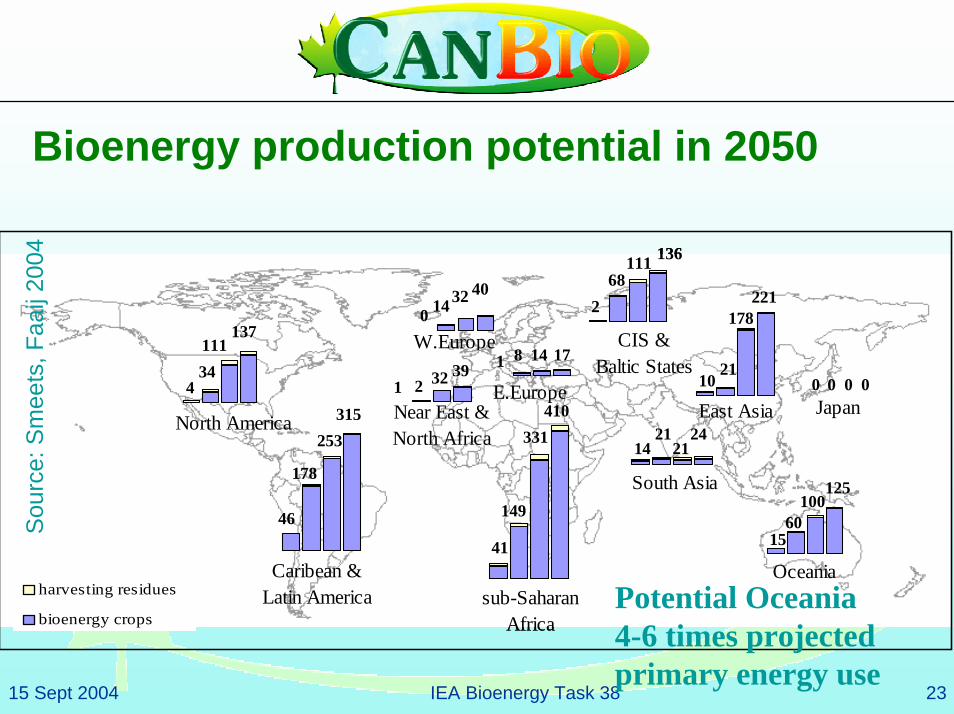
Bioenergy production potential in 2050
434111
137
North AmericaJapan
0 0 0 0
Near East & North Africa
1 2 32 39
W.Europe0 14 32 40
harvesting residues
bioenergy crops
Oceania
1560
100125
E.Europe1 8 14 17
East Asia10
21
178221
410
sub-SaharanAfrica
41
149
331
Caribean &Latin America
178
253315
46
268
111 136
CIS & Baltic States
South Asia
1421
2124
Sou
rce:
Sm
eets
, Faa
ij 20
04
Potential Oceania 4-6 times projected primary energy use
15 Sept 2004 IEA Bioenergy Task 38 24
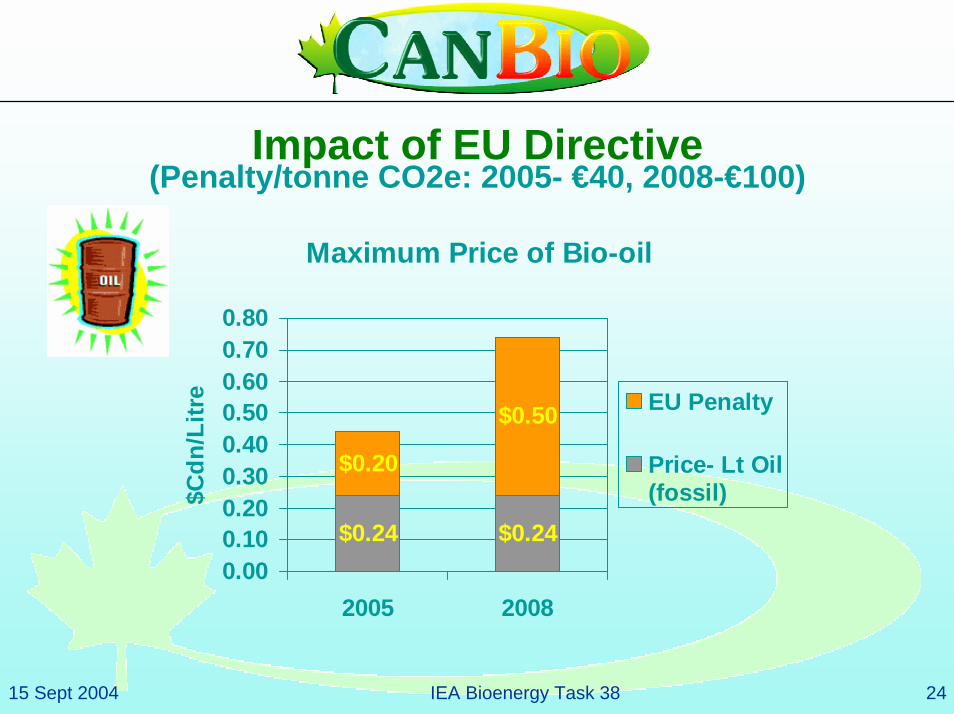
Impact of EU Directive (Penalty/tonne CO2e: 2005- €40, 2008-€100)
Maximum Price of Bio-oil
$0.24 $0.24
$0.20
$0.50
0.000.100.200.300.400.500.600.700.80
2005 2008
$Cdn
/Litr
e EU Penalty
Price- Lt Oil(fossil)
15 Sept 2004 IEA Bioenergy Task 38 25
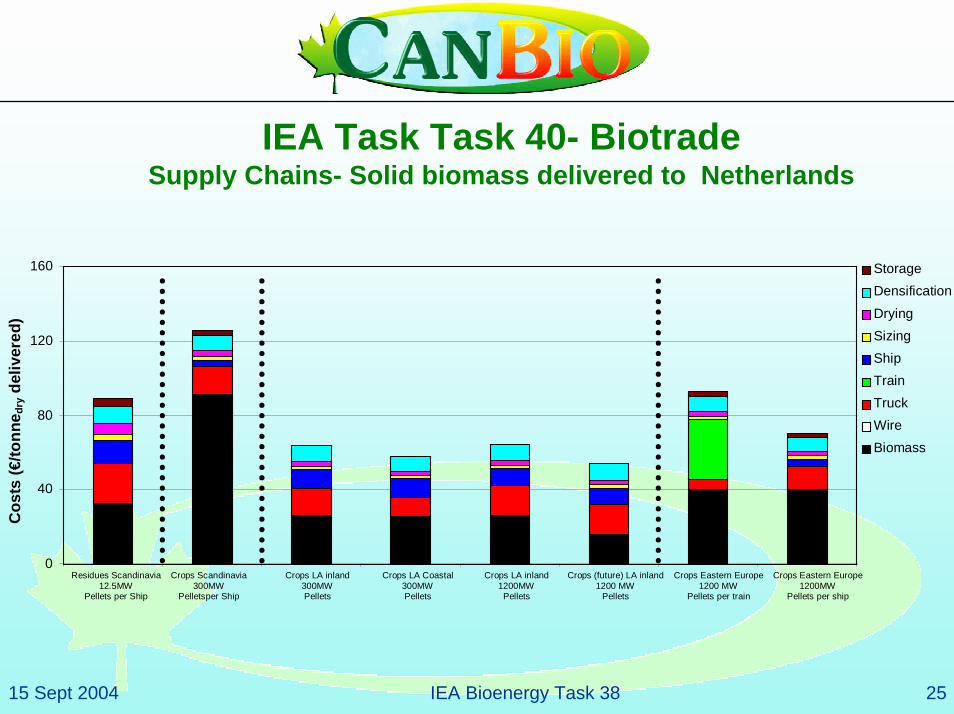
IEA Task Task 40- BiotradeSupply Chains- Solid biomass delivered to Netherlands
0
40
80
120
160
Residues Scandinavia 12.5MW
Pellets per Ship Crops Scandinavia
300MW Pelletsper Ship
Crops LA inland 300MW Pellets
Crops LA Coastal 300MW Pellets
Crops LA inland 1200MW Pellets
Crops (future) LA inland1200 MW
Pellets Crops Eastern Europe
1200 MW Pellets per train
Crops Eastern Europe 1200MW
Pellets per ship
Cos
ts (€
/tonn
e dry
del
iver
ed)
Storage Densification Drying Sizing Ship Train Truck Wire Biomass
15 Sept 2004 IEA Bioenergy Task 38 26
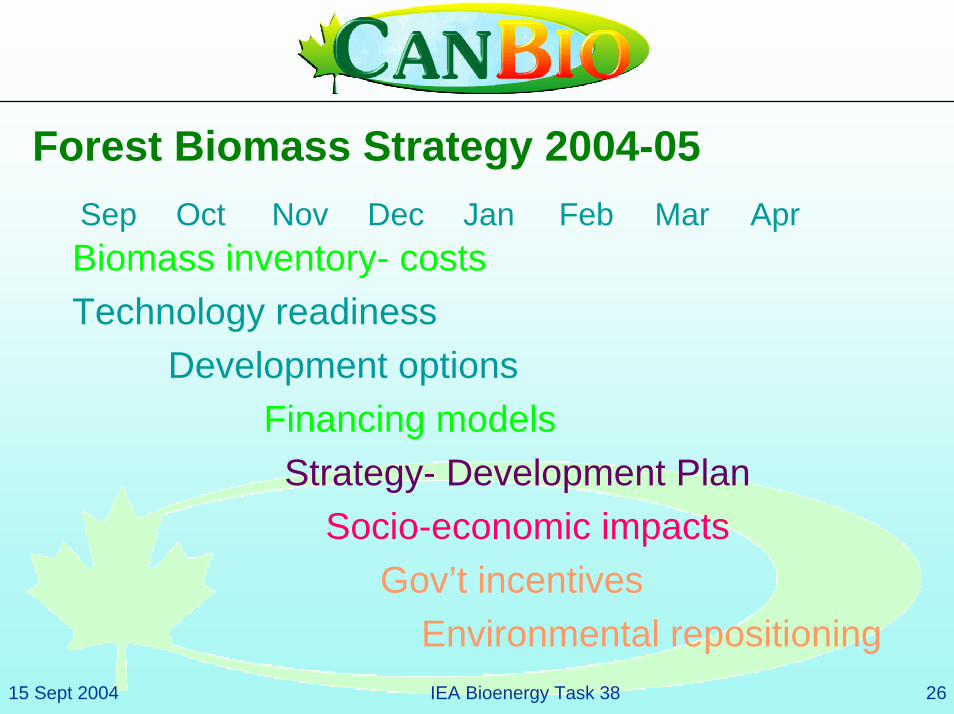
Forest Biomass Strategy 2004-05
Biomass inventory- costsTechnology readiness
Development optionsFinancing modelsStrategy- Development Plan
Socio-economic impactsGov’t incentives
Environmental repositioning
Sep Oct Nov Dec Jan Feb Mar Apr
15 Sept 2004 IEA Bioenergy Task 38 27
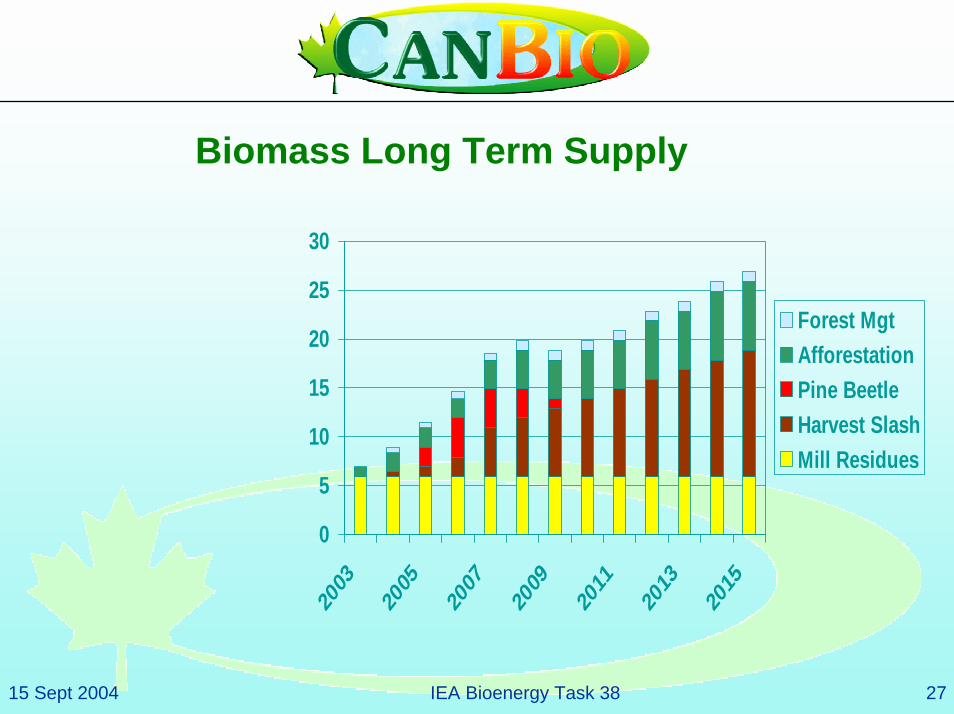
Biomass Long Term Supply
0
5
10
15
20
25
30
2003
2005
2007
2009
2011
2013
2015
Forest MgtAfforestationPine BeetleHarvest SlashMill Residues
15 Sept 2004 IEA Bioenergy Task 38 28
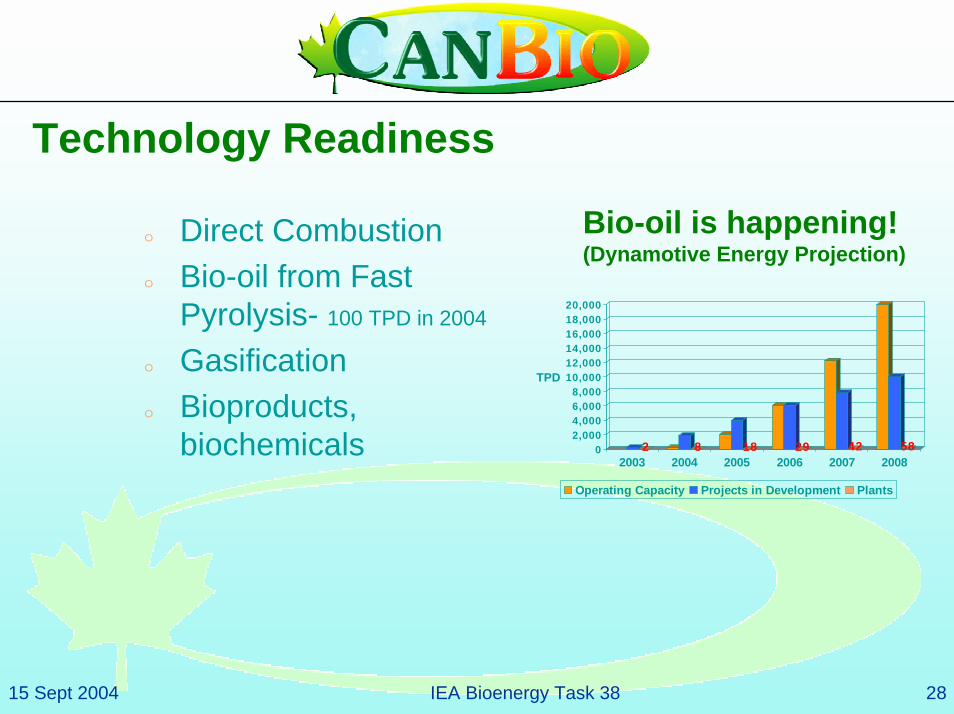
Technology Readiness
Bio-oil is happening!(Dynamotive Energy Projection)
o Direct Combustiono Bio-oil from Fast
Pyrolysis- 100 TPD in 2004
o Gasificationo Bioproducts,
biochemicals 2 8 18 29 42 5802,0004,0006,0008,000
10,00012,00014,00016,00018,00020,000
TPD
2003 2004 2005 2006 2007 2008
Operating Capacity Projects in Development Plants
15 Sept 2004 IEA Bioenergy Task 38 29
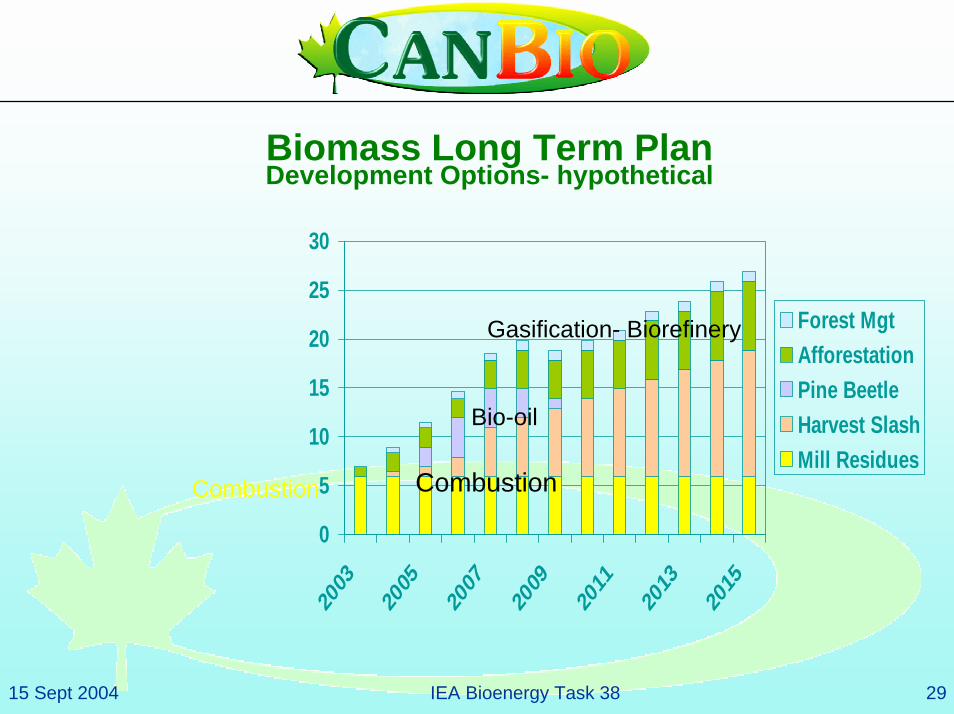
Biomass Long Term Plan Development Options- hypothetical
0
5
10
15
20
25
30
2003
2005
2007
2009
2011
2013
2015
Forest MgtAfforestationPine BeetleHarvest SlashMill Residues
Combustion
Bio-oil
Gasification- Biorefinery
Combustion
15 Sept 2004 IEA Bioenergy Task 38 30
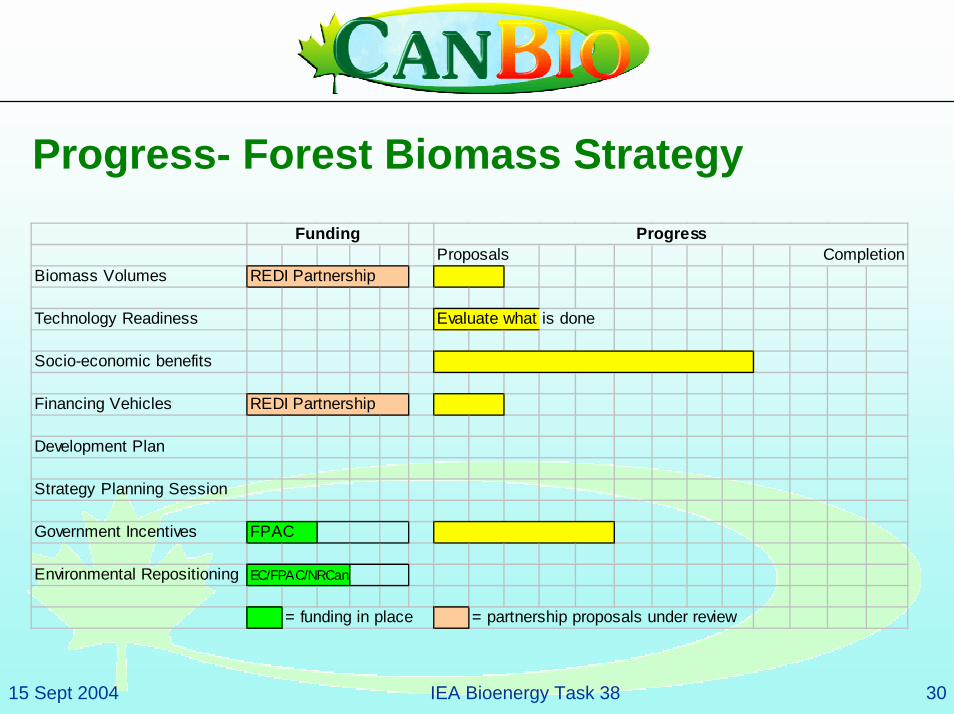
Progress- Forest Biomass StrategyFunding Progress
Proposals CompletionBiomass Volumes REDI Partnership
Technology Readiness Evaluate what is done
Socio-economic benefits
Financing Vehicles REDI Partnership
Development Plan
Strategy Planning Session
Government Incentives FPAC
Environmental Repositioning EC/FPAC/NRCan
= funding in place = partnership proposals under review
15 Sept 2004 IEA Bioenergy Task 38 31
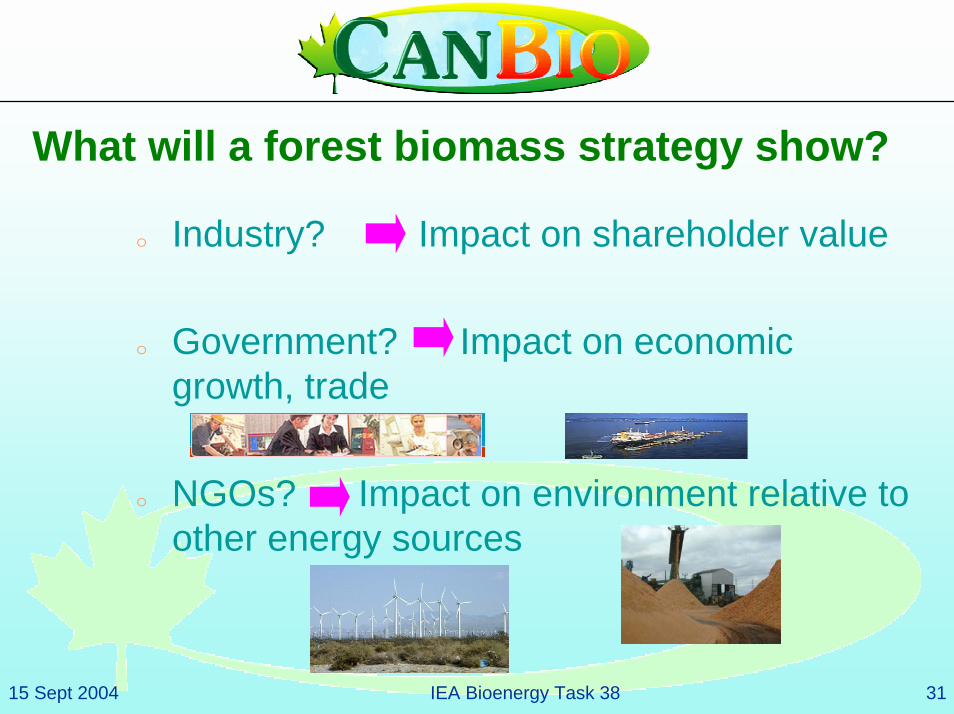
What will a forest biomass strategy show?
o Industry? Impact on shareholder value
o Government? Impact on economic growth, trade
o NGOs? Impact on environment relative to other energy sources
15 Sept 2004 IEA Bioenergy Task 38 32
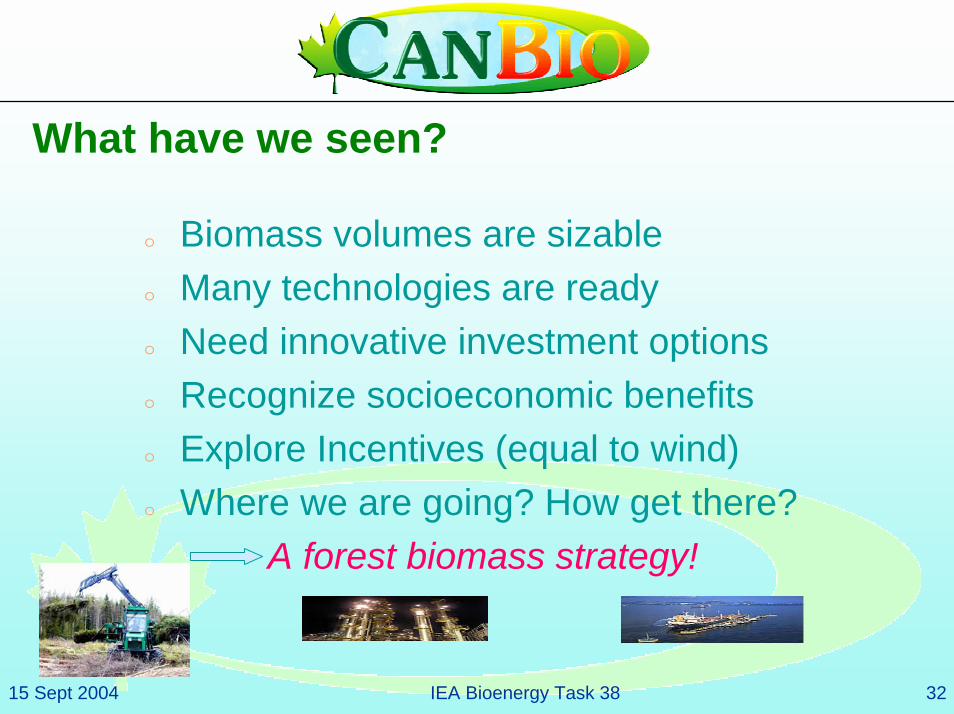
What have we seen?
o Biomass volumes are sizableo Many technologies are readyo Need innovative investment optionso Recognize socioeconomic benefitso Explore Incentives (equal to wind)o Where we are going? How get there?
A forest biomass strategy!
15 Sept 2004 IEA Bioenergy Task 38 33
Canadian Bioenergy Association3330 White Oak Road, London, Ontario N6E 1L8
E-mail: [email protected] Web: www.canbio.caPhone: (519) 686-8895 Fax: (519) 686-1132
Doug Bradleyo 69 Fulton Avenue ·Ottawa, Ontario ·Canada K1S 4Y7o phone · 613.730.1999 email ·[email protected] web site · www.climatechangesolutions.net


![Forests, bioenergy and climate change mitigationtask38.ieabioenergy.com/wp-content/uploads/2017/01/... · century through large-scale changes in energy systems … [and that] bioenergy](https://img.pdfslide.us/doc/110x75/5f0c94947e708231d4361cc8/forests-bioenergy-and-climate-change-century-through-large-scale-changes-in-energy.jpg)