Embed Size (px)
Citation preview
Canada Fluorspar (NL) Inc, Newfoundland and Labrador
1
Government of Newfoundland & Labrador Department of Environment, Climate Change &
Municipalities Water Resources Management Division
Real-Time Water Quality Report
Canada Fluorspar (NL) Inc, Real-Time Water Quality
Stations
Deployment Period July 2, 2020 to August 5, 2020
Canada Fluorspar (NL) Inc, Newfoundland and Labrador
2
Prepared by: Tara Clinton Environmental Scientist Water Resources Management Division Department of Environment, Climate Change & Municipalities 4th Floor, Confederation Building, West Block PO Box 8700, St. John's NL A1B 4J6 Ph. No.: (709) 729 - 5925 Fax No.: (709) 729 - 0320 [email protected]
Canada Fluorspar (NL) Inc, Newfoundland and Labrador
3
General
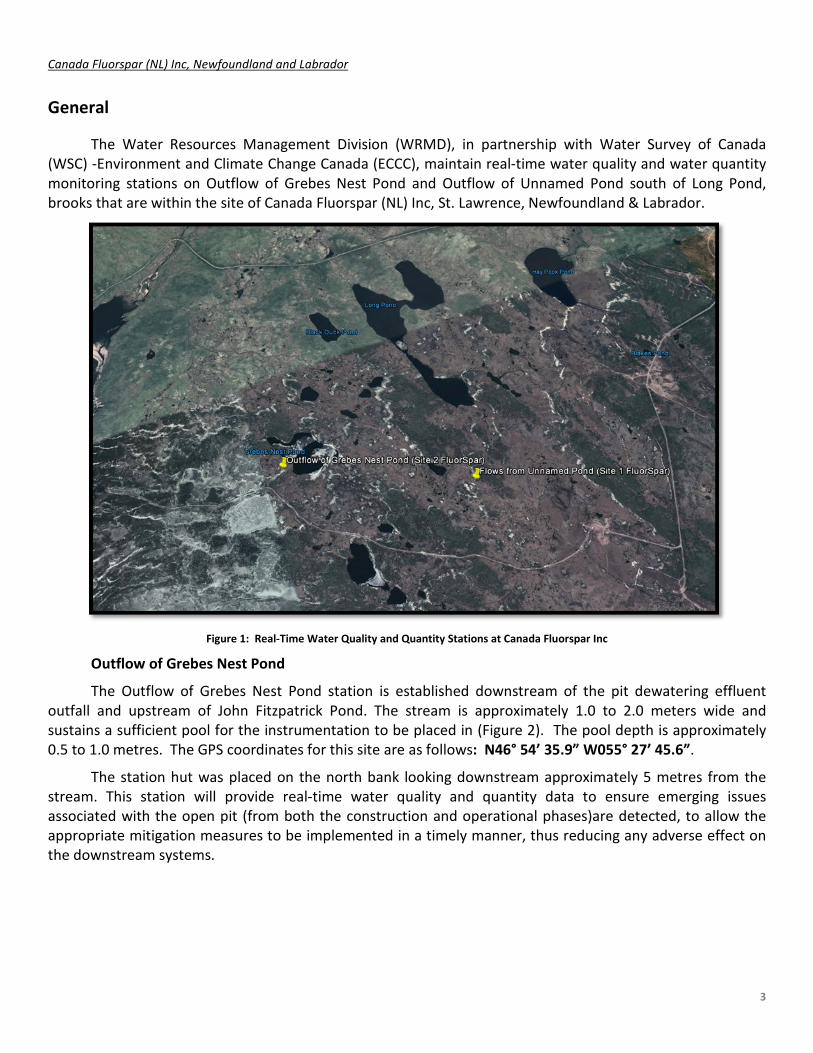
The Water Resources Management Division (WRMD), in partnership with Water Survey of Canada (WSC) -Environment and Climate Change Canada (ECCC), maintain real-time water quality and water quantity monitoring stations on Outflow of Grebes Nest Pond and Outflow of Unnamed Pond south of Long Pond, brooks that are within the site of Canada Fluorspar (NL) Inc, St. Lawrence, Newfoundland & Labrador.
Figure 1: Real-Time Water Quality and Quantity Stations at Canada Fluorspar Inc
Outflow of Grebes Nest Pond
The Outflow of Grebes Nest Pond station is established downstream of the pit dewatering effluent outfall and upstream of John Fitzpatrick Pond. The stream is approximately 1.0 to 2.0 meters wide and sustains a sufficient pool for the instrumentation to be placed in (Figure 2). The pool depth is approximately 0.5 to 1.0 metres. The GPS coordinates for this site are as follows: N46° 54’ 35.9” W055° 27’ 45.6”.
The station hut was placed on the north bank looking downstream approximately 5 metres from the stream. This station will provide real-time water quality and quantity data to ensure emerging issues associated with the open pit (from both the construction and operational phases)are detected, to allow the appropriate mitigation measures to be implemented in a timely manner, thus reducing any adverse effect on the downstream systems.
Canada Fluorspar (NL) Inc, Newfoundland and Labrador
4
Outflow of Unnamed Pond south of Long Pond
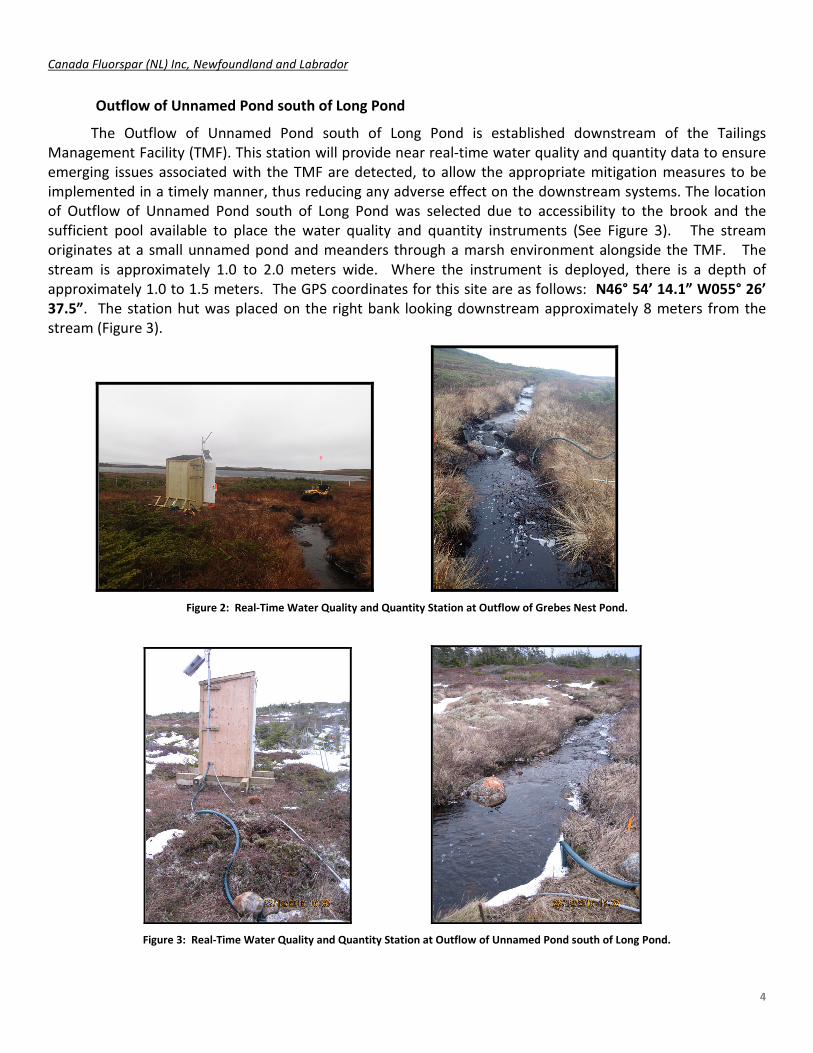
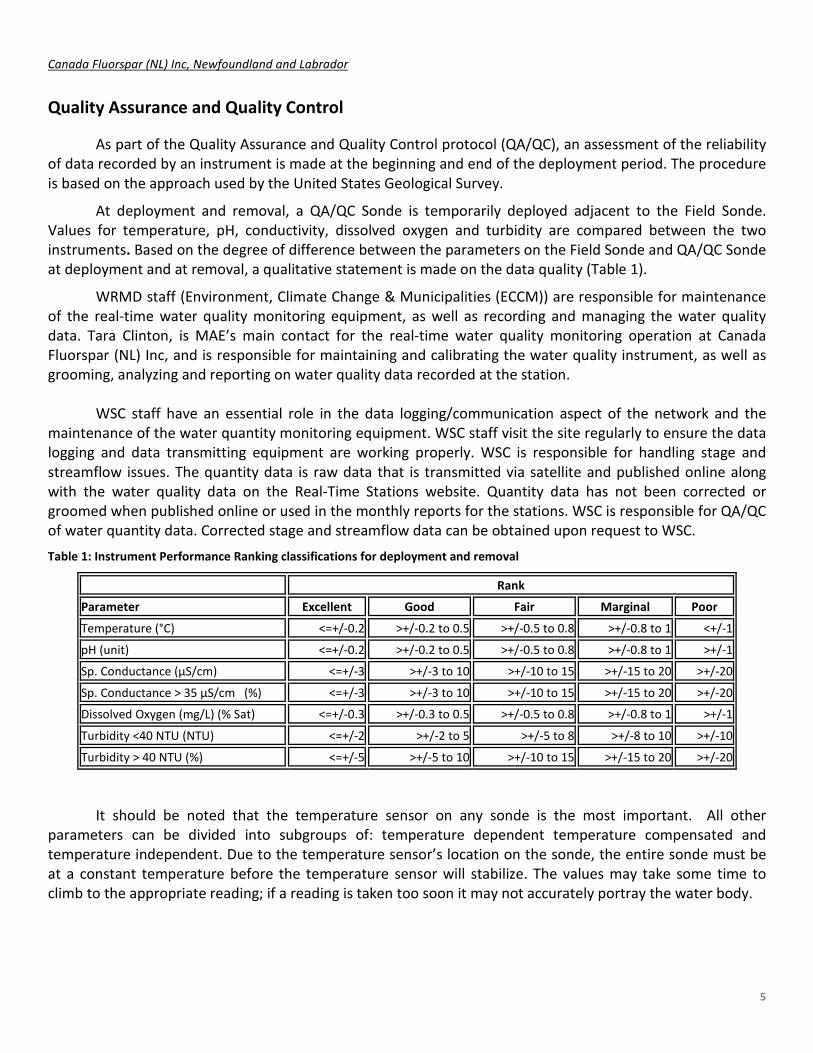
The Outflow of Unnamed Pond south of Long Pond is established downstream of the Tailings Management Facility (TMF). This station will provide near real-time water quality and quantity data to ensure emerging issues associated with the TMF are detected, to allow the appropriate mitigation measures to be implemented in a timely manner, thus reducing any adverse effect on the downstream systems. The location of Outflow of Unnamed Pond south of Long Pond was selected due to accessibility to the brook and the sufficient pool available to place the water quality and quantity instruments (See Figure 3). The stream originates at a small unnamed pond and meanders through a marsh environment alongside the TMF. The stream is approximately 1.0 to 2.0 meters wide. Where the instrument is deployed, there is a depth of approximately 1.0 to 1.5 meters. The GPS coordinates for this site are as follows: N46° 54’ 14.1” W055° 26’ 37.5”. The station hut was placed on the right bank looking downstream approximately 8 meters from the stream (Figure 3).
Figure 2: Real-Time Water Quality and Quantity Station at Outflow of Grebes Nest Pond.
Figure 3: Real-Time Water Quality and Quantity Station at Outflow of Unnamed Pond south of Long Pond.
Canada Fluorspar (NL) Inc, Newfoundland and Labrador
5
Quality Assurance and Quality Control
As part of the Quality Assurance and Quality Control protocol (QA/QC), an assessment of the reliability of data recorded by an instrument is made at the beginning and end of the deployment period. The procedure is based on the approach used by the United States Geological Survey.
At deployment and removal, a QA/QC Sonde is temporarily deployed adjacent to the Field Sonde. Values for temperature, pH, conductivity, dissolved oxygen and turbidity are compared between the two instruments. Based on the degree of difference between the parameters on the Field Sonde and QA/QC Sonde at deployment and at removal, a qualitative statement is made on the data quality (Table 1).
WRMD staff (Environment, Climate Change & Municipalities (ECCM)) are responsible for maintenance of the real-time water quality monitoring equipment, as well as recording and managing the water quality data. Tara Clinton, is MAE’s main contact for the real-time water quality monitoring operation at Canada Fluorspar (NL) Inc, and is responsible for maintaining and calibrating the water quality instrument, as well as grooming, analyzing and reporting on water quality data recorded at the station.
WSC staff have an essential role in the data logging/communication aspect of the network and the maintenance of the water quantity monitoring equipment. WSC staff visit the site regularly to ensure the data logging and data transmitting equipment are working properly. WSC is responsible for handling stage and streamflow issues. The quantity data is raw data that is transmitted via satellite and published online along with the water quality data on the Real-Time Stations website. Quantity data has not been corrected or groomed when published online or used in the monthly reports for the stations. WSC is responsible for QA/QC of water quantity data. Corrected stage and streamflow data can be obtained upon request to WSC. Table 1: Instrument Performance Ranking classifications for deployment and removal
Rank
Parameter Excellent Good Fair Marginal Poor
Temperature (°C) <=+/-0.2 >+/-0.2 to 0.5 >+/-0.5 to 0.8 >+/-0.8 to 1 <+/-1
pH (unit) <=+/-0.2 >+/-0.2 to 0.5 >+/-0.5 to 0.8 >+/-0.8 to 1 >+/-1
Sp. Conductance (μS/cm) <=+/-3 >+/-3 to 10 >+/-10 to 15 >+/-15 to 20 >+/-20
Sp. Conductance > 35 μS/cm (%) <=+/-3 >+/-3 to 10 >+/-10 to 15 >+/-15 to 20 >+/-20
Dissolved Oxygen (mg/L) (% Sat) <=+/-0.3 >+/-0.3 to 0.5 >+/-0.5 to 0.8 >+/-0.8 to 1 >+/-1
Turbidity <40 NTU (NTU) <=+/-2 >+/-2 to 5 >+/-5 to 8 >+/-8 to 10 >+/-10
Turbidity > 40 NTU (%) <=+/-5 >+/-5 to 10 >+/-10 to 15 >+/-15 to 20 >+/-20
It should be noted that the temperature sensor on any sonde is the most important. All other parameters can be divided into subgroups of: temperature dependent temperature compensated and temperature independent. Due to the temperature sensor’s location on the sonde, the entire sonde must be at a constant temperature before the temperature sensor will stabilize. The values may take some time to climb to the appropriate reading; if a reading is taken too soon it may not accurately portray the water body.
Canada Fluorspar (NL) Inc, Newfoundland and Labrador
6
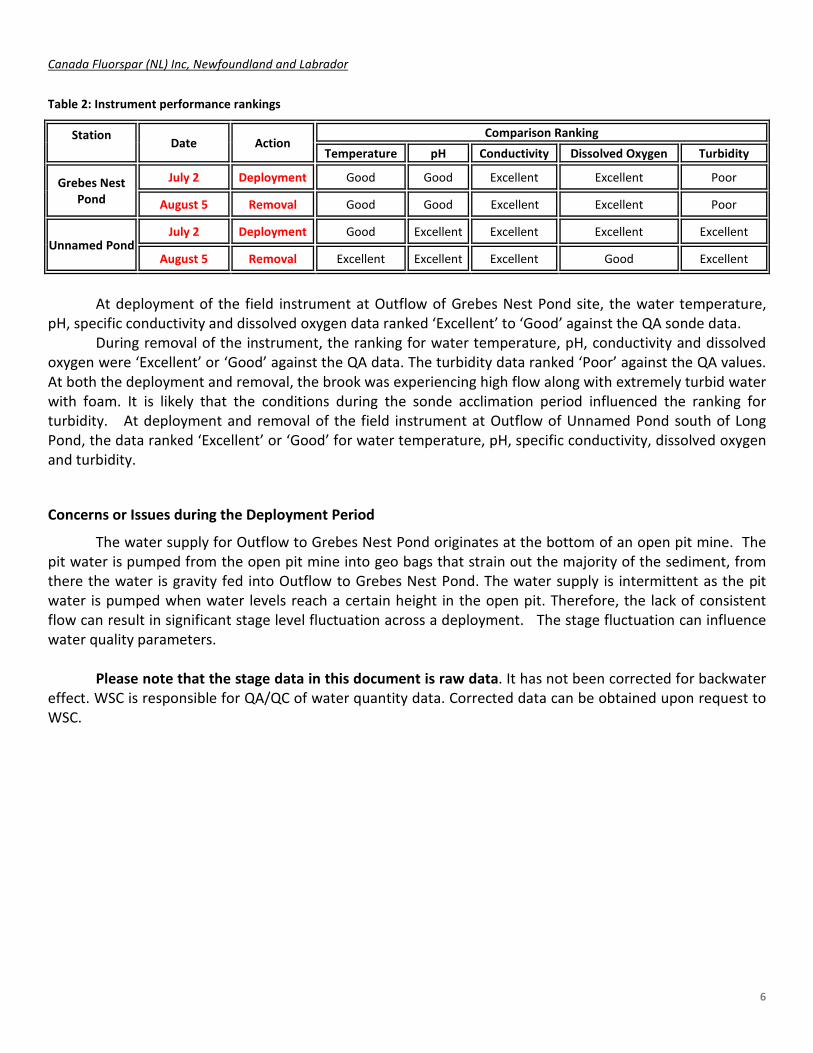
Table 2: Instrument performance rankings
Station Date Action
Comparison Ranking Temperature pH Conductivity Dissolved Oxygen Turbidity
Grebes Nest Pond
July 2 Deployment Good Good Excellent Excellent Poor
August 5 Removal Good Good Excellent Excellent Poor
Unnamed Pond July 2 Deployment Good Excellent Excellent Excellent Excellent
August 5 Removal Excellent Excellent Excellent Good Excellent
At deployment of the field instrument at Outflow of Grebes Nest Pond site, the water temperature,
pH, specific conductivity and dissolved oxygen data ranked ‘Excellent’ to ‘Good’ against the QA sonde data. During removal of the instrument, the ranking for water temperature, pH, conductivity and dissolved
oxygen were ‘Excellent’ or ‘Good’ against the QA data. The turbidity data ranked ‘Poor’ against the QA values. At both the deployment and removal, the brook was experiencing high flow along with extremely turbid water with foam. It is likely that the conditions during the sonde acclimation period influenced the ranking for turbidity. At deployment and removal of the field instrument at Outflow of Unnamed Pond south of Long Pond, the data ranked ‘Excellent’ or ‘Good’ for water temperature, pH, specific conductivity, dissolved oxygen and turbidity.
Concerns or Issues during the Deployment Period
The water supply for Outflow to Grebes Nest Pond originates at the bottom of an open pit mine. The pit water is pumped from the open pit mine into geo bags that strain out the majority of the sediment, from there the water is gravity fed into Outflow to Grebes Nest Pond. The water supply is intermittent as the pit water is pumped when water levels reach a certain height in the open pit. Therefore, the lack of consistent flow can result in significant stage level fluctuation across a deployment. The stage fluctuation can influence water quality parameters. Please note that the stage data in this document is raw data. It has not been corrected for backwater effect. WSC is responsible for QA/QC of water quantity data. Corrected data can be obtained upon request to WSC.

Canada Fluorspar (NL) Inc, Newfoundland and Labrador
7
Outflow of Grebes Nest Pond
Water Temperature
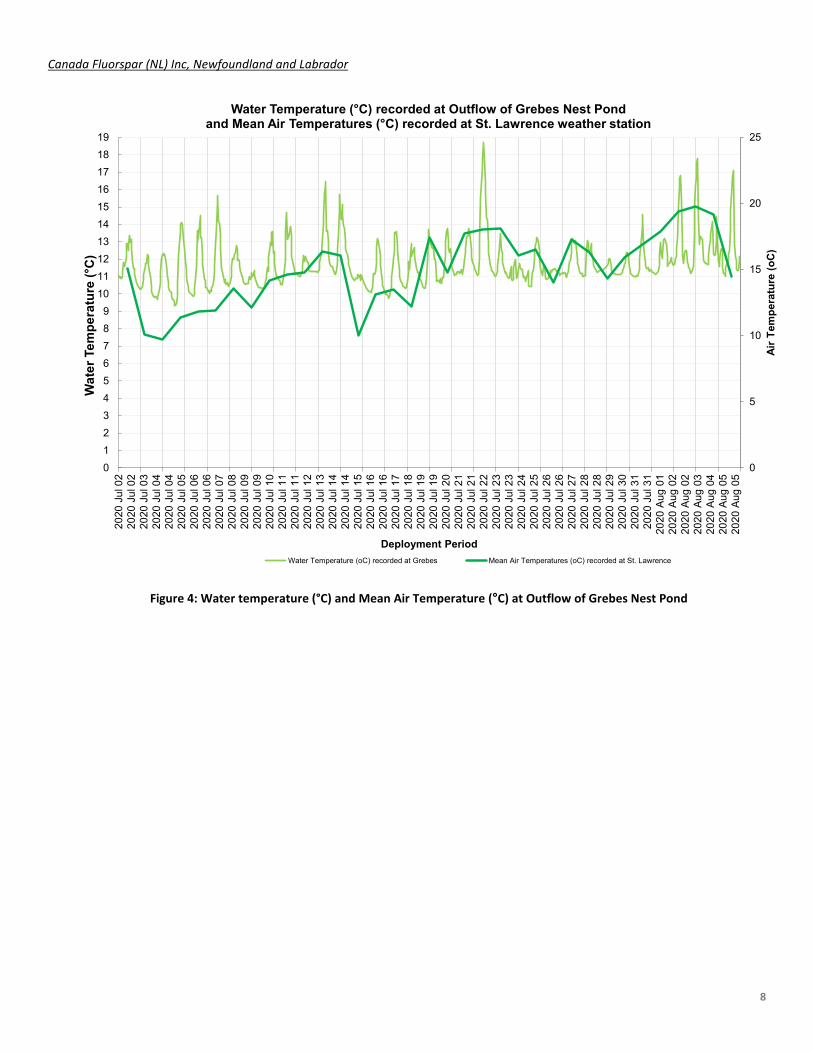
Water temperature ranged from 9.31°C to 18.7°C during the deployment period (Figure 3). The average water temperature for the deployment is 11.7°C.
Outflow to Grebes Nest Pond station does not have consistent flow, thus the stage data can fluctuate significantly across a deployment. The large stage changes recorded in this deployment were a result of precipitation events that occurred on the same day (Appendix I).
Water temperature displayed the natural diurnal pattern. Higher water temperature represents the daylight hours and the lower temperatures representing the nighttime hours (Figure 4), mirroring the air temperature. In some instances, such as July 22, elevated temperature and below normal stage may indicate the instrument is out of the water.
Please note that the stage data in this document is raw data. It has not been corrected for backwater
effect. WSC is responsible for QA/QC of water quantity data. Corrected data can be obtained upon request to WSC.
1.3
1.35
1.4
1.45
1.5
1.55
1.6
0123456789
10111213141516171819
2020
Jul
02
2020
Jul
02
2020
Jul
03
2020
Jul
04
2020
Jul
04
2020
Jul
05
2020
Jul
06
2020
Jul
06
2020
Jul
07
2020
Jul
08
2020
Jul
09
2020
Jul
09
2020
Jul
10
2020
Jul
11
2020
Jul
11
2020
Jul
12
2020
Jul
13
2020
Jul
14
2020
Jul
14
2020
Jul
15
2020
Jul
16
2020
Jul
16
2020
Jul
17
2020
Jul
18
2020
Jul
19
2020
Jul
19
2020
Jul
20
2020
Jul
21
2020
Jul
21
2020
Jul
22
2020
Jul
23
2020
Jul
23
2020
Jul
24
2020
Jul
25
2020
Jul
26
2020
Jul
26
2020
Jul
27
2020
Jul
28
2020
Jul
28
2020
Jul
29
2020
Jul
30
2020
Jul
31
2020
Jul
31
2020
Aug
01
2020
Aug
02
2020
Aug
02
2020
Aug
03
2020
Aug
04
2020
Aug
05
2020
Aug
05
Stag
e (m
)
Wat
er T
empe
ratu
re (°
C)
Deployment Period
Water Temperature (°C) and Stage Level (m) at Outflow of Grebes Nest Pond
Water Temperature (oC) Stage (m)
Figure 3: Water temperature (°C) values at Outflow of Grebes Nest Pond
Canada Fluorspar (NL) Inc, Newfoundland and Labrador
8
0
5
10
15
20
25
0123456789
10111213141516171819
2020
Jul
02
2020
Jul
02
2020
Jul
03
2020
Jul
04
2020
Jul
04
2020
Jul
05
2020
Jul
06
2020
Jul
06
2020
Jul
07
2020
Jul
08
2020
Jul
09
2020
Jul
09
2020
Jul
10
2020
Jul
11
2020
Jul
11
2020
Jul
12
2020
Jul
13
2020
Jul
14
2020
Jul
14
2020
Jul
15
2020
Jul
16
2020
Jul
16
2020
Jul
17
2020
Jul
18
2020
Jul
19
2020
Jul
19
2020
Jul
20
2020
Jul
21
2020
Jul
21
2020
Jul
22
2020
Jul
23
2020
Jul
23
2020
Jul
24
2020
Jul
25
2020
Jul
26
2020
Jul
26
2020
Jul
27
2020
Jul
28
2020
Jul
28
2020
Jul
29
2020
Jul
30
2020
Jul
31
2020
Jul
31
2020
Aug
01
2020
Aug
02
2020
Aug
02
2020
Aug
03
2020
Aug
04
2020
Aug
05
2020
Aug
05
Air T
empe
ratu
re (o
C)
Wat
er T
empe
ratu
re (°
C)
Deployment Period
Water Temperature (°C) recorded at Outflow of Grebes Nest Pond and Mean Air Temperatures (°C) recorded at St. Lawrence weather station
Water Temperature (oC) recorded at Grebes Mean Air Temperatures (oC) recorded at St. Lawrence
Figure 4: Water temperature (°C) and Mean Air Temperature (°C) at Outflow of Grebes Nest Pond
Canada Fluorspar (NL) Inc, Newfoundland and Labrador
9
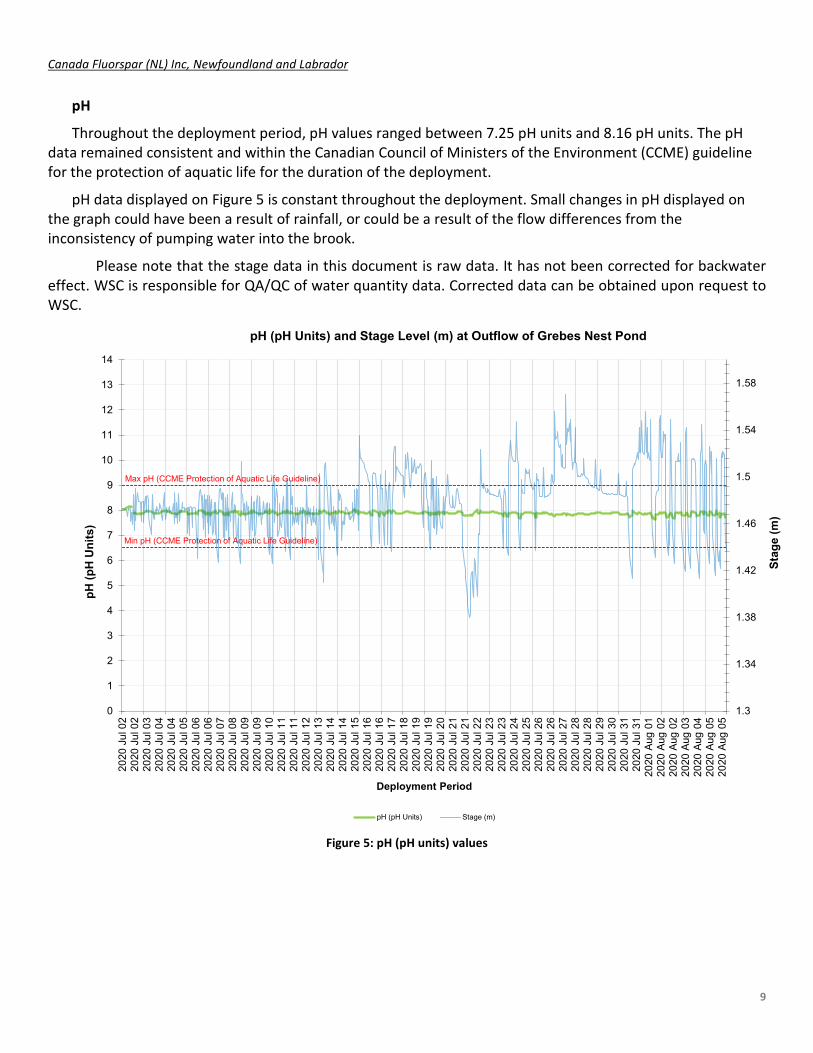
pH
Throughout the deployment period, pH values ranged between 7.25 pH units and 8.16 pH units. The pH data remained consistent and within the Canadian Council of Ministers of the Environment (CCME) guideline for the protection of aquatic life for the duration of the deployment.
pH data displayed on Figure 5 is constant throughout the deployment. Small changes in pH displayed on the graph could have been a result of rainfall, or could be a result of the flow differences from the inconsistency of pumping water into the brook.
Please note that the stage data in this document is raw data. It has not been corrected for backwater effect. WSC is responsible for QA/QC of water quantity data. Corrected data can be obtained upon request to WSC.
1.3
1.34
1.38
1.42
1.46
1.5
1.54
1.58
0
1
2
3
4
5
6
7
8
9
10
11
12
13
14
2020
Jul
02
2020
Jul
02
2020
Jul
03
2020
Jul
04
2020
Jul
04
2020
Jul
05
2020
Jul
06
2020
Jul
06
2020
Jul
07
2020
Jul
08
2020
Jul
09
2020
Jul
09
2020
Jul
10
2020
Jul
11
2020
Jul
11
2020
Jul
12
2020
Jul
13
2020
Jul
14
2020
Jul
14
2020
Jul
15
2020
Jul
16
2020
Jul
16
2020
Jul
17
2020
Jul
18
2020
Jul
19
2020
Jul
19
2020
Jul
20
2020
Jul
21
2020
Jul
21
2020
Jul
22
2020
Jul
23
2020
Jul
23
2020
Jul
24
2020
Jul
25
2020
Jul
26
2020
Jul
26
2020
Jul
27
2020
Jul
28
2020
Jul
28
2020
Jul
29
2020
Jul
30
2020
Jul
31
2020
Jul
31
2020
Aug
01
2020
Aug
02
2020
Aug
02
2020
Aug
03
2020
Aug
04
2020
Aug
05
2020
Aug
05
Stag
e (m
)
pH (p
H U
nits
)
Deployment Period
pH (pH Units) and Stage Level (m) at Outflow of Grebes Nest Pond
pH (pH Units) Stage (m)
Max pH (CCME Protection of Aquatic Life Guideline)
Min pH (CCME Protection of Aquatic Life Guideline)
Figure 5: pH (pH units) values
Canada Fluorspar (NL) Inc, Newfoundland and Labrador
10
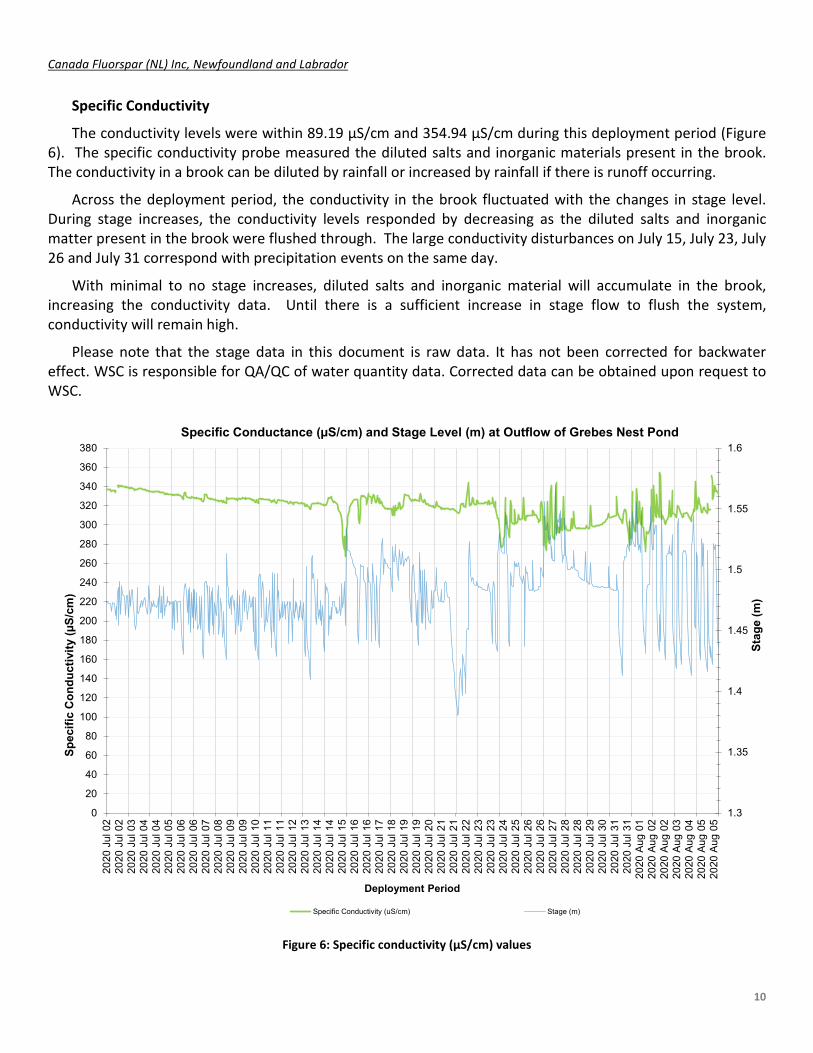
Specific Conductivity
The conductivity levels were within 89.19 µS/cm and 354.94 µS/cm during this deployment period (Figure 6). The specific conductivity probe measured the diluted salts and inorganic materials present in the brook. The conductivity in a brook can be diluted by rainfall or increased by rainfall if there is runoff occurring.
Across the deployment period, the conductivity in the brook fluctuated with the changes in stage level. During stage increases, the conductivity levels responded by decreasing as the diluted salts and inorganic matter present in the brook were flushed through. The large conductivity disturbances on July 15, July 23, July 26 and July 31 correspond with precipitation events on the same day.
With minimal to no stage increases, diluted salts and inorganic material will accumulate in the brook, increasing the conductivity data. Until there is a sufficient increase in stage flow to flush the system, conductivity will remain high.
Please note that the stage data in this document is raw data. It has not been corrected for backwater effect. WSC is responsible for QA/QC of water quantity data. Corrected data can be obtained upon request to WSC.
1.3
1.35
1.4
1.45
1.5
1.55
1.6
0
20
40
60
80
100
120
140
160
180
200
220
240
260
280
300
320
340
360
380
2020
Jul
02
2020
Jul
02
2020
Jul
03
2020
Jul
04
2020
Jul
04
2020
Jul
05
2020
Jul
06
2020
Jul
06
2020
Jul
07
2020
Jul
08
2020
Jul
09
2020
Jul
09
2020
Jul
10
2020
Jul
11
2020
Jul
11
2020
Jul
12
2020
Jul
13
2020
Jul
14
2020
Jul
14
2020
Jul
15
2020
Jul
16
2020
Jul
16
2020
Jul
17
2020
Jul
18
2020
Jul
19
2020
Jul
19
2020
Jul
20
2020
Jul
21
2020
Jul
21
2020
Jul
22
2020
Jul
23
2020
Jul
23
2020
Jul
24
2020
Jul
25
2020
Jul
26
2020
Jul
26
2020
Jul
27
2020
Jul
28
2020
Jul
28
2020
Jul
29
2020
Jul
30
2020
Jul
31
2020
Jul
31
2020
Aug
01
2020
Aug
02
2020
Aug
02
2020
Aug
03
2020
Aug
04
2020
Aug
05
2020
Aug
05
Stag
e (m
)
Spec
ific
Cond
uctiv
ity (µ
S/cm
)
Deployment Period
Specific Conductance (µS/cm) and Stage Level (m) at Outflow of Grebes Nest Pond
Specific Conductivity (uS/cm) Stage (m)
Figure 6: Specific conductivity (μS/cm) values

Canada Fluorspar (NL) Inc, Newfoundland and Labrador
11
Dissolved Oxygen
The water quality instrument directly measures dissolved oxygen (mg/L) with the dissolved oxygen probe. The instrument then calculates percent saturation (% Sat) taking into account the water temperature.
During the deployment, the dissolved oxygen concentration levels ranged within a minimum of 9.57 mg/L to a maximum of 11.45 mg/L. The percent saturation levels for dissolved oxygen ranged within 90.6% Saturation to 116.7% Saturation (Figure 7).
Due to the intermittent stream flow at this brook, dissolved oxygen concentration does not always display the expected diurnal pattern that accompanies natural ambient waterways. This was evident from July 25 to July 31, as the DO mg/L data displayed less variation. Water temperature is included with dissolved oxygen as it directly influences the water column’s ability to store dissolved oxygen. This relationship is shown in Figure 7, on July 21; as the water temperature increases, the dissolved oxygen decreases and vs versa.
Figure 7: Dissolved Oxygen (mg/L & Percent Saturation) values and Water Temperature (°C)
0
10
20
30
40
50
60
70
80
90
100
110
120
0123456789
1011121314151617181920
2020
Jul
02
2020
Jul
02
2020
Jul
03
2020
Jul
04
2020
Jul
04
2020
Jul
05
2020
Jul
06
2020
Jul
06
2020
Jul
07
2020
Jul
08
2020
Jul
09
2020
Jul
09
2020
Jul
10
2020
Jul
11
2020
Jul
11
2020
Jul
12
2020
Jul
13
2020
Jul
14
2020
Jul
14
2020
Jul
15
2020
Jul
16
2020
Jul
16
2020
Jul
17
2020
Jul
18
2020
Jul
19
2020
Jul
19
2020
Jul
20
2020
Jul
21
2020
Jul
21
2020
Jul
22
2020
Jul
23
2020
Jul
23
2020
Jul
24
2020
Jul
25
2020
Jul
26
2020
Jul
26
2020
Jul
27
2020
Jul
28
2020
Jul
28
2020
Jul
29
2020
Jul
30
2020
Jul
31
2020
Jul
31
2020
Aug
01
2020
Aug
02
2020
Aug
02
2020
Aug
03
2020
Aug
04
2020
Aug
05
2020
Aug
05
Dis
solv
ed O
xyge
n (%
-Sat
)
Dis
solv
ed O
xyge
n (m
g/l)
& W
ater
Tem
pera
ture
(°C
)
Deployment Period
Dissolved Oxygen (mg/L & %Sat) at Outflow of Grebes Nest Pond
Dissolved Oxygen (mg/L) Water Temperature (oC) Dissolved Oxygen (%Sat)
CCME Guideline for the Protection of Other Life Stages
CCME Guideline for the Protection of Early Life Stages

Canada Fluorspar (NL) Inc, Newfoundland and Labrador
12
Turbidity
Turbidity levels during the deployment ranged within 3.3 NTU and 4117.1 NTU (Figure 8). The deployment data had a median of 9.7 NTU, which was lower than the previous deployment median of 12.6 NTU.
Outflow to Grebes Nest Brook, is fed via a sump pump from a pit mine. The pit water is fed through a geo bag before it gravity flows into the Outflow of Grebes Nest Brook. Based on the nature of the water pumped into the brook, it would be expected for the turbidity at this site to fluctuate throughout the deployment. Turbidity can also increase in the water column through evaporation. If the brook is not replenished with rainfall or pumped water, the water can become stagnant. Evaporation reduces the water level, concentrating the sediments in the remaining water.
The weather station recorded several rainfall events. The high spikes in turbidity on July 15 and July 31, 2020 were most likely a direct result of the rainfall recorded on those two days (Appendix I).
Please note the stage data on the graph below, is raw data. It has not been corrected for backwater effect. WSC is responsible for QA/QC of water quantity data. Corrected data can be obtained upon request to WSC.
Figure 8: Turbidity (NTU) values.
1.3
1.35
1.4
1.45
1.5
1.55
1.6
0200400600800
1000120014001600180020002200240026002800300032003400360038004000
2020
Jul
02
2020
Jul
02
2020
Jul
03
2020
Jul
04
2020
Jul
04
2020
Jul
05
2020
Jul
06
2020
Jul
06
2020
Jul
07
2020
Jul
08
2020
Jul
09
2020
Jul
09
2020
Jul
10
2020
Jul
11
2020
Jul
11
2020
Jul
12
2020
Jul
13
2020
Jul
14
2020
Jul
14
2020
Jul
15
2020
Jul
16
2020
Jul
16
2020
Jul
17
2020
Jul
18
2020
Jul
19
2020
Jul
19
2020
Jul
20
2020
Jul
21
2020
Jul
21
2020
Jul
22
2020
Jul
23
2020
Jul
23
2020
Jul
24
2020
Jul
25
2020
Jul
26
2020
Jul
26
2020
Jul
27
2020
Jul
28
2020
Jul
28
2020
Jul
29
2020
Jul
30
2020
Jul
31
2020
Jul
31
2020
Aug
01
2020
Aug
02
2020
Aug
02
2020
Aug
03
2020
Aug
04
2020
Aug
05
2020
Aug
05
Stag
e (m
)
Turb
idity
(NTU
)
Deployment Period
Turbidity and Stage Level at Outflow of Grebes Nest Pond
Turbidity (NTU) Stage (m)

Canada Fluorspar (NL) Inc, Newfoundland and Labrador
13
Conclusion
Outflow of Grebes Nest Pond currently flows through an evolving mine site. Grebes Nest Pond has been dewatered for mining purposes and no longer exists. The water supply for Outflow of Grebes Nest Pond station has changed. The water supply is pit water pumped via a sump pump into a geo bag, that is then gravity fed into Outflow of Grebes Nest Pond. The geo-bag is used to strain out the sediment-laden water that is pumped from the open pit mine.
Water temperature fluctuated with stage changes, but remained stable throughout the deployment. pH levels at Grebes Nest station were consistent during the deployment, with pH data being influenced by stage changes. Stage level did affect the specific conductivity data at Grebes Nest. As the stage level increased, the conductivity decreased. However, the changes were quick and were likely a result of the rainfall that was recorded at St. Lawrence.
Outflow to Grebes Nest Pond station does not always have consistent flow. The dissolved oxygen concentration can change quickly over a few hours or days and is greatly influencing stagnant water due to limited flow.
This brook has significant fluctuations in turbidity. The turbidity levels will increase in either high or low stage events, is due to the sediment present in the water coming from the geobag. This deployment had one large turbidity event, 4117.0 NTU on July 31, 2020. It is likely that after the water level in the brook dropped the first onset of a stage increase or rainfall event (17.7mm recorded on July 31, 2020) stirred up the sediment in the water column and caused the turbidity to increase.
Overall, the water quality parameters recorded at Outflow of Grebes Nest Pond displayed events expected of a brook in an environment influenced heavily by anthropogenic activities.
Canada Fluorspar (NL) Inc, Newfoundland and Labrador
14
Outflow of Unnamed Pond south of Long Pond
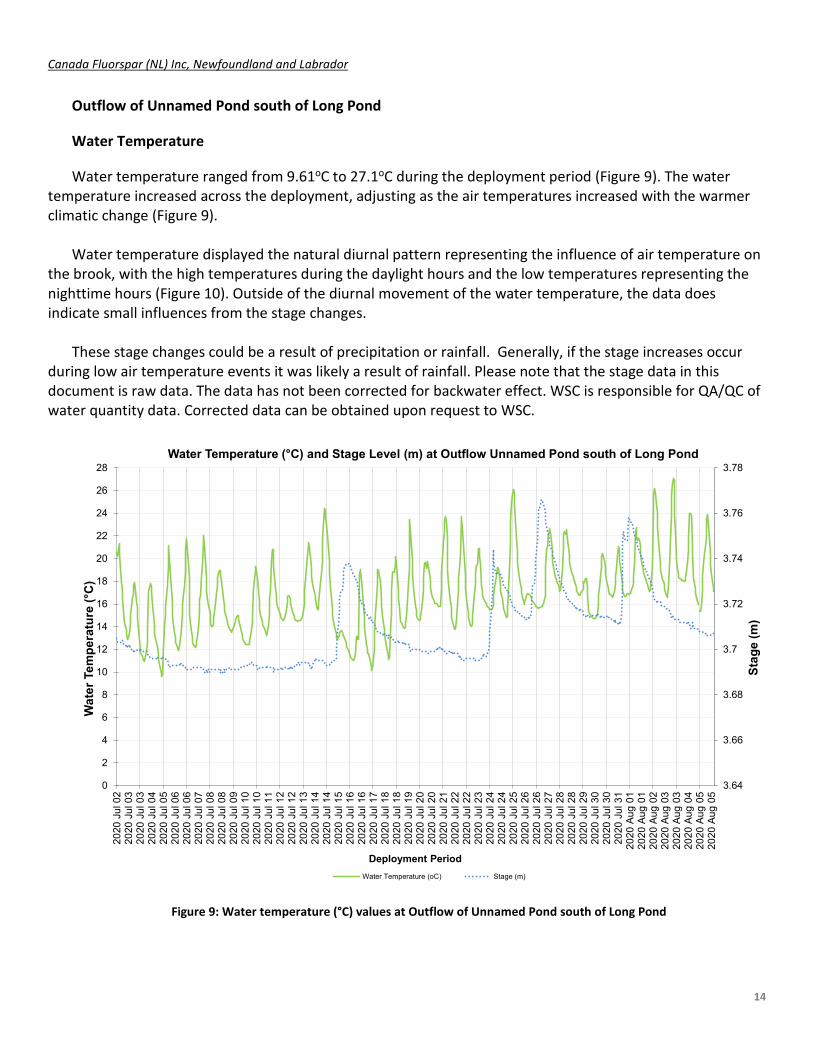
Water Temperature
Water temperature ranged from 9.61oC to 27.1oC during the deployment period (Figure 9). The water temperature increased across the deployment, adjusting as the air temperatures increased with the warmer climatic change (Figure 9).
Water temperature displayed the natural diurnal pattern representing the influence of air temperature on
the brook, with the high temperatures during the daylight hours and the low temperatures representing the nighttime hours (Figure 10). Outside of the diurnal movement of the water temperature, the data does indicate small influences from the stage changes.
These stage changes could be a result of precipitation or rainfall. Generally, if the stage increases occur
during low air temperature events it was likely a result of rainfall. Please note that the stage data in this document is raw data. The data has not been corrected for backwater effect. WSC is responsible for QA/QC of water quantity data. Corrected data can be obtained upon request to WSC.
3.64
3.66
3.68
3.7
3.72
3.74
3.76
3.78
0
2
4
6
8
10
12
14
16
18
20
22
24
26
28
2020
Jul
02
2020
Jul
03
2020
Jul
03
2020
Jul
04
2020
Jul
05
2020
Jul
06
2020
Jul
06
2020
Jul
07
2020
Jul
08
2020
Jul
08
2020
Jul
09
2020
Jul
10
2020
Jul
10
2020
Jul
11
2020
Jul
12
2020
Jul
12
2020
Jul
13
2020
Jul
14
2020
Jul
14
2020
Jul
15
2020
Jul
16
2020
Jul
16
2020
Jul
17
2020
Jul
18
2020
Jul
18
2020
Jul
19
2020
Jul
20
2020
Jul
20
2020
Jul
21
2020
Jul
22
2020
Jul
22
2020
Jul
23
2020
Jul
24
2020
Jul
24
2020
Jul
25
2020
Jul
26
2020
Jul
26
2020
Jul
27
2020
Jul
28
2020
Jul
28
2020
Jul
29
2020
Jul
30
2020
Jul
30
2020
Jul
31
2020
Aug
01
2020
Aug
01
2020
Aug
02
2020
Aug
03
2020
Aug
03
2020
Aug
04
2020
Aug
05
2020
Aug
05
Stag
e (m
)
Wat
er T
empe
ratu
re (°
C)
Deployment Period
Water Temperature (°C) and Stage Level (m) at Outflow Unnamed Pond south of Long Pond
Water Temperature (oC) Stage (m)
Figure 9: Water temperature (°C) values at Outflow of Unnamed Pond south of Long Pond

Canada Fluorspar (NL) Inc, Newfoundland and Labrador
15
0
5
10
15
20
25
0
2
4
6
8
10
12
14
16
18
20
22
24
26
2820
20 J
ul 0
220
20 J
ul 0
320
20 J
ul 0
420
20 J
ul 0
520
20 J
ul 0
620
20 J
ul 0
720
20 J
ul 0
820
20 J
ul 0
920
20 J
ul 1
020
20 J
ul 1
120
20 J
ul 1
220
20 J
ul 1
320
20 J
ul 1
420
20 J
ul 1
520
20 J
ul 1
620
20 J
ul 1
720
20 J
ul 1
820
20 J
ul 1
920
20 J
ul 2
020
20 J
ul 2
120
20 J
ul 2
220
20 J
ul 2
320
20 J
ul 2
420
20 J
ul 2
520
20 J
ul 2
620
20 J
ul 2
720
20 J
ul 2
820
20 J
ul 2
920
20 J
ul 3
020
20 J
ul 3
120
20 A
ug 0
120
20 A
ug 0
220
20 A
ug 0
320
20 A
ug 0
420
20 A
ug 0
5
Mea
n Ai
r Tem
pera
ture
(oC
)
Dai
ly A
vera
ged
Wat
er T
empe
ratu
re (°
C)
Deployment Period
Daily Averaged Water Temperature (°C) at Outflow of Unnamed Pond south of Long Pond and Mean Air Temperature (°C) recorded at St. Lawrence weather station.
Daily Averaged Water Temperature (oC) Mean Air Temperature (oC)
Figure 10: Water temperature (°C) and Mean Air Temperature (°C) at Outflow of Unnamed Pond south of Long Pond
Canada Fluorspar (NL) Inc, Newfoundland and Labrador
16
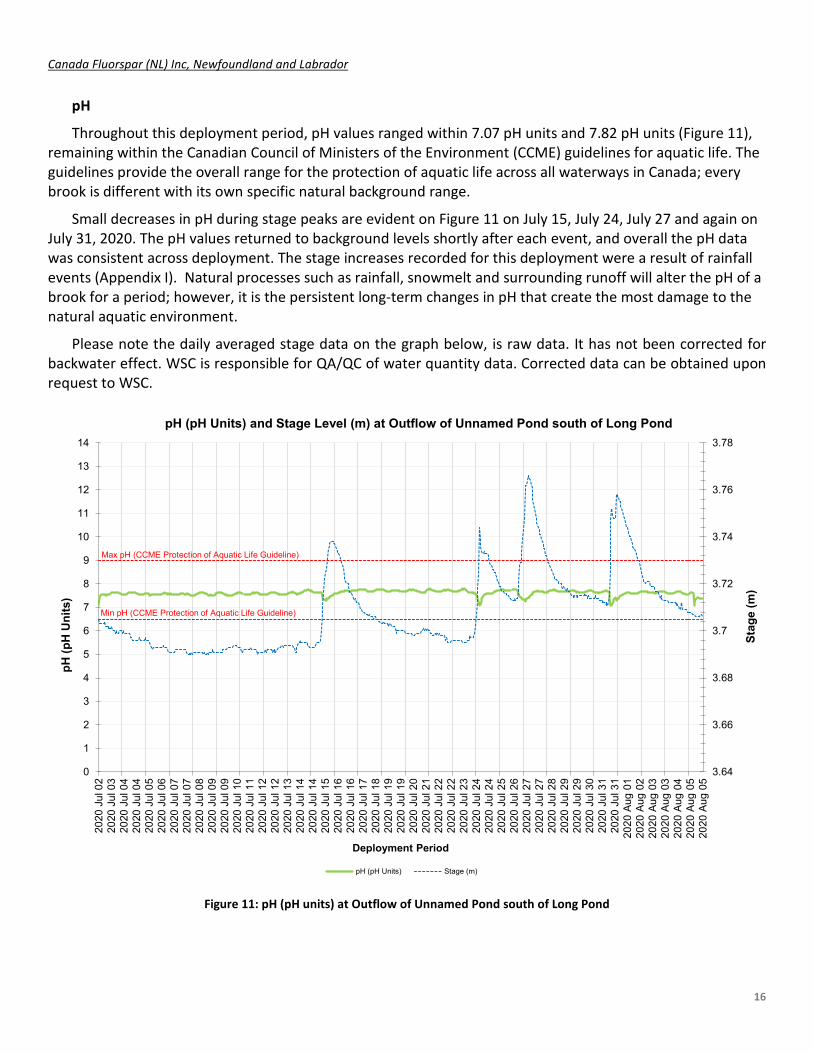
pH
Throughout this deployment period, pH values ranged within 7.07 pH units and 7.82 pH units (Figure 11), remaining within the Canadian Council of Ministers of the Environment (CCME) guidelines for aquatic life. The guidelines provide the overall range for the protection of aquatic life across all waterways in Canada; every brook is different with its own specific natural background range.
Small decreases in pH during stage peaks are evident on Figure 11 on July 15, July 24, July 27 and again on July 31, 2020. The pH values returned to background levels shortly after each event, and overall the pH data was consistent across deployment. The stage increases recorded for this deployment were a result of rainfall events (Appendix I). Natural processes such as rainfall, snowmelt and surrounding runoff will alter the pH of a brook for a period; however, it is the persistent long-term changes in pH that create the most damage to the natural aquatic environment.
Please note the daily averaged stage data on the graph below, is raw data. It has not been corrected for backwater effect. WSC is responsible for QA/QC of water quantity data. Corrected data can be obtained upon request to WSC.
3.64
3.66
3.68
3.7
3.72
3.74
3.76
3.78
0
1
2
3
4
5
6
7
8
9
10
11
12
13
14
2020
Jul
02
2020
Jul
03
2020
Jul
04
2020
Jul
04
2020
Jul
05
2020
Jul
06
2020
Jul
07
2020
Jul
07
2020
Jul
08
2020
Jul
09
2020
Jul
09
2020
Jul
10
2020
Jul
11
2020
Jul
12
2020
Jul
12
2020
Jul
13
2020
Jul
14
2020
Jul
14
2020
Jul
15
2020
Jul
16
2020
Jul
16
2020
Jul
17
2020
Jul
18
2020
Jul
19
2020
Jul
19
2020
Jul
20
2020
Jul
21
2020
Jul
22
2020
Jul
22
2020
Jul
23
2020
Jul
24
2020
Jul
24
2020
Jul
25
2020
Jul
26
2020
Jul
27
2020
Jul
27
2020
Jul
28
2020
Jul
29
2020
Jul
29
2020
Jul
30
2020
Jul
31
2020
Jul
31
2020
Aug
01
2020
Aug
02
2020
Aug
03
2020
Aug
03
2020
Aug
04
2020
Aug
05
2020
Aug
05
Stag
e (m
)
pH (p
H Un
its)
Deployment Period
pH (pH Units) and Stage Level (m) at Outflow of Unnamed Pond south of Long Pond
pH (pH Units) Stage (m)
Max pH (CCME Protection of Aquatic Life Guideline)
Min pH (CCME Protection of Aquatic Life Guideline)
Figure 11: pH (pH units) at Outflow of Unnamed Pond south of Long Pond

Canada Fluorspar (NL) Inc, Newfoundland and Labrador
17
Specific Conductivity
The conductivity levels ranged between 96.58 µS/cm and 211.76 µS/cm during deployment (Figure 12). The deployment period had a median of 178.86 µS/cm, which was higher than previous deployment.
Changes in stage will influence the conductivity data (Figure 12). The extra volume of water during a stage increase will dilute the particle matter present in a water column. When stage level drops, the conductivity levels will increase. Suspended solids are concentrated in the water column as the volume of water reduces.
The decrease in conductivity can be noted on Figure 12, on July 15, July 24, July 27 and again on July 31, 2020 as conductivity data dropped for a short period before returning to previous levels.
Please note the daily averaged stage data on the graph below, is raw data. It has not been corrected for backwater effect. WSC is responsible for QA/QC of water quantity data. Corrected data can be obtained upon request to WSC.
3.64
3.66
3.68
3.7
3.72
3.74
3.76
3.78
0
20
40
60
80
100
120
140
160
180
200
220
240
260
280
300
320
340
2020
Jul
02
2020
Jul
03
2020
Jul
04
2020
Jul
04
2020
Jul
05
2020
Jul
06
2020
Jul
07
2020
Jul
07
2020
Jul
08
2020
Jul
09
2020
Jul
09
2020
Jul
10
2020
Jul
11
2020
Jul
12
2020
Jul
12
2020
Jul
13
2020
Jul
14
2020
Jul
14
2020
Jul
15
2020
Jul
16
2020
Jul
16
2020
Jul
17
2020
Jul
18
2020
Jul
19
2020
Jul
19
2020
Jul
20
2020
Jul
21
2020
Jul
22
2020
Jul
22
2020
Jul
23
2020
Jul
24
2020
Jul
24
2020
Jul
25
2020
Jul
26
2020
Jul
27
2020
Jul
27
2020
Jul
28
2020
Jul
29
2020
Jul
29
2020
Jul
30
2020
Jul
31
2020
Jul
31
2020
Aug
01
2020
Aug
02
2020
Aug
03
2020
Aug
03
2020
Aug
04
2020
Aug
05
2020
Aug
05
Stag
e (m
)
Spec
ific
Cond
uctiv
ity (µ
S/cm
)
Deployment Period
Specific Conductance (µS/cm) and Stage Level (m) at Outflow of Unnamed Pond south of Long Pond
Specific Conductivity (uS/cm) Stage (m)
Figure 12: Specific conductivity (μS/cm) at Outflow of Unnamed Pond south of Long Pond
Canada Fluorspar (NL) Inc, Newfoundland and Labrador
18
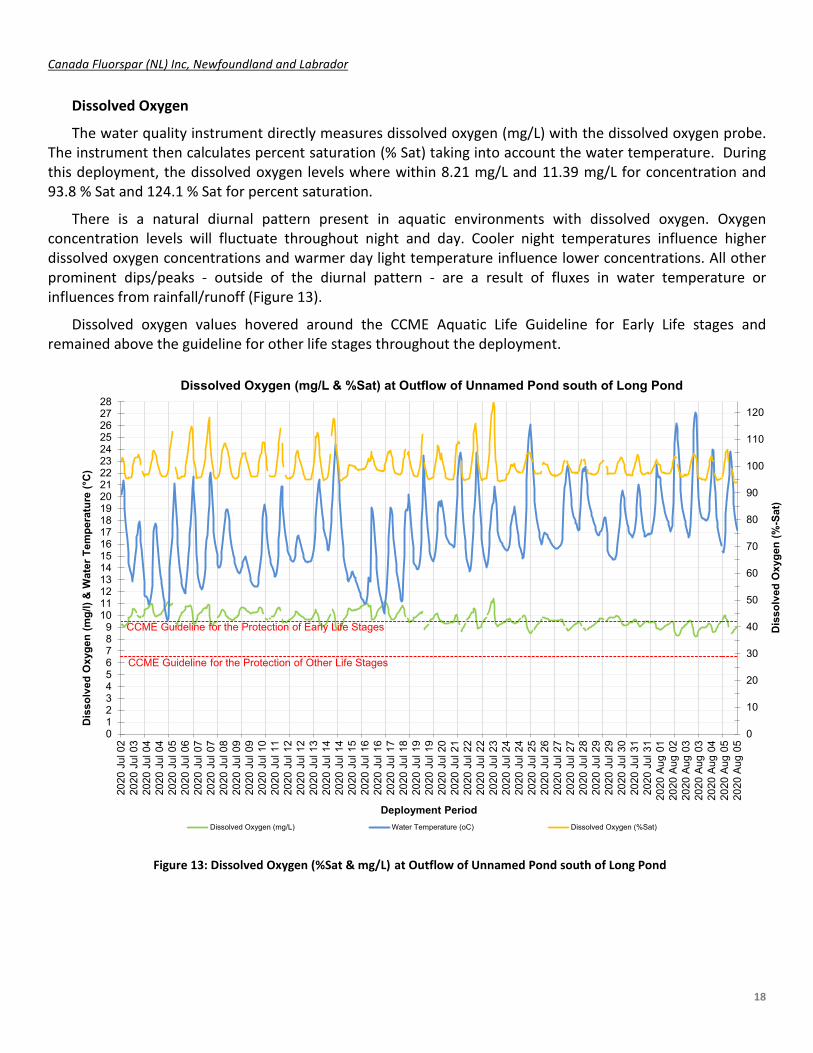
Dissolved Oxygen
The water quality instrument directly measures dissolved oxygen (mg/L) with the dissolved oxygen probe. The instrument then calculates percent saturation (% Sat) taking into account the water temperature. During this deployment, the dissolved oxygen levels where within 8.21 mg/L and 11.39 mg/L for concentration and 93.8 % Sat and 124.1 % Sat for percent saturation.
There is a natural diurnal pattern present in aquatic environments with dissolved oxygen. Oxygen concentration levels will fluctuate throughout night and day. Cooler night temperatures influence higher dissolved oxygen concentrations and warmer day light temperature influence lower concentrations. All other prominent dips/peaks - outside of the diurnal pattern - are a result of fluxes in water temperature or influences from rainfall/runoff (Figure 13).
Dissolved oxygen values hovered around the CCME Aquatic Life Guideline for Early Life stages and remained above the guideline for other life stages throughout the deployment.
0
10
20
30
40
50
60
70
80
90
100
110
120
0123456789
10111213141516171819202122232425262728
2020
Jul
02
2020
Jul
03
2020
Jul
04
2020
Jul
04
2020
Jul
05
2020
Jul
06
2020
Jul
07
2020
Jul
07
2020
Jul
08
2020
Jul
09
2020
Jul
09
2020
Jul
10
2020
Jul
11
2020
Jul
12
2020
Jul
12
2020
Jul
13
2020
Jul
14
2020
Jul
14
2020
Jul
15
2020
Jul
16
2020
Jul
16
2020
Jul
17
2020
Jul
18
2020
Jul
19
2020
Jul
19
2020
Jul
20
2020
Jul
21
2020
Jul
22
2020
Jul
22
2020
Jul
23
2020
Jul
24
2020
Jul
24
2020
Jul
25
2020
Jul
26
2020
Jul
27
2020
Jul
27
2020
Jul
28
2020
Jul
29
2020
Jul
29
2020
Jul
30
2020
Jul
31
2020
Jul
31
2020
Aug
01
2020
Aug
02
2020
Aug
03
2020
Aug
03
2020
Aug
04
2020
Aug
05
2020
Aug
05
Dis
solv
ed O
xyge
n (%
-Sat
)
Dis
solv
ed O
xyge
n (m
g/l)
& W
ater
Tem
pera
ture
(°C
)
Deployment Period
Dissolved Oxygen (mg/L & %Sat) at Outflow of Unnamed Pond south of Long Pond
Dissolved Oxygen (mg/L) Water Temperature (oC) Dissolved Oxygen (%Sat)
CCME Guideline for the Protection of Other Life Stages
CCME Guideline for the Protection of Early Life Stages
Figure 13: Dissolved Oxygen (%Sat & mg/L) at Outflow of Unnamed Pond south of Long Pond
Canada Fluorspar (NL) Inc, Newfoundland and Labrador
19
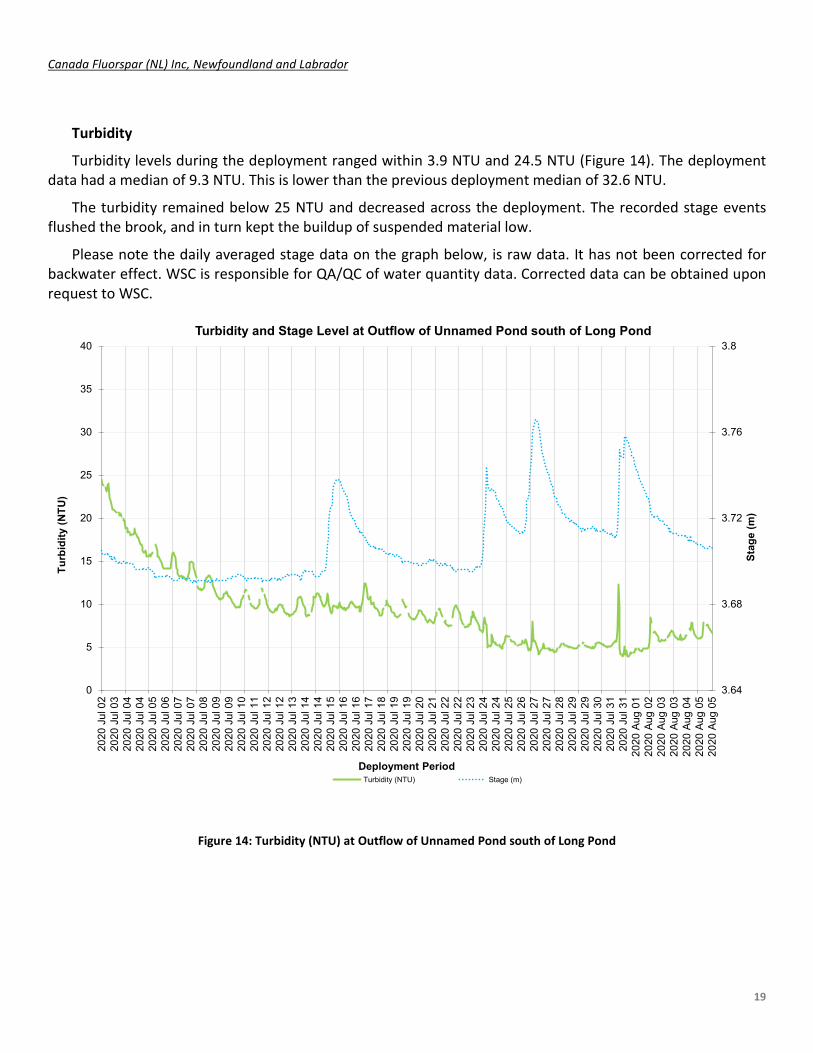
Turbidity
Turbidity levels during the deployment ranged within 3.9 NTU and 24.5 NTU (Figure 14). The deployment data had a median of 9.3 NTU. This is lower than the previous deployment median of 32.6 NTU.
The turbidity remained below 25 NTU and decreased across the deployment. The recorded stage events flushed the brook, and in turn kept the buildup of suspended material low.
Please note the daily averaged stage data on the graph below, is raw data. It has not been corrected for backwater effect. WSC is responsible for QA/QC of water quantity data. Corrected data can be obtained upon request to WSC.
3.64
3.68
3.72
3.76
3.8
0
5
10
15
20
25
30
35
40
2020
Jul
02
2020
Jul
03
2020
Jul
04
2020
Jul
04
2020
Jul
05
2020
Jul
06
2020
Jul
07
2020
Jul
07
2020
Jul
08
2020
Jul
09
2020
Jul
09
2020
Jul
10
2020
Jul
11
2020
Jul
12
2020
Jul
12
2020
Jul
13
2020
Jul
14
2020
Jul
14
2020
Jul
15
2020
Jul
16
2020
Jul
16
2020
Jul
17
2020
Jul
18
2020
Jul
19
2020
Jul
19
2020
Jul
20
2020
Jul
21
2020
Jul
22
2020
Jul
22
2020
Jul
23
2020
Jul
24
2020
Jul
24
2020
Jul
25
2020
Jul
26
2020
Jul
27
2020
Jul
27
2020
Jul
28
2020
Jul
29
2020
Jul
29
2020
Jul
30
2020
Jul
31
2020
Jul
31
2020
Aug
01
2020
Aug
02
2020
Aug
03
2020
Aug
03
2020
Aug
04
2020
Aug
05
2020
Aug
05
Stag
e (m
)
Turb
idity
(NTU
)
Deployment Period
Turbidity and Stage Level at Outflow of Unnamed Pond south of Long Pond
Turbidity (NTU) Stage (m)
Figure 14: Turbidity (NTU) at Outflow of Unnamed Pond south of Long Pond
Canada Fluorspar (NL) Inc, Newfoundland and Labrador
20
Conclusion
The Outflow of Unnamed Pond south of Long Pond is established downstream of the Tailings Management Facility (TMF), to assist in capturing any emerging water quality issues with the management of the tailings facility. The Outflow of Unnamed Pond South of Long Pond also flows through undeveloped area that includes natural wetlands and marshlands. This station is the furthest away from the anthropogenic activities that are occurring on the Canada Fluorspar mine site.
As with many shallow brooks and streams, precipitation and runoff events play a significant role in influencing water quality. Increased water temperatures during the deployment were representative of the climate for the time of year. The pH values were consistent for this brook. Any significant changes in pH data corresponded with a rise in stage.
Conductivity levels responded to stage fluctuations by decreasing during high stage events and increasing during periods of low stage. The changes in dissolved oxygen levels are a result of the warmer water temperatures. Oxygen levels decreased slightly across deployment as the air temperature increased with the climatic change into summer.
The deployment had moderate turbidity, with the range in turbidity decreasing even further toward the end of deployment.
The four large stage events recorded in the deployment were a result of the rainfall events that occurred on the same dates. The precipitation can influence water quality conditions. The majority of the changes are natural and quick adjustments in levels before the data returns to background levels. The health of a waterway can be determined by how quickly the parameters return to background data after a water quality event, such as precipitation, run off or snowmelt.

Canada Fluorspar (NL) Inc, Newfoundland and Labrador
21
APPENDIX I
Canada Fluorspar (NL) Inc, Newfoundland and Labrador
22
0
5
10
15
20
25
30
1.38
1.4
1.42
1.44
1.46
1.48
1.5
1.52
1.5420
20 Ju
l 02
2020
Jul 0
3
2020
Jul 0
4
2020
Jul 0
5
2020
Jul 0
6
2020
Jul 0
7
2020
Jul 0
8
2020
Jul 0
9
2020
Jul 1
0
2020
Jul 1
1
2020
Jul 1
2
2020
Jul 1
3
2020
Jul 1
4
2020
Jul 1
5
2020
Jul 1
6
2020
Jul 1
7
2020
Jul 1
8
2020
Jul 1
9
2020
Jul 2
0
2020
Jul 2
1
2020
Jul 2
2
2020
Jul 2
3
2020
Jul 2
4
2020
Jul 2
5
2020
Jul 2
6
2020
Jul 2
7
2020
Jul 2
8
2020
Jul 2
9
2020
Jul 3
0
2020
Jul 3
1
2020
Aug
01
2020
Aug
02
2020
Aug
03
2020
Aug
04
2020
Aug
05
Tota
l Pre
cipi
tatio
n (m
m)
Stag
e (m
)
Deployment Period
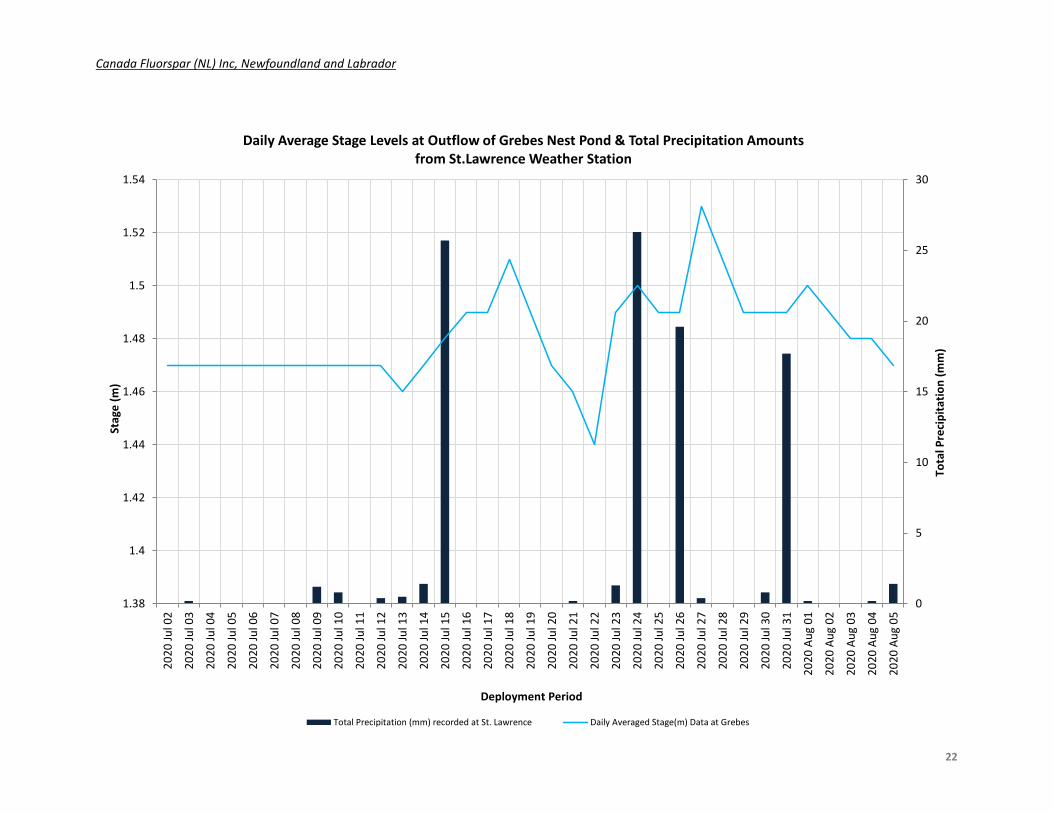
Daily Average Stage Levels at Outflow of Grebes Nest Pond & Total Precipitation Amountsfrom St.Lawrence Weather Station
Total Precipitation (mm) recorded at St. Lawrence Daily Averaged Stage(m) Data at Grebes

Canada Fluorspar (NL) Inc, Newfoundland and Labrador
23
APPENDIX II
Canada Fluorspar (NL) Inc, Newfoundland and Labrador
24
0
2
4
6
8
10
12
14
16
18
20
22
24
26
28
3.5
3.52
3.54
3.56
3.58
3.6
3.62
3.64
3.66
3.68
3.7
3.72
3.74
3.76
3.78
2020
Jul 0
2
2020
Jul 0
3
2020
Jul 0
4
2020
Jul 0
5
2020
Jul 0
6
2020
Jul 0
7
2020
Jul 0
8
2020
Jul 0
9
2020
Jul 1
0
2020
Jul 1
1
2020
Jul 1
2
2020
Jul 1
3
2020
Jul 1
4
2020
Jul 1
5
2020
Jul 1
6
2020
Jul 1
7
2020
Jul 1
8
2020
Jul 1
9
2020
Jul 2
0
2020
Jul 2
1
2020
Jul 2
2
2020
Jul 2
3
2020
Jul 2
4
2020
Jul 2
5
2020
Jul 2
6
2020
Jul 2
7
2020
Jul 2
8
2020
Jul 2
9
2020
Jul 3
0
2020
Jul 3
1
2020
Aug
01
2020
Aug
02
2020
Aug
03
2020
Aug
04
2020
Aug
05
Tota
l Pre
cipi
tatio
n (m
m)
Stag
e (m
)
Deployment Period
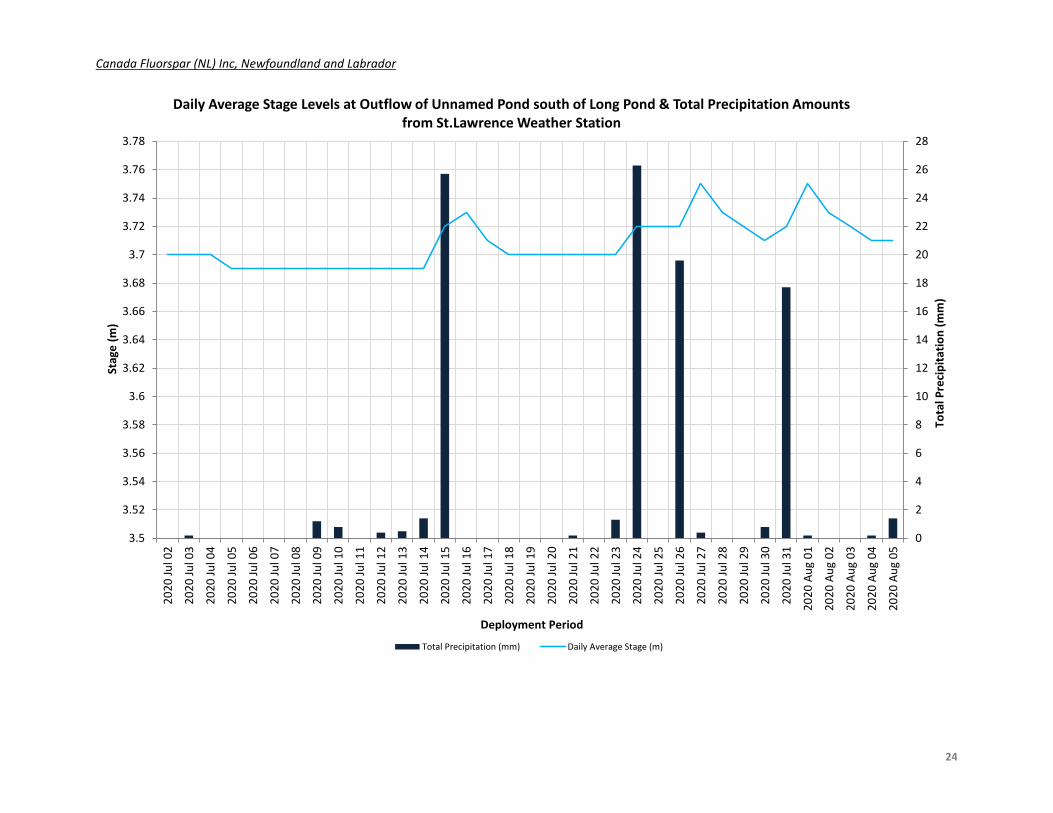
Daily Average Stage Levels at Outflow of Unnamed Pond south of Long Pond & Total Precipitation Amountsfrom St.Lawrence Weather Station
Total Precipitation (mm) Daily Average Stage (m)