Embed Size (px)
Citation preview

THIS REPORT CONTAINS ASSESSMENTS OF COMMODITY AND TRADE ISSUES MADE
BY USDA STAFF AND NOT NECESSARILY STATEMENTS OF OFFICIAL U.S.
GOVERNMENT POLICY
Date:
GAIN Report Number:
Approved By:
Prepared By:
Report Highlights:
Canada has had a federal mandate requiring 5 percent of the national gasoline pool to be renewable
(ethanol) and 2 percent renewable content in diesel fuel. In addition, many provinces have
equivalent or higher provincial mandates, including a 5 percent renewable content mandate in
Ontario, 7.5 percent in Saskatchewan, and 8.5 percent in Manitoba. Ethanol production in Canada
is estimated to increase by 1.5 percent in 2016 to 1.75 billion liters up from 2015 levels of 1.725
billion liters. To meet the blend mandate Canada requires over 2 billion liters of fuel grade ethanol.
Canada is estimated to import 1 billion liters of ethanol in 2016 and 2017, nearly 100 percent
originating from the United States. Canada’s biodiesel production is estimated to reach 400 million
liters in 2016 and forecast to reach 550 million liters in 2017, but is still below the level needed to
meet the federal mandate thus requiring imports.
Darlene Dessureault, Senior Agricultural Specialist
Jeff Zimmerman, Agricultural Attaché
2016
Biofuels Annual
Canada
CA16038
8/9/2016
Required Report - public distribution
I. Executive Summary
Since December 15, 2010, Canada has had a federal mandate requiring 5 percent of the national
gasoline pool to be renewable (ethanol). In addition, many provinces have equivalent or higher
provincial mandates, including a 5 percent renewable content mandate in Ontario, 7.5 percent in
Saskatchewan, and 8.5 percent in Manitoba.
Bioethanol production in Canada will increase/decrease by 1.5 percent in 2016 to 1.75 billion liters
from 2015 levels of 1.725 billion liters. No increase in domestic production capacity expected
between 2016 and 2017. Production is forecast to remain at level in 2017. Factors most affecting
changes in production will include provincial carbon reduction policies/targets, gasoline prices and
technological improvements.
Domestic production capacity will likely remain at 1.775 billion liters unless economics change
substantially. Canada, unlike the United States has not reached a domestic production capacity that
makes it possible to meet its blend mandates with domestic production alone and therefore will
continue to import the balance. To meet the blend mandate Canada requires over 2 billion liters of
fuel grade ethanol.
Primary feedstocks for ethanol remain corn and wheat. Commercial-scale production levels of
cellulosic ethanol from wood waste and municipal solid waste are now feasible, however, for
economic reasons, methanol is currently being produced instead.
On July 1, 2011, the federal government implemented a federal mandate of two percent renewable
content in diesel fuel and heating oil. In 2013, regulations amending the Renewable Fuels
Regulations were released, extending the exemption until June 30, 2013, as well as permanently
exempting heating oils from the mandate. Some provincial mandates require higher blend levels
and/or low carbon intensity requirements.
In 2016, Canadian biodiesel production increased due to new production capacity coming on-line.
In 2017, production capacity is forecast to reach 600 million liters Canada’s biodiesel production is
estimated to reach 400 million liters in 2016 and forecast to reach 550 million liters in 2017, but is
still below the level needed to meet the federal mandate. The balance will continue to be met by
imports. Primary feedstocks remain canola, animal fat, and recycled oils. Canola feedstock is
expected to account for nearly 29 percent of Canadian biodiesel production by the end of 2016 and
in 2017. Cooking oil is forecast to account for 49 percent of the feedstock in 2016 and 46 percent on
2017. Soybean oil is expected to increase to 8 percent in 2016 and rise to 20 percent in 2017.
Canada’s limited biofuels production, both in the short and medium term, suggests that Canada will
never be in a trade surplus situation for biodiesel or ethanol. Canada is a major exporter of wood
pellets however. There is an increasing amount of trade in the co-products of ethanol production.
Cross-border trade between Canada and the United States in biofuels reflects the most economical
trade corridors.
II. Policy and Programs Energy is a joint federal and provincial responsibility in Canada and it is for this reason that
programs and incentives to support energy development are found at both levels of government. In
Canada, many of the provincial governments put in place provincial biofuel blend mandates well
ahead of the federal mandate and are currently working on provincial policies to monetize carbon in
order to achieve provincial greenhouse gas reduction targets. Due to the focus on emissions at both
the federal and provincial level on emissions, foreign suppliers can achieve a competitive edge by
supplying lower carbon intensity (CI) fuels.
A federal election in the fall of 2015 resulted in the Liberal party of Canada coming to power after
10 years of the Conservative government. Shortly after the election, Canada signed the Paris
Agreement and pledged by 2030 to cut its emissions by 30 percent from 2005 levels. The federal
government is currently working on developing a climate strategy with the provinces while also
working with the United States and Mexico on a North American Plan.
At this time there is little yet announced at the federal level that will have a profound impact on
biofuel demand or production. Industry contacts suggest that the federal government may consider a
combination of an increased renewable fuel standard combined with lower carbon intensity
requirements.
Developments in the federal government’s action on climate change can be found at the following
url address:
http://www.climatechange.gc.ca/default.asp?lang=En&n=72F16A84-1
FEDERAL BIOFUEL POLICY STRUCTURE
Currently, regulations under the Canadian Environmental Protection Act (1999) require a 5 percent
renewable content in the Canadian gasoline pool, and a 2 percent renewable content in the distillate
pool, excluding heating oil. There are a few excluded volumes from the gasoline pools and distillate
pool which include gasoline, diesel fuel or heating distillate oil sold for or delivered for use in
aircraft, competition vehicles, feedstock for the production of chemicals (other than fuel), military
combat equipment, space heating purposes and gasoline or heating distillate oil sold for or delivered,
represented as kerosene for use in unvented space heater, wick-fed illuminating lamps, or flue-
connected stoves and heaters. Also excluded is gasoline, diesel fuel or heating distillate oil for export
or transit through Canada, as well as renewable fuel.
Some partial exemptions are made for the use of biocrude. According to the regulations, a primary
supplier may subtract from their gasoline pool for a gasoline compliance period 20 percent of the
volume, if any, of biocrude, other than triglyceride-derived biocrude, that they used as feedstock to
produce liquid petroleum fuel during the gasoline compliance period. In terms of the distillate pool,
a primary supplier may subtract from their distillate pool for a distillate compliance period (a) 20
percent of the volume, if any, of biocrude, other than triglyceride-derived biocrude, that they used as
feedstock to produce liquid petroleum fuel during the distillate compliance period; and (b) 85
percent of the volume, if any, of triglyceride-derived biocrude that they used as feedstock to produce

liquid petroleum fuel during the distillate compliance period.
The overall structure is similar to the Renewable Fuel Standard in the United States, with the point
of compliance being the point of production or importation. The RFS regulations fall under the
Canadian Environmental Protection Act (CEPA). The full regulations can be found at the following
URL address: Renewable Fuel Regulations. An offense under this act is a criminal offense.
There is no indication at this time that federally mandated ethanol blend rates will increase beyond
current levels in the next few years. Domestic production capacity continues to fall short of
domestic demand, necessitating that a significant portion of the federal mandate for ethanol being
met through imports.
Federal production incentives are scheduled to sunset on March 31, 2017. Production incentives are
administered by the Federal Department of Natural Resources through the ecoEnergy for Biofuels
program. The current federal incentive rate for ethanol production in dollars per liter is 0.03, and for
renewable diesel/biodiesel production is 0.04. The contribution agreements require the participants
to provide to NRCan production and financial data which includes but is not limited to anticipated
eligible sales, annual audited financial statements, and environmental performance data. There are
no requirements that the production must be supplied to the Canadian marketplace.
PROVINCIAL BIOFUEL POLICIES
Canada’s western provinces, as well as the province of Ontario, have blend mandates in place.
The province of Quebec has an aspirational mandate of 5% but has concentrated most of its support
on the development of cellulosic ethanol. Quebec has a policy that limits the use of corn ethanol
production beyond the one existing plant in the province. The provincial blend mandates are not as
broad as the federal mandate and focus on transportations fuels. Table 1 below summarizes the
provincial blend mandates for ethanol and biodiesel that are currently in place.
Table 1: Provincial Blend Mandates
Province Ethanol Blend Mandate for
Gasoline
Renewable Fuel Blend
Mandate for Diesel
British Columbia 5 percent 4 percent
Alberta 5 percent 2 percent
Saskatchewan 7.5 percent 2 percent
Manitoba 8.5 percent 2 percent
Ontario 5 percent 2-4 percent*
Quebec 5% inspirational mandate none
*depending on greenhouse gas emission reductions
In Canada, provincial policies are significant as they have been the forerunners of what eventually
was developed at the federal level. The federal mandate served to harmonize provincial mandates
and eliminated inter-provincial trade barriers. Most interprovincial trade distortions that existed
were in the form of provincial incentives that may have a requirement that the biofuel be produced
and/or consumed in the province. With the sun-setting of these provincial production and/or
consumption incentives, these types of distortions have disappeared.
The federal government is now shifting its focus is on trying to work with provinces to reduce

interprovincial trade and wealth distortions resulting from provincial efforts to monetize carbon and
force emitters to reduce their emissions in order to reach provincial GHG reduction targets.
British Columbia, Alberta, Ontario and Quebec have taken the lead in cap and trade initiatives, with
several including low carbon fuel intensity fuel requirements in addition to their blend mandates.
For example, the province of BC has included with its blend mandate of transportation fuel a low
carbon fuel standard with prescribed carbon intensity limits that decrease 10 percent between 2010
and 2020.
Alberta will, beginning on January 1, 2017 be applying a carbon levy that will be applies to fuels at a
rate of 20$ per ton, with the levy increasing to $30/ton on January 2018. Biofuels, including
biomethane, biodiesel and ethanol will not be subject to the levy and so the levy may result in
increased usage of these biofuels. Alberta currently has an emission eligibility standard attached to
its blend mandate that requires suppliers to demonstrate 25% fewer GHG emission than the
equivalent petrol fuel.
Ontario is in the final phase of the implementation of its “green diesel standard”. The content
requirements are being phased in over three years, from 2014-2017. Requirements in 2016 are that
3% of the total volume of diesel fuel must be bio-based. The bio-based diesel component of this
blend must have 50% lower greenhouse gas emissions than standard petroleum diesel. In 2017, 4%
of the total volume of diesel fuel must be bio-based. The bio-based diesel component of this blend
must have 70% lower greenhouse gas emissions than standard petroleum diesel.
The province of Ontario has also announced a new climate change action plan which makes
reduction in the transportation sectors a priority as it is identified as one of the most difficult sectors
in which significant emission reductions can be achieved. Some of the measures being proposed by
Ontario as part of its climate change action plan is developing a province-wide electric and hydrogen
passenger vehicle sales target of five percent in 2020. Based on year 2015 passenger car sales in
Ontario in 2015, this would represent about 14,000 cars. Ontario also will strive to increase the
availability and use of lower carbon fuel which will include propane, liquefied gas, and gasoline
mixed with renewable fuel content such as ethanol. Ontario intends to set a new renewable fuel
standard to increase the percentage of renewable content required in gasoline for transportation sold
in the province. The goal is to achieve a five percent reduction in greenhouse gas pollution from
gasoline by 2020. This is likely to include a lower carbon intensity requirement. Ontario also
intends to fund fuels distributors for higher-blends of sustainable biofuels and infrastructure
upgrades. This could have a positive effect on demand of ethanol and biodiesel/renewable diesel.
Ontario has also announced places to link its cap and trade system for GHG emissions to the
Western Climate Initiative (WCI) system in which Quebec and California are active participants.
Quebec and California officially implemented the WCI’s cap-and-trade regulations on January 1,
2012, and carbon emitters were given until January 1, 2013 to make necessary adjustments. The
Government of Quebec’s provincial target is to reduce emissions 20 per cent below 1990 levels by
2020. Businesses that emit 25,000 metric tons or more of CO2 equivalent a year are subject to the
cap and trade system. For the first compliance period (20132014), only the industrial and electricity
sectors are subject to the system. However, during the second and third compliance periods
(20152017 and 20182020), fossil fuel distributors are also subject to the system. In addition, the cap
and trade system is open to individuals and other entities that would like to participate in the carbon
market, even if there is no regulatory obligation for them to do so.

Given the direction of the provincial policies and objectives, foreign suppliers can achieve a
competitive edge by supplying lower carbon intensity (CI) fuels which can be achieved through a
better understanding of the lifecycle analysis used and integrating strategies which reduce the overall
carbon intensity to produce the ethanol or renewable/biodiesel. For example, the integration of a
feed lot and/or using corn stover as an energy source in the production process.
CANADIAN ENERGY SITUATION
Energy security is not a factor behind the recent and projected growth in Canada’s renewable fuel
industry. According to the U.S. Energy Information Administration (EIA), Canada has the world’s
third largest proven oil reserves (estimated at 180 billion barrels), behind Venezuela and Saudi
Arabia. Canada is one of the world’s top ten oil exporters, and is one of the world’s five largest
energy producers.
The National Energy Board has published a report title Canada’s Energy Future 2016: Energy
Supply and Demand Projections to 2040. The report provides the agency’s energy supply and
demand projections from 2014 until 2040. Energy demand in the Canadian transportation sector,
like the United States, is expected to slow from historical growth rates. This is largely a result of
periodic higher fuel prices, federal requirements to boost fleet efficiency standards, and demographic
changes especially among younger people who are delaying the purchase of their first car or finding
solutions to forgo car ownership all together. Canada has adopted the same vehicle fuel efficiency
standards as the United States and as a result it is expected that future growth rates for diesel fuel
will be higher than the growth rate for gasoline as gasoline usage is forecast to decline. The report
projects that Canadian energy demand for transportation demand will fall from an average annual
rates growth rate of 1.5 in 2014 to 0.2 percent by 2040. The entire report is available at the
following URL: https://www.neb-one.gc.ca/nrg/ntgrtd/ftr/2016/index-eng.html
Gasoline and diesel fuel continue to dominate as the transportation sector’s main energy sources,
accounting on average 38 percent and 28 percent of the fuel types used. The average retail gasoline
price fell by 15% or just over 19 cents per liter compared to 2014 with retail prices. Gasoline prices
averaged $1.09 per liter in 2015. The retail gasoline price in 2015 was the lowest it had been since
2010 when it was at $1.04 per liter. Diesel retail prices were down by 23% or almost 25 cents per
liters compared to 2014. Diesel prices averaged $1.09 per liter. Year to date data suggest that prices
at the pumps for both gasoline and diesel will continue to fall and will likely continue to limit
discretionary blending above the federal or provincial mandates. More information is available in
the Fuel Focus 2015 Annual Review published by Natural Resources Canada and available at the
following URL address: http://www.nrcan.gc.ca/energy/fuel-prices/gasoline-reports/18031.
Statistical data is also available from CANSIM table 326-0009 at the following URL:
http://www5.statcan.gc.ca/cansim/a26.
Official data on the use of refined petroleum products can be found in the supply and disposition
table 134-0004 by Statistics Canada (CANSIM). Domestic gasoline sales fell by 2 percent in 2015
compared to 2014 levels for the same period. In 2016, year to date data has gasoline sales running 6
percent ahead of 2015 domestic sales for the same time period. This is reflective of lower gasoline
prices. Post estimates year 2016 gasoline demand at 4,600 million liters, 3 percent above 2015
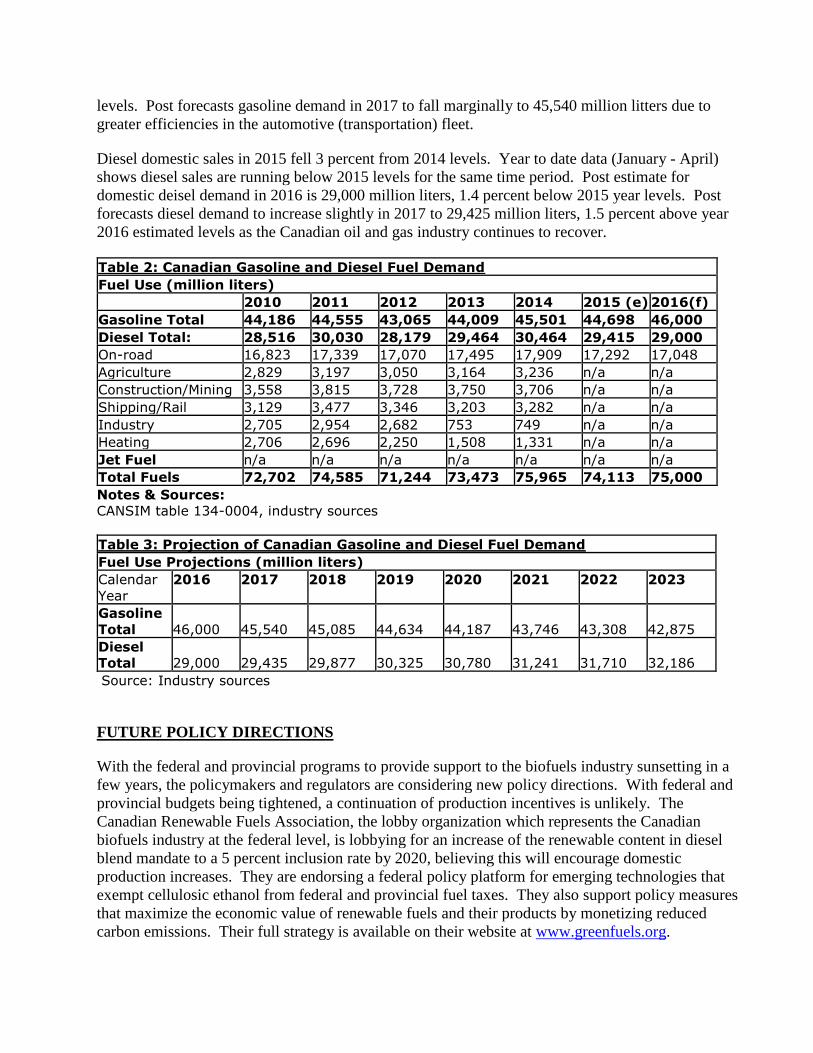
levels. Post forecasts gasoline demand in 2017 to fall marginally to 45,540 million litters due to
greater efficiencies in the automotive (transportation) fleet.
Diesel domestic sales in 2015 fell 3 percent from 2014 levels. Year to date data (January - April)
shows diesel sales are running below 2015 levels for the same time period. Post estimate for
domestic deisel demand in 2016 is 29,000 million liters, 1.4 percent below 2015 year levels. Post
forecasts diesel demand to increase slightly in 2017 to 29,425 million liters, 1.5 percent above year
2016 estimated levels as the Canadian oil and gas industry continues to recover.
Table 2: Canadian Gasoline and Diesel Fuel Demand
Fuel Use (million liters)
2010 2011 2012 2013 2014 2015 (e) 2016(f)
Gasoline Total 44,186 44,555 43,065 44,009 45,501 44,698 46,000
Diesel Total: 28,516 30,030 28,179 29,464 30,464 29,415 29,000
On-road 16,823 17,339 17,070 17,495 17,909 17,292 17,048
Agriculture 2,829 3,197 3,050 3,164 3,236 n/a n/a
Construction/Mining 3,558 3,815 3,728 3,750 3,706 n/a n/a
Shipping/Rail 3,129 3,477 3,346 3,203 3,282 n/a n/a
Industry 2,705 2,954 2,682 753 749 n/a n/a
Heating 2,706 2,696 2,250 1,508 1,331 n/a n/a
Jet Fuel n/a n/a n/a n/a n/a n/a n/a
Total Fuels 72,702 74,585 71,244 73,473 75,965 74,113 75,000
Notes & Sources:
CANSIM table 134-0004, industry sources
Table 3: Projection of Canadian Gasoline and Diesel Fuel Demand
Fuel Use Projections (million liters)
Calendar
Year
2016 2017 2018 2019 2020 2021 2022 2023
Gasoline
Total 46,000 45,540 45,085 44,634 44,187 43,746 43,308 42,875
Diesel
Total 29,000 29,435 29,877 30,325 30,780 31,241 31,710 32,186
Source: Industry sources
FUTURE POLICY DIRECTIONS
With the federal and provincial programs to provide support to the biofuels industry sunsetting in a
few years, the policymakers and regulators are considering new policy directions. With federal and
provincial budgets being tightened, a continuation of production incentives is unlikely. The
Canadian Renewable Fuels Association, the lobby organization which represents the Canadian
biofuels industry at the federal level, is lobbying for an increase of the renewable content in diesel
blend mandate to a 5 percent inclusion rate by 2020, believing this will encourage domestic
production increases. They are endorsing a federal policy platform for emerging technologies that
exempt cellulosic ethanol from federal and provincial fuel taxes. They also support policy measures
that maximize the economic value of renewable fuels and their products by monetizing reduced
carbon emissions. Their full strategy is available on their website at www.greenfuels.org.

The federal government will likely have to play an important role in unifying the various emissions
reductions policies the provincial governments are putting in place. This will likely include ways to
unify low carbon intensity requirements, new renewable content blend mandates. The federal
government may also play a role in helping fuel suppliers invest in technologies that could allow for
the higher usage of flex fuels and higher level blends of biofuels.
III. Ethanol
Ethanol Used as Fuel and Other Industrial Chemicals (Million Liters)
Calendar Year 2010 2011 2012 2013 2014 2015 2016 (e) 2017(f)
Beginning Stocks 108 128 127 130 131 131 131 131
Fuel Begin Stocks 108 128 127 130 131 131 131 131
Production 1,530 1,790 1,780 1,815 1,820 1,820 1,800 1,820
Fuel Production 1,445 1,700 1,695 1,730 1,730 1,725 1,750 1,750
Imports 449 1,008 1,087 1,119 1,157 1,234 1,000 1,000
Fuel Imports 11 450 803 1,079 1,143 1,094 1,000 1,000
Exports 94 77 53 57.00 63 68 65 65
Fuel Exports 0 0 0 0 0 0 0 0
Consumption 1,865 2,722 2,811 2,876 2,914 2,986 2,735 2,755
Fuel Consumption 1,436 2,151 2,495 2,808 2,873 2,819 2,750 2,750
Ending Stocks 128 127 130 131 131 131 131 131
Fuel Ending Stocks 128 127 130 131 131 131 131 131
Production Capacity
Number of Refineries 15 15 14 15 15 15 14 14
Nameplate Capacity 1,429 1,818 1,815 1,760 1,800 1,800 1,775 1,774
Capacity Use (%) 101% 94% 93% 98% 96% 96% 99% 99%
Co-product Production (1,000 MT)
DDGs 980 1,220 1,075 1,100 1,100 1,100 1,100 1,100
WDG 575 550 635 650 650 650 650 650
Corn Oil 2 2 3 6 6 6 6 6
Feedstock Use for Fuel (1,000 MT)
Corn 2,800 3,201 3,285 3,200 3,250 3,375 3,250 3,250
Wheat 770 970 850 1,000 1,000 1,000 950 1,000
Market Penetration (Million Liters)
Fuel Ethanol 1,436 2,151 2,495 2,808 2,873 2,819 2,750 2,750
Gasoline 44,186 44,555 43,065 44,009 45,501 44,698 46,000 45,540
Blend Rate (%) 3.2% 4.8% 5.8% 6.4% 6.3% 6.3% 6.0% 6.0%
Source: Canadian government and industry sources with FAS/Ottawa analysis

Production:
The ethanol industry has consolidated leaving only the bigger players and those that remain are
producing at capacity. A complete list of the plants can be found on the website of the Canadian
Renewable Fuels Association website (URL: http://ricanada.org/industry/industry-map/). Canadian
ethanol plants for the most part have operated at maximum capacity since 2009. Demand for fuel
ethanol has generally exceeded domestic supply due to the implementation of provincial mandates
and the federal blends mandates. The availability of the federal and provincial support programs has
been sufficient for the plants to operate positive cash flows despite spikes in feedstock prices and
competition from US imports.
The cellulosic plant ENERKEM was not included the domestic production numbers due to the fact
that it is not conventional ethanol; so also not included in the capacity. In addition, the plant is not
currently producing ethanol from municipal waste but instead is producing methanol because the
economics are better.
A plant closure in 2015 reduced nameplate production capacity, however, increased efficiencies in
the other plants will help lift production in 2016 to an estimated 1,750 million liters, 1.4 percent
above 2015 production levels. Production in 2017 is expected to remain level with that of 2016 due
to no new plants coming on line. Domestic production capacity will likely remain at 1.775 billion
liters unless economics change substantially. Canada, unlike the United States has not reached a
domestic production capacity that makes it possible to meet its blend mandates with domestic
production alone and therefore will continue to import the balance.
As domestic production has increased, so has the production of co-products. Corn oil production has
not followed the trend in the United States due in large part to the fact that Canada Feed Regulations
require that the Dried Distillers Grains (DDGs) have a minimum amount of energy content that
requires more oil remain in the DDGs. Guidance on these regulations can be found at the following
website: http://www.inspection.gc.ca/animals/feeds/regulatory-guidance/rg-
6/eng/1329275341920/1329275491608
Feedstock choice for ethanol plants has been driven by the availability of feedstock. Corn and
wheat are the main feedstock for bioethanol production in Canada. Feedstock use figures are based
on Post estimates, assuming plants use feedstocks grown in their vicinity. Ethanol plants in Ontario,
Quebec and Manitoba process corn as it is available in the vicinity of the ethanol plants. Ethanol
plants in Saskatchewan and Alberta process mostly feed wheat as there is limited corn production in
those regions.
There has been an increasing interest in developing corn varieties that can be grown in Western
Canada. As more corn varieties are developed with lower heat unit requirements, it is expected that
corn use for ethanol production in Saskatchewan and perhaps Alberta will increase. There has also
been increasing research on wheat varieties for industrial use. Currently, the need for high-yielding,
low-protein wheat by the livestock industry and the bioethanol plants put the industries in conflict
with each other when supplies of feed wheat are low. A large wheat crop is expected in 2016 (June
2016-July 31 2017) and therefore Post is assuming that higher supplies of feed wheat will be
available this year compared to the previous year.

In 2016, it is estimated that Post estimates that 77 percent of the domestic production of domestic
ethanol will be derived from corn, and 23 percent will be derived from wheat. Post forecasts that
this will likely remain relatively stable throughout 2017. Post assumes based on harvest reports that
there will be amble supplies of corn from the U.S. as well as domestic feed wheat will allow plants
much flexibility.
Consumption
A use mandate of 5 percent ethanol blended into the gasoline supply currently requires a 2.2 billion
liters of ethanol. However, production and trade statistics indicate that the national average blend
rate rose above the federally mandated level and was higher than most provincial mandates after
2012. Low corn prices contributed to low ethanol prices driving blend levels above the above the
minimum federal (and most provincial) blend level requirements. Financial incentives encouraging
“discretionary blending” (blending above required minimum levels) were strongest in 2013, but have
since moderated mainly due the stronger U.S. dollar (increases the cost in importing feedstock (corn)
and ethanol) and lower oil prices. In 2016 and 2017, blend levels for ethanol in gasoline are
expected to remain at 6.0 percent.
Trade:
Dedicated tariff codes to track ethanol for fuel began in 2012.
Imports: Lower discretionary blending tends to impact ethanol imports negatively. Year to date
trade data (January to May) under tariff lines 2207201210 and 22072109010 suggests that ethanol
for fuel imports in 2016 will decrease slightly from 2015 import levels of 1,093 million liters.
Imports in 2016 are expected to fall to 1,000 million liters due to decreased demand. The United
States will remain the main market (close to 100 percent share) from which Canada imports its fuel
ethanol. Imports for 2017 are forecast to remain at similar levels to 2016, assuming that there are no
changes to the blend mandates and lower gasoline prices are forecast to persist.
Exports: Canada exports less than 200 thousand liters of ethanol fuel per year due to the fact that
domestic production has not yet surpassed the amount required to the transportation cost,
feedstock/operating costs make the delivered cost of Canadian ethanol in the U.S. too high to be
competitive. Statistics Canada reports that in year 2015, Canada exported 104 thousand liters of fuel
grade ethanol, with 63% of it going to the United States. The year to date trade data suggests that
the volume exported in 2016 may increase slightly in 2016 over 2015 levels to reach 114 thousand
liters. Exports in 2017 are forecast to remain at similar levels since there is no significant increase in
production or decrease in demand that is expected to generate a significant surplus for export
markets.
Due to the North American Free Trade Agreement (NAFTA), there is no tariff on renewable fuels
produced in the United States and imported into Canada. However, Canada does have a tariff on
bioethanol imported from other countries such as Brazil ($0.05 per liter).
In terms of meeting standards, both corn and wheat ethanol plants in Canada do not have difficulty
meeting the Canadian quality standard (CGSB) which is more restrictive than the ASTM standard
used in the United States. As a result Canadian ethanol does not have difficulties entering the United
States. However, due to differences around minimum moisture content, not all US ethanol

producers can meet the Canadian standard and remain price competitive which can prevent access to
the Canadian market.
IV. Biodiesel and Hydrogenated Vegetable Oil (HVO)
Biodiesel & Renewable Diesel (HVO), Million Liters
Biodiesel
Calendar Year 2008 2009 2010 2011 2012 2013 2014 2015 2016 2017
Beginning Stocks 10 10 10 19 19 4 20 20 20 20
Production 95 110 115 120 100 140 290 340 400 550
Imports 20 15 100 170 261 307 269 300 270 270
Exports 95 105 110 80 85 123 225 240 380 300
Consumption 20 20 96 210 291 308 334 400 290 520
Ending Stocks 10 10 19 19 4 20 20 20 20 20
Production Capacity
Number of Plants 5 7 13 9 8 8 8 9 10 10
Nameplate Capacity 131 162 258 225 223 400 400 400 550 600
Capacity Use (%) 73% 68% 45% 53% 45% 35% 73% 85% 73% 92%
Feedstock Use for Biodiesel (1,000 MT)
Canola Oil 2 3 3 7 7 35 152 220 220 220
Animal Fats 85 78 78 63 26 30 36 37 37 37
Used Cooking Oil 3 20 27 46 65 65 84 143 293 343
Soybean oil 0 1 1 1 0 1 0 0 50 150
HVO
Imports 0 0 30 65 179 273 250 250 250 250
Consumption 0 0 30 65 179 273 250 250 250 250
Biodiesel + HVO
Beginning Stocks 10 10 10 19 19 4 20 20 20 20
Production 95 110 115 120 100 140 290 340 400 550
Imports 20 15 130 235 440 580 519 550 520 520
Exports 95 105 110 80 85 123 225 240 380 300
Consumption 20 20 126 275 470 581 584 650 540 770
Ending Stocks 10 10 19 19 4 20 20 20 20 20
Market Penetration, Biodiesel + HVO (Million Liters)
Biodiesel+HVO, on-road use
10 20 126 275 350 350 375 350 346 350
Diesel, on-road use 16,840 17,352 17,136 17,495 17,909 17,292 17,048 17,314
Blend Rate (%), on-road 0.7% 1.6% 2.0% 2.0% 2.1% 2.0% 2.0% 2.0%
Diesel, total use 28,516 30,030 28,179 29,464 30,464 29,415 29,000 29,435
Source: Canadian government and industry sources with FAS/Ottawa analysis

Production:
New production capacity has come on line in 2015 and 2016 as some plants that had been idle
started producing again and some plants came online. Until recently the industry has operated far
below full capacity. Only the three largest plants have consistently been able to operate at capacity
in the past 5 years and they export most of their product to the U.S. market.
In Canada, the biodiesel industry faces greater challenges than the ethanol industry. As in many
markets, unlike ethanol, biodiesel can rarely be supplied at a price equal to or below the price of the
fossil fuel it is blended with. In addition, Canadian biodiesel plants tend to be smaller than U.S.
plants and are therefore less able to capture economies of scale. There was also a mismatch in the
timing of incentives and the startup of the federal mandates. The renewable fuel mandate for diesel
came into full effect more than three years after the bioethanol mandate. Also, the smaller plants
tended to use feedstock types which were not able to meet the internal specifications of some
obligated parties.
The majority of biodiesel produced in Canada is exported to the United States due to the U.S.
biodiesel blenders’ tax credit and Renewable Identification Numbers (RINs). This topic is treated in
detail in the trade section.
In 2016, Canadian biodiesel production increased due to new production capacity coming on-line.
In 2017, production capacity is forecast to reach 600 million liters. Biodiesel production is
estimated to reach 550 million liters in 2016, an increase of 37 percent over 2015 levels. It is
forecast to reach 600 million liters in 2017. There is no HVO produced in Canada.
While biodiesel can be made from a variety of different feedstock, prices and availability are the
determining factors likely to be considered. Biodiesel quality standards do not specify the use of a
specific feedstock, however the cloud point of biodiesel varies on the level of free fatty acids which
depends on the feedstock used. Cloud point is an important fuel quality issue especially in colder
operating temperatures when fuels begin to gel and clog filters. As temperature falls, animal fat and
recycled oil-based biodiesels are first to reach cloud point, palm oil is next followed by soybean oil
biodiesel, and canola oil biodiesel is the last to gel. HVO performs even better than biodiesels, with a
cloud point similar to fossil diesels. Some obligated parties have feedstock requirements in their
internal purchasing specifications (often requiring that the feedstock be canola based). Many of the
early Canadian biodiesel plants were not built taking this into account and so the supply chains were
not optimized for the feedstocks that the market is looking for. This is changing with new plants
being designed accordingly and older plants being refitted to meet demand.
Primary feedstocks remain canola, animal fat, and recycled oils. Canola feedstock is expected to
account for nearly 29 percent of Canadian biodiesel production by the end of 2016 and in 2017.
Cooking oil is forecast to account for 49 percent of the feedstock in 2016 and 46 percent on 2017.
Soybean oil is expected to increase to 8 percent in 2016 and rise to 20 percent in 2017.
While canola use for biodiesel by-itself may be expensive, the co-products from biodiesel production
may make economic sense. Co-products include meal to be used in animal feed. There are limits on
the profitability of using canola as a feedstock if by-products are part of the everyday production
process. For example, off-seed canola may not be a suitable feedstock since this meal may not meet

quality standards. Despite these limitations, co-products and the production capacity of the plants
(these plants could potentially supply the vast majority of the federal 2 percent biodiesel mandate),
combined with provincial biodiesel mandates may make the industry profitable, despite higher
commodity prices.
Consumption:
The federal mandate pertains to “renewable fuel content” and is being met by a combination of
biodiesel and HVO. Post estimates that renewable diesel consumption will remain fall to 540
million liters in 2016 due to a decreased demand for diesel due in part to a slowing economy due to a
slowdown in the oil and gas sectors. Post forecast that demand will increase in 2017 as the economy
recovers and consumption will rise to 770 million tons to meet mandated requirement of renewable
content.
Trade:
Canada established an HS code for biodiesel in 2012, however trade of HVO and biodiesel enters
under a number of line. Post relied on industry contacts to provide more representative trade data
than was available through the biodiesel HS code on 3826.00.
Exports: The majority of biodiesel produced in Canada is exported to the United States due to the
U.S. biodiesel blenders’ tax credit and Renewable Identification Numbers (RINs). U.S. companies
that blend biodiesel with diesel to fulfill their obligation under the Renewable Fuel Standard (RFS)
can reduce their tax liability by US$1/gallon of biodiesel blended into the diesel they supply the
market. Through contractual arrangements with suppliers (both domestic and foreign) blenders share
a portion of this credit with suppliers. RINs have market value and accompany domestic and foreign
biodiesel made using EPA-approved pathways and therefore used by obligated parties to meet their
supply requirements under the RFS. Depending on market conditions and contractual arrangements
between producers and obligated parties, a portion of the value of RINs will be shared with
producers thus further incentivizing Canadian shipments to the United States. Both Canadian
production and exports to the United States trade have continued under contractual arrangements
that limit revenue loss if the tax credit is not reinstated. This credit has expired five times in the past
six years, only to be reinstated retroactively usual only for the past year. While risk persists, the
industry assumption is that the blenders’ tax credit will be reinstated retroactively indefinitely.
The U.S. blenders’ tax credit has the added trade impact of lowering to some degree the price of US
biodiesel delivered to the Canadian market and thus promoting U.S. shipments to Canada. This
incentive is maximized for each shipment when B99 is sold because 99 gallons of every 100 gallons
will receive this tax credit. However, since this credit is used by US blenders to offset taxes owed,
only a portion of the benefit will be passed forward in the marketing chain and thus lowering the
landed price of U.S. biodiesel in Canada. By law, RINs attached to exported biodiesel must be
retired and thus have no impact on US shipments to Canada.
Exports are forecast to rise in 2016 to reach 380 million liters thanks to increased production
capacity, increase in U.S. demand and a weaker Canadian dollar compared to the American dollar.

Exports are forecast to fall to 300 million liters in 2017 in response to more renewable diesel coming
on line in the United States.
The HVO comes under the same tariff code as biodiesel and most of the HVO imports into Canada
go into the province of British Columbia which has a biodiesel blend mandate but no commercial-
scale biodiesel production. Canada does not export any HVO due to the fact that it does not
produce any.
Imports:
Canada imports renewable diesel in order to meet the mandate for renewable content requirements.
V. Advanced Biofuels
While Canada is still not a significant producer of advanced biofuels, over the past few years it has
been making progress toward beginning full-scale operation plants. In 2009, Enerkem opened a
demonstration biofuels and biochemicals facility; in spring of 2012, this plant began production of
cellulosic ethanol via treated wood as feedstock at a 5 million liter capacity.
Enerkem completed its construction of a 38 million liter, cellulosic ethanol plant in Edmonton,
Alberta. Edmonton provides 100,000 dry metric tons of municipal solid waste to the plant as
feedstock.
Future plans for a full-scale, cellulosic ethanol plant in Varennes, Quebec have also been
announced. It would be a joint venture of Enerkem and Greenfield Ethanol Inc. and the Varennes
plant will use Enerkem’s proprietary thermochemical technology to convert non-recyclable waste
into 38 million liters of cellulosic ethanol per year.
There is also Atlantic Canadian interest in producing cellulosic from wood waste or other advanced
feedstock. For more information, please see the bel
Currently, HVO production in Canada is currently less economic than biodiesel, resulting in less
Canadian demand. There are currently no domestic HVO production facilities, and no plans
currently to build a commercial-scale facility in the future.
Biogas is also of increasing interest and investment. Much of the work for on biogas is being done
at the municipal level and for the most part is at the pilot project level. Two of the three bio-energy
projects that received funding under Alberta’s Biorefining Commercialization and Market
Development Program and the Bio-energy Infrastructure Development Program are for the
development of biogas as an alternative source of energy. Kingdom Farm Inc. received a significant
grant to review the potential for bio-gas from large scale Alberta hog operations. Highmark
Renewables Research also received a significant grant from AVAC Ltd. for a bio-gas feasibility
study at a large scale dairy facility. More information on the biogas industry in Canada can be found
on the website of the Biogas Association at the following
URL: http://www.biogasassociation.ca/bioExp/.

VI. Biomass for Heat and Power
Wood Pellets
The Canadian wood pellet industry is export oriented with production capacity far exceeding
domestic demand. Exports to the UK accounted for 74 percent of total exports. Wood pellets have
been going to Europe to meet the increased demand for biomass used in European heat and power
plants. In 2016, year to date data shows that there is also increased demand from Japan as it seeks to
reduced emissions in its heat and power sectors. The EU has been increasing funding for renewable
energy production, including doubling the financial allotment of funds to renewable energy in 2007.
In 2004, the EU announced that by 2020, 20 percent of its total energy consumption requirements
will be renewable energy sources, greatly higher than the 12.4 percent in 2010.
Canadian pellet consumption has remained relatively steady throughout the past several years, and
there are no official statistics reflecting possible increases. Low oil prices in 2015 and 2016 is
reducing demand from Canadian consumers, however, the Ontario government has turned to wood
pellets to meet the demand of its heat and power sectors. The Ontario government shut down coal-
fired power plants as a significant part in the quest to meet its emissions reduction targets.
Table 5
Wood Pellets (1,000 MT)
Calendar Year 2009 2010 2011 2012 2013 2014 2015 2016(
e)
2017(
f)
Beginning Stocks 70 71 71 101 148 151 163 165 60
Production 1,300 1,320 1,450 1,521 1,822 1,820 1,820 2,150 2,200
Imports 0 0 0 45 21 30 30 15 15
Exports 1,244 1,225 1,300 1,369 1,640 1,638 1,628 2,000 1,740
Consumption 95 95 120 150 200 200 220 270 450
Ending Stocks 31 71 101 148 151 163 165 60 85
Number of Plants 33 33 39 42 41 41 39 44 44
Nameplate
Capacity 2,083 2,082 2,900 3,175 3,282 3,681 3,400 3,575 4,135
Capacity Use (%) 62.4% 63.4% 50.0% 47.9% 55.5% 49.4% 53.5% 52.2% 53.2%
Source: Canadian government and industry sources with FAS/Ottawa analysis
Previously published reports:
2015 Annual Biofuels - Canada