Embed Size (px)
Citation preview
Can Policy Crowd Out Culture?
Natalie Bau∗
March 10, 2016
Preliminary and incomplete
Abstract
Policies may change the returns to transmitting cultural norms to the next genera-tion, unintentionally changing cultural practices. I study cultural norms that determinewhich children support their parents in their old age in Indonesia and Ghana. Consis-tent with a model where these norms play the dual role of increasing old age supportand ameliorating incomplete contracting problems between parents and children, par-ents invest more in the human capital of the children who are more likely to care forthem in old age. In both Indonesia and Ghana, the entry and expansion of pensionplans crowds out human capital investment in the children targeted by the norms.Moreover, consistent with a model where transmission of the norm is costly and par-ents choose how much to invest in transmitting the norm to their children, the pensionplans also crowd out the practice of the norms. Thus, policy crowds out culture.
∗University of Toronto, Contact: [email protected]. I gratefully acknowledge the support of theNSF graduate research fellowship and the Harvard Inequality and Social Policy Fellowship. I am deeplyindebted to my advisors, Asim Khwaja and Nathan Nunn, for their guidance and encouragement. I am alsograteful to Nava Ashraf, David Baqaee, Gustavo Bobonis, David Figlio, Claudia Goldin, Marco Gonzalez-Navarro, Christopher Jencks, Peter Morrow, Michel Serafinelli, Aloysious Siow, and Alessandra Voena, aswell as participants in the Harvard Development, Labor, and History Workshops, members of the HarvardProseminar on Inequality and Social Policy, and attendees of the University of Toronto Junior AppliedMicroseminar for their helpful comments. Eva Ng and Palermo Penano provided exceptional research assis-tance.
1

1 Introduction
Culture evolves in response to the conditions in which humans live (Boyd and Richerson,
1988). As Boyd and Richerson (1988) write, “humans adjust their [cultural] phenotypes in
response to their environments through learning and rational calculation” (p. 9). Indeed,
informal cultural institutions can substitute for complete markets and formal institutions to
facilitate better economic outcomes (for example, see Greif (1993)). Then, if modernization is
accompanied by more complete markets and formal institutions, it may have the unintended
consequence of crowding out traditional cultural practices. In this paper, I test whether this
is the case.
I study traditional, ethnicity-level norms that determine whether daughters (matrilocal),
sons (patrilocal), or neither gender (neolocal) live with their parents after marriage. I first
establish that country-level variation in these norms explains a substantial portion of the
cross-country gender gap (4 percent) in the World Economic Forum global gender gap rank-
ings, and this is entirely driven by these norms’ association with the economic and education
gaps (rather than the health or political gender gaps). I then focus on Ghana and Indonesia,
two countries where the census collects ethnicity-level data, and there is significant variation
in traditional practices across ethnic groups. In Indonesia, I find that matrilocal norms are
associated with greater human capital investment in daughters relative to their male siblings.
In Ghana, I find that patrilocal norms are associated with greater human capital investment
in sons relative to their female siblings. Both these findings are robust to extensive controls
for geographic location, parental socioeconomic status, and other traditional norms. These
findings are consistent with a theoretical literature that suggests that imperfectly altruistic
parents may invest less than is optimal in their children since their children cannot credibly
commit to repaying that investment in the future (Becker et al., 2012; Banerjee, 2004). If
matrilocal (patrilocal) norms increase the probability that daughters (sons) support their
parents in their old age, then these norms may increase parents’ incentives to invest in their
children’s human capital. This finding is also consistent with work by Ashraf et al. (2016),
which shows that bride price norms, which increase the returns on female education for
parents, incentivize parents to invest more in their daughters’ human capital.
I develop a model consistent with these results in which imperfectly altruistic parents
choose whether to educate their children. Furthermore, drawing on insights by Bisin and
Verdier (2001), I allow parents to make costly investments to transmit traditional cultural
practices to their children. Greater investment in norms increases the portion of a child’s
utility parents can extract for themselves in their old age. The model yields several novel pre-
2
dictions. The institution of a pension plan, by offering parents a more attractive way to save,
crowds out investment in the intergenerational transmission of the norm. Since investments
in the norm and in a child’s human capital are complements, as long as pre-existing education
levels are not too different between ethnic groups that practice matrilocality, patrilocality,
and neolocality, the institution of the pension plan will also crowd out human capital invest-
ment more for daughters in matrilocal societies (relative to neolocal and patrilocal societies)
and for sons in patrilocal societies (relative to neolocal and matrilocal societies).
In both Ghana and Indonesia, the data are consistent with these predictions. In In-
donesia, the 1977 introduction of a pension system, Astek, for workers at medium and large
formal sector enterprises (Sudomo, 1985; Muliati, 2013) crowds out human capital invest-
ment in matrilocal daughters who are more exposed to the pension plan in their childhood
relative to non-matrilocal daughters. Moreover, using a triple-interaction analysis, I exploit
additional geographic variation in the roll-out of Astek, and find that the effects of the
pension plan were largest among matrilocal daughters who would have been most exposed
to the plan. Additionally, in line with the model’s predictions, daughters who were more
exposed to the introduction of the pension plan in their childhood were less likely to practice
matrilocality (living in their parents’ household after marriage). Exploiting the expansion
of the pension plan to formal sector workers at smaller enterprises in 1992 (Purwoko, 1997)
yields qualitatively identical results.
I replicate these analyses in Ghana, exploiting the introduction of the 1972 pension policy,
which established the Social Security and National Insurance Trust (SSNIT) to administer
compulsory social security in establishments that employed at least 5 workers (Kumado and
Gockel, 2003). Patrilocal males who were exposed to the pension plan for longer received
fewer years of education than non-patrilocal males and were less likely to practice patrilocal-
ity (living in their parents’ household after marriage). Finally, an additional prediction of the
model is borne out in both Indonesia and Ghana: conditional on education, higher ability
girls (boys) in matrilocal (patrilocal) ethnic groups are more likely to practice matrilocality
(patrilocality) as adults, consistent with parents investing more heavily in transmitting the
norm to children for whom the returns to education are higher.
This paper contributes to several literatures. First, it provides additional empirical evi-
dence that parents are imperfectly altruistic and respond to strategic incentives when they
decide how much to invest in their children’s human capital (Ashraf et al.,2016; Becker et al.,
2012; Banerjee, 2004; Jensen and Miller, 2011). In particular, it complements empirical work
on the association between matrilocal and patrilocal practices and human capital investment
3
in Indonesia (Levine and Kavane, 2003; Rammohan and Robertson, 2012).
Additionally, this paper adds to a nascent literature on the importance of culture for
determining the effects of different policies (Ashraf et al., 2016; World Bank, 2015), as
well as the growing literature that examines the effects of gender-related cultural norms
(Fernandez, 2007; Fernandez, 2011; Fernandez and Fogli, 2009; Alesina et al., 2013; Giuliano,
2014; Alesina et al., 2015).
Most importantly, this paper contributes to the literature on the evolution of culture
and attitudes. Most empirical papers in this literature study the effects of large shocks that
likely affected culture along many dimensions. For example, Campa and Serafinelli (2015)
and Alesina and Fuchs-Schundeln (2007) study the effects of state socialism on attitudes.
Other papers study the effect of different historical empires (Peisakhin, 2010; Becker et al.,
2014; Grosfeld and Zhuravskaya, 2015; Wysokinskya, 2015). In contrast, this paper studies
relatively small policy changes, and finds that a model in which the transmission of norms is
costly and individuals are rational can predict heterogeneous responses to these policies by
different ethnic groups over just a few years. Moreover, these policies can lead to the rational
decline of traditional practices. This illustrates the role modernization and the policies that
accompany it can play in crowding out traditional cultural practices by eliminating the
incentives that underpinned those practices. Importantly, the crowd out of traditional norms
by the pension plans had the unintended consequence of reducing female (male) educational
attainment since, while pensions substituted for the role of matrilocal (patrilocal) norms
in guaranteeing old age support, they did not help resolve the intergenerational incomplete
contracting problem.
The paper is organized as follows. Section 2 provides more details on the origins and
distribution of patrilocal and matrilocal norms. Section 3 provides cross-country and within-
country evidence on the association of these norms with the gender gap. Section 4 presents
a model, consistent with the evidence from section 3, of parental investment in the presence
of imperfect altruism. Section 5 tests additional predictions of the model using the timing of
the institution and expansion of pension plans in Indonesia and Ghana, section 6 investigates
alternative explanations, and section 7 concludes.
2 Patrilocal and Matrilocal Norms
There are several theories in anthropology regarding the origins of matrilocal/patrilocal
norms. One of the fathers of kinship studies, Lewis Morgan, argued that early hunter gath-
4
erer societies were typically matrilineal (lineage and inheritance pass through the mother’s
line, and a son may inherit from his maternal uncle) because sexual promiscuity made it
difficult to identify a child’s father (Engels, 1942). While matrilocality does not always ac-
company matrilineality, these norms frequently appear together since matrilocality increases
the likelihood that a female’s son will be in the household to inherit. Engels (1942), writing
on Morgan’s theories, suggests that the switch to patrilineality (and patrilocality) occurred
after more monogamous practices made it possible to identify a child’s father. Engels argues
that this switch typically happened in conjunction with the increasing importance of private
property and productive capital, which men wished to pass on to their sons.
An alternative view is that matrilineality tends to occur in horticultural societies where
women often have a more dominant role in agriculture (Jones, 2011). Relatedly, Holden and
Mace (2003) argues that patrilineality (and therefore, patrilocality) may be more likely to
evolve in pastoral societies with access to cattle, where men play a larger role in agricultural
production. Jones (2011) also suggests that matrilocality may evolve in societies which need
greater cross-cutting ties to strengthen neighboring communities inside a group, since ties
of mutual obligation are “carried by the dominant sex” in matrilocal societies. That is,
households send their sons to other households through marriage, generating stronger ties
between the households. Jones (2011) suggests that these types of ties tend to be more
important at a “cultural frontier,” where a group faces a threat from the outside.
Some anthropologists have also linked matrilineality to dowry and patrilineality to bride
price. For example, Vroklage (1952) suggests that bride price, a payment from the family of
the husband to the family of the bride at the time of marriage, compensates the family of the
bride for taking the daughter from their lineage group. If bride price is positively associated
with female education (Ashraf et al., 2016), to the extent that this hypothesis is true, the
negative correlation between bride price and female education would also negatively bias
estimates of the association between matrilocality and female education. However, Boserup
(1970) has hypothesized that polygamy is also linked with bride price since female agriculture
makes wives more valuable (resulting in both more polygamy and more bride price). In this
case, if matrilocality is negatively associated with bride price, it may also be negatively
associated with polygamy.
While these hypotheses are consistent with the idea that norms may endogeneously re-
spond to changing environmental factors, most evidence suggests that until recently norms
have been quite sticky. While it is difficult to trace whether a group was matrilocal or
patrilocal during different periods, anthropologists have made progress in tracing the evolu-
5

tion of norms. They use language trees which show how and when the languages of different
groups bifurcated. Combining this information with information on the contemporary norms
practiced by groups, anthropologists have used Bayesian algorithms to estimate the prob-
ability that a culture was, for example, matrilineal at each node of the tree (for example,
see Holden and Mace (2003)). Work by Holden and Mace (2005) suggests that even when
matrilocal norms changed endogeneously to patrilocal norms in response to the use of cat-
tle, the change took on the order of five hundred years to occur. Similarly, according to
Jones (2011), the balance of evidence suggests that the cultures that today make up Central
Africa’s “matrilineal belt” were likely matrilineal from early in their history.
I proxy for an ethnicity’s modern practices using the practices recorded in the Ethno-
graphic Atlas (Murdock, 1967). Following Ashraf et al. (2016) and Alesina et al. (2013),
I use the Ethnologue (Gordon, 2005) to match the ethnicity or language data collected by
the Ghana and Indonesia censuses with the ethnicity-level data on cultural norms available
in the Ethnographic Atlas. Of the 1,235 ethnic groups for whom data on ethnic norms are
available in the Ethnographic Atlas, 880 are traditionally patrilocal (71 percent), 155 are
traditionally neolocal (13 percent) and 200 are traditionally matrilocal (16 percent). Figures
1 and 2 map the district-level percent of individuals in the census who are matrilocal (in
Indonesia) and patrilocal (in Ghana). While the norms are not uniformly distributed in
either country, there is still a great deal of geographic variation in matrilocal and patrilocal
practices.
Using the Ethnographic Atlas, I estimate the correlations between patrilocality and ma-
trilocality and other potentially important norms in appendix table A1. Consistent with
some of the theories from the anthropological literature, patrilocality and matrilocality are
strongly correlated with bride price, polygamy, and patrilineality and matrilineality across
ethnic groups. Consequently, when I present my results, I will always present versions that
control for bride price, polygamy, male dominated agriculture, and aboriginal plow use (the
norms most frequently linked with gender bias).
However, the correlations between norms may be weaker within countries where the
traditional practices of the populations are more homogeneous. In Indonesia, I match more
than 800 languages in the 2010 census to 53 ethnic groups in the Ethnographic Atlas. Of
these, 67 percent are patrilocal (29), 23 percent are neolocal (10), and 9 percent are matrilocal
(4). I focus on variation between matrilocality and patrilocality/neolocality, since groups
that primarily practice patrilocality or neolocality in Indonesia often practice the other as a
6

secondary practice (Lebar, ed, 1972).1 In Ghana, I match 58 ethnic groups in the 2000 census
to 24 groups in the Ethnographic Atlas. According to this match, 22 groups (92 percent)
are patrilocal and 2 (8 percent) are matrilocal. Therefore, I focus on the margin between
patrilocality and matrilocality.2 Table A2 reports the correlations between matrilocality
and other norms within Indonesia and between patrilocality and other norms within Ghana.
Once we restrict to within-country variation, there is little correlation between matrilocality
or patrilocality and other norms. In fact, there is no variation in Ghana in polygamy (all
groups are historically polygamous) and aboriginal plow use (no groups had the plow). Only
matrilineality is still strongly correlated with matrilocality.3
Unfortunately, to date, there has been little work on how matrilocal and patrilocal norms
are related to other forms of gender bias besides differences in human capital investment.
However, one paper does shed light on this question. Using data from African Demographic
and Health Surveys for 18 countries, Alesina et al. (2015) study whether patrilocality4 pre-
dicts either actual violence against women or attitudes toward violence. In both cases, they
find no correlation between patrilocality and violence.
In table 1, I test whether historical norms are predictive of modern behavior in the 2000
Ghana census and the 2010 Indonesia census. I code a household as practicing matrilocality
if a married daughter lives in the same household as her parents. Similarly, a household prac-
tices patrilocality if a married son lives in the same household as his parents. In principle,
this is a lower-bound measure of the prevalence of matrilocality or patrilocality since it will
not capture cases where a child lives in the same compound or the same village as a parent
but does not live in the same household as defined by the census.5 Odd number regressions
1This choice also follows from the fact I created a secondary match of ethnicities in the 2010 Indonesiacensus to ethnic norms using Lebar, ed (1972) and Strouthes (1993). In this match, relatively few householdswere patrilocal, consistent with the fact that these ethnic groups in fact follow a mix of practices. Incontrast, practice of matrilocality in both matches is highly correlated, and all the results I present usingthe Ethnographic Atlas match replicate using the alternative match.
2The coding of patrilocality in this match is strongly correlated with a second match between census-levelethnicities and ethnic norms that I constructed using Gil (1964) and Asante and Mazama, eds (2009). Thissecond match, however, codes the groups that are matrilocal in the match from the Ethnographic Atlas asneolocal. Thus, I focus on comparing patrilocal groups to groups that may be matrilocal or neolocal. Allthe results using the match from the Ethnographic Atlas replicate using this second match as well.
3Matrilineality does not necessarily imply that daughters inherit. Most frequently, it indicates that sonsinherit from their maternal uncles. Thus, in Status of Women in Pre-Industrial Societies, Whyte, ed (1978)notes that matrilineal norms need not imply that women will be better off, writing, “It is perfectly possiblefor the position of women to be as low as the greatest misogynist would desire” (p. 7).
4Their paper uses the alternative term for patrilocality, virilocality.5Beaman and Dillon (2012) show that the determining the exact boundaries of a household in low income
countries is difficult, and the choice of boundaries may affect the results of economic analysis.
7

report the coefficient of an indicator variable for whether the household head belongs to a
traditionally matrilocal or patrilocal ethnicity without any controls. Even number columns
control for other potentially important norms: bride price, polygamy, male dominated agri-
culture, and aboriginal plow use. In both cases, historical norms are predictive of modern-day
practices. In Indonesia, the matrilocal norm increases the likelihood a household practices
matrilocality by 2.3 percentage points (a 28 percent increase on a base of 8.1 percent). In
Ghana, the patrilocal norm increases the likelihood a household practices patrilocality by
3.2 percentage points (a 46 percent increase on a base of 7 percent).
This paper assumes that matrilocal norms increase the probability of old-age support
by daughters and that patrilocal norms increase the probability of old age support by sons.
I take this view because a daughter or a son living with a parent pays less transfer costs
in providing resources to a parent, may share “public” goods with a parent like housing,
can be monitored by the parent to ensure that they transfer resources, and can provide
care that may be difficult to purchase through the market. Reassuringly, the policy dis-
cussion surrounding pension plans in Indonesia is consistent with this interpretation. In
discussions of the establishment and expansion of pension plans in Indonesia, both Muliati
(2013) and Sudomo (1985) mention the important role that traditional family practices play
in guaranteeing old age support. Muliati (2013), in particular, argues that pension plans
are increasingly necessary due to changes in “social culture”, writing, “Urbanization and the
decline in the number of children have changed the family and social structure in Indone-
sia... Children are also leaving their villages and moving to cities in search of more lucrative
employment opportunities. Consequently, the family support system is not as robust as it
was in the past, and there is a greater need for the State to assist with the establishment
of programs and institutions to care for the elderly.” Similarly, Sudomo (1985) writes that
government-run pension plans are increasingly important because “the modern family in
Indonesia tends to be a small, nuclear family, with much weaker ties to grandparents and
other relatives than existed in traditional rural society.”
3 Gender Gap
In this section, I provide evidence that matrilocality and patrilocality affect both cross-
country gender gaps using data from the 2013 World Economic Forum Gender Gap Scores
and within-family gender gaps in Ghana and Indonesia. This association motivates the
model in the next section, which allows human capital investment to depend on parents’
8

perception of whether a child will care for them in their old age.
3.1 Cross-Country Evidence
To test whether patrilocality is associated with cross-country gender gaps, I combine country-
level data on the percent of the population that is traditionally patrilocal based on a match
to the Ethnographic Atlas created by Alesina et al. (2013) with country-level data on gender
gaps from the 2013 World Economic Forum. The World Economic Forum reports measures of
gender gaps along 4 sub-indices, as well as an overall index. These sub-indices are “Economic
Participation and Opportunity,” “Educational Attainment, “ Health and Survival,” and
“Political Empowerment.”6
Using this country-level data set, I estimate the following regression
yc = β0 + β1incomec + β2income2c + γPerPatrilocalc + αr + εc, (1)
where c denotes a country and yc, the outcome variable may be the combined gender gap
score, the economics score, the education score, the health score, or the political score;
incomec is country c’s gdp per capita, PerPatrilocalc is the percent of a country’s popula-
tion that belongs to historically patrilocal ethnic groups, and αr is a continent fixed effect.
Table 2 presents the estimates from these regressions. Column 1 estimates equation 1 for the
aggregate score but omits the independent variable PerPatrilocalc. Column 2 re-estimates
the regression in column 1 including Per Patrilocalc. The inclusion of PerPatrilocalc in-
creases the percentage of the variation explained by the regressors by 4 percentage points.
Additionally, moving from 0 to 100 percent of the population belonging to traditionally
patrilocal ethnicities decreases the overall gender gap score by 5 percent. The remaining
columns estimate equation 1 for the economics (column 3), education (column 4), health
(column 5), and political scores (column 6). The large and significant effect of patrilocality
6The “Economic Participation and Opportunity Index” is based on measures of the ratio of female laborforce participation over male labor force participation; female wage over male wage for similar work; theratio of female estimated earned income over male estimated earned income; the ratio of female over malelegislators, senior officials and managers; and the ratio of female over male professional and technical workers.The “Educational Attainment” index is based on female over male literacy; female net primary enrollmentover male net primary enrollment; female net secondary enrollment over male net secondary enrollment; andfemale gross tertiary enrollment over male gross tertiary enrollment. The “Health and Survival Index” isbased on the sex ratio at birth and the ratio of female health life expectancy over male healthy life expectancy.Finally, the “Political Empowerment” index is composed of the ratio of females with seats in parliament overmales with seats; the ratio of females at the ministerial level over males; and the ratio of years of a femalehead of state (last 50 years) over the male value. For more information on these indices, see Bekhouche etal. (2013).
9

on the overall gender gap in column 2 appears to be driven by its effect on the economics gap
(column 3) and the education gap (column 4). In contrast, patrilocality does not significantly
affect the health or political gender gaps. This is consistent with the idea that patrilocality
largely affects gender gaps through differences in human capital investments. Now that we
have established that patrilocality is associated with country-level gender gaps, we consider
the association between patrilocality and matrilocality and gender gaps in human capital
within within countries.
3.2 Within-Country Evidence
To estimate the association between patrilocality and matrilocality and within households
differences in school enrollment in Indonesia and Ghana, I use the 2010 census data in
Indonesia and the 2000 census data in Ghana from Minnesota Population Center (2011) to
estimate:
enrollie = β1genderi + β2genderi × norme + τXi +HHj + εie, (2)
where i denotes a child of the household head between the ages of 5 and 22, e denotes an
ethnic group, enrollie is an indicator variable equal to 1 if a child is enrolled in school and
0 otherwise, genderi is an indicator variable for the relevant gender (female in Indonesia
and male in Ghana), norme is an ethnicity-specific indicator variable for whether an ethnic
group historically practiced the relevant norm (matrilocality in Indonesia and patrilocality
in Ghana), and HHj is a household fixed effect. Xi contains child-specific controls and de-
pending on the specification, includes age fixed effects, controls for parent educational status
interacted with child gender,7 controls for geographic region (province indicator variables in
Indonesia and district indicator variables in Ghana) interacted with gender, and indicators
for aboriginal plow use, bride price customs, male dominated agriculture, and polygamy
traditions interacted with child gender.
Tables A3 and A4 document summary statistics for the Indonesia and Ghana census
data. The first 9 columns of table A3 provide information on the mean, standard deviation,
and number of observations for a variety of child and parent characteristics in Indonesia.
Column 10 tests for balance between the matrilocal and non-matrilocal groups, regressing
each of the child and parent characteristics on an indicator for matrilocality and controlling
7These consist of indicator variables for whether the father has completed primary school, whether thefather’s spouse has completed primary school, whether the father works in a high skill sector, whether thefather’s spouse works in a high skill sector, whether the father works in agriculture, whether the father’sspouse works in agriculture, and whether the household head is male.
10
for the ethnicity controls and province fixed effects. Along most dimensions, matrilocal and
non-matrilocal groups are similar. Fathers are no more educated in matrilocal groups than
in patrilocal groups and mothers are no more likely to work in agriculture or in high skill
industries. Matrilocal and non-matrilocal women aged 25 to 45 have statistically indistin-
guishable birth rates after controlling for province and ethnicity fixed effects (2.523 children
on average in matrilocal ethnic groups and 2.065 children on average in non-matrilocal eth-
nic groups). The percent of female children in matrilocal ethnic groups (48.2 percent) and
non-matrilocal ethnic groups (48.2 percent) are also not statistically significantly different.
The only significant difference is that fathers are 12 percentage points more likely to be
employed in agriculture in matrilocal groups. Table A4 provides analogous summary statis-
tics for Ghana. In Ghana, there are strong differences between patrilocal and non-patrilocal
groups. Across measures, patrilocal parents are consistently less likely to be in high skill in-
dustries, more likely to be employed in agriculture, and less likely to be educated. However,
as before, there is no statistically significant difference between fertility in patrilocal groups
(3.757 on average) and non-patrilocal groups (3.589 on average) or the percent of children
that are female at birth in patrilocal (48.5 percent) and non-patrilocal (48.8 percent) groups.
Overall, the comparison between matrilocal and non-matrilocal groups in Indonesia appears
to be cleaner than the comparison between patrilocal and non-patrilocal groups in Ghana.
Nonetheless, all the findings in Indonesia replicate in Ghana as well.
The estimates from regression equation 2 are in table 3. As the upper-half of the table
shows, females in matrilocal households are 1.3-2 percentage points more likely to be enrolled
in school relative to their brothers when compared to females in non-matrilocal households
in Indonesia. The effect size is stable and significant (p < 0.01) across all four specifications.
Neither household socioeconomic status (column 2), alternative ethnic norms (column 3),
nor geographic location in Indonesia (column 4) appear to explain this result. The estimates
are similar in Ghana. Patrilocal males are 1 percentage point more likely to be enrolled
in school relative to their sisters when compared to non-patrilocal males in Ghana. While
the effect size is not significant in the first 2 columns, the inclusion of the ethnicity level
norms and the district by gender fixed effects in columns 3 and 4 respectively increases the
precision of the estimates and the coefficient is significant at either the 5 or 1 percent level.
Table A5 reports the regression coefficients using the alternative ethnographic data on post-
marriage residency practices by ethnicity; the results are broadly consistent with those in
table 3.8 Both the cross- and within-country regression results suggest that norms which
8Unlike the results from the match with the Ethnographic Atlas, the Indonesia results are not robust
11

determine which child supports his or her parents in their old age may be linked to human
capital investment. In the next session, I present a model in which matrilocal (or patrilocal)
norms help resolve intergenerational incomplete contracting problems between parents and
children, explaining this association. Additionally, the model allows me to derive several
new predictions regarding how these norms will interact with pension plan policies.
4 Model
The evidence in the previous section suggests that matrilocality is associated with greater
human capital investments in daughters relative to sons and that patrilocality is associated
with greater human capital investment in sons relative to daughters. In this section, I develop
a model that explains this relationship in which norms play a dual role; they help resolve
the incomplete contracting problem between parents and children, and they allow parents
to save for old age. In this model, imperfectly altruistic parents decide how much to invest
in the human capital of their children. Since children cannot credibly commit to repay their
parents in the future, norms which allow parents to extract a greater portion of the returns
to their human capital investment will increase these investments. To develop predictions
about how the practice of norms evolves over time, I further allow parents to undertake
costly investments in transmitting norms to their children, as long as the parents belong to
an ethnic group that traditionally practices the norm.
Under reasonable assumptions, this model has two main predictions. First, the institution
and expansion of pension plans will crowd out human capital investment more in daughters
(sons) in matrilocal (patrilocal) ethnic groups than non-matrilocal (non-patrilocal) ethnic
groups. Second, the institution and expansion of the pension plan will not only crowd out
human capital investment; it will also crowd out intergenerational transmission of the norm.
Thus, the model provides a mechanism for the role policy can play in crowding out cultural
practices.
4.1 Setup
Without loss of generality, I focus on the comparison between a matrilocal household and a
neolocal household, but all the predictions of the model will be symmetric for the compar-
to the inclusion of province fixed effects. The alternative match is only able to determine norms for 23ethnic groups instead of the 50 in the main match, leading to a reduction in the within-province variationin traditional ethnic norms.
12
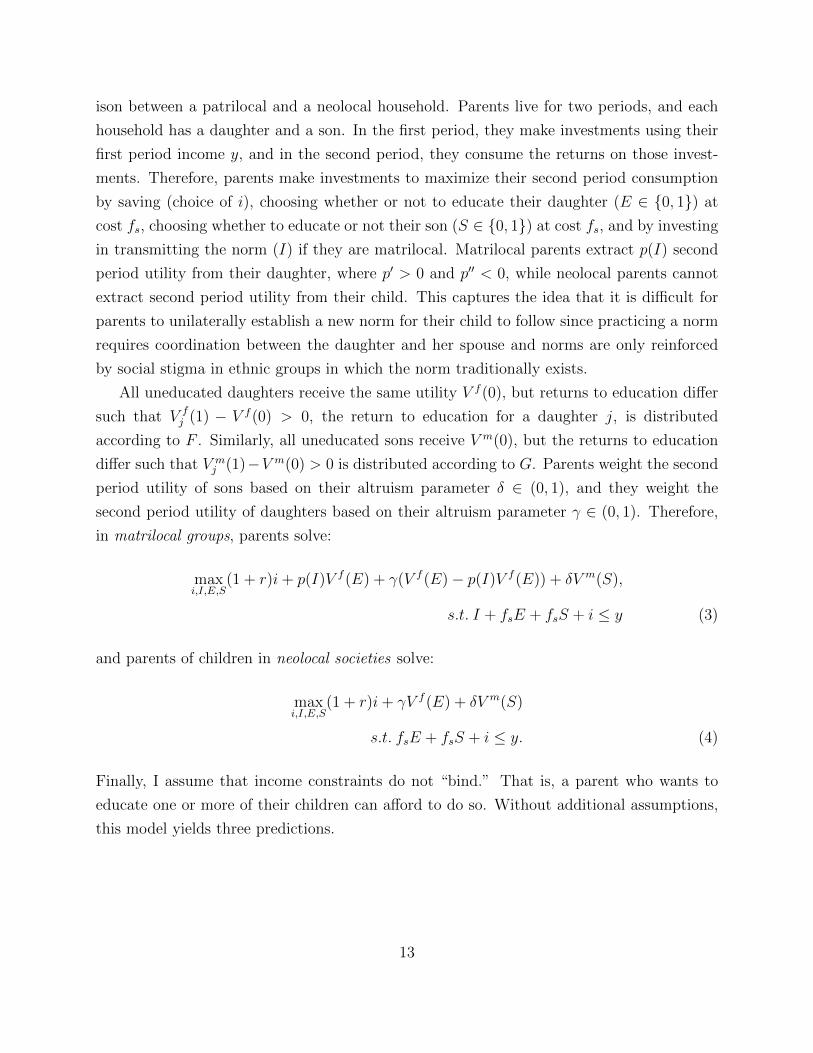
ison between a patrilocal and a neolocal household. Parents live for two periods, and each
household has a daughter and a son. In the first period, they make investments using their
first period income y, and in the second period, they consume the returns on those invest-
ments. Therefore, parents make investments to maximize their second period consumption
by saving (choice of i), choosing whether or not to educate their daughter (E ∈ {0, 1}) at
cost fs, choosing whether to educate or not their son (S ∈ {0, 1}) at cost fs, and by investing
in transmitting the norm (I) if they are matrilocal. Matrilocal parents extract p(I) second
period utility from their daughter, where p′ > 0 and p′′ < 0, while neolocal parents cannot
extract second period utility from their child. This captures the idea that it is difficult for
parents to unilaterally establish a new norm for their child to follow since practicing a norm
requires coordination between the daughter and her spouse and norms are only reinforced
by social stigma in ethnic groups in which the norm traditionally exists.
All uneducated daughters receive the same utility V f (0), but returns to education differ
such that V fj (1) − V f (0) > 0, the return to education for a daughter j, is distributed
according to F . Similarly, all uneducated sons receive V m(0), but the returns to education
differ such that V mj (1)−V m(0) > 0 is distributed according to G. Parents weight the second
period utility of sons based on their altruism parameter δ ∈ (0, 1), and they weight the
second period utility of daughters based on their altruism parameter γ ∈ (0, 1). Therefore,
in matrilocal groups, parents solve:
maxi,I,E,S
(1 + r)i+ p(I)V f (E) + γ(V f (E)− p(I)V f (E)) + δV m(S),
s.t. I + fsE + fsS + i ≤ y (3)
and parents of children in neolocal societies solve:
maxi,I,E,S
(1 + r)i+ γV f (E) + δV m(S)
s.t. fsE + fsS + i ≤ y. (4)
Finally, I assume that income constraints do not “bind.” That is, a parent who wants to
educate one or more of their children can afford to do so. Without additional assumptions,
this model yields three predictions.
13

4.2 Model Predictions
The first of the model’s predictions, below, explains the results in section 3.
Proposition 4.1. Female education rates are higher relative to male education rates in a
matrilocal ethnicity than in a neolocal ethnicity. That is, αfMAT − αmMAT > αfNEO − αmNEO,where αsnorm is the share of gender s and ethnic norm norm that is educated.
Proof. See mathematical appendix. Proposition 4.1 tells us that enrollment rates will
be higher for females relative to males in matrilocal societies than non-matrilocal societies.
This is consistent with the estimates in tables 2 and 3. The mechanism is simple, since
parents are imperfectly altruistic, they may not educate their children even if the returns
exceed the costs. Matrilocal norms increase the returns to educating a female child for the
parents, lowering the minimum returns to education needed for the parents to educate the
child. In contrast, the incentives for matrilocal and neolocal ethnic groups to invest in boys
are the same.
Proposition 4.2. Investment in the norm I∗ is decreasing in the interest rate r.
Proof. See mathematical appendix. This proposition captures the fact that when the
returns to savings go up (for example, because of the creation or expansion of pension plans),
intergenerational transmission of matrilocality should decrease. Intuitively, this is because
as the returns to savings increase, parents will substitute from investing in transmitting the
norm to investing in savings.
Proposition 4.3. I∗E is increasing in V fj (1), a daughter’s returns to education.
Proof. See mathematical appendix. This proposition captures the simple idea that
parents will want to invest more in transmitting the norm to children with higher returns to
education, since these children will have greater future utility to extract.
The final proposition shows that pension plans will reduce education more for matrilocal
females than non-matrilocal females. This proposition is true under one additional assump-
tion:
Assumption 4.1.
fs + I∗1 − I∗0 +p(I∗0 )
p′(I∗0 )
(1 + 1+r
p′(I∗0 )(1−γ)V f (0)
)fs
>F ′(
(1+r)fsγ
)F ′(
1+rγ
(fs + I∗1 − I∗1 −p(I∗1 )
p′(I∗1 )+
p(I∗0 )
p′(I∗0 ))) ,
14
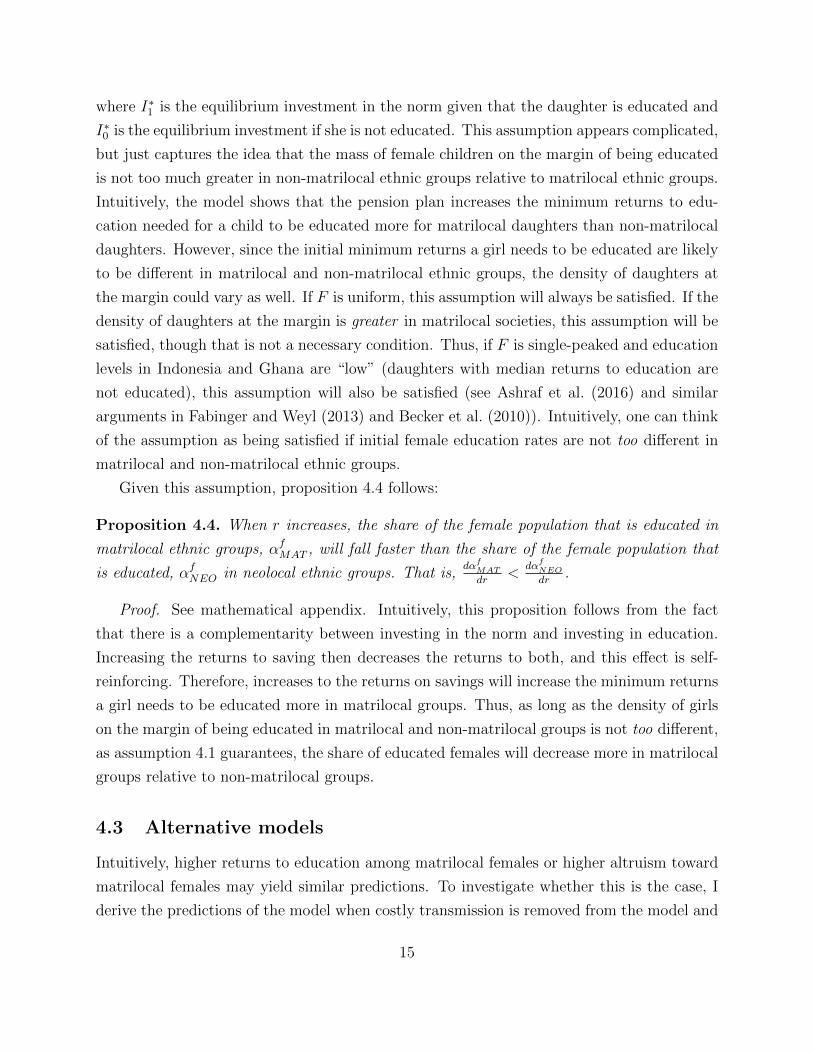
where I∗1 is the equilibrium investment in the norm given that the daughter is educated and
I∗0 is the equilibrium investment if she is not educated. This assumption appears complicated,
but just captures the idea that the mass of female children on the margin of being educated
is not too much greater in non-matrilocal ethnic groups relative to matrilocal ethnic groups.
Intuitively, the model shows that the pension plan increases the minimum returns to edu-
cation needed for a child to be educated more for matrilocal daughters than non-matrilocal
daughters. However, since the initial minimum returns a girl needs to be educated are likely
to be different in matrilocal and non-matrilocal ethnic groups, the density of daughters at
the margin could vary as well. If F is uniform, this assumption will always be satisfied. If the
density of daughters at the margin is greater in matrilocal societies, this assumption will be
satisfied, though that is not a necessary condition. Thus, if F is single-peaked and education
levels in Indonesia and Ghana are “low” (daughters with median returns to education are
not educated), this assumption will also be satisfied (see Ashraf et al. (2016) and similar
arguments in Fabinger and Weyl (2013) and Becker et al. (2010)). Intuitively, one can think
of the assumption as being satisfied if initial female education rates are not too different in
matrilocal and non-matrilocal ethnic groups.
Given this assumption, proposition 4.4 follows:
Proposition 4.4. When r increases, the share of the female population that is educated in
matrilocal ethnic groups, αfMAT , will fall faster than the share of the female population that
is educated, αfNEO in neolocal ethnic groups. That is,dαf
MAT
dr<
dαfNEO
dr.
Proof. See mathematical appendix. Intuitively, this proposition follows from the fact
that there is a complementarity between investing in the norm and investing in education.
Increasing the returns to saving then decreases the returns to both, and this effect is self-
reinforcing. Therefore, increases to the returns on savings will increase the minimum returns
a girl needs to be educated more in matrilocal groups. Thus, as long as the density of girls
on the margin of being educated in matrilocal and non-matrilocal groups is not too different,
as assumption 4.1 guarantees, the share of educated females will decrease more in matrilocal
groups relative to non-matrilocal groups.
4.3 Alternative models
Intuitively, higher returns to education among matrilocal females or higher altruism toward
matrilocal females may yield similar predictions. To investigate whether this is the case, I
derive the predictions of the model when costly transmission is removed from the model and
15

either altruism towards females or the returns to education for females are allowed to vary
systematically with matrilocality. The removal of the transmission mechanism will mean
that I can no longer derive propositions 4.2 and 4.3 since I no longer model the practice of
the norm.
4.3.1 Differential altruism
In this sub-section, I allow the weight that parents put on girls’ utilities to differ between
matrilocal and non-matrilocal ethnic groups so that γMAT > γNEO. Thus, matrilocal parents
solve the maximization problem
maxi,I,E,S
(1 + r)i+ γMATVf (E) + δV m(S)
s.t. I + fsE + fsS + i ≤ y,
and neolocal parents solve
maxi,I,E,S
(1 + r)i+ γNEOVf (E) + δV m(S)
s.t. I + fsE + fsS + i ≤ y.
Given these maximization problems, parents will educate daughters when
V fj (1)− V f (0) ≥ (1 + r)fs
γnorm.
Thus, the share of educated daughters will be αnorm = 1− F ( (1+r)fsγnorm
). Since, γMAT > γNEO,
the share of daughters receiving education will be higher in matrilocal societies. Since, as
before, the problem for boys is the same in matrilocal and neolocal societies, this result yields
the same prediction as proposition 4.1. Now, I consider whether differential altruism can
also produce proposition 4.4. To do so, I differentiate αNORM = 1− F ( (1+r)fsγNORM
) with respect
to r. The resulting expression is
dαnormdr
= − fsγnorm
F ′((1 + r)fsγnorm
).
16

Therefore, dαMAT
dr< dαNEO
drif and only if
γNEOγMAT
>F ′( (1+r)fs
γNEO)
F ′( (1+r)fsγMAT
). (5)
As before, without further assumptions, it is ambiguous whether the derivative of the share
of educated females with respect to r is larger in magnitude for matrilocal or non-matrilocal
ethnic groups. However, much stronger assumptions are needed to ensure that the magnitude
of the effect is larger for matrilocal groups in this model. Since γMAT > γNEO, the left hand-
side of equation 5 is less than 1. Therefore, for this condition to be true, the mass of matrilocal
daughters on the margin of receiving education must be greater than the mass of neolocal
daughters at the margin. However, this is not sufficient: the differences in the masses must
be great enough to compensate for the fact that matrilocal societies increase the minimum
returns to education at which a daughter is educated less than neolocal societies in response
to an increase in r. Even assuming that the distribution of the returns to education is single-
peaked and education rates are low – an assumption that is sufficient but not necessary to
deliver proposition 4.4 – will not ensure that increasing r crowds out education more for
matrilocal females. Indeed, I am not aware of any plausible assumptions that would deliver
this result.
4.3.2 Differential returns to education
To model differential returns, I again assume that γMAT = γNEO and instead assume that
the distributions of the returns to education are different for matrilocal and non-matrilocal
daughters. To model the idea that the returns to education are greater in matrilocal societies,
I assume thatFMAT first order stochastically dominates FNEO. Under this assumption, it is
straightforward to show that
αMAT = 1− FMAT ((1 + r)fs
γ)
and
αMAT = 1− FNEO((1 + r)fs
γ).
First order stochastic dominance implies that αMAT > αNEO, again yielding the same pre-
diction as proposition 4.1. Differentiating with respect to r and rearranging the expressions
17

shows that dαMAT
dr< dαMAT
drif and only if
F ′NEO((1 + r)fs
γ) > F ′NEO(
(1 + r)fsγ
).
Essentially, matrilocal and non-matrilocal ethnic groups increase the minimum returns needed
to be educated by the same amount in response to an increase in r. Therefore, for this ex-
pression to be true, there must be more matrilocal females at the margin of being educated
than non-matrilocal females. As before, strong assumptions are needed to deliver proposi-
tion 4.4. For example, if the FMAT distribution is identical to the FNEO distribution except
for a mean-shift to the right, then the assumption that returns are single-peaked and that
education rates are low would again deliver this result. However, this assumption may not
be attractive when studying the 1992 pension plan expansion since by the mid-1990s, female
primary completion rates were quite high in Indonesia. The World Bank development indi-
cators suggest that female primary completion in 1995, the earliest year for which data was
available, was 97 percent.
To summarize the findings of this subsection, both greater altruism toward females by
matrilocal ethnic groups and great returns to female education for matrilocal ethnic groups
can produce proposition 4.1. However, much stronger assumptions and perhaps implausible
assumptions are needed to produce proposition 4.4, the prediction that the pension plan
expansion will crowd out education for matrilocal females more than non-matrilocal females.
Finally, since neither of these models endogenize the transmission of the norm, they cannot
produce proposition 4.2, the prediction that the pension plan will crowd out the practice of
the norm, or proposition 4.3, the prediction that higher ability daughters will be more likely
to practice matrilocality.
5 Additional Predictions
In this section, I test the additional predictions of the model. In the first sub-section, I
explore the effects of pension plan entry and expansions on Indonesia and Ghana to test
propositions 4.2 and 4.4. I first rely on cohort-level variation in exposure to the pension
plan creation or expansion to provide evidence that cohorts who were more exposed to the
expansion received less education. Since the estimates using cohort-level variation may be
driven by time-trends, I then focus on the creation of Astek and exploit finer geographic
variation in the administration of the Astek pension plan. In the second sub-section, I test
18

whether higher ability children are more likely to live with their parents as proposition 4.3
suggests.
5.1 Pension Plan Entry and Expansion
To test whether pension plans indeed crowd out investment in human capital and in the
transmission of the norm differentially in matrilocal (patrilocal) societies relative to non-
matrilocal (non-patrilocal) societies, I study the effects of three pension plan-related policy
changes. The first is the establishment of formal sector pension plans in Indonesia under
a government-owned corporation, Astek, in 1977. Astek developed accident, health care,
death, and provident fund schemes for employees of medium and large firms (greater than
100 employees). Under the plan, employees were required to save 1 percent of their earnings
and employers provided a matching contribution of 1.5 percent. Most funds were allocated
to bank time deposits with annual interest rates of 9 percent, and retirees received their
benefits in lump-sum form when they retired, as long as they were 55 or older (Kerja,
1982). By the end of 1983, 8,602 employers and 1,960,109 employees were covered by Astek
(about 40 percent of the eligible labor force and 4 percent of the labor force between the
ages of 20 and 50). Coverage expanded rapidly, and in 1982, the government estimated
that 5.5 million employees would be covered by 1988 (Kerja, 1982). The second policy
change is the 1992 replacement of Astek with Jamsostek, which expanded the pension plan
scheme to cover workers at enterprises of 10 or more employees. This approximately doubled
the number of people with insurance policies from 8 million in 1990 to 15 million in 1995
(7.8 percent of the population) (Purwoko, 1997). By 2000, 17 million employees were in
Jamsostek (Tambunan and Purwoko, 2002). Additionally, the 1992 law allowed for the
formation of private pension plans (Purwoko, 1997). Finally, I study the creation of a
social security scheme in Ghana in 1972. The passage of NRCD 127 in 1972 established
the Social Security and National Insurance Trust (SSNIT), which administered a provident
scheme that paid lump sum benefits to beneficiaries. The bill mandated compulsory coverage
for establishments that employed at least 5 workers; the scheme was optional for smaller
establishments (Kumado and Gockel, 2003).
To estimate the differential effects of each policy change, I exploit variation in the number
of years an individual was exposed to the change due to her year of birth as well as variation
19
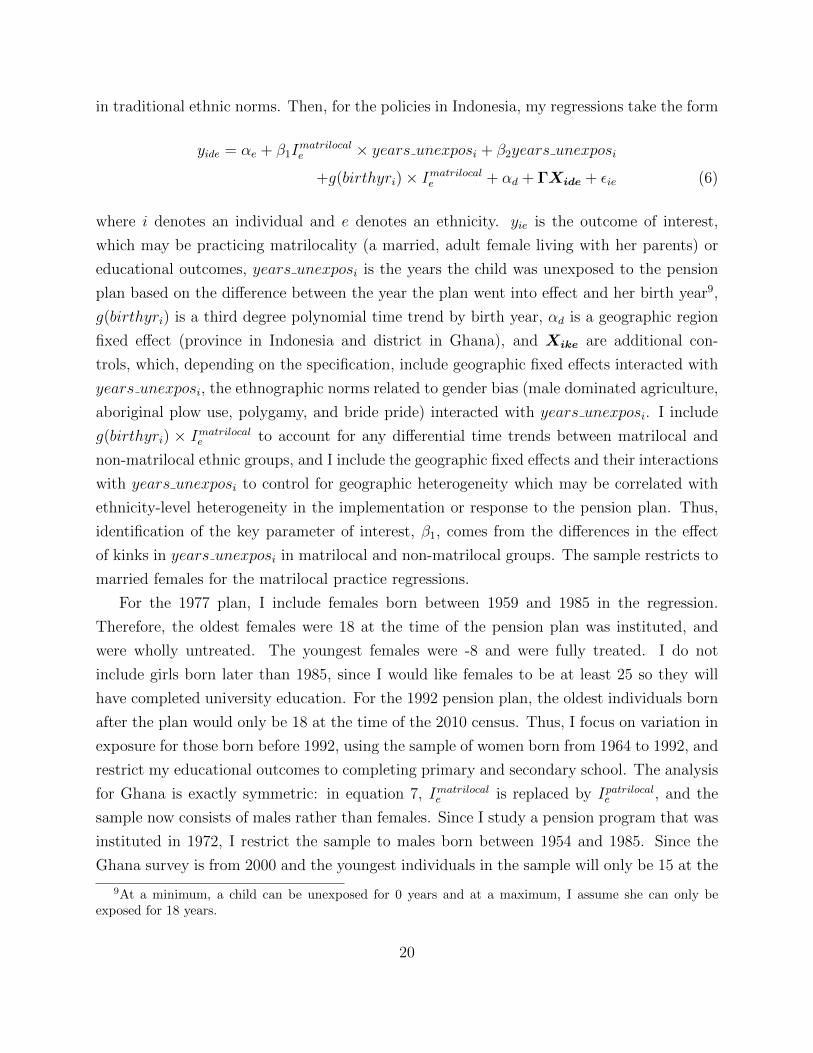
in traditional ethnic norms. Then, for the policies in Indonesia, my regressions take the form
yide = αe + β1Imatrilocale × years unexposi + β2years unexposi
+g(birthyri)× Imatrilocale + αd + ΓXide + εie (6)
where i denotes an individual and e denotes an ethnicity. yie is the outcome of interest,
which may be practicing matrilocality (a married, adult female living with her parents) or
educational outcomes, years unexposi is the years the child was unexposed to the pension
plan based on the difference between the year the plan went into effect and her birth year9,
g(birthyri) is a third degree polynomial time trend by birth year, αd is a geographic region
fixed effect (province in Indonesia and district in Ghana), and Xike are additional con-
trols, which, depending on the specification, include geographic fixed effects interacted with
years unexposi, the ethnographic norms related to gender bias (male dominated agriculture,
aboriginal plow use, polygamy, and bride pride) interacted with years unexposi. I include
g(birthyri) × Imatrilocale to account for any differential time trends between matrilocal and
non-matrilocal ethnic groups, and I include the geographic fixed effects and their interactions
with years unexposi to control for geographic heterogeneity which may be correlated with
ethnicity-level heterogeneity in the implementation or response to the pension plan. Thus,
identification of the key parameter of interest, β1, comes from the differences in the effect
of kinks in years unexposi in matrilocal and non-matrilocal groups. The sample restricts to
married females for the matrilocal practice regressions.
For the 1977 plan, I include females born between 1959 and 1985 in the regression.
Therefore, the oldest females were 18 at the time of the pension plan was instituted, and
were wholly untreated. The youngest females were -8 and were fully treated. I do not
include girls born later than 1985, since I would like females to be at least 25 so they will
have completed university education. For the 1992 pension plan, the oldest individuals born
after the plan would only be 18 at the time of the 2010 census. Thus, I focus on variation in
exposure for those born before 1992, using the sample of women born from 1964 to 1992, and
restrict my educational outcomes to completing primary and secondary school. The analysis
for Ghana is exactly symmetric: in equation 7, Imatrilocale is replaced by Ipatrilocale , and the
sample now consists of males rather than females. Since I study a pension program that was
instituted in 1972, I restrict the sample to males born between 1954 and 1985. Since the
Ghana survey is from 2000 and the youngest individuals in the sample will only be 15 at the
9At a minimum, a child can be unexposed for 0 years and at a maximum, I assume she can only beexposed for 18 years.
20

time of the census, I focus on primary schooling and years of schooling as outcomes.
Table A6 reports the summary statistics used in the two pension plan analyses in In-
donesia. Consistent with the idea that there are stronger incentives to educate matrilocal
females, matrilocal females are 3-4 percentage points more likely to complete primary school.
They are also more likely to live with their parents after marriage. However, they are not
more likely to work in high skilled professions or agriculture. Table 4 reports the results
from the analyses of the policy changes in Indonesia. Odd numbered columns present the
baseline specification and even numbered regressions include the ethnic norm controls inter-
acted with the years unexposed to the pension plan. The results from both 1977 and 1992
are consistent with the predictions of the theoretical model. While the 1977 pension plan
had only a marginally significant effect on primary school completion,10 matrilocal daugh-
ters who were unexposed to the pension plan for an additional year were 2 percentage points
more likely to complete secondary school and 0.6 percentage points more likely to attend
university (p < 0.01). An addition year unexposed to the pension plan is also associated
with an increase in the practice of matrilocality by 1 percentage point (p < 0.01). The
effects of the 1992 expansion of the pension plan are similar. Matrilocal daughters who were
unexposed to the 1992 expansion for an additional year were 1.8-2.0 percentage points more
likely to complete primary school (p < 0.01) and 1.1-1.2 percentage points more likely to
practice matrilocality after marriage (p < 0.01). The program had no significant effect on
secondary school completion, though these results may be biased if the younger cohorts –
the youngest cohort is 18 at the time of the survey – have not yet had an opportunity to
complete secondary school. Table A8 reports the results from the alternative concordance.
These estimates are also wholly consistent with the theory.
Table A7 reports the summary statistics for the Ghana pension sample. As before,
patrilocal Ghanians appear to be disadvantaged relative to non-patrilocal Ghanians: they
are more likely to practice agriculture and males receive less education (though the gap is
even bigger between patrilocal and non-patrilocal females). Table 5 reports the results for
the analysis from the policy change in Ghana. As before, odd columns report the baseline
specifications and even columns add ethnic norm controls11 (traditionally male dominated
10The large-scale, 1974 primary school building program studied by Duflo (2001) is a potential confounderfor the estimates using the institution of the pension plan in 1977. To the extent that the province by yearsunexposed to the pension plan interactions fail to control for geographic variation in the changes to the costsof school, which may also be correlated with cultural norms, the results for primary schooling may be biased.However, Duflo shows that the effects of the program on schooling beyond primary school are negligible.Therefore, the program is unlikely to explain the association between pension plan exposure and reducedsecondary school and university completion for matrilocal females.
11There is no variation in whether ethnicities are traditionally polygamous or were early adopters of the
21
agriculture and bride price) interacted with years unexposed to the pension plan. Like
Indonesia, the results from Ghana are consistent with the predictions of the theoretical
model. The inclusion of these controls only strengthens the baseline results. Patrilocal
males who are exposed to the the pension plan for 1 fewer years in their childhood are
0.7 percentage points more likely to complete primary school and on average complete 0.07
years more schooling (p < 0.05). Moreover, an additional year unexposed to the pension plan
leads patrilocal males to be 0.9 percentage points more likely to practice patrilocality after
marriage (p < 0.01). Table A9 replicates these regressions using the alternative ethnographic
data drawn from Gil (1964). Again, the results are wholly consistent with the theory and
qualitatively similar to the results in table 5.
Up to this point, all of these estimates have relied on the fact that different cohorts
were more or less exposed to the pension plan roll out. While I control for time trends
in my estimates, it is possible that these results are still biased by underlying differential
time trends in educational attainment and the practice of matrilocality for different ethnic
groups. I now exploit additional, finer geographic variation in the roll-out of Astek to test if
pension plan exposure has a larger effect in areas where access to the pension plan was likely
to be greater. All formal sector employees at firms with greater than 100 employees did not
receive pension plans overnight in 1977. On the contrary, Astek expanded over time. From
1978 to 1979, its number of enrollees grew by 24 percent; from 1979 to 1980, the number of
enrollees grew by 12 percent (Sudomo, 1985). Additionally, compliance with Astek was and
is imperfect. For example, in 1983, Sudomo (1985) reports that only 40 percent of eligible
individuals were enrolled. I hypothesize that initial enrollment was higher in areas with
more Astek branch offices, liaisons, and representatives. While there is very little existent
documentation of Astek’s initial roll-out, Sudomo (1985) reports the locations of branch
offices, liaisons, and representations in 1985. Figure 3 plots the locations of these offices
along with geographic variation in ethnic practices in Indonesia.
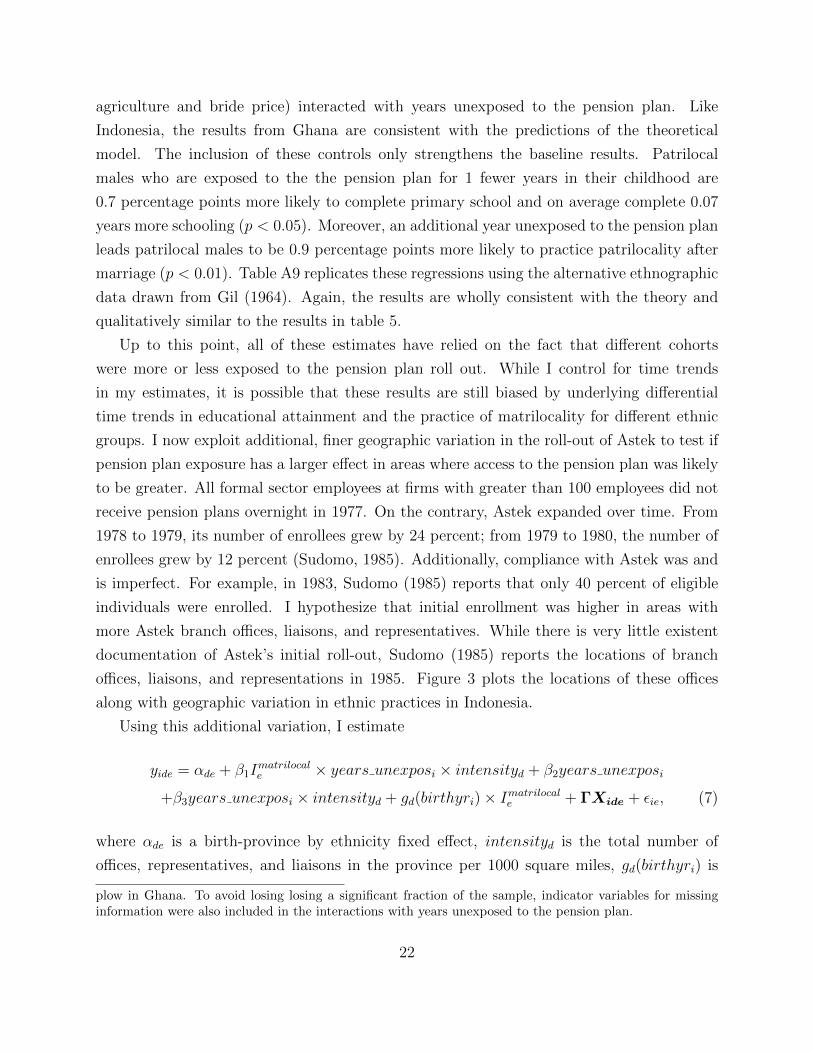
Using this additional variation, I estimate
yide = αde + β1Imatrilocale × years unexposi × intensityd + β2years unexposi
+β3years unexposi × intensityd + gd(birthyri)× Imatrilocale + ΓXide + εie, (7)
where αde is a birth-province by ethnicity fixed effect, intensityd is the total number of
offices, representatives, and liaisons in the province per 1000 square miles, gd(birthyri) is
plow in Ghana. To avoid losing losing a significant fraction of the sample, indicator variables for missinginformation were also included in the interactions with years unexposed to the pension plan.
22

now a birth-province specific third-degree polynomial in birth year, and the controls Xide
include province fixed effects interacted with years unexposi, and the triple- and double-
interactions of the ethnicity-level indicators for polygamy, bride price, aboriginal plow use,
and male dominated agriculture with years unexposi and intensityd.
Table 6 reports the estimates from equation 7. As in table 4, there is no statistically
significant effect on primary schooling. However, daughters who were 1 year more unexposed
to the pension plan and lived in provinces with 1 additional office per 1,000 miles, were 3.3
percentage points more likely to complete secondary schooling (p < 0.01), 1.9 percentage
points more likely to attend university (p < 0.01) and 0.9 (p < 0.01) percentage points
more likely to practice matrilocality after marriage. The mean number of branches per 1000
miles is 0.654, indicating that, in the average province, the pension policy reduced secondary
school completion by 1.2 percentage points per year of exposure, university enrollment by 1.2
percentage points per year of exposure, and the practice of matrilocality by 0.6 percentage
points per year of exposure for matrilocal daughters.
Thus, across the three policy experiments in two countries, the results are remarkably
similar. Pension plans crowd out human capital investment more for matrilocal females
relative to non-matrilocal females in Indonesia and for patrilocal males relative to non-
patrilocal males in Ghana. Moreover, in both countries, exposure to the pension plan crowds
out the practice of the norm by patrilocal males (relative to non-patrilocal males) and by
matrilocal females (relative to non-matrilocal females).
5.2 Ability and the Practice of Patrilocality and Matrilocality
In this section, I consider an additional test of the theoretical model. Proposition 4.3 indi-
cates that parents will invest more in the transmission of the norm to high ability children
who have higher returns to schooling. Therefore, contrary to the standard intuition that
high ability children will be more likely to migrate, the theory argues that high ability girls
(boys) will be more likely to live with their parents after marriage in matrilocal (patrilocal)
cultures. While the Ghana and Indonesia censuses do not contain rich data on ability, they
do ask if individuals are literate. Conditional on the amount of schooling a child receives,
literacy may proxy for ability. Thus, the argument is that a child who has completed primary
school and is literate is likely to be higher ability than a child who has completed primary
school and is not literate. To test proposition 4.3, I estimate
yie = τ0 + τ1ILiteratei + τ2I
Primaryi + τ3I
Secondaryi + τ4I
Universityi + αd + εie,
23

where yie is an indicator variable for practicing matrilocality (in Indonesia) or patrilocality
(in Ghana), ILiteratei is an indicator variable equal to 1 if individual i is literate, IPrimaryi is
an indicator variable equal to 1 if i has completed primary school, ISecondaryi is an indicator
variable equal to 1 if i has completed secondary school, IUniversityi is an indicator variable
equal to 1 if i has completed university, and αd is a geographic fixed effect (province-level in
Indonesia and district-level in Ghana). In Indonesia, the sample consists of married women
aged 25-45 and in Ghana it consists of men aged 25-45.12 Then, proposition 4.3 predicts
that τ1 will be positive.
Table 7 reports the results from these regressions. In both Indonesia, conditional on
education, literate females are 3 percentage points (p < .01) more likely to live with their
parents after marriage. In Ghana, literate males are 1.7 percentage points (p < 0.01) more
likely to live with their parents after marriage. Both these findings are consistent with the
model’s prediction that parents will invest more in transmitting the norm to high ability
children.
6 Alternative Explanations
In this section, I consider whether alternative drivers could explain the associations I report in
the previous sections. One natural question is whether the returns to education are different
between matrilocal and non-matrilocal females in Indonesia and patrilocal and non-patrilocal
males in Ghana. If matrilocal females and patrilocal males have larger returns to education,
this could explain both the correlation between the gender gap and traditional norms and
the fact that the crowd out of education by the pension plan is greater among matrilocal
daughters and patrilocal sons.
Without random or quasi-random variation in the amount of education an individual
attains, I cannot directly estimate the returns to education for females in Ghana and males
in Indonesia. As a second best, I estimate hedonic regressions, regressing labor market
outcomes and proxies for household wealth on educational attainment (indicator variables for
primary school completion, secondary school completion, and university completion) and its
interaction with matrilocality (in Indonesia) or patrilocality (in Ghana). Additionally, while
the 2010 Indonesia Census does not include questions about wages, formal sector workers
report their wages in the 1995 Intercensal survey. Therefore, I use the 1995 Intercensal
12I choose individuals aged 25-45 to avoid any bias due to differential mortality. However, the results arenot sensitive to the sample selection.
24
data for these regressions in Indonesia instead of the 2010 census; this has the additional
advantage of estimating the association between education and later-life outcomes closer to
when the pension plan creation and expansion that I studied occurred. In both Ghana and
Indonesia, I restrict my samples to individuals aged 25-45 at the time of the survey to (1)
ensure that those included in the sample have completed their education and (2) help ensure
that differential mortality does not bias the results.
Table 8 reports the results of this exercise. Column 1 shows that education is not more
predictive of employment by matrilocal females relative to non-matrilocal females. Column
2 regresses log wages on the educational attainment measures and their interactions with
matrilocality,13 and shows that the interactions are jointly insignificant predictors of log
wages in Indonesia. In column 3, the interactions between matrilocality and education are
jointly significant predictors (p < 0.01) of the wealth index,14 but they are systematically
negative. Turning to Ghana, in columns 5 and 6, I find that the interactions between the
educational attainment measures and the indicator variable for traditional patrilocality are
jointly statistically significant predictors of whether an individual is employed and household
wealth, but in both cases the coefficients are again systematically negative.
Altogether, in the hedonic regressions, there is little evidence that there are greater
returns to education for matrilocal females or patrilocal males. However, I caution against
interpreting these estimates as causal. As the model shows, females with lower returns
to education will receive education in matrilocal ethnic groups relative to non-matrilocal
ethnic groups, and males with lower returns to education will receive education in patrilocal
ethnic groups relative to non-patrilocal ethnic groups. Therefore, the model suggests that
the returns to education estimated by these hedonic regressions will be negatively biased for
matrilocal females and patrilocal males. This is consistent with the fact that in columns 3,
4, and 5 of table 8, the estimated returns to education are significantly lower for matrilocal
females and patrilocal males.
13The much reduced sample size is because very few women work in the formal sector in 1995.14In Indonesia, the wealth index is formed by predicting the first principal component of a principal
components analysis of indicator variables for ownership of a automobile, tv, radio, buffet, stove, bicycleboat, and motor boat (for a discussion of this methodology, see Filmer and Pritchett (2001)). In Ghana, thewealth index is the predicted first component from a principal components analysis of indicator variablesfor whether a household has a toilet, whether it has electricity, and whether it has running water, and thenumber of rooms in the house.
25

7 Conclusion
This paper provides novel evidence that the practice of traditional norms evolves quickly in
response to institutions and policies. If modernization brings more complete markets and
new policies, these policies may substitute for traditional practices that formerly resolved
problems like old age support, decreasing the incentive to transmit these practices to the next
generation. To establish if this is the case, I study norms which determine which child lives
with his or her parents after marriage in Ghana and Indonesia. Consistent with a model
where these norms resolve incomplete contracting problems between parents and children
by increasing parents’ ability to share in the returns to human capital investment in their
children, I find these norms play a significant role in explaining the gender gap both across
and within countries.
I then develop a model in which passing on traditional practices to children is costly.
Parents who invest more in passing on the practices are able to claim a higher share of
the returns to educating the children who are subject to the norm. This complementarity
between the transmission of culture and the education of one’s child means that the intro-
duction and expansion of pension plans will crowd out both educating children targeted by
the norm and the transmission of the norm to the next generation. Indeed, when I study
the establishment of pension plans in Ghana and Indonesia, and the expansion of a plan in
Indonesia, I find that this is the case. In Indonesia, matrilocal daughters who are exposed to
the pension plan for longer receive less education and are less likely to live with their parents
after marriage. In Ghana, patrilocal sons who are exposed to the pension plan for longer
also receive less education and are also less likely to live with their parents after marriage. I
also show, consistent with the model, that higher ability children are more likely to practice
matrilocality in matrilocal societies and patrilocality in patrilocal societies.
These results have several implications. First, they provide evidence on how and when
cultural practices change. In particular, these results show that policies may unintentionally
lead culture to evolve. Moreover, by decoupling old age support from parental investment
in children, pension plans had the unintended consequence of crowding out human capital
investments. Along with evidence from Ashraf et al. (2016), this highlights the importance
of taking culture into account when considering the effects of policies. Finally, these findings
point to a rational role cultural norms can play in determining gender gaps by coordinating
human capital investments in a given gender.
26

References
Alesina, Alberto and Nicola Fuchs-Schundeln, “Good-Bye Lenin (or Not?): The Effect
of Communism on People’s Preferences,” The American Economic Review, 2007, 97 (4),
1507–1528.
, Benedetta Brioschi, and Eliana La Ferrara, “Violene Against Women: A Cross-
cultural Analysis for Africa,” Working Paper, 2015.
, Paola Giuliano, and Nathan Nunn, “On the origins of gender roles: Women and
the plough,” The Quarterly Journal of Economics, 2013, 128 (2), 469–530.
Asante, Molefi Kete and Ama Mazama, eds, Encyclopedia of African Religion, Vol. 1,
SAGE Publications, Inc., 2009.
Ashraf, Nava, Natalie Bau, Nathan Nunn, and Alessandra Voena, “Bride Price
and Female Education,” Working Paper, 2016.
Banerjee, Abhijit, “Educational Policy and Economics of the Family,” Journal of Devel-
opment Economics, 2004, 74 (1), 3–32.
Beaman, Lori and Andrew Dillon, “Do Household Definitions Matter in Survey De-
sign? Results From a Randomized Survey Experiment in Mali,” Journal of Development
Economics, 2012, 98 (1), 124–135.
Becker, Gary, Kevin Murphy, and Jorg Spenkuch, “The Manipulation of Children’s
Preferences, Old Age Support, and Investment in Children’s Human Capital,” Working
Paper, 2012.
Becker, Gary S, William HJ Hubbard, and Kevin M Murphy, “Explaining the
Worldwide Boom in Higher Education of Women,” Journal of Human Capital, 2010, 4
(3), 203–241.
Becker, Sascha O, Katrin Boeckh, Christa Hainz, and Ludger Woessmann, “The
Empire Is Dead, Long Live the Empire! Long-Run Persistence of Trust and Corruption
in the Bureaucracy,” The Economic Journal, 2014.
Bekhouche, Yasmina, Ricardo Hausmann, LD Tyson, and Saadia Zahidi, “The
global gender gap report 2013.,” in “in” Geneva Switzerland World Economic Forum 2013.
2013.
27

Bisin, Alberto and Thierry Verdier, “The economics of cultural transmission and the
dynamics of preferences,” Journal of Economic theory, 2001, 97 (2), 298–319.
Boserup, Ester, Woman’s Role in Economic Development, Earthscan, 1970.
Boyd, Robert and Peter J Richerson, Culture and the evolutionary process, University
of Chicago Press, 1988.
Campa, Pamela and Michel Serafinelli, “Politico-economic Regimes and Attitudes:
Female Workers under State-socialism,” Working Paper, 2015.
Duflo, Esther, “Schooling and Labor Market Consequences of School Construction in In-
donesia: Evidence from an Unusual Policy Experiment,” American Economic Review,
2001, 91 (4), 795–813.
Engels, Friedrich, The Origin of the Family, Private Property, and the State, International
Publishers Co., 1942.
Fabinger, Michal and E. Glen Weyl, “Pass-through and Demand Forms,” Working
Paper, 2013.
Fernandez, Raquel, “Alfred Marshall Lecture: Women, Work, and Culture,” Journal of
the European Economic Association, 2007, pp. 305–332.
, “Does Culture Matter?,” in Jess Benhabib, Matthew O. Jackson, and Alberto Bisin, eds.,
Handbook of Social Economics, Vol. 1A, Amsterdam: North-Holland, 2011, pp. 481–510.
and Alessandra Fogli, “Culture: An Empirical Investigation of Beliefs, Work, and
Fertility,” American Economic Journal: Macroeconomics, 2009, 1 (1), 146–177.
Filmer, Deon and Lant H Pritchett, “Estimating wealth effects without expenditure
dataor tears: An application to educational enrollments in states of india*,” Demography,
2001, 38 (1), 115–132.
Gil, Benjamin Zvi, Tribes in Ghana, Ghana Census Office, 1964.
Giuliano, Paola, “The Role of Women in Society: from Preindustrial to Modern Times,”
CESifo Economic Studies, 2014, p. ifu019.
Gordon, Raymond G., Ethnologue: Languages of the World, 15th Edition, SIL Interna-
tional, 2005.
28

Greif, Avner, “Contract enforceability and economic institutions in early trade: The
Maghribi traders’ coalition,” The American economic review, 1993, pp. 525–548.
Grosfeld, Irena and Ekaterina Zhuravskaya, “Cultural vs. economic legacies of empires:
Evidence from the partition of Poland,” Journal of Comparative Economics, 2015, 43 (1),
55–75.
Holden, Clare and Ruth Mace, “Spread of Cattle Led to the Loss of Matrilinear Descent
in Africa: A Co-Evolutionary Analysis,” Proceedings of the Royal Society, 2003, 270, 2425–
2433.
and , “A Phylogenetic Approach to Cultural Evolution,” Trends in Ecology and Evo-
lution, 2005, 20 (3), 116–121.
Jensen, Robert and Nolan Miller, “Keepin’ ‘em Down on the Farm: Old Age Security
and Strategic Underinvestment in Children,” Working Paper, 2011.
Jones, Doug, “The Matrilocal Tribe: An Organization of Demic Expansion,” Human Na-
ture, 2011, 22, 177–200.
Kerja, Perusahan Umum Asuransi Sosial Tenaga, Readings in Social Security: The
Indonesian Case, The Board, 1982.
Kumado, Kofi and Augustine Fritz Gockel, A study on social security in Ghana,
University of Ghana, 2003.
Lebar, Frank, ed., Ethnic Groups of Insular Southeast Asia, Vol. 1, Human Relations Area
Files Press, 1972.
Levine, David and Michael Kavane, “Are Investments in Daughters Lower When Daugh-
ters Move Away?,” World Development, 2003, 31 (6), 1065–1084.
Milgrom, Paul and Ilya Segal, “Envelope theorems for arbitrary choice sets,” Economet-
rica, 2002, 70 (2), 583–601.
Minnesota Population Center, “Integrated Public Use Microdata Series, International:
Version 6.1,” 2011.
Muliati, Iene, “Pension reform experience in Indonesia,” in “World Bank, prepared for IMF
conference “Designing Sustainable and Equitable Pension Systems in Asia in the Post
29
Crisis World”, www. imf. org/external/np/seminars/eng/2013/oapfad/pdf/muliati ppr.
pdf” 2013.
Murdock, George Peter, Ethnographic Atlas, Pittsburgh: University of Pittsburgh Press,
1967.
Peisakhin, Leonid V, “Living Historical Legacies: The ‘Why’ and ‘How’ of Institutional
Persistence – The Case of Ukraine,” Working Paper, 2010.
Purwoko, Bambang, “The Social Security System in Indonesia: Current Investment Issues
and Future Prospects,” in “AFIR/ERM Colloquium” 1997.
Rammohan, Anu and Peter Robertson, “Do Kinship Norms Influence Female Educa-
tion? Evidence From Indonesia,” Oxford Development Studies, 2012, 40 (3), 283–304.
Strouthes, D., Encyclopedia of World Cultures: East and Southeast Asia, Vol. 5, GK Hall
and Co., 1993.
Sudomo, R, “The development of the ASTEK social insurance system in Indonesia,” In-
ternational Social Security Review, 1985, 38 (1), 55–61.
Tambunan, Tulus TH and Bambang Purwoko, “Social protection in Indonesia,” Sin-
gapore, 2002.
Vroklage, Bernh, “Bride Price or Dower,” Anthropos, 1952, Bd. 47, H. 1./2., 133–146.
Whyte, Martin, ed., The Status of Women in Preindustrial Societies, Princeton University
Press, 1978.
World Bank, “World Development Report 2015: Mind, Society, and Behavior,” Washing-
ton, DC: World Bank., 2015.
Wysokinskya, Agnieszka, “Invisible Wall: How History Matters for Economic Develop-
ment,” Working Paper, 2015.
30
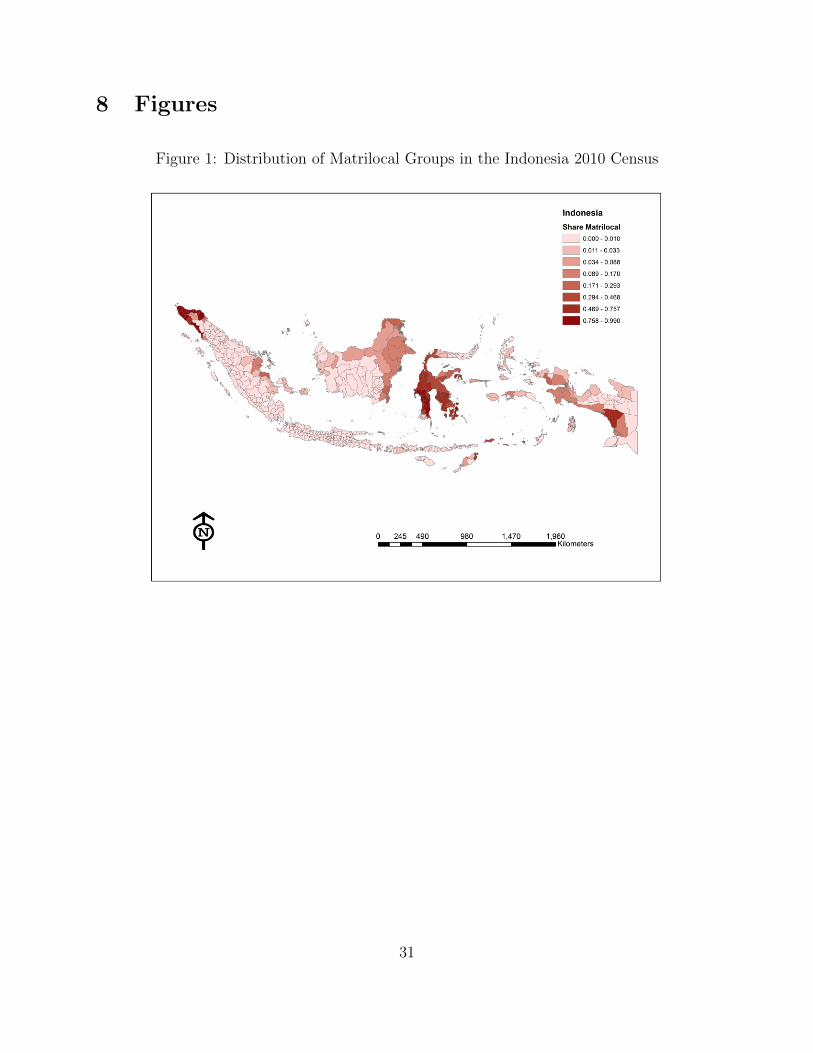
8 Figures
Figure 1: Distribution of Matrilocal Groups in the Indonesia 2010 Census
31
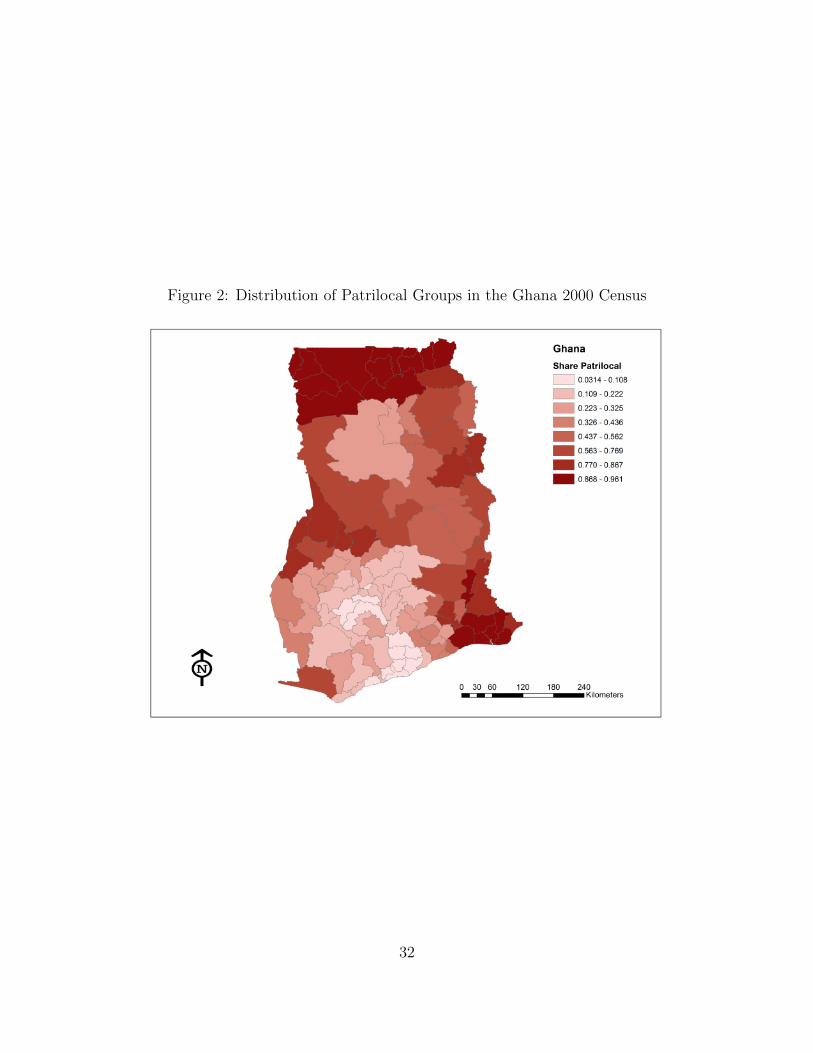
Figure 2: Distribution of Patrilocal Groups in the Ghana 2000 Census
32
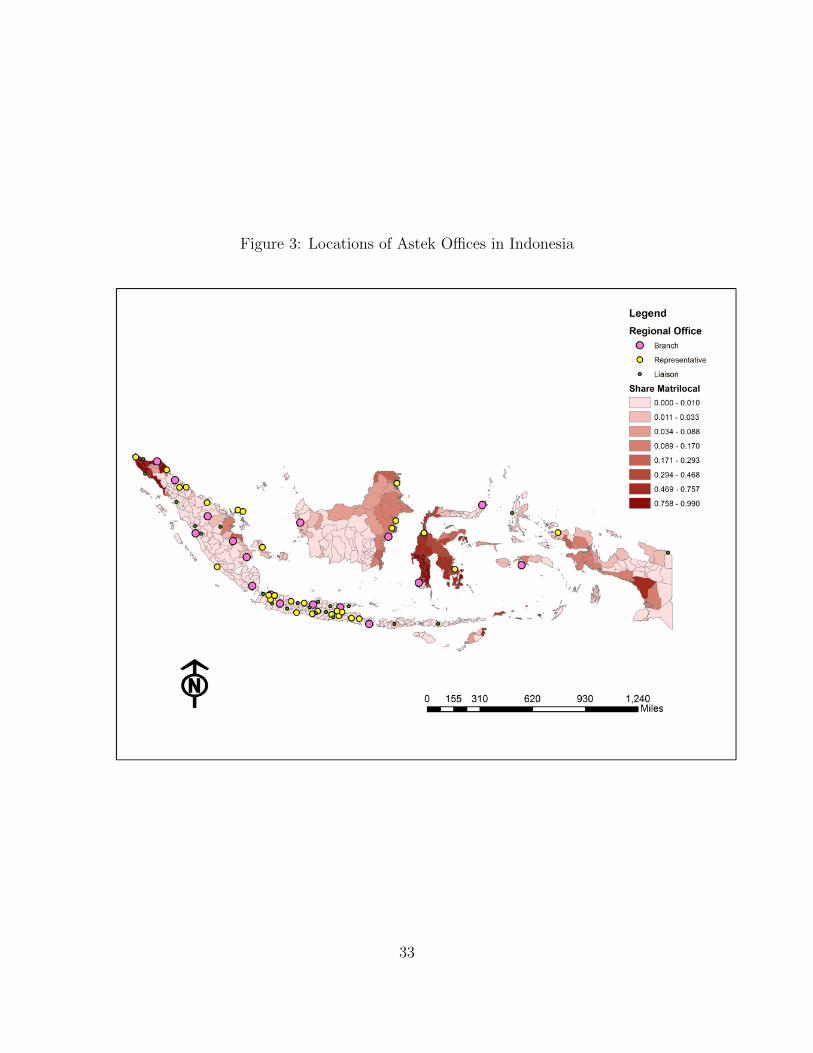
Figure 3: Locations of Astek Offices in Indonesia
33

9 Tables
Table 1: Association Between Traditional Norms and Current Practices
(1) (2) (3) (4)Indonesia Ghana
Household Practices Matrilocality Household Practices Patrilocality
Matrilocal 0.023*** 0.043***(0.006) (0.010)
Patrilocal 0.032*** 0.023*(0.011) (0.014)
Mean 0.081 0.081 0.070 0.070Ethnic Norm Controls N Y N YNumber of observations 5,955,980 5,955,980 298,245 298,245Adjusted R2 0.000 0.001 0.008 0.007Clusters 43 43 24 24
This table regresses an indicator variable for whether a household practices matrilocality (a married daugh-ter lives in the same household as her parents) or patrilocality (a married son lives in the same householdas his parents) on indicator variables for whether the household head belongs to a traditionally matrilocalor patrilocal ethnicity. An observation is a household. Ethnicity controls consist of indicator variables forpolygamy, aboriginal plow use, male dominated agriculture, and bride price customs, as well as indicatorvariables for cases where information on these customs is missing. Standard errors are clustered at theethnicity level.
34
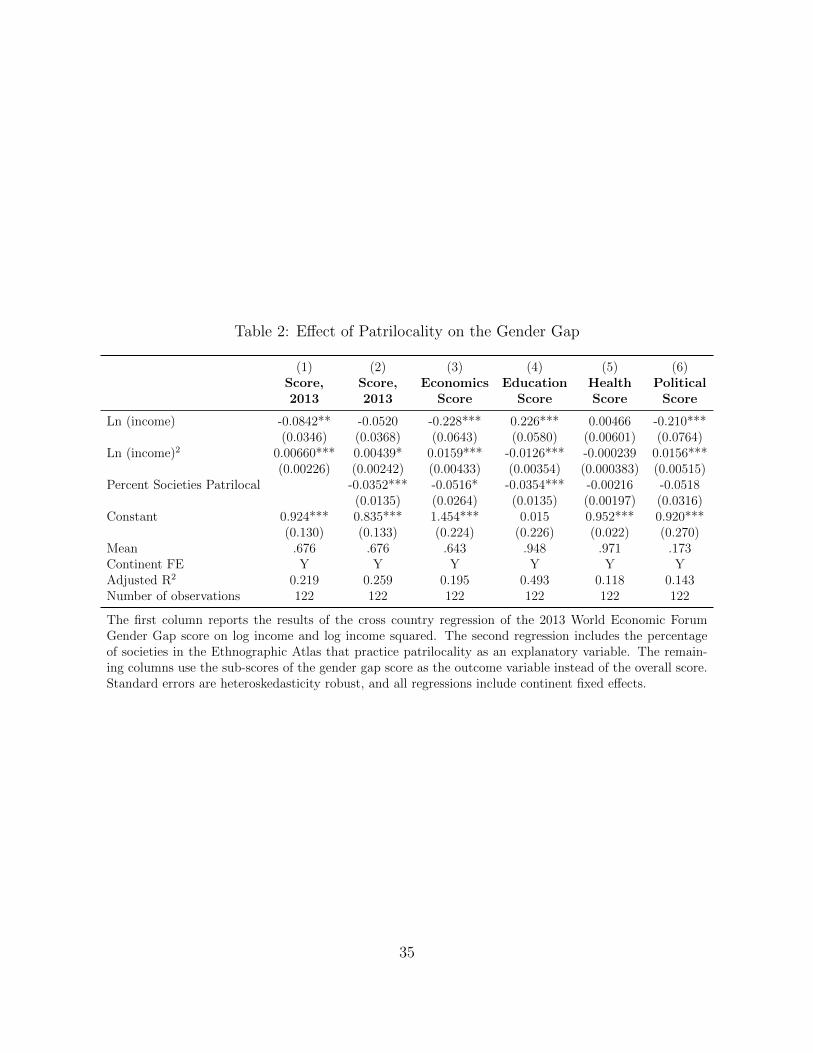
Table 2: Effect of Patrilocality on the Gender Gap
(1) (2) (3) (4) (5) (6)Score, Score, Economics Education Health Political2013 2013 Score Score Score Score
Ln (income) -0.0842** -0.0520 -0.228*** 0.226*** 0.00466 -0.210***(0.0346) (0.0368) (0.0643) (0.0580) (0.00601) (0.0764)
Ln (income)2 0.00660*** 0.00439* 0.0159*** -0.0126*** -0.000239 0.0156***(0.00226) (0.00242) (0.00433) (0.00354) (0.000383) (0.00515)
Percent Societies Patrilocal -0.0352*** -0.0516* -0.0354*** -0.00216 -0.0518(0.0135) (0.0264) (0.0135) (0.00197) (0.0316)
Constant 0.924*** 0.835*** 1.454*** 0.015 0.952*** 0.920***(0.130) (0.133) (0.224) (0.226) (0.022) (0.270)
Mean .676 .676 .643 .948 .971 .173Continent FE Y Y Y Y Y YAdjusted R2 0.219 0.259 0.195 0.493 0.118 0.143Number of observations 122 122 122 122 122 122
The first column reports the results of the cross country regression of the 2013 World Economic ForumGender Gap score on log income and log income squared. The second regression includes the percentageof societies in the Ethnographic Atlas that practice patrilocality as an explanatory variable. The remain-ing columns use the sub-scores of the gender gap score as the outcome variable instead of the overall score.Standard errors are heteroskedasticity robust, and all regressions include continent fixed effects.
35

Table 3: Association Between Matrilocality and Patrilocality and the Within-HouseholdGender Gap in Ghana and Indonesia
(1) (2) (3) (4)Baseline +SES Controls +Norm Controls +Geography Controls
IndonesiaIMatrilocale × IFemalei 0.020*** 0.018*** 0.014*** 0.012***
(0.002) (0.003) (0.005) (0.004)Number of observations 6,151,544 5,551,976 5,551,976 5,551,976Adjusted R2 0.522 0.515 0.516 0.516Clusters 43 43 43 43
GhanaIPatrilocale × IMale
i 0.011 0.007 0.010** 0.010***(0.007) (0.006) (0.005) (0.004)
Number of observations 406,840 266,418 266,418 266,418Adjusted R2 0.507 0.517 0.517 0.517Clusters 24 24 24 24
This table presents difference-in-difference estimates of the association between the interaction betweenmatrilocality and female (Indonesia) and patrilocality and male (Ghana) and enrollment for children ofthe household head aged 5-22 in the Indonesia 2010 Census and the Ghana 2000 Census. All regressionsinclude household fixed effects. In addition, the baseline regression in column 1 includes age fixed effects.Column 2 adds indicator variables for whether the father has completed primary school, whether the fa-ther’s spouse has completed primary school, whether the father works in a high skill sector, whether thefather’s spouse works in a high skill sector, whether the father works in agriculture, whether the father’sspouse works in agriculture, and whether the household head is male interacted with child gender. Col-umn 3 includes indicator variables for whether a child belongs to an ethnicity with bride price custom,male dominated agriculture, polygamy, or aboriginal plow use interacted with child gender. Column 4includes province fixed effects (Indonesia) or district fixed effects (Ghana) interacted with child gender.Data on ethnic norms is drawn from the Ethnographic Atlas. Standard errors are clustered at the ethnic-ity level in the Ethnographic Atlas.
36

Tab
le4:
Eff
ect
ofth
eP
ensi
onP
lan
onE
duca
tion
alO
utc
omes
and
Pra
ctic
eof
Mat
rilo
cality
inIn
don
esia
1977
Cre
ati
on
of
Ast
ek
(1)
(2)
(3)
(4)
(5)
(6)
(7)
(8)
Pri
mary
Pri
mary
Seco
nd
ary
Seco
nd
ary
Un
ivers
ity
Un
ivers
ity
Pra
ctic
eP
ract
ice
Matr
iloca
lity
Matr
iloca
lity
IMatrilocal
e×years
unexpos i
0.00
10.
005*
0.02
0***
0.01
8***
0.00
6***
0.00
6***
0.01
0***
0.01
0***
(0.0
04)
(0.0
03)
(0.0
04)
(0.0
04)
(0.0
02)
(0.0
02)
(0.0
01)
(0.0
01)
Pro
vin
ceF
EY
YY
YY
YY
YP
rovin
ceF
E×years
unexpos i
YY
YY
YY
YY
Eth
nic
ity
FE
YY
YY
YY
YY
Tim
eT
rend
Con
trol
sY
YY
YY
YY
YE
thnic
Nor
mIn
tera
ctio
ns
NY
NY
NY
NY
Num
ber
ofob
serv
atio
ns
4,69
5,70
54,
695,
705
4,69
5,70
54,
695,
705
4,69
5,70
54,
695,
705
4,38
0,84
14,
380,
841
Clu
ster
s50
5050
5050
5050
50A
dju
sted
R2
0.12
10.
123
0.14
40.
144
0.03
20.
032
0.03
90.
039
(1)
(2)
(3)
(4)
(5)
(6)
1992
Exp
an
sion
toS
mall
Form
al
Sect
or
Ente
rpri
ses
Pri
mary
Pri
mary
Seco
nd
ary
Seco
nd
ary
Pra
ctic
eP
ract
ice
Matr
iloca
lity
Matr
iloca
lity
IMatrilocal
e×years
unexpos i
0.01
8***
0.02
2***
-0.0
07-0
.007
0.01
2***
0.01
1***
(0.0
03)
(0.0
02)
(0.0
05)
(0.0
06)
(0.0
02)
(0.0
02)
Pro
vin
ceF
EY
YY
YY
YP
rovin
ceF
E×years
unexpos i
YY
YY
YY
Eth
nic
ity
FE
YY
YY
YY
Tim
eT
rend
Con
trol
sY
YY
YY
YE
thnic
Nor
mIn
tera
ctio
ns
NY
NY
NY
Num
ber
ofob
serv
atio
ns
5,38
2,60
25,
382,
602
5,38
2,60
25,
382,
602
4,33
1,69
64,
331,
696
Clu
ster
s50
5050
5050
50A
dju
sted
R2
0.09
20.
093
0.12
20.
122
0.08
60.
087
This
table
use
sdat
afr
omth
eIn
don
esia
2010
censu
sto
esti
mat
eth
ediff
eren
tial
effec
tsof
year
sunex
pos
edto
the
1977
esta
blish
men
tof
com
puls
ory
pen
-si
onpla
ns
and
the
1992
expan
sion
ofth
ese
pen
sion
pla
ns
duri
ng
childhood
oned
uca
tion
alou
tcom
esan
dpra
ctic
eof
mat
rilo
cality
(am
arri
eddau
ghte
rlivin
gin
the
sam
ehou
sehol
das
her
par
ents
)in
mat
rilo
cal
and
non
-mat
rilo
cal
ethnic
grou
ps.
Dat
aon
mat
rilo
cal
pra
ctic
esar
edra
wn
from
am
atch
be-
twee
net
hnic
ity-l
evel
censu
sdat
aan
dth
eEthnographic
Atlas
.T
he
educa
tion
regr
essi
ons
for
the
1977
esta
blish
men
tof
the
pla
nre
stri
ctto
fem
ales
bor
nb
etw
een
1959
and
1985
.T
he
educa
tion
regr
essi
ons
for
the
1992
expan
sion
ofth
epla
nre
stri
ctto
fem
ales
bor
nb
etw
een
1964
and
1992
.T
he
pra
ctic
eof
mat
rilo
cality
regr
essi
ons
addit
ional
lyre
stri
ctth
esa
mple
sto
mar
ried
indiv
idual
s.A
mar
ried
fem
ale
isco
nsi
der
edto
pra
ctic
em
atri
loca
lity
ifsh
elive
sin
the
sam
ehou
sehol
das
atle
ast
1of
her
par
ents
.Sta
ndar
der
rors
are
clust
ered
atth
eet
hnic
ity
leve
l.
37
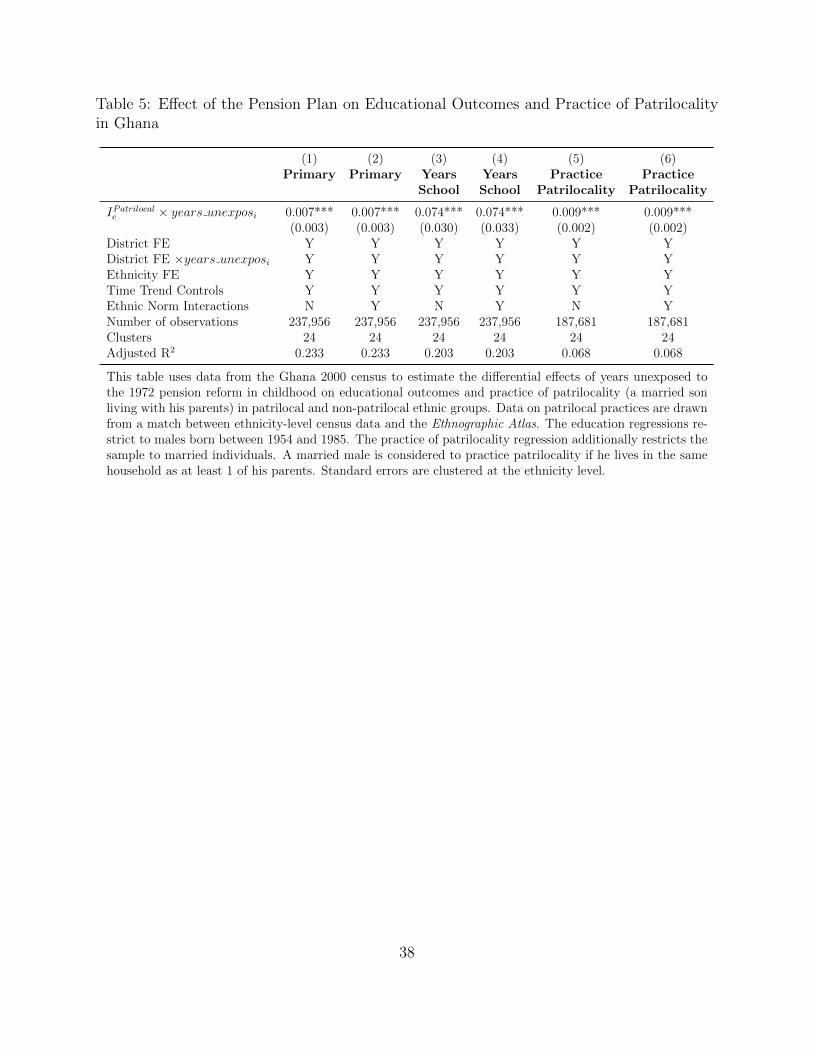
Table 5: Effect of the Pension Plan on Educational Outcomes and Practice of Patrilocalityin Ghana
(1) (2) (3) (4) (5) (6)Primary Primary Years Years Practice Practice
School School Patrilocality Patrilocality
IPatrilocale × years unexposi 0.007*** 0.007*** 0.074*** 0.074*** 0.009*** 0.009***(0.003) (0.003) (0.030) (0.033) (0.002) (0.002)
District FE Y Y Y Y Y YDistrict FE ×years unexposi Y Y Y Y Y YEthnicity FE Y Y Y Y Y YTime Trend Controls Y Y Y Y Y YEthnic Norm Interactions N Y N Y N YNumber of observations 237,956 237,956 237,956 237,956 187,681 187,681Clusters 24 24 24 24 24 24Adjusted R2 0.233 0.233 0.203 0.203 0.068 0.068
This table uses data from the Ghana 2000 census to estimate the differential effects of years unexposed tothe 1972 pension reform in childhood on educational outcomes and practice of patrilocality (a married sonliving with his parents) in patrilocal and non-patrilocal ethnic groups. Data on patrilocal practices are drawnfrom a match between ethnicity-level census data and the Ethnographic Atlas. The education regressions re-strict to males born between 1954 and 1985. The practice of patrilocality regression additionally restricts thesample to married individuals. A married male is considered to practice patrilocality if he lives in the samehousehold as at least 1 of his parents. Standard errors are clustered at the ethnicity level.
38

Tab
le6:
Eff
ect
ofA
stek
onE
duca
tion
alO
utc
omes
and
Pra
ctic
eof
Mat
rilo
cality
inIn
don
esia
(1)
(2)
(3)
(4)
(5)
(6)
(7)
(8)
Pri
mary
Pri
mary
Seco
nd
ary
Seco
nd
ary
Un
ivers
ity
Un
ivers
ity
Pra
ctic
eP
ract
ice
Matr
iloca
lity
Matr
iloca
lity
IMatrilocal
e×years
unexpos i×Intensityd
0.00
20.
002
0.03
3***
0.03
3***
0.01
9***
0.01
9***
0.00
9***
0.00
9***
(0.0
03)
(0.0
03)
(0.0
08)
(0.0
08)
(0.0
02)
(0.0
02)
(0.0
02)
(0.0
02)
Pro
vin
ceF
E×
Eth
nic
ity
FE
YY
YY
YY
YY
Pro
vin
ceF
E×years
unexpos i
YY
YY
YY
YY
IMatrilocal
e×years
unexpos i
YY
YY
YY
YY
Tim
eT
ren
dC
ontr
ols
YY
YY
YY
YY
Eth
nic
Nor
mIn
tera
ctio
ns
NY
NY
NY
NY
Nu
mb
erof
obse
rvat
ion
s4,
670,
402
4,67
0,40
24,
670,
402
4,67
0,40
24,
670,
402
4,67
0,40
24,
357,
678
4,35
7,67
8C
lust
ers
5050
5050
5050
5050
Ad
just
edR
20.
127
0.12
70.
150
0.15
00.
034
0.03
40.
057
0.05
7
Th
ista
ble
use
sd
ata
from
the
Ind
ones
ia20
10ce
nsu
sto
esti
mat
eth
ed
iffer
enti
aleff
ects
ofye
ars
un
exp
osed
toth
e19
77es
tab
lish
men
tof
com
pu
lsor
yp
ensi
onp
lan
sd
uri
ng
chil
dh
ood
inte
ract
edw
ith
the
inte
nsi
tyof
the
pen
sion
pla
nro
llou
tin
ach
ild
’sb
irth
pro
vin
ceon
edu
cati
onal
outc
omes
and
the
pra
ctic
eof
ma-
tril
oca
lity
(am
arri
edd
augh
ter
livin
gin
the
sam
eh
ouse
hol
das
her
par
ents
)in
mat
rilo
cal
and
non
-mat
rilo
cal
eth
nic
grou
ps.
Dat
aon
mat
rilo
cal
pra
ctic
esar
ed
raw
nfr
oma
mat
chb
etw
een
eth
nic
ity-l
evel
cen
sus
dat
aan
dth
eEthnographic
Atlas
.D
ata
onth
elo
cati
ons
ofA
stek
office
sis
dra
wn
from
Su
dom
o(1
985)
.T
he
regr
essi
ons
rest
rict
tofe
mal
esb
orn
bet
wee
n19
59an
d19
85.
Am
arri
edfe
mal
eis
con
sid
ered
top
ract
ice
mat
rilo
cali
tyif
she
live
sin
the
sam
eh
ouse
hol
das
atle
ast
1of
her
par
ents
.S
tan
dar
der
rors
are
clu
ster
edat
the
eth
nic
ity
leve
l.
39

Table 7: Ability and the Practice of Patrilocality and Matrilocality in Ghana and Indonesia
(1) (2)Indonesia GhanaPractice Practice
Matrilocality Patrilocality
ILiteratee 0.030*** 0.017***(0.001) (0.003)
Education FE Y YDistrict FE Y YNumber of observations 302,369 129,017Adjusted R2 0.034 0.038
This table uses data from the Ghana 2000 census andthe Indonesia 2010 census to estimate the association be-tween literacy and the practice of patrilocality in Ghanaand matrilocality in Indonesia. Data on patrilocal andmatrilocal practices are drawn from a match betweenethnicity/language-level census data and the EthnographicAtlas. The Ghana regression restricts to married, patrilo-cal males between 25 and 45, and the Indonesia regressionrestricts to married, matrilocal females between 25 and 45.A married male is considered to practice patrilocality is helives in the same household as at least 1 of his parents, andan analogous rule is used to determine if married femalespractice patrilocality. Standard errors are heteroskedas-ticity robust.
40

Table 8: Association Between Education and Long-term Outcomes in Ghana and Indonesia
(1) (2) (3) (4) (5)Indonesia Ghana
Employed Log(wage) Wealth Index Employed Wealth Index
Inorme × IPrimarye -0.028 -0.045 -0.022 -0.025*** -0.123(0.027) (0.038) (0.089) (0.007) (0.077)
Inorme × ISecondarye 0.038 0.120* -0.145 -0.030*** -0.025(0.025) (0.064) (0.170) (0.005) (0.047)
Inorme × ICollegee -0.004 0.007 -0.274*** 0.019 -0.073(0.032) (0.036) (0.081) (0.012) (0.049)
IPrimarye -0.065*** 0.332*** 0.834*** 0.022*** -0.367***(0.007) (0.013) (0.015) (0.000) (0.022)
ISecondarye 0.062*** 0.836*** 1.219*** -0.103*** -0.001(0.017) (0.015) (0.026) (0.001) (0.009)
ICollegee 0.150*** 0.239*** 0.498*** -0.037*** 0.186***(0.026) (0.024) (0.036) (0.002) (0.003)
F-statistic 0.89 1.74 15.31 16.60 10.67Sample Females Females Females Males MalesEthnicity FE Y Y Y Y YAge FE Y Y Y Y YNumber of observations 84,498 12,421 84,488 190,990 189,539Clusters 25 22 25 24 24Adjusted R2 0.044 0.443 0.295 0.039 0.113
This table estimates the association between education and labor market outcomes and wealth for ma-trilocal and non-matrilocal females aged 25-45 in the 1995 Indonesia Intercensal Survey and patrilocaland non-patrilocal males aged 25-45 in the 2000 Ghana Census. Inorme is an indicator variable equalto 1 if an individual is matrilocal in Indonesia and if an individual is patrilocal in Ghana. In Indone-sia, the wealth index is formed by predicting the first principal component of a principal componentsanalysis of indicator variables for ownership of a automobile, tv, radio, buffet, stove, bicycle boat,and motor boat (for a discussion of this methodology, see Filmer and Pritchett (2001)). In Ghana,the wealth index is the predicted first component from a principal components analysis of indicatorvariables for whether a household has a toilet, whether it has electricity, and whether it has runningwater, and the number of rooms in the house. Standard errors are clustered at the ethnicity level.
41

10 Mathematical Appendix
In this section, I prove the propositions in section 4. Before proceeding to the proofs, some
preliminaries are helpful. First, because of the linearity of parents’ utility functions and the
assumption that income constraints are “not binding,” parents treat the problem of how
much to invest in daughters and how much to invest in sons as separable. Proofs of the
separability lemmas are available on request. Second, differentiating equation 3, the maxi-
mization problem of matrilocal parents, with respect to I yields an important relationship
that will appear in several of the proofs below:
(1 + r) = p′(I∗E)(1− γ)V f (E), (8)
where I∗E is the equilibrium investment in the norm as a function of the choice of E. For
notational simplicity, I will suppress the subscript j.
Proof of Proposition 4.1.
To prove the proposition, I first show that girls are more likely to be educated in matrilocal
societies. The strategy is to show that any girl who is weakly educated in a neolocal society
will be strictly educated in a matrilocal society. A neolocal girl is educated if:
(1 + r)(y − fs − fsS) + γV f (1) + δV m(S) ≥ (1 + r)(y − fsS) + γV f (0) + δV m(S)
γ(V f (1)− V f (0)) ≥ (1 + r)fs
V f (1)− V f (0) ≥ (1 + r)fsγ
. (9)
Then we can define ∆V ∗NEO = V f (1)−V f (0) = (1+r)fsγ
as the minimal returns to education a
girl needs in a neolocal society to be educated. In a matrilocal society, a girl will be educated,
cancelling out the male terms, if:
(1 + r)(y − fsS − fs − I∗1 ) + p(I∗1 )(1− γ)V f (1) + γV f (1) ≥
(1 + r)(y − fsS − I∗0 ) + p(I∗0 )(1− γ)V f (0) + γV f (0). (10)
To show that girls in matrilocal societies are more likely to be educated than girls in neolocal
societies, it is sufficient to show that equation 10 will always be satisfied (and non-binding)
if V f (1) − V f (0) = (1+r)fsγ
. In other words, if a girl’s returns to education are sufficiently
high enough to be educated in a neolocal society, they will be more than sufficiently high in
a matrilocal society. Substituting this expression into V f (1)− V f (0) = (1+r)fsγ
produces the
42

condition:
(1 + r)(I∗0 − I∗1 ) + (1− γ)(p(I∗1 )V f (1)− p(I∗0 )V f (0)) > 0. (11)
Note that we can rewrite equation 8 as 1+rp′(I∗E)
= (1− γ)V f (E). Substituting thing expression
into equation 11 gives us
p(I∗1 )
p′(I∗1 )− p(I∗0 )
p′(I∗0 )> I∗1 − I∗0 . (12)
Define g(IE) = p(IE)p′(IE)
. Then, equation 12 will hold if g(I∗1 )− g(I∗0 ) > I∗1 − I∗0 . Note also that
g(I∗1 )− g(I∗0 ) =∫ I∗1I∗0g′(I)δI. Thus, equation 12 will be satisfied if g′(I) > 1. By the quotient
rule,
g′(IE) = 1− p′′(IE)
p′(IE), (13)
and by assumption p′′(IE) < 0 and p′(IE) > 0, so g′(IE) > 1. This shows that girls in
matrilocal ethnicities are more likely to be educated than girls in neolocal ethnicities. From
the separability of the boys’ and girls’ problems, it follows that education rates will be the
same for boys and girls in matrilocal and neolocal ethnicities. Therefore, girls are more likely
to be educated relative to boys in matrilocal ethnicities relative to neolocal ethnicities.
Proof of Proposition 4.2.
The proof has three steps. The first step is to show that an increase in r will reduce I∗Efor both E = 0 and E = 1. The second step is to show that I∗1 > I∗0 , and the third step is
to show that an increase in r will increase the share of households choosing E = 0. Taken
together, these facts imply that an increase in r must reduce overall investment in the norm.
Proof that an increase in r will reduce I∗E: Recall that I∗E must satisfy the first order condition
in equation 8. Therefore, if r increases, the value of p′(I∗E)(1− γ)V f (E) must also increase.
Since p exhibits diminishing marginal returns, this will occur if I∗E falls.
Proof that I∗1 > I∗0 :
Rewrite the first order condition in equation 8 as:
p′(I∗E) =1 + r
(1− γ)V f (E). (14)
By assumption, V f (1) > V f (0) and p has diminishing marginal returns, so for the first order
condition to be satisfied for both I∗1 and I∗0 , it must be the case that p′(I∗1 ) < p′(I∗0 ), implying
43

that I∗1 > I∗0 .
Proof that E(r) is weakly decreasing in r:
Here, I show that no household that is not educating their daughter will start educating
her in response to an increase in r. Assume E(r) = 0. Then, it is sufficient to show
that E(r + ε) = 0 ∀ε > 0. Note that a girl will be uneducated if U(E = 0, I∗0 (r), S, r) >
U(E = 1, I∗1 (r), S, r), where U is the parents’ utility as a function of E, S, I, and r. If
this relationship holds at r, then I can show that it must also hold at r + ε. Milgrom and
Segal (2002) show that we can apply the envelope theorem despite the fact that E and S
are discrete. Applying the unconstrained envelope theorem to both sides of this inequality
shows thatdU(E=1,I∗1 (r),r)
dr= y−fs−fsS− I∗1 and
dU(E=0,I∗0 (r),r)
dr= y−fsS− I∗0 . Since I∗0 < I∗1 ,
it follows thatdU(E=1,I∗1 (r),r)
dr<
dU(E=0,I∗0 (r),r)
dr, implying that the benefits to not educating a
daughter grow faster than the benefits to educating a daughter as r increases.
Proof of Proposition 4.3.
This follows naturally from the first order condition in equation 8. For the expression to
be true, when V f (E) increases, p′(I∗E) must fall. Since p has diminishing marginal returns,
this will occur when I∗E increases.
Proof of Proposition 4.4.
To show that the an increase in r causes education rates to fall more for matrilocal
ethnicities than neolocal ethnicities, I show that under assumption 4.1, the derivative of the
share of educated women in a matrilocal ethnicity with respect to r is more negative than
the derivative of the share of educated women with respect to r in a neolocal ethncitiy. In
neolocal ethnicities, a woman is educated if
V f (1)− V f (0) ≥ (1 + r)fsγ
, (15)
so
αfNEO = 1− F ((1 + r)fs
γ). (16)
Then,
dαfNEOdr
= −fsγF ′(
(1 + r)fsγ
). (17)
Now, I show that we can calculate αfMAT in the same way by showing that if equation
10 holds for V f (1), it must hold for V f (1) + ε. To see this, use the envelope theorem to
44

take the derivative of the lefthand and righthand sides of equation 10 with respect to V f (1).
Then, dLHSdV f (1)
= p(I∗1 )(1− γ) + γ > 0 and dRHSdV f (1)
= 0. Therefore, if equation 10 is satisfied for
V f (1), it must be satisfied for V f (1) + ε. In matrilocal ethnicities, rearranging equation 10
and using the relationship V f (E) = 1+rp′(I∗E)(1−γ) from equation 8 produces an expression for
the minimal returns to education that a girl must have to be educated:
V f (1)− V f (0) ≥ 1 + r
γ
(fs + I∗1 − I∗0 −
p(I∗1 )
p′(I∗1 )+p(I∗0 )
p′(I∗0 )
). (18)
Define ∆V ∗MAT = 1+rγ
(fs + I∗1 − I∗0 −
p(I∗1 )
p′(I∗1 )+
p(I∗0 )
p′(I∗0 )
). Therefore,
αMAT = 1− F (∆V ∗MAT ). (19)
Now differentiate αMAT with respect to r:
dαMAT
dr= −F ′(∆V ∗MAT )
(1
γ(fs + I∗1 − I∗0 −
p(I∗1 )
p′(I∗1 )+p(I∗0 )
p′(I∗0 ))
+1 + r
γ(∂I∗1∂r− ∂I∗0
∂r− p′(I∗1 )2 − p′′(I∗1 )p(I∗1 )
p′(I∗1 )2∂I∗1∂r
+p′(I∗0 )2 − p′′(I∗0 )p(I∗0 )
p′(I∗0 )2∂I∗0∂r
)). (20)
Using the fact that∂I∗E∂r
= 1p′′(I∗E)(1−γ)V f (E)
for∂I∗1∂r
and∂I∗0∂r
and from equation 8,p(I∗1 )
p′(I∗1 )
(1 −
1+rp′(I∗1 )(1−γ)V f (1)
)= 0, dαMAT
dr< dαNEO
drif and only if
fs + I∗1 − I∗0 +p(I∗0 )
p′(I∗0 )
(1 + 1+r
p′(I∗0 )(1−γ)V f (0)
)fs
>F ′(
(1+r)fsγ
)F ′(
1+rγ
(fs + I∗1 − I∗1 −p(I∗1 )
p′(I∗1 )+
p(I∗0 )
p′(I∗0 ))) ,
which is satisfied by assumption 4.1. Note that the left-hand side of the inequality will always
be greater than or equal to 1, capturing the fact that the minimum returns for a girl to be
educated will increase more in response to r in matrilocal societies. The right-hand side
captures the fact that the density of girls on the margin may differ in matrilocal and non-
matrilocal societies. The inequality will not be true if the density of girls at the margin in
neolocal societies is much greater than the density in matrilocal societies. The fact that this
inequality is satisfied implies that education rates fall faster for girls in matrilocal ethnicities
than for boys in response to the pension plan expansion.
45

11 Appendix Tables
46

Tab
leA
1:A
ssoci
atio
nB
etw
een
Mat
rilo
cality
and
Pat
rilo
cality
and
Oth
erT
radit
ional
Pra
ctic
es
(1)
(2)
(3)
(4)
(5)
(6)
(7)
(8)
(9)
(10)
(11)
(12)
Indic
ato
rvari
able
for
patr
iloca
lIn
dic
ato
rvari
able
for
matr
iloca
l
Plo
w-0
.057
-0.0
31(0
.060
)(0
.051
)B
rid
eP
rice
0.13
4***
-0.1
28**
*(0
.030
)(0
.025
)M
ale
Dom
inat
edA
gric
ult
ure
-0.0
500.
024
(0.0
34)
(0.0
29)
Agr
icu
ltu
reD
epen
den
ce-0
.020
-0.0
24(0
.027
)(0
.023
)P
olyga
my
0.13
3***
-0.0
63**
(0.0
36)
(0.0
31)
Pat
rili
nea
l0.
377*
**(0
.027
)M
atri
lin
eal
0.54
3***
(0.0
29)
Reg
ion
FE
YY
YY
YY
YY
YY
YY
Nu
mb
erof
obse
rvat
ion
s1,
135
1,23
593
41,
235
1,20
81,
220
1,13
51,
235
934
1,23
51,
208
1,22
0A
dju
sted
R2
0.33
90.
352
0.32
70.
341
0.36
20.
436
0.28
80.
304
0.26
90.
289
0.30
30.
456
Th
ista
ble
regr
esse
sin
dic
ator
vari
able
sfo
rp
ract
icin
gm
atri
loca
lity
orp
atri
loca
lity
onin
dic
ator
vari
able
sfo
rot
her
eth
nic
ity-l
evel
nor
ms.
All
regr
essi
ons
contr
olfo
rre
gion
(su
b-c
onti
nen
t)fi
xed
effec
ts.
Th
ed
ata
isd
raw
nfr
omM
urd
ock
’sEthnograph
icAtlas.
Sta
nd
ard
erro
rsar
eh
eter
oske
das
tici
tyro
bu
st.
47

Table A2: Association Between Matrilocality and Patrilocality and Other Traditional Prac-tices Within Indonesia and Ghana
(1) (2) (3) (4) (5) (6) (7) (8) (9) (10)Indonesia Ghana
Indicator variable for matrilocal Indicator variable for patrilocal
Plow -0.048(0.103)
Bride Price -0.022 0.111(0.092) (0.169)
Male Dominated Agriculture 0.038 0.056(0.135) (0.198)
Agriculture Dependence 0.032 -0.091(0.091) (0.064)
Polygamy -0.100(0.120)
Matrilineal 0.975***(0.025)
Patrilineal 0.167(0.113)
Number of observations 37 43 31 43 42 43 24 15 24 23Adjusted R2 -0.023 -0.023 -0.031 -0.022 -0.001 0.725 -0.014 -0.070 -0.037 0.044
This table regresses indicator variables for practicing matrilocality or patrilocality on indicator variables for other ethnicity-level norms using within Indonesia and within Ghana variation. Regressions for polygamy and aboriginal plow use are ex-cluded for Ghana since all ethnic groups in Ghana historically practiced polygamy and no ethnic groups had the plow. Thedata is drawn from Murdock’s Ethnographic Atlas. Standard errors are heteroscedasticity robust.
48

Tab
leA
3:Sum
mar
ySta
tist
ics
for
Childre
nA
ged
5-22
inth
eIn
don
esia
2010
Cen
sus
(1)
(2)
(3)
(4)
(5)
(6)
(7)
(8)
(9)
(10)
(11)
Mean
SD
NM
atr
iloca
lSD
NN
on-M
atr
iloca
lSD
NC
oeffi
cient
Se
Male
sM
atri
loca
l0.
048
0.21
33,
246,
317.
000
1.00
00.
000
154,
317.
000
0.00
00.
000
3,09
2,00
0.00
0E
nro
lled
0.66
70.
471
3,24
6,31
7.00
00.
650
0.47
715
4,31
7.00
00.
668
0.47
13,
092,
000.
000
-0.0
270.
028
Fat
her
Pri
mar
y0.
858
0.34
93,
009,
543.
000
0.77
80.
416
138,
634.
000
0.86
20.
345
2,87
0,90
9.00
00.
012
0.03
9M
other
Pri
mar
y0.
842
0.36
43,
161,
320.
000
0.77
60.
417
150,
944.
000
0.84
60.
361
3,01
0,37
6.00
00.
053
0.04
0F
ather
Em
plo
yed
inH
igh
Skil
lIn
dust
ry0.
045
0.20
73,
009,
543.
000
0.03
40.
182
138,
634.
000
0.04
50.
208
2,87
0,90
9.00
0-0
.012
0.00
7F
ather
Em
plo
yed
inA
gric
ult
ure
0.40
50.
491
3,00
9,54
3.00
00.
660
0.47
413
8,63
4.00
00.
392
0.48
82,
870,
909.
000
0.11
7**
0.05
0M
ather
inH
igh
Skill
Indust
ry0.
041
0.19
93,
161,
320.
000
0.03
90.
195
150,
944.
000
0.04
20.
200
3,01
0,37
6.00
00.
001
0.01
1M
other
inA
gric
ult
ure
0.25
30.
435
3,16
1,32
0.00
00.
390
0.48
815
0,94
4.00
00.
246
0.43
13,
010,
376.
000
0.00
20.
048
Fem
ale
sM
atri
loca
l0.
048
0.21
32,
905,
227.
000
1.00
00.
000
138,
491.
000
0.00
00.
000
2,76
6,73
6.00
0E
nro
lled
0.70
80.
455
2,90
5,22
7.00
00.
701
0.45
813
8,49
1.00
00.
709
0.45
42,
766,
736.
000
-0.0
160.
026
Fat
her
Pri
mar
y0.
866
0.34
02,
699,
037.
000
0.78
40.
412
124,
704.
000
0.87
00.
336
2,57
4,33
3.00
00.
011
0.04
0M
other
Pri
mar
y0.
853
0.35
52,
833,
305.
000
0.78
40.
411
135,
629.
000
0.85
60.
351
2,69
7,67
6.00
00.
051
0.04
1F
ather
,H
igh
Skil
led
Indust
ry0.
046
0.21
12,
699,
037.
000
0.03
50.
185
124,
704.
000
0.04
70.
212
2,57
4,33
3.00
0-0
.012
0.00
7F
ather
Agr
icult
ure
0.39
30.
488
2,69
9,03
7.00
00.
658
0.47
412
4,70
4.00
00.
380
0.48
52,
574,
333.
000
0.12
4**
0.05
0M
other
,H
igh
Skil
led
Indust
ry0.
043
0.20
42,
833,
305.
000
0.04
00.
196
135,
629.
000
0.04
40.
204
2,69
7,67
6.00
00.
000
0.01
1M
other
Em
plo
yed
inA
gric
ult
ure
0.24
30.
429
2,83
3,30
5.00
00.
387
0.48
713
5,62
9.00
00.
235
0.42
42,
697,
676.
000
0.00
90.
047
Wom
en
Aged
25-4
5N
um
ber
ofC
hil
dre
n2.
086
1.56
33,
858,
633.
000
2.52
32.
012
176,
669.
000
2.06
51.
535
3,68
1,96
4.00
00.
106
0.11
5P
erce
nt
Fem
ale
Childre
n0.
482
0.36
93,
321,
873.
000
0.48
20.
335
144,
616.
000
0.48
20.
370
3,17
7,25
7.00
00.
000
0.00
1
This
table
pro
vid
essu
mm
ary
stat
isti
csfo
rch
ildre
nof
hou
sehol
ds
aged
5-22
inth
eIn
don
esia
2010
cen
sus.
Th
efi
rst
two
colu
mns
give
the
mea
n,
SD
,an
dnu
mb
erof
obse
r-va
tion
sfo
rth
ew
hol
esa
mple
.T
he
nex
tth
ree
colu
mns
give
the
mea
n,
SD
,an
dnum
ber
ofob
serv
atio
ns
for
child
ren
from
his
tori
call
ym
atri
loca
let
hnic
grou
ps
acco
rdin
gto
theEthnograph
icAtlas
and
colu
mns
7,8,
9gi
veth
em
eans,
SD
,an
dnum
ber
ofob
serv
atio
ns
for
non
-mat
rilo
cal
grou
ps.
Col
um
n10
test
sfo
rb
alan
ce:
itre
gres
ses
the
row
-nam
eva
riab
les
onan
indic
ator
vari
able
for
bel
ongi
ng
toa
mat
rilo
cal
eth
nic
ity,
contr
olli
ng
for
the
eth
nic
ity
contr
ols
(pol
yga
my,
bri
de
pri
ce,
mal
ed
omin
ated
agri
cult
ure
,an
dab
orig
inal
plo
wuse
)an
dpro
vin
cefixed
effec
ts.
Sta
ndar
der
rors
are
clu
ster
edat
the
ethn
icit
yle
vel.
49
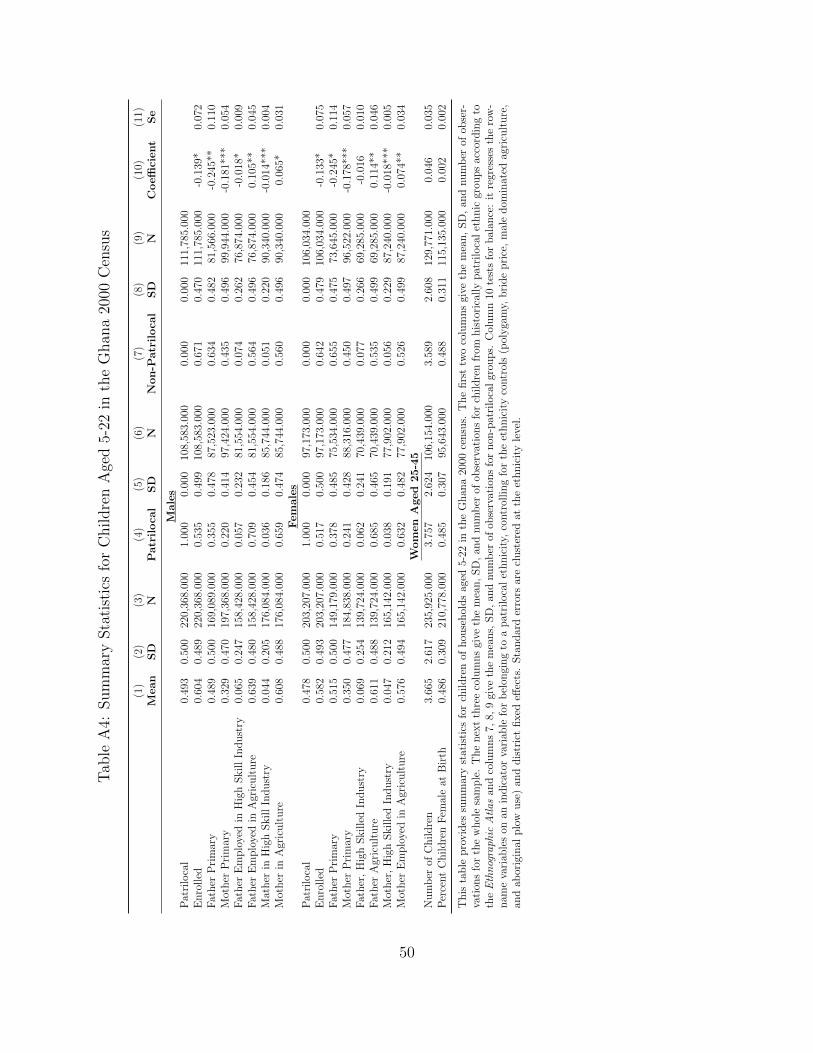
Tab
leA
4:Sum
mar
ySta
tist
ics
for
Childre
nA
ged
5-22
inth
eG
han
a20
00C
ensu
s
(1)
(2)
(3)
(4)
(5)
(6)
(7)
(8)
(9)
(10)
(11)
Mean
SD
NP
atr
iloca
lSD
NN
on-P
atr
iloca
lSD
NC
oeffi
cient
Se
Male
sP
atri
loca
l0.
493
0.50
022
0,36
8.00
01.
000
0.00
010
8,58
3.00
00.
000
0.00
011
1,78
5.00
0E
nro
lled
0.60
40.
489
220,
368.
000
0.53
50.
499
108,
583.
000
0.67
10.
470
111,
785.
000
-0.1
39*
0.07
2F
ath
erP
rim
ary
0.48
90.
500
169,
089.
000
0.35
50.
478
87,5
23.0
000.
634
0.48
281
,566
.000
-0.2
45**
0.11
0M
oth
erP
rim
ary
0.32
90.
470
197,
368.
000
0.22
00.
414
97,4
24.0
000.
435
0.49
699
,944
.000
-0.1
81**
*0.
054
Fat
her
Em
plo
yed
inH
igh
Skil
lIn
du
stry
0.06
50.
247
158,
428.
000
0.05
70.
232
81,5
54.0
000.
074
0.26
276
,874
.000
-0.0
18*
0.00
9F
ath
erE
mp
loye
din
Agr
icu
ltu
re0.
639
0.48
015
8,42
8.00
00.
709
0.45
481
,554
.000
0.56
40.
496
76,8
74.0
000.
105*
*0.
045
Mat
her
inH
igh
Skil
lIn
du
stry
0.04
40.
205
176,
084.
000
0.03
60.
186
85,7
44.0
000.
051
0.22
090
,340
.000
-0.0
14**
*0.
004
Mot
her
inA
gric
ult
ure
0.60
80.
488
176,
084.
000
0.65
90.
474
85,7
44.0
000.
560
0.49
690
,340
.000
0.06
5*0.
031
Fem
ale
sP
atri
loca
l0.
478
0.50
020
3,20
7.00
01.
000
0.00
097
,173
.000
0.00
00.
000
106,
034.
000
En
roll
ed0.
582
0.49
320
3,20
7.00
00.
517
0.50
097
,173
.000
0.64
20.
479
106,
034.
000
-0.1
33*
0.07
5F
ath
erP
rim
ary
0.51
50.
500
149,
179.
000
0.37
80.
485
75,5
34.0
000.
655
0.47
573
,645
.000
-0.2
45*
0.11
4M
oth
erP
rim
ary
0.35
00.
477
184,
838.
000
0.24
10.
428
88,3
16.0
000.
450
0.49
796
,522
.000
-0.1
78**
*0.
057
Fat
her
,H
igh
Skil
led
Ind
ust
ry0.
069
0.25
413
9,72
4.00
00.
062
0.24
170
,439
.000
0.07
70.
266
69,2
85.0
00-0
.016
0.01
0F
ath
erA
gric
ult
ure
0.61
10.
488
139,
724.
000
0.68
50.
465
70,4
39.0
000.
535
0.49
969
,285
.000
0.11
4**
0.04
6M
oth
er,
Hig
hS
kil
led
Ind
ust
ry0.
047
0.21
216
5,14
2.00
00.
038
0.19
177
,902
.000
0.05
60.
229
87,2
40.0
00-0
.018
***
0.00
5M
oth
erE
mp
loye
din
Agr
icu
ltu
re0.
576
0.49
416
5,14
2.00
00.
632
0.48
277
,902
.000
0.52
60.
499
87,2
40.0
000.
074*
*0.
034
Wom
en
Aged
25-4
5N
um
ber
ofC
hil
dre
n3.
665
2.61
723
5,92
5.00
03.
757
2.62
410
6,15
4.00
03.
589
2.60
812
9,77
1.00
00.
046
0.03
5P
erce
nt
Ch
ild
ren
Fem
ale
atB
irth
0.48
60.
309
210,
778.
000
0.48
50.
307
95,6
43.0
000.
488
0.31
111
5,13
5.00
00.
002
0.00
2
Th
ista
ble
pro
vid
essu
mm
ary
stat
isti
csfo
rch
ild
ren
ofh
ouse
hol
ds
aged
5-22
inth
eG
han
a20
00ce
nsu
s.T
he
firs
ttw
oco
lum
ns
give
the
mea
n,
SD
,an
dnu
mb
erof
obse
r-va
tion
sfo
rth
ew
hol
esa
mp
le.
Th
en
ext
thre
eco
lum
ns
give
the
mea
n,
SD
,an
dnu
mb
erof
obse
rvat
ions
for
chil
dre
nfr
omh
isto
rica
lly
pat
rilo
cal
eth
nic
grou
ps
acco
rdin
gto
theEthnograph
icAtlas
and
colu
mn
s7,
8,9
give
the
mea
ns,
SD
,an
dnu
mb
erof
obse
rvat
ion
sfo
rn
on-p
atri
loca
lgr
oup
s.C
olu
mn
10te
sts
for
bal
ance
:it
regr
esse
sth
ero
w-
nam
eva
riab
les
onan
ind
icat
orva
riab
lefo
rb
elon
gin
gto
ap
atri
loca
let
hn
icit
y,co
ntr
olli
ng
for
the
ethn
icit
yco
ntr
ols
(pol
yga
my,
bri
de
pri
ce,
mal
ed
omin
ated
agri
cult
ure
,an
dab
orig
inal
plo
wu
se)
and
dis
tric
tfi
xed
effec
ts.
Sta
nd
ard
erro
rsar
ecl
ust
ered
atth
eet
hn
icit
yle
vel.
50

Table A5: Association Between Matrilocality and Patrilocality and the Within-HouseholdGender Gap in Ghana and Indonesia Using Alternative Ethnographic Data
(1) (2) (3)Baseline +SES Controls +Geography Controls
IndonesiaIMatriloale × IFemalee 0.015*** 0.015*** -0.001
(0.006) (0.005) (0.004)Number of observations 4,775,991 4,286,046 4,286,046Adjusted R2 0.525 0.519 0.519Clusters 23 23 23
GhanaIPatrilocale × IMale
e 0.019* 0.015** 0.017***(0.010) (0.007) (0.005)
Number of observations 434,217 285,585 285,585Adjusted R2 0.503 0.512 0.513Clusters 56 56 56
This table presents difference-in-difference estimates of the association between theinteraction between matrilocality and female (Indonesia) and patrilocality and male(Ghana) and enrollment for children of the household head aged 5-22 in the Indone-sia 2010 Census and the Ghana 2000 Census using alternative data on ethnicity-level, traditional practices regarding residency after marriage. All regressions in-clude household fixed effects. In addition, the baseline regression in column 1 in-cludes age fixed effects. Column 2 adds indicator variables for whether the fatherhas completed primary school, whether the father’s spouse has completed primaryschool, whether the father works in a high skill sector, whether the father’s spouseworks in a high skill sector, whether the father works in agriculture, whether thefather’s spouse works in agriculture, and whether the household head is male in-teracted with child gender. Column 3 includes province fixed effects (Indonesia) ordistrict fixed effects (Ghana) interacted with child gender.
51

Table A6: Summary Statistics for Females in Indonesia Pension Analysis
(1) (2) (3) (4) (5) (6) (7) (8) (9) (10) (11)1977 Sample
Full Sample Matrilocal Non-MatrilocalMean SD N Mean SD N Mean SD N Difference Se
Matrilocal 0.046 0.209 4,693,486.000 1.000 0.000 214,619.000 0.000 0.000 4,478,867.000Practicing Matrilocality 0.073 0.260 4,693,486.000 0.087 0.281 214,619.000 0.072 0.259 4,478,867.000 0.024*** 0.006Primary 0.876 0.330 4,693,486.000 0.828 0.377 214,619.000 0.878 0.328 4,478,867.000 0.070* 0.038Secondary 0.317 0.465 4,693,486.000 0.254 0.435 214,619.000 0.320 0.467 4,478,867.000 -0.054 0.098Employed in Agriculture 0.404 0.491 2,455,637.000 0.575 0.494 116,644.000 0.395 0.489 2,338,993.000 -0.020 0.103Employed in High Skill Industry 0.107 0.310 2,455,637.000 0.119 0.323 116,644.000 0.107 0.309 2,338,993.000 -0.013 0.047
1992 SampleFull Sample Matrilocal Non-Matrilocal
Mean SD N Mean SD N Mean SD N Difference Se
Matrilocal 0.046 0.210 5,380,059.000 1.000 0.000 248,405.000 0.000 0.000 5,131,654.000Practicing Matrilocality 0.092 0.289 5,380,059.000 0.106 0.308 248,405.000 0.091 0.288 5,131,654.000 0.034*** 0.007Primary 0.913 0.282 5,380,059.000 0.873 0.333 248,405.000 0.915 0.279 5,131,654.000 0.063** 0.031Secondary 0.369 0.482 5,380,059.000 0.309 0.462 248,405.000 0.372 0.483 5,131,654.000 -0.047 0.097Employed in Agriculture 0.368 0.482 2,535,921.000 0.567 0.495 118,142.000 0.358 0.479 2,417,779.000 -0.023 0.099Employed in High Skill Industry 0.108 0.310 2,535,921.000 0.122 0.327 118,142.000 0.107 0.309 2,417,779.000 -0.011 0.042
This table reports summary statistics from the 2010 Indonesia census for the samples used in the Indonesia pension plan analysis. The samplefor the analysis of the 1977 pension plan consists of females born between 1959 and 1985. The sample for the analysis of the 1992 pension planexpansion consists of females born between 1964 and 1992. Differences are based on a regression with the row name as the outcome variable andmatrilocality as the independent variable controlling for province fixed effects and cultural traditions from the Ethnographic Atlas (polygamy,bride price, aboriginal plow, and male dominated agriculture).
Table A7: Summary Statistics for Males in Ghana Pension Analysis
(1) (2) (3) (4) (5) (6) (7) (8) (9) (10) (11)Full Sample Patrilocal Non-Patrilocal
Mean SD N Mean SD N Mean SD N Difference Diff, Se
Patrilocal 0.426 0.494 273,071.000 1.000 0.000 116,318.000 0.000 0.000 156,753.000Practicing Patrilocality 0.076 0.266 273,071.000 0.095 0.294 116,318.000 0.062 0.242 156,753.000 -0.008 0.005Primary 0.593 0.491 273,071.000 0.503 0.500 116,318.000 0.661 0.474 156,753.000 -0.121*** 0.043Secondary 0.162 0.368 273,071.000 0.147 0.354 116,318.000 0.173 0.378 156,753.000 -0.018 0.016Employed in Agriculture 0.512 0.500 251,065.000 0.585 0.493 106,813.000 0.457 0.498 144,252.000 0.061*** 0.017Employed in High Skill Industry 0.065 0.246 251,065.000 0.061 0.239 106,813.000 0.068 0.251 144,252.000 -0.009 0.004
This table reports summary statistics from the 2000 Ghana census for the samples used in the Ghana pension plan analysis. The sample forthe analysis of the 1972 pension plan consists of males born between 1954 and 1985. Differences are based on a regression with the row nameas the outcome variable and matrilocality as the independent variable controlling for province fixed effects and cultural traditions from theEthnographic Atlas (polygamy, bride price, aboriginal plow, and male dominated agriculture).
52

Table A8: Effect of the Pension Plan on Educational Outcomes and Practice of Patrilocalityin Indonesia Using Alternative Ethnographic Data
1977 Creation of Astek(1) (2) (3) (4)
Primary Secondary University PracticeMatrilocality
IMatrilocale × years unexposi 0.009*** 0.024*** 0.008*** 0.009***
(0.002) (0.005) (0.002) (0.002)Province FE Y Y Y YProvince FE ×years unexposi Y Y Y YEthnicity FE Y Y Y YTime Trend Controls Y Y Y YNumber of observations 3,762,221 3,762,221 3,762,221 3,538,194Clusters 23 23 23 23Adjusted R2 0.113 0.108 0.023 0.041
(1) (2) (3)1992 Expansion to Small Formal Sector EnterprisesPrimary Secondary Practice
Matrilocality
IMatrilocale × years unexposi 0.009*** 0.024*** 0.011***
(0.003) (0.005) (0.001)Province FE Y Y YProvince FE ×years unexposi Y Y YEthnicity FE Y Y YTime Trend Controls Y Y YEthnic Norm Interactions N N NNumber of observations 3,762,221 3,762,221 3,479,998Clusters 23 23 23Adjusted R2 0.113 0.108 0.090
This table uses data from the Indonesia 2010 census to estimate the differential effects ofyears unexposed to the 1977 establishment of compulsory pension plans and the 1992 expan-sion of these pension plans during childhood on educational outcomes and practice of ma-trilocality (a married daughter living in the same household as her parents) in matrilocal andnon-matrilocal ethnic groups. These analyses use the alternative ethnographic data based onLebar, ed (1972) and Strouthes (1993). The education regressions for the 1977 establishmentof the plan restrict to females born between 1959 and 1985. The education regressions for the1992 expansion of the plan restrict to females born between 1964 and 1992. The practice ofmatrilocality regressions additionally restrict the samples to married individuals. A marriedfemale is considered to practice matrilocality is she lives in the same household as at least 1of her parents. Standard errors are clustered at the ethnicity level.
53

Table A9: Effect of the Pension Plan on Educational Outcomes and Practice of Patrilocalityin Ghana Using Alternative Ethnographic Data
(1) (2) (3)Primary Years Practice
School Patrilocality
IPatrilocale × years unexposi 0.007*** 0.071** 0.010***(0.002) (0.027) (0.002)
District FE Y Y YDistrict FE ×years unexposi Y Y YEthnicity FE Y Y YTime Trend Controls Y Y YNumber of observations 256,431 256,431 201,711Clusters 56 56 56Adjusted R2 0.243 0.210 0.069
This table uses data from the Ghana 2000 census to estimate thedifferential effects of years unexposed to the 1972 pension reform inchildhood on educational outcomes and practice of patrilocality (amarried son living with his parents) in patrilocal and non-patrilocalethnic groups. Data on patrilocal practices come from the alterna-tive ethnographic data source, Gil (1964). The education regressionsrestrict to males born between 1954 and 1985. The practice of pa-trilocality regression additionally restricts the sample to married in-dividuals. A married male is considered to practice patrilocality ishe lives in the same household as at least 1 of his parents. Standarderrors are clustered at the ethnicity level.
54