Embed Size (px)
Citation preview
Can Momentum Investing Be Saved?Part IV of Alice in FactorlandRob Arnott, Vitali Kalesnik, PhD, Engin Kose, PhD, and Lillian Wu
There’s many a slip twixt cup and lip.— Old English proverb
On paper, momentum is one of the most compelling factors: simulated portfolios based on momentum add remarkable value, in most time periods and in most asset classes, all over the world. So, our title may seem unduly provocative. However, live results for mutual funds that take on a momentum factor loading are surprisingly weak.1 No US-benchmarked mutual fund with “momentum” in its name has cumulatively outper-formed its benchmark since inception, net of fees and expenses. Worse, because the standard momentum factor gave up so much ground in the last momentum crash of 2008–2009, it remains underwater in the United States, not only compared to its 2007 peak, but even relative to its 1999 performance peak. This means 18 years with no alpha, before subtracting trading costs and fees!2
October 2017
September 2017
The Folly of Hiring Winners and Firing LosersRob Arnott, Vitali Kalesnik, PhD, and
Lillian Wu
May 2017
Why Factor Tilts Are Not Smart “Smart Beta”Rob Arnott, Mark Clements, PhD, and
Vitali Kalesnik, PhD
April 2017
The Incredible Shrinking Factor ReturnRob Arnott, Vitali Kalesnik, PhD, and
Lillian Wu
Key Points1. Simulated portfolios based on momentum add remarkable value, in
most time periods and in most asset classes, all over the world; however,
live results for mutual funds that take on a momentum factor loading are
surprisingly weak.
2. A primary contributor to the performance gap between the standard
momentum factor’s live and theoretical results is the price impact of
trading costs associated with the strategy’s high turnover.
3. In addition to thoughtful implementation, relying on a strong sell
discipline and avoiding stocks with stale momentum can help investors
capture more of the benefits of the momentum factor.
FURTHER READING
CONTACT US
Web: www.researchaffiliates.com
Americas
Phone: +1.949.325.8700
Email: [email protected]
Media: [email protected]
EMEA
Phone: +44.2036.401.770
Email: [email protected]
Media: [email protected]
October 2017 . Arnott, Kalesnik, Kose, and Wu . Can Momentum Investing Be Saved? 2
www.researchaffiliates.com
To be sure, most advocates of momentum investing will disavow the standard model, and will claim they use proprietary momen-tum strategies with better simulated, and perhaps better live, performance. A handful (especially in the hedge fund commu-nity) may be able to point to respectable fund performance, net of trading costs and fees. But a careful review of the competitive landscape reveals that most claims of the merits of momentum investing are not supported by data, particularly not live mutual fund results, net of trading costs and fees.3
The three traps for momentum investing are 1) high turnover, in crowded trades, which leads to high trading costs; 2) a careless sell discipline, because momentum’s profits accrue for months, not years, and then reverse course; and 3) repeat winners (and losers), which have been soaring (or tumbling) for so very long they enjoy little or no momentum follow-through. Each of these traps can be avoided. By evading these traps, we can narrow the gap between paper and live results. Yes, momen-tum can probably be saved, even net of fees and trading costs.
This is the fourth and final article in the Alice in Factorland series.4
Momentum is the tendency for rising stock prices to continue rising and for falling stock prices to continue fall-ing. Why should stocks behave this way? Human nature conditions us to extrapolate our recent past experience: we want more of anything that has given us great joy and profit, and we want less of whatever has given us pain and losses. For this simple reason, momentum investing is popular. The mere act of buying recent winners and selling recent losers is both comfortable and enticing, and many investors act accordingly. Thus, human behavior may play a large role in fueling price momentum and creating a self-fulfilling prophecy. This may be the reason the momentum factor has enjoyed persistent success for so many years, in so
many geographic regions. Momentum’s steam is able to power on, however, only until valuations are stretched so far that relative valuation overcomes the forces of momentum.
Momentum: Toward a Better UnderstandingWhereas investors have pursued momentum investing for centuries, the “science” of understanding momentum is rather new, dating back only about a quarter-century.5 Our understanding has been improved through the work of many researchers, in multiple ways, ranging from correla-tions between past and subsequent returns to long–short factor portfolios.6
The most convincing explanations for momentum lie in the behavioral realm.7 Three articles are frequently cited as offering the best explanation of the momentum effect. The three underlying theories do not contradict each other and each is likely to be partially responsible for the momen-tum effect. The first article, Barberis, Shleifer, and Vishny (1998), suggests that when earnings surprises reach the market, investors do not pay them enough attention, and the stock price initially underreacts to the news.8 When the initial news is followed by confirming news, the stock price adjusts in the same direction (momentum), often to the point of over-extrapolation to where the stock price is poised for mean reversion.
Daniel, Hirshleifer, and Subrahmanyam (1998) propose a second explanation, arguing that investors overestimate precision of their private information and underestimate precision of public information as a result of biased self-at-tribution and overconfidence.9 Overconfidence encourages investors to overestimate the accuracy of their insights or private information, which causes them to trade more aggressively. In the case of biased self-attribution—when success is attributed to superior skill, but failures to bad luck—investors tend to pay attention to confirmatory signals and ignore conflicting ones, which again inspires more aggressive trading. Both behaviors lead to initial momentum and subsequent mean reversion in prices.
“The gap between paper portfolios and live results is very real.”
October 2017 . Arnott, Kalesnik, Kose, and Wu . Can Momentum Investing Be Saved? 3
www.researchaffiliates.com
The third explanation, a model proposed by Hong and Stein (1999), observes that information is not evenly available to all market participants. The model describes two groups of traders: “news watchers,” who have better access to private information about specific stocks, but are not well versed in market dynamics, so are not able to extract information from prices; and “momentum traders,” who do not have private information, but are well aware of market dynam-ics. The gradual release of private information leads to an initial underreaction from the news watchers, followed by an overreaction when the momentum traders try to profit by trend chasing, which in turn is followed by price rever-sion to the mean.10
Momentum in stocks is perhaps one of the best-perform-ing signals on paper: it has a better risk–return tradeoff than most known equity market factors. A momentum factor pairs a long portfolio of stocks whose prices have recently been soaring relative to the market, with a short portfolio of stocks whose prices have been sharply under-performing the market.11 Our research, discussed in this article, considers three types of momentum: 1) standard
momentum, which we define as the trailing 12-month return, excluding the most recent month; 2) fresh momen-tum, capturing stocks in the early part of their momen-tum trajectory (which we define as standard momentum conditioned on the opposite prior-year relative return); and 3) stale momentum, capturing stocks in the later part of their momentum trajectory (which we define as standard momentum conditioned on the same direction of the prior-year relative return).
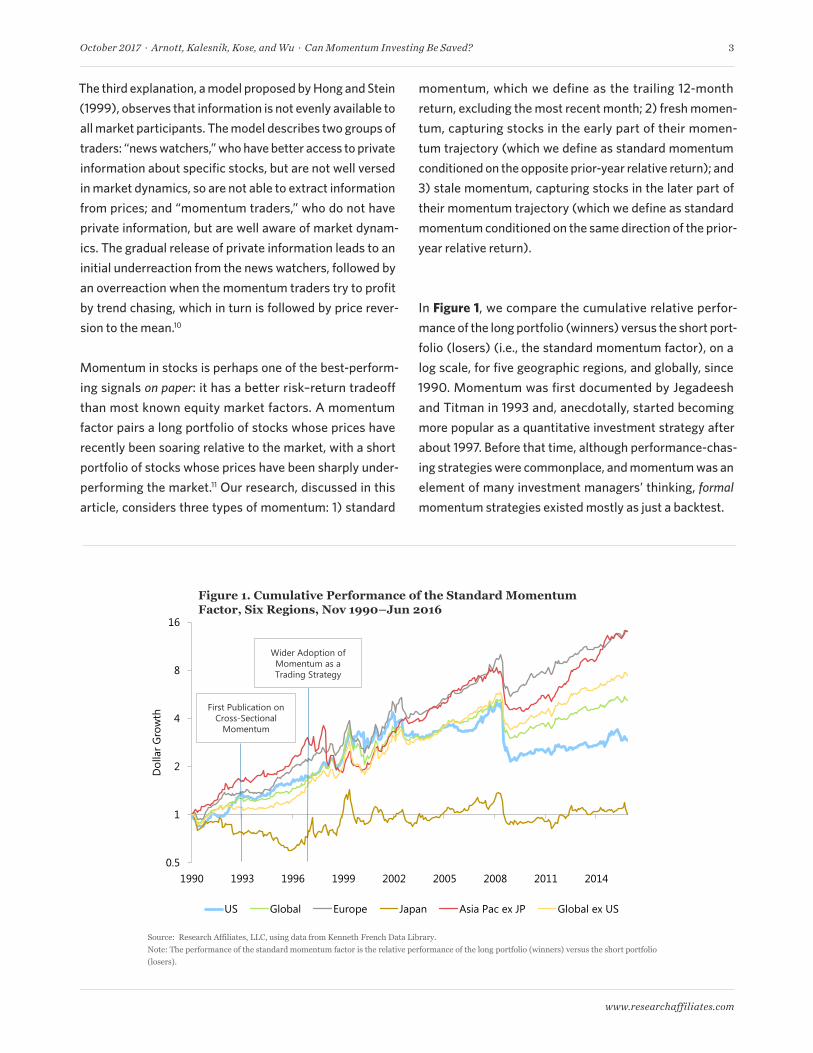
In Figure 1, we compare the cumulative relative perfor-mance of the long portfolio (winners) versus the short port-folio (losers) (i.e., the standard momentum factor), on a log scale, for five geographic regions, and globally, since 1990. Momentum was first documented by Jegadeesh and Titman in 1993 and, anecdotally, started becoming more popular as a quantitative investment strategy after about 1997. Before that time, although performance-chas-ing strategies were commonplace, and momentum was an element of many investment managers’ thinking, formal momentum strategies existed mostly as just a backtest.
0.5
1
2
4
8
16
1990 1993 1996 1999 2002 2005 2008 2011 2014
Dol
lar G
row
th
US Global Europe Japan Asia Pac ex JP Global ex US
First Publication on Cross-Sectional
Momentum
Wider Adoption of Momentum as a Trading Strategy
Any use of the above content is subject to all important legal disclosures, disclaimers, and terms of use found at www.researchaffiliates.com, which are fully incorporated by reference as if set out herein at length.
Source: Research Affiliates, LLC, using data from Kenneth French Data Library. Note: The performance of the standard momentum factor is the relative performance of the long portfolio (winners) versus the short portfolio (losers).
Figure 1. Cumulative Performance of the Standard Momentum Factor, Six Regions, Nov 1990–Jun 2016
October 2017 . Arnott, Kalesnik, Kose, and Wu . Can Momentum Investing Be Saved? 4
www.researchaffiliates.com
Momentum appears to be successful, everywhere except Japan. A closer look, however, reveals that the cumulative return for the standard momentum factor in the United States and Japan is no better now than in 1999, and for global markets remains below its 2007 peak. Two momen-tum crashes, in 2002 and 2009, took their toll on momen-tum factor performance in the United States by 28% and 54%, respectively, and the factor has not yet recovered. A momentum strategy is very vulnerable to crashes that tend to occur when the momentum trade is relatively expensive and in periods of heightened volatility. Momentum perfor-mance has also shown dismayingly high global correla-tion—especially during the crashes—since about 1999. All six regions show a momentum crash at the end of the tech bubble, at the end of the 2000–2002 bear market, and a big crash in 2009. There was nowhere to hide.
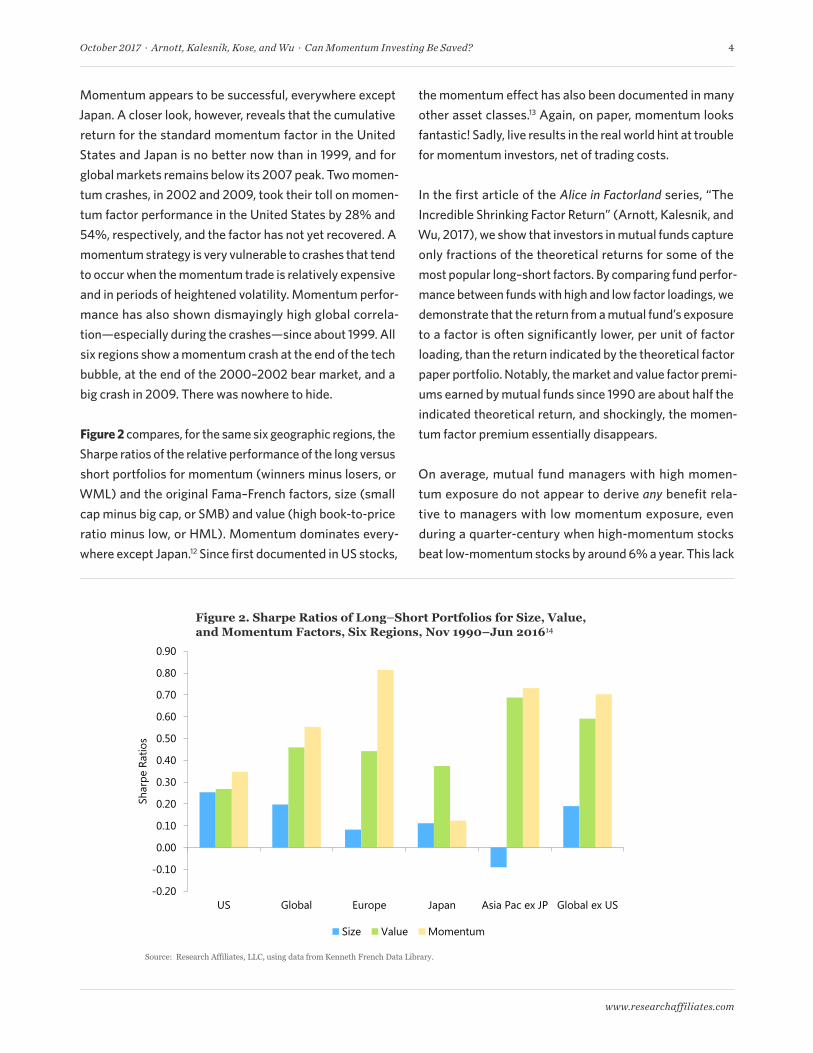
Figure 2 compares, for the same six geographic regions, the Sharpe ratios of the relative performance of the long versus short portfolios for momentum (winners minus losers, or WML) and the original Fama–French factors, size (small cap minus big cap, or SMB) and value (high book-to-price ratio minus low, or HML). Momentum dominates every-where except Japan.12 Since first documented in US stocks,
the momentum effect has also been documented in many other asset classes.13 Again, on paper, momentum looks fantastic! Sadly, live results in the real world hint at trouble for momentum investors, net of trading costs.
In the first article of the Alice in Factorland series, “The Incredible Shrinking Factor Return” (Arnott, Kalesnik, and Wu, 2017), we show that investors in mutual funds capture only fractions of the theoretical returns for some of the most popular long–short factors. By comparing fund perfor-mance between funds with high and low factor loadings, we demonstrate that the return from a mutual fund’s exposure to a factor is often significantly lower, per unit of factor loading, than the return indicated by the theoretical factor paper portfolio. Notably, the market and value factor premi-ums earned by mutual funds since 1990 are about half the indicated theoretical return, and shockingly, the momen-tum factor premium essentially disappears.
On average, mutual fund managers with high momen-tum exposure do not appear to derive any benefit rela-tive to managers with low momentum exposure, even during a quarter-century when high-momentum stocks beat low-momentum stocks by around 6% a year. This lack
-0.20
-0.10
0.00
0.10
0.20
0.30
0.40
0.50
0.60
0.70
0.80
0.90
US Global Europe Japan Asia Pac ex JP Global ex US
Shar
pe R
atio
s
Size Value Momentum
Any use of the above content is subject to all important legal disclosures, disclaimers, and terms of use found at www.researchaffiliates.com, which are fully incorporated by reference as if set out herein at length.
Source: Research Affiliates, LLC, using data from Kenneth French Data Library.
Figure 2. Sharpe Ratios of Long–Short Portfolios for Size, Value, and Momentum Factors, Six Regions, Nov 1990–Jun 201614
October 2017 . Arnott, Kalesnik, Kose, and Wu . Can Momentum Investing Be Saved? 5
www.researchaffiliates.com
of benefit from momentum breaks neatly into two peri-ods: a large benefit was earned in the 1990s, and nearly all reversed in the years following. Perhaps some individual momentum strategies might have bucked this pattern by providing substantial, reliable alpha.15 An exhaustive explo-ration of the many flavors of momentum is difficult, and far beyond the scope of our research. In any event, were these new momentum strategies developed in the 1990s? Did these momentum variants work on live assets, or only on paper, with the blessings of hindsight?
In this article we examine the gap between theoretical and live portfolio performance in detail. Let’s begin by digging into the problems of momentum in live portfolios, then explore ways to potentially fix these problems.
The Momentum Gap: Live versus Paper PerformanceThe gap between paper portfolios and live results is very real. In our first test, we select mutual funds using the Morningstar database of mutual fund performance that have specific keywords in their names. We combine funds sharing a specific keyword into one basket and compute the performance of these baskets of funds (a description of our data and method are in the online appendix). We limit this survey to US-benchmarked funds with at least one year of live history, using whichever of three share classes (insti-tutional, A, or no-load) has the longest history.
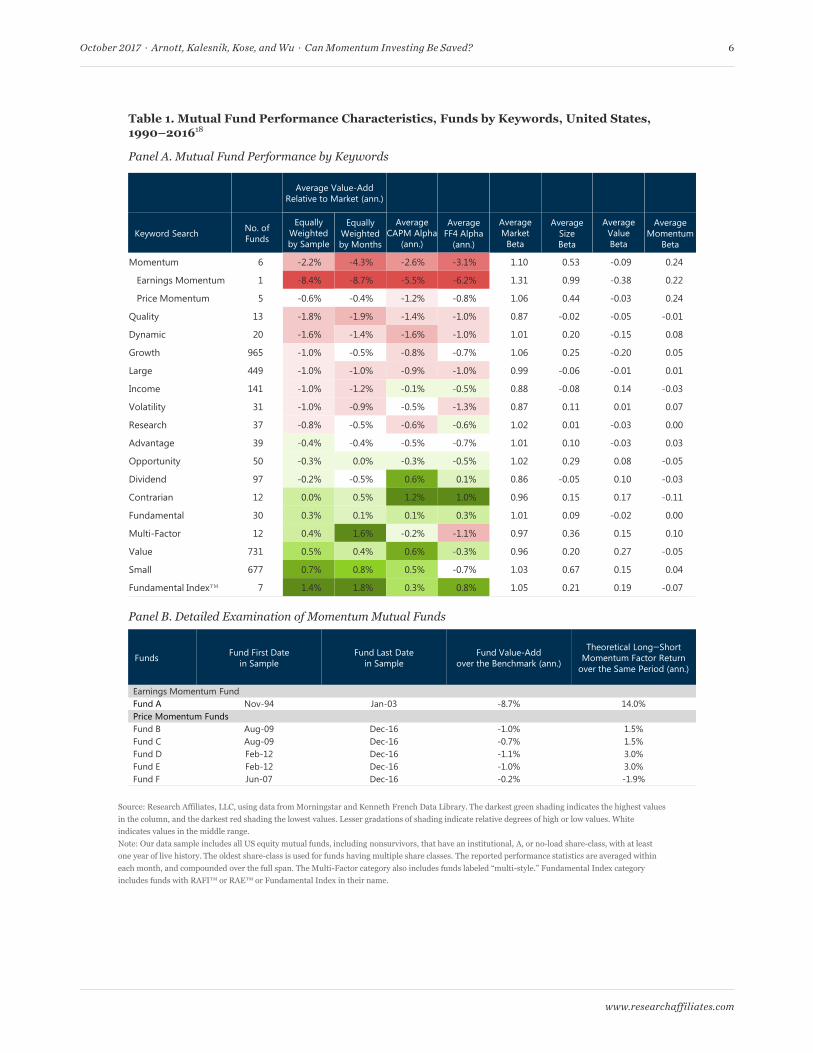
We show in Table 1, Panel A, the performance character-istics of these funds, for an array of keyword searches in the fund names. We compute two measures of value-add relative to the market: 1) equally weighted by sample, for which we equally weight the fund-month observations (“first method”); and 2) equally weighted by months, for which we combine funds available at a given month into an equally weighted portfolio of those funds and compute the value-add of the portfolio (“second method”). The first approach gives 10 times as much weight to months with 10 live funds as to months with 1 fund; the second gives equal weight to all months with at least 1 fund that meets the keyword search. We display the fund category results in ascending order of their value-add relative to the capital-
ization-weighted market, based on the first method, which is equally weighted by sample.
To be sure, the naming of a fund is more a marketing exer-cise than an objective statement of fund purpose. Neverthe-less, it seems a reasonable assumption that if “momentum” is in the fund name, the manager must want to be perceived as a momentum expert. Six such funds with a US bench-mark are in the Morningstar database. Of all the keywords we considered, these six funds with the keyword “momen-tum” have the highest average momentum loadings, vali-dating they are indeed trying to benefit from momentum.
These so-labeled momentum funds were the worst-per-forming category of funds in our research in terms of value-add relative to the market. On average, they under-performed the market −2.2% a year when weighting by the first method, and by a whopping −4.3% a year using the second method. These funds yielded an average −2.6% CAPM alpha and −3.1% four-factor alpha (using the Fama–French three-factor model plus the standard momentum factor). In other words, the investors in these funds expe-rienced a 3.1% annualized average shortfall relative to the performance of the paper portfolios their factor load-ings were replicating. If these funds had been able to fully capture their factor premia, they would have outperformed the market by roughly 0.9% a year (3.1% better than their 2.2% average shortfall).
The small number of momentum funds in the database allows us to look at them in more detail. Only one fund, which self-identified with the tag “earnings momentum,” was live from November 1994 to January 2003. Not until four years later in June 2007 did any funds again use a momentum tag. Although earnings momentum and price momentum are definitely related (e.g., Novy-Marx, 2015, provides evidence that earnings momentum is the main
“Price impact of trading costs…makes standard momentum…a very expensive strategy.”
October 2017 . Arnott, Kalesnik, Kose, and Wu . Can Momentum Investing Be Saved? 6
www.researchaffiliates.com
Any use of the above content is subject to all important legal disclosures, disclaimers, and terms of use found at www.researchaffiliates.com, which are fully incorporated by reference as if set out herein at length.
Source: Research Affiliates, LLC, using data from Morningstar and Kenneth French Data Library. The darkest green shading indicates the highest values in the column, and the darkest red shading the lowest values. Lesser gradations of shading indicate relative degrees of high or low values. White indicates values in the middle range.Note: Our data sample includes all US equity mutual funds, including nonsurvivors, that have an institutional, A, or no-load share-class, with at least one year of live history. The oldest share-class is used for funds having multiple share classes. The reported performance statistics are averaged within each month, and compounded over the full span. The Multi-Factor category also includes funds labeled “multi-style.” Fundamental Index category includes funds with RAFI™ or RAE™ or Fundamental Index in their name.
Table 1. Mutual Fund Performance Characteristics, Funds by Keywords, United States, 1990–201618
Panel A. Mutual Fund Performance by Keywords
Average Value-AddRelative to Market (ann.)
Keyword Search No. of Funds
EquallyWeighted by Sample
Equally Weighted by Months
Average CAPM Alpha
(ann.)
Average FF4 Alpha
(ann.)
Average Market
Beta
Average Size Beta
Average Value Beta
Average Momentum
Beta
Momentum 6 -2.2% -4.3% -2.6% -3.1% 1.10 0.53 -0.09 0.24
Earnings Momentum 1 -8.4% -8.7% -5.5% -6.2% 1.31 0.99 -0.38 0.22
Price Momentum 5 -0.6% -0.4% -1.2% -0.8% 1.06 0.44 -0.03 0.24
Quality 13 -1.8% -1.9% -1.4% -1.0% 0.87 -0.02 -0.05 -0.01
Dynamic 20 -1.6% -1.4% -1.6% -1.0% 1.01 0.20 -0.15 0.08
Growth 965 -1.0% -0.5% -0.8% -0.7% 1.06 0.25 -0.20 0.05
Large 449 -1.0% -1.0% -0.9% -1.0% 0.99 -0.06 -0.01 0.01
Income 141 -1.0% -1.2% -0.1% -0.5% 0.88 -0.08 0.14 -0.03
Volatility 31 -1.0% -0.9% -0.5% -1.3% 0.87 0.11 0.01 0.07
Research 37 -0.8% -0.5% -0.6% -0.6% 1.02 0.01 -0.03 0.00
Advantage 39 -0.4% -0.4% -0.5% -0.7% 1.01 0.10 -0.03 0.03
Opportunity 50 -0.3% 0.0% -0.3% -0.5% 1.02 0.29 0.08 -0.05
Dividend 97 -0.2% -0.5% 0.6% 0.1% 0.86 -0.05 0.10 -0.03
Contrarian 12 0.0% 0.5% 1.2% 1.0% 0.96 0.15 0.17 -0.11
Fundamental 30 0.3% 0.1% 0.1% 0.3% 1.01 0.09 -0.02 0.00
Multi-Factor 12 0.4% 1.6% -0.2% -1.1% 0.97 0.36 0.15 0.10
Value 731 0.5% 0.4% 0.6% -0.3% 0.96 0.20 0.27 -0.05
Small 677 0.7% 0.8% 0.5% -0.7% 1.03 0.67 0.15 0.04
Fundamental Index™ 7 1.4% 1.8% 0.3% 0.8% 1.05 0.21 0.19 -0.07
Panel B. Detailed Examination of Momentum Mutual Funds
Funds Fund First Date in Sample
Fund Last Date in Sample
Fund Value-Add over the Benchmark (ann.)
Theoretical Long–Short Momentum Factor Return
over the Same Period (ann.)
Earnings Momentum FundFund A Nov-94 Jan-03 -8.7% 14.0%Price Momentum FundsFund B Aug-09 Dec-16 -1.0% 1.5%Fund C Aug-09 Dec-16 -0.7% 1.5%Fund D Feb-12 Dec-16 -1.1% 3.0%Fund E Feb-12 Dec-16 -1.0% 3.0%Fund F Jun-07 Dec-16 -0.2% -1.9%
October 2017 . Arnott, Kalesnik, Kose, and Wu . Can Momentum Investing Be Saved? 7
www.researchaffiliates.com
driver of price momentum), the two are somewhat distinct. Therefore, we divide our sample into those funds labeled as earnings momentum and those labeled as price momen-tum in order to conduct a more detailed examination.
We report in Table 1, Panel B, the performance character-istics of the six individual momentum funds. As reported in Panel A of Table 1, the average annual underperformance of −2.2% a year (for still-extant funds, this is through year-end 2016),17 net of all trading costs and fees, is heavily skewed downward by the poor results of the single earn-ings momentum fund. But the other five funds hardly show exemplary results, even though the momentum factor has delivered a return of nearly 5.0% a year since the start of our study in 1990, and over 3.0% a year since the March–September 2009 momentum crash. As Panel B shows, only Fund F can blame the poor performance of the momentum factor for its low return. The other funds have underper-formed in periods when momentum delivered a decent return on paper in the theoretical long–short momentum factor portfolio.
The performance of the earnings momentum fund was horrid, returning a whopping −8.4% a year and generating an annualized −6.2% four-factor alpha. Let’s not let the word “earnings” deceive us; this was a real momentum fund with a very strong momentum loading of 0.22—only a notch lower than the loading of the price momentum funds at 0.24. The other five funds, by contrast, fared signifi-cantly better. They underperformed the benchmark by
“only” −0.6% a year using the first method (and by −0.4% by the second method), with a four-factor Fama–French alpha of “only” −0.8%.
Other fund groups that show a high momentum-factor loading are multi-factor and dynamic. The momentum loadings for these groups are 0.10 and 0.08, respectively (about one-half to one-third the 0.24 loading for the funds self-identifying as momentum). The multi-factor group outperforms the benchmark by 0.4% a year (1.6% by the second measure), while the dynamic group lags the bench-mark by −1.6% a year (−1.4% by the second measure); the two have annualized four-factor alphas of −1.1% and −1.0%, respectively. (A brief analysis of the strategies with the
other keywords listed in Table 1, Panel A, is provided in the online appendix.)
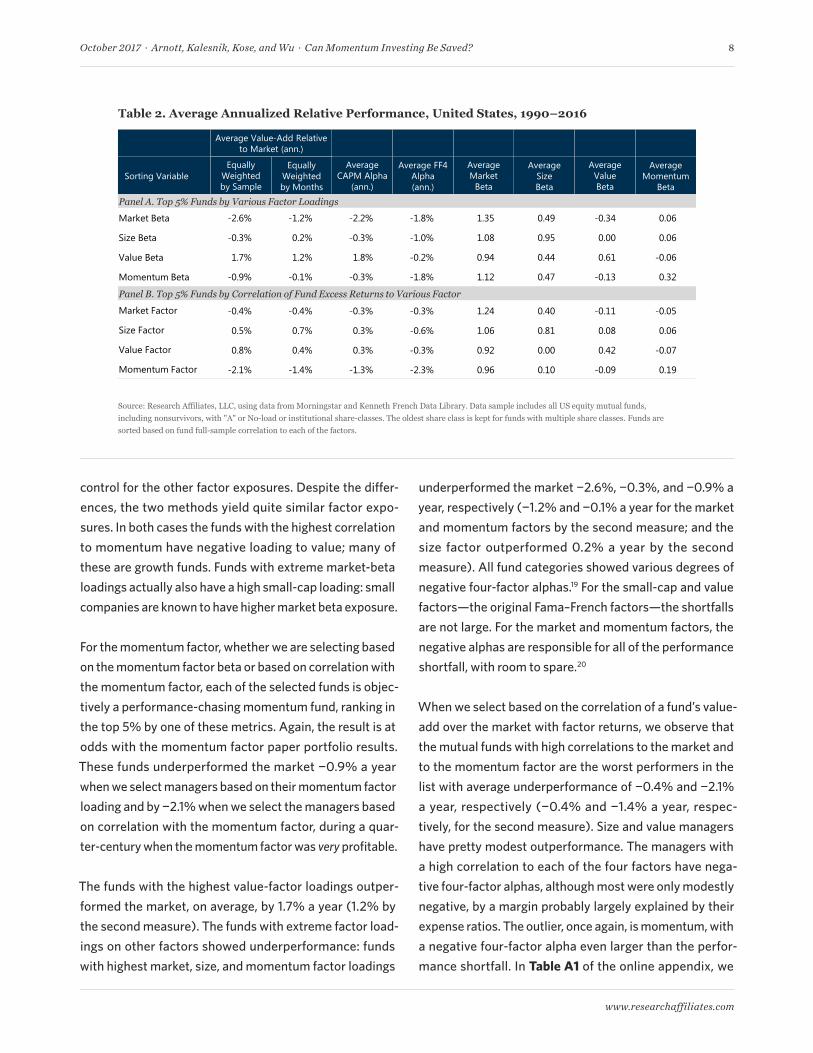
We acknowledge the keyword method we use to examine the performance of the momentum funds has the potential to miss funds that are betting heavily on momentum, but do not choose to identify as such. To address this problem, we broaden our universe to include all funds ranked in the top 5%, based on correlation or beta, with each factor in the standard four-factor Fama–French model, each month. These funds have the highest correlation or beta expo-sure to one of the market, small-cap, value, or momentum factors.18 Our universe then expands to over 20 funds at the start of our analysis, and roughly 100 funds (80 to 110 funds) during the current decade.
In Table 2, Panel A, we report the performance characteris-tics of the funds with the highest factor loadings. We repeat the same exercise selecting the 5% of funds with the high-est correlation of value-add to the list of factors, and display performance characteristics for this list of funds in Panel B. For momentum, this means we are looking for the 5% of funds with the highest momentum factor loading (the momentum beta in a multivariate four-factor Fama–French regression) in Panel A, or with the highest correlation of the fund’s excess return, relative to the benchmark, with the momentum factor in Panel B.
The first measure, which is based on a multi-factor regres-sion, selects funds with the largest exposures controlling for the other factor exposures. Its drawback is that the regres-sion coefficient may be sensitive to outliers. The correla-tion-based measure is somewhat less sensitive to outliers and is a function of how much of the fund’s value-add is explained by the specific factor exposure. The biggest difference is that selection based on correlation does not
“An investor should…consider using momentum to block trades initiated by other strategies.”
October 2017 . Arnott, Kalesnik, Kose, and Wu . Can Momentum Investing Be Saved? 8
www.researchaffiliates.com
control for the other factor exposures. Despite the differ-ences, the two methods yield quite similar factor expo-sures. In both cases the funds with the highest correlation to momentum have negative loading to value; many of these are growth funds. Funds with extreme market-beta loadings actually also have a high small-cap loading: small companies are known to have higher market beta exposure.
For the momentum factor, whether we are selecting based on the momentum factor beta or based on correlation with the momentum factor, each of the selected funds is objec-tively a performance-chasing momentum fund, ranking in the top 5% by one of these metrics. Again, the result is at odds with the momentum factor paper portfolio results. These funds underperformed the market −0.9% a year when we select managers based on their momentum factor loading and by −2.1% when we select the managers based on correlation with the momentum factor, during a quar-ter-century when the momentum factor was very profitable.
The funds with the highest value-factor loadings outper-formed the market, on average, by 1.7% a year (1.2% by the second measure). The funds with extreme factor load-ings on other factors showed underperformance: funds with highest market, size, and momentum factor loadings
underperformed the market −2.6%, −0.3%, and −0.9% a year, respectively (−1.2% and −0.1% a year for the market and momentum factors by the second measure; and the size factor outperformed 0.2% a year by the second measure). All fund categories showed various degrees of negative four-factor alphas.19 For the small-cap and value factors—the original Fama–French factors—the shortfalls are not large. For the market and momentum factors, the negative alphas are responsible for all of the performance shortfall, with room to spare.20
When we select based on the correlation of a fund’s value-add over the market with factor returns, we observe that the mutual funds with high correlations to the market and to the momentum factor are the worst performers in the list with average underperformance of −0.4% and −2.1% a year, respectively (−0.4% and −1.4% a year, respec-tively, for the second measure). Size and value managers have pretty modest outperformance. The managers with a high correlation to each of the four factors have nega-tive four-factor alphas, although most were only modestly negative, by a margin probably largely explained by their expense ratios. The outlier, once again, is momentum, with a negative four-factor alpha even larger than the perfor-mance shortfall. In Table A1 of the online appendix, we
Any use of the above content is subject to all important legal disclosures, disclaimers, and terms of use found at www.researchaffiliates.com, which are fully incorporated by reference as if set out herein at length.
Source: Research Affiliates, LLC, using data from Morningstar and Kenneth French Data Library. Data sample includes all US equity mutual funds, including nonsurvivors, with "A" or No-load or institutional share-classes. The oldest share class is kept for funds with multiple share classes. Funds are sorted based on fund full-sample correlation to each of the factors.
Table 2. Average Annualized Relative Performance, United States, 1990–2016
Average Value-Add Relative to Market (ann.)
Sorting VariableEqually
Weighted by Sample
Equally Weighted by Months
Average CAPM Alpha
(ann.)
Average FF4 Alpha (ann.)
Average Market
Beta
AverageSize Beta
Average Value Beta
Average Momentum
Beta
Panel A. Top 5% Funds by Various Factor Loadings
Market Beta -2.6% -1.2% -2.2% -1.8% 1.35 0.49 -0.34 0.06
Size Beta -0.3% 0.2% -0.3% -1.0% 1.08 0.95 0.00 0.06
Value Beta 1.7% 1.2% 1.8% -0.2% 0.94 0.44 0.61 -0.06
Momentum Beta -0.9% -0.1% -0.3% -1.8% 1.12 0.47 -0.13 0.32
Panel B. Top 5% Funds by Correlation of Fund Excess Returns to Various Factor
Market Factor -0.4% -0.4% -0.3% -0.3% 1.24 0.40 -0.11 -0.05
Size Factor 0.5% 0.7% 0.3% -0.6% 1.06 0.81 0.08 0.06
Value Factor 0.8% 0.4% 0.3% -0.3% 0.92 0.00 0.42 -0.07
Momentum Factor -2.1% -1.4% -1.3% -2.3% 0.96 0.10 -0.09 0.19
October 2017 . Arnott, Kalesnik, Kose, and Wu . Can Momentum Investing Be Saved? 9
www.researchaffiliates.com
display results for a similar exercise based on selecting the top 10% of funds based on either factor loading or value-add correlation; the results are directionally similar, although the magnitudes are (predictably) only about half as large, on average.
Mutual fund data show that investors are able to benefit (a little) from the value effect, net of all fees and trading costs. The same data show that investors are not able to benefit from the momentum premium, even during a quarter-cen-tury with robust paper portfolio performance. Once again, we observe a large (and highly economically significant) gap between the premium demonstrated by long–short momentum portfolios on paper and the returns earned by live funds. Momentum funds are generally unable to translate the high paper portfolio momentum premium into profits for their investors.
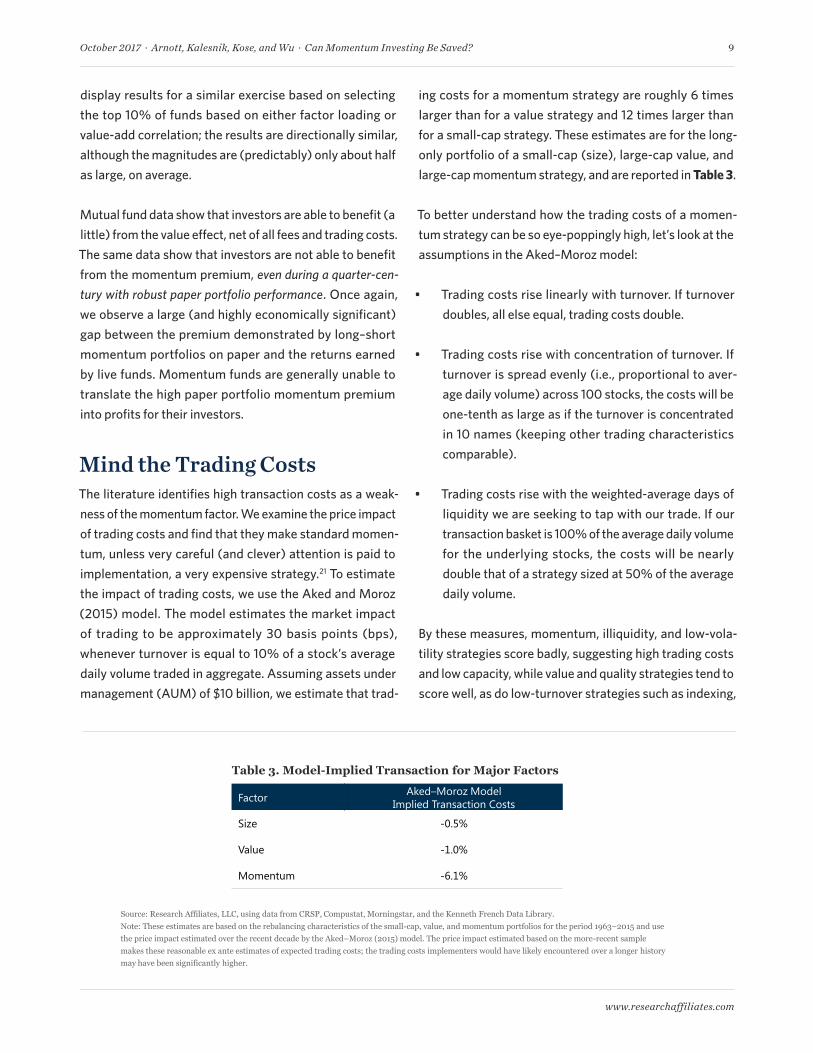
Mind the Trading CostsThe literature identifies high transaction costs as a weak-ness of the momentum factor. We examine the price impact of trading costs and find that they make standard momen-tum, unless very careful (and clever) attention is paid to implementation, a very expensive strategy.21 To estimate the impact of trading costs, we use the Aked and Moroz (2015) model. The model estimates the market impact of trading to be approximately 30 basis points (bps), whenever turnover is equal to 10% of a stock’s average daily volume traded in aggregate. Assuming assets under management (AUM) of $10 billion, we estimate that trad-
ing costs for a momentum strategy are roughly 6 times larger than for a value strategy and 12 times larger than for a small-cap strategy. These estimates are for the long-only portfolio of a small-cap (size), large-cap value, and large-cap momentum strategy, and are reported in Table 3.
To better understand how the trading costs of a momen-tum strategy can be so eye-poppingly high, let’s look at the assumptions in the Aked–Moroz model:
• Trading costs rise linearly with turnover. If turnover doubles, all else equal, trading costs double.
• Trading costs rise with concentration of turnover. If turnover is spread evenly (i.e., proportional to aver-age daily volume) across 100 stocks, the costs will be one-tenth as large as if the turnover is concentrated in 10 names (keeping other trading characteristics comparable).
• Trading costs rise with the weighted-average days of liquidity we are seeking to tap with our trade. If our transaction basket is 100% of the average daily volume for the underlying stocks, the costs will be nearly double that of a strategy sized at 50% of the average daily volume.
By these measures, momentum, illiquidity, and low-vola-tility strategies score badly, suggesting high trading costs and low capacity, while value and quality strategies tend to score well, as do low-turnover strategies such as indexing,
Any use of the above content is subject to all important legal disclosures, disclaimers, and terms of use found at www.researchaffiliates.com, which are fully incorporated by reference as if set out herein at length.
Source: Research Affiliates, LLC, using data from CRSP, Compustat, Morningstar, and the Kenneth French Data Library.Note: These estimates are based on the rebalancing characteristics of the small-cap, value, and momentum portfolios for the period 1963–2015 and use the price impact estimated over the recent decade by the Aked–Moroz (2015) model. The price impact estimated based on the more-recent sample makes these reasonable ex ante estimates of expected trading costs; the trading costs implementers would have likely encountered over a longer history may have been significantly higher.
Table 3. Model-Implied Transaction for Major Factors
Factor Aked–Moroz Model Implied Transaction Costs
Size -0.5%
Value -1.0%
Momentum -6.1%
October 2017 . Arnott, Kalesnik, Kose, and Wu . Can Momentum Investing Be Saved? 10
www.researchaffiliates.com
equal-weight, and Fundamental Index™. It may be easy to argue with the magnitude of the numbers in Table 3. But if the basic assumptions of the Aked–Moroz model seem reasonable, it would be difficult to argue with the relative magnitude of these estimated annual transaction costs. In other words, momentum trading costs may or may not consume 6.1% a year (at $10 billion AUM), but they will very likely consume about 12 times as much as a small-cap strategy.
How We Can Save MomentumEven though momentum has “worked” historically, deliv-ering a terrific alpha in a long–short paper portfolio,22 momentum mutual funds have failed to capture this alpha. Trading costs are a very likely culprit of this discrepancy because turnover is exceptionally high, but in addition to minding trading costs, investors can take other steps to preserve the potential that momentum can bring to an investing strategy:
• Successful momentum investing is at least as reliant on its sell discipline as on its buy discipline. Most factors decay—they peter out over time—but they don’t turn against us. Momentum is different. It reverses after a few months, eventually giving up all of its gains and then some, for those who do not reverse their positions in time. As we will demonstrate, successful momen-tum investing requires that we eliminate stocks that no longer exhibit strong momentum, rather than waiting until they have poor momentum.
• Momentum can be divided into fresh and stale momentum, with very different results. Stocks that have exhibited strong momentum for two or more years are both very expensive and tired; this is stale momentum. Momentum essentially fails, especially net of trading costs, for stale momentum companies. 23
A momentum strategy, on average, favors expensive stocks. In periods when a momentum strategy becomes particu-larly expensive relative to the historical distribution of a stock’s price, that stock’s momentum tends to crash. Avoid-ing momentum exposures at the times when momentum strongly trades against value may be prudent as demon-
strated by Arnott et al. (2016) and Arnott, Beck, and Kale-snik (2016a,b). Because our previously published research has examined this phenomenon in detail, we now turn our attention to gaining a better understanding of the benefits of a strong sell discipline and of avoiding stale momentum.
Sell Discipline Is More Important than Buy DisciplineMomentum factor returns, such as those shown in Figure 1, are generally calculated monthly, reconstituting a new long–short portfolio each month. The theoretical paper portfolio rebalances every single month, replacing the stocks in the long portfolio that are no longer soaring with new fliers, and replacing the stocks in the short portfolio that are no longer in freefall with new losers. This way the strategy is able to capture, over and over again, the strong returns typically earned in the first month (plus or minus its historical distribution uncertainty) of holding a long–short momentum portfolio. The problem is that in the real world, we cannot trade at month-end closing prices, for free, on an institutional scale. Lacking the ability to fully replicate the conditions the theoretical factor assumes, momentum’s payoff pattern shows a reward that tapers off pretty quickly.
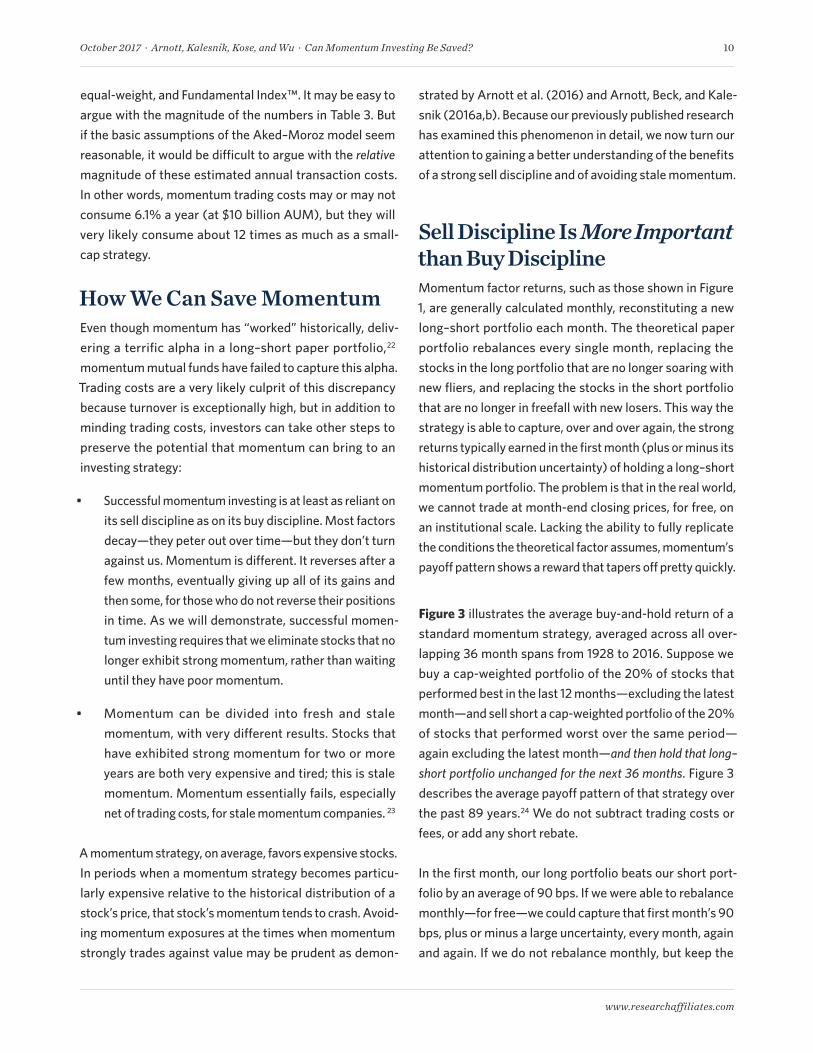
Figure 3 illustrates the average buy-and-hold return of a standard momentum strategy, averaged across all over-lapping 36 month spans from 1928 to 2016. Suppose we buy a cap-weighted portfolio of the 20% of stocks that performed best in the last 12 months—excluding the latest month—and sell short a cap-weighted portfolio of the 20% of stocks that performed worst over the same period—again excluding the latest month—and then hold that long–short portfolio unchanged for the next 36 months. Figure 3 describes the average payoff pattern of that strategy over the past 89 years.24 We do not subtract trading costs or fees, or add any short rebate.
In the first month, our long portfolio beats our short port-folio by an average of 90 bps. If we were able to rebalance monthly—for free—we could capture that first month’s 90 bps, plus or minus a large uncertainty, every month, again and again. If we do not rebalance monthly, but keep the
October 2017 . Arnott, Kalesnik, Kose, and Wu . Can Momentum Investing Be Saved? 11
www.researchaffiliates.com
same portfolio, the strategy earns an additional 77 bps in the second month, then 57 bps in the third month, and so forth. After eight months, the momentum portfolio starts to lose money. After less than two years (24 months), the portfolio has lost all of its gains and is underwater. This makes intuitive sense because momentum has us buying more expensive stocks, on average, than the stocks we are short—both more expensive relative to their recent histories and (usually) more expensive in terms of valua-tion ratios.25
The value literature tells us that cheaper stocks outper-form, on average, but with a long and slow payoff. Figure 3 vividly highlights a vulnerability in momentum investing: momentum has a half-life of barely three months, then value overcomes momentum, on average, in less than a year, and overwhelms its cumulative gain in less than two years.26 By contrast, value has a half-life measured in years, not months, and it never turns south. This means that with momentum—perhaps uniquely among all major factors—the sell discipline is extraordinarily important.
Let’s look again at Figure 3. Granted, the first month gives us nearly a 1.0% return, before trading costs, but if we hold the portfolio until momentum is flat on a 12-month basis, labeled point A on the figure, we would earn just 2.4% over 15 months, or 0.16% a month. Suppose we wait until momentum reaches the bottom quartile before we liqui-date. That takes us to about point B, where we would earn an average of less than 1.0% over a two-year span on a long–short portfolio, without any allowance for trading costs or fees. Momentum has likely earned us nothing.
One way to deal with the sell-discipline problem is to never buy in the first place! We are not suggesting an investor should ignore momentum, but to consider using momentum to block trades initiated by other strategies. Suppose, for example, a value strategy tells us to sell a hot stock that’s on a tear. Suppose, at the same time, our value strategy tells us to buy a lousy company that is in freefall. If momen-tum is used to defer both of these trades until the momen-tum (strong for the former, weak for the latter) dissipates, then we are able to catch the early performance illustrated in Figure 3, without suffering from the later performance
-2%
-1%
0%
1%
2%
3%
4%
5%
0 6 12 18 24 30 36
Cum
ulat
ive
Futu
re R
etur
ns
Number of Months
Standard Momentum
A
B
Any use of the above content is subject to all important legal disclosures, disclaimers, and terms of use found at www.researchaffiliates.com, which are fully incorporated by reference as if set out herein at length.
Source: Research Affiliates, LLC, using data from CRSP.
Figure 3. Return Trajectory of the Momentum Factor, United States, Feb 1928–Jun 2016

October 2017 . Arnott, Kalesnik, Kose, and Wu . Can Momentum Investing Be Saved? 12
www.researchaffiliates.com
dissipation; when momentum dissipates, the trade would no longer be blocked.
On average, a stock in the momentum long–short port-folios (20% long and 20% short), drops out after about five months. Individual examples will be all over the lot, of course, ranging from far shorter to far longer. In our average experience, however, Figure 3 shows that we would have earned a 3.33% benefit on this pair of deferred trades in that first five months (or 8.0% a year).
To gauge the performance impact of momentum-based trade blocking, consider a value strategy with 50% annual turnover. Suppose that at least 20% of this turnover will be blocked. The actual amount is probably much higher because buys are more likely to have weak momentum than strong, and hence to be blocked, and sells are more likely to have strong momentum than weak, and hence to be blocked. Note that the blocking will not cut turnover, just delay the trades. If our strategy has 50% turnover, if 20% of the trades are deferred, and if trade blocking delivers 8.00% a year on each pair of blocked trades, we’ve just boosted the performance of our value strategy by 120 bps a year. Not bad!!
We know anecdotally that Dimensional Fund Advisors and a few other managers have been using this approach for almost as long as momentum has been a topic of academic study. We have also used this method for years. The trad-ing costs are free, because we’re not doing any trading we weren’t going to do anyway.
What have we foregone because of missed trades? Noth-ing. We’re merely deferring trades until the momentum has fizzled. What incremental trading costs are we facing? None. Trades are deferred, none are initiated. What costs
are we facing from the short portfolio in our momentum strategy? None, because we’re not shorting or leveraging our portfolio, merely blocking purchases that have terrible momentum, and that may be more sensible to buy when the stock’s price is no longer in freefall.
The sell discipline becomes a problem only if we are proac-tively using momentum to initiate trades. We then need a rule to decide when to reverse those trades. If we are initiat-ing trades, the round-trip trading cost must be covered with the momentum alpha. If we fail to cover that cost with alpha, averaged across thousands of trades, then momentum will hurt us, not help us. We would surmise this is a major contributing factor to the observed slippage between the lofty paper portfolio returns for a long–short momentum factor over the last quarter-century and the zero-to-nega-tive relative performance results for most momentum and momentum-tilted funds.
The Perils of Stale MomentumFigure 3 showed the trajectory for momentum based on prior 12-month performance, ignoring all other information about the prior return. Some stocks selected in this mix are in the early stage of their momentum trajectory, having just experienced wonderful news that market participants have perhaps underreacted to; these stocks may generate a healthy momentum premium. Some stocks selected by this rule are in their second or third year of robust momentum (or for the short portfolio, in their second or third year of meltdown). These stocks are mostly already very expensive (or, for the short side, very cheap) due to market partici-pants’ overreaction; they are unlikely to present any posi-tive surprises (negative surprises for the wrung-out short stocks) for investors.
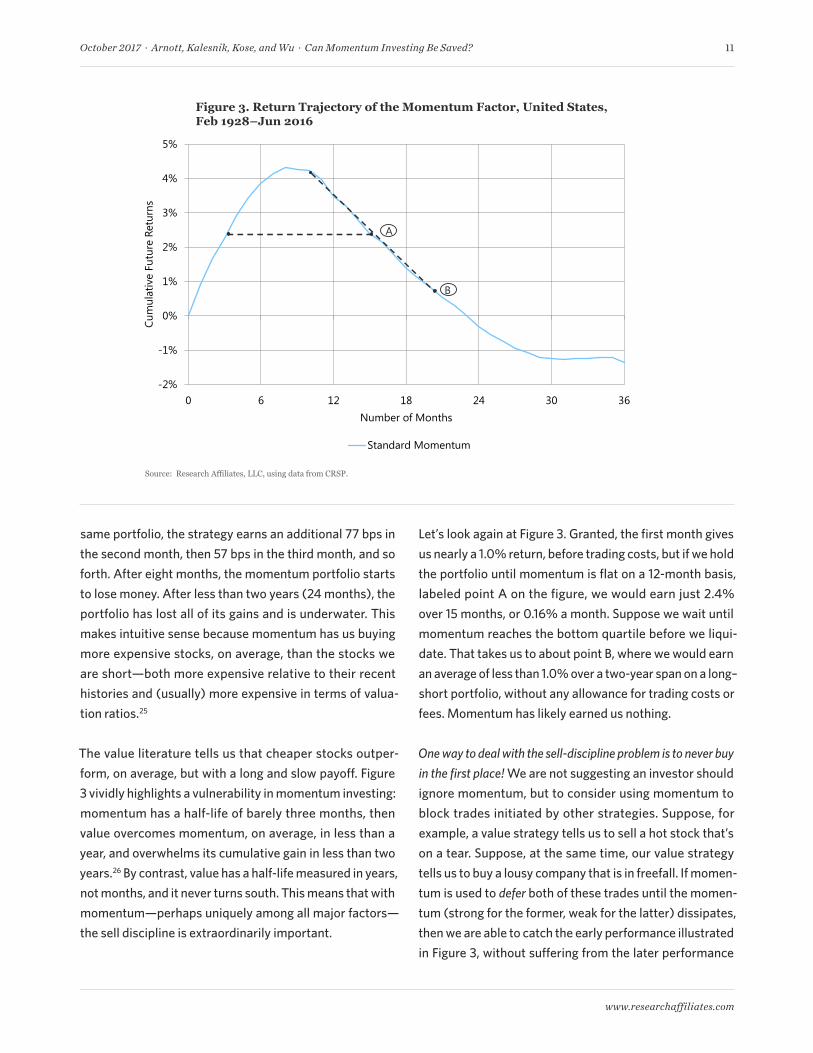
Figure 4 recreates the line in Figure 3, and also shows two special segments of our universe: stocks with fresh momentum and stocks with stale momentum. Following Chen, Kadan, and Kose (2012), we condition on the stock price movement prior to the last year—the period we use to identify momentum stocks.27 Thus, we form two additional portfolios within the momentum portfolio:
“Investors will be better off if their strategies avoid stocks with stale momentum.”
October 2017 . Arnott, Kalesnik, Kose, and Wu . Can Momentum Investing Be Saved? 13
www.researchaffiliates.com
• Stale momentum portfolio. We select the 20% of stocks with the most extreme performance in the same direc-tion that we used for momentum selection in the 12 months preceding the last year. The stocks in the long portfolio are among the 20% best performers in the previous 12 months; the stocks in the short portfolio are among the 20% worst performers in the prior 12 months. As such, each portfolio consists of only about 4% of the stocks in the market. The top quintile repeat-ers versus the bottom quintile repeaters.
• Fresh momentum portfolio. We select the 20% of stocks with the most extreme performance in the opposite direction to the one we used for momentum selection in the 12 months preceding the last year, and follow the same construction rules as outlined for the stale momentum portfolio. These are reversal portfolios and turnaround situations.
The cumulative performance for the stale portfolio reaches its performance peak at just over 1% by month 5, much earlier than the standard momentum peak. After this
modest peak, the portfolio begins a relentless march down-ward, wasting all gains by month 10 and losing investors an impressive 8% by month 36.
Momentum funds should avoid stale momentum stocks, on both sides of the portfolio. Stale winners have little, if any, follow through; and stale losers are wrung out, cheap, and often ready to rebound. We leave it to others to exam-ine whether the damage is greater on the long side or the short side, and whether the damage is more or less severe based on the actual valuation levels of the individual stocks in these portfolios.
Fresh momentum shows a much more attractive trajectory. The strategy reaches its cumulative performance peak of about 7% by month 11. Only about half of the gain is even-tually ceded through mean reversion; even by month 36, fresh momentum still shows a respectable cumulative gain of almost 4%. The high cumulative performance reduces the need to trade too quickly and can reduce the total turn-over and trading costs for the strategy. Recall, however, the portfolio is small, with only 4% of the market on either side of the long–short portfolio.
Any use of the above content is subject to all important legal disclosures, disclaimers, and terms of use found at www.researchaffiliates.com, which are fully incorporated by reference as if set out herein at length.
Source: Research Affiliates, LLC, using data from CRSP.
Figure 4. Return Trajectory of the Momentum Factor, United States, Feb 1928–Jun 2016
-9%
-6%
-3%
0%
3%
6%
9%
0 6 12 18 24 30 36
Cum
ulat
ive
Futu
re R
etur
ns
Number of Months
Standard Momentum Stale Momentum Fresh Momentum
October 2017 . Arnott, Kalesnik, Kose, and Wu . Can Momentum Investing Be Saved? 14
www.researchaffiliates.com
The best way to benefit from fresh momentum is not, as a first reaction to the graph might indicate, to shorten the holding period. Doing so would lead to prohibitively high transaction costs from high turnover, as well as eliminating the benefit of typically longer momentum follow-through on these stocks. Instead, the best approach is to avoid hold-ing stale momentum stocks that have been on a momentum trajectory for two or more years.
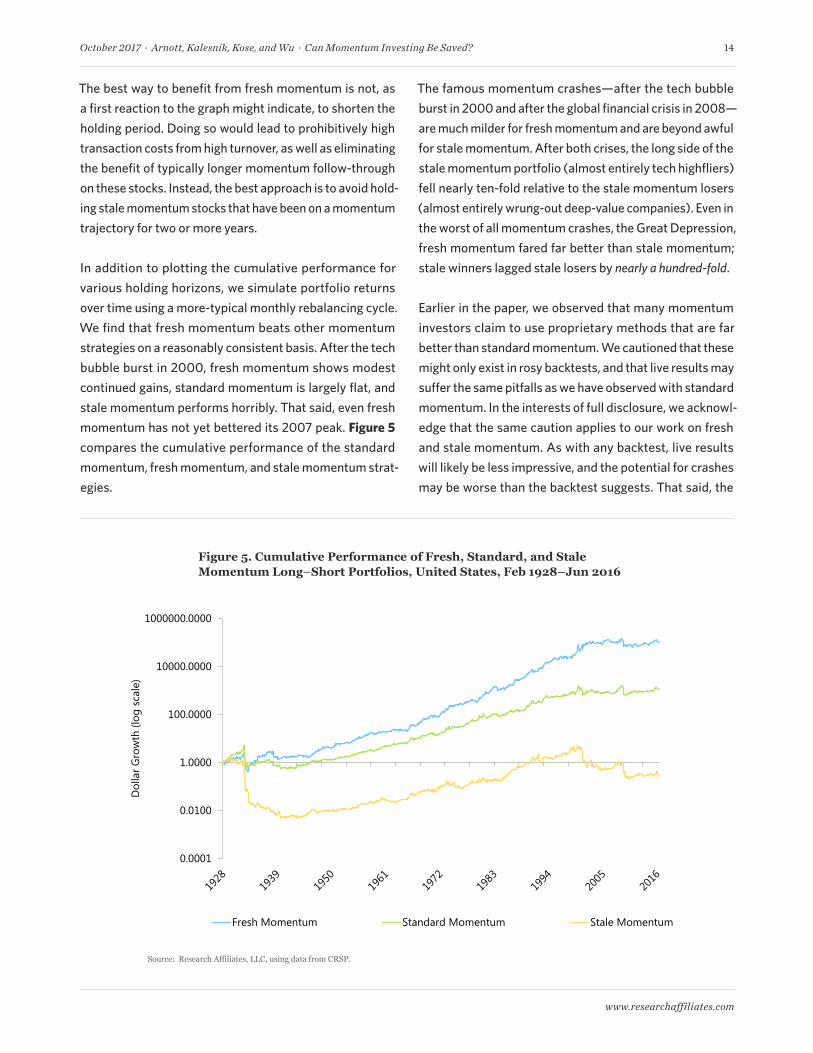
In addition to plotting the cumulative performance for various holding horizons, we simulate portfolio returns over time using a more-typical monthly rebalancing cycle. We find that fresh momentum beats other momentum strategies on a reasonably consistent basis. After the tech bubble burst in 2000, fresh momentum shows modest continued gains, standard momentum is largely flat, and stale momentum performs horribly. That said, even fresh momentum has not yet bettered its 2007 peak. Figure 5 compares the cumulative performance of the standard momentum, fresh momentum, and stale momentum strat-egies.
The famous momentum crashes—after the tech bubble burst in 2000 and after the global financial crisis in 2008—are much milder for fresh momentum and are beyond awful for stale momentum. After both crises, the long side of the stale momentum portfolio (almost entirely tech highfliers) fell nearly ten-fold relative to the stale momentum losers (almost entirely wrung-out deep-value companies). Even in the worst of all momentum crashes, the Great Depression, fresh momentum fared far better than stale momentum; stale winners lagged stale losers by nearly a hundred-fold.
Earlier in the paper, we observed that many momentum investors claim to use proprietary methods that are far better than standard momentum. We cautioned that these might only exist in rosy backtests, and that live results may suffer the same pitfalls as we have observed with standard momentum. In the interests of full disclosure, we acknowl-edge that the same caution applies to our work on fresh and stale momentum. As with any backtest, live results will likely be less impressive, and the potential for crashes may be worse than the backtest suggests. That said, the
0.0001
0.0100
1.0000
100.0000
10000.0000
1000000.0000
Dol
lar G
row
th (l
og s
cale
)
Fresh Momentum Standard Momentum Stale Momentum
Any use of the above content is subject to all important legal disclosures, disclaimers, and terms of use found at www.researchaffiliates.com, which are fully incorporated by reference as if set out herein at length.
Source: Research Affiliates, LLC, using data from CRSP.
Figure 5. Cumulative Performance of Fresh, Standard, and Stale Momentum Long–Short Portfolios, United States, Feb 1928–Jun 2016
October 2017 . Arnott, Kalesnik, Kose, and Wu . Can Momentum Investing Be Saved? 15
www.researchaffiliates.com
gap between stale and fresh momentum is intuitively sound and the statistical evidence is impressive.
Having the discipline to exclude stale momentum stocks—those late in their momentum cycle— can be an important step in overcoming the performance gap between paper and live portfolios. Fresh momentum stocks—those early in their momentum trajectory—can help reduce downside risk, improve performance, and allow for a less-demanding trading strategy, albeit on a skinny 4% slice of the market.
ConclusionMomentum is a popular and seductive strategy. Human nature conditions us to want more of whatever has given us joy and profit and to get rid of anything that has inflicted pain and losses. Momentum delivers exactly this, as a formal strategy! It tells us to buy what’s hot and sell what’s not. On paper, this is associated with superior performance, all over the world, over long periods of time. Alas, momen-tum fares far worse on live assets than on paper. Histori-cally, momentum funds—whether self-identifying as such, or objectively showing a strong momentum loading—have failed to beat the market, on average, even during extended periods when momentum factor paper portfolios were delivering outstanding performance.
One weakness of standard momentum strategies is that they do not distinguish between stocks as to whether they are early or late in their momentum cycles. We call the first group fresh momentum and the latter stale momentum. Stale momentum stocks are typically very expensive on
the long side, and very cheap on the short side, with little likelihood of follow-through. Fresh momentum fares much better than stale momentum, especially since standard momentum went off the rails at the start of the current century. Investors will be better off if their strategies avoid stocks with stale momentum and instead rely more heav-ily on stocks with fresh momentum. If we’re going to incur trading costs to initiate momentum trades, we should perhaps concentrate those trades in the fresh momentum segment of the portfolio.
Another weakness of most momentum strategies is high turnover and high trading costs. Momentum funds use momentum to initiate momentum trades. Why don’t we turn this logic on its head? Why not use momentum to block (or at least condition) trades for other strategies, such as value, quality, low volatility, Fundamental Index, and so forth? Using momentum to block trades should improve performance on two levels. First, our strategy will be trading less, not more; after all, we incur no trading costs when we are deferring a trade. Second, the momentum effect—without trading costs—is one of the most robust in the literature, notwithstanding recent disappointments. If momentum—especially fresh momentum—improves the timing of our trades, we extract momentum alpha while reducing our trading costs, giving us the best of both worlds.
Momentum—at least as defined by the standard momen-tum factor—clearly does more harm than good on live assets in the mutual fund arena. It need not. It clearly needs saving. With a few simple steps, we think it can be saved, though not necessarily on a vast asset base.
The authors would like to thank Cam Harvey for his insightful comments to this article.
The appendix is available on our website at www.researchaffiliates.com
October 2017 . Arnott, Kalesnik, Kose, and Wu . Can Momentum Investing Be Saved? 16
www.researchaffiliates.com
Endnotes 1. Throughout the article our focus is on the examination of cross-
sectional momentum and how mutual funds attempting to capture cross-sectional momentum are able to benefit their investors. We leave the study of time-series momentum or momentum in asset classes other than equity outside the scope of this article.
2. To be fair, all factors may experience long periods of less-than-stellar performance when investors would have been better off investing in the benchmark. If the momentum factor is characterized by sharp drawdowns, other factors such as value may have long periods of underperformance without high negative skewness. As we write this article, many value managers have experienced a decade-long period of subpar performance over which the theoretical long–short value factor (HML) has averaged an annualized −3.1% return in the 10 years ending December 2016.
3. Our study focuses on mutual funds. We are not claiming that no market participants have benefited from momentum. In fact, some highly skilled hedge fund managers are able to benefit from momentum. Ironically, the fact that mutual funds are not benefiting from momentum exposures likely means that these mutual funds are acting as a source of the premium to the hedge fund industry.
4. In the first article of the Alice in Factorland series (Arnott, Kalesnik, and Wu, 2017) we show that investors are routinely unable to capture most factor premia. Mutual fund managers deliver only about half of the value premium and, quite strikingly, almost none of the momentum premium. We expand on that finding in this article with a more detailed examination of momentum funds. In the second article of the series (Arnott, Clements, and Kalesnik, 2017), we show that those who dismiss smart beta strategies as merely a collection of factor tilts miss the rich nuances of some of these strategies, and in so doing, perform a disservice to investors. We show this by replicating smart beta strategies using theoretical long–short factor portfolios and find they delivered much worse investment outcomes than the paper portfolios—even before trading costs, which would be incurred in live replications of the strategies. We also find that a “smart” smart beta strategy is far more than a collection of its factors. In the third article of the series, we demonstrate mean reversion in fund performance. This finding implies that investors who follow the common practice of firing underperforming managers and replacing them with recently outperforming managers tend to lose from such performance chasing. Another important take away of the article is that fund-return mean reversion is largely driven by factor valuation cycles. Indeed, knowing a fund’s past factor exposures and current factor valuations can be useful in identifying future winners; this relationship has correlations ranging to above 25% for subsequent one-year relative performance.
5. Although cross-sectional momentum was first documented in the academic literature fairly recently, traders have been following momentum strategies for centuries in various forms of technical analysis. A good example is the candlestick chart, which Japanese traders speculating in rice futures used at least as far back as the 17th century.
6. Cross-sectional momentum in equities was first documented by Jegadeesh and Titman (1993), Asness (1994), and Carhart (1997). These authors showed that stock performance on the horizon of several months up to a year tends to continue into subsequent months, and that this factor should be a part of the standard toolkit in explaining cross-sectional equity performance.
Subsequent studies by Rouwenhorst (1998), Griffin, Ji, and Martin (2003), Liew and Vassalou (2000) and Chui, Titman, and Wei (2010) have demonstrated that the momentum effect is robust internationally. Moskowitz and Grinblatt (1999) have documented an industry momentum effect. Asness, Liew, and Stevens (1997) and Bhojraj and Swaminathan (2006) have demonstrated the momentum effect for country equity indices. The momentum effect has also been demonstrated for other asset classes: Arnott and Pham (1993), Kho (1996), and LeBaron (1999) for currencies; and Erb and Harvey (2006) and Gorton, Hayashi, and Rouwenhorst (2008) for commodities. Apart from cross-sectional momentum, Moskowitz, Ooi, and Pedersen (2012) have documented time-series momentum.
7. Risk-based explanations for momentum have, to this point, been less developed in the literature. Perhaps one of the more convincing risk-based explanations is offered by Harvey and Siddique (2000), who provide evidence that skewness risk is associated with a premium. This evidence suggests negatively skewed momentum is responsible, tying its positive return premium to its negative skewness. In other words, it works well most of the time, as recompense for its horrible crashes. Conrad and Kaul (1998) also offer a risk-based interpretation of momentum, demonstrating that the momentum return comes mostly from the differences in the long-run average returns of stocks, not the time-series effect. This outcome is inconsistent with the behavioral-based explanations of Barberis, Shleifer, and Vishny (1998), Daniel, Hirshleifer, and Subrahmanyam (1998), and Hong and Stein (2000). The risk-based interpretation of these results is that if certain stocks are riskier than others and consistently deliver a higher risk premium, they will be picked up by a momentum strategy. Unfortunately, later studies such as Jegadeesh and Titman (2001, 2002) have failed to replicate their findings and therefore attribute the original result to complications of using a boot-strapping econometric technique. Chordia and Shivakumar (2002) argue that momentum profits can be explained by stock return predictability arising from macroeconomic variables, suggesting a possible role for time-varying expected returns. Grinblatt and Moskowitz (2004) point out the relation between tax-loss selling and the momentum effect. And finally, Lou, Polk, and Skouras (2017) show that momentum profits accrue entirely overnight and explain this phenomenon as the “clientele effect.”
8. Evidence suggests the slow reaction to news, both positive and negative, could be due to a conservativism bias in human information processing (Barberis, Shleifer, and Vishny, 1998). Such a bias could explain both the initial underreaction when good news is announced and the overreaction of investors in continuing to push a stock’s price higher or lower following the direction of the momentum. Several studies, such as Chan, Jegadeesh, and Lakonishok (1996) and Chordia and Shivakumar (2002), find a strong return associated with earnings momentum, confirming that a lot of the momentum return is earned around earnings announcements. Earnings momentum and price momentum are such related anomalies that Novy-Marx (2015) recently argued that earnings momentum fundamentally subsumes price momentum.
9. Overconfidence in psychology is defined as a type of miscalibration of the accuracy of success probability (Brenner et al., 1996; Dawes and Mulford, 1996; Fischhoff, Slovic, and Lichtenstein, 1977; and Slovic, Fischhoff, and Lichtenstein 1980). Sources of overconfidence are grouped into cognitive and motivational categories (Keren, 1997, and Griffin and Tversky, 1992). Overconfidence bias is also extensively studied in the behavioral economics and finance literature, including implications of this bias on trading volume (Biais, Glosten, and Spatt, 2005),

October 2017 . Arnott, Kalesnik, Kose, and Wu . Can Momentum Investing Be Saved? 17
www.researchaffiliates.com
information processing in markets (Odean, 1998), and corporate actions, such as mergers and acquisitions activity (Roll, 1986).
10. We observe that these three widely cited papers, all which describe behavioral foundations for momentum, appeared shortly before standard momentum began to fail in the United States.
11. Except where otherwise noted, we are referring to standard momentum, which measures performance over the past 12 months, excluding the latest month, and we are choosing the best-performing 30% of stocks for our long portfolio and the worst-performing 30% for our short portfolio, while controlling for size.
12. Sharpe ratio comparisons mask the propensity of momentum strategies to suffer from momentum crashes; the cross-sectional momentum strategy is negatively skewed, while the value and small-cap strategies have historically exhibited positive skewness. Japan is a notable exception. Momentum does not work in the Japanese market. We will touch on the unique situation of Japan in more detail in a later section.
13. Because momentum is viewed as one of the strongest and most pervasive investment factors, academics tend to include it in empirical studies of multi-factor models along with other widely studied factors, such as value and size. Asness (1994) and Carhart (1997) were among the first to advocate controlling for momentum in empirical research.
14. Sharpe ratios of the small-cap, value, and momentum factors in the US region for the 1927–2016 period are 0.23, 0.38, and 0.49, respectively. To compare the US region to the other geographic regions, we report statistics for the 1990–2016 period in Figure 1.
15. Arnott, Kalesnik, and Wu (2017) document the performance gap by comparing the respective performances of the momentum funds (with positive momentum exposure) and the contrarian funds (with negative momentum exposure). In using this method, we acknowledge the possibility that the gap could arise because the contrarian funds perform materially better than implied by their negative momentum exposure. Furthermore, if the momentum exposure of the funds we measure is very noisy, then the measured factor premium would be significantly downward biased. The detailed study of the gap in this article addresses these concerns.
16. A regression-based factor model may not be the best tool to adjust fund performance for momentum exposure because it is not clear that momentum is a risk factor. The literature mostly agrees that mispricing interpretation is more plausible as the cause of the momentum premium and that the momentum stock characteristic is the driver of return. Thus, a Daniel et al. (1997) (DGTW) model-style attribution may provide more accurate fund momentum exposure measurement and fund performance attribution. The drawback of the DGTW model is that it requires access to fund holdings. Because our main purpose in including the factor exposure is to validate that momentum funds do indeed have higher momentum loadings among the selected groups, we view the less accurate method as still being appropriate.
17. The −1.4% a year underperformance is calculated using equally weighted fund/month observations. If at each point in time we equally weighted the funds and computed this equally weighted portfolio, it would underperform −4.1% a year.
18. In Panel A of Table 2, we report measures of fund sensitivity to market, small-cap, value, and momentum factors using observed fund returns in the full sample. The factor sensitivity of funds is
estimated using multivariate regression. No doubt, using the full sample introduces a look-ahead bias into estimation of fund factor sensitivities, but also makes factor sensitivity estimations more precise. In Panel B of Table 2, we report measures of the correlation of fund value-add relative to the benchmark with the momentum factor, again using the full sample.
19. We find it puzzling many observers expect positive alphas net of Fama–French three-or-more factor attribution tests. Fees and trading costs will show up in these alphas, as will other forms of implementation shortfall (Arnott, 2006). A multi-factor alpha of zero is a win. A positive multi-factor alpha is a big win. A more realistic exercise could be to use an alternative factor-model specification in which factor returns are adjusted for the implementation shortfall.
20. We also display the factor sensitivities of the funds to confirm that our selection process yields the desired outcome; each of the groups has the highest loading on the factor it seeks to capture.
21. Other studies, for example, Korajczyk and Sadka (2004) and Novy-Marx and Velikov (2015), using different assumptions, find a similar order of magnitude in trading cost estimates. Further, we find that these estimated trading costs match remarkably well the realized factor-return shortfalls we observed in the first article in this series, Arnott, Kalesnik, and Wu (2017).
22. This is constructed in the conventional fashion. Stocks are ranked based on trailing 12-month performance, excluding the most recent month; this is our momentum metric. The factor-return time series is constructed by computing the performance difference of a long portfolio, consisting of 30% of the market with the best momentum, capitalization weighted, relative to a short portfolio consisting of 30% of the market with the worst momentum, also capitalization weighted. The portfolio is reconstituted monthly, leading to just under 10% turnover each month for both the long and the short portfolios. No adjustment is made for transaction costs, missed trades, cost of leverage, cost of borrowing stock for the short portfolio, fees, and so forth.
23. Credit for this finding goes to Engin Kose and his colleagues during his PhD program Long Chen and Ohad Kadan, who explore this idea in detail in the 2012 working paper “Fresh Momentum.”
24. These average results are based on 89 years of data, with over 1,000 starting portfolios on both the long and the short sides, so the smoothness of this line is deceptive. Every starting month will be different, as will be the trajectory over the subsequent three years.
25. See Arnott, Beck, and Kalesnik (2016a,b).
26. More generally, as first documented by DeBondt and Thaler (1987), a stock, on average, experiences short-term mean reversion on a monthly horizon, then momentum on the horizon of up to a year, and then mean reversion on the horizon larger than a year and strongest over 2 to 3 years. The mean reversion we observe on the horizon above one year, as shown in Figure 3, is strongly related and largely subsumed by value as documented by Beck et al. (2017). Most of these 89 years of data are before standard momentum was “discovered” by academe, and before it lost its efficacy in even the early months.
27. Chen, Kadan, and Kose (2012) argue a more efficient way of momentum investing. Conditioning momentum on longer-term return performance creates a more profitable momentum strategy. We are adopting this idea in our fresh and stale momentum definitions.

October 2017 . Arnott, Kalesnik, Kose, and Wu . Can Momentum Investing Be Saved? 18
www.researchaffiliates.com
ReferencesAked, Michael, and Max Moroz. 2015. “The Market Impact of Passive
Trading.” Journal of Trading, vol. 10, no. 3 (Summer):5–12.
Arnott, Robert D. 2006. “Implementation Shortfall.” Financial Analysts Journal, vol. 62, no. 3 (May/June):6–8.
Arnott, Robert D., Noah Beck, and Vitali Kalesnik. 2016a. “To Win with ‘Smart Beta’ Ask If the Price Is Right.” Research Affiliates (June).
———. 2016b. “Timing ‘Smart Beta’ Strategies? Of Course! Buy Low, Sell High!” Research Affiliates (September).
Arnott, Robert D., Noah Beck, Vitali Kalesnik, and John West. 2016. “How Can ‘Smart Beta’ Go Horribly Wrong?” Research Affiliates (February).
Arnott, Robert D., Mark Clements, and Vitali Kalesnik. 2017. “Why Factor Tilts Are Not Smart ‘Smart Beta.’” Research Affiliates (May).
Arnott, Robert D., Jason Hsu, Jun Liu, and Harry Markowitz. 2014. “Can Noise Create the Size and Value Effects?” Management Science, vol. 61, no. 11 (October):2569–2579.
Arnott, Robert D., Vitali Kalesnik, and Lillian Wu. 2017. “The Incredible Shrinking Factor Return.” Research Affiliates (April).
Arnott, Robert D., and Tan Pham. 1993. “Tactical Currency Allocation.” Financial Analysts Journal, vol. 49, no. 5 (September/October):47–52.
Asness, Clifford. 1994. “Variables That Explain Stock Returns.” Doctoral dissertation, University of Chicago.
Asness, Clifford, John Liew, and Ross Stevens. 1997. “Parallels between the Cross-Sectional Predictability of Stock and Country Returns.” Journal of Portfolio Management, vol. 23, no. 3 (Spring):79–87.
Barberis, Nicholas, Andrei Shleifer, and Robert Vishny. 1998. “A Model of Investor Sentiment.” Journal of Financial Economics, vol. 49, no. 3 (September):307–343.
Beck, Noah, Shingo Goto, Jason Hsu, and Vitali Kalesnik. 2017. “The Duality of Value and Mean-Reversion.” In Portfolio Construction, Measurement, and Efficiency edited by John B. Guerard, Jr. Switzerland: Springer International Publishing:229–238.
Bhojraj, Sanjeev, and Bhaskaran Swaminathan. 2006. “Macromomentum: Returns Predictability in International Equity Indices.” Journal of Business, vol. 79, no. 1(January):429–451.
Biais, Bruno, Larry Glosten, and Chester Spatt. 2005. “Market Microstructure: A Survey of Microfoundations, Empirical Results, and Policy Implications.” Journal of Financial Markets, vol. 8, no. 2 (May):217–264.
Brenner, Lyle, Derek Koehler, Varda Liberman, and Amos Tversky. 1996. “Overconfidence in Probability and Frequency Judgments: A Critical Examination.” Organizational Behavior and Human Decision Processes, vol. 65, no. 3 (March):212–219.
Carhart, Mark. 1997. “On Persistence in Mutual Fund Performance.” Journal of Finance, vol. 52, no. 1 (March):57–82.
Chan, Louis, Narasimhan Jegadeesh, and Josef Lakonishok. 1996. “Momentum Strategies.” Journal of Finance, vol. 51, no. 5 (December):1681–1713.
Chen, Long, Ohad Kadan, and Engin Kose. 2012. “Fresh Momentum.” Washington University in St. Louis working paper.
Chordia, Tarun, and Lakshmanan Shivakumar. 2002. “Momentum, Business Cycle, and Time-Varying Expected Returns.” Journal of Finance, vol. 57, no. 2 (April):985–1019.
Chui, Andy, Sheridan Titman, and John Wei. 2010. “Individualism and Momentum around the World.” Journal of Finance, vol. 65, no. 1 (February):361–392.
Conrad, Jennifer, and Gautam Kaul. 1998. “An Anatomy of Trading Strategies.” Review of Financial Studies, vol. 11, no. 3 (July):489–519.
Daniel, Kent, Mark Grinblatt, Sheridan Titman, and Russ Wermers. 1997. “Measuring Mutual Fund Performance with Characteristic-Based Benchmarks.” Journal of Finance, vol. 52, no. 3 (July):1035–1058.
Daniel, Kent, David Hirshleifer, and Avanidhar Subrahmanyam. 1998. “Investor Psychology and Security Market Under- and Overreactions.” Journal of Finance, vol. 53, no. 6 (December):1839–1885.
Dawes, Robyn, and Matthew Mulford. 1996. “The False Consensus Effect and Overconfidence: Flaws in Judgment or Flaws in How We Study Judgment?” Organizational Behavior and Human Decision Processes, vol. 65, no. 3 (March):201–211.
Erb, Claude, and Campbell Harvey. 2006. “The Strategic and Tactical Value of Commodity Futures.” Financial Analysts Journal, vol. 62, no. 2 (March/April):69–97.
Fama, Eugene, and Kenneth French. 1993. “Common Risk Factors in the Returns on Stocks and Bonds.” Journal of Financial Economics, vol. 33, no. 1 (February):3–56.
Fischhoff, Baruch, Paul Slovic, and Sarah Lichtenstein. 1977. “Knowing with Certainty: The Appropriateness of Extreme Confidence.” Journal of Experimental Psychology: Human Perception and Performance, vol. 3, no. 4 (November):552–564.
Gorton, Gary, Fumio Hayashi, and Geert Rouwenhorst. 2008. “The Fundamentals of Commodity Futures Returns.” Yale International Center for Finance working paper.
Griffin, Dale, and Amos Tversky. 1992. “The Weighing of Evidence and the Determinants of Confidence.” Cognitive Psychology, vol. 24, no. 3 (July):411–435.
Griffin, John, Xiuqing Ji, and Spencer Martin. 2003. “Momentum Investing and Business Cycle Risk: Evidence from Pole to Pole.” Journal of Finance, vol. 58, no. 6 (December):2515–2547.
Grinblatt, Mark, and Tobias Moskowitz. 2004. “Predicting Stock Price Movements from Past Returns: The Role of Consistency and Tax-Loss Selling.” Journal of Financial Economics, vol. 71, no. 3 (March):541–579.
Harvey, Campbell, and Akhtar Siddique. 2000. “Conditional Skewness in Asset Pricing Tests.” Journal of Finance, vol. 55, no. 3 (June):1263–1296.

October 2017 . Arnott, Kalesnik, Kose, and Wu . Can Momentum Investing Be Saved? 19
www.researchaffiliates.com
Hong, Harrison, and Jeremy Stein. 1999. “A Unified Theory of Underreaction, Momentum Trading, and Overreaction in Asset Markets.” Journal of Finance, vol. 54, no. 6 (December):2143–2184.
Jegadeesh, Narasimhan, and Sheridan Titman. 1993. “Returns to Buying Winners and Selling Losers: Implications for Stock Market Efficiency.” Journal of Finance, vol. 48, no. 1 (March):65–91.
———. 2001. “Profitability of Momentum Strategies: An Evaluation of Alternative Explanations.” Journal of Finance, vol. 56, no. 2 (April):699–720.
———. 2002. “Cross-Sectional and Time-Series Determinants of Momentum Returns.” Review of Financial Studies, vol. 15, no. 1 (January):143–157.
Keren, Gideon.1997. “On the Calibration of Probability Judgments: Some Critical Comments and Alternative Perspectives.” Journal of Behavioral Decision Making, vol. 10, no. 3 (September):269–278.
Kho, Bong-Chan. 1996. “Time-Varying Risk Premia, Volatility, and Technical Trading Rule Profits: Evidence from Foreign Currency Futures Markets.” Journal of Financial Economics, vol. 41, no. 2 (June):249–290.
LeBaron, Blake. 1999. “Technical Trading Rule Profitability and Foreign Exchange Intervention.” Journal of International Economics, vol. 49, no. 1 (June):125–143.
Liew, Jimmy, and Maria Vassalou. 2000. “Can Book-to-Market, Size, and Momentum Be Risk Factors That Predict Economic Growth?” Journal of Financial Economics, vol. 57, no. 2 (August):221–245.
Lou, Dong, Christopher Polk, and Spyros Skouras. 2017. “A Tug of War: Overnight versus Intraday Expected Returns.” Working paper (March).
Moskowitz, Tobias, and Mark Grinblatt. 1999. “Do Industries Explain Momentum?” Journal of Finance, vol. 54, no. 4 (August):1249–1290.
Moskowitz, Tobias, Yao Hua Ooi, and Lasse Heje Pedersen. 2012. “Time Series Momentum,“ Journal of Financial Economics, vol. 104, no. 2 (May):228–250.
Novy-Marx, Robert. 2015. “Fundamentally, Momentum Is Fundamental Momentum.” NBER Working Paper No. w20984 (February).
Odean, Terrance. 1998. “Are Investors Reluctant to Realize Their Losses?” Journal of Finance, vol. 53, no. 3 (October):1775–1798.
Roll, Richard. 1986. “The Hubris Hypothesis of Corporate Takeovers.” Journal of Business, vol. 59, no. 2 (April):197–216.
Rouwenhorst, Geert. 1998. “International Momentum Strategies.” Journal of Finance, vol. 53, no. 1 (February):267–284.
Slovic, Paul, Baruch Fischhoff, and Sarah Lichtenstein. 1980. “Facts and Fears: Understanding Perceived Risk.” In Societal Risk Assessment: How Safe Is Safe Enough? edited by Richard Schwing and Walter Albers, General Motors Research Laboratories. Boston, MA: Springer:181–216.
Treynor, Jack. 2005. “Why Market-Valuation-Indifferent Indexing Works.” Financial Analysts Journal, vol. 61, no. 5 (September/October):65–69.
October 2017 . Arnott, Kalesnik, Kose, and Wu . Can Momentum Investing Be Saved? 20
www.researchaffiliates.com
The material contained in this document is for general information purposes only. It is not intended as an offer or a solicitation for the purchase and/or sale of any security, deriva-tive, commodity, or financial instrument, nor is it advice or a recommendation to enter into any transaction. Research results relate only to a hypothetical model of past performance (i.e., a simulation) and not to an asset manage-ment product. No allowance has been made for trading costs or management fees, which would reduce investment performance. Actual results may differ. Index returns represent back-tested performance based on rules used in the creation of the index, are not a guaran-tee of future performance, and are not indica-tive of any specific investment. Indexes are not managed investment products and cannot be invested in directly. This material is based on information that is considered to be reliable, but Research Affiliates™ and its related enti-ties (collectively “Research Affiliates”) make this information available on an “as is” basis without a duty to update, make warranties, express or implied, regarding the accuracy of the informa-tion contained herein. Research Affiliates is not responsible for any errors or omissions or for results obtained from the use of this information. Nothing contained in this material is intended
to constitute legal, tax, securities, financial or investment advice, nor an opinion regarding the appropriateness of any investment. The infor-mation contained in this material should not be acted upon without obtaining advice from a licensed professional. Research Affiliates, LLC, is an investment adviser registered under the Investment Advisors Act of 1940 with the U.S. Securities and Exchange Commission (SEC). Our registration as an investment adviser does not imply a certain level of skill or training.
Investors should be aware of the risks associated with data sources and quantitative processes used in our investment management process. Errors may exist in data acquired from third party vendors, the construction of model portfolios, and in coding related to the index and portfolio construction process. While Research Affiliates takes steps to identify data and process errors so as to minimize the potential impact of such errors on index and portfolio performance, we cannot guarantee that such errors will not occur.
The trademarks Fundamental Index™, RAFI™, Research Affiliates Equity™, RAE™, and the Research Affiliates™ trademark and corporate name and all related logos are the exclusive intel-lectual property of Research Affiliates, LLC and
in some cases are registered trademarks in the U.S. and other countries. Various features of the Fundamental Index™ methodology, including an accounting data-based non-capitalization data processing system and method for creating and weighting an index of securities, are protected by various patents, and patent-pending intel-lectual property of Research Affiliates, LLC. (See all applicable US Patents, Patent Publica-tions, Patent Pending intellectual property and protected trademarks located at https://www.researchaffiliates.com/en_us/about-us/legal.html#d, which are fully incorporated herein.) Any use of these trademarks, logos, patented or patent pending methodologies without the prior written permission of Research Affiliates, LLC, is expressly prohibited. Research Affiliates, LLC, reserves the right to take any and all neces-sary action to preserve all of its rights, title, and interest in and to these marks, patents or pend-ing patents.
The views and opinions expressed are those of the author and not necessarily those of Research Affiliates, LLC. The opinions are subject to change without notice.
©2017 Research Affiliates, LLC. All rights reserved
Disclosures