Embed Size (px)
Citation preview
Multitemporal spectral mixture analysis forAmazonian land-cover change detection
Dengsheng Lu, Mateus Batistella, and Emilio Moran
Abstract. The complex landscape and environmental conditions in the moist tropical region often result in poor land-coverchange detection accuracy using traditional change detection methods. This paper explores linear spectral mixture analysis(LSMA) of multitemporal thematic mapper (TM) images to detect land-cover change in Rondônia, Brazilian Amazon basin.Three image endmembers (shade, green vegetation, and soil) were developed based on a combination of field data andimage scatterplots. An unconstrained least-squares solution was used to unmix the multitemporal TM images into threefractions. Then, fraction image differencing results were used to analyze land-cover change/non-change detection. Thedetailed “from-to” change detection was implemented using a pixel-by-pixel comparison of classified images, which weredeveloped using a decision tree classifier on the multitemporal fraction images. This study indicates that LSMA is apowerful image processing tool for land-cover classification and change detection. The multitemporal fraction images canbe effectively used for land-cover change detection. The stable and reliable multitemporal fraction images developed usingLSMA make the change detection possible without the use of training sample datasets for historical remotely sensed data.This characteristic is particularly valuable for the land-cover change detection in the Amazon basin.
Résumé. Le paysage complexe et les conditions environnementales caractéristiques de cette région humide tropicaleentraînent souvent une précision faible dans le contexte de la détection des changements dans le couvert basée surl’utilisation des méthodes traditionnelles de détection du changement. Cet article explore l’analyse spectrale mixte (LSMA)appliquée aux images multitemporelles de « thematic mapper » (TM) pour la détection des changements dans le couvertdans la région de Rondônia, dans le bassin du fleuve Amazone. Trois composantes spectrales pures d’images (ombre,végétation verte et sol) ont été développées basé sur une combinaison de graphiques de corrélation dérivés des données deterrain et des images. Une solution non contrainte par moindres carrés a été utilisée pour démixer les imagesmultitemporelles TM en trois fractions différentes. Ensuite, les résultats de la différenciation des fractions d’images ont étéutilisés pour la détection des zones avec changement / sans changement dans le couvert. La détection en détail duchangement “de / à” a été appliquée en effectuant une comparaison pixel par pixel des images classifiées, qui ont été ensuitedéveloppées à l’aide d’un classificateur basé sur un arbre de décision appliqué aux images multitemporelles des fractions.Cette étude montre que la technique LSMA est un outil de traitement d’image puissant pour la classification du couvert et ladétection du changement. Les images multitemporelles des fractions peuvent être utilisées efficacement pour la détection duchangement dans le couvert. Les images multitemporelles des fractions, stables et fiables, développées à l’aide de latechnique LSMA rendent possible la détection du changement sans recours à l’utilisation d’ensembles de donnéesd’entraînement dans le cas des données historiques de télédétection. Cette dernière caractéristique est particulièrementimportante pour la détection du changement dans le couvert dans le bassin de l’Amazone.[Traduit par la Rédaction]
100Introduction
Change detection techniques can be roughly grouped intotwo categories: (1) those detecting binary change/non-changeinformation, such as using image differencing, image ratioing,vegetation index differencing, and principal componentanalysis (PCA); and (2) those detecting detailed “from-to”change trajectory, such as using the post-classificationcomparison and hybrid change detection methods (Lu et al.,2004). Previous literature has reviewed a variety of changedetection techniques (Singh, 1989; Coppin and Bauer, 1996;Jensen, 1996; Yuan et al., 1998; Serpico and Bruzzone, 1999;Lu et al., 2004). When implementing change/non-changedetection, one critical step is to select appropriate thresholds inboth tails of the histogram representing the changed areas(Singh, 1989). Two methods are often used for selection ofthresholds (Singh, 1989; Yool et al., 1997): (1) interactiveprocedure or manual trial-and-error procedure — an analyst
interactively adjusts the thresholds and evaluates the resultingimage until satisfied; and (2) statistical measures — selectionof a suitable standard deviation from the mean. Thedisadvantages of the threshold technique are that (i) the
© 2004 CASI 87
Can. J. Remote Sensing, Vol. 30, No. 1, pp. 87–100, 2004
Received 7 March 2003. Accepted 21 July 2003.
D. Lu1. Center for the Study of Institutions, Population, andEnvironmental Change (CIPEC), Indiana University,408 N Indiana Avenue, Bloomington, IN 47408, U.S.A.
M. Batistella. Anthropological Center for Training and Researchon Global Environmental Change (ACT), Indiana University,Bloomington, IN 47405, U.S.A., and Brazilian AgriculturalResearch Corporation, Embrapa Satellite Monitoring Campinas,São Paulo, Brazil.
E. Moran. CIPEC, Indiana University, Bloomington, IN 47408,U.S.A., and ACT, Indiana University, Bloomington, IN 47405,U.S.A.
1Corresponding author (e-mail: [email protected]).

resulting differences may include external influences caused byatmospheric conditions, sun angles, soil moistures, andphenological differences in addition to true land-cover change;and (ii) the threshold is highly subjective and scene-dependent,depending on the analyst’s familiarity with the study area andskill. When implementing detailed “from-to” change detection,the results are mainly dependent on the classification accuracyfor each date being analyzed (Jensen, 1996). In other words, theclassification errors from the individual-date images will affectthe final change detection accuracy. The critical step is todevelop an accurate classification image for each date.However, the complex landscapes and environmentalconditions, particularly in the Amazon basin, often result inpoor land-cover classification accuracies using conventionalclassifiers. Although many efforts have been made to improveland-cover classification and change detection in the Amazonbasin (Mausel et al., 1993; Brondízio et al., 1994; Moran et al.,1994a; 1994b; Adams et al., 1995; Brondízio et al., 1996;Roberts et al., 1998a), acceptable accuracies are often notachieved without assistance of abundant and high qualitytraining sample data. On the other hand, the collection of alarge number of field data is, in particular, costly andimpractical in the Amazon basin. Therefore, applications ofhistorical remote sensing data for land-cover classifications areoften difficult because of lack of ground truth data. Thisproblem often induces difficulty in detecting land-cover “from-to” change. It is necessary to develop a method that does notrequire use of training sample data for the classifications ofhistorical remote sensing data.
Linear spectral mixture analysis (LSMA) approach supportsrepeatable and accurate extraction of quantitative subpixelinformation (Smith et al., 1990; Roberts et al., 1998a). It isregarded as a physically based image processing tool that canbe used to extract fractions representing areal proportions of theendmembers within the pixel. The LSMA approach assumesthat the spectrum measured by a sensor is a linear combinationof the spectra of all components within the pixel (Adams et al.,1995; Roberts et al., 1998a). Hence, using the LSMA approachcan develop fractions through unmixing the multispectralimage based on selected endmembers. Previous research hasindicated that the LSMA approach can be used for land-use/land-cover classification (Cochrane and Souza, 1998; Ustinet al., 1999; Aguiar et al., 1999; DeFries et al., 2000; Theseiraet al., 2002; Lu et al., 2003b) and change detection (Adams etal., 1995; Roberts et al., 1998a; 2002; Shimabukuro et al.,1998; Elmore et al., 2000; Rogan et al., 2002). This paperexamines the potential use of LSMA for Amazonian land-coverchange detection.
MethodsDescription of study area
Rondônia has experienced high deforestation rates duringthe last two decades. For example, the deforestation rates inRondônia range from 1.14% to 2.62% per year between 1991
and 2000, much higher than the overall deforestation rate(ranging from 0.37% to 0.80% per year) in the BrazilianAmazon basin in the same period (Instituto Nacional dePesquisas Espaciais (INPE), 2002). Following the nationalstrategy of regional occupation and development, colonizationprojects initiated by the Brazilian government in the 1970splayed a major role in this process (Moran, 1981; Schmink andWood, 1992). Most colonization projects in the state weredesigned to settle landless migrants. The immigrantstransformed the forested landscape into a patchwork ofcultivated crops, pastures, and a vast area of fallow land.
The study area is located at Machadinho d’Oeste,northeastern Rondônia (Figure 1). The size of the study area isapproximately 1000 km2 (30 km × 34 km). Settlement began inthe mid-1980s and major deforestation occurred in the late1980s. The climate in this study area is classified as equatorialhot and humid with a tropical transition area. A well-defineddry season lasts from June to August, and the annual averageprecipitation is 2016 mm (Rondônia, 1998). The annualaverage temperature is 25.5 °C. The terrain is undulating,ranging from 100 to 450 m above sea level. The main treecommunities are imbauba, lacre, leguminosae, mimosoideae,para-para, and urucum. Several soil types have been identified,mainly alfisols, oxisols, ultisols, alluvial soils, and other lessspatially represented associations (Bognola and Soares, 1999).Settlers, rubber tappers, and loggers inhabit the area,transforming the landscape through their economic activitiesand use of resources (Batistella, 2001). Farming systems aremainly household-based, and little depends on group efforts.Loggers play a major role in providing access to remote areaswithin the settlement as they open trails through the forest toreach valuable species.
Data collection and preprocessing
Fieldwork was conducted during the dry season of 1999. Theprocedure used for surveying vegetation was a multileveltechnique adapted from the methods used by the Center for theStudy of Institutions, Population, and Environmental Change(CIPEC, 1998) at Indiana University. Preliminary imageclassification and band composite printouts indicated candidateareas to be surveyed, and a flight over the areas provided visualinsights about the size, condition, and accessibility of each site.The surveys were carried out in areas with relativelyhomogeneous ecological conditions (e.g., topography, distancefrom water, and land use) and uniform physiognomiccharacteristics. After defining the area to be surveyed (plotsample), center points for three sets of nested subplots (1, 9,and 100 m2) were randomly marked to cover the variabilitywithin the plot sample. A detailed description of field datacollection methods and the statistical description of vegetationinventory data were provided in Batistella (2001) and Lu et al.(2003a). During fieldwork, stand parameters such as total treeheight and diameter at breast height in 26 plots coveringsecondary succession and 14 plots covering mature forest weremeasured. Meanwhile, more secondary succession and mature
88 © 2004 CASI
Vol. 30, No. 1, February/février 2004

forest plots, and many other land-cover observations (such asdegraded pastures, cultivated pastures, coffee plantations, barelands, etc.) were identified during the fieldwork. Every plotwas registered with a global positioning system (GPS) deviceto allow integration with other spatial data in geographicinformation systems (GIS) and image processing systems.
Two Landsat 5 thematic mapper (TM) images of 15 July1994 and 18 June 1998 were acquired and used in this research.For change detection application using multitemporal remotesensing data, accurate geometric rectification and atmosphericcalibration are two important aspects in image preprocessing.The 1998 TM image was first geometrically rectified into UTMprojection (Universal Transverse Mercator, south 20 zone)using control points taken from topographic maps at 1:100 000scale. Then the 1994 TM image was registered to the samecoordination system as the 1998 TM image. The nearest-neighbor resampling technique was used and a root meansquare error of less than 0.5 pixel was obtained for both dates ofTM images. Then, an improved image-based dark objectsubtraction (DOS) model was used to implement atmosphericcorrection for both TM images (Lu et al., 2002). The gain andoffset for each band and sun elevation angle were obtained fromthe image header file. The path radiance was identified basedon clear water for each band. The atmospheric transmittancevalue (average for each spectral band derived from radiativetransfer code) for each visible and near infrared bands wasderived from Chavez (1996). For middle infrared bands, theatmospheric transmittance was set to one. A detailed
description about the DOS model is provided (Chavez, 1996;Lu et al., 2002). The surface reflectance values after calibrationfall within the range between 0 and 1. For the convenience ofdata analysis, the reflectance values were rescaled to the rangebetween 0 and 100 by multiplying 100 for each pixel.
Endmember selection and unmixing TM images
A variety of endmember selection methods have beendeveloped (Adams et al., 1993; Settle and Drake, 1993;Bateson and Curtiss, 1996; Tompkins et al., 1997; Mustard andSunshine, 1999). For most remote sensing applications usingLSMA, the image-based endmember selection method is oftenused because the endmembers are easily obtained and representspectra measured at the same scale as the image data (Robertset al., 1998a). In general, the image endmembers are developedfrom the extremes of the image feature space, assuming theyrepresent the purest pixels in the images (Mustard andSunshine, 1999). Three or four endmembers are often used(Adams et al., 1995; Roberts et al., 1998a; Lu et al., 2003b). Inthis study, endmembers were initially identified from the 1998TM image based on ground truth data. The shade endmemberwas identified from the areas of clear and deep water and thegreen vegetation (GV) endmember was selected from the areasof dense initial successional vegetation. Soil endmembers wereselected from road intersections and from bare soils inagricultural lands. The reflectance features of these initiallyselected endmembers were compared with those endmembers
© 2004 CASI 89
Canadian Journal of Remote Sensing / Journal canadien de télédétection
Figure 1. Location of the study area in Rondônia, Brazilian Amazon basin.

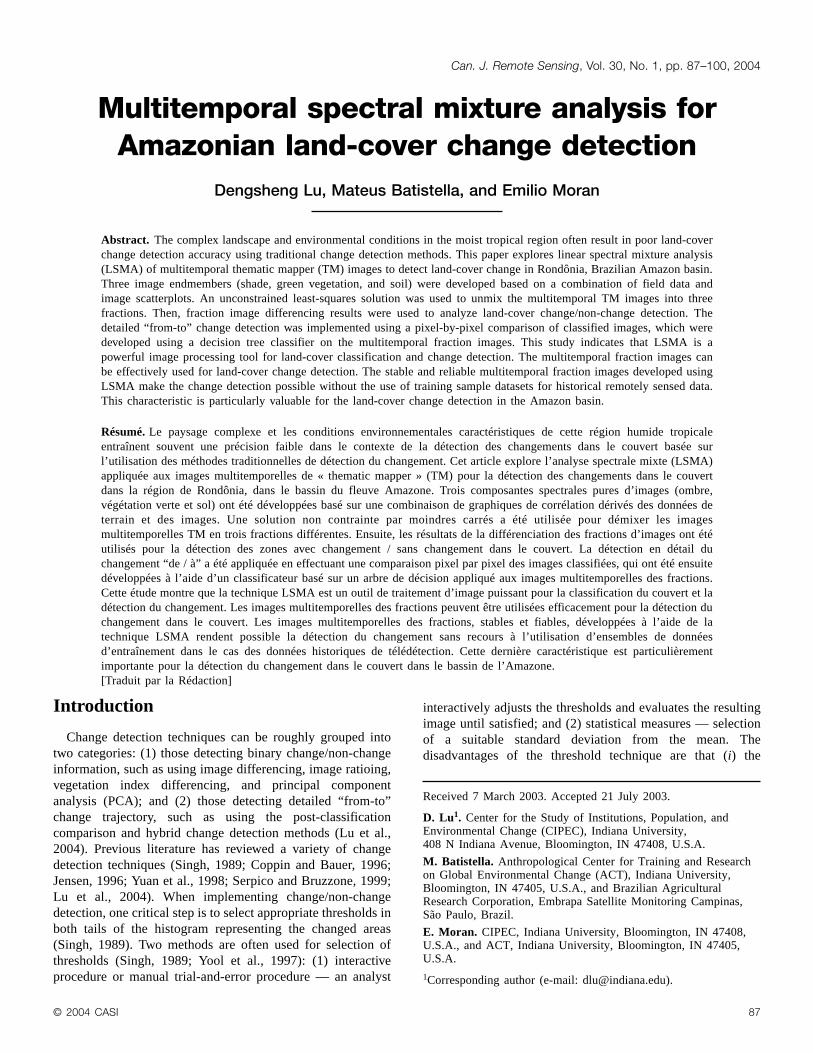
selected from the scatterplots of bands TM 3 and TM 4(Figure 2a) and of bands TM 4 and TM 5 (Figure 2b). Theendmembers whose reflectance curves were similar but locatedat the extreme vertices of the scatterplot were finally used. Anaverage of 10 to 15 pixels of these vertices was calculated.Figure 3 illustrates the reflectance characteristics of theselected three endmembers. They are independent of eachother. After determination of endmembers, an unconstrainedleast-squares solution was used to unmix the 1998 TM imageinto three endmember fraction images. The same method wasused to unmix the 1994 TM image into shade, GV, and soilfraction images. Then the multitemporal fraction images wereused to implement land-cover classification and changedetection.
Change detection analysis
Different fraction images have their own characteristics inrepresenting land-cover types, and different vegetation standstructures and land-cover types have different area proportionalcompositions of the endmembers. For example, vegetation andnonvegetation have significantly different soil fractions — verylow soil fractions for vegetation covers and high values for
nonvegetation covers except water. Thus, soil fractiondifferencing image from two dates can be used to detectvegetation deforestation or reforestation. In the shade and GVfractions, different vegetation types such as successional andmature forests have different fractions owing to their differentvegetation stand structures. Also vegetation and nonvegetationhave different shade and GV characteristics. Thus, the fractiondifferencing images of bi-temporal shade or GV fractions canbe used to detect the changes between different vegetationtypes, in addition to the changes between vegetation andnonvegetation. The image differencing method of bi-temporalfractions can be expressed as follows:
∆Shade = Shade(t1) – Shade(t2)
∆GV = GV(t1) – GV(t2)
∆Soil = Soil(t1) – Soil(t2)
where t1 and t2 are the prior and posterior dates for the changedetection. So, the fraction differencing results can be used forland-cover change detection through the use of suitablethreshold methods. In general, thresholds were determined
90 © 2004 CASI
Vol. 30, No. 1, February/février 2004
Figure 2. Scatterplots of two TM image bands: (a) between bands TM 3 and TM 4, and (b) between bands TM 4 and TM 5.
from the two tails of the histogram based on trial-and-errorprocedure. In this study, the selection of thresholds was basedon the mean and standard deviation of unchanged land-coverclasses, because unchanged land covers have normallydistributed histograms (the mean value is close to zero) butchanged land covers do not. The threshold values of unchangedland covers were identified on the fraction images throughstatistical analysis of 25 unchanged land-cover sample plots.Different standard deviations (from 2.5 to 3.5) were tested tofind a suitable threshold for change detection. Thus, threebinary change/non-change detection images were developedfrom the three fraction differencing images. The finalchange/non-change detection image was developed through the“or” overlay operation. This means that any change identifiedfrom each fraction differencing image was assigned as changein the final detection image.
Visual interpretation of multitemporal color composite is analternative way to analyze land-cover change because it canmake full use of the analyst’s knowledge. When ∆Shade, ∆GV,and ∆Soil are assigned as red, green, and blue, respectively, thecolor composite image can tell us how the different land-covertypes have changed. For example, red in the color compositeindicates a high shade differencing value associated with bothlow GV and soil fraction differencing values, implying the
change from mature forest to successional vegetation becauseGV and soil fractions are similar between mature forest andsucessional vegetation, but the shade fraction is decreased frommature forest to successional vegetation owing to theirdifferent forest stand structures, i.e., high shade fraction valuesfor mature forest but low shade values for successionalvegetation. Yellow in the color composite indicates high valuesin the shade and GV fraction differencing images associatedwith low or negative values in the soil fraction differencingimage, implying the change from mature forest to bare land orpasture (in the dry season, some pastures are dead). Theconversion from mature forest to bare land or pasture makessignificant change in forest stand structure, leading todecreasing shade and GV fractions from mature forest to bareland or pasture, but increasing soil fraction values. Other colorscan also be used to analyze the land-cover change trajectoriesbecause the fractions represent physical characteristics.
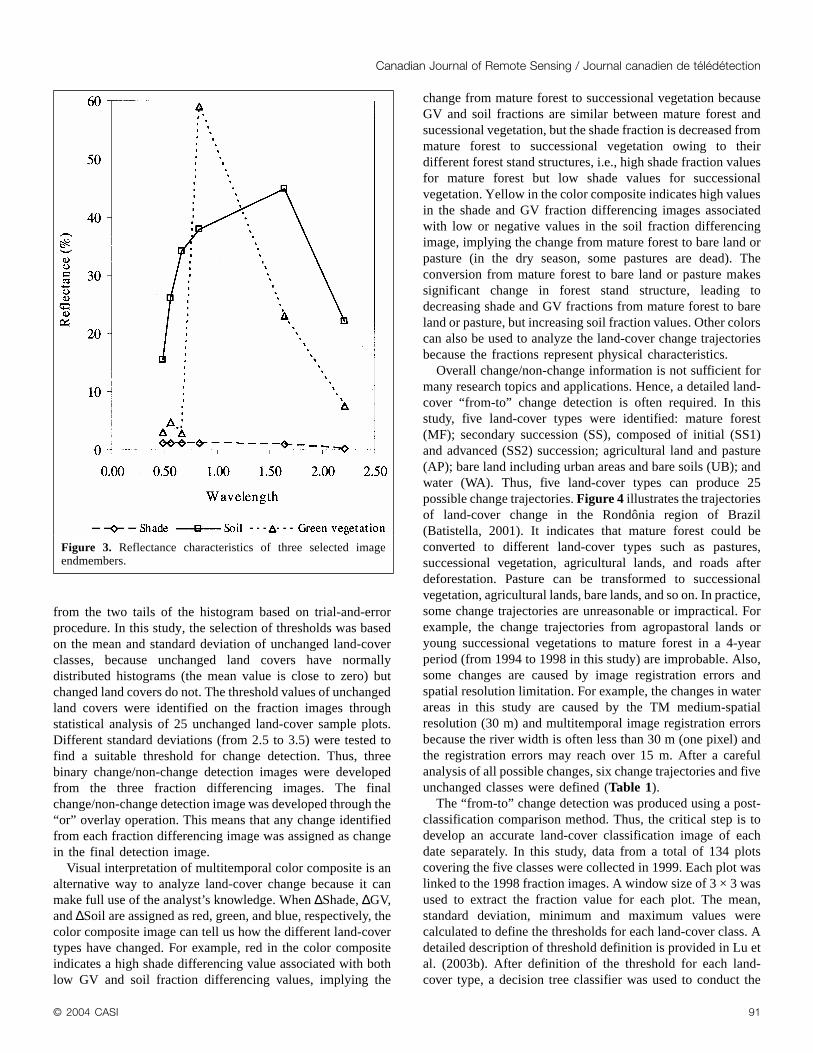
Overall change/non-change information is not sufficient formany research topics and applications. Hence, a detailed land-cover “from-to” change detection is often required. In thisstudy, five land-cover types were identified: mature forest(MF); secondary succession (SS), composed of initial (SS1)and advanced (SS2) succession; agricultural land and pasture(AP); bare land including urban areas and bare soils (UB); andwater (WA). Thus, five land-cover types can produce 25possible change trajectories. Figure 4 illustrates the trajectoriesof land-cover change in the Rondônia region of Brazil(Batistella, 2001). It indicates that mature forest could beconverted to different land-cover types such as pastures,successional vegetation, agricultural lands, and roads afterdeforestation. Pasture can be transformed to successionalvegetation, agricultural lands, bare lands, and so on. In practice,some change trajectories are unreasonable or impractical. Forexample, the change trajectories from agropastoral lands oryoung successional vegetations to mature forest in a 4-yearperiod (from 1994 to 1998 in this study) are improbable. Also,some changes are caused by image registration errors andspatial resolution limitation. For example, the changes in waterareas in this study are caused by the TM medium-spatialresolution (30 m) and multitemporal image registration errorsbecause the river width is often less than 30 m (one pixel) andthe registration errors may reach over 15 m. After a carefulanalysis of all possible changes, six change trajectories and fiveunchanged classes were defined (Table 1).
The “from-to” change detection was produced using a post-classification comparison method. Thus, the critical step is todevelop an accurate land-cover classification image of eachdate separately. In this study, data from a total of 134 plotscovering the five classes were collected in 1999. Each plot waslinked to the 1998 fraction images. A window size of 3 × 3 wasused to extract the fraction value for each plot. The mean,standard deviation, minimum and maximum values werecalculated to define the thresholds for each land-cover class. Adetailed description of threshold definition is provided in Lu etal. (2003b). After definition of the threshold for each land-cover type, a decision tree classifier was used to conduct the
© 2004 CASI 91
Canadian Journal of Remote Sensing / Journal canadien de télédétection
Figure 3. Reflectance characteristics of three selected imageendmembers.
land-cover classification based on the fraction images (Lu etal., 2003b). The same thresholds were also used for the 1994fraction images to produce the land-cover classification image.
ResultsLand-cover change/non-change detection
Visual analysis of fraction images is useful for understandingthe characteristics of different land-cover types. Figure 5provides comparisons of the multitemporal fraction imagesderived from 1994 and 1998 TM images. In the shade fractionimage, water appears white and mature forests appear brightgrey owing to their high shade fraction values. Successional
vegetation, some agricultural land such as coffee plantationsand degraded pastures appear grey. Urban areas, roads, andbare soils appear dark grey. On the GV fraction image,successional vegetation appears white owing to its high GVfraction values. Mature forests appear bright grey. Pastures andagricultural lands had a wide variation of GV fraction valuesowing to their different vegetation cover densities. Some ofthem (e.g., degraded pastures, coffee plantations) had similarGV fractions as successional vegetation. The very low GVfraction values of water, urban areas, and bare soils make themappear black on the GV fraction image. In contrast, urban areas,roads, and bare soils appear white on the soil fraction becauseof their high fraction values. Pastures and agricultural landsappear grey, successional and mature forests and water areas
92 © 2004 CASI
Vol. 30, No. 1, February/février 2004
Figure 4. Trajectories of land-cover change in Rondônia.
Type Change trajectories Meaning
Changed MF to SS Mature forest in 1994 was changed to SS in 1998MF to AP or UB Mature forest in 1994 was changed to agropastoral land, built-up land, or bare land in 1998SS to AP or UB SS in 1994 was changed to agropastoral land, built-up land, or bare land in 1998AP or UB to SS Agropastoral land or bare land in 1994 was changed to SS in 1998AP to UB Agropastoral land in 1994 was changed to built-up or bare land in 1998UB to AP Bare land in 1994 was changed to agropastoral land in 1998
Unchanged MF, SS, AP, UB, and WA Unchanged land-cover types between both dates
Note: MF, mature forest; SS, secondary succession; UB, urban areas and bare lands; AP, agropastoral lands; WA, water.
Table 1. Definition of land-cover change trajectories used in this study.
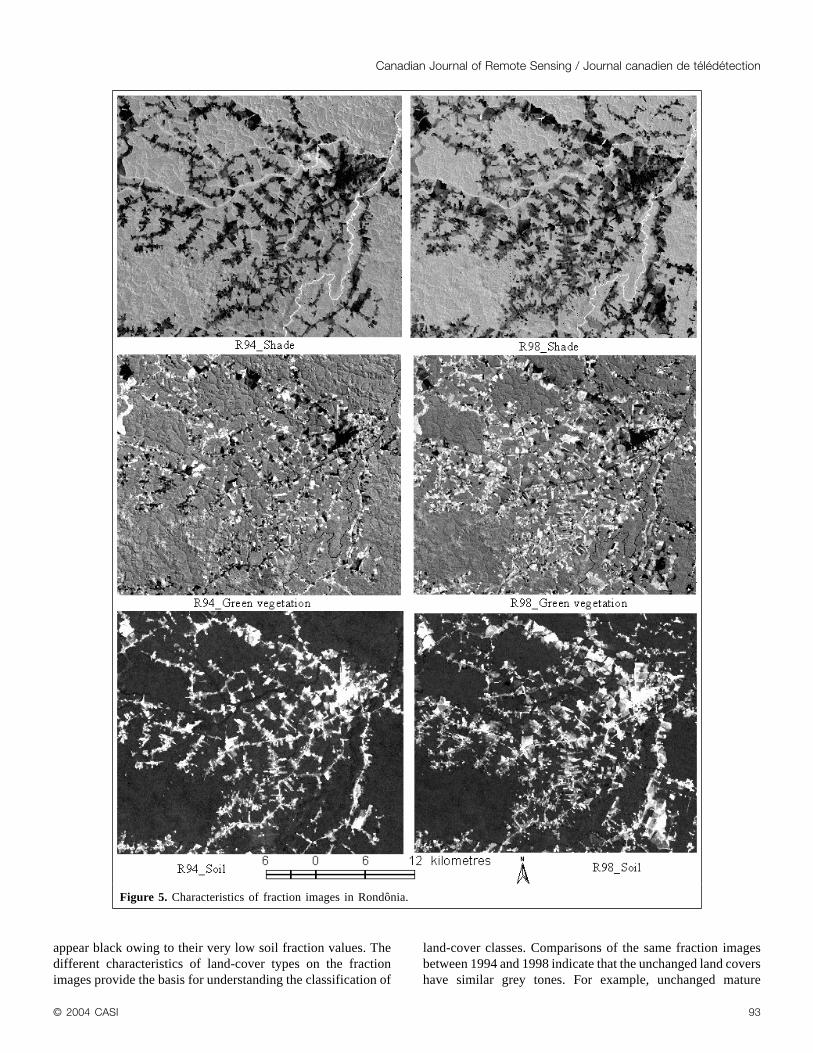
appear black owing to their very low soil fraction values. Thedifferent characteristics of land-cover types on the fractionimages provide the basis for understanding the classification of
land-cover classes. Comparisons of the same fraction imagesbetween 1994 and 1998 indicate that the unchanged land covershave similar grey tones. For example, unchanged mature
© 2004 CASI 93
Canadian Journal of Remote Sensing / Journal canadien de télédétection
Figure 5. Characteristics of fraction images in Rondônia.
forests have similar bright grey tones in the shade and GVfraction images because of their high shade and GV fractionvalues and have dark grey tones in the soil fraction imagesowing to their very low soil fraction values. However, for thosechanged land covers, the characteristics between both dates offraction images vary depending on the change trajectory. Thus,differencing images between the same fractions of both datesprovides new insights to visually interpret the land-coverchange.
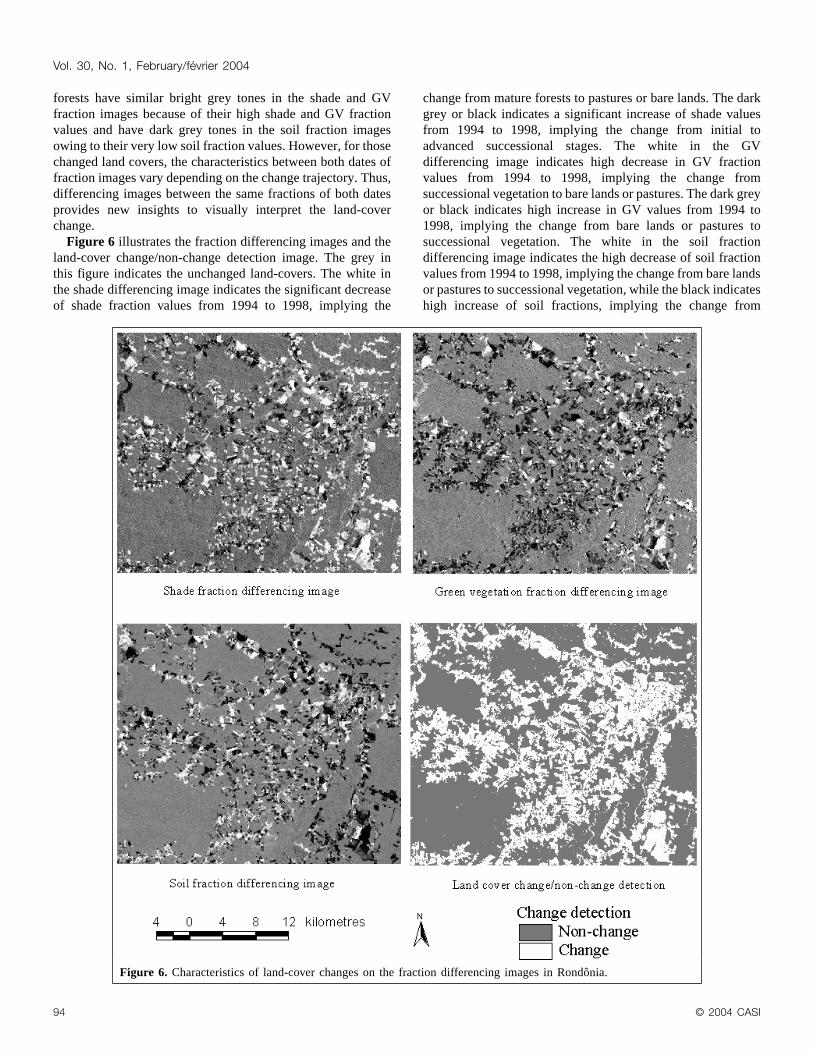
Figure 6 illustrates the fraction differencing images and theland-cover change/non-change detection image. The grey inthis figure indicates the unchanged land-covers. The white inthe shade differencing image indicates the significant decreaseof shade fraction values from 1994 to 1998, implying the
change from mature forests to pastures or bare lands. The darkgrey or black indicates a significant increase of shade valuesfrom 1994 to 1998, implying the change from initial toadvanced successional stages. The white in the GVdifferencing image indicates high decrease in GV fractionvalues from 1994 to 1998, implying the change fromsuccessional vegetation to bare lands or pastures. The dark greyor black indicates high increase in GV values from 1994 to1998, implying the change from bare lands or pastures tosuccessional vegetation. The white in the soil fractiondifferencing image indicates the high decrease of soil fractionvalues from 1994 to 1998, implying the change from bare landsor pastures to successional vegetation, while the black indicateshigh increase of soil fractions, implying the change from
94 © 2004 CASI
Vol. 30, No. 1, February/février 2004
Figure 6. Characteristics of land-cover changes on the fraction differencing images in Rondônia.

mature forests or successional vegetation to bare lands orpastures. The change/non-change detection result does includesome errors caused by errors inherent in the image registration(e.g., river width) and the LSMA approach limitation (e.g.,urban areas). Visual comparison of the change/non-changedetection results with the multiple dates of TM image colorcomposites indicated that almost all land-cover changes wereaccurately detected but for the urban areas and rivers. Thepossible reason of poor urban change detection is the complexfraction composition within the pixel in the urban landscape.Almost all pixels in the urban areas are mixed with differentland-cover types owing to the limitation of spatial resolution ofTM data and the fraction composition of each pixel is possiblydifferent from that of its neighbor pixels. Thus, the imageregistration error may cause the difference on the fractiondifferencing image. This evidence is clearer in the singlefraction differencing images. For example, in the GV fractiondifferencing image, the urban areas appear as grey (unchanged)because urban areas have very low GV fraction values.However, in the shade or soil fraction differencing image,many pixels in the urban areas appear bright grey owing to theimpacts of variation of shade and soil fractions betweenfraction images of both dates.
A color composite of fraction differencing images canprovide different insights about land-cover change detectioninformation. Figure 7 illustrates a comparison of colorcomposites between 1994 and 1998 TM images (bands TM 4,5, and 3 were assigned as red, green, and blue, respectively) andthe fraction differencing image color composite (∆Shade, ∆GV,and ∆Soil were assigned as red, green, and blue, respectively).Visual interpretation and comparison of these color compositesindicate that the different colors represent different land-coverchange trajectories. For example, the land-cover class in theselected polygon in the 1994 TM color composite is a matureforest. In 1998, some mature forest was converted toagropastoral lands (some pastures have color similar toagricultural lands because of the dry season) and successionalvegetation. The yellow color within the same polygon indicatesthe change from mature forest to agropastoral lands, and the redimplies the change from mature forest to successionalvegetation or agropastoral lands (such as coffee plantations).Thus, from the fraction differencing image color composite,land-cover change can be visually identified. Table 2 providesthe major land-cover change trajectories associated with thecolors in Figure 7. This analysis of fraction differencing imagecolor composites is useful for further quantitative land-coverchange detection using the multitemporal fraction images.
Land-cover “from-to” change detection
Figure 8 illustrates a comparison of fraction values amongselected land-cover classes. It was developed from fractionimages using the LSMA approach for the 1998 TM image,based on 134 sample sites covering different land-cover types.It indicates that mature forests and successional vegetationhave very low soil fraction values while mature forests have
higher shade fraction but lower GV fraction than successionalvegetation. Agropastoral lands have relatively higher soilfraction but lower shade fraction than successional and matureforests. Urban areas and bare lands have the highest soilfraction values but much lower shade and GV values thanvegetated areas. In contrast, water has the highest shade valuesbut low soil and GV values. The different fractioncompositions among the land-cover types provide the potentialto accurately classify the land-cover types and implementchange detection between two dates of fraction images.Therefore, the thresholds to distinguish land-cover types can bedefined based on the typical land-cover classes from the sampleplot data. These thresholds were then used to classify the entirestudy area for 1998 fraction images. Because stable and reliablefraction images also were developed from the 1994 TM image,the same thresholds were directly used for the 1994 fractionimage for land-cover classification. Finally, the classifiedimages of both dates were used to implement land-coverchange detection using the post-classification comparisonmethod, pixel by pixel.
Figure 9, which illustrates the land-cover changedistribution between 1994 and 1998, was developed from bi-temporal fraction images. It indicates that unchangedagropastoral lands are mainly distributed near the urban areasand along both sides of roads. Deforestation occurred along theroads and unchanged mature forest was located away from theroads and at large patches of forest reserves. The most obviousland-cover change is the conversion of mature forest toagropastoral lands or bare lands. Table 3 provides the statisticalresults of land-cover change detection between 1994 and 1998.The changes are mainly from the mature forest deforestationand vegetation regrowth, accounting for 56.93% (including14.63% of the changes from mature forest to successionalvegetation and 42.3% of the changes from mature forest toagropastoral lands and bare lands) and 25.8% of the totalchanged areas, respectively. In the unchanged areas, matureforest and agropastoral lands account for 73.7% and 21.6%,respectively. The change detection accuracy assessment wasnot available for this study owing to the lack of ground-truthdata for the 1994 TM data and the difficulty for visuallyinterpreting between the successional vegetation, degradedpastures, and agroforestry based on TM images.
DiscussionThe land-cover classification of historical remote sensing
images using traditional classifiers is often problematic owingto the lack of training sample data. The LSMA approach avoidsthis dilemma because it provides accurate and stable fractionsfor multitemporal TM images. This allows the direct transfer ofthresholds for each land-cover type developed on one date offraction images to another date of fraction images. Cautionsneed to be taken when implementing the model transfer amongmultitemporal fraction images to make sure the fraction imageswere developed with high quality. The examination of fractionvalues for those unchanged objects is useful to assure that the
© 2004 CASI 95
Canadian Journal of Remote Sensing / Journal canadien de télédétection

fraction values of the same unchanged objects have similarvalues on both dates of fraction images. If the fraction valuesare significantly different, checking the endmembers and thefraction images is necessary to verify that the endmembersselected are suitable. In the LSMA approach, endmemberselection is a crucial step. The selection of suitableendmembers often involves an iterative process, i.e., selectinginitial endmembers, refining these endmembers, evaluating
fraction images, and then further refining endmembers. Finally,selected endmembers should be independent of each other. Fora study area with complex landscape structures, such as thoseurban areas composed of residential, commercial and industrialuses, agricultural lands, and forests, identification and selectionof proper endmembers for the whole study area is often notstraightforward. Two possible approaches may be taken for
96 © 2004 CASI
Vol. 30, No. 1, February/février 2004
Figure 7. Comparison of land-cover change on the color composites between 1994 and 1998 TM images for the studyarea of Rondônia.

effective derivation of endmembers in an intricate urban area:(1) stratification or (2) use of multiple endmembers.
Stratification of the whole study area into smaller regions ofsimilar landscape structures may be necessary to facilitate thederivation of high quality fraction images. For example, in astudy area dominated by residential, commercial, and industrialuses, possible endmembers may be GV, shade, and impervioussurface, while in an agriculture-dominated region, endmembersmay be GV, shade, and soil. In the forested area, GV, shade, andnon-photosynthetic vegetation (NPV) may be the mostappropriate choice of endmembers. However, if GV, shade,impervious surface, soil, and NPV are used for the entire studyarea without stratification, the process for developing highquality fraction images could be lengthy and technically
difficult because of potentially high correlations between someendmembers, e.g., between impervious surfaces, soil, and NPV(Lu and Weng, 2004). On the other hand, a limited number ofendmembers may not account for the spectral variability of thecomplex landscape and cannot tackle the mixed pixel problem.In urban regions, because of the complexity of impervioussurfaces, identification of suitable impervious surfaces asendmembers, based on remote-sensing features, is oftendifficult and the impervious surfaces tend to be confused withsoils. Hence, a possible method is to use multiple endmembermodels (Roberts et al., 1998b). The multiple-endmemberLSMA approach permits a large number of endmembers to bemodeled across a scene and has shown a better performancethan the standard LSMA approach (Roberts et al., 1998b). The
© 2004 CASI 97
Canadian Journal of Remote Sensing / Journal canadien de télédétection
Major changetrajectories
Shade change(1994–1998)
GV change(1994–1998)
Soil change(1994–1998) Color compositea
MF to SS ++ 0 or – 0 RedMF to AP or UB ++ ++ – – YellowSS to AP or UB 0 or + ++ – – Between green and yellowAP or UB to SS 0 or – – – ++ BlueAP to UB 0 + – Between green and yellow, but darkUB to AP 0 – + Dark blue
Note: MF, mature forest; SS, secondary succession; UB, urban areas and bare lands; AP, agropastoral lands; ++, higher changeamounts (decreased from 1994 to 1998) than +; – –, higher change amounts (increased from 1994 to 1998) than –; 0, almostunchanged between 1994 and 1998.
aShade, GV, soil differencing images as red, green, and blue, respectively.
Table 2. Interpretation of some typical land-cover change trajectories in the color composite with bi-temporalfraction differencing images.
Figure 8. Comparison of fractions of typical land-cover classes for the study area of Rondônia.

multiple-endmember LSMA approach may be more suitablefor use in urban landscapes. For this study, three endmemberswere suitable for unmixing the non-urban areas for land-coverchange detection because very few urban areas exist in thisstudy area.
The fraction differencing images have their owncharacteristics and merits in land-cover change detection. Forexample, the soil fraction differencing image reflects more
effectively the vegetation and nonvegetation change, but is notsensitive to changes within vegetation types. In contrast, theshade and GV fraction differencing images are more effectivefor vegetation change detection. Therefore, the selection ofappropriate endmember fraction differencing images providesthe flexibility to implement change detection according tospecific research needs.
98 © 2004 CASI
Vol. 30, No. 1, February/février 2004
Change trajectory Area (ha) Area (%) Unchanged Area (ha) Area (%)
MF to SS 3 340.53 14.63 MF 56 416.50 73.71MF to UB or AP 9 658.44 42.30 SS 1 958.76 2.56SS to UB or AP 1 225.80 5.37 AP 16 520.40 21.59UB or AP to SS 5 891.85 25.80 UB 502.47 0.66AP to UB 852.57 3.73 WA 1 136.07 1.48UB to AP 1 864.17 8.16Total area 22 833.36 Total area 76 534.20
Note: MF, mature forest; SS, secondary succession; UB, urban areas and bare lands; AP, agropastoral lands;WA, water.
Table 3. Statistical results of land-cover change detection between 1994 and 1998.
Figure 9. Land-cover change distribution between 1994 and 1998 for the study area ofRondônia.

ConclusionsUsing traditional methods, land-cover change detection in
moist tropical regions is often difficult. The LSMA has provedto be a powerful tool that decomposes the image data intofraction images with physical meanings and has shown thecapability to implement land-cover classification and changedetection. This study indicates that fraction differencingimages have different characteristics in land-cover changedetection. Shade or GV fraction differencing images are moresuitable to detect vegetation change, while the soil fractiondifferencing image is more suitable to detect vegetation/nonvegetation change. The LSMA is especially suitable todetect detailed “from-to” change. The stable and reliablefraction images developed using LSMA from multitemporalimages provide the capability to directly transfer the thresholdsof each land-cover type from one date of fraction images toother dates of fraction images. This characteristic isparticularly valuable to classify land-cover types for historicalremotely sensed data to implement accurate land-cover changedetection.
AcknowledgmentsThe authors wish to thank the National Science Foundation
(grants 95-21918 and 99-06826), the National Aeronautics andSpace Administration (grant N005-334), and Brazil’s Programfor the Advancement of Education (CAPES) for their supportof the research that resulted in this paper. This study is a part ofthe Large-Scale Biosphere-Atmosphere Experiment inAmazônia (LBA) program, LC-09, which is examining thehuman and physical dimensions of land-use and land-coverchange. We also thank collaborators in Brazil, especially theLBA program, Embrapa Satellite Monitoring, INPE, and thepopulation of the study area, who made this work possible.
ReferencesAdams, J.B., Smith, M.O., and Gillespie, A.R. 1993. Imaging spectroscopy:
interpretation based on spectral mixture analysis. In Remote GeochemicalAnalysis, Topics in Remote Sensing 4. Edited by C.M. Pieters and P.A.J.Englert. Cambridge University Press, Cambridge, U.K. pp. 145–166.
Adams, J.B., Sabol, D.E., Kapos, V., Filho, R.A., Roberts, D.A., Smith, M.O.,and Gillespie, A.R. 1995. Classification of multispectral images based onfractions of endmembers: application to land-cover change in the BrazilianAmazon. Remote Sensing of Environment, Vol. 52, pp. 137–154.
Aguiar, A.P.D., Shimabukuro, Y.E., and Mascarenhas, N.D.A. 1999. Use ofsynthetic bands derived from mixing models in the multispectralclassification of remote sensing images. International Journal of RemoteSensing, Vol. 20, pp. 647–657.
Bateson, A., and Curtiss, B. 1996. A method for manual endmember selectionand spectral unmixing. Remote Sensing of Environment, Vol. 55, pp. 229–243.
Batistella, M. 2001. Landscape change and land-use/land-cover dynamics inRondônia, Brazilian Amazon. CIPEC Dissertation Series, No. 7. Center for
the Study of Institutions, Population, and Environmental Change (CIPEC),Indiana University, Bloomington, Ind.
Bognola, I.A., and Soares, A.F. 1999. Solos das “glebas 01, 02, 03 e 06” doMunicípio de Machadinho d’Oeste, RO. Embrapa Monitoramento porSatélite, Campinas, Brazil. Pesquisa em Andamento, n. 10.
Brondízio, E.S., Moran, E.F., Mausel, P., and Wu, Y. 1994. Land use change inthe Amazon estuary: patterns of Caboclo settlement and landscapemanagement. Human Ecology, Vol. 22, pp. 249–278.
Brondízio, E.S., Moran, E.F., Mausel, P., and Wu, Y. 1996. Land-cover in theAmazon estuary: linking of the Thematic Mapper with botanical andhistorical data. Photogrammetric Engineering & Remote Sensing, Vol. 62,pp. 921–929.
Center for the Study of Institutions, Population, and Environmental Change(CIPEC). 1998. International Forestry Resources and Institutions (IFRI)research program, field manual. CIPEC, Indiana University, Bloomington,Ind.
Chavez, P.S., Jr. 1996. Image-based atmospheric corrections — revisited andimproved. Photogrammetric Engineering & Remote Sensing, Vol. 62,pp. 1025–1036.
Cochrane, M.A., and Souza, C.M., Jr. 1998. Linear mixture modelclassification of burned forests in the eastern Amazon. InternationalJournal of Remote Sensing, Vol. 19, pp. 3433–3440.
Coppin, P.R., and Bauer, M.E. 1996. Digital change detection in forestecosystems with remote sensing imagery. Remote Sensing Reviews, Vol. 13,pp. 207–234.
DeFries, R.S., Hansen, M.C., and Townshend, J.R.G. 2000. Global continuousfields of vegetation characteristics: a linear mixture model applied to multi-year 8 km AVHRR data. International Journal of Remote Sensing, Vol. 21,pp. 1389–1414.
Elmore, A.J., Mustard, J.F., Manning, S.J., and Lobell, D.B. 2000,Quantifying vegetation change in semiarid environments: precision andaccuracy of spectral mixture analysis and the normalized differencevegetation index. Remote Sensing of Environment, Vol. 73, pp. 87–102.
Instituto Nacional de Pesquisas Espaciais (INPE). 2002. Monitoring of theBrazilian Amazon Forest by Satellite 2000–2001. INPE, Brazil.
Jensen, J.R. 1996. Introductory digital image processing: a remote sensingperspective. 2nd ed. Prentice Hall, Upper Saddle River, N.J.
Lu, D., and Weng, Q. 2004. Spectral mixture analysis of the urban landscapesin Indianapolis with Landsat ETM+ imagery. PhotogrammetricEngineering & Remote Sensing. In press.
Lu, D., Mausel, P., Brondizio, E., and Moran, E. 2002. Assessment ofatmospheric correction methods for Landsat TM data applicable toAmazon basin LBA research. International Journal of Remote Sensing,Vol. 23, pp. 2651–2671.
Lu, D., Batistella, M., and Moran, E. 2003a. Integration of vegetationinventory data and Thematic Mapper image for Amazonian successionaland mature forest classification. In Proceedings of the ASPRS 2003 AnnualConference, 5–9 May 2003, Anchorage, Alaska. [CD-ROM]. AmericanSociety of Photogrammetry and Remote Sensing, Bethesda, Md.
Lu, D., Moran, E., and Batistella, M. 2003b. Linear mixture model applied toAmazônian vegetation classification. Remote Sensing of Environment,Vol. 87, No. 4, pp. 456–469.
Lu, D., Mausel, P., Brondizio, E., and Moran, E. 2004. Change detectiontechniques. International Journal of Remote Sensing. In press.
© 2004 CASI 99
Canadian Journal of Remote Sensing / Journal canadien de télédétection

Mausel, P., Wu, Y., Li, Y., Moran, E.F., and Brondízio, E.S. 1993. Spectralidentification of succession stages following deforestation in the Amazon.Geocarto International, Vol. 8, pp. 61–72.
Moran, E.F. 1981. Developing the Amazon. Indiana University Press,Bloomington, Ind.
Moran, E.F., Brondízio, E.S., and Mausel, P. 1994a. Secondary succession.Research and Exploration, Vol. 10, pp. 458–476.
Moran, E.F., Brondízio, E.S., Mausel, P., and Wu, Y. 1994b. IntegratingAmazonian vegetation, land use and satellite data. BioScience, Vol. 44,pp. 329–338.
Mustard, J.F., and Sunshine, J.M. 1999. Spectral analysis for earth science:investigations using remote sensing data. In Remote Sensing for the EarthSciences: Manual of Remote Sensing. Edited by A.N. Rencz. John Wiley &Sons, New York. Vol. 3, pp. 251–307.
Roberts, D.A., Batista, G.T., Pereira, J.L.G., Waller, E.K., and Nelson, B.W.1998a. Change identification using multitemporal spectral mixtureanalysis: applications in eastern Amazônia. In Remote Sensing ChangeDetection: Environmental Monitoring Methods and Applications. Editedby R.S. Lunetta and C.D. Elvidge, Ann Arbor Press, Ann Arbor, Mich.pp. 137–161.
Roberts, D.A., Gardner, M., Church, R., Ustin, S., Scheer, G., and Green, R.O.1998b. Mapping chaparral in the Santa Monica mountains using multipleendmember spectral mixture models. Remote Sensing of Environment,Vol. 65, pp. 267–279.
Roberts, D.A., Numata, I., Holmes, K.W., Batista, G., Krug, T., Monteiro, A.,Powell, B., and Chadwick, O. 2002. Large area mapping of land-coverchange in Rondônia using multitemporal spectral mixture analysis anddecision tree classifiers. Journal of Geophysical Research, Vol. 107(D20),8073 (LBA 40-1 – 40-18).
Rogan, J., Franklin, J., and Roberts, D.A. 2002. A comparison of methods formonitoring multitemporal vegetation change using Thematic Mapperimagery. Remote Sensing of Environment, Vol. 80, pp. 143–156.
Rondônia. 1998. Diagnóstico sócio-econômico do Estado de Rondônia eassistência técnica para formulação da segunda aproximação dozoneamento sócio-econômico-ecológico — Climatologia, v. 1. Governo deRondônia – PLANAFLORO, Porto Velho, Brazil.
Schmink, M., and Wood, C.H. 1992. Contested frontiers in Amazônia.Columbia University Press, New York.
Serpico, S.B., and Bruzzone, L. 1999. Change detection. In Informationprocessing for remote sensing. Edited by C.H. Chen. World ScientificPublishing Co., Singapore. pp. 319–336.
Settle, J.J., and Drake, N.A. 1993. Linear mixing and the estimation of groundcover proportions. International Journal of Remote Sensing, Vol. 14,pp. 1159–1177.
Shimabukuro, Y.E., Batista, G.T., Melio, E.M.K., Moreira, J.C., and Duarte, V.1998. Using shade fraction image segmentation to evaluate deforestation inLandsat Thematic Mapper images of the Amazon region. InternationalJournal of Remote Sensing, Vol. 19, pp. 535–541.
Singh, A. 1989. Digital change detection techniques using remotely senseddata. International Journal of Remote Sensing, Vol. 10, pp. 989–1003.
Smith, M.O., Ustin, S.L., Adams, J.B., and Gillespie, A.R. 1990. Vegetation inDeserts: I. A regional measure of abundance from multispectral images.Remote Sensing of Environment, Vol. 31, pp. 1–26.
Theseira, M.A., Thomas, G., and Sannier, C.A.D. 2002. An evaluation ofspectral mixture modeling applied to a semi-arid environment.International Journal of Remote Sensing, Vol. 23, pp. 687–700.
Tompkins, S., Mustard, J.F., Pieters, C.M., and Forsyth, D.W. 1997.Optimization of endmembers for spectral mixture analysis. Remote Sensingof Environment, Vol. 59, pp. 472–489.
Ustin, S.L., Smith, M.O., Jacquemoud, S., Verstraete, and M., Govaerts, Y.1999. Geobotany: vegetation mapping for earth sciences. In Remotesensing for the earth sciences: Manual of remote sensing. Edited by A.N.Rencz. John Wiley & Sons. Vol. 3, pp. 189–233.
Yool, S.R., Makaio, M.J., and Watts, J.M. 1997. Techniques for computer-assisted mapping of rangeland change. Journal of Range Management,Vol. 50, pp. 307–314.
Yuan, D., Elvidge, C.D., and Lunetta, R.S. 1998. Survey of multispectralmethods for land-cover change analysis. In Remote sensing changedetection: Environmental monitoring methods and applications. Edited byR.S. Lunetta and C.D. Elvidge. Ann Arbor Press, Chelsea, Mich. pp. 21–39.
100 © 2004 CASI
Vol. 30, No. 1, February/février 2004