Embed Size (px)
Citation preview

Copyright UCT
Can household income explain township consumer behaviour?
A study of the Roots Health and Wellness Centre (Spa)
A Research Report
The Graduate School of Business
University of Cape Town
in partial fulfillment of the requirements for the
Masters of Business Administration Degree
by
Rodgers Ndobe
11 December 2009
Supervisor: Mlenga Jere

Copyright UCT
i | P a g e R e s e a r c h R e p o r t
Plagiarism Declaration
1. I know that plagiarism is wrong. Plagiarism is to use another‟s work and pretend that
it is your own.
2. I have used a recognized convention for citation and referencing. Each significant
contribution and quotation from the works of other people has been attributed, cited
and referenced.
3. I certify that this submission is all our own work.
4. I have not allowed and will not allow anyone to copy this assignment with the
intention of passing it off as his or her own work.
07 May 2010
Signed Date

Copyright UCT
ii | P a g e R e s e a r c h R e p o r t
Acknowledgements
I would like to record my sincerest gratitude to the following people who have been made my
load light and bearable throughout the research period:
My Supervisor Mr. Mlenga Jere – for accepting me as a protégé and shaping my
formless and vague imaginations into a researchable idea. Your patience and humility
has motivated me to work even harder in the short space of time I had. I have learned
a lot from you.
Sis Thabang Molefi – for opening the doors of your business to allow me to conduct
this research. Your generosity and spirit of Ubuntu is rare jewel in the present day and
age. God bless you.
Thetso and the staff at Diepkloof and Spruitview Roots branches – your continued
support has given me hope and courage at the most challenging times of this research.
Do not be weary in doing good, „cause in due season you will reap your reward.

Copyright UCT
iii | P a g e R e s e a r c h R e p o r t
Abstract
The objective of the research was to determine if the level of household income influenced
consumer behaviour in the townships in South Africa. The research focused on the clients of
Roots Health and Wellness Centre Spas located in Soweto and Spruitview. A quantitative
research methodology was used and questionnaires were used to collect data from the Roots
clients. Data on the following variable was collected: client income; client age and gender;
frequency of use and money spent at the Spa. The data was analyzed using the Chi-Squared
Association method. The research results showed that the low income clients used the Spa
more frequently and spent less money per visit and the high income clients used the Spa less
frequently and spent more money per visit .Thus it would appear that there is correlation
between household income and consumer behaviour in the townships of South Africa
Key words:
Consumer behaviour, income groups, social class, spending,

Copyright UCT
iv | P a g e R e s e a r c h R e p o r t
Table of Contents
Plagiarism Declaration ................................................................................................................ i
Acknowledgements .................................................................................................................... ii
Abstract .................................................................................................................................... iii
List of figures ............................................................................................................................ vi
List of tables ............................................................................................................................. vii
1 Introduction ........................................................................................................................ 1
1.1 Research area and problem ......................................................................................... 1
1.2 Research questions and corresponding hypotheses ..................................................... 2
1.3 Research scope ............................................................................................................ 4
1.4 Research assumption ................................................................................................... 4
1.5 Research ethics ............................................................................................................ 5
2 Literature review ................................................................................................................ 5
2.1 Factors that influence consumer behaviour ................................................................. 5
2.2 Social class influence .................................................................................................. 6
2.3 Income as a predictor of consumer behaviour ............................................................ 7
2.4 Conclusion ................................................................................................................. 12
3 Research methodology ..................................................................................................... 15
3.1 Research approach and strategy ................................................................................ 15
3.2 Sampling, research setting and participants .............................................................. 18

Copyright UCT
v | P a g e R e s e a r c h R e p o r t
3.3 Research criteria ........................................................................................................ 19
3.4 Data analysis methods ............................................................................................... 20
4 Research findings and analysis ........................................................................................ 22
4.1 Surveyed sample information.................................................................................... 22
4.1.1 Research response rate and respondents‟ area of residence ............................... 22
4.1.2 Respondents‟ age and gender distribution ......................................................... 23
4.1.3 Respondents‟ personal and household income distribution ............................... 24
4.1.4 Marketing medium that introduced respondents to Roots ................................. 26
4.1.5 Person responsible for paying respondents‟ bill at Roots .................................. 27
4.2 Analysis ..................................................................................................................... 28
4.2.1 Number of clients using Roots among different income groups ....................... 28
4.2.2 Amount of money spent per visit per income group .......................................... 29
4.2.3 Person paying for services used per income group ............................................ 32
4.2.4 Number of spa visits per income group ............................................................. 33
5 Discussion ........................................................................................................................ 36
6 Research limitations ......................................................................................................... 37
7 Research conclusions ....................................................................................................... 38
8 Future research directions ................................................................................................ 41
References ................................................................................................................................ 42
Appendix .................................................................................................................................. 45
Appendix 1: Research theory ............................................................................................... 45

Copyright UCT
vi | P a g e R e s e a r c h R e p o r t
Appendix 2: Research instrument ........................................................................................ 47
Letter of introduction ....................................................................................................... 47
Survey Questionnaire ....................................................................................................... 48
Appendix 3: Radio Listenership among LSM groups ......................................................... 51
Percentage of listenership in the SU- LSM 1-5 categories .............................................. 51
Percentage of radio listenership in the SU- LSM 6-10 categories ................................... 51
List of figures
Figure 1: Engel, Blackwell and Miniard Model ........................................................................ 6
Figure 2: The consumer decision-making process ..................................................................... 7
Figure 3: Share of LSMs in total household cash expenditure and households ...................... 10
Figure 4: Engel curves for some of the consumption categories ............................................. 11
Figure 5: The process of deduction .......................................................................................... 15
Figure 6: Breakdown of respondents‟ residential status .......................................................... 22
Figure 7: Main use of the wellness centre ............................................................................... 23
Figure 8: Gender distribution of respondents .......................................................................... 23
Figure 9: Respondents‟ age distribution .................................................................................. 23
Figure 10: Respondents‟ personal income ............................................................................... 24
Figure 11: Employed family members per respondent ............................................................ 24
Figure 12: Respondents‟ family income .................................................................................. 25
Figure 13: Number of financial dependents per respondent .................................................... 25

Copyright UCT
vii | P a g e R e s e a r c h R e p o r t
Figure 14: How respondents came to know about Roots ........................................................ 26
Figure 15: Marketing channels that attracted respondents to Roots ........................................ 26
Figure 16: Person paying for the wellness services at Roots ................................................... 27
Figure 17: Length of time the respondents have been using Roots services ........................... 27
Figure 18: % of radio listenership among LSM 1-5 ................................................................ 51
Figure 19: % of radio listenership among LSM 6-10 .............................................................. 52
List of tables
Table 1: Percentage (%) growth in household expenditure from 1994 to 2004 ........................ 1
Table 2: Fruit and vegetables consumed by participants in the past 24-hours .......................... 9
Table 3: Summary of relationship between theory and research questions and questionaire . 14
Table 4: International Spas Association definitions of spas .................................................... 45
Table 5: Adults by race, income group, and sex, 2008 (proportions) ...................................... 46
Copyright UCT
1 | P a g e R e s e a r c h R e p o r t
1 Introduction
1.1 Research area and problem
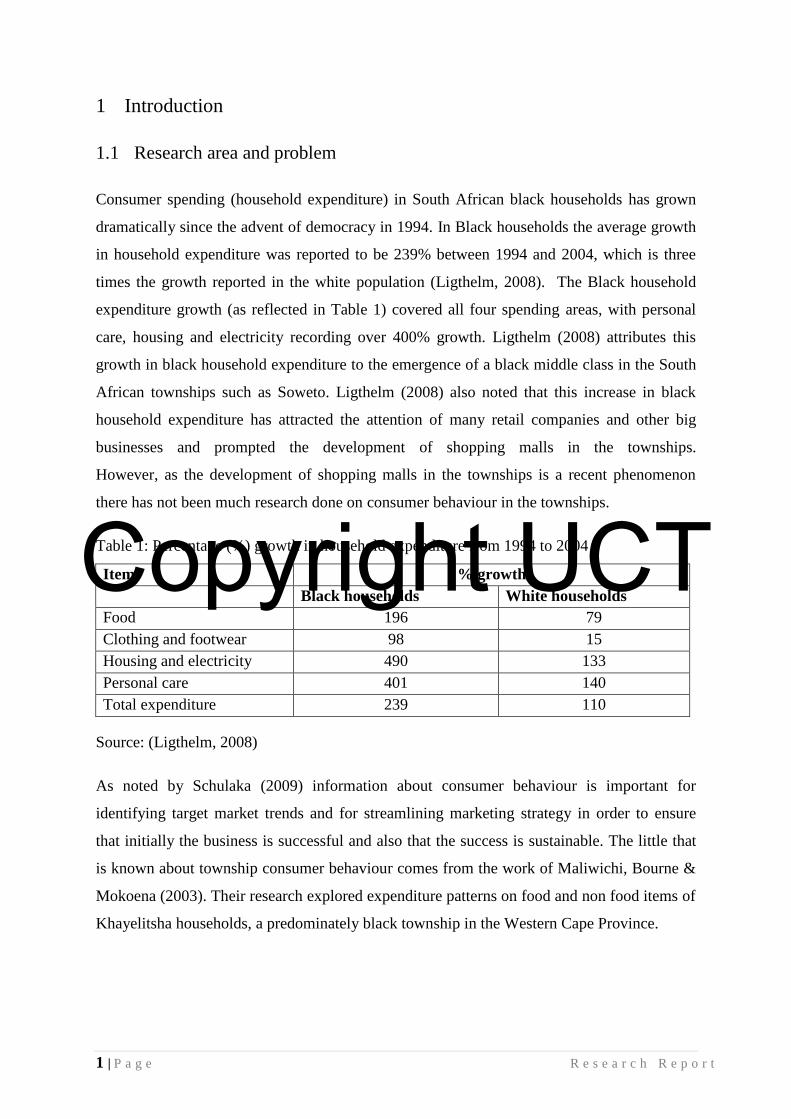
Consumer spending (household expenditure) in South African black households has grown
dramatically since the advent of democracy in 1994. In Black households the average growth
in household expenditure was reported to be 239% between 1994 and 2004, which is three
times the growth reported in the white population (Ligthelm, 2008). The Black household
expenditure growth (as reflected in Table 1) covered all four spending areas, with personal
care, housing and electricity recording over 400% growth. Ligthelm (2008) attributes this
growth in black household expenditure to the emergence of a black middle class in the South
African townships such as Soweto. Ligthelm (2008) also noted that this increase in black
household expenditure has attracted the attention of many retail companies and other big
businesses and prompted the development of shopping malls in the townships.
However, as the development of shopping malls in the townships is a recent phenomenon
there has not been much research done on consumer behaviour in the townships.
Table 1: Percentage (%) growth in household expenditure from 1994 to 2004
Item % growth
Black households White households
Food 196 79
Clothing and footwear 98 15
Housing and electricity 490 133
Personal care 401 140
Total expenditure 239 110
Source: (Ligthelm, 2008)
As noted by Schulaka (2009) information about consumer behaviour is important for
identifying target market trends and for streamlining marketing strategy in order to ensure
that initially the business is successful and also that the success is sustainable. The little that
is known about township consumer behaviour comes from the work of Maliwichi, Bourne &
Mokoena (2003). Their research explored expenditure patterns on food and non food items of
Khayelitsha households, a predominately black township in the Western Cape Province.

Copyright UCT
2 | P a g e R e s e a r c h R e p o r t
Having identified the research area as being the lack of information about consumer
behaviour in townships the researcher decided to investigate the consumer behaviour related
to the Roots Health and Wellness Centre which is a Spa located in Soweto and Spruitview.
Dr Thabang Molefi is the founder of the Roots Spa and she had previously conducted
research when planning to set up her business – however this research had been inappropriate
for her needs. Part of the research was financially taxing as she pursued wrong marketing
channels for her services after establishing her business such as advertising on radio stations
like Metro FM, a station with a listenership predominantly black young up and coming
professionals (Macanda, 2007).
Thus the focus of this research was to provide consumer behaviour information to
entrepreneurs like Dr. Thabang Molefi and businesses wanting to expand to the township
market to help identify the viability of their businesses. This information will hopefully help
them to establish their businesses without having to conduct their own primary research,
which can be time consuming and costly.
1.2 Research questions and corresponding hypotheses
The main question that this research sought to answer is:
Does the level of household income influence consumer behaviour for spa services in the
townships? To understand whether the level of household income influences consumer
spending behaviour or not, the research questions below were formulated using the main
research question. These questions were used to develop the questionnaire that was used to
collect consumer data and to test the relationship between the two variables.
Question 1
Is there a difference in the number of people visiting the spas between income groups? (Is it
lower among low income group, moderate among middle income group and higher among
high income group?)
Copyright UCT
3 | P a g e R e s e a r c h R e p o r t
Hypothesis 1
Ho : The number of clients using the spa is equal among income groups
Ha : The number of clients using the spa is different among income groups
Question 2
Is there a difference in the amount of money spend during a visit to the spa between different
income groups? (Is it lower among low income group, moderate among middle income group
and higher among high income group?)
Hypothesis 2
Ho : The amount of money spent during a spa visit is similar among income groups
Ha : The amount of money spent during a spa visit differs among income groups
Question 3
Is there a difference among income groups as to who pays for the spa visits? (Is it own, gift or
family who pays for the spa visit?)
Hypothesis 3
Ho : The person paying for services used at the spa is similar among income groups
Ha : The person paying for services used at the spa is different among income groups
Question 4
Is there a difference in the total number of monthly visits to the spa between income groups?
(Is it lower among low income group, moderate among middle income group and higher
among high income group?)
Copyright UCT
4 | P a g e R e s e a r c h R e p o r t
Hypothesis 4
Ho : The combined number of visits to the spa is the same among income groups
Ha : The combined number of visits to the spa is different among income groups
1.3 Research scope
The research was conducted among customers of the Roots spa. This was chosen due to the
huge and diverse nature of the township market and the constraints of the time allocated to
this research. Hence application of the research results is likely to be confined to the market
sector and type of business Roots operates in. It would be possible to replicate the study to
other markets and business types.
1.4 Research assumption
The following assumptions have been made to facilitate both collection and analysis of data:
The proportion of income groups is the same in all townships.
If Soweto, for instance, has a household income group distribution of say 5% high
income families, 35% middle income families and 60% low income family and the
research results reflect that 5% of people using Roots are from high income families,
35% are from middle income families and 60% are from low income families. This
will simply be a reflection of the demographics in the township. Since that
information could not be access during the time of the research, this assumption has to
be made to enable analysis of data.
Consumer dynamics are similar across South African townships.
This was made to enable data collected from the two townships to be collated and
analysed as one. However there may be geographically, economic and cultural aspects
that can possibly influence how consumers behave from different townships.
Copyright UCT
5 | P a g e R e s e a r c h R e p o r t
1.5 Research ethics
Although there was no tangible risk of harm to research respondents, it was noted that lack of
informed consent and data protection could have presented some challenges (Bryman & Bell,
2008). Respondents may have chosen not to participate if they did not have full
understanding of what the research was about. To address this possible lack of informed
consent, a letter of introduction was attached to each survey questionnaire, explaining the
purpose of the research in details (see appendix 2 for copy of the letter). This assisted
respondents to decide if they wanted to participate or not in the survey. Respondents‟
responses were also kept anonymous by not gathering personal data such as names, ID
numbers, street addresses, and other information that may later make it possible to identify
respondents. The University of Cape Town‟s Research Ethical Clearance on-line form was
also completed and submitted. This clearance was done to assess and address possible ethical
implications of the research before soliciting responses from the research participants.
2 Literature review
2.1 Factors that influence consumer behaviour
Understanding consumer behaviour is vital for crafting an effective marketing strategy
(Wiese, 2008). According to Silk (2006) understanding consumer behaviour gives businesses
a competitive advantage over their competitors. Wiese (2008) explains consumer behaviour
as how consumers make decisions on how they will spend their resources (money, time and
skills) and Peter and Donnelly (2006) describe it as understanding why consumers behave the
way they do. Numerous models of consumer behaviour have been developed such as the
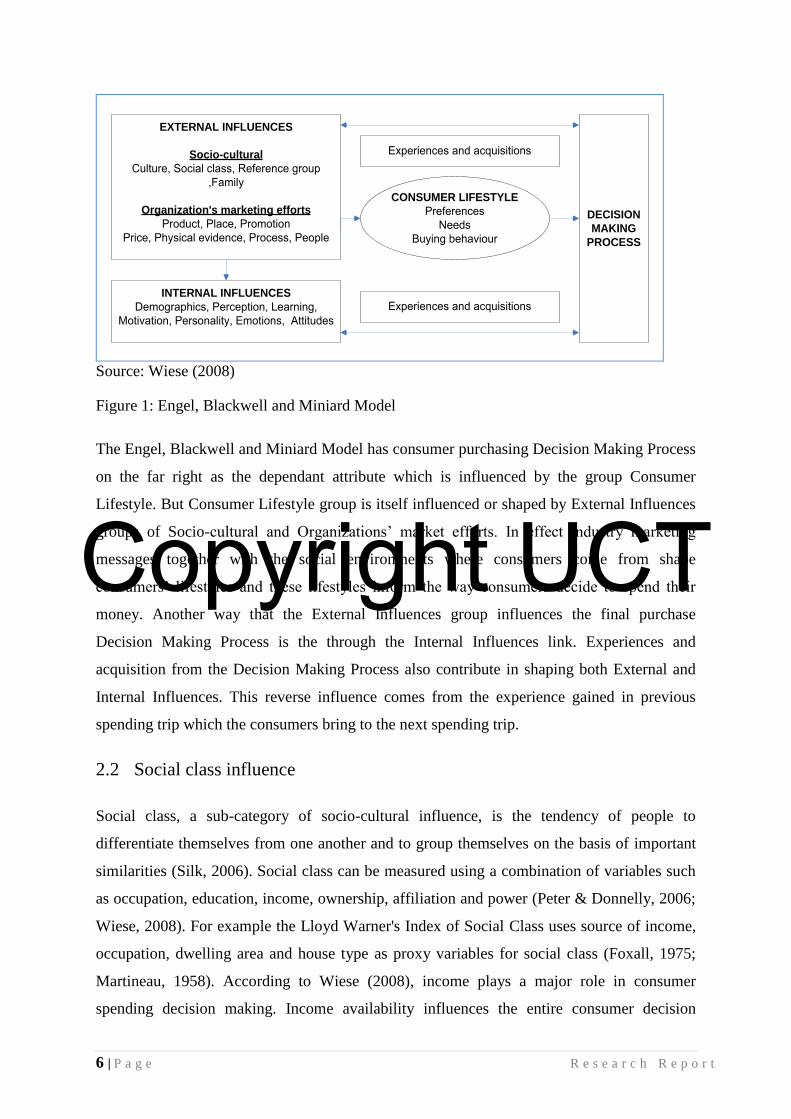
Engel, Blackwell and Miniard Model (Wiese, 2008) as shown in Figure 1 below.
The Engel, Blackwell and Miniard model group variables that influence consumer behaviour
into major categories that influence consumers such as socio-cultural, marketing and
psychological variables. The model also shows the causal relationships that develop between
these variable and consumer behaviour (consuming decision making process)
Copyright UCT
6 | P a g e R e s e a r c h R e p o r t
CONSUMER LIFESTYLE
PreferencesNeeds
Buying behaviour
DECISION
MAKING
PROCESS
EXTERNAL INFLUENCES
Socio-cultural
Culture, Social class, Reference group ,Family
Organization's marketing efforts
Product, Place, PromotionPrice, Physical evidence, Process, People
INTERNAL INFLUENCES
Demographics, Perception, Learning, Motivation, Personality, Emotions, Attitudes
Experiences and acquisitions
Experiences and acquisitions
Source: Wiese (2008)
Figure 1: Engel, Blackwell and Miniard Model
The Engel, Blackwell and Miniard Model has consumer purchasing Decision Making Process
on the far right as the dependant attribute which is influenced by the group Consumer
Lifestyle. But Consumer Lifestyle group is itself influenced or shaped by External Influences
groups of Socio-cultural and Organizations‟ market efforts. In effect industry marketing
messages together with the social environments where consumers come from shape
consumers‟ lifestyles and these lifestyles inform the way consumers decide to spend their
money. Another way that the External Influences group influences the final purchase
Decision Making Process is the through the Internal Influences link. Experiences and
acquisition from the Decision Making Process also contribute in shaping both External and
Internal Influences. This reverse influence comes from the experience gained in previous
spending trip which the consumers bring to the next spending trip.
2.2 Social class influence
Social class, a sub-category of socio-cultural influence, is the tendency of people to
differentiate themselves from one another and to group themselves on the basis of important
similarities (Silk, 2006). Social class can be measured using a combination of variables such
as occupation, education, income, ownership, affiliation and power (Peter & Donnelly, 2006;
Wiese, 2008). For example the Lloyd Warner's Index of Social Class uses source of income,
occupation, dwelling area and house type as proxy variables for social class (Foxall, 1975;
Martineau, 1958). According to Wiese (2008), income plays a major role in consumer
spending decision making. Income availability influences the entire consumer decision
Copyright UCT
7 | P a g e R e s e a r c h R e p o r t
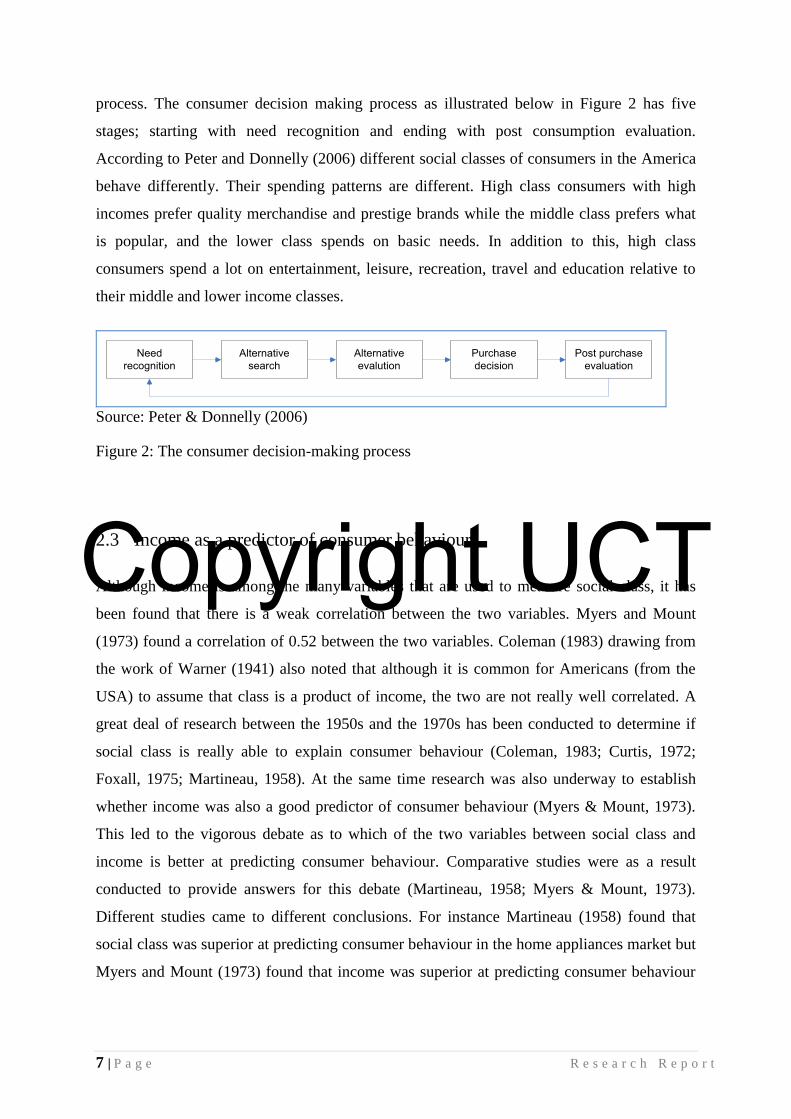
process. The consumer decision making process as illustrated below in Figure 2 has five
stages; starting with need recognition and ending with post consumption evaluation.
According to Peter and Donnelly (2006) different social classes of consumers in the America
behave differently. Their spending patterns are different. High class consumers with high
incomes prefer quality merchandise and prestige brands while the middle class prefers what
is popular, and the lower class spends on basic needs. In addition to this, high class
consumers spend a lot on entertainment, leisure, recreation, travel and education relative to
their middle and lower income classes.
Need recognition
Alternative search
Alternative evalution
Purchase decision
Post purchase evaluation
Source: Peter & Donnelly (2006)
Figure 2: The consumer decision-making process
2.3 Income as a predictor of consumer behaviour
Although income is among the many variables that are used to measure social class, it has
been found that there is a weak correlation between the two variables. Myers and Mount
(1973) found a correlation of 0.52 between the two variables. Coleman (1983) drawing from
the work of Warner (1941) also noted that although it is common for Americans (from the
USA) to assume that class is a product of income, the two are not really well correlated. A
great deal of research between the 1950s and the 1970s has been conducted to determine if
social class is really able to explain consumer behaviour (Coleman, 1983; Curtis, 1972;
Foxall, 1975; Martineau, 1958). At the same time research was also underway to establish
whether income was also a good predictor of consumer behaviour (Myers & Mount, 1973).
This led to the vigorous debate as to which of the two variables between social class and
income is better at predicting consumer behaviour. Comparative studies were as a result
conducted to provide answers for this debate (Martineau, 1958; Myers & Mount, 1973).
Different studies came to different conclusions. For instance Martineau (1958) found that
social class was superior at predicting consumer behaviour in the home appliances market but
Myers and Mount (1973) found that income was superior at predicting consumer behaviour
Copyright UCT
8 | P a g e R e s e a r c h R e p o r t
for certain packaged consumer goods and some services. It was Schaninger in Coleman
(1983) who eventually provided guidance and direction through the following generalization:
Social class is superior for areas of consumer behaviour that do not involve high value
expenditures, but do reflect underlying life-style value
Income is superior for products which require substantial expenditure and reflect
ability to pay yet are not perceived to be class-linked status symbols
Both must be used in combination for product classes that are highly visible, serve as
symbols of status within class, and require either moderate or substantial expenditure
Further research on the influence of income on consumer behaviour continued to yield
different results in line with these generalizations. Gundgaard‟s (2006) study of the health
services utilization between income groups in Denmark‟s Funen County is one such example.
Gundgaard surveyed 2,915 respondents who used hospital services and used the index of
horizontal inequity (HI) to determine the role of income in predicting consumer behaviour.
Although his study revealed that lower income groups consumed a bigger share of the health
systems with exception of dental services, no significant inequity use of health services was
found to exist. Hence the study concluded that the use of health care services in Funen
County was in general equitable across all income groups. In this case social class may be the
alternative to explaining consumer behaviour.
However, Bowman (1997) and Giskes, Turrell, Patterson, and Newman (2002) in unrelated
separate studies concluded that income was a predictor of consumer behaviour. Bowman
(1997) explored the influence of income on snacking habits of American households using
data from USDA's 1994 Continuing Survey of Food Intakes by Individuals (CSFII). Mean
intakes of foods, nutrients, Food Guide Pyramid servings, and frequency of snacking were
computed for the 5400 respondents surveyed. The study used linear models and logistics
regressions with the aid of the SPSS-X (Release 6.1) software package to analyze the
collected data. The research results concluded that the percentage of individuals who snacked
or had a beverage break increased with an increase in income. The number of people from the
surveyed sample who had a snack break was 69 percent in (lower income), 74 percent in
middle income and 79 percent in higher incomes. The lowest income group were also found
to have more snack breaks than the other income groups during the conventional lunch and
Copyright UCT
9 | P a g e R e s e a r c h R e p o r t
dinner hours, which Bowman (1997) argued could reflect an inability to afford a nutritionally
adequate meal.
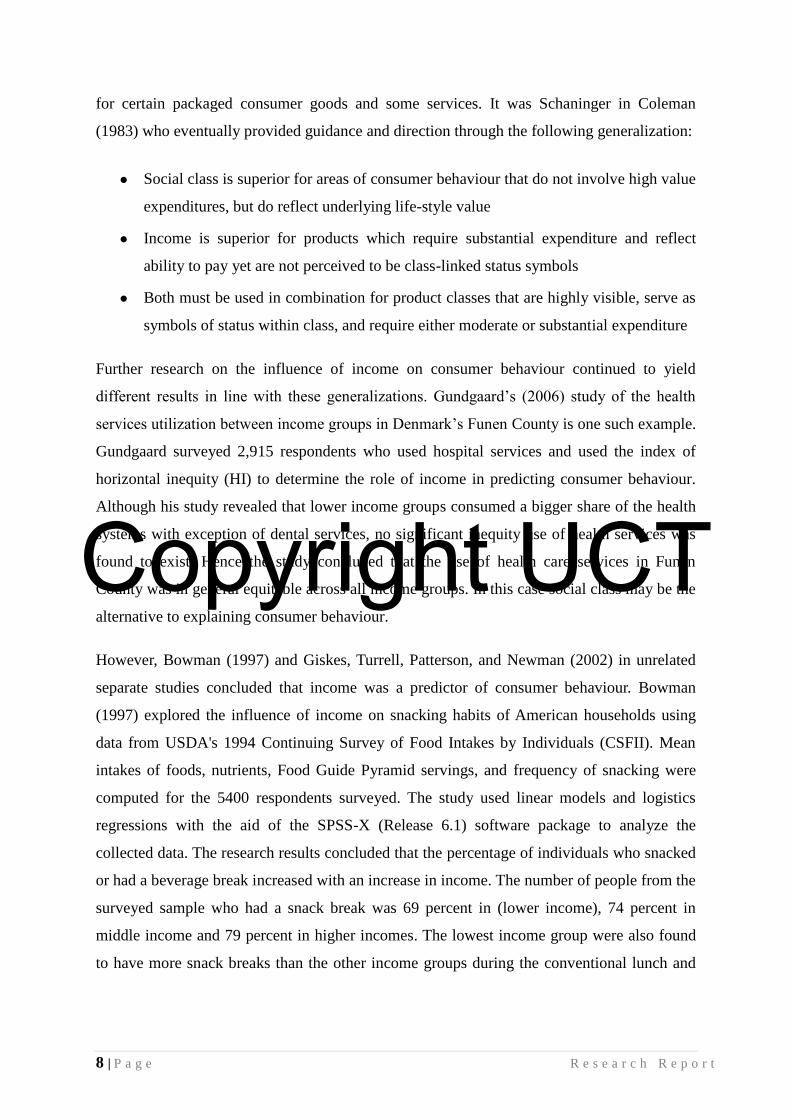
Giskes et al. (2002) also arrived at a similar conclusion during their research which explored
the influence of socioeconomic factors on consumption of fruit and vegetable high in
vitamins A, C and folate. Household income was used as the measure of socioeconomic
position (SEP). Giskes et al. (2002), like Bowman (1997), employed the multiple-pass 24-
hour recall procedure from the US CSFII to collect data from 13 858 participants representing
their households and the SPSS Version 10.0 to analyze it. This software uses linear models to
examine the associations between nutrient intakes, the amount of fruit and vegetables
consumed and income. A summary of the analysis results on table 2 below revealed that
participants from low-income households consumed a smaller quantity of fruit and
vegetables. Like in the Bowman (1997) study, the average consumption of vegetables
increased steadily from low income households to high income households. Participants from
low income household were also less likely to consume fruit and vegetables high in vitamin
C, folate and vitamin A than their richer counterparts, albeit the differences were small to
moderate in magnitude. Vitamin A intakes were not significantly related to income.
Table 2: Fruit and vegetables consumed by participants in the past 24-hours
Household Income (Quintiles)
Grams of fruit consumed (SD) Grams of vegetables consumed (SD)
Income Men Women Men Women
1 (Low) 69 (9) 87(9) 118(8) 104(7)
2 72 (10) 97(9) 118(7) 102(7)
3 96 (10) 117(9) 117(7) 104(7)
4 101(11) 110(10) 111(7) 105(7)
5(High) 146 (11) 160(9) 136(7) 120(7)
P-value <0.01 <0.01 0.02 <0.01
Source: Giskes et al. (2002)
Local and other international research also suggests that household income exert significant
influence on consumer behaviour. A study of South African households, which made use of
descriptive rather than inferential statistical methods revealed that household income affect
consumption of goods and services among different LSM groups. According to Martins
(2005) 12.4 million households in South Africa spent a total of R870 billion in 2005
Copyright UCT
10 | P a g e R e s e a r c h R e p o r t
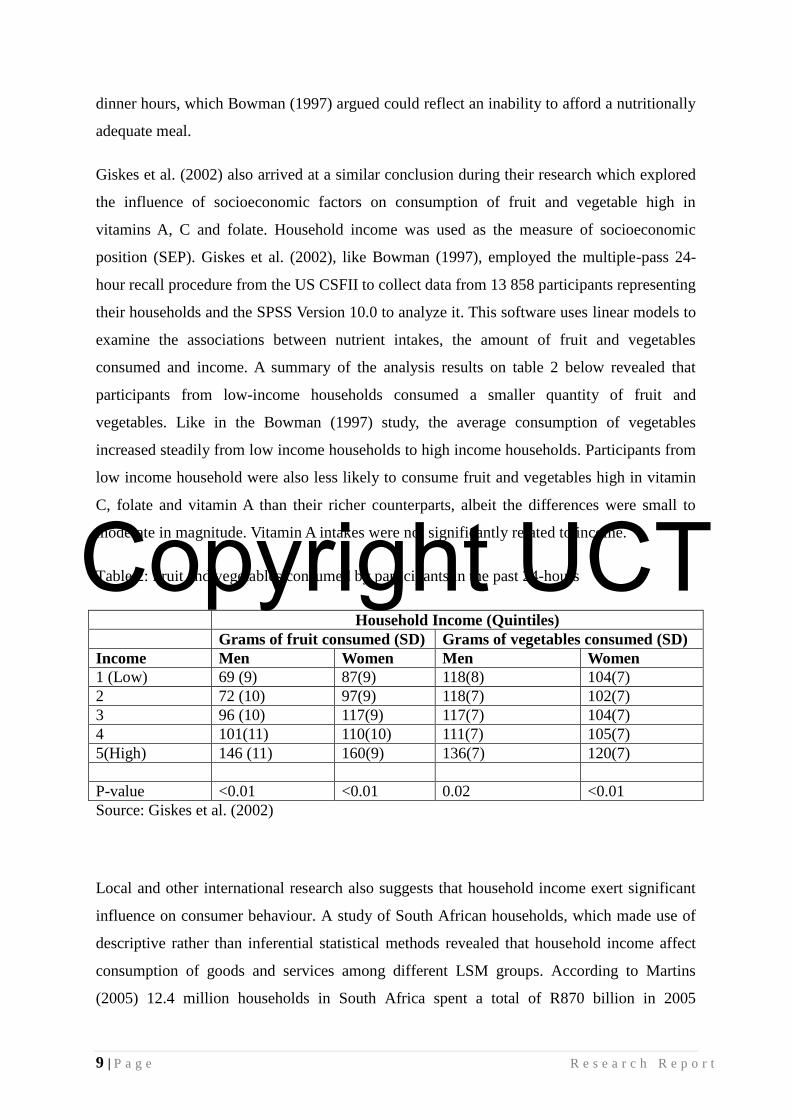
collectively. The spending was on approximately 500 products and services. The distribution
of this spending among families per LSM categories is shown on figure 3 below. LSM 10
households which account for 6.5% of all households were responsible for 30.5% of this total
cash spending. One remarkable feature of the LSM 10 spending is its contribution on what
one may call luxury spending. This LSM was responsible for 61% of the R11 billion of all
holidays spending by South African, 53% of the R10.9 billion sport, recreation, entertainment
and sport spending and 53% of R10.9 billion paid to domestic servants.
Source: Martins (2005)
Figure 3: Share of LSMs in total household cash expenditure and households
Another peculiar feature of the households spending is the nature of food items purchased by
LSM 6‟s compared to LSM 1‟s. Whereas LSM 1‟s spent 71% of their total budget on basic
food items such poultry, bread, maize meal and rice , LSM 6‟s spent only 24% of their total
budget but much higher in rand value term, on varied food items such as white bread, beef,
mutton, lamb, poultry and fresh milk (Martins, 2005). High income families also seem to
indulge in a big way since they spend a small percentage of their income on foods but
account for a big portion of overall cash spending in the entire country. This may be as a
result of frequent spending and consumption of high value items and services.
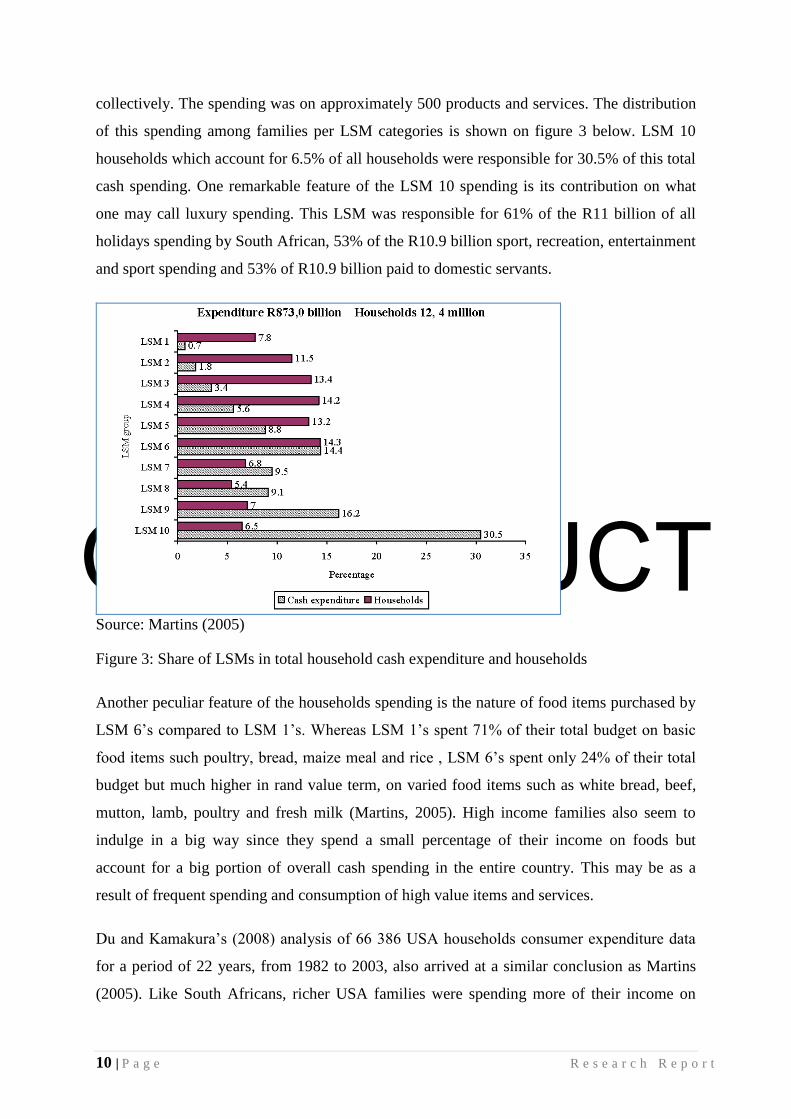
Du and Kamakura‟s (2008) analysis of 66 386 USA households consumer expenditure data
for a period of 22 years, from 1982 to 2003, also arrived at a similar conclusion as Martins
(2005). Like South Africans, richer USA families were spending more of their income on
Copyright UCT
11 | P a g e R e s e a r c h R e p o r t
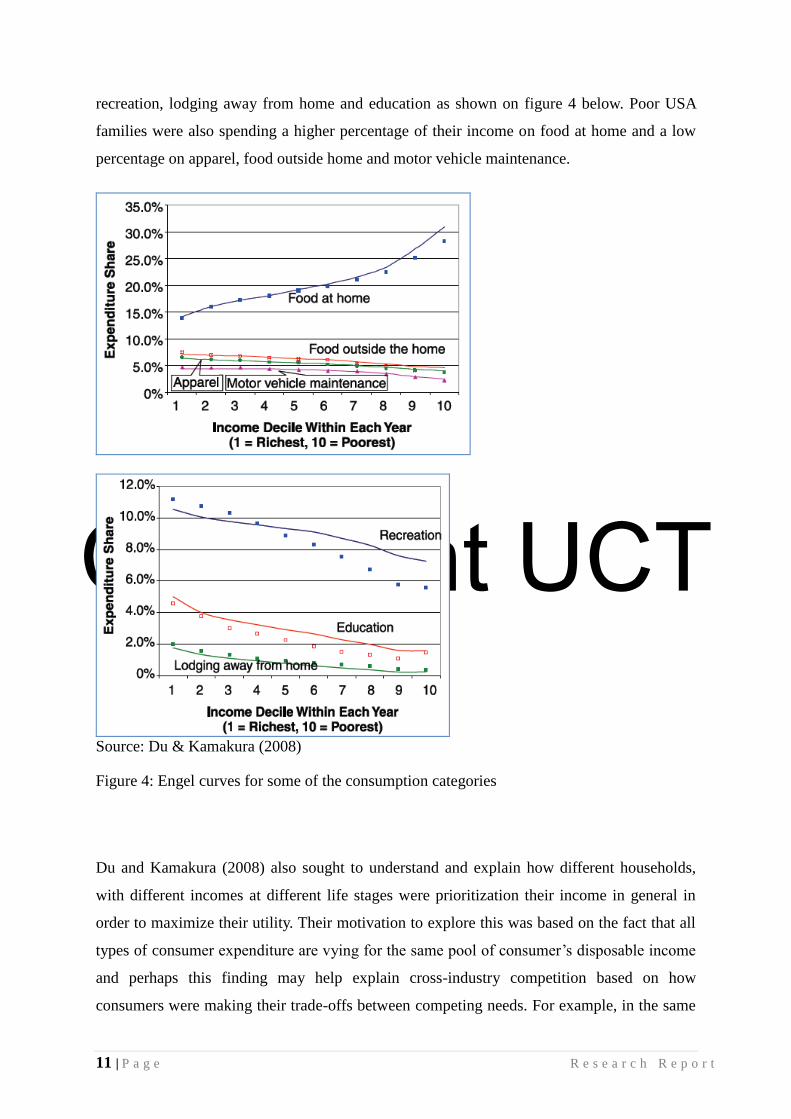
recreation, lodging away from home and education as shown on figure 4 below. Poor USA
families were also spending a higher percentage of their income on food at home and a low
percentage on apparel, food outside home and motor vehicle maintenance.
Source: Du & Kamakura (2008)
Figure 4: Engel curves for some of the consumption categories
Du and Kamakura (2008) also sought to understand and explain how different households,
with different incomes at different life stages were prioritization their income in general in
order to maximize their utility. Their motivation to explore this was based on the fact that all
types of consumer expenditure are vying for the same pool of consumer‟s disposable income
and perhaps this finding may help explain cross-industry competition based on how
consumers were making their trade-offs between competing needs. For example, in the same

Copyright UCT
12 | P a g e R e s e a r c h R e p o r t
study they observed that health spending among families was declining and that this could
have been due to increasing health insurance (medical aid). Using the Structural demand
model which estimates consumer utility, they were able to show that richer families were in
general deriving high utility than their poorer counterparts from prioritizing spending on non-
essential items such as holidays, personal and miscellaneous care services, alcoholic
beverages away from home, food takeaways, jewelries and watches regardless of their life
stage.
2.4 Conclusion
The foregoing discussion clearly suggests that the level of income can influence consumer
behaviour. However, there are times when income is not a good predictor of consumer
behaviour. In those instances social class becomes a better predictor of consumer behaviour.
Where income was found to be better predictor of consumer behaviour, the following were
particularly noted:
The level of household or personal income was found to be able to predict the prevalence of
spending among different income groups. For instance in the USA, the number of people
engaging in snacking habits was found to increase as one moves up the income scale, that is it
was low among low income earners, moderate among middle income earners and high among
high increase earners. In order words there is a positive correlation between the level of
income and the number of consumers within income groups. This is the basis for hypothesis
1, which sought to test if there was a difference in the number of clients using Roots spa
among income groups and if this difference will follow these earlier findings.
Again the findings from the USA households‟ snacking habits research shed some light on
whether the level of income had an influence on spending frequency or not. The finding was
that although there were fewer people engaging in snacking habits in the lower income group,
these people were having snacks at a frequency that was higher than that observed in the
middle and high income groups. Contrary to the snacking prevalence among incomes, the
snacking frequency was found to be inversely related to the level of income. This is the basis
for hypothesis 4, which was used to test whether the level of income was able to explain the
frequency of spa visits among clients of Roots.

Copyright UCT
13 | P a g e R e s e a r c h R e p o r t
Research findings regarding general spending patterns in South Africa, Australia and the
USA also suggest that the level of income can determine where and how consumers spend
their money and how much they spend when they do. In South Africa and the USA, low
income earners were spending a higher percentage of their income on basic items such as
food and accommodation whereas higher income earners were spending a higher percentage
of their income on non-essential items such as holidays and recreation. In addition to this the
South African high income earners were responsible for more than 50% of all these non-
essential spending and yet they accounted for 9% of the entire population of consumers. A
study in Australia also found that there was a positive correlation between the level of income
and the intake of the certain vegetables and income. This means higher income earners were
spending more money than the low income earners on vegetables and fruits. This supports
Hypothesis 2, which was formulated to check if this is the case for the township consumers
by testing if high income earners were spending more money at Roots relative to low income
earners.
There was no evidence from consumer behaviour literature that was found to support
hypothesis 3, except from the industry market research that Roots operates in. This industry
research, which was conducted in the USA, found that it was common for a family, a
company or friends to offer a client an all-expense-paid gift for spa services (Monteson &
Singer, 2002). This unfortunately could not form part of the literature survey as it is
somewhat unrelated to subject matter under consideration however, in the South African
context where the culture is different and family members like husbands are known for take
pride in taking good care of their wives, this kind of practice can be expect to exist.
Hence the questionnaire that was design and used to collect information about the consumers
that was required to test these hypotheses included level; of personal and household income,
number of time the consumer used Roots services, the amount of money spend during every
visit to Roots, and person who was paying for the services used at Roots. This core fields
were supplemented by demographics data such place of residence, age, size of households,
services most used and profession of the respondent among others. Demographic data played
two roles namely filtering who was from the township and who was not and attributes like
profession of respondents was used to verify income. Table 3 below summarizes the
relationship between the literature above and the research questions and questionnaire design.

Copyright UCT
14 | P a g e R e s e a r c h R e p o r t
Table 3: Summary of relationship between theory and research questions and questionaire
Research Question Theory Corresponding variables
(fields in the questionnaire)
1. Is there a difference in
the number of people
visiting the spa (Roots)
between income groups?
Snacking habit was found to
more common among high
income earners but less
common among low income
earner (Bowman, 1997).
2. What is your job title?
4. What is your marital
status?
8. How much do you earn?
a) Alone
b) As a family
10. How many members of
your family are employed
2. Is there a difference in
the amount of money
spend during spa visits
between different income
groups?
High income families were
spending less of their money
on basic items when
compared to low income
families. High income
families were spending more
on education, recreation, and
holidays in comparison (Du
& Kamakura, 2008). In
South Africa they were
responsible for 55% of
spending for these items
(Martins, 2008). In Australia
High income families had a
high income of certain fruits
and vegetables when
compared to their low
income counterparts (Giskes
et al., 2002)
13. How much do you spend
every time you visit the spa?
3. Is there a difference
among income groups as
to who pays for their spa
visits?
Users of spas in the USA
were paying for their services
using one of the following:
own pocket, family, or gift
(Monteson & Singer, 2002)
12. Who pays for your spa
visit?
4. Is there a difference on
the number of spa visits
between income groups?
High snacking frequency
low income earners and low
snacking frequency among
high income earners
(Bowman, 1997)
7. How many times do you
visit the spa in a month??
Copyright UCT
15 | P a g e R e s e a r c h R e p o r t
3 Research methodology
3.1 Research approach and strategy
Approach and strategy
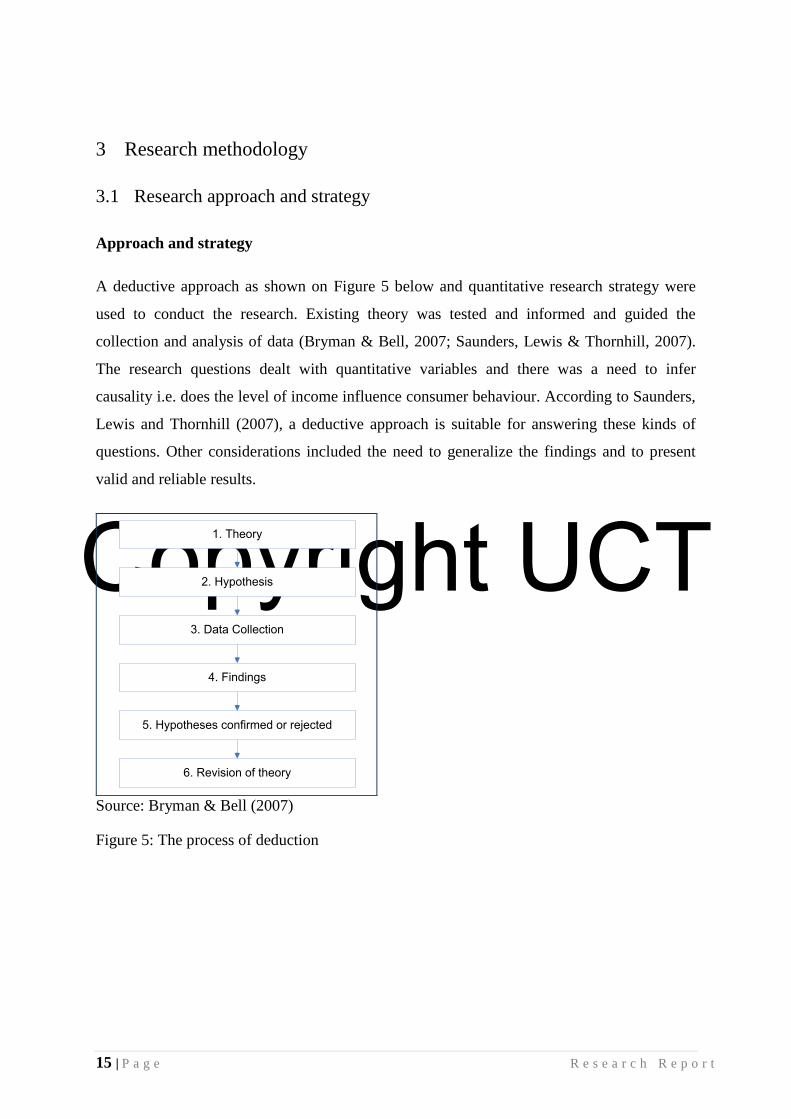
A deductive approach as shown on Figure 5 below and quantitative research strategy were
used to conduct the research. Existing theory was tested and informed and guided the
collection and analysis of data (Bryman & Bell, 2007; Saunders, Lewis & Thornhill, 2007).
The research questions dealt with quantitative variables and there was a need to infer
causality i.e. does the level of income influence consumer behaviour. According to Saunders,
Lewis and Thornhill (2007), a deductive approach is suitable for answering these kinds of
questions. Other considerations included the need to generalize the findings and to present
valid and reliable results.
1. Theory
2. Hypothesis
3. Data Collection
4. Findings
5. Hypotheses confirmed or rejected
6. Revision of theory
Source: Bryman & Bell (2007)
Figure 5: The process of deduction
Copyright UCT
16 | P a g e R e s e a r c h R e p o r t
Epistemological plan
A positivism philosophy was adopted so as to ensure that the research became acceptable
knowledge in the field of research (Bryman & Bell, 2007, Saunders, Lewis & Thornhill,
2007). A „resource‟ researcher‟s method was employed as opposed to a „feeling‟ researcher‟s
method (Saunders, Lewis & Thornhill, 2007)i.e. research questions were developed from
existing theory and observable, quantifiable and measurable data was collected to test this
question. Although the research deals with human behaviour, this research philosophy was
deemed suitable as it looked into the measurable variables (influence) of the behaviour e.g.
level of income, which can be measured by looking at the salary slip.
Ontological plan
The research attempted to determine the influence of one variable, income, on consumer
behaviour and did not consider the simultaneous influence that other variables may have on
the consumer behaviour. During the research consumers may have been shaping their
behaviour based on the influences of other variables other than income. This objectivist
approach allowed the research to take a snapshot of the „then moment‟ but its failure to
recognize the constructionist approach (meaning construction by consumers) meant that the
changing reality may have been miss-captured (Bryman & Bell, 2007). However, research
such as conducted by Du and Kamakura 2008 entitled “Where did all that money go?
Understanding how consumers allocate their consumption budget” (Du & Kamakura, 2008)
and research by Bowman on “Snacking habits of different income groups” (Bowman, 1997)
seem to suggest that the variable, income, exerts a major and a consistent influence relative to
other variables on the consumer behaviour over time. Thus there was no concern about this
seemingly „simplification‟ of the research and the tendency of other variables, outside
observation, to negatively influence the results.

Copyright UCT
17 | P a g e R e s e a r c h R e p o r t
Research design, data collection methods and instruments
A social survey research design was used to collect and analyze data. As there are four
research sub-questions that needed to answered in order to answer the main question. This
method allowed for simultaneous collection of data from respondents (Bryman & Bell, 2007)
and answered these specific questions in their „who‟, „what‟, „how much” and „many‟
formats (Saunders, Lewis & Thornhill, 2007). Data collected using this method made it
possible to perform descriptive and inferential statistical analysis. It also made it easier to
infer causality between variables (Saunders, Lewis & Thornhill, 2007).
A self-completion questionnaire was used to survey respondents (the Questionaire is attached
in Apprenix 2) The self completion method provided benefits such as standardization of
questions, ease of results explanation and comparison and selecting a representative sample,
which ensured generalizability of findings (Saunders, Lewis & Thornhill, 2007). The self
completion questionnaire also made it possible to collect data from participants
simultaneously and it also economical and relatively easier to administer (Bryman & Bell,
2007; Saunders, Lewis & Thornhill, 2007).
The questionnaire consists of three parts namely research background, instructions and the
actual research questions. The purpose of the background was to give respondents a brief
introduction to the research and the instructions was to explain how they should complete the
questionnaire. There were a total of 19 questions in the questionnaire. Although not indicated
on the questionnaire, these questions fall into three broad categories i.e. demographic data,
consumer behaviour (core research questions) and the marketing related questions.
Demographic data collected from respondents included variables and attributes like age,
gender, marital status, profession, family size and area of residence and most of these
questions were in the beginning of the questionnaire. The main purpose for including these
questions was to gather knowledge regarding the type of consumers Roots was serving and to
aid analysis and interpretation of the core research questions. Core research questions
included variables such as respondents‟ household and personal income, the number of times
they used Roots in a month, the amount of money they spend per service at Roots and person
who was paying for the services used at Roots. These questions are directly related to the four
research hypotheses that were tested. Marketing related questions, which formed the last part
Copyright UCT
18 | P a g e R e s e a r c h R e p o r t
of questionnaire, were primarily used to understand Roots‟ marketing channels and the gather
information was also used to aid the analysis of the core research questions.
Data was collected at the Roots‟ two branches in both Diepkloof (Soweto) and Spruitview
between October and November 2009. Respondents at Spruitview completed questionnaires
on their own, whenever they went to use the services at the branch. However, the rate at
which those responses were received was very slow. Data collection at the Soweto branch
started late due to issues of access which was needed to be addressed. The issues of access
prompted the research to change the data collection format from self-completion
questionnaires survey to assisted questionnaire completion. Roots allocated private office
space for this process at their branches, where respondents were helped to complete the
survey. The questionnaire completion process followed this sequence: the researcher
introduced himself, explained the purpose of the research, asked for permission to continue
conducting the survey, asked respondent to provide the information while completing
questionnaire and at the end thanked the respondent for participating. This method allowed
data to be collected at a fast rate.
3.2 Sampling, research setting and participants
The research population comprised of consumers who live in the townships of South Africa
and have disposal income, whether from their own personal income or family (household)
income. Consumers from Roots Health and Wellness Centre (Spa) were surveyed. This
represents a form of convenient sampling as only responses from consumers using this
particular spa were solicited (Bryman & Bell, 2007). According to Bryman and Bell (2007),
there is no guideline for response rate for samples selected using non-random sampling.
Although other authorities recommend that an acceptable response rate is anything above
50% as a low response rate may raise questions regarding the representativity of the sample
(Bryman & Bell, 2007). Therefore no specific response rate was required for this research.
However efforts were made to ensure a high rate so as to improve the generalizability and
credibility of the findings.
The survey was conducted at the two Roots branches, where respondents were asked to take
part in the survey shortly after finishing their using their service, generally included

Copyright UCT
19 | P a g e R e s e a r c h R e p o r t
consultation and/or treatment. Roots braches have generally waiting areas at the reception,
consulting rooms and treatment rooms. The management saw it fit to provide a private survey
room so as to enable people to participate freely. This was necessary in dealing with the
issues regarding disclosure of personal and confidential information like income. This
arrangement also made it possible to get as many responses as possible from respondents who
were referred to the survey room immediately after completing their consultation and/or
treatment. Without a referral system it could have been difficult to get people to participate in
the survey.
A total of 80 clients participated in the survey. These participants were never selected but
took part as they happened to be using Roots services during the time of the survey. Clients
who were not willing to participate in surveyed, after all efforts were made to convince them
to, were allowed to leave immediately. Participants included women and middle age adults
and these were from the two townships. There were few people who were from places outside
the two townships; some were coming from as far as Lesotho and New Castle in Kwazulu-
Natal and some from other townships in Gauteng
3.3 Research criteria
Reliability, according to Bryman and Bell (2007) deals with whether the research is
repeatable or not, and whether the measurement is consistent and stable over time. The
research design followed as described above makes it possible to reproduce the research. The
use of a standardized questionnaire, with fewer open-ended questions where possible ensured
consistency and stability of the measure. Other measures that were taken to improve stability
and consistency are the use of non-ambiguous or quantifiable measures such as income scale,
age, gender, etc. Opinions from experts and peers regarding whether the measure really
measured the concept were solicited to ensure measurement validity. Bryman and Bell (2007)
refers to this approach as face validity. Internal validity was also ensured by using proven and
tested statistical analytical methods to test for relationships. Since the sample is not a random
one but a convenient sample, a high response rate was solicited. According to Bryman and
Bell (2007), a larger sample reduces both sampling error and sampling-related error thereby
increasing the accuracy and the generalizability of the findings. By default, the research deals
Copyright UCT
20 | P a g e R e s e a r c h R e p o r t
with practical issues of everyday issues regarding consumption and how people choose to
consume depending on their wealth. Hence its ecological validity is automatically ensured.
3.4 Data analysis methods
A combination of descriptive and inferential statistics was used to analyze the collected data.
Descriptive statistics was used to summarize and explain the surveyed sample demographic
data whereas inferential statistical analysis was used to answer research questions by
searching for relationships between variables (Saunders, Lewis & Thornhill, 2007). The Chi-
Squared of association method was used to determine relationships between different
variables and draw conclusions. According to Bryman and Bell (2007), this method is
suitable for determining patterns of association between two variables. Apart from being
flexible, the method also allows for a test of statistical significance to be performed on the
results. This was necessary for generalization of the findings beyond the surveyed sample to
the general population.
MS Excel was used to summarize and process collected data. Contingency tables were
created by means of the pivot table. These tables were both used for graphical representation
of demographic and marketing findings and for testing the hypotheses using the Chi-Squared
of association method. Contingency tables were first examined to check if they met
conditions for performing a Chi-Squared test. Thereafter Chi-values were manually
calculated in Excel following the steps and formulae below, from Utts and Heckard (2007):
Step 1: Calculate the expected values of each cell on the table
Step 2: Calculate the Chi-value for each cell

Copyright UCT
21 | P a g e R e s e a r c h R e p o r t
Step 3: Calculate the Chi value for the entire table
Table Chi values were then use to calculate p-values, which were used to determine if a
relationship between the row and column variable existed or no. The MS Excel function
below was used to calculate the p-values:
Where the degrees of freedom were determined using the formulae below:
For a 1 row by n columns
For n rows x n columns
P-values results were interpreted as follows:
A p-value of less than 0.05 meant that the null hypothesis should be rejected and the
alternative hypothesis should be accepted. This means that there a relationship exist between
the two variables represented on contingency table.
A pP-value of greater than 0.05 meant that the null hypothesis should be accepted and the
alternative hypothesis should be rejected. This means that no relationship exists between the
two variables represented on contingency table.
Copyright UCT
22 | P a g e R e s e a r c h R e p o r t
4 Research findings and analysis
4.1 Surveyed sample information
4.1.1 Research response rate and respondents‟ area of residence
80 responses were obtained from the 200 survey questionnaires placed to two Roots branches
located at Spruitview in the East Rand and Diepkloof in Soweto. This represents a response
rate of 40%. However only 69 (35%) responses were usable and 11 were not due to
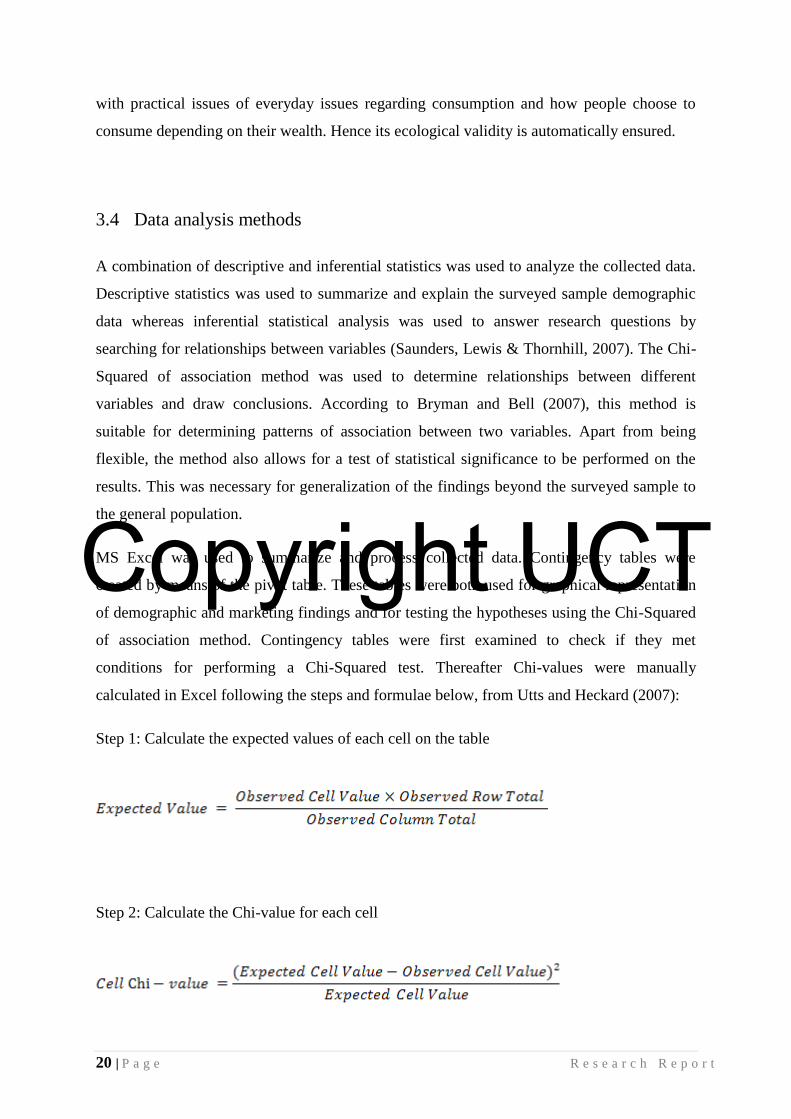
incompleteness. As shown on Figure 6 below, 64% of the respondents are current or previous
residents of the two townships, 22% are from other townships and 14% come from areas
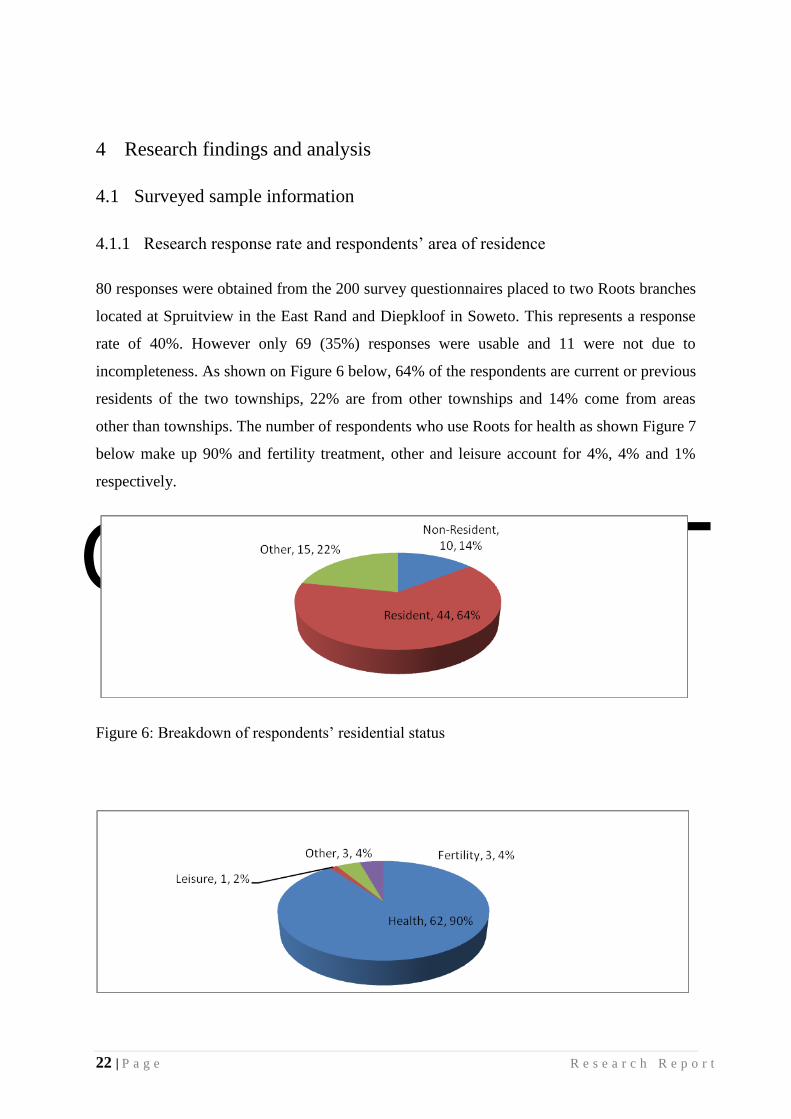
other than townships. The number of respondents who use Roots for health as shown Figure 7
below make up 90% and fertility treatment, other and leisure account for 4%, 4% and 1%
respectively.
Figure 6: Breakdown of respondents‟ residential status
Copyright UCT
23 | P a g e R e s e a r c h R e p o r t
Figure 7: Main use of the wellness centre
4.1.2 Respondents‟ age and gender distribution
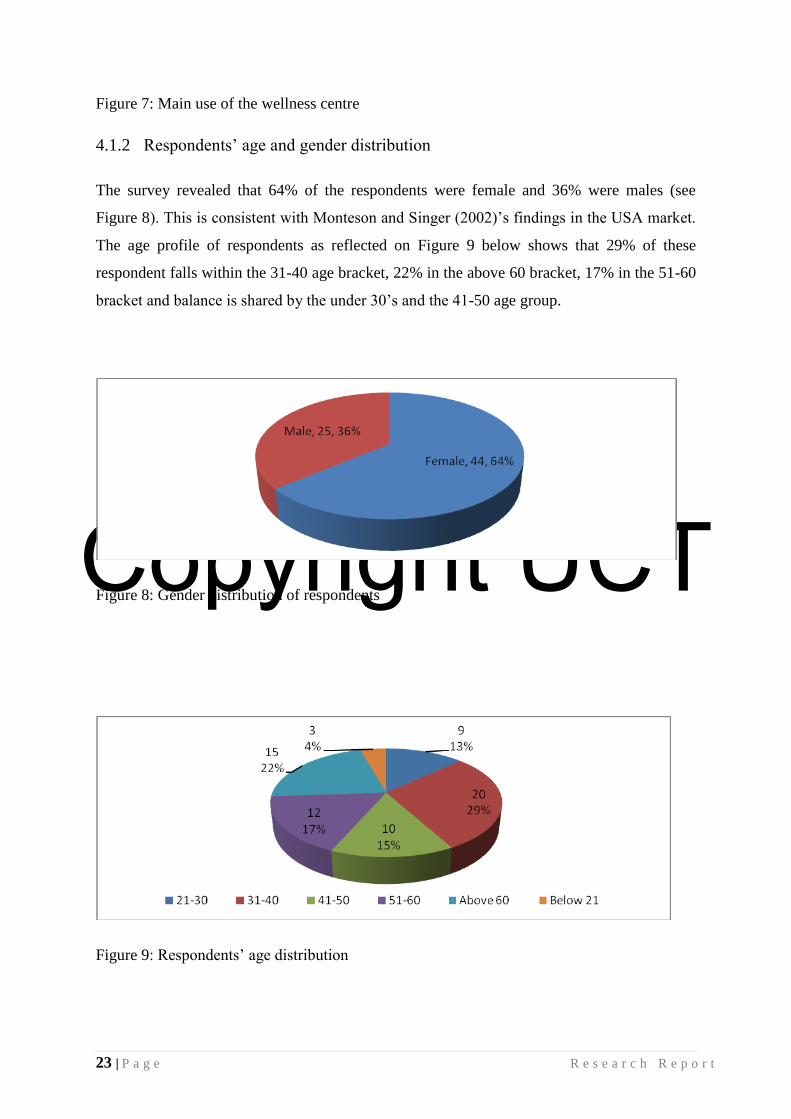
The survey revealed that 64% of the respondents were female and 36% were males (see
Figure 8). This is consistent with Monteson and Singer (2002)‟s findings in the USA market.
The age profile of respondents as reflected on Figure 9 below shows that 29% of these
respondent falls within the 31-40 age bracket, 22% in the above 60 bracket, 17% in the 51-60
bracket and balance is shared by the under 30‟s and the 41-50 age group.
Figure 8: Gender distribution of respondents
Figure 9: Respondents‟ age distribution
Copyright UCT
24 | P a g e R e s e a r c h R e p o r t
4.1.3 Respondents‟ personal and household income distribution
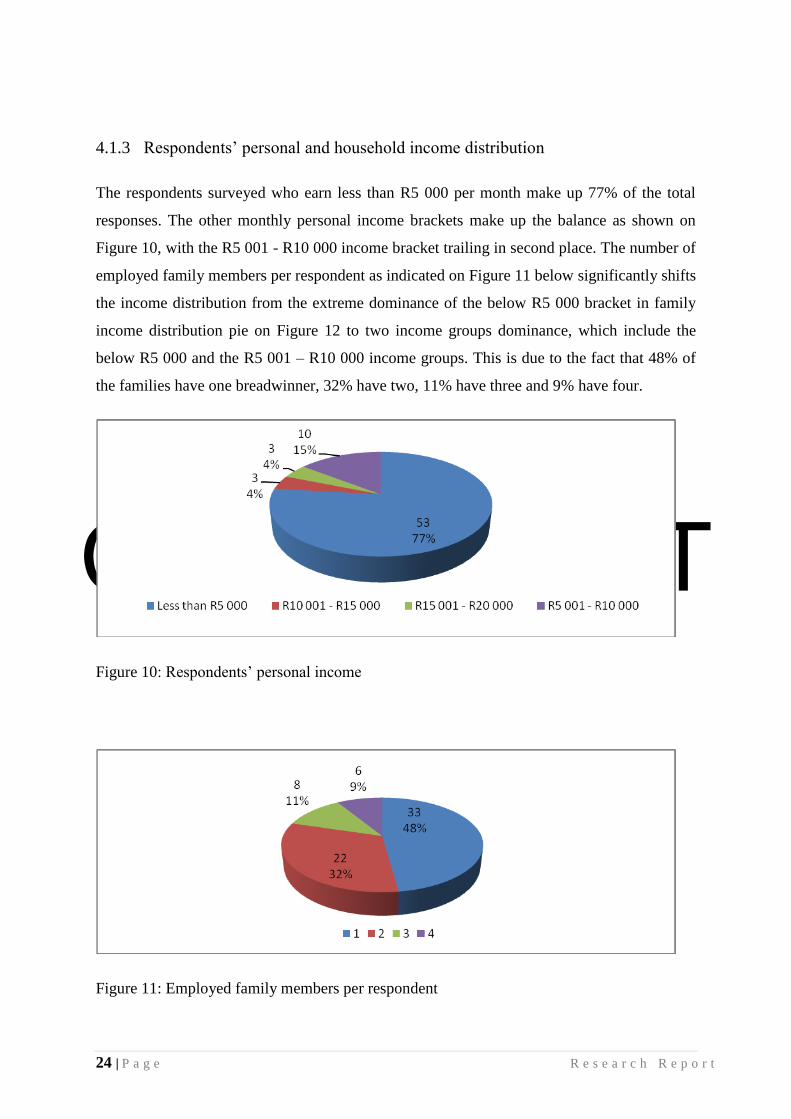
The respondents surveyed who earn less than R5 000 per month make up 77% of the total
responses. The other monthly personal income brackets make up the balance as shown on
Figure 10, with the R5 001 - R10 000 income bracket trailing in second place. The number of
employed family members per respondent as indicated on Figure 11 below significantly shifts
the income distribution from the extreme dominance of the below R5 000 bracket in family
income distribution pie on Figure 12 to two income groups dominance, which include the
below R5 000 and the R5 001 – R10 000 income groups. This is due to the fact that 48% of
the families have one breadwinner, 32% have two, 11% have three and 9% have four.
Figure 10: Respondents‟ personal income
Figure 11: Employed family members per respondent
Copyright UCT
25 | P a g e R e s e a r c h R e p o r t
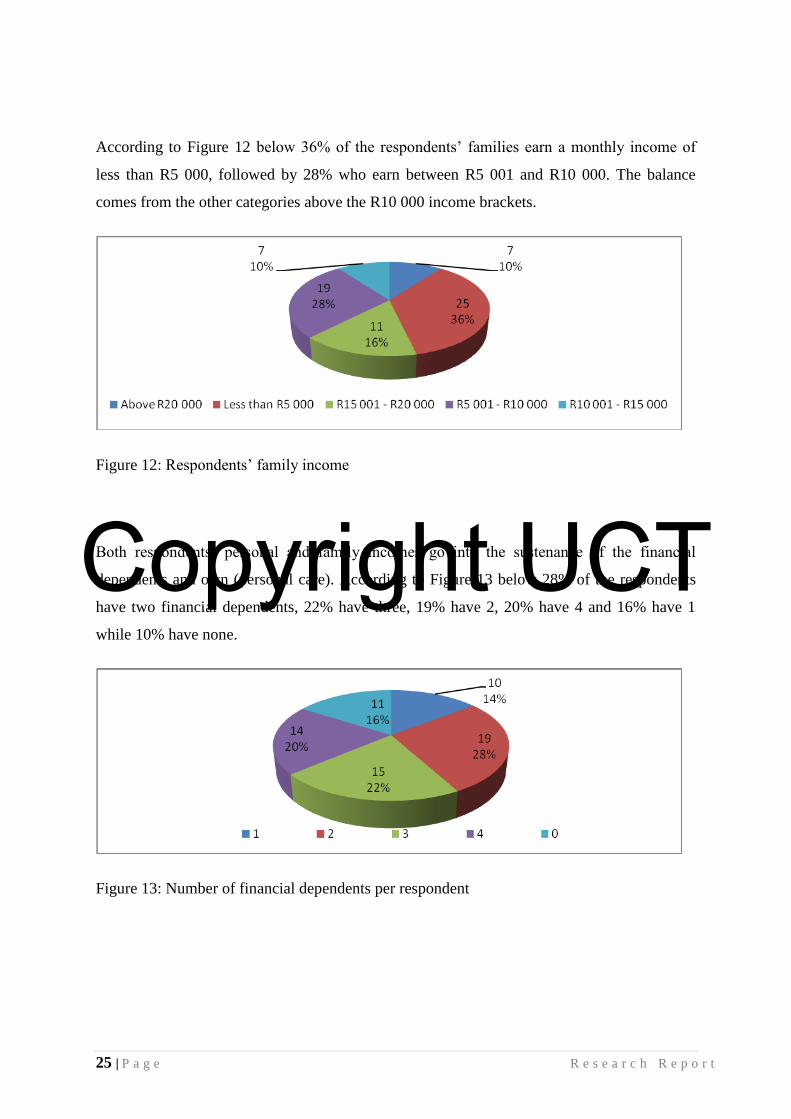
According to Figure 12 below 36% of the respondents‟ families earn a monthly income of
less than R5 000, followed by 28% who earn between R5 001 and R10 000. The balance
comes from the other categories above the R10 000 income brackets.
Figure 12: Respondents‟ family income
Both respondents‟ personal and family incomes go into the sustenance of the financial
dependents and own (personal care). According to Figure 13 below 28% of the respondents
have two financial dependents, 22% have three, 19% have 2, 20% have 4 and 16% have 1
while 10% have none.
Figure 13: Number of financial dependents per respondent
Copyright UCT
26 | P a g e R e s e a r c h R e p o r t
4.1.4 Marketing medium that introduced respondents to Roots
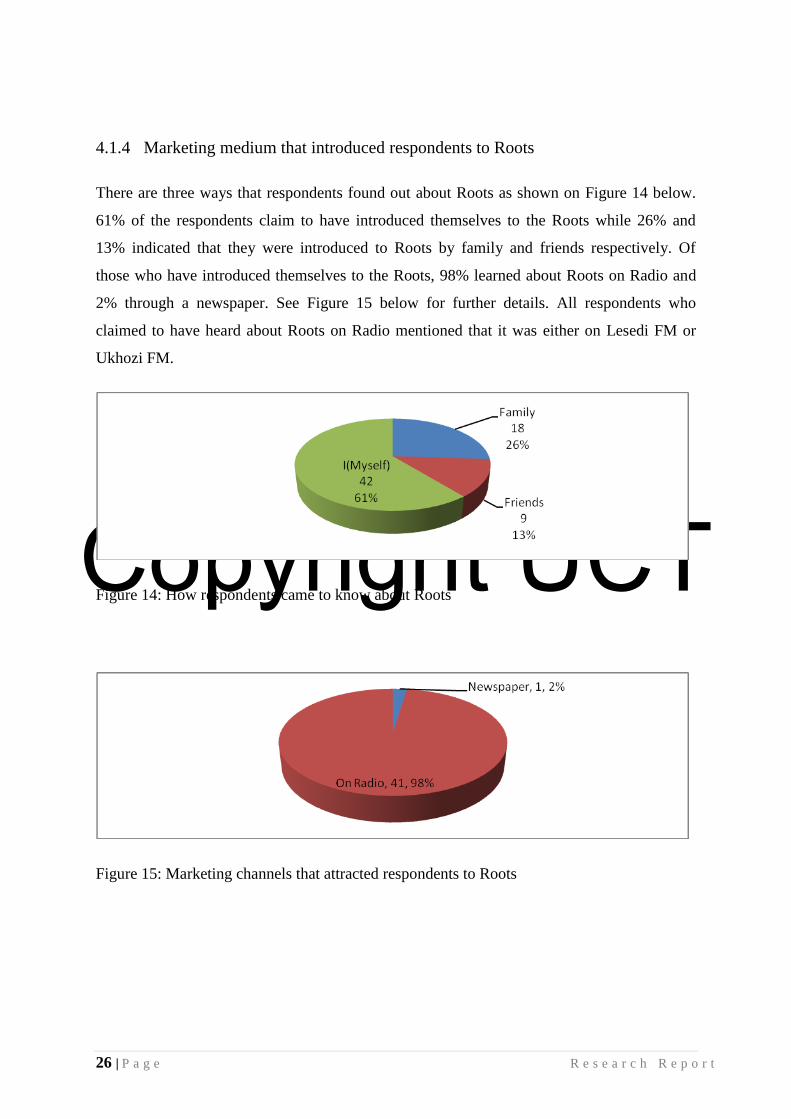
There are three ways that respondents found out about Roots as shown on Figure 14 below.
61% of the respondents claim to have introduced themselves to the Roots while 26% and
13% indicated that they were introduced to Roots by family and friends respectively. Of
those who have introduced themselves to the Roots, 98% learned about Roots on Radio and
2% through a newspaper. See Figure 15 below for further details. All respondents who
claimed to have heard about Roots on Radio mentioned that it was either on Lesedi FM or
Ukhozi FM.
Figure 14: How respondents came to know about Roots
Figure 15: Marketing channels that attracted respondents to Roots
Copyright UCT
27 | P a g e R e s e a r c h R e p o r t
4.1.5 Person responsible for paying respondents‟ bill at Roots
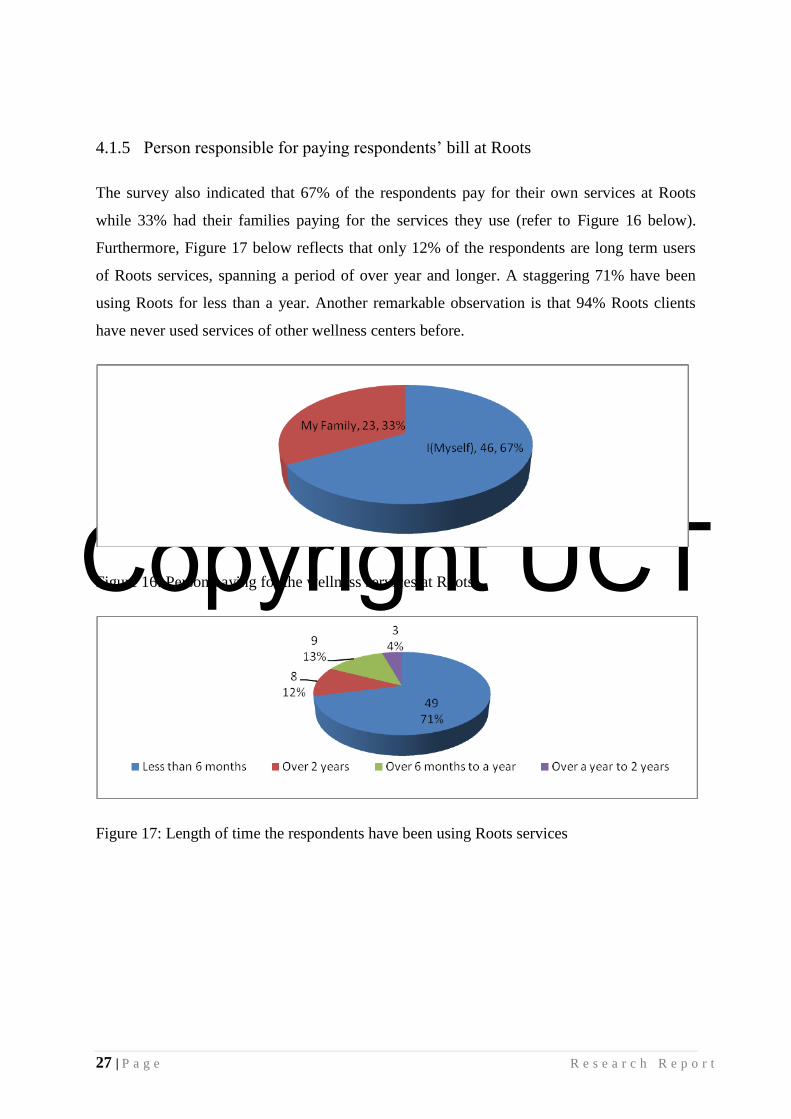
The survey also indicated that 67% of the respondents pay for their own services at Roots
while 33% had their families paying for the services they use (refer to Figure 16 below).
Furthermore, Figure 17 below reflects that only 12% of the respondents are long term users
of Roots services, spanning a period of over year and longer. A staggering 71% have been
using Roots for less than a year. Another remarkable observation is that 94% Roots clients
have never used services of other wellness centers before.
Figure 16: Person paying for the wellness services at Roots
Figure 17: Length of time the respondents have been using Roots services
Copyright UCT
28 | P a g e R e s e a r c h R e p o r t
4.2 Analysis
The research questions in section 3 above were answered by performing the Chi-Squared test
of a relationship between two variables method. Chi-values and p-values were calculated to
determine if the result were of statistically significance or not, using the formulae described
under section 3.4 above (data analysis methods). Each research question was analyzed as a
separate section. The research questions were applied to both personal and family income
categories.
4.2.1 Number of clients using Roots among different income groups
Research Question 1
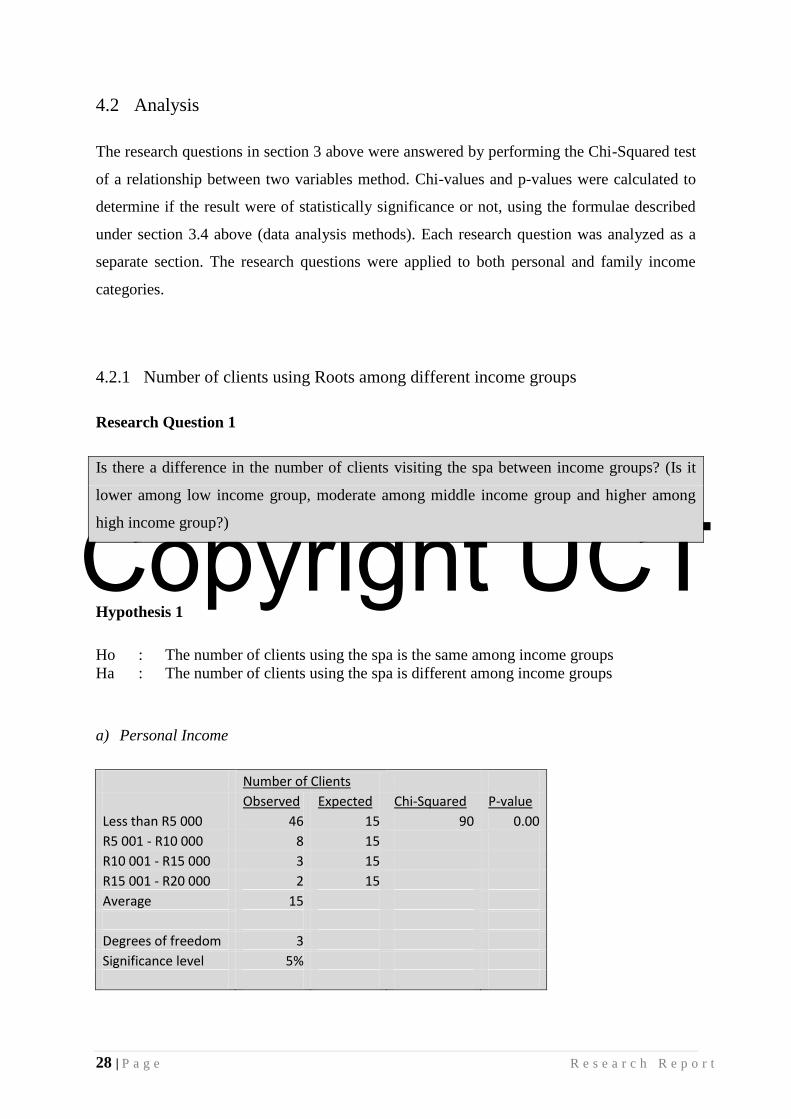
Is there a difference in the number of clients visiting the spa between income groups? (Is it
lower among low income group, moderate among middle income group and higher among
high income group?)
Hypothesis 1
Ho : The number of clients using the spa is the same among income groups
Ha : The number of clients using the spa is different among income groups
a) Personal Income
Number of Clients
Observed Expected Chi-Squared P-value Less than R5 000 46 15 90 0.00 R5 001 - R10 000 8 15 R10 001 - R15 000 3 15 R15 001 - R20 000 2 15
Average 15 Degrees of freedom 3 Significance level 5%
Copyright UCT
29 | P a g e R e s e a r c h R e p o r t
Since the p-value is less than 0.05, the null hypothesis was rejected and the alternative
hypothesis was accepted. This means that the number of clients using the spa is significantly
different among income groups. The number of clients using the spa was found to be high
among low income earners and decrease drastically as one move up the income scale.
b) Family Income
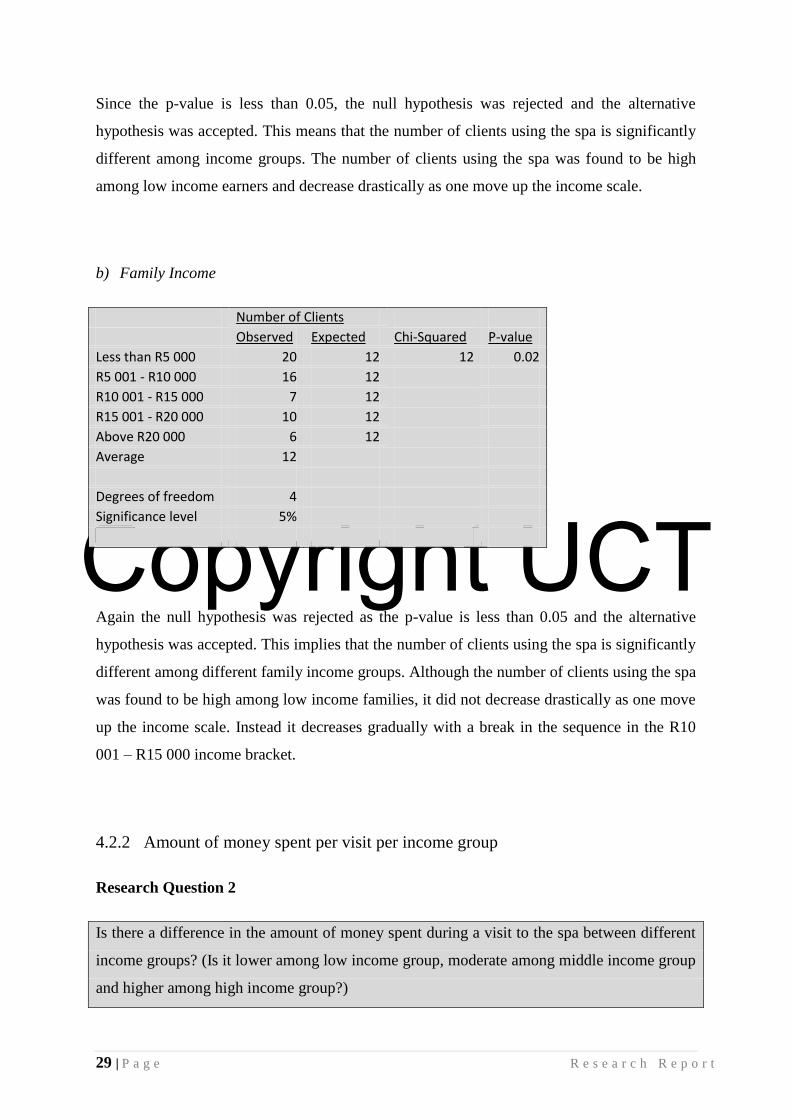
Number of Clients Observed Expected Chi-Squared P-value Less than R5 000 20 12 12 0.02 R5 001 - R10 000 16 12 R10 001 - R15 000 7 12 R15 001 - R20 000 10 12 Above R20 000 6 12 Average 12
Degrees of freedom 4 Significance level 5%
Again the null hypothesis was rejected as the p-value is less than 0.05 and the alternative
hypothesis was accepted. This implies that the number of clients using the spa is significantly
different among different family income groups. Although the number of clients using the spa
was found to be high among low income families, it did not decrease drastically as one move
up the income scale. Instead it decreases gradually with a break in the sequence in the R10
001 – R15 000 income bracket.
4.2.2 Amount of money spent per visit per income group
Research Question 2
Is there a difference in the amount of money spent during a visit to the spa between different
income groups? (Is it lower among low income group, moderate among middle income group
and higher among high income group?)
Copyright UCT
30 | P a g e R e s e a r c h R e p o r t
Hypothesis 2
Ho : The amount of money spent during a spa visit is similar among income groups
Ha : The amount of money spent during a spa visit differs among income groups
a) Personal Income
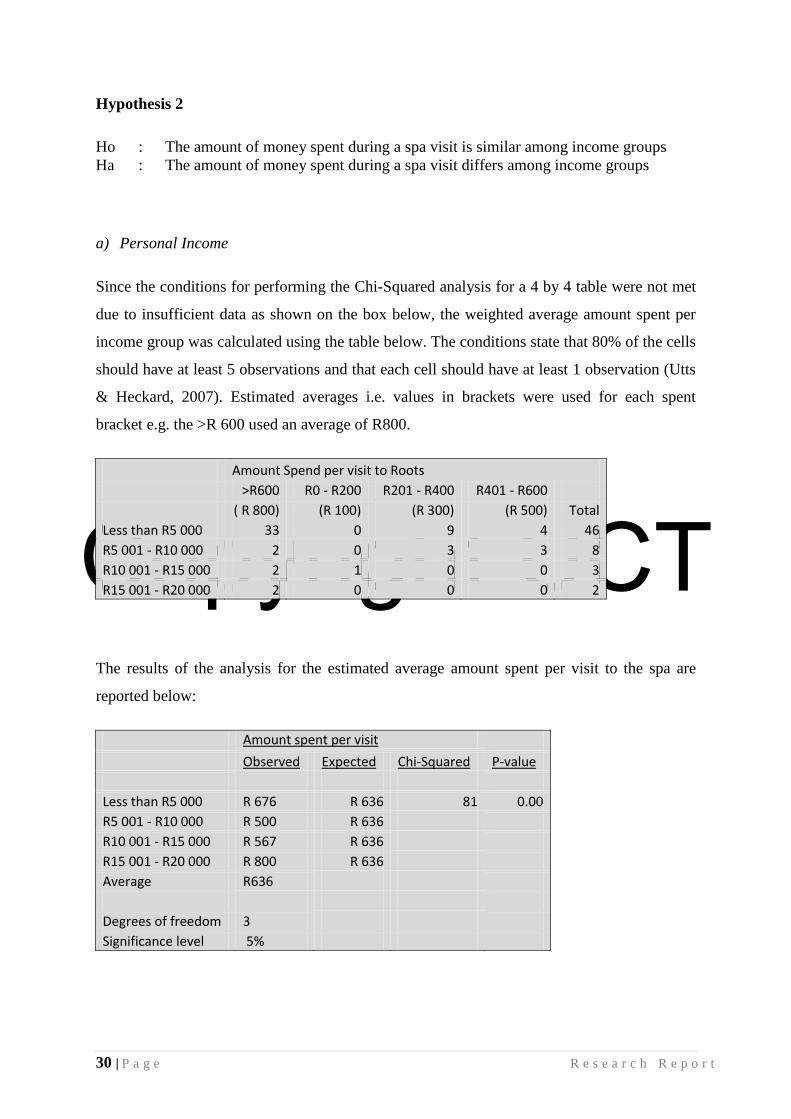
Since the conditions for performing the Chi-Squared analysis for a 4 by 4 table were not met
due to insufficient data as shown on the box below, the weighted average amount spent per
income group was calculated using the table below. The conditions state that 80% of the cells
should have at least 5 observations and that each cell should have at least 1 observation (Utts
& Heckard, 2007). Estimated averages i.e. values in brackets were used for each spent
bracket e.g. the >R 600 used an average of R800.
Amount Spend per visit to Roots >R600 R0 - R200 R201 - R400 R401 - R600
( R 800) (R 100) (R 300) (R 500) Total Less than R5 000 33 0 9 4 46 R5 001 - R10 000 2 0 3 3 8 R10 001 - R15 000 2 1 0 0 3 R15 001 - R20 000 2 0 0 0 2
The results of the analysis for the estimated average amount spent per visit to the spa are
reported below:
Amount spent per visit
Observed Expected Chi-Squared P-value Less than R5 000 R 676 R 636 81 0.00 R5 001 - R10 000 R 500 R 636 R10 001 - R15 000 R 567 R 636 R15 001 - R20 000 R 800 R 636 Average R636
Degrees of freedom 3 Significance level 5%
Copyright UCT
31 | P a g e R e s e a r c h R e p o r t
Since the p-value is less than 0.05, the null hypothesis was rejected and the alternative
hypothesis was accepted. This means that the average amount of money spent during a spa
visit is significantly different among income groups. However there is no clear direction on
the relationship between income brackets and amount spend as the observed spending in the
lowest income bracket is high than the next two high income brackets. But the direction is
clear when the low income bracket excluded. In that case one can conclude that the amount
of money spend per visit to the spa is low among low income groups and high among the
high income brackets.
b) Family income
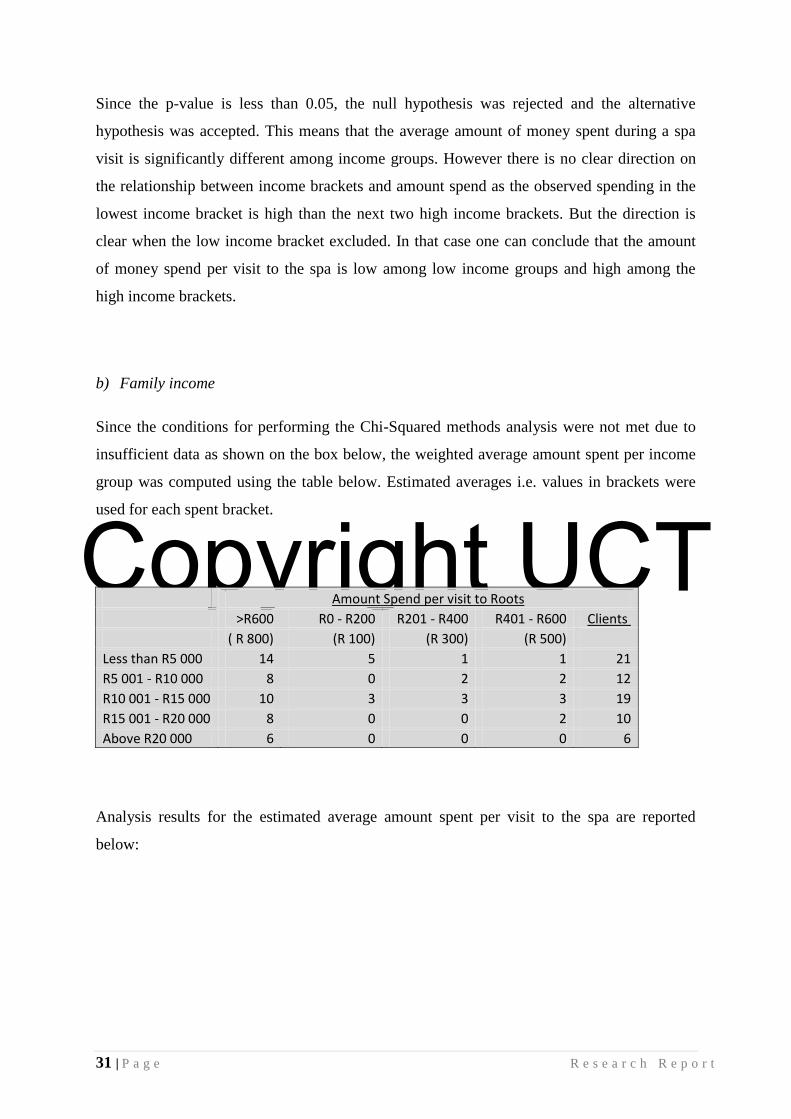
Since the conditions for performing the Chi-Squared methods analysis were not met due to
insufficient data as shown on the box below, the weighted average amount spent per income
group was computed using the table below. Estimated averages i.e. values in brackets were
used for each spent bracket.
Amount Spend per visit to Roots >R600 R0 - R200 R201 - R400 R401 - R600 Clients ( R 800) (R 100) (R 300) (R 500)
Less than R5 000 14 5 1 1 21 R5 001 - R10 000 8 0 2 2 12
R10 001 - R15 000 10 3 3 3 19 R15 001 - R20 000 8 0 0 2 10 Above R20 000 6 0 0 0 6
Analysis results for the estimated average amount spent per visit to the spa are reported
below:
Copyright UCT
32 | P a g e R e s e a r c h R e p o r t
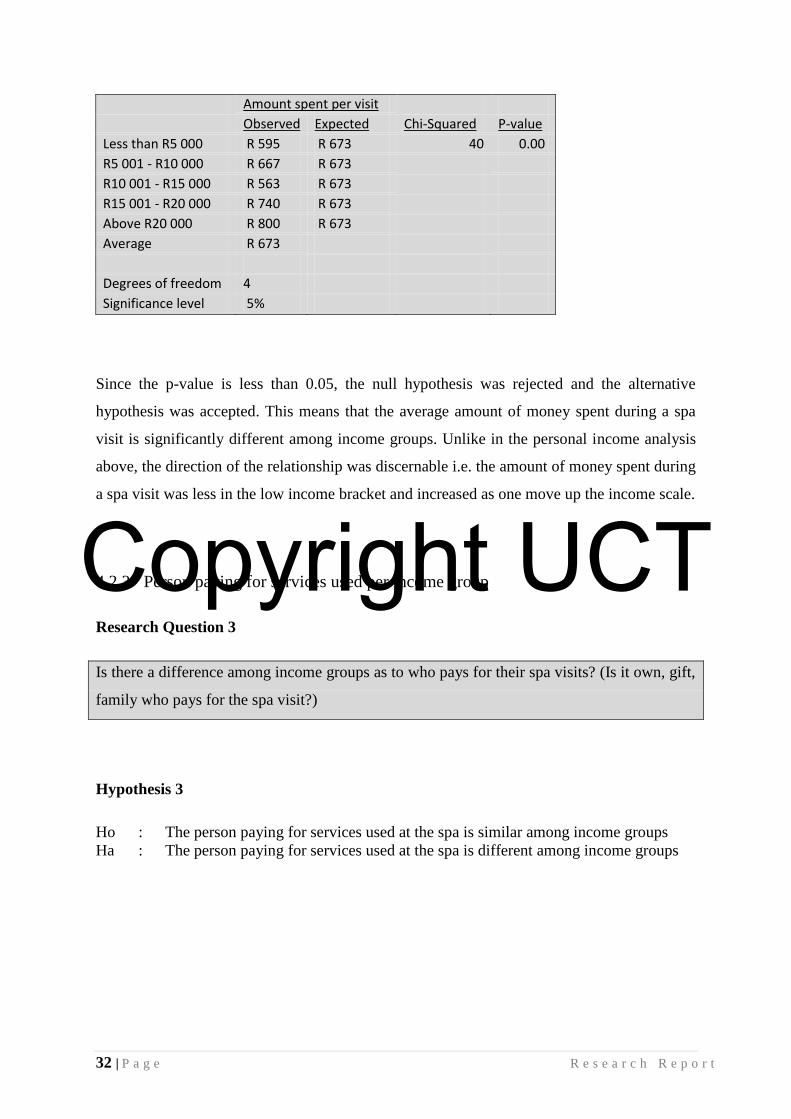
Amount spent per visit Observed Expected Chi-Squared P-value Less than R5 000 R 595 R 673 40 0.00 R5 001 - R10 000 R 667 R 673 R10 001 - R15 000 R 563 R 673 R15 001 - R20 000 R 740 R 673 Above R20 000 R 800 R 673 Average R 673 Degrees of freedom 4 Significance level 5%
Since the p-value is less than 0.05, the null hypothesis was rejected and the alternative
hypothesis was accepted. This means that the average amount of money spent during a spa
visit is significantly different among income groups. Unlike in the personal income analysis
above, the direction of the relationship was discernable i.e. the amount of money spent during
a spa visit was less in the low income bracket and increased as one move up the income scale.
4.2.3 Person paying for services used per income group
Research Question 3
Is there a difference among income groups as to who pays for their spa visits? (Is it own, gift,
family who pays for the spa visit?)
Hypothesis 3
Ho : The person paying for services used at the spa is similar among income groups
Ha : The person paying for services used at the spa is different among income groups
Copyright UCT
33 | P a g e R e s e a r c h R e p o r t
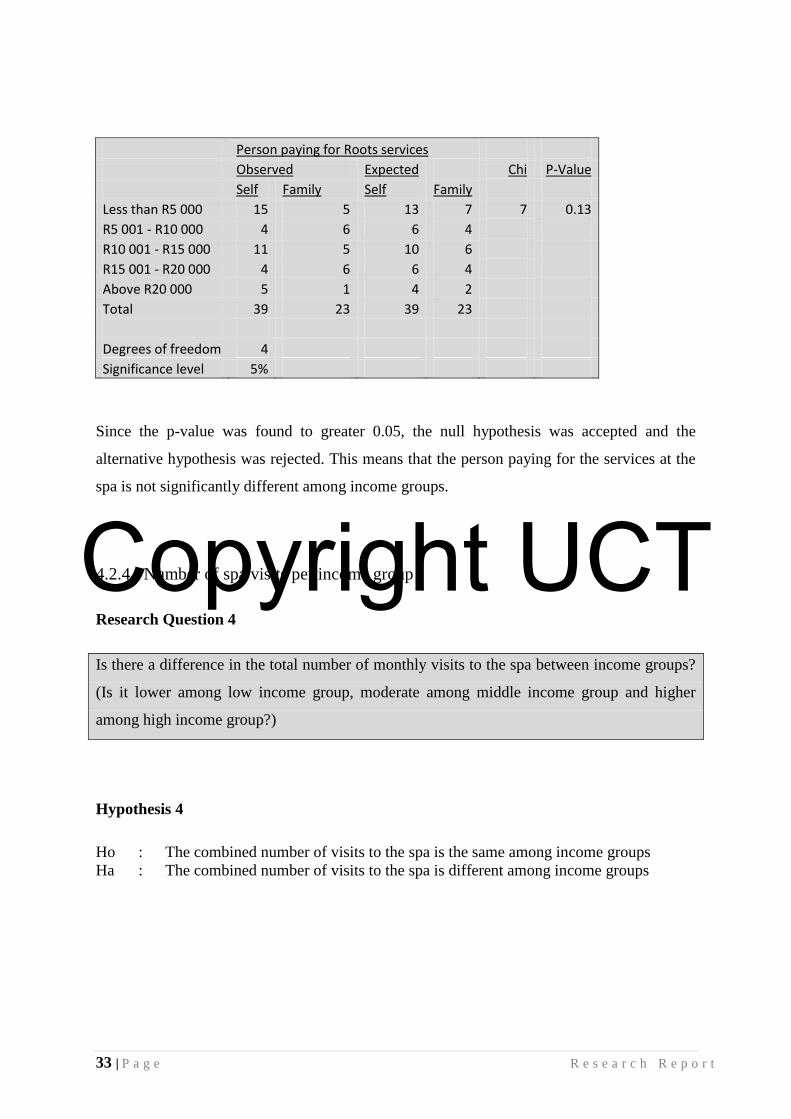
Person paying for Roots services
Observed Expected Chi P-Value Self Family Self Family
Less than R5 000 15 5 13 7 7 0.13 R5 001 - R10 000 4 6 6 4 R10 001 - R15 000 11 5 10 6 R15 001 - R20 000 4 6 6 4 Above R20 000 5 1 4 2
Total 39 23 39 23 Degrees of freedom 4 Significance level 5%
Since the p-value was found to greater 0.05, the null hypothesis was accepted and the
alternative hypothesis was rejected. This means that the person paying for the services at the
spa is not significantly different among income groups.
4.2.4 Number of spa visits per income group
Research Question 4
Is there a difference in the total number of monthly visits to the spa between income groups?
(Is it lower among low income group, moderate among middle income group and higher
among high income group?)
Hypothesis 4
Ho : The combined number of visits to the spa is the same among income groups
Ha : The combined number of visits to the spa is different among income groups
Copyright UCT
34 | P a g e R e s e a r c h R e p o r t
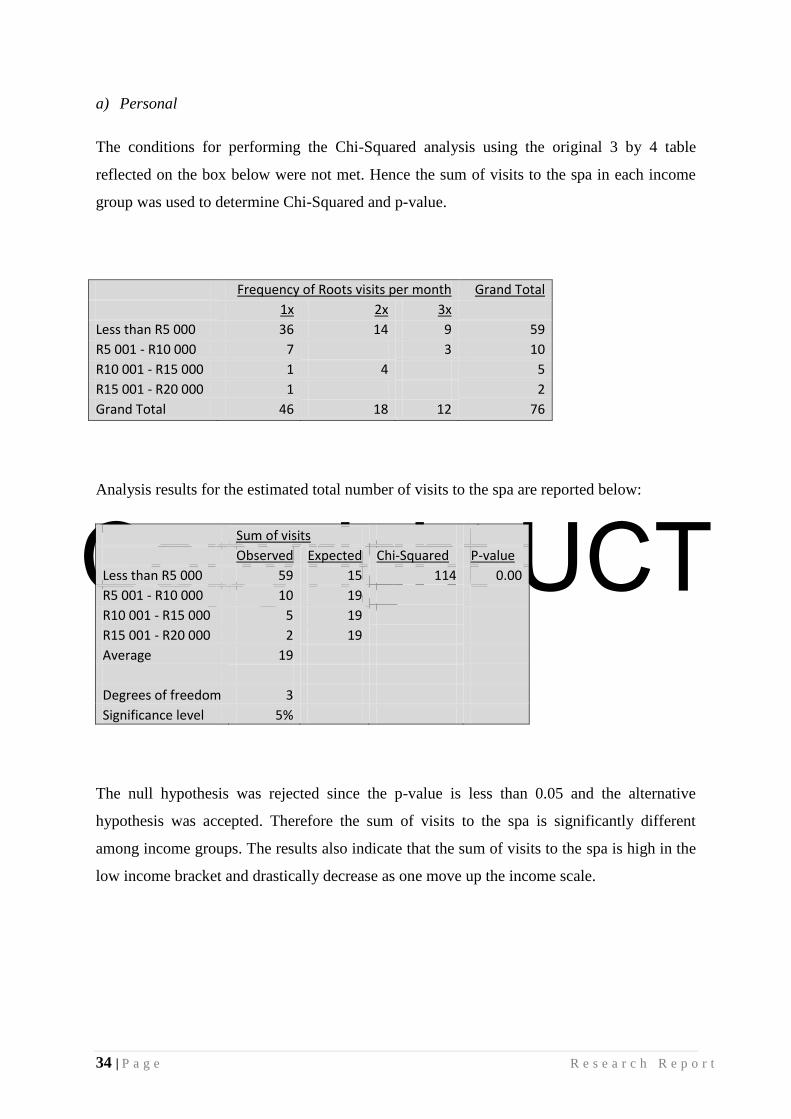
a) Personal
The conditions for performing the Chi-Squared analysis using the original 3 by 4 table
reflected on the box below were not met. Hence the sum of visits to the spa in each income
group was used to determine Chi-Squared and p-value.
Frequency of Roots visits per month Grand Total
1x 2x 3x Less than R5 000 36 14 9 59 R5 001 - R10 000 7 3 10 R10 001 - R15 000 1 4 5 R15 001 - R20 000 1 2 Grand Total 46 18 12 76
Analysis results for the estimated total number of visits to the spa are reported below:
Sum of visits
Observed Expected Chi-Squared P-value Less than R5 000 59 15 114 0.00 R5 001 - R10 000 10 19 R10 001 - R15 000 5 19 R15 001 - R20 000 2 19 Average 19 Degrees of freedom 3
Significance level 5%
The null hypothesis was rejected since the p-value is less than 0.05 and the alternative
hypothesis was accepted. Therefore the sum of visits to the spa is significantly different
among income groups. The results also indicate that the sum of visits to the spa is high in the
low income bracket and drastically decrease as one move up the income scale.
Copyright UCT
35 | P a g e R e s e a r c h R e p o r t
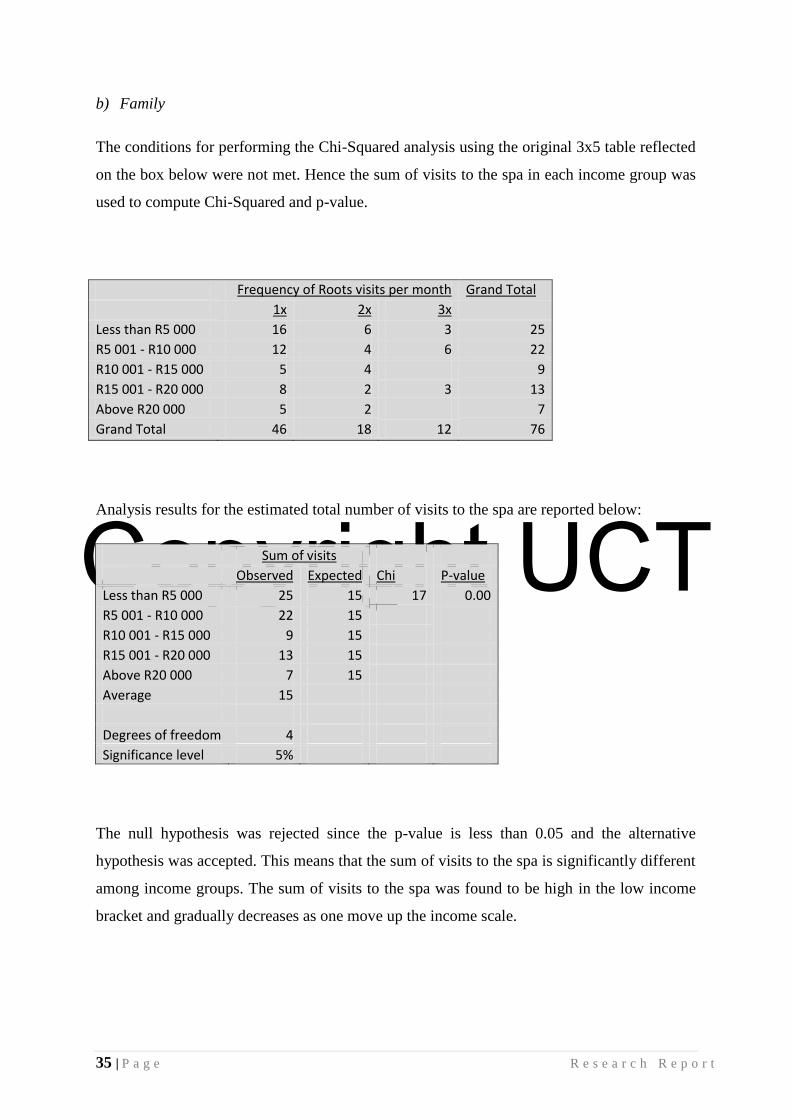
b) Family
The conditions for performing the Chi-Squared analysis using the original 3x5 table reflected
on the box below were not met. Hence the sum of visits to the spa in each income group was
used to compute Chi-Squared and p-value.
Frequency of Roots visits per month Grand Total
1x 2x 3x Less than R5 000 16 6 3 25 R5 001 - R10 000 12 4 6 22 R10 001 - R15 000 5 4 9 R15 001 - R20 000 8 2 3 13 Above R20 000 5 2 7 Grand Total 46 18 12 76
Analysis results for the estimated total number of visits to the spa are reported below:
Sum of visits
Observed Expected Chi P-value Less than R5 000 25 15 17 0.00 R5 001 - R10 000 22 15 R10 001 - R15 000 9 15 R15 001 - R20 000 13 15 Above R20 000 7 15
Average 15
Degrees of freedom 4 Significance level 5%
The null hypothesis was rejected since the p-value is less than 0.05 and the alternative
hypothesis was accepted. This means that the sum of visits to the spa is significantly different
among income groups. The sum of visits to the spa was found to be high in the low income
bracket and gradually decreases as one move up the income scale.

Copyright UCT
36 | P a g e R e s e a r c h R e p o r t
5 Discussion
The number of clients visiting the spa was found to be significantly different among income
groups, both at a personal level (with P < 0.00) and at a family level (with P=0.02). Generally
the number of clients decreased with an increase in the level of income. The decrease was
faster in the personal income category starting from 46 (lower income group) falling to 8, 2
and 2 (higher income group) but it was gradual in the family income category starting at 20
(lower income group) going down to 16, 7, 10, and 6 (higher income group). This is in
contrast with Bowman (1997) and Giskes et al (2002)‟s findings which suggest that the
consumption of certain food items increased with an increase in income level. The finding
also disproves Gundgaard (2006)‟s results which advocate that the use of health services in
Denmark‟s Funen County was generally equitable among income groups. The difference in
the outcomes of the study could be due to societal differences between South African
townships and residential areas Denmark, Australia and USA when the earlier studies were
conducted.
The amount of money spent per visit to the spa was also found to be significantly different
among income groups, both in the personal income category (with P<0.00) and family
income category (with P<0.00). The amount of money spent per visit t the spas seem to
generally increase in both income categories from the lower income to the higher income
groups, even though it starts slightly higher, then dips in the subsequent income group before
picking up in the medium to higher income groups. This is in line with Martins (2005) and
Du & Kamakura (2008)‟s findings, who in their analysis of households spending allocation in
both South Africa and the USA respectively, found that richer families were generally
spending more money on everything including services than their poorer counterparts who
spend a higher percentage of their money on basic needs such as food and transport.
The person paying for services at the spa was found not to be significantly different among
family income groups (with P=0.13). It was also found that the paying “person” was split
between family and own. According Monteson and Singer (2002), the person paying should
have been split between family, gift and own. Perhaps differences in cultural practices
between the American and the South Africa societies may be help explain this inconsistency
in the findings.
Copyright UCT
37 | P a g e R e s e a r c h R e p o r t
The total number of client monthly visits to the spa was found to be significantly different
among income groups, both in the personal income category (with P<0.00) and the family
income category (with a P<0.00). These client visits seem to decrease with the increase in the
level of both personal and family income. Just like in the case of number of visitors, the
decrease was faster in the personal income category falling from 59 (lower income group) to
10, 5 and 2 (higher income group) but gradual in the family income category starting at 25
(lower income group) going down to 22, 9, 13 and 7 (higher income group). Bowman (1997)
had a similar finding regarding the snacking frequency of consumers in the United States of
America, where consumers from poorer families were snacking more frequently than their
counterparts from richer families. He associated this behaviour of poor families to the
inability to afford a proper and a filling or adequate meal, which is generally not the case with
richer families. It could also be that clients from poor families using the spa also faces similar
financial constraints and would therefore come frequently as they cannot afford to spend high
amount of money for a single compressive service that address all their needs every time they
visit the spa.
6 Research limitations
The following research limitations were identified based on the type of business, population
sample and other unique business operations:
The nature and industry of Roots business, which is health and wellness services, may
render it a challenge to directly generalize the results to other businesses operating in
other industries. Personal health and wellness is seldom a choice issue when it comes
to consumption. In life threatening situations clients may pull all the stops to get the
medical attention, including raising finances using loan instruments, which they may
not always do when it is just for mere indulging purposes.
The use of radio stations that command a higher listenership from certain LSM
segments may mean that the results cannot be generalized as this possibly introduces
a natural bias.
Copyright UCT
38 | P a g e R e s e a r c h R e p o r t
The fact that 64% of clients are women also introduces a gender bias, which means
that results cannot just be generalized to other populations which may have an equal
or over representation of men.
7 Research conclusions
The main purpose or aim of the research was to investigate whether the level of income
influences consumer behaviour in the townships. Four research questions and their
corresponding hypotheses were formulated and tested using the data collected from Roots to
answer this main question. Research conclusions were drawn for each of the research
questions and are discussed in the next paragraphs.
Does the level of income influence number of clients or consumers using service?
The level of personal and family income influences the number of clients who use spa
services at Roots. However there is an inverse relationship between the two variables
(income and number of clients using the services). This is contrary to Bowman (1997)‟s
findings, which is the basis for hypothesis 1. According to Bowman (1997), the number of
clients using Roots was expected to be directly proportional to the level of income i.e. lower
amongst low income earners and higher among high income earners. Two factors may have
contributed to this relationship are 1) Roots‟ marketing channels, 2) class polarization that
prevails in the township. Roots runs marketing campaigns on native languages radio stations
such as Ukhozi and Lesedi. This may not reach certain sections of the township market like
the black high income earners who listen to English radio stations for various reasons. It may
also be that high income earners also like spending their money outside the township, at up
market shopping malls where they feel they get value for their money. In addition upper class
income earners may also regard shopping in up market areas as a way of differentiating
themselves from the rest of the society and thereby maintaining their hard earned status.
Beside the two factors above, it may also be that the township income profile is reflected in
the number of client using services at Roots. Businesses wanting to venture into the township
market may have to select their niche carefully as the bulk of the business comes from low
income earners. This means choosing the right marketing mix i.e. place, price, product and
Copyright UCT
39 | P a g e R e s e a r c h R e p o r t
promotion for intended market. Further work needs to be done to verify if the finding is not a
reflection of the society‟s income profile.
Does the level of income influence the amount of money spend each time a service is
used?
The amount of money spent for each service at Roots was found to be low among low
income earners and increased as one moves the earning scale. This is line with what expected
(in Hypothesis 2). It also confirms earlier findings by Du & Kamakura (2008), Martins
(2008) and Giskes et al. (2002), which concluded that high income families were spending
more money on certain non-basic items than their low income counterparts. Affordability,
which is generally a function of income level, seems to play a major role in this case. One
would have normally expected high income earner to spend more and low income earner to
spend less. What this means for businesses is that the right pricing strategy coupled with
innovative product packaging strategy would have to be employed to service this market. If
this is not done, there is a risk of excluding the low income earners who are willing to spend
but their economic conditions constrain them to spend. These clients currently account for
bigger share of the market.
Does the level of income influence the person paying for services that the client of
consumer uses?
The level of family income has no influence on the person paying for services used at Roots.
Two paying „persons‟ were reported namely own and family. This different from what was
expected (as in hypothesis 3) and reported in the USA where spa clients were paying for their
services using one of the following: own pocket, family, or gift (Monteson & Singer, 2002).
Societal evolution may perhaps explain why the level of income has no influence on who
pays for services used at the spa. One of the factors is the shift from family emphasis to
individual emphasis. People may be increasingly making their own decisions without
involving family. In the same vein, self-centeredness may be taking Roots in society such that
purchase or spending decisions lies within the individual. Nevertheless, families still play a
role in terms of looking for the sick and elderly. Business operating in the townships should
Copyright UCT
40 | P a g e R e s e a r c h R e p o r t
perhaps focus their message on individual as he or she seem to be replacing family (the
historically Decision Making Unit).
Does the level of income influence the frequency of client or consumer spending?
The frequency of service use was found to be influenced by the level of income. But there
was an inverse relationship between the use of services and level of income. Collectively low
income earners use services more frequently than high income earners. This is in line with
what was expected (as in hypothesis 4) and confirms earlier findings by Bowman (1997),
which concluded that the level of income was inversely related to the snacking frequency.
This may be influenced by their economic status and the ability to afford all-in-one services
that carter for all aspects in one visit. Hence clients may be dividing their needs into small
and affordable services. This implies that servicing this market will again require innovative
ways of packaging the services offering so as to make it affordable to the market.
In conclusion, three of the four research questions suggest that the level of income in the
township influences consumer behaviour in the following ways: it determines the number of
consumers or clients using a service, it determines the amount of money consumers spend
when using those services and it determines the frequency at which consumers spend. The
findings were however not able to differentiate who the key financier or key decision maker
is when it comes to that spending or consumption of services.

Copyright UCT
41 | P a g e R e s e a r c h R e p o r t
8 Future research directions
The following work is recommended in order to enhance the generalizability of the research
findings:
The proportion of income groups in the township population should be determined
and used to formulate and test revised hypotheses, which will further determine if the
number of clients visiting the spa is genuinely related to income and not just a
reflection of the socio-economic situation of the township population. This will also
eliminate the equal proportion of income groups in the township assumption that was
made to enable the analysis of the data.
Replicate the study to other industries operating in the township. Findings from other
industries will help confirm the validity of the current findings.
Increase both the survey sample size and sites to include more clients and other
branches of Roots operating across the countries. The bigger the sample, the better
will be the chance of eliminating errors associated with both sample and sampling.
Copyright UCT
42 | P a g e R e s e a r c h R e p o r t
References
Bowman, SA. (1997). Snacking habits of different income groups [Electronic version].
Family Economics & Nutrition Review, 10(4).
Bryman, A., & Bell, E. (2007). Business Research Methods (2nd
ed.). Oxford: Oxford
University Press.
Chipp, K. (2009). SAARF Universal LSM®. South African Advertising Research
Foundations. PowerPoint Training Slides, January.
Coleman, R.P. (1983). The Continuing Significance of Social Class to Marketing [Electronic
version]. Journal of Consumer Research, 10, 265 – 280
Curtis, W.W. (1972). Social Class or Income? (Electronic version]. Journal of Marketing,
January, 67 – 68.
Dimant, T. & Roodt, M. (2009). South Africa Survey 2008/2009: Employment and Income.
South African Institute of Race Relations. Retrieved December 1, 2009, from:
http://www.sairr.org.za/research-and-publications/south-africa-survey-2008-2009
Du, R.Y., & Kamakura, W.A. (2008). Where did all that money go? Understanding how
consumers allocate their consumption budget [Electronic version]. Journal of Marketing, 72,
109–131
Foxall, G.R. (1975) Social Factors in Consumer Choice: Replication and Extension
[Electronic version]. Journal of Consumer Research , 2, June, 60 - 64
Frost, J.G. (2004). The Spa as a Model of an Optimal Healing Environment [Electronic
version]. Journal of Alternative and Complementary Medicine, 10(1), 85- 92.
Giskes, K., Turrell, G., Patterson, C., & Newman, B. (2002). Socioeconomic differences
among Australian adults in consumption of fruit and vegetables and intakes of vitamins A, C
and folate. Journal of Human Nutrition Dietetics, 15, 375 – 385.

Copyright UCT
43 | P a g e R e s e a r c h R e p o r t
Gundgaard, J. (2006). Income-related inequality in utilization of health services in Denmark:
Evidence from Funen County. Scandinavian Journal of Public Health, 34, 462 – 471.
Ligthelm, A.A. (2008). Small Business Sustainability in a Changed Trade Environment: The
Soweto Case. Bureau of Market Research, University of South Africa.
Macanda, P. (2007, January 21). The beauty of running my own business. Sunday Times.
Retrieved May 19, 2009, from http://www.itsmybusiness.co.za/IMB21Jan2007.pdf
Maliwichi, L.L., Bourne, L., Mokoena, L. (2003). Expenditure patterns on food and non food
items of Khayelitsha households, Western Cape, South Africa [Electronic version].
International Journal of Consumer Studies, 27(3), 227
Martineau, P. (1958). Social Classes and Spending Behavior [Electronic version]. The
Journal of Marketing, October, 121 – 130
Martins, J.H. (2005). Total Household Cash Expenditure in SA by Living Standards Measure
(LSM) Group and Product. Bureau of Market Research, University of South Africa.
Monteson, P.A. & Singer, J.L. (2002). Planning and operation a resort-based spa [Electronic
version]. Journal of Retail & Leisure Property, 2(4), 358 - 368
Myers, J.H. & Mount, J.F. (1973). More on Social Class vs. Income as Correlates of Buying
Behavior [Electronic version]. Journal of Marketing, April, 71 – 73
Peter, J.P., & Donnelly, J.H. (2006). A Preface to Marketing Management (10th
ed.). New
York: McGraw-Hill/Irwin
Saunders, M.N.K., Lewis, P., Thornhill, A. (2007). Research methods for business students
(4th
ed.). Pearson Education Limited.
Schulaka, C. (2009). Consumer demographics: Understand consumer spending to better serve
clients. Research Spotlight, Journal of Financial Planning, 2nd Quarter, 1-7
Silk, A.J. (2006). What is marketing? Boston, Massachusetts: Harvard Business School Press.
Thorsteinsdottir, K. (2005). Hotels: The state of the European hotel spa sector [Electronic
version]. Journal of Retail & Leisure Property, 4(3), 272 – 277.

Copyright UCT
44 | P a g e R e s e a r c h R e p o r t
Utts, M.J. & Heckard, R.F. (2007). Mind on Statistics (3rd
Ed.). Belmont, California:
Thompson Brooks/Cole.
Weise, M. (2008). A higher education marketing perspective on choice factors and
information sources considered by South African first year student. Unpublished Doctoral
Dissertation, Department of Marketing and Communication, University of Pretoria, Pretoria,
Gauteng.

Copyright UCT
45 | P a g e R e s e a r c h R e p o r t
Appendix
Appendix 1: Research theory
Table 4: International Spas Association definitions of spas
Type Description
1. Club Spa A facility, the primary purpose of which is fitness, which offers a variety
of professionally administered spa services on a day-use basis.
2. Cruise Ship Spa A spa onboard a cruise ship providing spa services, fitness, and often spa-
cuisine menu choices.
3. Day Spa A spa offering a variety of spa services on a day-use basis. The emphasis is
on pampering services such as facials and body scrubs, not fitness.
4. Mineral Springs
Spa
A spa with an onsite source of natural mineral springs or seawater, used in
hydrotherapy treatments.
5. Resort/Hotel Spa A spa located within a resort or hotel environment that provides spa
services, fitness activities, spa-cuisine menu choices, and perhaps some
wellness components.
6. Medi-Spa A center where medical and spa professionals offer some wellness care in
addition to spa services, most often in the area of cosmetic procedures.
7. Destination Spa A facility, the sole purpose and mission of which is to provide guests with
opportunities for lifestyle improvement and health enhancement through
professionally administered spa services, fitness and educational
programming, onsite accommodations, and a variety of health and healing
services. Healthy cuisine is served exclusively.
Source: (Thorsteinsdottir, 2005)
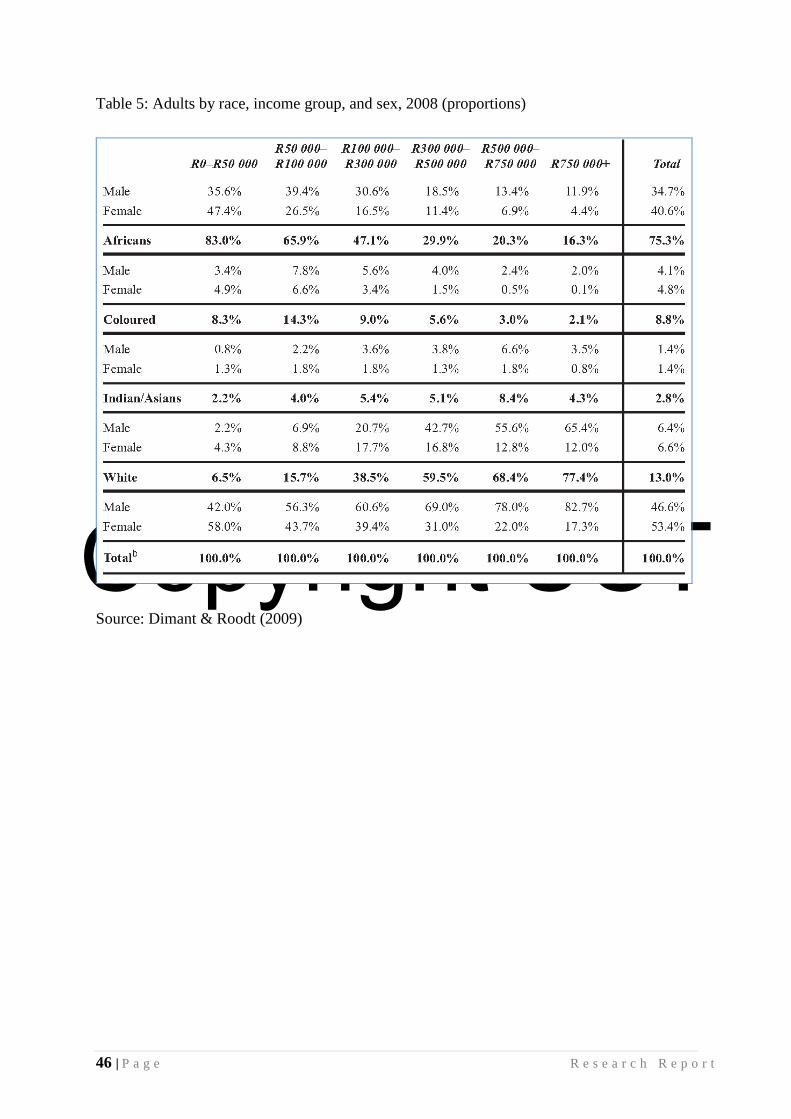
Copyright UCT
46 | P a g e R e s e a r c h R e p o r t
Table 5: Adults by race, income group, and sex, 2008 (proportions)
Source: Dimant & Roodt (2009)

Copyright UCT
47 | P a g e R e s e a r c h R e p o r t
Appendix 2: Research instrument
Letter of introduction
Graduate School of Business
University of Cape Town
Private Bag X3
Rondebosch
7701
22 September 2009
Hi,
My name is Rodgers Ndobe. I am a Master of Business Administration (MBA) student at the
UCT Graduate School of Business and currently doing my final year. Part of my MBA
requirements is conducting a research (survey) on a topic of my choice. I have chosen
consumer behaviour in the townships as I believe that the township market is an important
contributor in the South African economy.
The purpose of this research (survey) is to gather information, using a questionnaire, which
will help me to understand consumer behaviour in the township. The information that you
will supply by completing the questionnaire will be used for academic purposes only. Your
confidentiality is guaranteed as no personal information is required. The survey also follows
strict university research guidelines which ensure that respondents‟ personal privacy is not
invaded.
Your participation in this survey will be highly appreciated
Sincerely
Rodgers Ndobe
Student Number: NBDROD001
Contact: 084 669 4985
Research Supervisor: Mr. Mlenga Jere (Senior Lecturer: Marketing)
Tel: 021 406 1414

Copyright UCT
48 | P a g e R e s e a r c h R e p o r t
Survey Questionnaire
CONSUMER BEHAVIOUR SURVEY QUESTIONNAIRE
BACKGROUND
The purpose of the survey is to gather information that will be used to determine the influence of
income level on consumer spending on spa services in the townships. This survey is an academic
exercise and it is undertaken as part of the MBA programme at the University of Cape Town’s
Graduate School of Business.
SPECIAL INSTRUCTIONS
The survey has 19 questions and will take approximately 5 minutes to complete.
Mark/Select the answer that applies to you with a cross (X)
Explain or describe where required in CAPITAL LETTERS
1. Gender
Male Female
2. What is your Job Title? (e.g. Nurse, Teacher, DJ, etc)
3. What is your age?
Below 21
21 -30
31 – 40
41 – 50
51 – 60
Above 60
4. What is your marital status?
Single Married Divorced Windowed
5. Do you currently live in Soweto?
Yes No

Copyright UCT
49 | P a g e R e s e a r c h R e p o r t
6. If not living in Soweto, were you living in Soweto before?
Yes No
7. How many times do you visit the spa in a month?
1 2 3 4 Other (Specify)
8. How much do you earn per month? (Give estimates)
(a) Alone
Less than R5 000
R5 001 –R10 000
R10 001 –R15 000
R15 001 – R20 000
Above R20 000
(b) As a family
Less than R5 000
R5 001 –R10 000
R10 001 –R15 000
R15 001 – R20 000
Above R20 000
9. How many financially dependent people do you have?
1 2 3 More than 3 None
10. How many members of your family are employed?
1 2 3 More than 3 None
11. For what purpose do you use the spa services? (Select most used)
Health Beauty Leisure Other (specify)
12. Who pays for your spa services? (Select one answer only – most used form of payment)
I (myself) My family Gift (From non-family members Other (specify)
13. How much do you spend every time you visit the spa?
R0 - R200 R201 - R400 R401 - R600 More than R600
14. Which spa services do YOU use most of times? (Select one answer only )
Grooming (e.g. facial, manicure)
Body services (e.g. massages)
Slimming
Health (e.g. stroke, epilepsy, shingles)
Other (Specify)
15. For how long have you been using spa services? (Not just The Roots)

Copyright UCT
50 | P a g e R e s e a r c h R e p o r t
Less than 6 months
Over 6 months to a year
Over a year to 2 years
Over 2 years
16. Do you have family or friends who are using the spa?
Yes No
17. Have you been to other spas besides Roots?
Yes No
18. Who introduced you to spa services? (Select one answer only)
I (Myself) Family Friends
19. If you introduce yourself, where did you first hear about this spa? (Roots in particular)
On Radio Newspaper Shopping Trip Word of Mouth
THANK YOU
For taking time to complete this survey
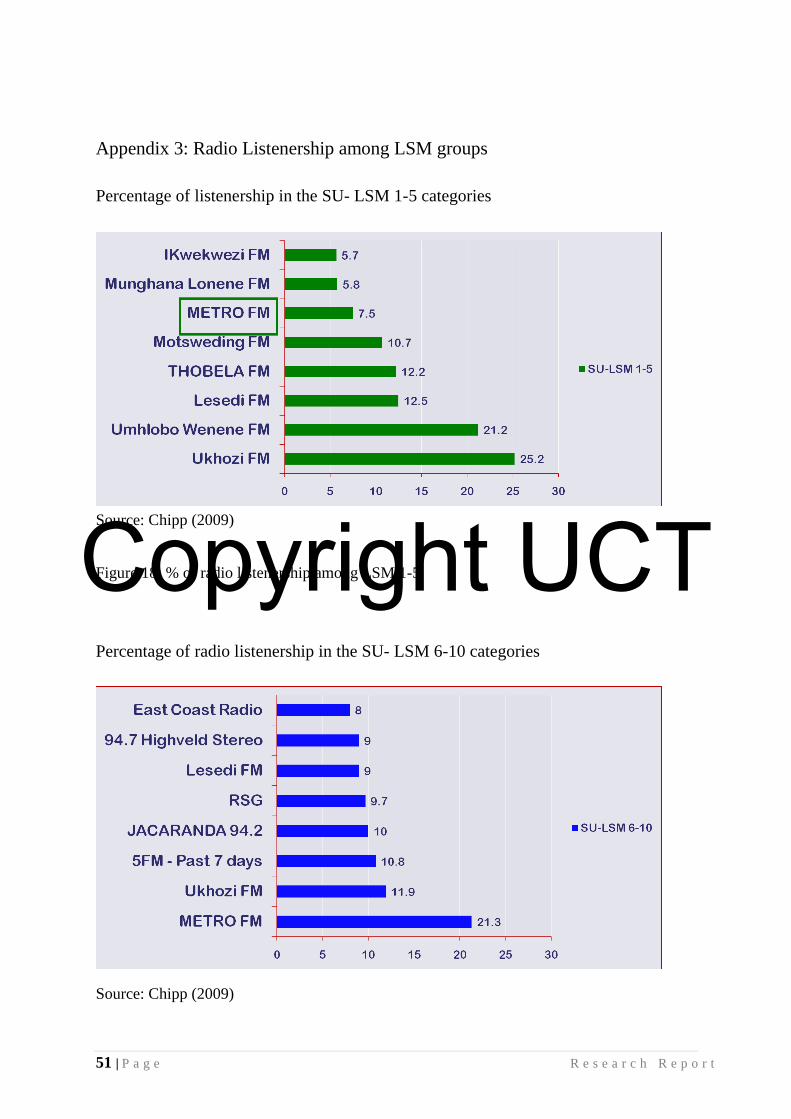
Copyright UCT
51 | P a g e R e s e a r c h R e p o r t
Appendix 3: Radio Listenership among LSM groups
Percentage of listenership in the SU- LSM 1-5 categories
Source: Chipp (2009)
Figure 18: % of radio listenership among LSM 1-5
Percentage of radio listenership in the SU- LSM 6-10 categories
Source: Chipp (2009)

Copyright UCT
52 | P a g e R e s e a r c h R e p o r t
Figure 19: % of radio listenership among LSM 6-10