Embed Size (px)
Citation preview

Can hedgerow management mitigate the impacts of predation on songbird nest
survival?
Jenny C. Dunn1,3, Derek Gruar1, Chris Stoate2, John Szczur2 and Will J. Peach1
1 RSPB Centre for Conservation Science, RSPB, The Lodge, Sandy, Bedfordshire, SG19
2DL, UK2 Allerton Project, Game and Wildlife Conservancy Trust, Loddington House, Loddington,
Leicestershire, LE7 9XE, UK 3 Correspondence author and current address
School of Life Sciences, University of Lincoln, Joseph Banks Laboratories, Lincoln, LN6
7TS, UK
Word count: 6,129 (excl. tables, figures and legends)
Figures: 3
Tables: 7
Appendices: 3
1
1
2
3
4
5
6
7
8
9
10
11
12
13
14
15
16
17
18
19

Abstract
Nest predators can have significant impacts on songbird reproductive success. These
impacts may be amplified by habitat simplification and here we test whether
sympathetic management of farmland hedgerows can reduce nest depredation,
especially by corvids. We test whether songbirds select nest sites according to structural
features of hedgerows (including nest visibility and accessibility), and whether these
features influence nest predation risk. Songbirds selected nesting sites affording higher
vegetation cover above the nest, increased visibility on the nest-side of the hedgerow
and reduced visibility on the far side of the hedge. Nest survival was unrelated to corvid
abundance and only weakly related (at the egg stage) to corvid nest proximity. Nest
survival at the chick stage was higher where vegetation structure restricted access to
corvid-sized predators (averaging 0.78 vs. 0.53), and at nests close to potential vantage
points. Overall nest survival was sensitive to hedgerow structure (accessibility)
particularly at low exposure to corvid predation, while the overall impact of corvid
exposure was dependent on the relationship involving proximity to vantage points. Nest
survival over the chick stage was much higher (0.67) in stock-proof, trimmed and
mechanically cut hedgerows, (which tended to provide lower side visibility and
accessibility) than in recently laid, remnant or leggy hedgerows (0.18). Long-term
reductions in the management of British hedgerows may therefore be exposing nesting
songbirds to increased predation risk. We recommend regular rotational cutting of
hedgerows to maintain a dense woody structure and thereby reduce songbird nest
predation.
Keywords: nest predation, corvids, farmland birds, predator-habitat interactions,
farmland conservation
2
20
21
22
23
24
25
26
27
28
29
30
31
32
33
34
35
36
37
38
39
40
41
42
43
44

1. Introduction
Nest predation is the main cause of nestling mortality in birds (Ricklefs, 1969),
with losses to predators approaching 69% in some altricial species (Remes and Martin,
2002), sometimes leading to population sinks (Rogers et al., 1997). Species suffering
high levels of nest predation have evolved behavioural and life-history strategies to
minimise predation risk (Dunn et al., 2010; Eggers et al., 2005a; Martin, 1995) such as
shorter nestling periods and multiple broods each year (Martin, 1995). Parents tend to
reduce investment in a nest when predation risk is high, through reduced egg size
(Fontaine and Martin, 2006), clutch size (Julliard et al., 1997) and clutch mass (Fontaine
and Martin, 2006). High levels of activity around the nest may attract predators and
parents often reduce activity when the risk of nest predation is high (Conway and
Martin, 2000; Dunn et al., 2010; Eggers et al., 2005b).
Behavioural adjustment by adult birds to reduce nest predation risk (Dunn et al.,
2010; Eggers et al., 2005b) is dependent not only on predator activity, but also on the
cover around the nest and the availability of food for chicks (Eggers et al., 2008). In
areas where food abundance is low, high corvid abundance is associated with reduced
nestling growth in a farmland songbird (Dunn et al., 2010). Ecological factors affecting
the likelihood of nest predation include nest density (Cresswell, 1997; Schmidt and
Whelan, 1998), predator abundance and nest type (i.e. cavity vs. open-cup, Fontaine et
al. 2007). Nests that are more visible are more likely to be depredated at the egg stage
(Martin et al., 2000; Matessi and Bogliani, 1999). Predation rates tend to increase with
reduced vegetation cover, vegetation height, and nest height (e.g. Cresswell 1997), all
features that are likely to interact to influence nest detectability and accessibility
(Cresswell, 1997), although there is no evidence for nest size affecting predation risk
(Weidinger, 2004). Factors affecting nest predation risk may differ between predators:
corvids are more likely to depredate poorly concealed nests, whereas well concealed
nests are more likely to suffer depredation by rodents (Weidinger, 2002). There may be
a trade-off for nest survival between nest concealment and the ability of parent birds to
detect an approaching predator (Cresswell, 1997; Gotmark and Post, 1996; Weidinger,
2002).
Corvids are important nest predators, especially in farmland environments
(Andren, 1992; Luginbuhl et al., 2001), and their populations in the UK have increased
steadily since the 1960s, coincidental with the declines in many farmland songbirds
(Gregory and Marchant, 1995). Whilst no clear link has been found between declining
abundance of farmland songbirds and increasing abundance of corvids (Gooch et al.,
1991; Madden et al., 2015; Newson et al., 2010; Thomson et al., 1998), local examples
3
45
46
47
48
49
50
51
52
53
54
55
56
57
58
59
60
61
62
63
64
65
66
67
68
69
70
71
72
73
74
75
76
77
78
79
80

have shown predation impacts through farming management. Organic farms harbour
more corvids, but fewer songbirds (Gabriel et al., 2010) and gamebird management
(corvid control and sympathetic habitat management) is associated with higher nest
survival and higher breeding densities of songbirds (Stoate and Szczur 2001, White et al.
2008, White et al. 2014). An extensive analysis of song thrush and blackbird nest record
cards found fine-scale spatial associations between corvid densities and nest survival
rates (Paradis et al., 2000). That corvids are responsible for high numbers of nest losses
is indisputable (Andren, 1992; Bradbury et al., 2000; Luginbuhl et al., 2001), and the
linear nature of hedgerows in farmland landscapes may increase the risk of nest
depredation (Chamberlain et al., 1995). Legal control of corvids is advocated and
practiced for game management, and specifically for songbird conservation, but the
control of one native species to benefit another is expensive and not universally
accepted as a management practice. Thus, reducing corvid nest predation through
habitat management would be desirable if possible, and, alongside measures to increase
food availability during summer and winter, providing productive nesting habitat might
help reverse population declines amongst some farmland bird species (Fuller et al.,
1995). To our knowledge, no previous study has investigated impacts of hedgerow
structure or management on nest predation risk in songbirds. The aims of the current
study were (1) to identify the structural features of farmland hedgerows that influence
nest site selection by songbirds, (2) to assess the relative importance of hedgerow
structure and corvid abundance / proximity in determining nest predation risk, and (3)
to identify aspects of hedgerow management that reduce nest predation risk.
4
81
82
83
84
85
86
87
88
89
90
91
92
93
94
95
96
97
98
99
100
101
102

2. Methods
2.1 Study sites
The fates of 399 songbird nests were monitored during April-July 2003 and
2004 across 11 farmland sites in total across two regions in eastern England (five in
Cambridgeshire, Bedfordshire and Hertfordshire, and six in Leicestershire and Rutland).
Not all sites were monitored in both years: 10 sites (5 in each region) were monitored in
2003 and seven sites (3 and 4 respectively) in 2004. The main species monitored were
Blackbird Turdus merula (n=140), Chaffinch Fringilla coelebs (83), Dunnock Prunella
modularis (17), Linnet Carduelis cannabina (103), Yellowhammer Emberiza citrinella
(28) and Song Thrush Turdus philomelos (8).
2.2 Nest finding and monitoring
Hedgerows were selected to cover the full range of hedgerow characteristics and
management types present across study sites. Studied hedgerows ranged from
intensively managed (usually less than 1 m high, with thin woody vegetation with gaps),
through managed (usually greater then 1 m high and cut or trimmed within the last 3 – 4
years) to unmanaged (usually >3 m high, not regularly cut or trimmed, often with trees
and tall shrubs). Hedgerows next to busy roads, gardens, woods or woodland strips, or
those planted within the last 5 years, were not selected for study.
Each hedgerow was cold-searched for nests at approximately weekly intervals
between early April and late July. For each nest, the species was noted and the nest was
inspected every 5–7 days until either the young fledged or the nest failed. Nest contents
and adult activity were recorded during each visit. Nest success was inferred by an
empty undamaged nest where the young were old enough to have fledged since the
previous visit. Nest failure was either known (nest contained cold eggs, egg fragments or
dead chicks) or was inferred from empty (often damaged) nests on a date prior to a
plausible fledging date. For analytical purposes the date of failure was assumed to be the
mid point between the last two visits. If there was evidence a nest had been pulled down
from below, we assumed predation by a mammal, although we acknowledge that
predator identification based on field signs is not always reliable (Pietz and Granfors,
2000). As we were specifically interested in corvid predation, nests for which
mammalian predation was presumed were excluded from analyses (n=11, 2.8 %), as
were any nests for which the outcome was uncertain (n=18, 4.5 %). A small number of
failures caused by starvation, abandonment, human interference, or egg infertility (eggs
not hatched or chicks found dead in the nest) were also excluded (n=24, 6.0 %).
Analyses were restricted to nests located within the woody vegetation of the hedge;
5
103
104
105
106
107
108
109
110
111
112
113
114
115
116
117
118
119
120
121
122
123
124
125
126
127
128
129
130
131
132
133
134
135
136
137
138

nests located on the ground or within field boundary vegetation were excluded. First egg
date (FED; a day-specific integer where 1st January = 1) was deduced from incomplete
clutches, hatch dates and estimated chick ages (e.g. Green, 2004). If FED could not be
determined to within 3 days then the nest was excluded from analyses.
2.3 Nest site characteristics
Data describing nest site characteristics were collected for 338 nests within ten
days of the nesting attempt ending and are defined in Table 1a (brief descriptions only
are given here). We recorded nest height above the ground, along with the shortest
horizontal depth and vertical depth between the nest and the hedgerow edge. We
measured nest dimensions to allow the calculation of nest volume, and identified
primary and surrounding plant species supporting the nest. Hedgerow height and width
at the nest were measured to calculate cross-sectional area at the nest site.
Nest concealment was assessed in three different ways: light penetration at the
nest (measured with a light meter), horizontal visibility (counts of white circles on a
black card positioned next to the nest) and vertical vegetation cover (assessed from a
digital image; see Table 1a for details). Nest accessibility (a binary variable) was
assessed by attempting to manoeuvre two different sized balls from the hedgerow edge
to the nest without breaking any woody vegetation (Table 1a). The smaller ball had a
circumference (30.5 cm) that was similar to the maximum body girth of a magpie Pica
pica (measured as 28 cm), and was intended to highlight potential accessibility to a
corvid. Accessibility with the larger ball (69cm) was intended to indicate easy access to a
foraging corvid.
Locations of carrion crow Corvus corone and magpie nests were recorded, and
the distance to the nearest corvid nest (corvid distance) subsequently calculated for
each songbird nest. We also recorded distance to the nearest wood or woodland strip
(wood distance), and distance to the nearest tree, pylon, telegraph pole or other vantage
point at least 5 m in height (vantage distance) as corvids are visually-oriented predators
known to utilise vantage points when searching for prey (Macdonald and Bolton, 2008).
2.4 Corvid abundance
The relative abundance of corvids (magpie, carrion crow, jackdaw Corvus
monedula and jay Garrulus glandarius) was assessed using a transect method (Stoate
and Szczur, 2001) on between 2 and 13 occasions (mean ± SE: 5.08 ± 1.00 visits) at each
site during April-June of each year. Transects were spaced approximately 600 – 700 m
apart and followed field boundaries; mean transect length was 5.75 ± 1.15 km (± 1 SE).
6
139
140
141
142
143
144
145
146
147
148
149
150
151
152
153
154
155
156
157
158
159
160
161
162
163
164
165
166
167
168
169
170
171
172
173
174

Each transect was walked at a steady pace, and all corvids were recorded. The total
number of corvids per km within 100m of the observer, averaged over all transects, was
taken as an index of corvid abundance for each site in each year.
2.5 Hedgerow characteristics and nest site selection
Data describing hedgerow characteristics were collected for 391 nests and
described the section of hedgerow 30m either side of each nest. Firstly, the hedgerow
aspect was recorded, and hedgerow management and cutting style were categorised (as
in Table 1b). The percentage of gaps within the same stretch of hedgerow was
estimated, along with the number of trees. The occurrence and timing of a hedgerow cut
during the previous 5 years was determined during farmer interviews. The width of
vegetated margins on both sides of the hedgerow was measured.
In order to identify structural features of hedgerows that were selected or
avoided by nesting songbirds, we repeated the nest site measurements for primary
supporting and surrounding vegetation, horizontal visibility and vertical cover at six
locations spread at 10m intervals either side of the nest (if an interval fell within a
hedgerow gap, then a point 5 m either side of the gap was measured instead). The
measurements were collected at the same height in the hedgerow as the nest. These
data were collected for 333 nests.
2.6 Statistical analysis
2.6.1 Nest site selection
To determine the features of hedgerows selected by nesting birds, the key
features of nest sites thought to indicate aspects of nest visibility and accessibility
(vegetation cover, horizontal visibility from each side of the nest, primary species and
surrounding species; Table 1) were compared with the six adjacent non-nest locations
using conditional logistic regression stratified by nest identifier to allow for the non-
independence of nest and non-nest locations (Anteau et al., 2012).
2.6.2 Likelihood of nest predation
We used generalised linear mixed models (GLMMs) with binomial error
structures and logit link functions to determine whether nest site characteristics
influenced the likelihood of nest predation at the egg (n=202 nests) and chick (n=190)
stages. GLMMs were fitted using the ‘glmer’ function within the lme4 package (Bates and
Maechler, 2009) in R v 2.10.1 for Mac (R Core Development Team, 2009). A hedgerow
identifier nested within farm was included as a random effect to control for the non-
7
175
176
177
178
179
180
181
182
183
184
185
186
187
188
189
190
191
192
193
194
195
196
197
198
199
200
201
202
203
204
205
206
207
208
209
210

independence of nests within the same hedgerow, or on the same farm, as well as to
control for spatial autocorrelation. The response variable was the daily whole nest
failure rate (DFR) in which nest outcome at the relevant nest stage (0 = successful, 1 =
depredated) was the binomial numerator and the number of exposure days during the
relevant nest stage declared as the binomial denominator (Aebischer, 1999; Hazler,
2004). Our aim was to identify predictors of nest survival associated with hedgerow
structure and corvid abundance / distance, and any interactions between the two. All
GLMMs initially included a set of fixed variables (irrespective of their statistical
significance) for factors that might have affected nest survival but were unrelated to
hedgerow structure or predator abundance (we call these ‘base models’). These
included mean-centred FED (for egg stage survival) or hatch date (for chick stage
survival) as linear and quadratic terms to allow for non-linear temporal variation in
predation risk across the breeding season. They also included species, nest contents
(clutch or brood size for egg and chick stage models respectively) and year. We tested
each ‘base variable’ within the base model, and excluded those with p>0.10 to avoid
overfitting, resulting in a ‘final base model’ which remained fixed for the rest of the
model selection.
We then followed a two-stage approach which aimed to identify predictors of
nest survival while balancing the likelihood of type I and type II errors (Pearce-Higgins
et al., 2009). First, each of the 15 hedgerow characteristics and corvid variables listed in
Table 1a (logarithm or arcsine transformed as necessary) was added to the final base
model one at a time. For those variables that were potentially influential on nest survival
(p<0.1; Table 2) we checked for multicollinearity by examining correlations between
variable pairs (detailed in Appendix 1). This was done separately for nest site character
and hedgerow management variables. As potentially influential variables exhibited little
inter-correlation (all r values<0.5; Appendix 1), all were retained in a second stage of
multivariate testing. This second stage involved the addition of all potentially influential
hedgerow/corvid variables to the final base model, followed by sequential backwards
deletion in which the least significant term (assessed using p value) was removed until
all remaining hedgerow/corvid terms were either formally significant (p<0.05) or
potentially influential (p<0.1). We report the latter to avoid type 2 errors but interpret
such relationships more cautiously. We finally tested two-way interactions between our
best measures of corvid exposure (corvid abundance and corvid distance) and our
measure of nest visibility most relevant to corvids flying overhead or walking along the
top of a hedgerow (vegetation cover), to assess whether more visible nests were more
likely to be depredated in areas of higher corvid exposure. Whilst stepwise model
8
211
212
213
214
215
216
217
218
219
220
221
222
223
224
225
226
227
228
229
230
231
232
233
234
235
236
237
238
239
240
241
242
243
244
245
246

construction has been criticised in the literature (Whittingham et al., 2006), it has since
been shown that stepwise approaches perform just as well as other methods (Murtaugh,
2009). Information theoretic methods were not employed as these require estimation
processes that approximate the likelihood rather than the model (Bolker et al., 2009).
To estimate the scale of effect at the whole nest level, we combined corvid and
nest access variables from our final models to predict overall nest survival rates for
accessible and inaccessible nests (small ball access) and high and low potential corvid
exposure (corvid distance and vantage distance). We predicted at both levels for binary
data, and at levels of the 10th and 90th percentiles from the raw data to provide whole
egg-stage, whole chick-stage and whole nest-stage survival proportions.
2.6.3. Management associations with nest predation
The GLMMs for egg (n=209) and chick stage (n=195) nest survival were
extended to test for any influence of our 8 hedgerow management variables (Table 1b).
Model selection proceeded as described above (2.5.2) with each management term
initially added in turn to the base model, followed by backwards deletion on the
significant one-at-a-time predictors. Because several of the management variables were
categorical and were likely to have co-varied, no interactions were considered.
9
247
248
249
250
251
252
253
254
255
256
257
258
259
260
261
262
263
264
265

3 Results
3.1 Nest site selection
Nest locations were characterised by higher vegetation cover compared to non-
nest sites, along with higher visibility from the side of the hedgerow closest to the nest
and lower visibility from far side of hedgerow (Table 3, Figure 1). Bramble was most
likely to be selected as the primary support for nests (rose the least), while ivy was the
preferred surrounding species (locations with rose or no surrounding species being
avoided; Table 3).
3.2 Effects of hedgerow structure and predators on nest failure rates
Mean DFR at the egg stage was 0.032, equivalent to 0.35 failure over a 13-day
incubation period. For nests reaching the chick stage, mean DFR was 0.035 equivalent to
0.38 failure over a 13-day chick-rearing period.
Egg stage DFRs declined significantly with increasing clutch size, and exhibited a
weak negative relationship with distance to the nearest corvid nest (Appendix 2; Table
4).
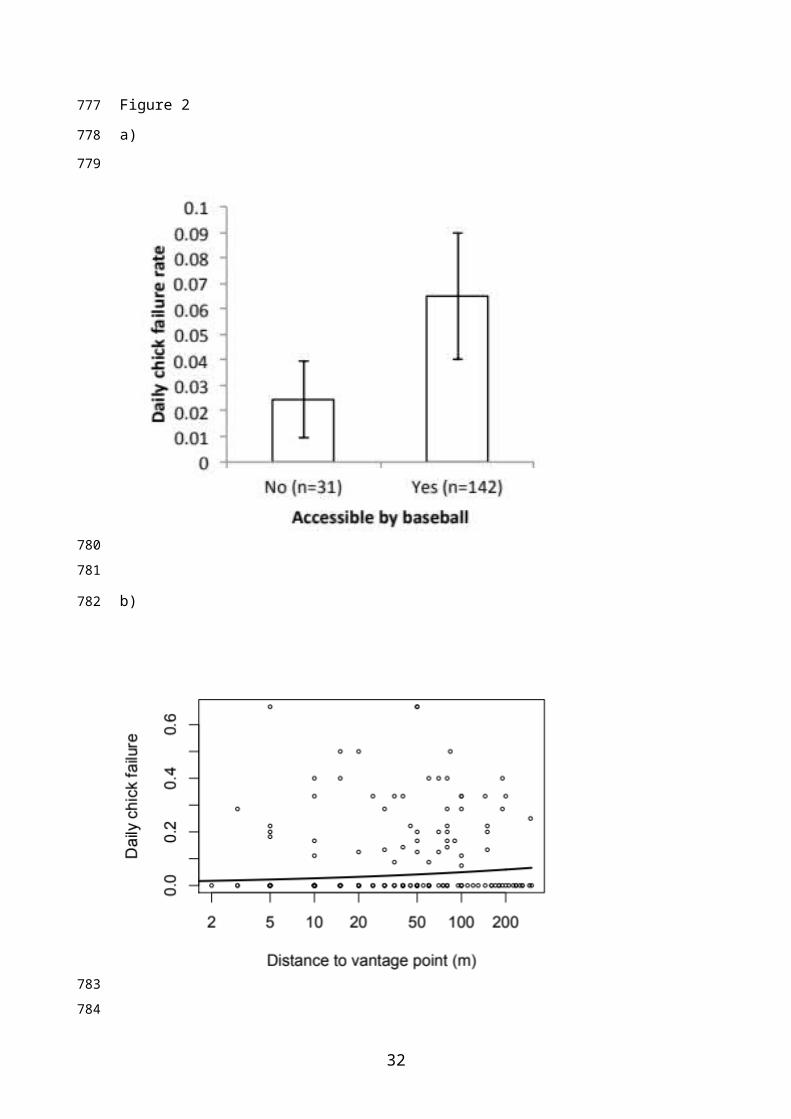
After allowing for a marked seasonal decline in chick stage failure rates, DFRs
were higher for nests that were accessible with a small ball (Figure 2a; DFRs of 0.047
and 0.019 for accessible and inaccessible nests respectively, equivalent to failure rates of
0.467 and 0.219 over a 13-day chick-rearing period), and for nests located further away
from vantage points (Figure 2b; Table 4).
The effect size of nest accessibility in terms of overall nest survival (averaged
between high and low corvid exposure) was 0.143, compared to a mean effect size of
0.031 for corvid exposure (averaged between accessible and inaccessible nests; Table
5). The sensitivity of overall nest survival to nest accessibility was particularly high
when corvid exposure was low (0.360 vs. 0.569, Table 5). When we excluded from these
calculations the (counterintuitive) positive relationship between chick stage nest failure
and vantage point distance, overall nest survival was similarly sensitive to corvid
exposure (mean effect 0.178) and nest accessibility (0.141; Table 5).
3.3 Effects of hedgerow management on nest failure rates
There was a statistically weak effect of time since last cut on egg stage DFR
(Table 6) with nests in recently cut hedgerows experiencing higher failure rates (nest
failure over the 13-day chick period was 0.693 in hedgerows cut during the preceding
year compared to 0.237 in hedgerows cut 4 years previously; Appendix 3). Chick stage
10
266
267
268
269
270
271
272
273
274
275
276
277
278
279
280
281
282
283
284
285
286
287
288
289
290
291
292
293
294
295
296
297
298
299
300
301

DFRs differed between hedgerow management (Table 6). In leggy, remnant and recently
laid hedgerows, the DFR averaged 0.125, equivalent to a nest failure rate of 0.824 over
the 13-day chick-rearing period. Conversely, in mechanically cut, trimmed but dense,
and stock-proof hedgerows, DFR averaged 0.030, equivalent to 0.327 nest failure across
the chick-rearing period (Figure 3). Hedgerow management categories associated with
this higher predation risk (leggy, remnant, recently laid) were characterised by
relatively high horizontal visibility and high small ball accessibility (Table 7).
11
302
303
304
305
306
307
308
309

4 Discussion
To our knowledge, this is the first study to consider the potential for hedgerow
management to ameliorate the impacts of avian nest predators on farmland songbirds.
In farmland environments, 50% of hedgerows have been removed since 1945 and the
diversity and quality of remaining hedgerows has declined (Robinson and Sutherland,
2002). This deterioration of linear hedgerow nesting habitat may have allowed songbird
nests to become more susceptible to nest predation in agricultural landscapes (Evans,
2004; Hinsley and Bellamy, 2000; Whittingham and Evans, 2004). We found songbirds
to select nest sites based on vegetation characteristics likely to provide concealment and
limit access to predators. We found evidence for both vegetation and corvid variables
influencing nest survival, suggesting that improving hedgerow structure can mitigate
corvid predation. Critically, we found that hedgerow management can influence nest
survival, with much lower nest failure rates in hedgerows that were managed to create a
dense structure (e.g. stock-proof or mechanically cut) compared to unmanaged (e.g.
leggy and remnant) hedgerows.
4.1 Nest site selection
Songbirds selected nest sites with high vegetation cover above the nest, which is
likely to afford a degree of protection from corvids flying overhead or foraging along the
top of hedgerows (Cresswell, 1997), as corvids tend to depredate more visible nests
(Matessi and Bogliani, 1999; Weidinger, 2002). Denser vegetation cover may also confer
protection from adverse weather. Songbirds also selected nest sites that conferred
relatively high visibility on the nest side of the hedge, and relatively low visibility on the
far side (Götmark et al., 1995). When faced with an approaching predator, incubating or
brooding parent birds tend to flush sooner when visibility from the nest is higher
(Burhans and Thompson, 2001), which may reduce the risk of attracting attention to the
nest, or disclosing the exact location of the nest by flushing late. Bramble was selected as
the primary nest support, possibly because its dense and thorny character may restrict
nest detection and access by predators. Ivy was selected for vegetation surrounding the
nest, probably as this evergreen species provides increased cover above the nest
especially early in the breeding season when well-hidden nest sites are less abundant
(e.g. White et al. 2008). Rose species were avoided for both primary and surrounding
vegetation, possibly because of their late leafing and relatively sparse leaf cover.
4.2 Effects of predator abundance / proximity and hedgerow structure on nesting
success
12
310
311
312
313
314
315
316
317
318
319
320
321
322
323
324
325
326
327
328
329
330
331
332
333
334
335
336
337
338
339
340
341
342
343
344
345

We found a weak negative effect of corvid nest distance on egg-stage nest failure
rates, which is likely to be a consequence of increased corvid activity close to corvid
nests. Conversely, we found a positive relationship between chick-stage failure rates and
distance to vantage point, which is surprising given the expectation that nests closer to
vantage points are more likely to be noticed by corvids (Macdonald and Bolton, 2008).
However, passerines are known to mediate predation risk through behavioural
modifications so may compensate for this increased exposure by reducing nest
visitation at times when corvids are present (Dunn et al., 2010; Eggers et al., 2005b). At
the chick stage, more accessible nests suffered higher failure rates, suggesting that
hedgerow structure can mitigate corvid predation (Evans, 2004). The relatively large
difference in nest survival between accessible and inaccessible nests translated into a
large effect of nest accessibility on overall nest survival especially when exposure to
potential corvid impacts was relatively low (raising average nest survival from 0.360 to
0.569: Table 5). This confirms that hedgerow vegetation structure confers considerable
protection to songbird nests against depredation, highlighting a role for hedgerow
management in songbird conservation. The overall impact of predator exposure on nest
survival depended on the inclusion of the (counterintuitive) positive relationship
between chick-stage nest failure and distance to vantage point (Table 5). Including this
relationship in predictions rendered overall nest survival relatively insensitive to corvid
exposure. However excluding this relationship (which may be artefactual) from
predictions, renders nest survival similarly sensitive to corvid exposure and hedgerow
vegetation structure (Table 5).
4.3 Management influences on nest success and recommendations
Although the effect of time since last cut on nest survival was statistically weak
the effect size was large, with nests more than twice as likely to survive in hedgerows
cut 4 years previously than during the past year. Nest survival rates were much higher
in stock-proof, trimmed or mechanically cut hedgerows (0.673) than in unmanaged or
recently laid hedges (0.176), probably because the more open vegetation structure in
unmanaged hedges limited the scope for nest concealment and protection from
predators (Cresswell, 1997; Matessi and Bogliani, 1999). Between 1984 and 2007 there
was a 24% reduction in the availability of ‘managed’ hedgerows in Great Britain (Carey
et al., 2008; Petit et al., 2003). Although hedgerow removal explains some of this loss up
until 1990, since then the loss of managed hedgerows is largely explained by a reduction
in hedgerow management activity and a transition to field boundaries dominated by
tree-lines and relict hedges especially in arable-dominated landscapes (Carey et al.,
13
346
347
348
349
350
351
352
353
354
355
356
357
358
359
360
361
362
363
364
365
366
367
368
369
370
371
372
373
374
375
376
377
378
379
380
381

2008). The loss of managed hedgerows from such landscapes, coupled with the increase
in corvid populations (Gregory and Marchant, 1995), may have increased the
vulnerability of hedgerow-nesting songbirds to nest predation (Evans, 2004).
Direct control of corvids can increase nest survival and breeding abundance of
some songbird species but is expensive and not universally accepted as a conservation
management strategy (White et al., 2014). Our study adds to the increasing literature
suggesting that negative impacts of corvids can be mitigated by improving habitat
quality (Dunn et al., 2010; Eggers et al., 2008; Evans, 2004). Associations with hedgerow
management were particularly clear-cut in determining chick survival with stock-proof
and trimmed hedgerows providing the highest nestling survival rates (Fig. 3). In
England, a new agri-environment scheme (Countryside Stewardship; Natural England,
2015) started in 2016 and promotes environmental management of hedgerows by
specifying minimum dimensions (2 m tall and 1.5 m wide) and cutting regimes (outside
the breeding season, no more than one year in three and leaving at least one-half of
hedgerows untrimmed each year). These cutting regimes can improve moth and
parasitoid diversity (Facey et al., 2014), and increase resources such as flowers and
berries (Staley et al., 2012), and our data suggest these guidelines should also benefit
nesting birds. Our data emphasise the importance of regular hedgerow trimming to
promote a dense woody structure and prevent succession to tree lines, and the
avoidance of overly frequent cutting (our data suggest a cut every 3-4 years might be
optimal to promote songbird nest survival; Appendix 3). Rotational hedge cutting
regimes within a farm (i.e. cutting 1/4 - 1/3 of hedgerows each year) is one way to
provide heterogeneity and ensure a continuous supply of other resources such flowers
and berries to meet other wildlife conservation objectives as well as improve passerine
nest survival.
5. Acknowledgements
We are grateful to the landowners who kindly granted access to their land, and
particularly to Mr Joe Nourish who took a special interest in the study. Thanks to Peter
Giovannini and David Watson, who carried out fieldwork alongside DG and JS. The study
was funded by RSPB with data collection at two sites in Leicestershire funded by GWCT.
Staff from RSPB conceived and designed the study, while staff from both RSPB and
GWCT contributed to data interpretation and writing. We thank two anonymous
reviewers for their kind and constructive comments.
14
382
383
384
385
386
387
388
389
390
391
392
393
394
395
396
397
398
399
400
401
402
403
404
405
406
407
408
409
410
411
412
413
414
415

6. Bibliography
Aebischer, N.J., 1999. Multi-way comparisons and generalized linear models of nest
success: extensions of the Mayfield method. Bird Study 46, S22–S31.
Andren, H., 1992. Corvid density and nest predation in relation to forest fragmentation:
a landscape perspective. Ecology 73, 794–804.
Anteau, N., Sherfy, M., Wiltermuth, M., 2012. Selection Indicates Preference in Diverse
Habitats: A Ground-Nesting Bird (Charadrius melodus) Using Reservoir Shoreline.
PLoS One 7, e30347.
Bates, D., Maechler, M., 2009. lme4: Linear mixed-effects models using S4 classes.
Bolker, B.M., Brooks, M.E., Clark, C.J., Geange, S.W., Poulsen, J.R., Stevens, M.H.H., White,
J.-S.S., 2009. Generalized linear mixed models: a practical guide for ecology and
evolution. Trends Ecol. Evol. 24, 127–135.
Bradbury, R.B., Kyrkos, A., Morris, A.J., Clark, S., Perkins, A., Wilson, J., 2000. Habitat
associations and breeding success of yellowhammers on lowland farmland. J. Appl.
Ecol. 37, 789–805.
Burhans, D.E., Thompson, F.R.I., 2001. Relationship of Songbird Nest Concealment to
Nest Fate and Flushing Behavior of Adults. Auk 118, 237–242.
Carey, P.D., Wallis, S., Chamberlain, P.M., Cooper, A., Emmett, B.A., Maskell, L.C., McCann,
T., Murphy, J., Norton, L.R., Reynolds, B., Scott, W.A., Simpson, I.C., Smart, S.M.,
Ullyett, J.., 2008. Boundary and Linear Features Broad Habitat, in: Countryside
Survey: UK Results from 2007. pp. 50–60.
Chamberlain, D.E., Hatchwell, B.J., Perrins, C., 1995. Spaced out nests and predators: an
experiment to test the effects of habitat structure. J. Avian Biol. 26, 346–349.
Conway, C.J., Martin, T.E., 2000. Evolution of passerine incubation behavior: influence of
food, temperature, and nest predation. Evolution 54, 670–685.
Cresswell, W., 1997. Nest predation: the relative effects of nest characteristics, clutch
size and parental behaviour. Anim. Behav. 53, 93–103.
Dunn, J.C., Hamer, K.C., Benton, T.G., 2010. Fear for the family has negative
consequences: indirect effects of nest predators on chick growth in a farmland bird.
J. Appl. Ecol. 47, 994–1002.
Eggers, S., Griesser, M., Andersson, T., Ekman, J., 2005a. Nest predation and habitat
change interact to influence Siberian jay numbers. Oikos 111, 150–158.
15
416
417
418
419
420
421
422
423
424
425
426
427
428
429
430
431
432
433
434
435
436
437
438
439
440
441
442
443
444
445
446
447

Eggers, S., Griesser, M., Ekman, J., 2008. Predator-induced reductions in nest visitation
rates are modified by forest cover and food availability. Behav. Ecol. 19, 1056–
1062. doi:10.1093/beheco/arn063
Eggers, S., Griesser, M., Ekman, J., 2005b. Predator-induced plasticity in nest visitation
rates in the Siberian jay (Perisoreus infaustus). Behav. Ecol. 16, 309–315.
doi:10.1093/beheco/arh163
Evans, K.L., 2004. The potential for interactions between predation and habitat change
to cause population declines of farmland birds. Ibis 146, 1–13.
Facey, S., Botham, M., Heard, M., Pywell, R., Staley, J., 2014. Moth communities and agri-
environment schemes: examining the effects of hedgerow cutting regime on
diversity, abundance, and parasitism. Insect Conserv. Divers. 7, 543–552.
Fontaine, J.J., Martel, M., Markland, H.M., Niklison, A.M., Decker, K.L., Martin, T.E., 2007.
Testing ecological and behavioral correlates of nest predation. Oikos 116, 1887–
1894.
Fontaine, J.J., Martin, T.E., 2006. Parent birds assess nest predation risk and adjust their
reproductive strategies. Ecol. Lett. 9, 428–434.
Fuller, R.J., Gregory, R.D., Gibbons, D.W., Marchant, J.H., Wilson, J.D., Baillie, S.R., Carter,
N., 1995. Population declines and range contractions among lowland farmland
birds in Britain. Conserv. Biol. 9, 1425–1441.
Gabriel, D., Sait, S.M., Hodgson, J.A., Schmutz, U., Kunin, W.E., Benton, T.G., 2010. Scale
matters: the impact of organic farming on biodiversity at different spatial scales.
Ecol. Lett. 13, 858–869.
Gooch, S., Baillie, S.R., Birkhead, T.R., 1991. Magpie Pica pica and songbird populations.
Retrospective investigation of trends in population density and breeding success. J.
Appl. Ecol. 28, 1068–1086.
Götmark, F., Blomqvist, D., Johansson, O., Bergkvist, J., 1995. Nest Site Selection: A Trade-
Off between Concealment and View of the Surroundings? J. Avian Biol. 26, 305–312.
Gotmark, F., Post, P., 1996. Prey selection by sparrowhawks, Accipiter nisus: Relative
Predation Risk for Breeding Passerine Birds in Relation to their Size, Ecology and
Behaviour. Philos. Trans. R. Soc. B Biol. Sci. 351, 1559–1577.
Green, R., 2004. Breeding biology, in: Sutherland, W., Newton, I., Green, R. (Eds.), Bird
Ecology and Conservation: A Handbook of Techniques. Oxford University Press,
Oxford, UK.
16
448
449
450
451
452
453
454
455
456
457
458
459
460
461
462
463
464
465
466
467
468
469
470
471
472
473
474
475
476
477
478
479
480

Gregory, R.D., Marchant, J., 1995. Population trends of Jays, Magpies, Jackdaws and
Carrion Crows in the United Kingdom. Bird Study 43, 28–37.
Hazler, K., 2004. Mayfield logistic regression: a practical approach for analysis of nest
survival. Auk 121, 707–716.
Hinsley, S.A., Bellamy, P., 2000. The influence of hedge structure, management and
landscape context on the value of hedgerows to birds: a review. J. Environ. Manage.
60, 33–49.
Julliard, R., McCleery, R., Clobert, J., Perrins, C., 1997. Phenotypic adjustment of clutch
size due to nest predation in the great tit. Ecology 78, 394–404.
Luginbuhl, J., Marzluff, J., Bradley, J., Raphael, M., Varland, D., 2001. Corvid survey
techniques and the relationship between corvid relative abundance and nest
predation. J. F. Ornithol. 72, 556–572.
Macdonald, M., Bolton, M., 2008. Predation on wader nests in Europe. Ibis 150, 54–73.
Madden, C.F., Arroyo, B., Amar, A., 2015. A review of the impacts of corvids on bird
productivity and abundance. Ibis 157, 1–16.
Martin, T.E., 1995. Avian life history evolution in relation to nest sites, nest predation,
and food. Ecol. Monogr. 65, 101–127.
Martin, T.E., Scott, J., Menge, C., 2000. Nest predation increases with parental activity:
separating nest site and parental activity effects. Proc. R. Soc. B Biol. Sci. 267, 2287–
2293.
Matessi, G., Bogliani, G., 1999. Effects of nest features and surrounding landscape on
predation rates of artificial nests. Bird Study 46, 184–194.
Murtaugh, P.A., 2009. Performance of several variable-selection methods applied to real
ecological data. Ecol. Lett. 12, 1061–8. doi:10.1111/j.1461-0248.2009.01361.x
Natural England, 2015. Countryside Stewardship Manual.
www.gov.uk/countrysidestewardship.
Newson, S.E., Rexstad, E.A., Baillie, S.R., Buckland, S.T., Aebischer, N.J., 2010. Population
change of avian predators and grey squirrels in England: is there evidence for an
impact on avian prey populations? J. Appl. Ecol. 47, 244.
Paradis, E., Baillie, S.R., Sutherland, W.J., Dudley, C., Crick, H., Gregory, R., 2000. Large‐scale spatial variation in the breeding performance of song thrushes Turdus
philomelos and blackbirds T. merula in Britain. J. Appl. Ecol. 37, 73–87.
17
481
482
483
484
485
486
487
488
489
490
491
492
493
494
495
496
497
498
499
500
501
502
503
504
505
506
507
508
509
510
511
512

Pearce-Higgins, J.W., Stephen, L., Langston, R.H.W., Bainbridge, I.P., Bullman, R., 2009.
The distribution of breeding birds around upland wind farms. J. Appl. Ecol. 46,
1323–1331. doi:10.1111/j.1365-2664.2009.01715.x
Petit, S., Stuart, R.C., Gillespie, M.K., Barr, C.J., 2003. Field boundaries in Great Britain:
stock and change between 1984, 1990 and 1998. J. Environ. Manage. 67, 229–238.
Pietz, P.J., Granfors, D.A., 2000. Identifying predators and fates of grassland passerine
nests using miniature video cameras. J. Wildl. Manage. 64, 71–87.
R Core Development Team, 2009. R: A language and environment for statistical
computing.
Remes, V., Martin, T.E., 2002. Environmental influences on the evolution of growth and
developmental rates in passerines. Evolution 56, 2505–2518. doi:10.1111/j.0014-
3820.2002.tb00175.x
Ricklefs, R.E., 1969. An analysis of nesting mortality in birds. Smithson. Contrib. to Zool.
9, 1–48.
Robinson, R.A., Sutherland, W.J., 2002. Post‐war changes in arable farming and
biodiversity in Great Britain. J. Appl. Ecol. 39, 157–176.
Rogers, C., Taitt, M., Smith, J., Jongejan, G., 1997. Nest predation and cowbird parasitism
create a demographic sink in wetland-breeding song sparrows. Condor 99, 622–
633.
Schmidt, K.A., Whelan, C.J., 1998. Predator-mediated interactions between and within
guilds of nesting songbirds: experimental and observational evidence. Am. Nat.
152, 393–402. doi:10.1086/286177
Staley, J.T., Sparks, T.H., Croxton, P.J., Baldock, K.C.R., Heard, M.S., Hulmes, S., Hulmes, L.,
Peyton, J., Amy, S.R., Pywell, R.F., 2012. Long-term effects of hedgerow management
policies on resource provision for wildlife. Biol. Conserv. 145, 24–29.
doi:10.1016/j.biocon.2011.09.006
Stoate, C., Szczur, J., 2001. Could game management have a role in the conservation of
farmland passerines? A case study from a Leicestershire farm. Bird Study 48, 279–
292.
Thomson, D.L., Green, R.E., Gregory, R., Baillie, S., 1998. The widespread declines of
songbirds in rural Britain do not correlate with the spread of their avian predators.
Proc. R. Soc. B Biol. Sci. 265, 2057–2062.
Weidinger, K., 2004. Relative effects of nest size and site on the risk of predation in open
18
513
514
515
516
517
518
519
520
521
522
523
524
525
526
527
528
529
530
531
532
533
534
535
536
537
538
539
540
541
542
543
544
545

nesting passerines. J. Avian Biol. 35, 515–523.
Weidinger, K., 2002. Interactive effects of concealment, parental behaviour and
predators on the survival of open passerine nests. J. Anim. Ecol. 71, 424–437.
White, P.J., Stoate, C., Szczur, J., Norris, K., 2014. Predator reduction with habitat
management can improve songbird nest success. J. Wildl. Manage. 78, 402–412.
White, P.J.C., Stoate, C., Szczur, J., 2008. Investigating the effects of predator removal and
habitat management on nest success and breeding population size of a farmland
passerine: a case study. Ibis 150, 178–190.
Whittingham, M.J., Evans, K., 2004. The effects of habitat structure on predation risk of
birds in agricultural landscapes. Ibis 146, 210–220.
Whittingham, M.J., Stephens, P.A., Bradbury, R.B., Freckleton, R.P., 2006. Why do we still
use stepwise modelling in ecology and behaviour? J. Anim. Ecol. 75, 1182–9.
doi:10.1111/j.1365-2656.2006.01141.x
19
546
547
548
549
550
551
552
553
554
555
556
557
558
559
560

Figure 1.
a)
b)
20
561
562
563
564
565
566

c)
21
567
568
569

22
570
571
572
573
574

Figure 2
a)
b)
23
575
576
577
578
579
580
581
582
583

Figure 3.
24
584
585
586
587
588
589
590
591
592
Figure and Table Legends
Figure 1. Differences between nest sites and non-nest sites in 1) vegetation cover above
the nest, 2) visibility of the nest from the closest side of the hedgerow and 3) visibility
from the far side of the hedgerow. Bars show raw means ± 1 SE.
Figure 2. Effect of a) nest accessibility (measured with a small ball) and b) distance from
the nearest vantage point, on chick stage failure rate. For a) Bars show predicted mean ±
1 SE failure rates assuming mean hatch date. For b), points show raw data and the line is
predicted from the final model for accessible nests assuming mean hatch date.
Figure 3. Effect of hedgerow management on chick stage nest survival. Bars show
predicted means ± 1 SE assuming mean hatch date and mean brood size, and numbers
indicate sample sizes. Categories of hedgerow management are: LEGG: Overgrown and
leggy; MECH: mechanically cut; RECE: recently laid; REMN: remnant; STOC: unclipped
and stock-proof; and TRIM: trimmed and dense. Letters above bars show where
significant differences lie (L = LEGG; M = MECH; Re = RECE, RM = REMN, S = STOC; T =
TRIM); letters in bold denote differences significant at p<0.05, letters not in bold
denoted marginally significant (P<0.1) differences.
Table 1. Descriptions of variables considered in analyses of a) nest and corvid
characteristics and b) management characteristics considered in nest survival models.
Table 2. Results of univariate tests for the initial base models to assess associations with
whole nest failure rates, followed by screening of explanatory variables against the final
base model for a) Hedgerow characteristics and b) Hedgerow management analyses at
the egg and chick stage separately. Terms with the variable name in bold were included
in interactions to examine the potential for interactions between nest visibility and
predator metrics. Terms where the statistics are highlighted in bold are those that were
highlighted as potentially important at p<0.1 by univariate testing and were thus
included in subsequent multivariate analyses.
Table 3. Results from a conditional logistic regression determining which features
differed between nest sites and random sites within the same hedgerow. 2 values are
from comparison of the final model with and without the term.
25
593
594
595
596
597
598
599
600
601
602
603
604
605
606
607
608
609
610
611
612
613
614
615
616
617
618
619
620
621
622
623
624
625
626
627
628

Table 4. Factors affecting the probability of nest predation at the egg and chick stages. a)
lists variables retained in multivariate GLMMs (at P<0.01) while b) lists variables that
were tested but failed to achieve this level of statistical significance. See section 2.5 for
further details of model selection.
Table 5. Predicted daily nest survival rates (DSR) and whole nest survival rates at the
egg and chick stages separately, and combined, assuming 13-day incubation and chick-
rearing periods. Predictions are for combinations of high and low vegetation access
(Small ball accessibility: Y = high access; N = low access) and high and low corvid
exposure (corvid distance and distance to vantage point: near = high corvid; far = low
corvid), predicted from the final models (Table 4). Continuous variables are predicted at
levels of the 10th and 90th percentiles from the raw data. To test the sensitivity of our
nest survival predictions to the potentially counterintuitive effect of vantage distance,
we re-ran our predictions from the models excluding this variable (figures in brackets).
Table 6. Hedgerow management terms affecting the probability of nest predation at the
egg and chick stages. a) lists variables retained in multivariate GLMMs (at P<0.01) while
b) lists variables that were tested but failed to achieve this level of statistical
significance. See section 2.5 for further details of model selection.
Table 7. Summary statistics (Mean ± SE) and GLMMs comparing vegetation structure
between a) nest sites and b) random locations within the same hedgerow in high (Leggy,
recently laid and remnant) and low (mechanically cut, stock-proof and trimmed; see
Figure 2) predation risk hedgerow managements. For a) GLMMs contain hedgerow
within farm as random terms, and for b) GLMMS contain an additional nested random
term of nest ID (to control for multiple random points per stretch of hedgerow). Small
ball accessibility was not measured at random locations.
26
629
630
631
632
633
634
635
636
637
638
639
640
641
642
643
644
645
646
647
648
649
650
651
652
653
654
655
656

Table 1
a)
Variable Description Median (Range) or levels (for
factors)
Nest height Height of the rim of the nest cup above ground level (m) 1.350 (0.300 – 2.300)
Horizontal depth Shortest horizontal distance of the edge of the nest cup to the nearest hedgerow
edge (m). A hedgerow edge is defined as the beginning of dense thick twigs, as
determined by using the weight of a cricket ball to move any light vegetation out
of the way and determine where the hedgerow ends. Thus, widely spaced, thin
twigs do not constitute the edge, whereas dense thick twigs do.
0.550 (0.050 – 1.800)
Vertical depth Shortest vertical distance of the nest rim to the top of the hedgerow (m) 1.194 (0.200 – 3.650)
Nest volume Maximum vertical x horizontal dimensions (cm3) 1040.0 (117.8 – 5542.0)
Primary speciesa Primary supporting woody plant species Blackthorn, Bramble, Hawthorn,
Rose and Other
Surrounding speciesa Surrounding vegetation not supporting the nest but offering protection Bramble, Ivy, Rose, None and
Other
Cross-sectional area Hedgerow height at the nest x hedgerow width at the nest (each ± 5 cm; area in
m2). Height and width were measured so as to include woody hedgerow
vegetation and recent growth, but exclude trees
5.57 (1.23 – 22.5)
Light penetration Assessed using two light meters (Wavetek Metreman LM631; range 0.01 – 20,000 0.011 (0.001 – 0.226)
27
657
658
659

Lux) to assess the amount of light penetration above the nest relative to light
levels outside the hedge. Only nests for which simultaneous measures from inside
and outside the hedgerow (egg n=158; chick n=147) were included in analyses as
the variable used was the ratio of light level above the nest to light level outside
the hedgerow
Horizontal visibilityab Maximum value of a measure from each side of the hedgerow. Assessed using a
14cm x 14cm black card containing a 5 x 5 regular grid of white circles (diameter
12 mm). The card was placed adjacent to each side of the nest (parallel to the
hedgerow side) and viewed from three different angles (-45˚, 90˚ and +45˚ to the
nest). The number of circles that were at least 75% visible at each angle was
summed for each side of the hedgerow, to give a measure (range 1-75) of
horizontal visibility on each side of the hedgerow.
4.11 (0-23)
Vegetation covera % vegetation cover above the nest assessed using a digital photograph taken by
placing a Casio EX-Z3 digital camera (set at the widest field of view) on the base of
the nest facing vertically upwards. Photoshop software (v 7.0.1) was used to
determine the proportion of pixels of sky in the image and thus the % vegetation
cover above the nest
96.23 (70.40-99.99)
Small ball accessibility Accessibility assessed by attempting to manoeuvre a baseball (circumference 30.5
cm) from the edge of the hedgerow to the nest by any route above or level with
the nest without breaking any woody vegetation. We assessed whether or not the
ball could reach the nest
Yes or No
28

Large ball accessibility Accessibility assessed by attempting to manoeuvre a football (circumference 69
cm) from the edge of the hedgerow to the nest by any route above or level with
the nest without breaking any woody vegetation. We assessed whether or not the
ball could reach the nest
Yes or No
Corvid distance Distance to nearest corvid nest (m) 270 (40 – 1350)
Wood distance Distance to nearest wood, copse, spinney or woodland strip (at least 5m wide) 170 (5 – 645)
Vantage distance Distance to nearest tree, pylon, telegraph pole or any other vantage point >5m in
height (m)
40 (3-300)
Corvid abundance Mean abundance of corvids per km, per site per year. 7.167 (0 – 28.830)
a variable included in nest site selection analysisb visibility on each side of hedgerow included in nest site selection analysis as two separate variables but combined (as maximum visibility from
either side of the hedgerow) for nest failure analyses
29
660
661
662
663
664
665
666

b)
Variable Description Median (Range)
Aspect Aspect of hedgerow E-W, N-S, NE-SW and SE-NW
Hedgerow management Category: remnant (REMN), recently laid (RECE), mechanically
cut (MECH), trimmed but dense (TRIM), overgrown and leggy
(lacking branches and foliage in the bottom 1 m of the hedgerow;
LEGG) or uncut and stock-proof (STOC) (from Bickmore, 2002;
see Table 7 for further details of structure)
Leggy, Mechanically trimmed Remnant, Recently
laid, Trimmed but dense, Stock-proof
Cutting style Hedgerow shape. Categorised as: ‘A’ shaped (at least 2 cuts),
Chamfered (at least 4 cuts), box (at least 3 cuts), free growth on
top (only two sides cut), or free growth all round (uncut)
‘A’ shaped, Chamfered, Box, Free growth on top, or
Free growth all round
% gaps The % gaps (± 5 %) within the 30m hedgerow section 0 (0 – 30)
Number of trees Number of trees >10m in height within 30m hedgerow section 0 (0 – 6)
Recent trim Whether or not a hedgerow had been trimmed in the last 5 years Trimmed or not
Last cut Years since last cut 1 (1 – 4)
Margin width Average width of herbaceous vegetation on both sides of the
hedgerow (± 1 m)
2.0 (1.0 – 3.5)
30
667
668
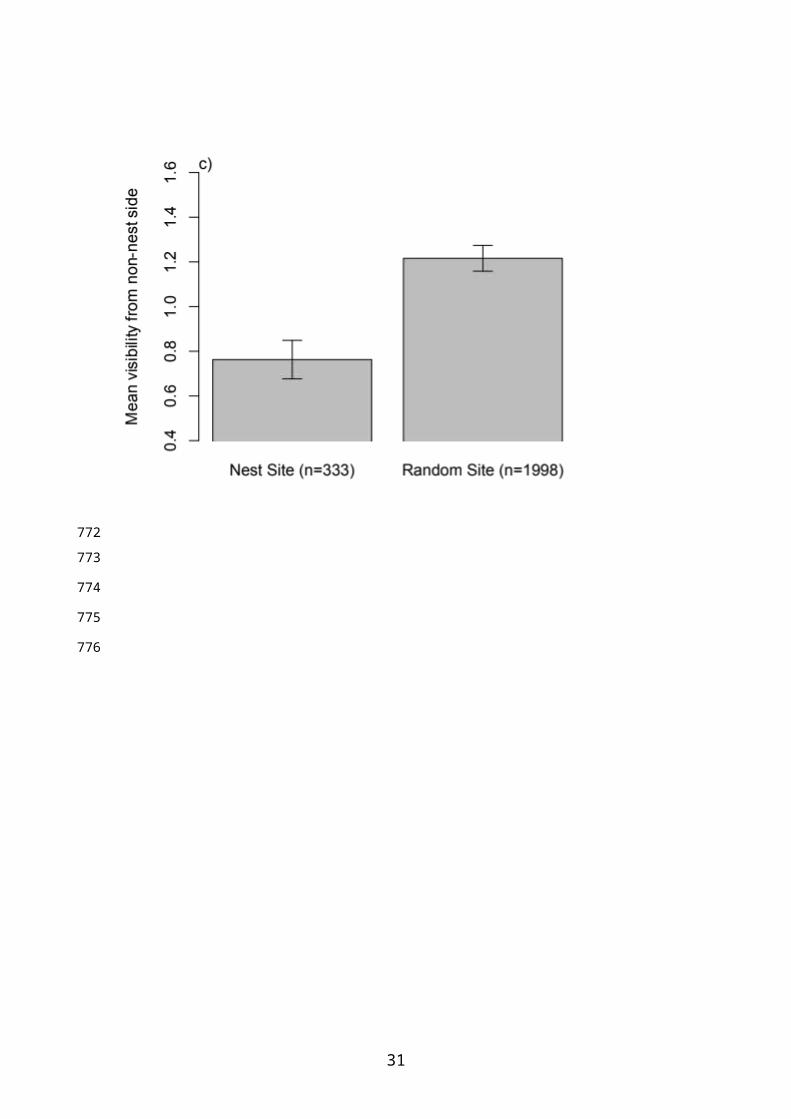
Table 2.
a Egg stage Chick stage
Base model Slope SE df 2 p Slope SE df 2 p
First egg date/Hatch date -0.014 0.007 1 4.529 0.038 -0.013 0.006 1 5.395 0.020
First egg date2/Hatch date2 -0.001 0.001 1 0.509 0.476 -0.001 0.001 1 1.753 0.186
Clutch size/Brood size -0.892 0.168 1 28.617 <0.001 0.261 0.172 1 2.459 0.117
Species 5 6.356 0.273 4 1.039 0.904
Year 0.066 0.351 1 0.036 0.850 -0.078 0.337 1 0.053 0.818
Univariate tests
Nest height 0.034 0.555 1 0.004 0.950 -0.620 0.561 1 1.226 0.268
Horizontal depth -0.228 0.465 1 0.239 0.625 0.678 0.793 1 0.713 0.399
Vertical depth -0.209 0.251 1 0.716 0.398 0.046 0.277 1 0.027 0.870
Nest volume 0.092 0.217 1 0.177 0.674 0.063 0.254 1 0.063 0.802
Primary species 4 8.461 0.076 4 2.887 0.577
Surrounding species 4 0.657 0.957 4 1.618 0.806
Cross sectional area -0.012 0.043 1 0.074 0.786 -0.062 0.274 1 0.051 0.821
Light penetration 4.552 4.318 1 1.024 0.312 -3.760 5.898 1 0.443 0.506
Horizontal visibility 0.162 0.170 1 0.883 0.347 -0.041 0.187 1 0.049 0.825
Vegetation cover -0.886 1.318 1 0.445 0.505 0.987 1.375 1 0.533 0.466
Small ball accessibility 0.095 0.413 1 0.054 0.817 0.942 0.541 1 3.627 0.057
Large ball accessibility -0.062 0.327 1 0.036 0.850 -0.225 0.365 1 0.392 0.531
31
669
Corvid distance -0.462 0.265 1 2.965 0.085 0.077 0.231 1 0.111 0.739
Vantage distance -0.002 0.003 1 0.691 0.406 0.290 0.132 1 4.680 0.031
Corvid abundance -0.014 0.029 1 0.248 0.619 -0.010 0.268 1 0.002 0.969
b Egg stage Chick stage
Base model Slope SE df 2 p Slope SE df 2 p
First egg date/Hatch date -0.013 0.006 1 0.860 0.354 -0.014 0.006 1 6.395 0.011
First egg date2/Hatch date2 -0.001 0.001 1 1.093 0.296 -0.001 0.001 1 0.366 0.545
Clutch size/Brood size -0.877 0.169 1 25.176 <0.001 0.334 0.174 1 3.977 0.046
Year 0.411 0.369 1 1.666 0.197 -0.492 0.319 1 2.330 0.127
Species 5 4.469 0.484 5 3.411 0.637
Univariate tests
Aspect 3 4.095 0.251 3 0.120 0.989
Hedgerow management 5 3.481 0.626 5 19.132 0.002
Cutting style 4 3.324 0.505 4 7.587 0.108
% gaps -0.031 0.035 1 0.887 0.346 0.021 0.026 1 0.654 0.419
Number of trees 0.116 0.320 1 0.131 0.718 -0.643 0.363 1 3.444 0.063
Recent trim 0.881 0.656 1 2.108 0.147 -1.047 0.441 1 4.990 0.025
Last cut -0.400 0.228 1 3.265 0.071 0.259 0.149 1 2.772 0.096
Margin width 0.081 0.250 1 0.105 0.746 -0.059 0.262 1 0.051 0.821
32
670
671

Table 3.
Variable df 2 p
Vegetation cover 1 31.18
9
<0.001
Horizontal visibility (non-nest side) 1 18.56
8
<0.001
Horizontal visibility (nest side) 1 17.75
1
<0.001
Surrounding species 5 20.77
3
<0.001
Primary species 4 9.845 0.043
33
672
673
674
675
676
677

Table 4.
a Egg stage Direction Chick stage Direction
Variable df 2 p of effect df 2 p of effect
First egg date/Hatch date 1 0.534 0.465 -ve 1 7.737 0.00
5
-ve
Clutch size/Brood size 1 23.462 <0.001 -ve - - - N/A
Corvid distance 1 2.965 0.085 -ve - - - N/A
Vantage distance - - - N/A 1 4.52 0.03
4
+ve
Small ball accessibility - - - N/A 1 3.656 0.05
6
See Fig 2
b Egg stage Chick stage
Variable df 2 p df 2 p
Primary species 4 6.094 0.192 - - -
Vegetation cover x Corvid abundance 1 0.461 0.497 1 0.515 0.473
Vegetation cover x Corvid distance 1 0.001 0.972 1 0.334 0.563
34
678
679
680
681
682

Table 5.
High access, high corvid Low access, high corvid High access, low corvid Low access, low corvid
Predicted egg stage DSR 0.953 (0.953) 0.953 (0.953) 0.981 (0.981) 0.981 (0.981)
Predicted chick stage DSR 0.977 (0.963) 0.991 (0.985) 0.942 (0.963) 0.976 (0.985)
Predicted egg-stage survival 0.533 (0.533) 0.533 (0.533) 0.781 (0.781) 0.781 (0.781)
Predicted chick stage survival 0.743 (0.609) 0.886 (0.824) 0.461 (0.609) 0.728 (0.824)
Predicted overall nest survival 0.396 (0.325) 0.472 (0.439) 0.360 (0.476) 0.569 (0.644)
35
683
684
685

Table 6.
a Egg stage Direction Chick stage Direction
Variable df 2 p of effect df 2 p of effect
First egg date/Hatch date - - - N/A 1 10.155 0.001 -ve
Clutch size/Brood size 1 37.636 <0.001 -ve 1 1.388 0.239 +ve
Hedgerow management - - - N/A 5 12.200 0.032 See Fig 3
Last cut 1 3.265 0.071 -ve - - - N/A
b Egg stage Chick stage
Variable df 2 p df 2 p
Recent trim - - - 1 0.744 0.389
Last cut - - - 1 0.148 0.700
Number of trees - - - 1 0.868 0.352
36
686
687
688
689
690
Table 7.
a)
Variable High predation risk Low predation risk 2 p
Vegetation cover 93.77 ± 0.62 93.85 ± 0.41 0.15 0.70
Horizontal visibility (nest side) 3.97 ± 0.53 3.72 ± 0.28 1.38 0.24
Horizontal visibility (non nest side) 1.10 ± 0.22 0.68 ± 0.10 0.01 0.95
Horizontal visibility 2.54 ± 0.32 2.20 ± 0.16 0.53 0.47
Small ball accessibility (%) 91.3 ± 0.03 81.5 ± 0.03 3.03 0.08
b)
Variable High predation risk Low predation risk 2 p
Vegetation cover 90.72 ± 0.42 91.79 ± 0.23 0.01 0.96
Horizontal visibility (nest side) 4.15 ± 0.21 3.08 ± 0.10 3.13 0.08
Horizontal visibility (non nest side) 2.02 ± 0.15 0.98 ± 0.06 18.67 <0.01
Horizontal visibility 3.08 ± 0.16 2.03 ± 0.07 6.63 0.01
37
691
692
693
694
695
696

Appendix 1. Correlation matrix for all continuous variables highlighted as potentially important by univariate analysis. Figures represent the
correlation co-efficient from a Pearson’s product moment test. Correlations significant at p<0.05 are highlighted in bold.
1)
Horizontal depth Vegetation cover Horizontal visibility Corvid abundance Corvid distance
Vegetation cover -0.04 - - - -
Horizontal visibility 0.05 -0.35 - - -
Corvid abundance -0.02 0.01 -0.05 - -
Corvid distance -0.07 -0.02 -0.06 -0.18 -
Vantage distance -0.03 -0.02 -0.02 -0.10 0.04
38
697
698
699
700
701
702

Appendix 2. Effect of distance from the nearest corvid nest on egg stage failure rate. Points show raw data; line is predicted from the final model
(Table 4) assuming mean hatch date and brood size.
39
703
704
705
706
707

Appendix 3. Effect of timing of last cut on egg stage nest failure rate. Bars show raw means ± 1 SE; last cut is analysed as a continuous variable but
displayed categorically for clarity
40
708
709
710
711
712


![QUANTIZATION TECHNIQUES - Shodhgangashodhganga.inflibnet.ac.in/bitstream/10603/25341/8/08... · 2018-07-09 · 3.3 VECTOR QUANTIZATION: Vector quantization [10, 11] is a process by](https://img.pdfslide.us/doc/110x75/5e5f8dd3f520f53a2949b994/quantization-techniques-2018-07-09-33-vector-quantization-vector-quantization.jpg)