Embed Size (px)
Citation preview

DBJ Discussion Paper Series, No.1003
Can Analysts Analyze Mergers?
Hassan Tehranian (Boston College)
Mengxin Zhao
(University of Alberta) and
Julie L. Zhu (Boston University)
September 2010
Discussion Papers are a series of preliminary materials in their draft form. No quotations,
reproductions or circulations should be made without the written consent of the authors in
order to protect the tentative characters of these papers. Any opinions, findings,
conclusions or recommendations expressed in these papers are those of the authors and do
not reflect the views of the Institute.


1
Can Analysts Analyze Mergers?
Hassan Tehranian Mengxin Zhao Julie L. Zhu
Boston College University of Alberta Boston University
[email protected] [email protected] [email protected]
Abstract
We examine how mergers and acquisitions (M&As) shape analyst coverage decisions and
whether this process affects research quality and reveals information about future performance of
merged firms. Since the target firm is delisted after the completion of the M&A transaction, we
expect the analysts covering the target firm to drop coverage of the merged firm. While most of the
target analysts do drop coverage, those target analysts who retain coverage provide the most
accurate earnings forecasts. Moreover, the long-run stock performance of the merged firm
increases with the fraction of target analysts retaining coverage. However, we do not find this
relation with acquirer analysts. Our results suggest that target and acquirer analysts go through
different decision processes, and target analysts prefer to cover merged firms that they can forecast
accurately and firms that are undervalued.
Keywords: Mergers and acquisitions, analyst coverage, forecast accuracy, stock performance.
JEL Classifications: G24, G29, G34.
Previous versions of the paper were circulated under the title “Analyst coverage around mergers and acquisitions.” We
appreciate helpful comments from Huasheng Gao, Amy Hutton, Wei Jiang, Bin Ke, Gennaro Bernile, Darren Kisgen, R.
David McLean, Krishnagopal Menon, Michael Mikhail, K. Ramesh, Stephen Ryan, Suraj Srinivasan, An Yan, and
seminar/session participants at City University of Hong Kong, Columbia Business School, Copenhagen Business
School, the AAA meetings in Chicago, the China International Conference in Finance (Guangzhou), and the Financial
Intermediation Research Society meetings in Florence. We also thank sell-side analysts Greg Alexopoulos (Morgan
Stanley), Li Bin (Merrill Lynch), Hongyu Cai (Goldman Sachs) and GuoJia Zhang (Delaware Investor) for providing
institutional insights. The authors are responsible for all remaining errors.
2
I. Introduction
An extensive literature examines the performance of mergers and acquisitions (M&As), and
finds that investors suffer substantial losses after some large scale M&A transactions.1 Since
financial analysts have expertise and private information on the firms they cover, a natural question
is what investors can learn from the analysts covering merging firms about the M&A transaction. In
particular, large scale M&As not only reshape merging firms, but also lead to significant changes in
analyst coverage of these firms. So far there has been little work linking analysts‘ decisions to add,
drop and maintain coverage of merging firms to the prospects and future performance of M&As.
With a large sample of M&A transactions during 1985-2005, this paper examines coverage
decisions of three groups of analysts: those covering the target firm (target analysts), those covering
the acquiring firm (acquirer analysts), and those who do not cover either merging firm (new analysts)
prior to the M&A deal. This paper is also the first to examine whether coverage decisions of
different groups of analysts reveal information regarding how well they can forecast the earnings of
the merged firm and the current valuation of the merged firm.
One of our key results is that M&As lead to different coverage decision processes for target
analysts and acquirer analysts. The target is delisted following a successful M&A deal (we focus on
publicly listed acquirer and target firms), while the acquiring firm continues its operations after
absorbing the target‘s assets. Moreover, many acquiring firms are large conglomerates while most
targets are small firms with fewer business segments. Therefore, the decision of target analysts to
cover the merged firm is similar to initiating coverage for a new firm that is much larger and more
complex, while acquirer analysts decide whether to continue covering the acquiring firm. Hence, we
expect that target analysts are less likely to retain coverage for the merged firm than acquirer
1 For example, Loughran and Vijh (1997) and Rau and Vermaelen (1998) find stock mergers underperform cash mergers,
and Shelifer and Vishny (2003) attribute this to stock market driven merger decisions. Moeller, Schlingemann, and
Stulz (2005) documents substantial losses of acquiring firms‘ shareholders during the late 1990s.
3
analysts. Consistent with this prediction, we find that the probability of a target analyst retaining
coverage for the merged firm is 18% lower than that of an acquirer analyst. In diversifying mergers,
target analysts are 26% more likely to drop coverage than acquirer analysts.
An interesting question is why some target analysts choose to cover the merged firm
following the delisting of the target. One reason is that these staying target analysts have superior
knowledge of both merging firms and the M&A transaction. This may not be true for acquirer
analysts, since they simply decide whether to extend coverage for essentially the same firm.
Therefore, the remaining target analysts can be more accurate in forecasting earnings for the merged
firm than the remaining acquirer analysts. We find that the target analysts who choose to retain
coverage are the most accurate in forecasting earnings among all the analysts covering the merged
firms (including newly added analysts). The forecast error of a remaining target analyst is 6% lower
than that of a remaining acquirer analyst. The difference in forecast errors between these two groups
of analysts is 16% after a diversifying merger, where the information loss from the delisting of the
target is more severe as compared to a related merger. Hence, the knowledge of the target,
possessed by the remaining target analysts but not necessarily by (remaining) acquirer analysts, can
lead to more accurate forecasts. We also find a positive and significant relationship between the
accuracy of the consensus forecast of the merged firm and the fraction of target analysts retaining
coverage. However, we do not find this relation for acquirer analysts.
Prior literature shows that analysts are reluctant to publicly criticize firms that they cover, but
overly optimistic opinions about the firms may tarnish analysts‘ reputation.2 These conflicting
incentives suggest that analysts are more likely to cover firms for which their (private) assessment is
more favorable. In our M&A context, this implies that another reason a target analyst chooses to
2 There is an extensive strand of literature on how analysts‘ reputation, institutional investors‘ evaluation of analysts‘
research, and investment banking relationships affect the accuracy of analysts‘ earnings forecasts and recommendations
(see, e.g., Stickel, 1992; Lin and McNichols, 1998; Michaely and Womack, 1999; Dechow, Hutton, and Sloan, 2000;
Hong and Kubik, 2003; and Michaely and Womack, 2005, for a review).

4
cover the merged firms is because she holds a favorable assessment of the merger. If this is the case,
we should expect a positive relationship between the fraction of target analysts retaining coverage
and future performance of the merged firm. Once again, this relation may not hold for acquirer
analysts because they are not forced to make a coverage decision for a new firm like target analysts
do. Consistent with these predictions, we find that the fraction of target analysts who choose to
retain coverage is positively associated with the long-term abnormal stock performance of the
merged firm. This result is robust to different performance measures and persists after controlling
for firm and M&A deal characteristics. We do not find such a relation for the fraction or the number
of staying acquirer analysts. We also find some evidence that merged firms that attract a greater
number of new analysts have better future stock performance.
Regarding the determinants of analysts‘ coverage decisions, we find that an analyst, covering
either the acquiring or target firm before the M&A deal, is more likely to retain coverage in deals
with more favorable market reaction and when the acquirer is larger and has higher past return on
assets. These results suggest that analysts are attracted to transactions that may lead to more future
business for investment banks. We also find that an analyst‘s reputation increases the likelihood of
providing coverage for the merged firm, but she is more likely to drop coverage when the acquiring
firm is a conglomerate.3 These findings suggest that increased information uncertainty which results
from the M&A transaction discourages analysts, especially those with inferior forecasting ability, to
retain coverage. Finally, we find that target analysts are more likely to provide coverage when a
greater fraction of the deal is paid by the acquirer‘s stock, and the superiority of forecasting accuracy
of the remaining target analysts over acquirer analysts is also more pronounced in these deals.
These results again demonstrate that target analysts‘ coverage decision can affect the information
3 For the literature on the determinants of analyst coverage, see, for example, Bhushan (1989), Bhushan and O‘Brien
(1990), Brennan and Hughes (1991), and Barth, Kasznik, and McNichols (2001). In particular, prior literature shows
that the quality of analyst coverage is a major determinant in firms‘ choice of underwriters (e.g., Mikhail, Walther, and
Willis, 1999; Krigman, Shaw, and Womack, 2001; Clarke et al., 2007).
5
environment in M&A deals with more complexity and uncertainty.
Our paper contributes to the literature on M&As and the literature on the role of analysts in
facilitating information transmission. Most of the literature studying the long-term stock
performance of post-merger firms focuses on firm and deal characteristics without examining how
analysts‘ coverage decisions can reveal prospects of the M&A transaction and future performance.
We extend this literature by documenting that, as a group, the target analysts who choose to provide
coverage for the merged firm can predict better long-term stock performance.4 McNichols and
O‘Brien (1997) track a small group of individual analysts‘ decisions of adding and dropping
coverage and link these decisions to the degree of optimism in their research reports. By contrast,
we focus on how M&As affect different groups of analysts‘ decisions to initiate, retain or drop
coverage of the merged firms, and examine how the coverage decisions affect research quality and
long-term performance of the merged firms.5 Das, Guo and Zhang (2006) examine analyst coverage
decisions and the performance of IPO firms. They find that greater (unexpected) analyst coverage is
associated with better firm performance. Fundamental differences between the two types of
corporate events help to differentiate our work from theirs. IPOs introduce private firms to the
capital markets for the first time, and thus all the analysts are ‗symmetric‘ in that they decide
whether to initiate coverage for firms with no prior coverage. Large scale M&As, however, lead to
significant changes to merging firms that already have analyst coverage. Hence, we can compare
analysts covering the target vs. those covering the acquirer, and find that these two groups of
analysts go through different coverage decision processes, leading to different implications for the
4 These results also extend the literature on the investment value of analysts‘ research, which generally focuses on the
overall and specific aspects of analysts‘ earnings forecasts and recommendations (e.g., Stickel, 1995; Womack, 1996;
Barber et al., 2001; Chen and Jiang, 2006).
5 Prior research also finds that the effectiveness of analysts as information intermediaries is weakened in environments
with heightened information uncertainty, such as those generated by large scale M&As (e.g., Abarbanell and Bernard,
1992; Zhang, 2008). However, this line of research focuses on how changes in firms affect the information transmission
process without examining the impact of changes in analysts on research quality of the firms.
6
information environment at merged firms.
Section II describes the M&A sample and analyst data, and Section III presents results on the
determinants of analyst coverage decisions, the effects of analyst turnovers on the research quality of
the merged firms, and whether the turnovers reveal information on the future performance of merged
firms. Section IV concludes. The Appendices contain explanations of all the variables.
II. Data
M&A sample
The initial sample is extracted from the Securities Data Company‘s (SDC) M&A database
based on the following criteria: (1) an M&A deal is announced between January 1, 1985 and
December 31, 2005; (2) both the acquiring and target firms are publicly listed and traded in the U.S.;
(3) the mode of the deals is ―merger‖ or ―acquisition‖; and, (4) the status of the deal is ―completed.‖
These criteria yield a sample of 6,662 deals. For each completed deal, we manually cross-check the
accuracy of the information from SDC using both the CRSP and Dow Jones News Retrieval
Services to exclude those deals in which the target firm is delisted for reasons other than the M&A.
We also require that both target and acquiring firms are included in the CRSP database and S&P‘s
COMPUSTAT Research Tape, from which financial statement and stock price data are extracted.
These additional filters reduce the sample size to 4,009 deals.
We further require each acquiring firm in the sample to have a one-year pre-event window
and a one-year post-event window during which there is no other M&A transaction. This
requirement ensures that any change in analyst coverage and/or their research quality is not
confounded by multiple events of the same acquirer thus reducing our sample to 2,260 deals.
Finally, we require that the size of the target firm to be at least 5% of the size of the acquiring firm

7
and that the deal value is at least $10 million.6 We impose these criteria so that the M&A
transactions in our sample represent substantial investment for the acquiring firms, and they render
our final sample of 1,787 deals from 1985 to 2005.
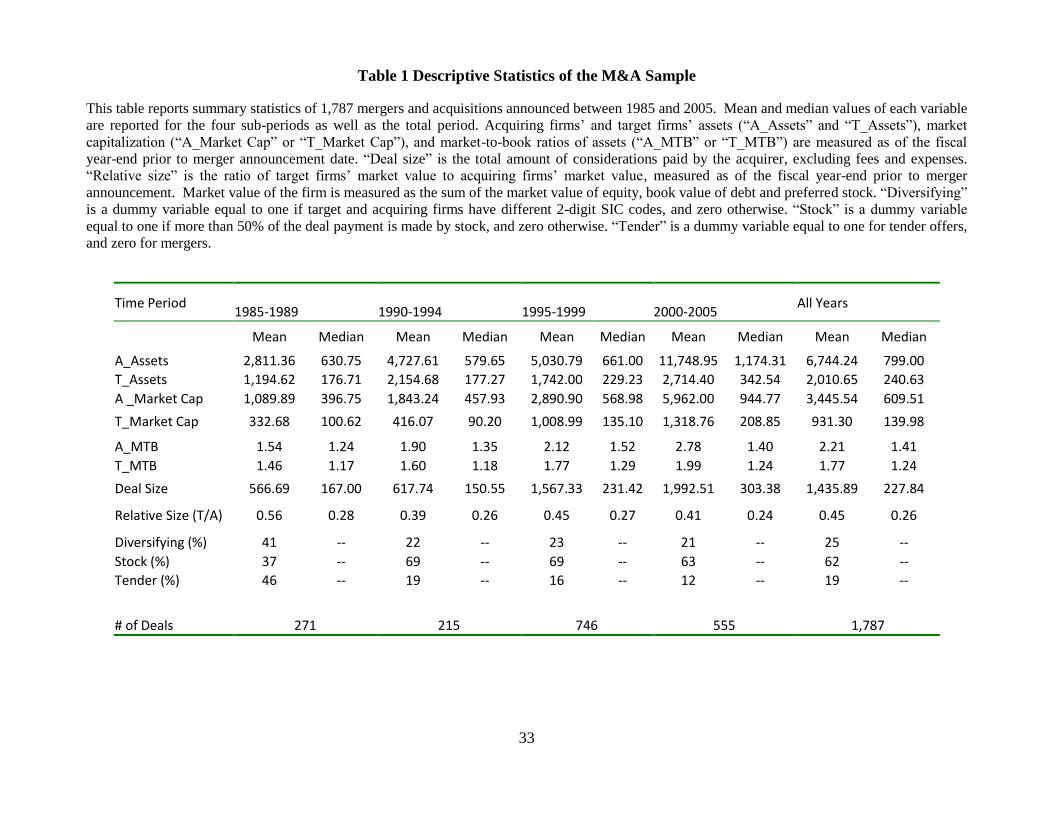
Table 1 provides descriptive statistics for our M&A sample, which is also divided into four
sub-sample periods. Not surprisingly, most of the deals are announced during the booming stock
market of the late 1990s; the average deal value increased from $567 million in the late 1980s to
$1,993 million after 2000. One quarter of the 1,787 transactions are diversifying mergers, defined
by the target and acquiring firms having different 2-digit SIC codes. Sixty-two percent (thirty-eight
percent) of the transactions are stock (cash) acquisitions, defined as more than half of the deal value
financed by the acquirer‘s stock (cash); 81% of the transactions are mergers and the remaining 19%
are tender offers. There is a significant drop in the number of tender offers in the 1990s and a
significant increase in stock-financed mergers (as compared to the 1980s), consistent with previous
studies (e.g., Holmstrom and Kaplan, 2001). Table 1 also shows that on average the acquirer is
more than twice as large as the target in terms of enterprise value (the median acquirer to target ratio
is about four to one). The acquirer‘s market-to-book ratio tends to be higher than that of the target,
suggesting that (relatively) more highly valued firms tend to acquire less highly valued ones (e.g.,
Shleifer and Vishny, 2003).
Data on analysts and turnovers around M&As
We construct a panel data set of over 49,000 one-year-ahead earnings forecasts for the
sample firms around M&A transactions made by 19,000 deal-specific analysts (i.e., some analysts
may cover multiple deals). We merge data on individual analysts and their affiliated investment
banks with the characteristics of merging firms, industries and M&A deals. Information on analysts‘
6 Firm size is measured by the ―enterprise value,‖ or the sum of market value of equity, book value of debt, and preferred
stocks at the fiscal year end prior to the M&A announcement.

8
one-year-ahead earnings forecasts is obtained from the I/B/E/S Detailed History file.
Comprehensive data coverage by I/B/E/S began in 1985, the first year of our M&A sample.
Figure 1 plots analyst turnovers for the merging firms around M&As. To avoid obtaining
noisy earnings forecasts immediately before an M&A transaction, we define ―pre-merger analysts‖
as those who provide one-year-ahead earnings forecasts for the fiscal year prior to the deal
announcement year (Year –1). Similarly, in order to avoid contaminated earnings forecasts after
deal completion, we define ―post-merger analysts‖ as those who provide one-year-ahead earnings
forecasts for the fiscal year following the deal completion year (Year +1). Accordingly, an analyst
who has covered either merging firm retains coverage of the merged firm if she is both a ―pre-
merger analyst‖ and a ―post-merger analyst.‖ Using these definitions, Figure 1 shows an increase in
analyst coverage changes around M&A deals; i.e., from Year −1 to +1, especially for target firms.
During the two years before the deal announcement date (Year −3 to −2 and from Year −2 to −1),
about 30% of the analysts drop coverage for the acquiring firm per year. An average of fourteen
analysts covers the acquiring firm in Year −1 and 55% of these analysts drop coverage for the
merged firm in Year +1. For the target firms, during the two years prior to deal announcement,
around 32% of target analysts drop coverage each year. An average of eight analysts covers the
target firm in Year −1 and 78% of these analysts drop coverage after the M&A transaction. Among
the analysts covering the merged firm (fifteen analysts), about half of them did not cover either
merging firm prior to the M&A transaction. This is significantly higher than the ‗normal‘ (initiation)
rate of around 30% per year (not shown in the graph).
These seemingly high turnover rates around M&As are in part driven by the event window as
defined above (from Year −1 to +1). Using our definitions, an analyst would have to cover a
merging firm for three or more years in order to be classified as retaining coverage for the merged
firm—the completion of many M&A transactions (from deal announcement date) takes more than

9
one year. We also construct an alternative set of measures using a shorter, calendar-year based event
window to correct for the possibly overstated analyst turnover measures. Not surprisingly, the
turnover rates based on these new measures are lower, with 40.3% of acquiring firm analysts and
71.6% of target analysts dropping coverage in Year +1, and 37.1% of analysts initiating coverage of
the merged firms. The details from the construction of these two sets of measures are presented in
Appendix A. We also rerun all the empirical tests based on the alternative turnover measures and all
of our main results remain unchanged. See Section III.4 below for more details.7
III. Empirical Tests and Results
In this section we first examine determinants of analyst coverage decisions. Next, we
compare the coverage decisions between target and acquirer analysts and examine the effects on
research quality of merged firms. In our final set of tests, we examine the relationship between the
fraction of analysts retaining coverage and the long-run stock performance of merged firms. We
briefly discuss a number of robustness checks at the end of the section. Appendix B lists all the
variables used in the paper.
III.1 Determinants of analyst coverage around M&As
We use the following Probit model to examine individual analyst‘s coverage decisions:
Prob(an analyst retaining coverage =1) = α + { Acquiring firm variables } + { Deal variables}
+ {Analyst variables} + {Other controls} + ε. (1)
The dependent variable equals one if an acquirer analyst (Panel A of Table 2), a target analyst (Panel
7 We also find (not reported) that there are significant cross-sectional variations in analyst turnovers across deals and the
twelve industries, as classified by Fama and French (1997). The utility industry experiences the highest percentage of
analysts dropping coverage after M&As (66.3% for acquirer analysts and 83.8% for target analysts), followed by the
business equipment and telecommunications industries (62.2% for acquirer analysts and 75.4% for target analysts). The
non-durable goods industry has the best record in retaining analyst coverage (47.6% for acquirer analysts and 68.0% for
target analysts). In our empirical tests below we include industry dummies as controls.

10
B), or either an acquirer or target analyst (Panel C) continues to cover the post-merger firm, and zero
otherwise. We report marginal probabilities in all the panels. We include three sets of explanatory
variables: measures of analyst research quality and reputation, characteristics of the acquiring firm
and of the M&A transaction. All the analyst and firm variables are measured as of the fiscal year
end immediately before the year in which the M&A deal is announced. We also include year and
industry dummy variables in all the models. Standard errors are clustered by analyst to allow for
possible dependence in coverage decisions (of multiple firms) made by the same analyst.
During our interviews with analysts, they informed us that corporate clients often cite the
quality of analyst coverage as a major determinant in their choice of underwriters. This is also
supported by recent research (e.g., Krigman, Shaw, and Womack, 2001; Clarke et al., 2007). Hence,
we expect that higher quality and more reputable analysts are more likely to retain coverage after the
M&A transaction is completed. We measure an analyst‘s reputation by whether she has been
selected as an ―All Star‖ analyst by the Institutional Investors magazine prior to the M&A deal and
whether she works for a top tier investment bank.8 The research quality of an analyst is measured
from several dimensions: 1) the number of years an analyst has issued earnings forecasts in I/B/E/S
prior to deal announcement (Experience); 2) whether she has covered firms from the other merging
firm‘s industry (Cross_Cover); and 3) the accuracy of her earnings forecasts for a merging firm prior
to the current M&A deal (FE).9
Panels A and B of Table 2 shows that an analyst, covering either the acquiring or the target
firm, is more likely to retain coverage of the merged firm if she has been elected an ―All Star‖ prior
8 Following prior work, the reputation of an investment bank is measured by the binary variable ―IB Reputation,‖ which
equals one if the investment bank is a top-tier bank. We identify top-tier investment banks as the ten underwriters with
the highest Carter-Manaster ranking (Carter and Manaster, 1990).
9 Following prior research, we define forecast error as the absolute value of the difference between an analyst‘s first
earnings forecast and the actual earning (scaled by the firm‘s stock price during the forecasting month). We focus on the
unsigned forecast errors because prior literature finds that when analysts face conflicts of interest, they can either be
optimistic or pessimistic in their forecasts. Thus, while the sign of the earnings forecast error can be positive or negative,
more accurate forecasts (and higher research quality) correspond to smaller magnitudes in the forecast error.

11
to the M&A deal or covered the other merging firm‘s industry (―Cross Cover‖ dummy equals 1).
Analysts‘ years of work experience and their affiliation with a top-tier investment bank increase the
likelihood of an acquirer analyst maintaining her coverage of the merged firm. However, these
attributes do not seem to matter in target analysts‘ decision. If a target analyst is more accurate in
her earnings forecasts, proxied by her earnings forecast error (scaled by stock prices) prior to the
M&A deal, she is more likely to retain coverage of the merged firm,10
but forecast accuracy does not
appear to affect an acquirer analyst‘s retention decision.
Prior research suggests that analysts‘ compensation is tied to their success in generating
investment banking business and trading commission for their employers (e.g., Stickel, 1992;
Michaely and Womack, 1999). Hence, we expect that analysts are more likely to cover merged
firms that can generate more trading and banking business in the future. Consistent with the benefits
of providing coverage, Panels A and B indicate that an analyst (covering either merging firm) is
more likely to retain coverage if the acquiring firm is larger (A_mktcap) and has higher return on
assets (A_ROA). In addition, the likelihood of retaining coverage for either an acquirer or target
analyst also increases for acquiring firms with higher abnormal returns (A_CAR).11
These measures
indicate the market‘s enthusiasm toward the deal, which can also lead to more investment banking
and trading business. Higher returns on assets and abnormal returns for the acquiring returns can
also proxy for higher-quality M&A deals, and these deals are attractive for both groups of analysts.
A large M&A transaction will likely give rise to or exacerbate information uncertainty of the
merged firm, making it more costly for analysts to gather and process information as compared to
the stand alone firms prior to the M&A deal. Therefore, we expect that the cost of providing
coverage for the merged firm increases with the scale and complexity of the integration process
10
This is consistent with the findings in Mikhail et al. (1999) and Hong and Kubik (2003), among others, that an analyst
is more likely to experience turnover if her forecast accuracy is lower than her peers.
11
The variable ‗A_CAR‘ is calculated using different event windows (in days): (-1, +1), (-3, +3), (-5, +5), and between
deal announcement and completion dates.

12
between the two merging firms. Consistent with the cost of providing coverage, Panels A and B
indicate that both acquirer and target analysts‘ retention decisions are inversely related to the
acquirer‘s conglomerate status (‗A_Conglomerate‘ dummy). An acquiring firm being a
conglomerate, i.e., one with multiple business segments before the pending M&A deal is associated
with a greater degree of information asymmetry, and thus higher costs for analysts to provide
coverage.
One of the unique aspects of using M&As as our empirical setting is that it allows us to
separately examine the coverage decisions of analysts following the target firm vs. those covering
the acquiring firm. The completion of an M&A transaction indicates the end of the target firm as a
publicly listed standalone company, while the acquirer moves on after taking over the target‘s assets
and operations. In our sample, many acquiring firms are large conglomerates while most targets are
much smaller firms with fewer business segments. These facts imply two different decision
processes: 1) target analysts decide whether to initiate coverage for a firm that is larger and more
complex; and 2) acquirer analysts decide whether to continue covering the same firm. Since
analysts suffer a reputation loss from poor research quality when covering firms that they are not
familiar with, we expect that target analysts, most of whom are industry specialists (of the target
firms), are more likely to drop coverage after the M&As than acquirer analysts, especially after
diversifying mergers.12
The results in Panels A and B of Table 2 support these conjectures. First, the average size of
the firms covered by a target analyst prior to the current M&A deal (Avg_mktcap) is positively
related to the likelihood of covering the merged firm (Panel B: the coefficients in all the models are
significant at 1%). We do not observe such a relation for acquirer analysts. Second, the experience
12
With a sample of 103 focus-increasing spinoffs, Gilson et al. (2001) find that firms experience a significant increase in
coverage by analysts that specialize in subsidiary firms‘ industries after the spinoff. These specialists contribute to an
increase in analyst forecast accuracy.
13
of cross-industry coverage seems to play a much more significant role in a target analyst‘s retention
decision than for an acquirer analyst. A target analyst who has covered the acquirer industry is
13.3% to 17.8% more likely to cover the merged firm than those without such experience (Panel B:
the coefficients in all the models are significant at 1%). By contrast, the cross-industry coverage
experience raises an acquirer analyst‘s likelihood of retaining coverage by only 6.8% to 9.6% (Panel
A). Third, target analysts are 4.5% to 5.3% more likely to drop coverage after a diversifying merger
relative to a related merger (Panel B: Columns 3 and 4; significant at 1%). However, the retention
decision of acquirer analysts does not seem to be affected by whether the deal is diversifying or not
(Panel A: Columns 3 and 4).
Target and acquirer analysts are also attracted by different M&A deal characteristics. Target
analysts are more likely to cover a merged firm if the target is larger (in size) relative to the acquirer,
and when the deal structure is more complex—a greater fraction of the deal is paid by the acquirer
stock (‗Paystock‘ is a continuous variable). In these deals, the knowledge of the target firm,
possessed by the remaining target analysts, can be particularly valuable. Finally, as discussed above,
target analysts‘ coverage decision is positively affected by her forecast accuracy (prior to the M&A
deal), but the same does not hold for acquirer analysts.
In Panel C, we pool the analysts covering both merging firms in one Probit regression and
include a dummy variable for target analysts. Consistent with the findings in Panel A and B, we find
that a target analyst is 18% more likely to drop coverage than an acquirer analyst (Model 1;
significant at 1%). We also interact the target analyst dummy with the ‗diversifying‘ dummy and
the ‗Cross_Cover‘ dummy. We find statistically and economically significant coefficients on both
interaction terms. First, target analysts are 25.5% less likely to retain coverage than acquirer
analysts in diversifying mergers (–15.2% –10.3%, Column 2). Second, a target analyst with cross-
industry experience is 31% (4.5% + 26.5%, Column 3) more likely to cover the merged firm than
14
the target analysts without such experience, versus an increase in likelihood by only 4.5% for an
acquirer analyst with such experience over other acquirer analysts.
Overall, the results from Table 2 indicate an asymmetry in the decision processes of the two
groups of analysts. Since target analysts must decide whether to initiate coverage for a new firm—
the post-merger acquiring firm, they are much more likely to drop coverage as compared to acquirer
analysts. However, as our results on cross coverage indicate, those remaining target analysts are
more likely to have superior knowledge of both merging firms‘ industries than those staying acquirer
analysts. The difference in the decision processes between target analysts and acquirer analysts
makes it interesting to compare the research quality of target analysts who choose to retain coverage
versus that of the remaining acquirer analysts. We examine this next.
III.2. Earnings forecasts for merged firms
A successful M&A transaction involves the combination of two separate entities and the
delisting of the target firm (publicly listed and traded). Both the integration process and information
loss from target delisting will likely exacerbate information uncertainty of the merged firm. As a
result, it may take an extended period of time for (all the) analysts to fully understand and evaluate
the effects of these changes on the merged firm. As discussed earlier, the impact of a large scale
M&A transaction on the target is much greater than that on the acquirer because the target firm will
be delisted while the acquiring firm continues its operations. Moreover, many acquiring (target)
firms are large conglomerates (small, single-segment firms), while most analysts (covering either
merging firm) are industry specialists and do not cover firms outside the industry of their focus.
These facts imply that acquirer analysts may be more knowledgeable about the operations of the
merged firm. However, target analysts and acquirer analysts go through different decision processes
in providing coverage for the merged firms. In particular, as documented above, while most target

15
analysts drop coverage, those who decide to cover the merged firm tend to be more accurate in their
earnings forecasts (of the target firm prior to the M&A deal) and have good knowledge of both
merging firms‘ industries. Acquirer analysts on the other hand simply decide whether to extend
coverage for the acquiring firm beyond the M&A transaction. In fact, the majority of acquirer
analysts do continue their coverage, even though some of them may not have a good understanding
of the target firm or the merger. Therefore, the asymmetric decision processes imply that the
average quality among the remaining target analysts can be higher than that of the remaining
acquirer analysts.
It remains an interesting empirical question to compare the research quality of those target
analysts who choose to retain coverage of the merged firm vs. that of those acquirer analysts who
have made the same decision. We conduct our analysis on research quality at both the analyst level
and the firm/deal level.
Table 3 presents univariate results on the attributes of research quality for different groups of
analysts. Panel A compares the attributes of research quality prior to the M&A transaction between
the acquirer analysts who choose to retain coverage (―A_Stay‖) and those who drop coverage of the
merged firm (―A_Left‖). Similar comparisons are also made between the target analysts retaining
coverage (―T_Stay‖) and those dropping coverage (―T_Left‖). Across all quality measures, it
appears that the analysts who retain coverage have higher average quality than those who drop
coverage, regardless of whether they have covered the acquiring or the target firm prior to the M&A
transaction. More importantly, among the analysts who retain coverage for the merged firm, the
remaining target analysts (―T_Stay‖) appear to have higher quality along many dimensions than the
remaining acquirer analysts (―A_Stay‖). For example, the remaining target analysts have worked
more years in the profession (Experience), covered a larger number of firms, and are more likely to
have the ―All Star‖ status. In addition, consistent with the results from Table 2, the remaining target

16
analysts are more likely to have cross-industry coverage experience: 73% of the remaining target
analysts have covered the acquiring firm‘s industry prior to the M&A deal, while only 22% of the
target analysts who drop coverage have done so; a striking difference of 51%. A much smaller
difference is observed between the two groups of acquiring firm analysts: 19% of ―A_Left‖ have
covered the target firm‘s industry vs. 27% for ―A_Stay‖ analysts.
In Panel B of Table 3, we compare forecast errors for the merged firms among three groups
of analysts covering the merged firm: ―A_Stay‖, ―T_Stay‖, and seasoned, newly added analysts.
These seasoned, newly added analysts are defined as the group of analysts who have not covered
either merging firm prior to the M&A deal but have issued earnings forecasts for other firms
(Seasoned_New). We also examine how the forecast errors vary across different deal characteristics
that proxy for degree of information uncertainty of the merged firm. These include the size of the
M&A transaction (Relative Size), whether the acquirer is a conglomerate and whether the deal is
diversifying or not. Once again (and following prior work), we define forecast error as the absolute
value of the difference between the actual earnings and the first earnings forecast made by an analyst
for the fiscal year after the deal completion date, scaled by the stock price of the merged firm at the
end of the forecasting month.
Not surprisingly, for all three groups of analysts, forecast errors are higher for deals with
higher information uncertainty. For the whole sample, we find that the remaining target firm
analysts are the most accurate in forecasting earnings (with the smallest forecast error) for the
merged firm. The superior forecasting ability of these analysts is more evident in larger deals, after
diversifying mergers, and when the acquiring firm is a conglomerate. By contrast, the remaining
acquiring firm analysts are only marginally more accurate than the (seasoned) newly added analysts
in the whole sample, as well as in the subsamples.
17
These results provide preliminary evidence that the average forecasting ability of remaining
target analysts is higher than that of remaining acquirer analysts due to the asymmetric selection
processes. To further differentiate the research quality between these two groups of analysts, we
next perform multivariate regression analyses at both the analyst and firm/deal levels.
Results from OLS regressions (analyst level)
We compare the research quality of all the analysts covering the merged firm by employing
the following OLS model:
FE_Post = α + β(T_analyst) + {Analyst characteristics} + η{Information Uncertainty}
+ γ{Information UncertaintyT_analyst} + ε, (2)
where β is the coefficient on the target analyst dummy, and , η, and γ are vectors of coefficients.
The dependent variable is the individual analysts‘ forecast errors for the merged firm (FE_Post).
This is defined as the absolute value of the difference between the actual earnings and the first
annual earnings forecast after the deal completion date scaled by the stock price of the merged firm
at the end of forecasting month. To compare forecast accuracy across different groups of analysts,
we include dummy variables to indicate whether an analyst has covered the target firm (T_Analyst)
or neither merging firm prior to the M&A deal (New_Analyst). We then assign those who have
covered the acquiring firm as the default group. We include the same set of variables measuring the
degree of information uncertainty of the merger (and the merged firm) as those in Table 3, Panel B.
We also include variables measuring analyst quality and reputation, as those in Table 2. Standard
errors are clustered at the analyst level to allow for possible dependence among forecasts (of
different firms) made by the same analyst.
The results are presented in Table 4. Consistent with our hypothesis on the negative impact
of heightened information uncertainty and deal complexity on research quality, we find analyst
18
forecast error increases with the size of the transaction (―relative size‖), after a diversifying merger,
or when the acquirer is a conglomerate and the acquirer stock is the main method of payment. More
importantly, after controlling for individual analysts‘ research quality and reputation (prior to the
M&A deal), we find a negative and significant relation between the ‗T_analyst‘ dummy and forecast
errors in all the models (including Column 6, where we include all the controls and interaction
terms). For example, the coefficient in Column 1 suggests that the forecast error of a remaining
target analyst is about 6% lower than that of a remaining acquirer analyst (significant at 1%). In
diversifying mergers, the forecast error of a remaining target analyst is 15% to 16% lower than that
of a staying acquirer analyst (Columns 2 and 6, the coefficient on the interaction between
―T_analyst‖ and ―Diversifying‖ dummies is significant at 1%). Moreover, in deals with more
complexity—a greater fraction of the deal is paid by the acquirer stock, the superiority of the
remaining target analysts over staying acquirer analysts is also more pronounced (Columns 5 and 6).
These results confirm our univariate findings (Table 3, Panel B) that the average forecasting ability
of the remaining target analysts is higher than that of the remaining acquirer analysts. Finally, the
coefficient on the ‗New_Analyst‘ dummy is not statistically significant in any of the models. This
suggests that the forecasting accuracy of a remaining acquirer analyst is not higher than that of an
analyst who has not covered either merging firm prior to the M&A transaction.
The comparison in research quality between the remaining target and acquirer analysts
supports our hypothesis that the asymmetric selection processes for acquirer and target analysts play
an important role in determining the research quality among the analysts covering the merged firm.
In particular, while target analysts are less likely to cover the merged firm (ex ante), those who
choose to provide coverage have higher forecast ability (ex post) than the remaining acquirer
analysts. In diversifying mergers, the information loss from the delisting of the target is more severe
relative to a related merger. Since a staying target analyst is more likely to have knowledge in both

19
the acquirer and target industries than a staying acquirer analyst, especially in diversifying mergers
as we have shown in Tables 2 and 3, such knowledge also contributes to the greater forecast
accuracy of the target analysts in diversifying mergers.
Results on the Accuracy of the Consensus Forecast (firm level)
In Table 4, we examine forecast accuracy of individual analysts and find that remaining
target analysts have higher forecast quality than the remaining acquirer analysts. We now examine
whether the remaining target analysts, as a group, can improve the overall research quality of the
merged firm because of their superior forecasting ability (individually). We employ the following
OLS model at the (merged) firm level:
Consensus_FE = α + {Analyst composition variables} + γ{Change in analyst quality variables}
+ η{Info/uncertainty variables} + φ{Info/uncertaintyT_post%} + ε (4)
The dependent variable is the forecast error of the consensus earnings forecast (average of all
individual forecasts) for the merged firm. This is defined to be the absolute value of the difference
between the actual earnings and the first consensus (annual) earnings forecast after the deal
completion date, scaled by the stock price of the merged firm at the end of forecasting month; , η, γ,
and φ are vectors of coefficients.
The results are presented in Table 5. First, we denote the fraction of acquirer analysts
retaining coverage (over the number of acquirer analysts before the M&A deal) as ‗A_Stay%‘ and
find that it has no impact on the accuracy of consensus forecast of the merged firm (Columns 1 and
5). Second, we interpret the new analysts‘ role as partially replacing analysts (covering acquirer
and/or target) who drop coverage following the M&A transaction. Hence, we use the number of
new analysts scaled by the number of analysts covering the acquirer prior to the merger as the
independent variable (New%). We do not find that a greater fraction of new analysts replacing

20
acquirer analysts is associated with higher accuracy of the consensus forecast (Columns 2 and 5).
Finally, we use ‗T_Stay%‘ to denote the fraction of target analysts retaining coverage (over the
number of target analysts before the M&A deal). Consistent with the analyst level results above, a
greater fraction of target analysts retaining coverage is associated with higher accuracy of the
consensus forecast of the merged firm.13
This relationship is robust to controlling for the fractions
of acquirer analysts and new analysts retaining or adding coverage (Column 5). In particular, a 1%
increase in the fraction of target analysts leads to a 9% decrease in the forecast error (Column 3,
significant at 1%). Once again, the positive impact of the target analysts appears to be more
pronounced in diversifying mergers, but we do not find the coefficient on the interaction term to be
statistically significant (Column 4).14
Overall, our results in this section show that the asymmetric selection processes of acquirer
and target analysts have significant impact on the research quality of the merged firms. While target
analysts are more likely to drop coverage of the merged firms, those who choose to stay have
superior forecasting ability, especially in diversifying mergers. As a group, these remaining target
analysts can also improve the overall research quality of the merged firms.
III.3 Long-term performance of merged firms
Existing literature has shown that analysts are reluctant to publicly criticize firms that they
cover; but, overly optimistic (and thus inaccurate) opinions about the firms may tarnish their
reputation. These different incentives suggest that analysts are more likely to cover firms in which
13
In our calculations of ‗A_Stay%‘ and ‗T_Stay%‘, we require that at least three analysts covered the acquirer and the
target before the M&A deal. We also exclude those analysts who have covered both the acquiring and target firms before
the M&A deal. Our results are robust to the inclusion of these analysts when calculating ‗A_Stay%‘ and ‗T_Stay%.‘ In
fact, the positive relations between ‗T_Stay%‘ and consensus forecast accuracy (Table 5) and long-run stock
performance of the merged firm (Table 6 below) become stronger using the alternative definitions.
14
We also include interactions between ‗T_Stay%‘ and ‗Paystock‘ and the dummy on whether the acquirer is a
conglomerate. These interaction terms are not statistically significant, and are not reported in Table 5 to save space.

21
their (private) assessment of the firms is more favorable. In our M&A context, this implies that an
additional reason a target analyst chooses to cover the merged firms is because she holds a favorable
assessment of the merger. Therefore, we should expect a positive relationship between the fraction
of target analysts retaining coverage and future performance of the merged firm. However, this
relation may not hold for acquirer analysts, as they are not forced to make a coverage decision for a
new firm like the target analysts. Given the complicated process of completing an M&A deal and
implementing synergies in the merged firm, as well as the large amount of new information revealed
during the process, the market may not immediately understand why certain groups analysts choose
to retain, drop, or add coverage of the merged firms. Thus, similar to many other studies following a
major corporate event, we hypothesize that a higher fraction of target analysts retaining coverage is
associated with better long-term stock performance of the merged firms, but the same relation may
not hold for acquirer analysts.15
To measure long-term stock performance, we employ two sets of return measures,
Cumulative Abnormal Return (CAR) and Buy-and-Hold Abnormal Return (BHR), commonly used
in the long-run event study literature.16
Specifically, the variable ‗CAR_3yr‘ is the cumulative
abnormal returns (over benchmark returns) during the three years after the merger completion date;
whereas the variable ‗BHR_3yrs‘ measures the three-year abnormal, buy-and-hold returns. We also
run tests using one- and two-year abnormal returns (CAR and BHR) and obtain qualitatively similar
results; for brevity, we do not report these results using shorter return windows.17
15
See, e.g., Loughran and Ritter (1997) for SEOs, Loughran and Vijh (1997) and Rau and Vermaelen (1998) for M&As.
16
For example, Barber and Lyon (1997) document that the control firm approach eliminates the skewness bias
associated with the long-run buy-and-hold abnormal returns, and that the size and market-to-book matched control firm
approach yields well-specified statistics. Rau and Vermaelen (1998) and Barber et al. (1999) show that the pre-event
performance of the acquiring firms plays an important role in explaining the post-acquisition long-run abnormal
performance. Finally, Fama (1998) suggests that abnormal returns can be estimated by using returns on matching
portfolios or by an asset pricing model. 17
For the calculations of both CAR and BHR returns, the benchmark portfolios for abnormal returns are constructed
based on size, book-to-market and momentum. The details are provided in Daniel, Grinblatt, Titman, and Wermers
(1997) and Wermers (2004). We thank Russ Wermers for providing the data on benchmark portfolios.
22
In a multivariate context (Table 6, Panels A through C), we examine whether the decision
processes of acquirer and target analysts (new analysts) to retain (add) coverage of the merged firm
have an impact on the long-term post-acquisition stock performance of merged firms. We control
for factors that have been shown to influence the long-term abnormal stock performance. For
example, consistent with previous studies (e.g., Loughran and Vijh, 1997; Rau and Vermaelen,
1998), we find that acquirer size is positively related to the long-term abnormal returns, while
diversifying transactions are negatively related to long-term performance of mergers.
After controlling for firm and deal characteristics, we find (Panel A) that the fraction of
acquirer analysts retaining coverage of the merged firm (A_Stay%) has no impact on the long-run
stock performance. There is some evidence that more new analysts initiating coverage indicates
better long-run performance (Panel B). Once again, we use the number of new analysts scaled by
the number of analysts covering the acquirer prior to the merger as the independent variable
(New%).18
In Panel C, Table 6, we find a positive and significant relationship between the fraction
of target analysts who choose to cover the merged firm (T_Stay%) and long-run stock performance.
The coefficient in Column 1 suggests that a one percent increase in T_Stay leads to an increase of
0.27% in the three-year CAR of the merged firm. Given that an average of eight analysts cover the
target prior to deal announcement, each additional target analyst covering the merged firm (an
increase of 12.5% in T_Stay) is associated with an increase of 3.34% in abnormal returns. This
result is robust to both measures of long-run abnormal stock returns and the inclusion of the fraction
of acquirer analysts retaining coverage or the number of new analysts as a fraction of acquirer
analysts prior to the merger. We also interact the ―T_Stay%‖ variable with various deal
18
We also use the log of the number of new analysts as the explanatory variable (results not reported) and find it to be
positively and significantly related with better long-run performance. In these models, we also include the size of the
merged firm as a control as prior literature finds larger firms attract more analysts. This result is similar to Das et al.
(2006), who find that more analyst coverage is associated with better long-run performance of IPO firms, for which all
the analysts provide coverage for the first time.
23
characteristics (diversifying and paystock dummies), but the coefficients on these interactions are
not statistically significant.
These results support our hypothesis on how the different selection processes among target
and acquirer analysts reveal information about the prospect of the merger. A greater number of
target analysts covering the merged firm indicate that more target analysts hold high expectations of
the merger, and their expectations are borne out as these deals have better long-term performance.
We do not find such a relation for the fraction or the number of staying acquirer analysts, as these
analysts are not forced to make a decision to cover a new firm like target analysts do. These results
also suggest that the market does not immediately understand why certain analysts choose to retain,
drop or add coverage of the merged firms. Thus, our results provide new insight regarding the
information environment surrounding M&As.
III.4. Robustness checks
We briefly discuss results from robustness tests using alternative definitions on analyst
turnovers and the composition of analysts covering merged firms. First, as discussed in Section II.2,
to avoid obtaining noisy earnings forecasts during the announcement and completion of an M&A
transaction, we use a long event window and fiscal years to define pre-merger analysts and post-
merger analysts. However, the calculation of analyst turnovers based on these definitions may
overstate the percentage of analysts dropping coverage and understate the percentage of analysts
retaining coverage of the merged firm. To correct for the potential over or understatement in
calculating analyst turnovers, we reconstruct these variables using a shorter event window and
calendar time periods. The details of the constructions of both sets of measures are discussed in
Appendix A. We then recalculate the changes in analyst coverage variables, and, not surprisingly,
we observe a lower (higher) fraction of analysts dropping (retaining) coverage of the merged firm
24
around the M&A transaction. We also redo all the analyses pertaining to the determinants of analyst
coverage and its impact on research quality of the merged firm using the new variables. All of our
main results continue to hold.
Second, the calculation of the percentage of analysts (who have covered either merging firm)
dropping coverage of the merged firm is based on identifying those who no longer make earnings
forecasts for the merged firm. A potential concern for this definition is that it may include analysts
who have covered a merging firm prior to the M&A deal but ‗disappeared‘ from the I/B/E/S
database after deal completion because they either retired or left the analyst profession.19
As a result,
our measure of the percentage of analysts dropping coverage may be biased upwards. We
recalculate the percentage of analysts dropping coverage, excluding those analysts disappearing
from the I/B/E/S database after the deal completion date. We replicate the analyses using the new
measure and find similar results.
IV. Conclusions
Large scale M&A transactions significantly transform merging firms and lead to
considerable changes to analyst coverage. Despite extensive work on M&As and financial analysts,
prior research has not examined whether investors can learn from analysts‘ decisions to add, drop
and maintain coverage of merging firms. With a large sample of M&A deals during 1985-2005, we
examine analyst turnovers around M&As and finds that this turnover process has significant impact
on the research quality of the merged firm. It also reveals important information about merger
prospect and future firm performance.
19
Wu and Zang (2008) indicate that for some of the analysts who disappear from I/B/E/S do not cease to be sell-side
analysts. In fact, they document that some of them have become research executives within the same industry and some
move to another brokerage firm that is not covered by I/B/E/S.
25
Analysts covering the target firm and those covering the acquiring firm go through different
decision processes. Since the target is delisted following the completion of the M&A transaction,
the decision of target analysts to cover the merged firm is similar to initiating coverage for a new
firm that tends to be much larger and more complex. Acquirer analysts on the other hand simply
decide whether to extend coverage of essentially the same firm. As a result, target analysts are much
more likely to drop coverage than acquirer analysts, especially after a diversifying merger.
Interestingly, those target analysts who choose to cover the merged firm are the most accurate in
forecasting earnings and their dominance in forecasting accuracy is more pronounced in diversifying
mergers. The accuracy of the consensus forecast and long-run stock performance of the merged firm
also increases with the fraction of target analysts who choose to retain coverage. However, we do
not find such a relation for the fraction of acquirer analysts retaining coverage for the merged firm.
Our results support the hypothesis that analysts‘ knowledge and information about the
merger is an important determinant of analyst turnovers, earnings forecast accuracy, and long-run
stock performance of the merged firm. These results also contribute to existing knowledge on the
performance of M&A transactions. In particular, target analysts only choose to cover merged firms
for which they have superior knowledge and a favorable assessment. On the other hand, while the
acquirer analysts are more likely to retain coverage since they are not forced to make a coverage
decision for a new firm, the average forecasting quality among the retained analysts is lower than
that of retained target analysts. As a group, their retention decision cannot predict future
performance of the merged firms.

26
Appendix A: Measures of Analyst Coverage before and after M&As
We construct two sets of measures for analyst coverage and changes in coverage based upon
different definitions of the M&A event window and pre- and post-merger analysts.
Our first set of measures, used to derive results presented in the paper, defines pre- and post-
merger analysts based on the fiscal years for which analysts provide earnings forecasts. Specifically,
for merging firms in the sample, we obtain analyst codes from I/B/E/S on analysts who provide one-
year-ahead earnings forecasts for the fiscal year prior to the deal announcement year (Year –1). We
define these analysts as the ―pre-merger analysts‖. Similarly, we obtain codes on analysts who
provide one-year-ahead earnings forecasts for the fiscal year following the deal completion year
(Year +1). We define these analysts as the ―post-merger analysts.‖ We use the fiscal year before the
deal announcement year and the fiscal year after the deal completion year to extract information on
analysts and their earnings forecasts. This is due to the fact that the earnings forecasts immediately
before the announcement, during the announcement and completion, and after the completion of an
M&A transaction can be noisy. Among the pre- and post-merger analysts, we identify separately
those analysts covering the acquiring firms and those covering the target firms (the ―acquiring firm
analysts‖ and ―target firm analysts‖) prior to the merger. In addition, among the post-merger
analysts, we identify those who did not cover either merging firm prior to the merger (the ―new
analyst‖).
An analyst is identified as dropping coverage for the merged firm if she is in the ―pre-merger
analysts‖ group but not in the ―post-merger analysts‖ group; whereas retaining coverage is defined
as being in both the ―pre-merger analysts‖ group (for either merging firm) and the ―post-merger
analysts‖ group. Finally, an analyst is identified as initiating coverage for the merged firm if she is
not in the ―pre-merger analysts‖ group but in the ―post-merger analysts‖ group. Based upon these
definitions, we document that, on average, 57% of the analysts covering the acquiring firm and 79%
of the analysts covering the target firm prior to the M&A transaction drop coverage for the merged
firm, while 58% of the analysts covering the merged firm are newly added.
The seemingly high turnover rates are not surprising given the long coverage window. In
particular, an analyst would have to continue covering a merging firm for at least three years in order
to be qualified as retaining or dropping coverage for a merged firm as the completion of most M&A
transactions in our sample takes more than one year. For example, a firm with fiscal year end of
December 31st announced a merger on January 3rd
of 1999 and completed the merger on May 25th
of 2000. Then, according to our definition, an analyst is a pre-merger analyst if she provides one-
27
year-ahead earnings forecasts for the fiscal year of 1998. An analyst is a post-merger analyst if she
provides one-year-ahead earnings forecasts for the fiscal year of 2001. Therefore, an analyst would
have to continue covering the firm from 1998 to 2001 to be classified as retaining coverage for the
firm.
Since the above definitions on pre- and post-merger analysts may overstate analyst turnovers
around M&As, we also construct a second set of measures with a shorter M&A event window and
calendar year based time periods. Specifically, we first define the ―M&A event period‖ as the
period starting from 20 days leading to the deal announcement date to 20 days after the deal
completion date. We then define the ―pre-merger analysts‖ as the analysts who provide at least one
earnings forecast during the twelve (calendar) months prior to the event period (Year –1). Similarly,
we define the ―post-merger analysts‖ as those who provide at least one earnings forecast during the
twelve months after the deal completion date (Year +1). We identify an analyst as retaining
coverage if she is in both the ―pre-merger analysts‖ and ―post-merger analysts‖ groups.
Not surprisingly, most of the turnover rates around mergers (from Year -1 to Year +1) are
lower than those using the previous set of measures, because the total duration from Year -1 to Year
+1 (including the M&A event period) under the current set of measures is shorter. On average,
about 40% of the analysts covering the acquiring firm drop converge and 37% of the analysts
covering the merged firm are newly added; both of which are not significantly different from the
annual turnover rates in the non-event years. However, the turnover rates for analysts covering the
target firm remains high – around 72% of target firm analysts drop coverage for the merged firm.
This is much higher than the turnover rates (31%) prior to the event year.
Two points are worth noting. First, while the turnover measures can be constructed using
different time windows, analyst research quality of the merged firm, measured by the accuracy of
earnings forecasts, must be examined using analysts‘ one-year-ahead earnings forecasts for the fiscal
year after the deal completion year (Year +1). This is to ensure that we compare analysts‘ earnings
forecasts for the same merged firms at the same fiscal year end. Second, while analyst turnover
rates differ when using different event/time windows, we observe significant cross-section variations
in turnovers using either set of definitions of pre- and post-merger analysts. It is the cross-sectional
variations in turnovers, rather than the absolute turnovers from Year -1 to Year +1, that we focus on
in our empirical analysis.
28
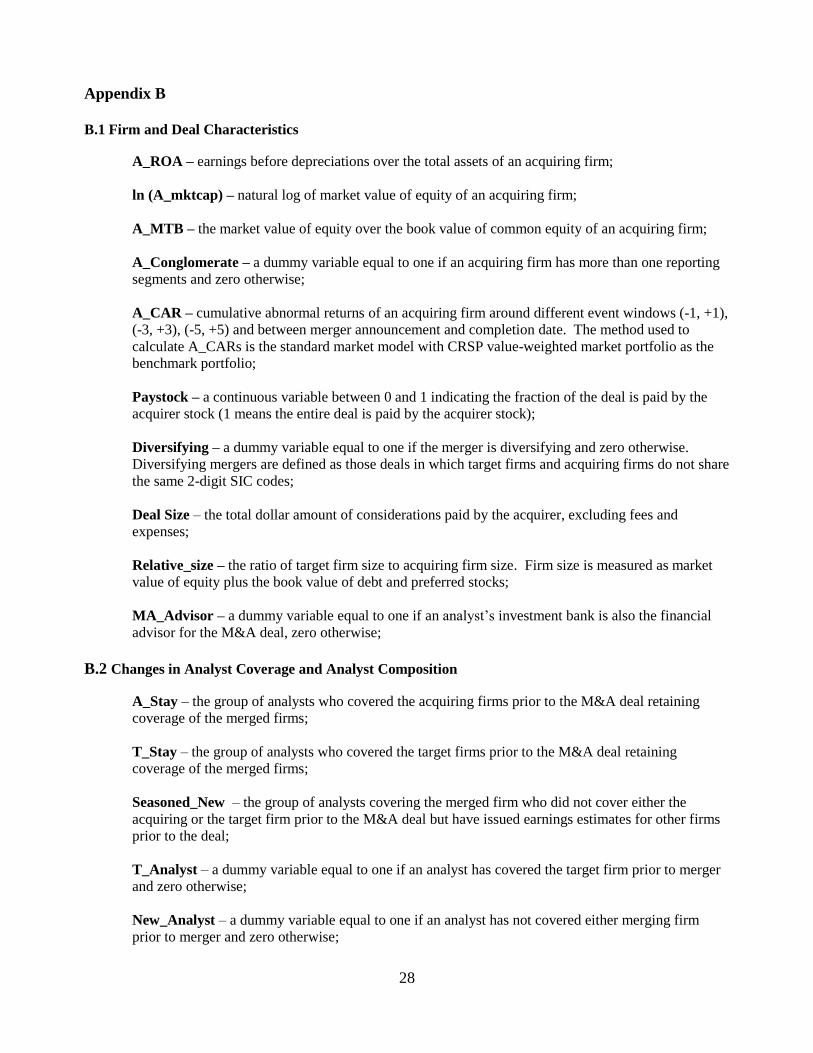
Appendix B
B.1 Firm and Deal Characteristics
A_ROA – earnings before depreciations over the total assets of an acquiring firm;
ln (A_mktcap) – natural log of market value of equity of an acquiring firm;
A_MTB – the market value of equity over the book value of common equity of an acquiring firm;
A_Conglomerate – a dummy variable equal to one if an acquiring firm has more than one reporting
segments and zero otherwise;
A_CAR – cumulative abnormal returns of an acquiring firm around different event windows (-1, +1),
(-3, +3), (-5, +5) and between merger announcement and completion date. The method used to
calculate A_CARs is the standard market model with CRSP value-weighted market portfolio as the
benchmark portfolio;
Paystock – a continuous variable between 0 and 1 indicating the fraction of the deal is paid by the
acquirer stock (1 means the entire deal is paid by the acquirer stock);
Diversifying – a dummy variable equal to one if the merger is diversifying and zero otherwise.
Diversifying mergers are defined as those deals in which target firms and acquiring firms do not share
the same 2-digit SIC codes;
Deal Size – the total dollar amount of considerations paid by the acquirer, excluding fees and
expenses;
Relative_size – the ratio of target firm size to acquiring firm size. Firm size is measured as market
value of equity plus the book value of debt and preferred stocks;
MA_Advisor – a dummy variable equal to one if an analyst‘s investment bank is also the financial
advisor for the M&A deal, zero otherwise;
B.2 Changes in Analyst Coverage and Analyst Composition
A_Stay – the group of analysts who covered the acquiring firms prior to the M&A deal retaining
coverage of the merged firms;
T_Stay – the group of analysts who covered the target firms prior to the M&A deal retaining
coverage of the merged firms;
Seasoned_New – the group of analysts covering the merged firm who did not cover either the
acquiring or the target firm prior to the M&A deal but have issued earnings estimates for other firms
prior to the deal;
T_Analyst – a dummy variable equal to one if an analyst has covered the target firm prior to merger
and zero otherwise;
New_Analyst – a dummy variable equal to one if an analyst has not covered either merging firm
prior to merger and zero otherwise;

29
A_Stay% – the ratio of the number of acquirer analysts retaining coverage of the merged firm over
the number of analysts covering the acquiring firm prior to the M&A transaction;
T_Stay% – the ratio of the number of target analysts retaining coverage of the merged firm over the
number of analysts covering the target firm prior to the M&A transaction;
New% – the ratio of the number of newly added analysts covering the merged firms over the number
of analysts covering the acquirer firm prior to the M&A transaction;
B.3 Analyst Research Quality
Experience – number of years an analyst has issued earnings forecasts in I/B/E/S;
# Firms – number of firms an analyst has issued earnings forecasts for in I/B/E/S prior to the merger,
i.e., number of firms an analyst covers;
Avg_mktcap – average market capitalization of all the firms an analyst covers prior to the merger;
Cross Cover – a dummy variable equal to one if an analyst covering the acquiring firm (target firm)
has covered the industry of the target firm (acquiring firm) and zero otherwise. An acquirer analyst
has cross-covered the target firm‘s industry if she has covered at least one firm with the same first 2-
digit SIC as that of the target firm;
FE – Analyst earnings forecast error is defined as the absolute proximity of an analyst‘s first forecast
to actual earnings, scaled by acquiring or target firm‘s stock price at the forecasting month.
All Star – a dummy variable equal to one if an analyst has been elected as an All Star analyst based
upon the annual survey conducted by the institutional investor magazine prior to mergers.
IB_Reputation – a dummy variable equal to one if an analyst works for a top-tier investment bank
and zero otherwise. We identify a top-tier investment bank as the ten underwriters with the highest
Carter-Manaster ranks in Carter et al. (1998); B.4 Long-run Stock Performance Post Merger
CAR_3yr – cumulative abnormal returns during three years after the merger completion date. The
benchmark portfolio to calculate the abnormal returns are obtained from Russ Wermers‘ website. The
benchmark portfolio is constructed based on size, book-to-market and momentum. The details of the
benchmark portfolio are provided in Daniel, Grinblatt, Titman, and Wermers (1997) and Wermers
(2004).
BHR_3yrs – three year abnormal buy-and-hold returns after the merger completion date. The
benchmark portfolio to calculate the abnormal returns are obtained from Russ Wermers‘ website. The
details of the benchmark portfolio are provided in Daniel, Grinblatt, Titman, and Wermers (1997) and
Wermers (2004). The portfolio is constructed based on size, book-to-market and momentum.
30
References
1. Abarbanell, J., and V. Bernard (1992). Tests of analysts‘ overreaction/underreaction to earnings information
as an Explanation for anomalous stock price behavior, Journal of Finance 47, 1191-1207.
2. Barber, B., and J. Lyon (1997). Detecting long-run abnormal stock returns: The empirical power and
specification of test statistics, Journal of Financial Economics 43, 341-372.
3. ____, ____, and Chil-Ling Tsai (1999). Improved methods for tests of long-run abnormal stock returns,
Journal of Finance 54, 165-201.
4. ____, R. Lehavy, M. McNichols, and B. Truemen, (2001). Can Investors Profit from the Prophets? Security
Analyst Recommendations and Stock Returns. Journal of Finance 56, 531-563.
5. Barth, M., Kasznik, R., and McNichols, M. (2001). Analyst Coverage and Intangible Assets, Journal of Accounting Research, 39, 1-34.
6. Bhushan, R. (1989). Firm characteristics and analyst following. Journal of Accounting and Economics, 11,
255-274.
7. ____, O‘Brien, P. (1990). Analyst following and institutional ownership. Journal of Accounting Research 28,
55-82.
8. Brennan, M., and P. Hughes (1991). Stock prices and the supply of information, Journal of Finance 46, 1665-
1691.
9. Carter, R., and S. Manaster (1990). Initial public offerings and underwriter reputation, Journal of Finance 45,
1045-1067.
10. Chen, Q., and W. Jiang, (2006). Analysts' Weighting of Private and Public Information. Review of Financial
Studies 19, 319-355.
11. Clarke, J., Khorana, A., Patel and P. R. Rau (2007). The impact of all-star analyst job changes on their
coverage choices and investment banking deal flow, Journal of Financial Economics 84, 713-737.
12. Daniel, K., M. Grinblatt, S. Titman, and R. Wermers (1997). Measuring mutual fund performance with
characteristics-based benchmarks, Journal of Finance 52, 1035-1058.
13. Das, Somnath, Re-Jin Guo, and Huai Zhang, (2006). Analysts‘ selective coverage and subsequent performance
of newly public firms. Journal of Finance 61, 1159-1185.
14. Dechow, P., A. Hutton, and R. Sloan (2000). The relation between analysts‘ forecasts of long-term earnings
growth and stock price performance following equity offerings. Contemporary Accounting Research 17, 1-32.
15. Fama, E. (1998). Market efficiency, long-term returns, and behavior finance, Journal of Financial Economics
49, 283-306.
16. ____, and K. French (1997). Industry costs of equity. Journal of Financial Economics 43, 153-193.
17. Gilson, S., Healy, P., Noe, C., and Palepu, K (2001). Analyst Specialization and conglomerate stock breakups.
Journal of Accounting Research 39, 565-581.
31
18. Holmstrom, B. and S. Kaplan. (2001). Corporate Governance and Merger Activity in the United States:
Making Sense of the 1980s and 1990s, Journal of Economic Perspectives, 15, 121-144.
19. Hong, H. and J. Kubik (2003). Analyzing the Analysts: Career Concerns and Biased Earnings Forecasts,
Journal of Finance, 58, 313-351.
20. Krigman, L., Shaw, W., and K. Womack, (2001). Why do firms switch underwriters? Journal of Financial
Economics 60, 245-284.
21. Lin, H., and M. McNichols (1998). Underwriting relationships, analysts‘ earnings forecasts and investment
recommendations, Journal of Accounting and Economics 25, 101-127.
22. Loughran, T., and J. Ritter (1997). The Operating Performance of Firms Conducting Seasoned Equity
Offerings, Journal of Finance 52, 1823-1850.
23. ____ and A. Vijh, (1997). Do long-term shareholders benefit from corporate acquisitions? Journal of Finance 52, 1765-1790.
24. McNichols, M., and P. O‘Brien. (1997). Self-selection and analyst coverage, Journal of Accounting Research,
35, 167-199.
25. Michaely, R., and K. Womack. (1999). Conflict of interest and the credibility of underwriter analyst
recommendations. Review of Financial Studies 12, 653-686.
26. ____, and ____ (2005). Brokerage recommendations: Stylized characteristics, market responses and biases,
book chapter in Advances in Behaviorial Fianance II, edited by Richard Thaler.
27. Mikhail, M., B. Walther, and R. Willis (1999). Does forecast accuracy matter to security analysts? The Accounting Review 74, 185-200.
28. Moeller, S., Schlingemann, F., Stulz, R., (2005). Wealth destruction on a massive scale? A study of acquiring-
firm returns in the recent merger wave. Journal of Finance 60, 757–782.
29. Rau, R., and T. Vermaelen, (1998). Glamour, value and the post-acquisition performance of acquiring firms.
Journal of Financial Economics 49, 223-253.
30. Stickel, S. (1992). Reputation and performance among security analysts, Journal of Finance 47, 1811-1836.
31. ____, (1995). The Anatomy of the Performance of Buy and Sell Recommendations. Financial Analysts
Journal 51, 25-39.
32. Shleifer, A., and R. Vishny (2003). Stock market driven acquisitions. Journal of Financial Economics 70, 295-
311.
33. Womack, K. (1996). Do Brokerage Analysts' Recommendation Have Investment Values? Journal of Finance
51, 137-167.
34. Wu, J., and A. Zang (2008). What determine financial analysts‘ career outcomes during mergers? Journal of
Accounting and Economics, forthcoming.
35. Zhang, Y. (2008). Analyst responsiveness and the post-earning-announcement drift, Journal of Accounting and Economics, forthcoming.

32
Figure 1 Change in Analyst Coverage around M&As
The Y-axis represents the percentage of analysts that drop (% Drop) or add coverage (% New) for acquiring
or target firms. Year –1 is defined as the fiscal year one year prior to the deal announcement date, and Year
+1 is defined as the fiscal year one year after the deal completion date; Year –2 is defined as the fiscal year
prior to Year –1, Year +2 is the fiscal year after Year +1, and so forth. An analyst drops coverage for a
merged firm if she provides one-year-ahead earnings forecasts for the acquiring firm in Year –1, but no
longer provides one-year-ahead earnings forecasts for the merged firm in Year +1.
33
Table 1 Descriptive Statistics of the M&A Sample
This table reports summary statistics of 1,787 mergers and acquisitions announced between 1985 and 2005. Mean and median values of each variable
are reported for the four sub-periods as well as the total period. Acquiring firms’ and target firms’ assets (“A_Assets” and “T_Assets”), market
capitalization (“A_Market Cap” or “T_Market Cap”), and market-to-book ratios of assets (“A_MTB” or “T_MTB”) are measured as of the fiscal
year-end prior to merger announcement date. “Deal size” is the total amount of considerations paid by the acquirer, excluding fees and expenses.
“Relative size” is the ratio of target firms’ market value to acquiring firms’ market value, measured as of the fiscal year-end prior to merger
announcement. Market value of the firm is measured as the sum of the market value of equity, book value of debt and preferred stock. “Diversifying”
is a dummy variable equal to one if target and acquiring firms have different 2-digit SIC codes, and zero otherwise. “Stock” is a dummy variable
equal to one if more than 50% of the deal payment is made by stock, and zero otherwise. “Tender” is a dummy variable equal to one for tender offers,
and zero for mergers.
Time Period 1985-1989
1990-1994
1995-1999
2000-2005
All Years
Mean Median Mean Median Mean Median Mean Median Mean Median
A_Assets 2,811.36 630.75 4,727.61 579.65 5,030.79 661.00 11,748.95 1,174.31 6,744.24 799.00
T_Assets 1,194.62 176.71 2,154.68 177.27 1,742.00 229.23 2,714.40 342.54 2,010.65 240.63
A _Market Cap 1,089.89 396.75 1,843.24 457.93 2,890.90 568.98 5,962.00 944.77 3,445.54 609.51
T_Market Cap 332.68 100.62 416.07 90.20 1,008.99 135.10 1,318.76 208.85 931.30 139.98
A_MTB 1.54 1.24 1.90 1.35 2.12 1.52 2.78 1.40 2.21 1.41
T_MTB 1.46 1.17 1.60 1.18 1.77 1.29 1.99 1.24 1.77 1.24
Deal Size 566.69 167.00 617.74 150.55 1,567.33 231.42 1,992.51 303.38 1,435.89 227.84
Relative Size (T/A) 0.56 0.28 0.39 0.26 0.45 0.27 0.41 0.24 0.45 0.26
Diversifying (%) 41 -- 22 -- 23 -- 21 -- 25 --
Stock (%) 37 -- 69 -- 69 -- 63 -- 62 --
Tender (%) 46 -- 19 -- 16 -- 12 -- 19 --
# of Deals 271 215 746 555 1,787
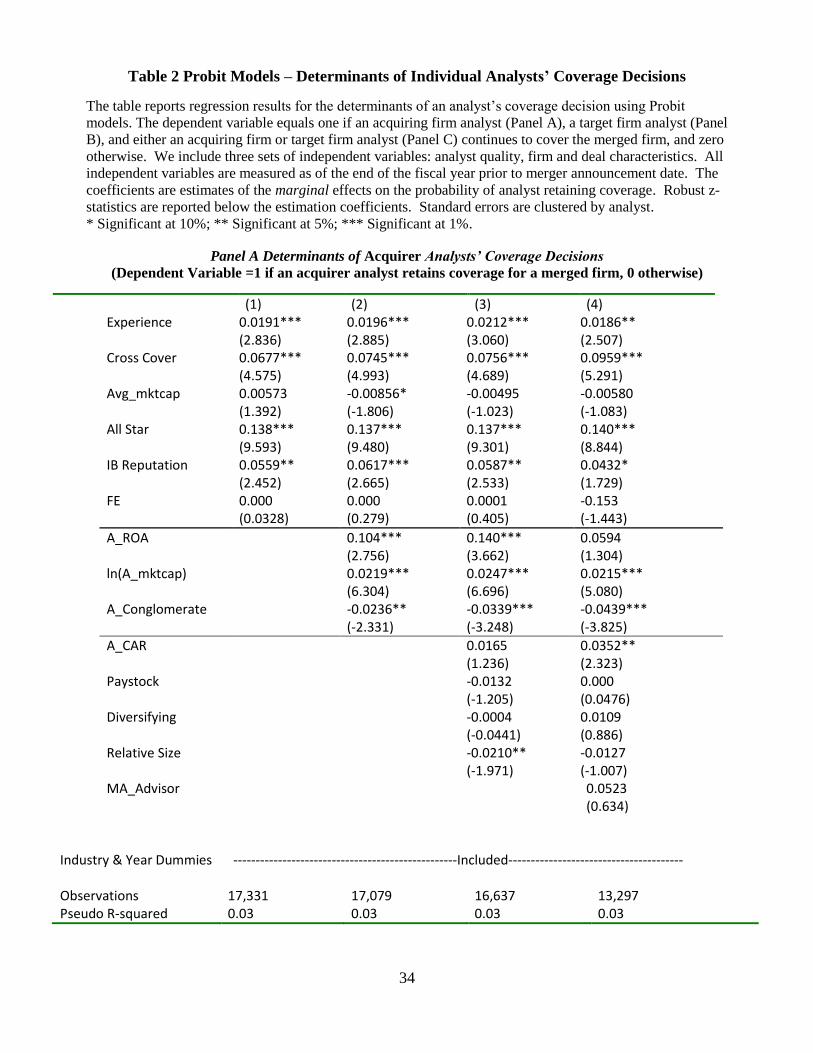
34
Table 2 Probit Models – Determinants of Individual Analysts’ Coverage Decisions
The table reports regression results for the determinants of an analyst’s coverage decision using Probit
models. The dependent variable equals one if an acquiring firm analyst (Panel A), a target firm analyst (Panel
B), and either an acquiring firm or target firm analyst (Panel C) continues to cover the merged firm, and zero
otherwise. We include three sets of independent variables: analyst quality, firm and deal characteristics. All
independent variables are measured as of the end of the fiscal year prior to merger announcement date. The
coefficients are estimates of the marginal effects on the probability of analyst retaining coverage. Robust z-
statistics are reported below the estimation coefficients. Standard errors are clustered by analyst.
* Significant at 10%; ** Significant at 5%; *** Significant at 1%.
Panel A Determinants of Acquirer Analysts’ Coverage Decisions
(Dependent Variable =1 if an acquirer analyst retains coverage for a merged firm, 0 otherwise)
(1) (2) (3) (4) Experience 0.0191*** 0.0196*** 0.0212*** 0.0186** (2.836) (2.885) (3.060) (2.507) Cross Cover 0.0677*** 0.0745*** 0.0756*** 0.0959*** (4.575) (4.993) (4.689) (5.291) Avg_mktcap 0.00573 -0.00856* -0.00495 -0.00580 (1.392) (-1.806) (-1.023) (-1.083) All Star 0.138*** 0.137*** 0.137*** 0.140*** (9.593) (9.480) (9.301) (8.844) IB Reputation 0.0559** 0.0617*** 0.0587** 0.0432* (2.452) (2.665) (2.533) (1.729) FE 0.000 0.000 0.0001 -0.153 (0.0328) (0.279) (0.405) (-1.443)
A_ROA 0.104*** 0.140*** 0.0594 (2.756) (3.662) (1.304) ln(A_mktcap) 0.0219*** 0.0247*** 0.0215*** (6.304) (6.696) (5.080) A_Conglomerate -0.0236** -0.0339*** -0.0439*** (-2.331) (-3.248) (-3.825)
A_CAR 0.0165 0.0352** (1.236) (2.323) Paystock -0.0132 0.000 (-1.205) (0.0476) Diversifying -0.0004 0.0109 (-0.0441) (0.886) Relative Size -0.0210** -0.0127 (-1.971) (-1.007) MA_Advisor 0.0523 (0.634)
Industry & Year Dummies --------------------------------------------------Included--------------------------------------- Observations 17,331 17,079 16,637 13,297 Pseudo R-squared 0.03 0.03 0.03 0.03
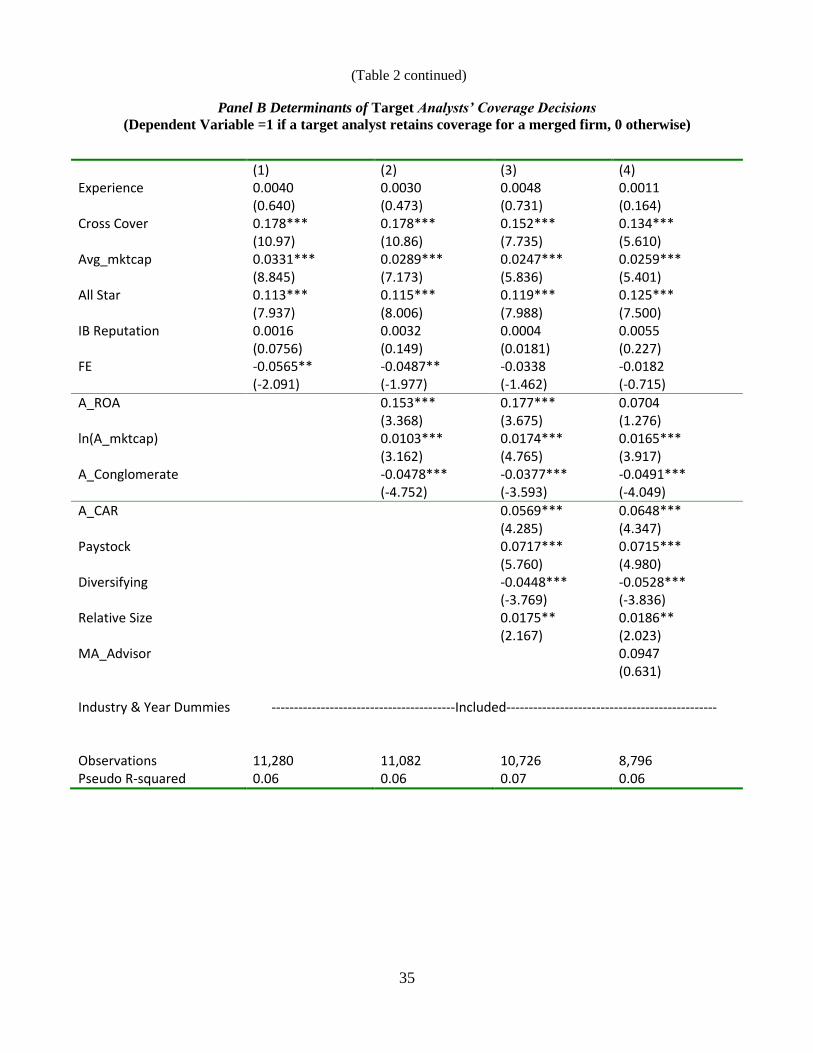
35
(Table 2 continued)
Panel B Determinants of Target Analysts’ Coverage Decisions
(Dependent Variable =1 if a target analyst retains coverage for a merged firm, 0 otherwise)
(1) (2) (3) (4) Experience 0.0040 0.0030 0.0048 0.0011 (0.640) (0.473) (0.731) (0.164) Cross Cover 0.178*** 0.178*** 0.152*** 0.134*** (10.97) (10.86) (7.735) (5.610) Avg_mktcap 0.0331*** 0.0289*** 0.0247*** 0.0259*** (8.845) (7.173) (5.836) (5.401) All Star 0.113*** 0.115*** 0.119*** 0.125*** (7.937) (8.006) (7.988) (7.500) IB Reputation 0.0016 0.0032 0.0004 0.0055 (0.0756) (0.149) (0.0181) (0.227) FE -0.0565** -0.0487** -0.0338 -0.0182 (-2.091) (-1.977) (-1.462) (-0.715)
A_ROA 0.153*** 0.177*** 0.0704 (3.368) (3.675) (1.276) ln(A_mktcap) 0.0103*** 0.0174*** 0.0165*** (3.162) (4.765) (3.917) A_Conglomerate -0.0478*** -0.0377*** -0.0491*** (-4.752) (-3.593) (-4.049)
A_CAR 0.0569*** 0.0648*** (4.285) (4.347) Paystock 0.0717*** 0.0715*** (5.760) (4.980) Diversifying -0.0448*** -0.0528*** (-3.769) (-3.836) Relative Size 0.0175** 0.0186** (2.167) (2.023) MA_Advisor 0.0947 (0.631) Industry & Year Dummies -----------------------------------------Included----------------------------------------------- Observations 11,280 11,082 10,726 8,796 Pseudo R-squared 0.06 0.06 0.07 0.06
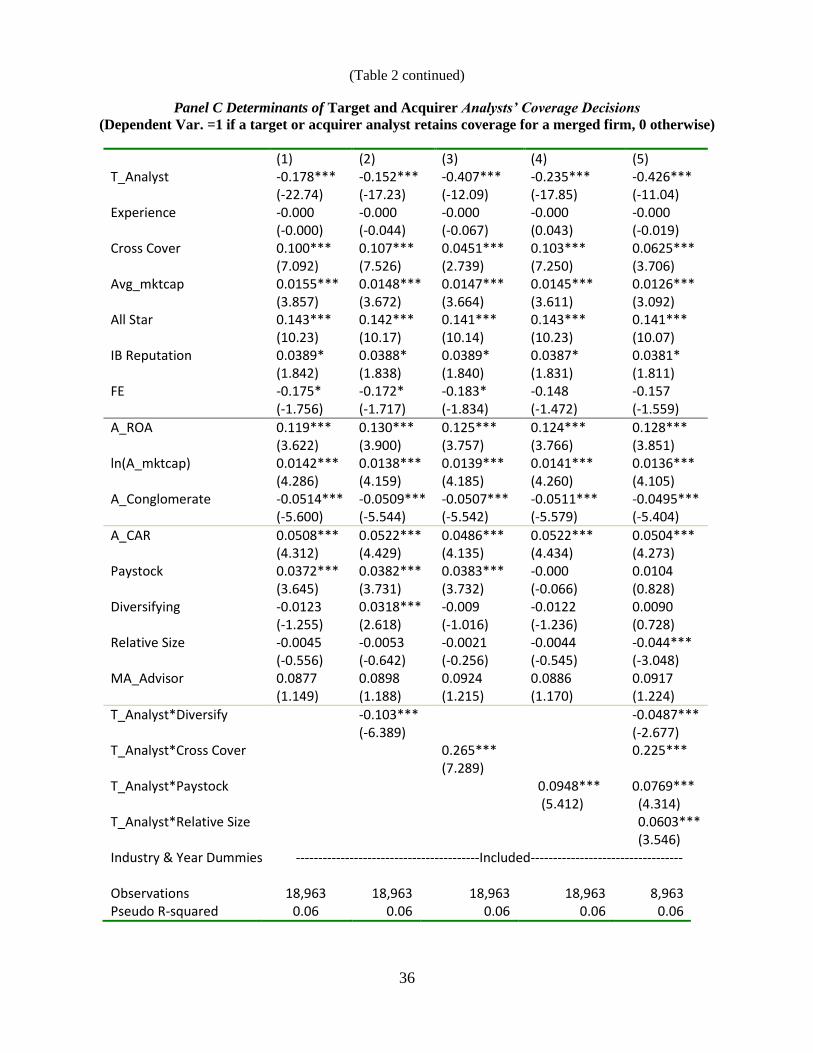
36
(Table 2 continued)
Panel C Determinants of Target and Acquirer Analysts’ Coverage Decisions
(Dependent Var. =1 if a target or acquirer analyst retains coverage for a merged firm, 0 otherwise)
(1) (2) (3) (4) (5) T_Analyst -0.178*** -0.152*** -0.407*** -0.235*** -0.426*** (-22.74) (-17.23) (-12.09) (-17.85) (-11.04) Experience -0.000 -0.000 -0.000 -0.000 -0.000 (-0.000) (-0.044) (-0.067) (0.043) (-0.019) Cross Cover 0.100*** 0.107*** 0.0451*** 0.103*** 0.0625*** (7.092) (7.526) (2.739) (7.250) (3.706) Avg_mktcap 0.0155*** 0.0148*** 0.0147*** 0.0145*** 0.0126*** (3.857) (3.672) (3.664) (3.611) (3.092) All Star 0.143*** 0.142*** 0.141*** 0.143*** 0.141*** (10.23) (10.17) (10.14) (10.23) (10.07) IB Reputation 0.0389* 0.0388* 0.0389* 0.0387* 0.0381* (1.842) (1.838) (1.840) (1.831) (1.811) FE -0.175* -0.172* -0.183* -0.148 -0.157 (-1.756) (-1.717) (-1.834) (-1.472) (-1.559)
A_ROA 0.119*** 0.130*** 0.125*** 0.124*** 0.128*** (3.622) (3.900) (3.757) (3.766) (3.851) ln(A_mktcap) 0.0142*** 0.0138*** 0.0139*** 0.0141*** 0.0136*** (4.286) (4.159) (4.185) (4.260) (4.105) A_Conglomerate -0.0514*** -0.0509*** -0.0507*** -0.0511*** -0.0495*** (-5.600) (-5.544) (-5.542) (-5.579) (-5.404)
A_CAR 0.0508*** 0.0522*** 0.0486*** 0.0522*** 0.0504*** (4.312) (4.429) (4.135) (4.434) (4.273) Paystock 0.0372*** 0.0382*** 0.0383*** -0.000 0.0104 (3.645) (3.731) (3.732) (-0.066) (0.828) Diversifying -0.0123 0.0318*** -0.009 -0.0122 0.0090 (-1.255) (2.618) (-1.016) (-1.236) (0.728) Relative Size -0.0045 -0.0053 -0.0021 -0.0044 -0.044*** (-0.556) (-0.642) (-0.256) (-0.545) (-3.048) MA_Advisor 0.0877 0.0898 0.0924 0.0886 0.0917 (1.149) (1.188) (1.215) (1.170) (1.224)
T_Analyst*Diversify -0.103*** -0.0487*** (-6.389) (-2.677) T_Analyst*Cross Cover 0.265*** 0.225*** (7.289) T_Analyst*Paystock T_Analyst*Relative Size
0.0948*** 0.0769*** (5.412) (4.314) 0.0603*** (3.546)
Industry & Year Dummies -----------------------------------------Included---------------------------------- Observations 18,963 18,963 18,963 18,963 8,963 Pseudo R-squared 0.06 0.06 0.06 0.06 0.06
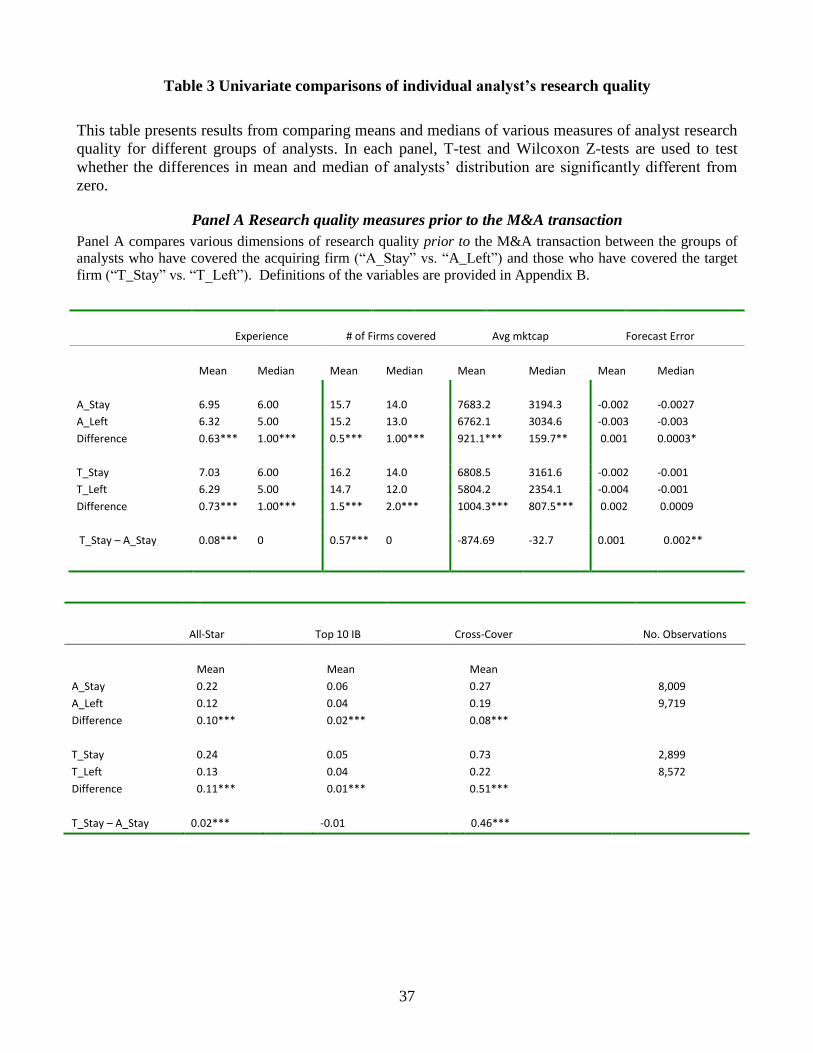
37
Table 3 Univariate comparisons of individual analyst’s research quality
This table presents results from comparing means and medians of various measures of analyst research
quality for different groups of analysts. In each panel, T-test and Wilcoxon Z-tests are used to test
whether the differences in mean and median of analysts’ distribution are significantly different from
zero.
Panel A Research quality measures prior to the M&A transaction
Panel A compares various dimensions of research quality prior to the M&A transaction between the groups of
analysts who have covered the acquiring firm (“A_Stay” vs. “A_Left”) and those who have covered the target
firm (“T_Stay” vs. “T_Left”). Definitions of the variables are provided in Appendix B.
Experience # of Firms covered Avg mktcap Forecast Error
Mean Median Mean Median Mean Median Mean Median
A_Stay 6.95 6.00 15.7 14.0 7683.2 3194.3 -0.002 -0.0027
A_Left 6.32 5.00 15.2 13.0 6762.1 3034.6 -0.003 -0.003
Difference 0.63*** 1.00*** 0.5*** 1.00*** 921.1*** 159.7** 0.001 0.0003*
T_Stay 7.03 6.00 16.2 14.0 6808.5 3161.6 -0.002 -0.001
T_Left 6.29 5.00 14.7 12.0 5804.2 2354.1 -0.004 -0.001
Difference 0.73*** 1.00*** 1.5*** 2.0*** 1004.3*** 807.5*** 0.002 0.0009
T_Stay – A_Stay 0.08*** 0 0.57*** 0 -874.69 -32.7 0.001 0.002**
All-Star Top 10 IB Cross-Cover No. Observations
Mean Mean Mean
A_Stay 0.22 0.06 0.27 8,009
A_Left 0.12 0.04 0.19 9,719
Difference 0.10*** 0.02*** 0.08***
T_Stay 0.24 0.05 0.73 2,899
T_Left 0.13 0.04 0.22 8,572
Difference 0.11*** 0.01*** 0.51***
T_Stay – A_Stay 0.02*** -0.01 0.46***
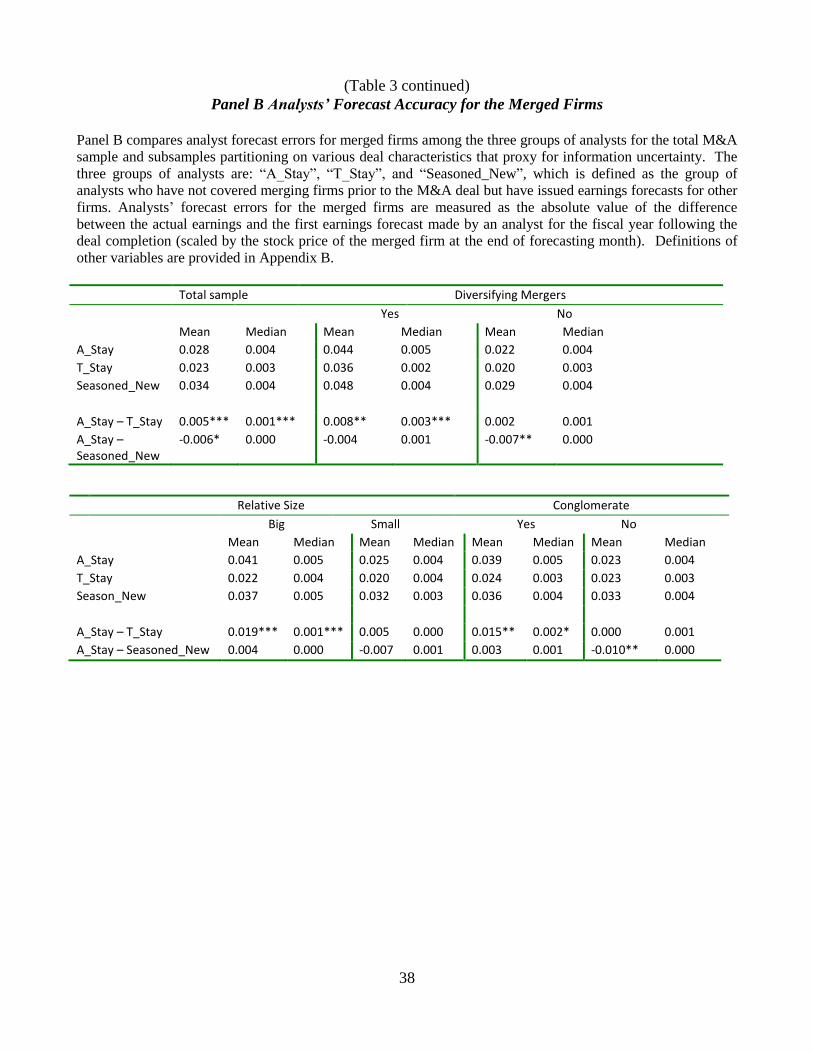
38
(Table 3 continued)
Panel B Analysts’ Forecast Accuracy for the Merged Firms
Panel B compares analyst forecast errors for merged firms among the three groups of analysts for the total M&A
sample and subsamples partitioning on various deal characteristics that proxy for information uncertainty. The
three groups of analysts are: “A_Stay”, “T_Stay”, and “Seasoned_New”, which is defined as the group of
analysts who have not covered merging firms prior to the M&A deal but have issued earnings forecasts for other
firms. Analysts’ forecast errors for the merged firms are measured as the absolute value of the difference
between the actual earnings and the first earnings forecast made by an analyst for the fiscal year following the
deal completion (scaled by the stock price of the merged firm at the end of forecasting month). Definitions of
other variables are provided in Appendix B.
Total sample Diversifying Mergers
Yes No
Mean Median Mean Median Mean Median
A_Stay 0.028 0.004 0.044 0.005 0.022 0.004
T_Stay 0.023 0.003 0.036 0.002 0.020 0.003
Seasoned_New 0.034 0.004 0.048 0.004 0.029 0.004
A_Stay – T_Stay 0.005*** 0.001*** 0.008** 0.003*** 0.002 0.001
A_Stay – Seasoned_New
-0.006* 0.000 -0.004 0.001 -0.007** 0.000
Relative Size Conglomerate
Big Small Yes No
Mean Median Mean Median Mean Median Mean Median
A_Stay 0.041 0.005 0.025 0.004 0.039 0.005 0.023 0.004
T_Stay 0.022 0.004 0.020 0.004 0.024 0.003 0.023 0.003
Season_New 0.037 0.005 0.032 0.003 0.036 0.004 0.033 0.004
A_Stay – T_Stay 0.019*** 0.001*** 0.005 0.000 0.015** 0.002* 0.000 0.001
A_Stay – Seasoned_New 0.004 0.000 -0.007 0.001 0.003 0.001 -0.010** 0.000
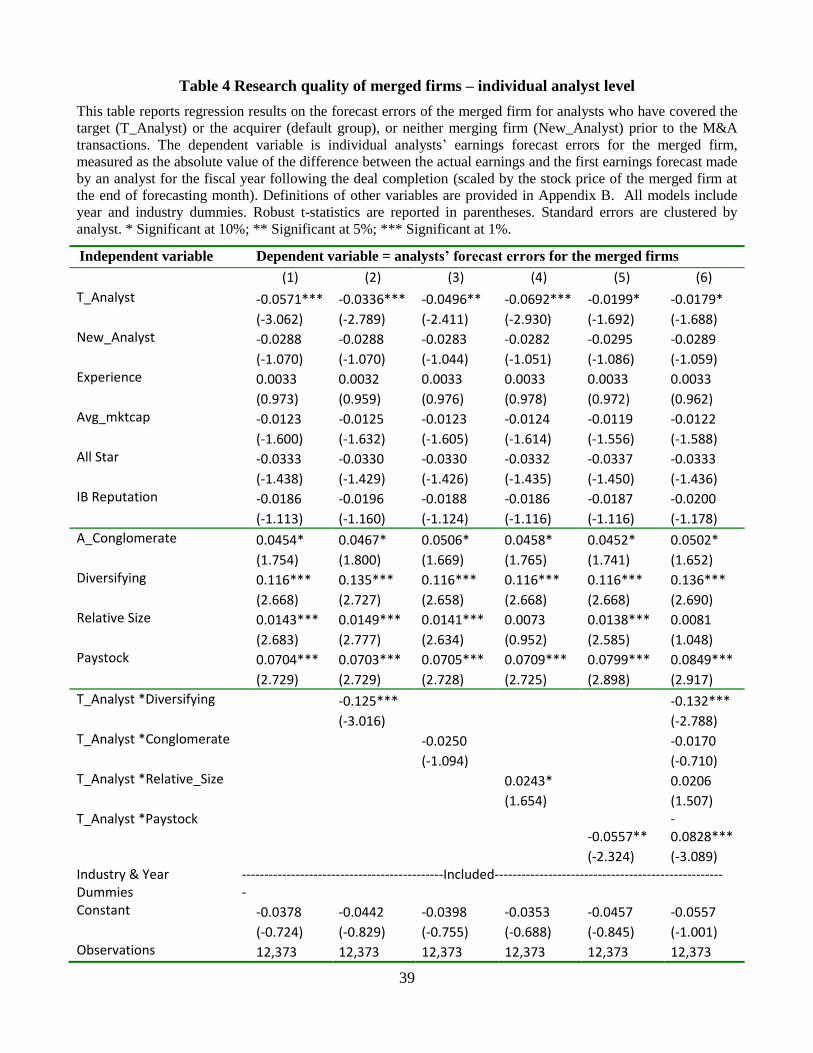
39
Table 4 Research quality of merged firms – individual analyst level
This table reports regression results on the forecast errors of the merged firm for analysts who have covered the
target (T_Analyst) or the acquirer (default group), or neither merging firm (New_Analyst) prior to the M&A
transactions. The dependent variable is individual analysts’ earnings forecast errors for the merged firm,
measured as the absolute value of the difference between the actual earnings and the first earnings forecast made
by an analyst for the fiscal year following the deal completion (scaled by the stock price of the merged firm at
the end of forecasting month). Definitions of other variables are provided in Appendix B. All models include
year and industry dummies. Robust t-statistics are reported in parentheses. Standard errors are clustered by
analyst. * Significant at 10%; ** Significant at 5%; *** Significant at 1%.
Independent variable Dependent variable = analysts’ forecast errors for the merged firms
(1) (2) (3) (4) (5) (6)
T_Analyst -0.0571*** -0.0336*** -0.0496** -0.0692*** -0.0199* -0.0179* (-3.062) (-2.789) (-2.411) (-2.930) (-1.692) (-1.688) New_Analyst -0.0288 -0.0288 -0.0283 -0.0282 -0.0295 -0.0289 (-1.070) (-1.070) (-1.044) (-1.051) (-1.086) (-1.059) Experience 0.0033 0.0032 0.0033 0.0033 0.0033 0.0033 (0.973) (0.959) (0.976) (0.978) (0.972) (0.962) Avg_mktcap -0.0123 -0.0125 -0.0123 -0.0124 -0.0119 -0.0122 (-1.600) (-1.632) (-1.605) (-1.614) (-1.556) (-1.588) All Star -0.0333 -0.0330 -0.0330 -0.0332 -0.0337 -0.0333 (-1.438) (-1.429) (-1.426) (-1.435) (-1.450) (-1.436) IB Reputation -0.0186 -0.0196 -0.0188 -0.0186 -0.0187 -0.0200 (-1.113) (-1.160) (-1.124) (-1.116) (-1.116) (-1.178)
A_Conglomerate 0.0454* 0.0467* 0.0506* 0.0458* 0.0452* 0.0502* (1.754) (1.800) (1.669) (1.765) (1.741) (1.652) Diversifying 0.116*** 0.135*** 0.116*** 0.116*** 0.116*** 0.136*** (2.668) (2.727) (2.658) (2.668) (2.668) (2.690) Relative Size 0.0143*** 0.0149*** 0.0141*** 0.0073 0.0138*** 0.0081 (2.683) (2.777) (2.634) (0.952) (2.585) (1.048) Paystock 0.0704*** 0.0703*** 0.0705*** 0.0709*** 0.0799*** 0.0849*** (2.729) (2.729) (2.728) (2.725) (2.898) (2.917)
T_Analyst *Diversifying -0.125*** -0.132*** (-3.016) (-2.788) T_Analyst *Conglomerate -0.0250 -0.0170 (-1.094) (-0.710) T_Analyst *Relative_Size 0.0243* 0.0206 (1.654) (1.507) T_Analyst *Paystock
-0.0557** -0.0828***
(-2.324) (-3.089) Industry & Year Dummies
---------------------------------------------Included----------------------------------------------------
Constant -0.0378 -0.0442 -0.0398 -0.0353 -0.0457 -0.0557 (-0.724) (-0.829) (-0.755) (-0.688) (-0.845) (-1.001) Observations 12,373 12,373 12,373 12,373 12,373 12,373
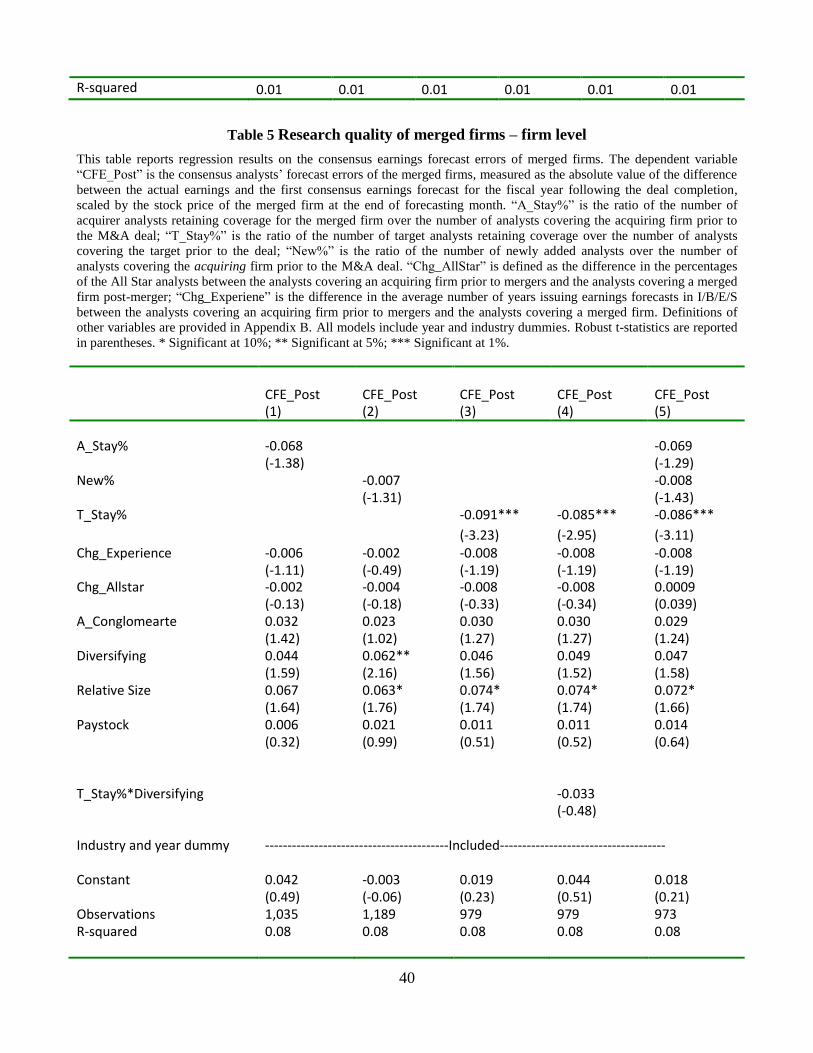
40
R-squared 0.01 0.01 0.01 0.01 0.01 0.01
Table 5 Research quality of merged firms – firm level
This table reports regression results on the consensus earnings forecast errors of merged firms. The dependent variable
“CFE_Post” is the consensus analysts’ forecast errors of the merged firms, measured as the absolute value of the difference
between the actual earnings and the first consensus earnings forecast for the fiscal year following the deal completion,
scaled by the stock price of the merged firm at the end of forecasting month. “A_Stay%” is the ratio of the number of
acquirer analysts retaining coverage for the merged firm over the number of analysts covering the acquiring firm prior to
the M&A deal; “T_Stay%” is the ratio of the number of target analysts retaining coverage over the number of analysts
covering the target prior to the deal; “New%” is the ratio of the number of newly added analysts over the number of
analysts covering the acquiring firm prior to the M&A deal. “Chg_AllStar” is defined as the difference in the percentages
of the All Star analysts between the analysts covering an acquiring firm prior to mergers and the analysts covering a merged
firm post-merger; “Chg_Experiene” is the difference in the average number of years issuing earnings forecasts in I/B/E/S
between the analysts covering an acquiring firm prior to mergers and the analysts covering a merged firm. Definitions of
other variables are provided in Appendix B. All models include year and industry dummies. Robust t-statistics are reported
in parentheses. * Significant at 10%; ** Significant at 5%; *** Significant at 1%.
CFE_Post
CFE_Post
CFE_Post
CFE_Post
CFE_Post
(1) (2) (3) (4) (5)
A_Stay% -0.068 -0.069 (-1.38) (-1.29) New% -0.007 -0.008 (-1.31) (-1.43) T_Stay% -0.091*** -0.085*** -0.086*** (-3.23) (-2.95) (-3.11) Chg_Experience -0.006 -0.002 -0.008 -0.008 -0.008 (-1.11) (-0.49) (-1.19) (-1.19) (-1.19) Chg_Allstar -0.002 -0.004 -0.008 -0.008 0.0009 (-0.13) (-0.18) (-0.33) (-0.34) (0.039) A_Conglomearte 0.032 0.023 0.030 0.030 0.029 (1.42) (1.02) (1.27) (1.27) (1.24) Diversifying 0.044 0.062** 0.046 0.049 0.047 (1.59) (2.16) (1.56) (1.52) (1.58) Relative Size 0.067 0.063* 0.074* 0.074* 0.072* (1.64) (1.76) (1.74) (1.74) (1.66) Paystock 0.006 0.021 0.011 0.011 0.014 (0.32) (0.99) (0.51) (0.52) (0.64) T_Stay%*Diversifying -0.033 (-0.48) Industry and year dummy -----------------------------------------Included------------------------------------- Constant 0.042 -0.003 0.019 0.044 0.018 (0.49) (-0.06) (0.23) (0.51) (0.21) Observations 1,035 1,189 979 979 973 R-squared 0.08 0.08 0.08 0.08 0.08
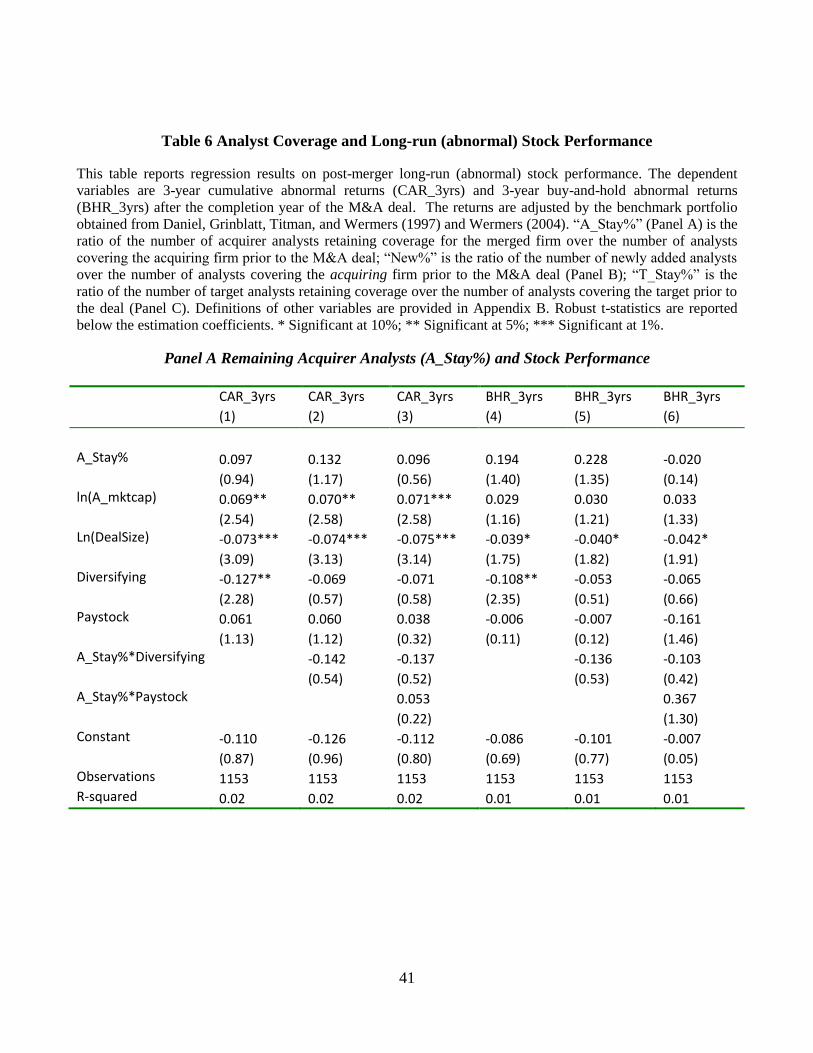
41
Table 6 Analyst Coverage and Long-run (abnormal) Stock Performance
This table reports regression results on post-merger long-run (abnormal) stock performance. The dependent
variables are 3-year cumulative abnormal returns (CAR_3yrs) and 3-year buy-and-hold abnormal returns
(BHR_3yrs) after the completion year of the M&A deal. The returns are adjusted by the benchmark portfolio
obtained from Daniel, Grinblatt, Titman, and Wermers (1997) and Wermers (2004). “A_Stay%” (Panel A) is the
ratio of the number of acquirer analysts retaining coverage for the merged firm over the number of analysts
covering the acquiring firm prior to the M&A deal; “New%” is the ratio of the number of newly added analysts
over the number of analysts covering the acquiring firm prior to the M&A deal (Panel B); “T_Stay%” is the
ratio of the number of target analysts retaining coverage over the number of analysts covering the target prior to
the deal (Panel C). Definitions of other variables are provided in Appendix B. Robust t-statistics are reported
below the estimation coefficients. * Significant at 10%; ** Significant at 5%; *** Significant at 1%.
Panel A Remaining Acquirer Analysts (A_Stay%) and Stock Performance
CAR_3yrs CAR_3yrs CAR_3yrs BHR_3yrs BHR_3yrs BHR_3yrs
(1) (2) (3) (4) (5) (6)
A_Stay% 0.097 0.132 0.096 0.194 0.228 -0.020 (0.94) (1.17) (0.56) (1.40) (1.35) (0.14) ln(A_mktcap) 0.069** 0.070** 0.071*** 0.029 0.030 0.033 (2.54) (2.58) (2.58) (1.16) (1.21) (1.33) Ln(DealSize) -0.073*** -0.074*** -0.075*** -0.039* -0.040* -0.042* (3.09) (3.13) (3.14) (1.75) (1.82) (1.91) Diversifying -0.127** -0.069 -0.071 -0.108** -0.053 -0.065 (2.28) (0.57) (0.58) (2.35) (0.51) (0.66) Paystock 0.061 0.060 0.038 -0.006 -0.007 -0.161 (1.13) (1.12) (0.32) (0.11) (0.12) (1.46) A_Stay%*Diversifying -0.142 -0.137 -0.136 -0.103 (0.54) (0.52) (0.53) (0.42) A_Stay%*Paystock 0.053 0.367 (0.22) (1.30) Constant -0.110 -0.126 -0.112 -0.086 -0.101 -0.007 (0.87) (0.96) (0.80) (0.69) (0.77) (0.05) Observations 1153 1153 1153 1153 1153 1153 R-squared 0.02 0.02 0.02 0.01 0.01 0.01
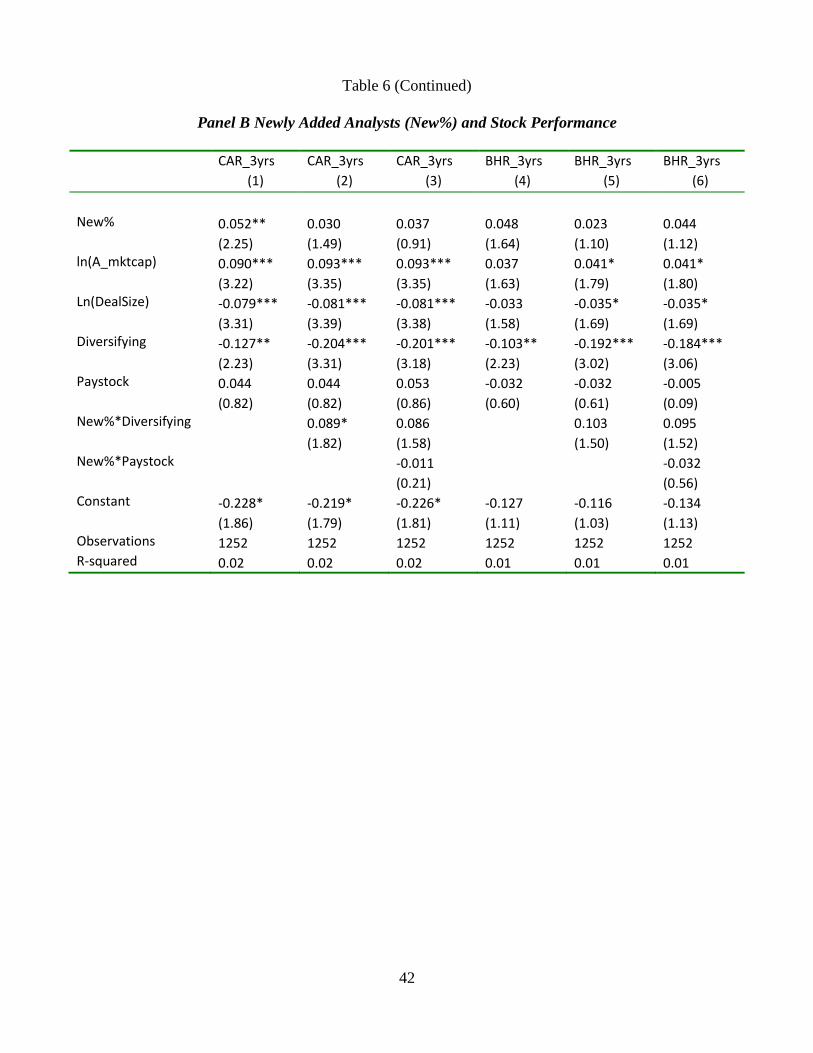
42
Table 6 (Continued)
Panel B Newly Added Analysts (New%) and Stock Performance
CAR_3yrs CAR_3yrs CAR_3yrs BHR_3yrs BHR_3yrs BHR_3yrs
(1) (2) (3) (4) (5) (6)
New% 0.052** 0.030 0.037 0.048 0.023 0.044 (2.25) (1.49) (0.91) (1.64) (1.10) (1.12) ln(A_mktcap) 0.090*** 0.093*** 0.093*** 0.037 0.041* 0.041* (3.22) (3.35) (3.35) (1.63) (1.79) (1.80) Ln(DealSize) -0.079*** -0.081*** -0.081*** -0.033 -0.035* -0.035* (3.31) (3.39) (3.38) (1.58) (1.69) (1.69) Diversifying -0.127** -0.204*** -0.201*** -0.103** -0.192*** -0.184*** (2.23) (3.31) (3.18) (2.23) (3.02) (3.06) Paystock 0.044 0.044 0.053 -0.032 -0.032 -0.005 (0.82) (0.82) (0.86) (0.60) (0.61) (0.09) New%*Diversifying 0.089* 0.086 0.103 0.095 (1.82) (1.58) (1.50) (1.52) New%*Paystock -0.011 -0.032 (0.21) (0.56) Constant -0.228* -0.219* -0.226* -0.127 -0.116 -0.134 (1.86) (1.79) (1.81) (1.11) (1.03) (1.13) Observations 1252 1252 1252 1252 1252 1252 R-squared 0.02 0.02 0.02 0.01 0.01 0.01

43
Table 6 (Continued)
Panel C Remaining Target Analysts (T_Stay%) and Stock Performance
CAR_3yrs CAR_3yrs CAR_3yrs BHR_3yrs BHR_3yrs BHR_3yrs
(1) (2) (3) (4) (5) (6)
T_Stay% 0.267** 0.275** 0.432** 0.378** 0.390* 0.460*
(2.49) (2.43) (2.26) (2.09) (1.86) (1.94)
A_Stay% 0.124 0.198
(1.05) (1.27)
New% 0.040 0.048
(1.43) (1.33)
ln(A_mktcap) 0.078*** 0.078*** 0.092*** 0.007 0.007 0.035
(2.62) (2.61) (3.03) (0.21) (0.21) (1.34)
Ln(DealSize) -0.067** -0.066** -0.090*** -0.010 -0.010 -0.048*
(2.46) (2.46) (3.43) (0.31) (0.30) (1.96)
Diversifying -0.140** -0.136** -0.146** -0.084 -0.078 -0.105**
(2.38) (2.12) (2.19) (1.58) (1.43) (2.02)
Paystock -0.033 -0.033 -0.012 -0.090* -0.089* -0.086
(0.67) (0.66) (0.21) (1.77) (1.75) (1.54)
T_Stay%*Diversifying -0.047 -0.076 -0.071 -0.139
(0.15) (0.24) (0.22) (0.44)
T_Stay%*Paystock -0.186 -0.019
(0.83) (0.06)
Constant -0.145 -0.146 -0.210 -0.019 -0.021 -0.123
(1.17) (1.18) (1.40) (0.15) (0.17) (0.83)
Observations 1171 1171 1020 1171 1171 1020
R-squared 0.02 0.02 0.03 0.01 0.01 0.03