Embed Size (px)
Citation preview

ENST 698—Environmental Capstone
Spring 2009
Campus Carbon Foodprint
Executive summary
This study sought to understand the carbon footprint of Carolina Dining Services (CDS), which
is responsible for food purchasing and distribution at the University of North Carolina at Chapel
Hill (UNC). The goal was to determine the total amount of carbon dioxide equivalent emissions
(CO2e) produced by CDS in one calendar year, to use this information to target the most carbon-
intensive practices, and make recommendations for their reduction. This report focuses on the
operations of the two largest UNC campus dining facilities: Lenoir and Rams Head dining halls.
Research suggests that agriculture is responsible for approximately 6% of the United
States’ anthropogenic greenhouse gas emissions. With nearly 40,000 students, faculty, and staff,
UNC’s campus dining halls may represent a significant addition to global carbon emissions.
A life cycle assessment provides a holistic view of the resource inputs and outputs at each
stage of a product’s life, as well as the associated impacts. This study adopts the cradle-to-grave
model, which accounts for all processes associated with the life of a product, from raw material
extraction through manufacturing and use, to disposal, because it represents the most
comprehensive analysis of carbon dioxide equivalent emissions that feasibly could be performed.
Unfortunately, life cycle analysis of food systems as a research tool is in its relative
infancy, so there are few standards in the way these estimations are made. The team reviewed
recent literature before choosing two different frameworks for calculating the greenhouse gas
emissions from food purchasing. They then gathered data on the types and amount of food
purchased for campus and estimated the associated life cycle greenhouse gas emissions. They
documented where they were unable to account for emissions and water and energy use, and
where inconsistent or unavailable data limited the analysis. They assessed the impact of campus
dining in terms of emissions resulting from the creation, processing, use, and disposal of food
products; identified various categories of food as heavily represented food groups and as carbon
―hot-spots‖; and commented on the value and feasibility of other practices, including
incorporating local and organic ingredients and low-impact practices into dining services.
Final Products included
1) A work plan and mid-term progress report
2) A set of datasheets and calculations that constitute an estimated carbon foodprint
3) This report, with methods, findings, and recommendations for greenhouse gas mitigation
4) A public presentation to the campus and community (in .pdf format)

2
UNC’s Carbon Foodprint:
The Carbon Dioxide Equivalent Emissions of
Carolina Dining Services
by
Rupert Campbell, Jonathan Carr, Madeline Gwyn,
Maggie Newcomb, and Molly Rosett
Environmental Studies 698
Spring 2009 Capstone
6 May 2009

3
Table of Contents
Introduction – UNC’s Campus Dining Services ―Foodprint‖ Capstone Project
Purpose/Goal
Literature Review
Process
A. Scope III LCA
B. Flow Charts
Part I – Farm to Fork
Food Emissions
Farm to Fork Flow Chart
A. Methodology
B. Data Sources
C. Database Assumptions
D. Transportation
E. Results
F. Conclusions
Part II – Dinner and Beyond
Waste Emissions
Waste system flow chart
A. Method
B. Assumptions
C. Results
D. Conclusions
Packaging Emissions A. Method
B. Assumptions
C. Results
D. Conclusions
Part III – Looking Ahead
Conclusion
Recommendations
A. Targeted Reductions
B. Holistic Reductions
C. Large-scale Initiatives
Future Directions A. Challenges
B. Future improvements
C. Potential projects

4
Purpose/Goal The purpose of this study was to determine the carbon footprint of Carolina Dining Services
(CDS), the institution responsible for food purchasing and distribution for the University of
North Carolina at Chapel Hill (UNC). The goal was to determine the total amount of carbon
dioxide equivalent emissions (CO2e) produced by CDS in one calendar year, and to use this
information to target the most carbon-intensive practices and make recommendations for their
reduction. This report highlights the operations of the two largest UNC campus dining facilities,
Lenoir and Rams Head dining halls, and will be used to obtain a more complete view of the total
UNC greenhouse gas emissions.
A life cycle assessment is a tool that provides a holistic view of the resource inputs and
outputs at each stage of a product’s life, as well as the associated impacts. Several life cycle
analysis models exist that vary widely in scope and definition. The cradle-to-grave model
accounts for all processes that occur within the life of a product, beginning with its creation from
raw materials and ending with its disposal. Other models include cradle-to-gate, which examines
all processes that occur up to the point at which a product is transported away from its original
location, and cradle-to-cradle, which includes the recycling of a product for its eventual reuse1.
The cradle-to-grave model was chosen for this study as it represented the most comprehensive
analysis of carbon dioxide equivalent emissions that feasibly could be performed.
Every effort was made to capture the carbon dioxide equivalent emissions resulting from
the creation, processing, use, and disposal of food products purchased by CDS. However, other
emissions and water and energy use were not accounted for. Furthermore, while the cradle-to-
grave carbon footprint of CDS completed in this study is as complete as possible, it includes
several omissions due to insufficient or unattainable data. These adjustments are noted and
explained throughout later sections.
The 2007 Greenhouse Gas Inventory and Retrospective2 is the most comprehensive
document to date concerning UNC greenhouse gas emissions. However, that report does not
account for emissions produced by the delivery, consumption, and disposal of food. This study
was conducted with the intent to fill this gap. Moreover, it aims to address student and
community interest in sustainable food purchasing and food disposal practices by increasing the
transparency of CDS operations. To our knowledge, a complete carbon footprint has not
previously been performed at the university dining system level. This report was created with
the objective of presenting a database and carbon footprint protocol that will simplify subsequent
analyses of the food purchasing, use, and disposal system as practiced by UNC and other
universities.
1 http://www.epa.gov/nrmrl/lcaccess/lca101.html
2 http://www.climate.unc.edu/GHGInventory

5
Literature Review With the rising prevalence of environmental rhetoric, awareness of climate change, and
sensitivity to peak oil, it is surprising to note that the field of carbon footprinting and life-cycle
analysis (LCA) has a severe lack of empirical studies and data for food systems in the Americas.
Globally, carbon footprinting and LCA have gained great momentum, but still a huge gap
remains where empirical food studies are concerned. Furthermore, much of the information that
does exist provides a contrast to commonly held perceptions.
To begin with, studies from Europe and America both indicate the minimal importance of
food transportation emissions in the overall carbon footprint of a particular food item. Matthews
and Weber argue that not only does public focus on ―food miles‖ overlook the grander impacts
of eating choices, but there is a severe shortage of empirical US studies of industrial food
systems3
Similarly, environmental consulting firm Ecotrust emphasizes the difficulty in finding
virtually any LCA studies of agriculture on American soil.4 Instead, Ecotrust was forced to rely
on foreign data, a phenomenon that will be discussed at length later. These two examples
underscore the current trends in food-related awareness in the US, where there is a growing
sensitivity to ―food miles,‖ a trend that actually puts critical focus on the wrong aspect of food
impacts. Not only is there a lack in comprehensive empirical food LCA studies, there is very
little awareness or momentum for such studies to appear in significant quantities.
Faced with an almost nonexistent field of data published in the US, Ecotrust relied
heavily on European studies instead, which seems to be an LCA norm established
internationally. While the US lags behind in LCA and footprinting research, several institutions
and organizations in Europe have firmly established approaches and models for carbon analysis.
Several public-private partnerships have produced comprehensive methodologies for LCA
studies, even including food systems. For example, the UK Department for Environment, Food
and Rural Affairs (DEFRA) works closely with businesses to raise green awareness, and has
produced a publicly-available LCA rubric, the PAS-2050. In an effort to establish consistent
practices, and make carbon analysis accessible to all, however, even DEFRA’s models maintain
a strong business-oriented approach, focusing more on energy and industrial processes, and
lacking capacity to analyze an entire food system. Also, while providing a comprehensive rubric,
DEFRA does not seem to maintain a public LCA database. This evidences the youth of carbon
footprinting, particularly of food systems, and unlike in the US, this lack of data stems not from
lack of awareness, studies or interest, but seems to stem more from the simple time delay from
investment in new fields of study to their blooming.
Overall, while there are some outspoken voices in the US, there is virtually no
comprehensive set of data or information for calculating US-based lifecycle analyses of food
systems. What information and studies that have been performed are concentrated almost
3 Matthews, Christopher; Weber, Scott. 2008. Food Miles and Relative Climate Impacts of Food Choices in the US.
Environmental Science and Technology online. Downloaded April 30, 2009 from
<http://pubs.acs.org/doi/pdfplus/10.1021/es702969f?cookieSet=1>
4 Ecotrust. 2008. Research Assumptions Methodologies and Analytical Results for a Low-Carbon Diet Calculator
for Public Education. Downloaded April 30, 2009 from
<http://www.circleofresponsibility.com/uploads/documents/low_carbon_diet/research_assumptions_methodologies_
paper_4_1_08.pdf>

6
exclusively in Europe, with a few outliers in places such as Japan5, India
6 and New Zealand
7.
While fruitful studies of particular food groups exist, even amongst these there are no
comprehensive data sets for holistic LCA of whole food systems. Consistency between data
assumptions is very important, so the lack of standardized studies is detrimental to the
comparability of future studies. Additionally, many of the studies and data available are not
transparent in their assumptions and calculations, making the simultaneous use of multiple
sources potentially inconsistent. Thus, while LCA has become well established internationally,
there are still many shortcomings for the analysis of food systems, and a particular deficit in the
US context for which there is no alternative.
To mitigate this deficit, certain assumptions and inconsistencies had to be accepted, the
process and impacts of which will be discussed later in this report.
5 Ogino, Kaku, Osada, Shimada. ―Environmental Impacts of the Beef-fattening System with Different Feeding
Lengths as Evaluated by a Life Cycle Assessment Method.‖ American Society of Animal Science. 2004.
<http://jas.fass.org/cgi/content/full/82/7/2115>
6 Maraseni, Tek Narayan and Mushtaq, Shahbaz and Maroulis, Jerry. “Greenhouse gas emissions from rice farming
inputs: a cross-country assessment.‖ Journal of Agricultural Science, 147. 2009. <http://eprints.usq.edu.au/4972/>
7 ―Meat and Wool New Zealand.‖ Environmental Stewardship.
<http://www.meatandwoolnz.com/download_file.cfm/Environmental_Stewardship.pdf?id=1928,f>

7
Process To clarify the scope and parameters of a food-related carbon footprint study, there are three main
Scope categories. Scope I involves direct emissions of a product, i.e., caused by the item itself,
and is the narrowest approach to a carbon footprint. Scope II includes the energy demands of a
product, for instance the carbon emissions of a power plant would be accounted for when
measuring a building’s footprint. Most carbon footprints keep within Scope II for pragmatic
reasons, as it both accounts for a large portion of emissions, and is relatively specific in its
parameters. Scope III, on the other hand, is the broadest and most nebulous Scope for a carbon
footprint analysis. A much more involved LCA approach, Scope III would not only account for a
power plant’s emissions, but would examine where the coal was sourced, by what methods, with
what transportation costs, and with what method of disposal. This perspective is particularly
pertinent when considering agriculture and food systems, as much of emissions are only
indirectly related to the foods themselves. This study utilizes the Scope III approach.
To provide a simplified visual guide of the food systems being analyzed, flow charts will
be provided at each stage of this report. Each box indicates a major actor in a food product’s
lifecycle, indicating a source for which emissions were calculated. While the direction of the
chart illustrates the flow of energy and materials from production to disposal, the arrows used
actually represent added costs of transportation, which were also included in emissions totals.
Part I, Farm to Fork, examines the agricultural production of foods, follows them through
regional and local distributors, and ends with their delivery to CDS. The actual preparation and
consumption of foods, as well as the heating, cooling and other emissions of the Lenoir and
Rams Head buildings have already been accounted for and so are not included in this study, but
remain on the flow chart as a crucial point in a food’s lifecycle. Part II, Dinner and Beyond,
focuses on the journey food, and its byproducts such as packaging, take after mealtimes,
examining the transportation and emissions of local recycling, composting and landfill systems.

8
Food Systems Flow Chart
= Transportation
Packaging
Food Waste
Recycling
Landfill
Compost
Lenoir
Dining
Hall
Rams
Head
Dining
Hall
Farm
Distributor Waste

9
Part I: FARM TO FORK
Methods
The acquisition of raw data to compile inventories of food products used in both Rams Head and
Lenoir dining halls was the primary step in analyzing the climate impact of UNC’s residential
dining services. CDS administrators Scott Myers, Bruce Eckmeder and Ricardo Rascon helped
to compile inventories of food products ordered in the month of February. The majority of
products came from Sysco, a food distributor in Durham, NC, with the remaining products from
smaller, more specialized distributors: PET (milk products), Flowers (bread products), and Pepsi
(soda and juice products).
Due to its lack of holidays or lengthy breaks, February represents a ―busy month,‖ ideal
for creating a yearly snapshot of CDS operations. Two separate order lists were supplied by
Sysco for the month of February, for Rams Head and Lenoir dining halls. Complete orders for
one week in February were obtained from the remaining smaller distributors and these totals
were multiplied by a factor of four to represent the entire month of February.
Each list provided specific package sizes, product weights, and quantities ordered over
the month in the case of Sysco’s reports, and over a week in the cases of PET, Flowers, and
Pepsi. Most product weights were listed in pounds or ounces, which were then converted to
kilograms. For liquid products reported as volumes, the specific densities were found and
applied to convert each product’s entry to a weight in pounds and kilograms.
Bon Appétit Database
The Low Carbon Diet Calculator8 is an online, user-friendly tool developed by Ecotrust, an
environmental consulting firm based in Oregon, for the Bon Appétit Management Company
Foundation. Bon Appétit Management Company provides restaurant services to colleges,
universities, and corporations nationwide, serving a total of 80 million meals per year9. This
calculator allows users to determine the impact of their food choices in terms of CO2 equivalent
emissions. CO2 equivalent (CO2e) is a measure of the climate impact of various gases, including
methane and nitrous oxide, expressed as the amount of CO2 that represents the same global
warming potential.10
A point system is used in the calculator and assigns a certain number of
―CO2e points‖ to a four-ounce serving of food. One ―CO2e point‖ equals one gram of CO2e
emissions of greenhouse gases, and, where possible, accounts for the production, transportation,
and cooking of each food product. The information provided in this calculator was used to
develop conversion factors that allow for the translation of kilograms of food into kilograms of
CO2e emissions.
This database of information was chosen for its completeness, relative transparency, and
consideration of European versus U.S. values. The Low Carbon Diet Calculator (referred to
herein as ―Bon Appétit database‖) includes point values for seven food categories, including
meat, fish, dairy, produce, legumes, starch, and beverages. The Bon Appétit database also
includes values for specific products within a category; for example, values are listed for beef
8 http://www.eatlowcarbon.org/Carbon-Calculator.html
9 http://www.bamco.com/news.35.htm
10 http://stats.oecd.org/glossary/detail.asp?ID=285

10
tenderloin, prime rib, and steak within the meat category. Furthermore, this database
acknowledges the impact of different production methods and transportation distances on the
CO2 e value for a single food product. To this end, the database provides CO2e values for fresh
and tropical fruit, seasonal and hothouse vegetables, and wild and farmed seafood. These
distinctions allow the calculation of a more precise CO2e value.
The data in this calculator is based on the results of a literature review of existing LCA
studies that determined greenhouse gas emissions from food production systems. Due to the
shortage of studies with comprehensive GHG emissions data for food, especially for food
produced in the United States, several assumptions were made by the authors of the Bon Appétit
Database. The majority of data was obtained from studies conducted on European food
production systems, while CDS sources primarily U.S. produced food items. This discrepancy
likely skews the results obtained using the Bon Appétit Database, although it is unclear how and
to what extent this is the case. In general, ―CO2e points‖ include greenhouse gas (GHG)
emissions from the production, transportation, and cooking of a food product. However, GHG
emissions data for some food products has not been published; for these items, the point value
reflects only transportation emissions, and is thus an underestimate of the true emissions. In
calculating emissions from the distribution of food items, it is assumed that all U.S.-produced
products are transported to the place of consumption by road. The Bon Appétit database
assumes that food travels an average of 260 kilometers between its origin and a local distributor,
an additional 2400 kilometers to a remote distributor, and finally 160 kilometers to Bon Appétit
offices. Assumptions were also made about transportation vehicles and are noted in the following
flow chart.
Figure 1.
Bon Appétit’s summary of domestic distribution assumptions11
Bon Appétit further assumes that all seafood products originate in Asia, arbitrarily using
Bangkok, Thailand as the place of origin for distance calculation purposes. Two transportation
11 Scholz, Astrid. ―Research assumptions, methodology, and analytical results for a low-carbon diet calculator for
public education.‖ 1 April 2008.

11
scenarios are considered for seafood–air and ocean. Strawberries are assumed to originate in
South America (Santiago, Chile) and arrive at Bon Appétit via air transport. Assumptions
concerning transportation vehicles and distribution processes are summarized in Figure 2.
Figure 2.
Bon Appétit’s summary of international distribution assumptions11
While the Bon Appétit database is comprehensive and provides values for all major food
groups, multiple concessions are made that introduce inaccuracies to the CO2e values presented
in this database. The authors note that the available data for some food items is not transparent
enough to allow for the removal of the transportation emissions factor from the item’s CO2e
value. Because a transportation emission factor is added to the CO2e value of every food item in
the Bon Appétit database, product transportation emissions may be counted twice for some
foods. For products with more transparent data, European electricity emissions values were
replaced with emissions for U.S. average electricity generation to bring these values closer to
U.S. standards. However, such substitution was not possible for all food items, and thus the
CO2e value for many items reflects the production and farming systems used in Europe.
ProBas Database12
ProBas is an entirely public online database formed through cooperation between the
German Federal Environment Agency and the private environmental research and consulting
institution Öko-Institut (The Institute for Applied Ecology). This institute was founded in
response to widely perceived environmental degradation, with the goal of raising awareness to
stop and prevent further environmental loss. Under this rubric, the ProBas database claims to be
serving the growing role of ecological awareness in society, and provides an extremely wide-
ranging array of data, including a large assortment of food groups, with a large degree of
transparency as to values used, sources referred to, internal assumptions and total values.
However, the usefulness of the ProBas database is severely limited by lack of an English
language interface.
12 <http://www.probas.umweltbundesamt.de>

12
For those able to understand German, the database provides highly detailed entries for
many foods, with a total database size of over eight thousand public values. Most food entries
have multiple values, representative of at-field emissions, factory or processing values, and the
environmental impact of food items found in stores (retail values). At the most basic at-field
level, the inputs to each food are clearly explained, including fertilizers and pesticides by type
(for instance nitrate versus phosphate fertilizers), followed by LCA-style output values,
including CO2, NO, CH4 and many others. Finally, each value has two compounded CO2e
values, accounting for the product alone (generally quite low), and then an additional number
accounting for all ―upstream‖ values (factors like fertilizer and diesel tractors). This CO2e value
incorporates all outputs with Global Warming Potential, and converts them to an equivalent
Carbon weight, providing an effective measure of comparison.
Scaling up from at-field values, each successive entry further adds processes to create a
more comprehensive carbon value. For retail values, storage, cooling, heating and transportation
are all included in the final output, with a clear statement for each entry stating the assumed
travel distance by transit type. However, all values from basic to complex are fundamentally
calculated with German, or at least European, values and assumptions, which create a potential
inaccuracy for American clients. In particular, such disparities as differing modes of electricity
generation, grid efficiency, agricultural ―best practices,‖ and treatment of livestock can make
significant impacts on final outputs. Compared to well-received studies in the UK and Japan,13
ProBas publishes much lower CO2e outputs for many meat products for instance; for performing
an LCA analysis it is more effective to use uniform data in order to provide fair comparison
between products, at the expense of a lower total value. Thus for the scope of this project,
ProBas was used as consistently as possible for all values.
A major reason for utilizing ProBas, despite language barriers, is the comprehensive
nature of its database, and the transparency with which it publishes data. No other database has
provided the transparency that ProBas maintains, which is key to understanding CO2e hotspots.
Additionally, aside from language differences, ProBas is designed with as user-friendly an
interface as possible, which makes browsing and accessing the database quick to master, greatly
helping efficiency in a large-scale project.
Database Assumptions
While the Bon Appétit and ProBas databases represent two of the most comprehensive
and transparent LCA food data sources available, it was necessary to make certain assumptions
in order to use this data in this study. Furthermore, inventory data obtained from CDS often
lacked transparency and clarity, thereby introducing further uncertainties to calculations
completed in this study.
Applying the ―CO2e point‖ system of the Bon Appétit database, food items purchased for
use in Lenoir and Rams Head dining halls were classified into one of thirty-three categories.
Items were assigned to the category corresponding closest to the food item itself or to the
ingredient of which it is primarily composed. Each category has a corresponding point value,
and an item’s CO2e value was obtained using this information. In designating each food item to
a category, several assumptions were made. First, while the Low Carbon Diet Calculator
contains point values for many items, many items purchased by CDS are not listed in the
13 Fanelli, Danielle. ―Meat is Murder on the Environment.‖ New Scientist. 18 July 2007.
<http://www.newscientist.com/article/mg19526134.500-meat-is-murder-on-the-environment.html>

13
calculator. To circumvent this problem, items were assigned to the category containing an item
or items most similar in composition, production, and origin to the food item not listed in the
Bon Appétit database. A complete listing of food category assumptions can be found at the
conclusion of this report. For example, beef brisket and eye of round were assigned the point
value corresponding to ―steak.‖ Similarly, pizza dough and pie lids were classified as ―bread.‖
The calculator provides values for only two pork items – pork chops and short ribs – so the
average of the CO2e values for these two items was applied to all pork items purchased by CDS.
In this manner, it was possible to assign virtually every food item a representative category and
CO2e conversion factor. However, it is important to note that some food items were excluded
from analysis. Because of their small carbon footprint and absence from both databases, spices
and condiments were not considered in the calculation of CDS’ carbon footprint. The exclusion
of these food items is expected to have a negligible impact on the total CO2e emissions.
Seafood items posed a particular challenge because of the limited information available
from CDS inventories. Bon Appétit assigns a CO2e point value to seafood items based on the
production method, i.e., whether the seafood was farmed, wild caught locally, or wild caught far
away. Inventories obtained from Sysco Food Systems do not supply information regarding the
origin or production methods of seafood products, and thus this information remains unknown.
It was assumed that salmon purchased by CDS was farmed, as the majority of salmon sold in
restaurants was raised in high-density farms.14
Catfish, tilapia, and whiting also were assigned
the ―farmed salmon‖ point value, as these items did not appear in the Low Carbon Diet
calculator.
The Bon Appétit database divides both fruits and vegetables into two categories. CO2e
point values are listed for seasonal and tropical fruit, as well as seasonal and hot house
vegetables. As previously stated, Sysco Food Systems sources food items nation and world-wide
from numerous suppliers. The complexity of Sysco’s food network coupled with a lack of
access to specific records meant that it was not feasible to obtain this information for each food
item purchased by CDS. Thus, the origin and production method of fruit and vegetables
analyzed in this study remain largely unknown. Furthermore, it is understood that certain fruits
and vegetables, regardless of their origin, are more energy intensive and require more water,
fertilizer, pesticides, or land area than others.15
. The Bon Appétit database does not list fruits and
vegetables item by item, but instead uses an average value that is applied to all fruits or all
vegetables. This method likely renders the CO2e value for produce items inaccurate, although it
is unclear how much so. Fruits were classified as ―tropical‖ or ―seasonal‖ based on the location
at which the majority of that item is produced. Of the nearly thirty different fruits purchased by
CDS, all were designated ―seasonal‖ except banana, mango, melon, and pineapple. This system
introduces uncertainties, as many fruits labeled ―seasonal‖ likely have a CO2e more similar to
that of tropical fruit. Namely, two major inaccuracies potentially skew the data. First, the
distances assumed for tropical fruits are much larger, yet ―seasonal‖ fruits such as apples from
Washington State also travel similar distances. Thus, considering the geographic location of
North Carolina, it is likely that the ―seasonal‖ category underestimates travel emissions.
Secondly, as many fruits and vegetables are bought year-round, there is a strong likelihood that
14 http://www.ewg.org/reports/farmedpcbs
15 ―An input-output energy analysis in greenhouse vegetable production: a case study for Antalya region of Turkey.‖
Ozkan et al. 2003. Biomass and Bioenergy. Vol 26 Issue 1.

14
some were grown in hothouses, which contribute much more CO2e emissions than seasonally
grown produce. Yet lacking transparent invoice data, all produce was necessarily given the label
of ―seasonal‖. This method is preferable to guessing which fruit and vegetables were grown
where and how, providing a measure of consistency over haphazard guesses. Even so, this
classification likely underestimates the true CO2e emissions generated from vegetable production
and consumption.
While this report does not strictly consider energy used in cooking processes in
calculating a food item’s total CO2e emissions, several point values taken from the Bon Appétit
database do include this information. Where possible, point values for uncooked food items
were used to exclude cooking processes from the item’s CO2e emissions. Otherwise, point
values corresponding to different cooking methods were averaged and applied to an item. For
example, the CO2e value used for ―chicken‖ represents the average of that listed for fried and
grilled chicken. Furthermore, many items purchased for use in Lenoir or Rams Head dining
halls arrive frozen or canned. Canned and frozen foods carry a larger CO2e value than fresh food
because they must undergo additional processing. Except in rare cases, use of the Bon Appétit
database does not allow for distinction between frozen, fresh, and canned food, and thus the
additional CO2e emissions resulting from processing many food items is lost.
The ProBas database, while more specific and transparent in its data and calculations,
was also subject to assumptions much like the Bon Appétit database. At the broadest scale, all
ProBas data is from Germany, which is important to bear in mind. Additionally, ProBas data
entries typically retained two CO2e values: a direct value, and a value including ―upstream‖
outputs, such as fertilizers, pesticides and tractor use. In accordance with Scope III parameters of
carbon footprinting, the upstream value was always used, to account for inputs and outputs
indirectly incurred through the production process. Further assumptions were made by product
category, and then per each food item classified.
With most values, ProBas provided multiple datasets, representative of ―at source,‖ ―in
factory‖ and ―retail‖ stages. As the final stage in a long supply chain, CDS food items were
largely categorized as ―retail‖ values, with small traveling distances of one to two hundred
kilometers by truck typically included. In light of Sysco and other providers’ massive food
networks, this is virtually insignificant in comparison to other factors, or even long distance
travel. As such, it is reasonable to assume that even this ―retail‖ value is either a close
representation of food products at CDS, or still an underestimate of total emissions, rationalizing
its use for most products, such as meat and bread.
A notable exception to the ―retail‖ categorization is fruit and vegetable produce. For
reasons noted above, knowing the source and production methods of produce is extremely
difficult, so in order to provide a consistent array of data for future studies only basic categories
were used. First, all food items were represented by the generic ―fruit‖ or ―vegetables‖ categories.
Additionally, within this classification, only two specifications were used: at-field or canned. In a
few cases a specifically named value was provided, for example, tomatoes, potatoes or
strawberries, but these were principally outliers. The advantages and pitfalls of this approach are
very similar to generalizing data with the Bon Appétit calculator, but the further disadvantage of
these two categories is that virtually no transportation values are included. More significantly,
while the vast majority of produce items were labeled with at-field ―generic vegetable‖ values (a
generic produce value similar to Bon Appétit’s), this creates data representative of students
literally picking and eating their meals from the earth directly. In reality, this picture is a more
accurate description of an ideal food system, and so is an entirely insufficient representation of

15
the CDS and Sysco process. (The benefits for this CO2e shortfall will be discussed more under
future recommendations.) With the ―canned fruit/vegetable‖ category, a similarly simplified food
system is described, but the added outputs of collecting, washing, cutting and canning produce
are described. Thus this category is used more liberally to represent any fruit or vegetables that
are pre-washed, pre-sliced or canned, but still does not capture the whole industrial food process.
Regarding meat and seafood products, ProBas presented what appeared to be a strongly
skewed set of data. This database includes only generic fish values and does not account for the
differences in wild caught or industrially farmed fish. As a result, it is assumed all seafood is
thus of generic type, and caught wild—a potential inaccuracy. A variety of data values were
available for meat products, but the calculations used to develop them often lacked transparency.
Specifically, aside from ―beef,‖ ―pork‖ and ―chicken,‖ ProBas provided several ―mixed meat,‖
―sausage‖ and ―frozen meat‖ categories, but did not explain their composition or animal source.
However, invoices from CDS also included meat products of uncertain animal source, so in these
cases either ―mixed meat‖ or ―sausage‖ values were used. In other cases, food items typically
had a meat value to accurately describe them, yet the underlying issue is differences in German
and US meat industries. Namely, compared to studies of industrial meat production from
England and Japan,16
as well as less empirical sources from the US,17
ProBas meat values were
as little as one-third of expected CO2e outputs. For consistency, ProBas data was still utilized,
but this example is indicative of the impact of wider assumptions such as these.
With other food items, often no specific category was available, so a process similar to
that used for Bon Appétit was implemented. Namely, a category either related by major
ingredient type or relevant in method of production was used. In particular, pasta and dough
products were typically classified as uncooked bread due to ingredient overlap, while heavy
creams and toppings for desserts were described as similar to butter due to production intensity
and their highly processed nature. A small data hole of significance was vegetarian products, as
this is a major standard against which meat products are compared. For many vegetarian
products, including tofu and vegetarian meat patties, a generic soy bean value was used, which
lacks much of the condensing and processing of tofu. While using this value does not capture
the full CO2e emissions of vegetarian products, it fulfills a role in still providing a rough measure
of comparison. In very few circumstances, data holes were filled by different database values,
but these values are clearly highlighted, and their usage avoided at all costs short of inputting
nothing. These cases relied on different studies performed specifically as a carbon-related LCA
of that food type, such as those referenced above from Japan and India. Relying on peer-
reviewed publications in this way provides reliable data; however, relying on disparate sources
for and study exacerbates the unevenness of parameters and assumptions across data sources,
which is why such data was used infrequently.
Overall, whilst using both the ProBas and Bon Appétit databases, pursuing a less
complex, straightforward approach was favored despite the resulting underestimate in CO2e
outputs. This method was used to provide a comprehensible system and value to work with in
future studies, and provide a consistent and easily alterable, rather than a convoluted and esoteric,
16 Ogino, Kaku, Osada, Shimada. ―Environmental Impacts of the Beef-fattening System with Different Feeding
Lengths as Evaluated by a Life Cycle Assessment Method.‖ American Society of Animal Science. 2004.
<http://jas.fass.org/cgi/content/full/82/7/2115>
17 Environmental website – ―eating 2lbs of beef like idling your car for 2 hours‖; also Pollan?

16
product. Such a product allows for more specific and detailed studies to be conducted in the
future to ascertain more accurate empirical numbers, while still providing a method for
comparison between food groups.
These conversion values are listed in side-by-side columns and multiplied by the total
weight in kilograms of each item to calculate a final CO2e total. The final page of the
spreadsheet reports the total weight in kilograms of CO2 equivalencies for each dining hall, in the
month of February, based on the two databases.
The next step was to extrapolate the data to represent yearly totals. Simply multiplying
February’s totals by 12 was not an option, for this would gloss over emissions due to seasonal
breaks, holidays, and summer camps that occur throughout much of the year. Based on the
university’s academic calendar and opinions of CDS administrators, multiplying February’s final
totals by 8.5 gave a reasonable estimate of a complete calendar year’s worth of carbon emissions
for the dining halls. These totals are also listed on the final page of the spreadsheet.
Transportation
As explained in the descriptions of the two databases, a key hole in the Probas calculation
is the absence of transportation, while for Bon Appétit the transportation values lack accuracy.
The lack of ―food-miles‖ in the results provides a final CO2e total that falls short of the true
emission value, so another means of estimation was developed.
Locating the exact origin for each item included was not feasible for this study. Instead,
a value of CO2e emission totals from transporting staple items to Chapel Hill was roughly
estimated. The US Department of Agriculture provided images of geographic densities for a
number of these items; the map of corn for grain is displayed on the next page as an example18
:
18 US Department of Agriculture, National Agricultural Statistics Service

17
Figure 3.
The first step was to locate the center, or centers, of highest densities for each crop. For
grain in the image above, the center location was Decatur, IL. The distance from Decatur to
Chapel Hill was assumed to be the distance the grain items served in Top of Lenoir and Rams
Head had traveled. Some items had multiple high density locations. In this case, the average of
all the distances to Chapel Hill was used, for the exact original location of UNC’s items
remained unknown. All distances are listed in Table 5 of the following Results section.

18
Results
This report features an Excel spreadsheet that includes all the raw data acquired and the steps
taken to calculate the final CO2 equivalency totals. The format remains similar to the format
presented in Sysco’s reports. Below is an example of the spreadsheet format:
Column A lists the descriptive name of each product separated into groups. The first groups
contain items from Pepsi, Flowers, and PET. The remaining categories break up the food items
ordered from Sysco, including pork and lamb, as pictured above. The dark blue highlighting
indicates frozen foods.
The next column, titled ―Quantity,‖ may seem to have some discrepancy between different
products. The differences come from the many ways a distributor can choose to package the
items based on its size or fragility. In some cases, the number listed in this column is the number
of the particular food item contained in one package. In this case, the number listed in the next
column, ―Weight/Quantity,‖ would be the weight of one of those food items. For example, above
there are 160 ―Sausage, pork patty cooked browned‖ in one package. One individual patty
weighs 0.0625 lbs, as listed under ―Weight/Quantity.‖ On the other hand, link sausage is
packaged in a different way, so its quantity and weight/quantity are listed differently. In this
case, the number listed under ―Weight/Quantity‖ is the weight of one whole package, 12 lbs. No
matter how the packaging was listed, the total weights of the packages were accounted for.
―Quantity/Week‖ and ―Quantity/Month‖ account for the amount of food ordered during the
month of February. Only the items from Pepsi, Flowers, and PET have values listed for
―Quantity/Week,‖ because only a week’s worth of these items was obtained. These figures were

19
multiplied by four to obtain values for the ―Quantity/Month‖ column. Sysco provided values for
the ―Quantity/Month‖ column, rendering ―Quantity/Week‖ irrelevant.
By multiplying these three columns, (Quantity) X (Weight/Quantity) X (Quantity/Month),
the total weight in pounds was calculated, and then converted to kilograms, by multiplying
pounds by 0.45359237 kg/lb, shown in the next column.
The next columns, ―Bon Appétit conversion factors‖ and ―ProBas conversion factors,‖ list
the carbon dioxide equivalent factors in kilograms/kilogram of food. The values come from two
separate, published databases.
Table 1.
Lenoir Dining Hall Annual CO2e Totals
Food Bon Appétit ProBas
Category kg CO2e/year kg CO2e/year kg CO2e/year
Dairy 2981 157938.5 213656
Beef 3235 820250 391340
Pork 2154 124159.5 89717.5
Lamb 76 11594 11262.5
Seafood 1812 115676.5 48764.5
Eggs 1676 82892 27344.5
Poultry 4822 211157 142230.5
Fruits 8761 199274 21564.5
Vegetables 14523 93959 36966.5
Bread 4306 62177.5 22312.5
Potatoes 5752 49844 4547.5
Fats 2791 0 32929
Nuts 36 119 153
Tofu 427 11602.5 2788
Sugar 1373 28475 19813.5
Totals 54725 1969118.5 1065390

20
Table 2.
Rams Head Dining Hall Annual CO2e Totals
Food Bon Appétit ProBas
Dairy kg/ year kg CO2e/year kg CO2e/year
Beef 2270 119187 198976.5
Pork 2206 481601.5 264061
Lamb 1541 112871.5 70397
Seafood 56 8559.5 7599
Eggs 538 18632 14008
Poultry 1560 77188.5 25466
Fruits 3428 149481 101889.5
Vegetables 11767 132277 37544.5
Beans 6545 46733 11441
Bread 1225 2184.5 3655
Potatoes 6935 90108.5 35173
Fats 5676 49716.5 4488
Nuts 1211 0 8806
Tofu 88 136 374
Sugar 41 1113.5 272
Totals 1,046 22,899 26,120.5
Table 3.
Pepsi , Flowers, and PET Annual CO2e Totals
Food Bon Appétit ProBas
Category kg/year kg CO2e/year kg CO2e/year
Pepsi 14546 70839 166897.5
Flowers(bread) 5211 51382.5 24012.5
PET (milk) 20767 191513.5 137742.5
Totals 101,654 313,735 328,652.5

21
Table 4.
Annual Total for All Dining Halls and Providers (metric Tons annually)
Total Totals Food Bon Appetit ProBas
Drinks(Pepsi) 14.546 70.839 166.8975
Bread(Flowers) 5.211 51.3825 24.0125
Milk 20.767 191.5135 137.7425
Dairy 5.251 277.1255 412.6325
Beef 5.441 1301.8515 655.401
Pork 3.695 237.031 160.1145
Lamb 0.132 20.1535 18.8615
Seafood 2.35 134.3085 62.7725
Eggs 3.236 160.0805 52.8105
Poultry 8.25 360.638 244.12
Fruits 20.528 331.551 59.109
Vegetables 21.068 140.692 48.4075
Beans 5.531 2.1845 3.655
Bread/Grains 11.241 152.286 57.4855
Potatoes 11.428 99.5605 9.0355
Fats 4.002 0 41.735
Nuts 0.124 0.255 0.527
Tofu 0.468 12.716 3.06
Sugar 2.419 51.374 45.934
TOTALS 145.688 3595.5425 2204.3135
22
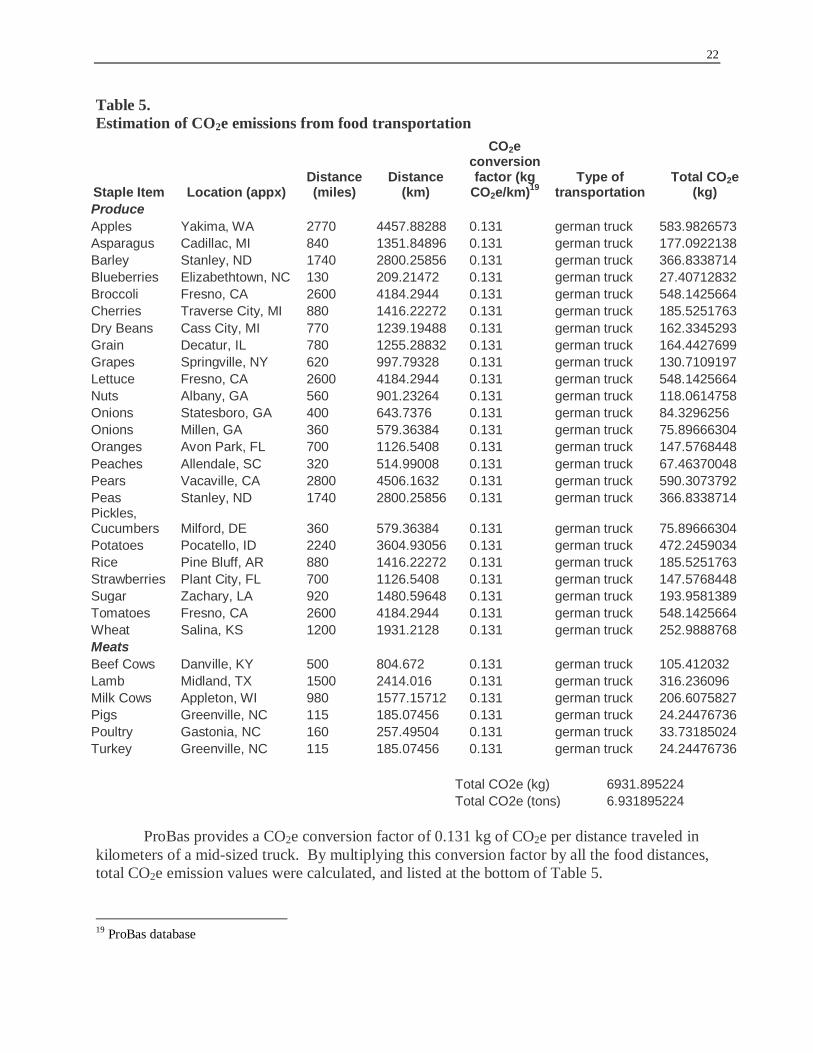
Table 5.
Estimation of CO2e emissions from food transportation
Staple Item Location (appx) Distance (miles)
Distance (km)
CO2e conversion factor (kg
CO2e/km)19
Type of
transportation Total CO2e
(kg)
Produce
Apples Yakima, WA 2770 4457.88288 0.131 german truck 583.9826573
Asparagus Cadillac, MI 840 1351.84896 0.131 german truck 177.0922138
Barley Stanley, ND 1740 2800.25856 0.131 german truck 366.8338714
Blueberries Elizabethtown, NC 130 209.21472 0.131 german truck 27.40712832
Broccoli Fresno, CA 2600 4184.2944 0.131 german truck 548.1425664
Cherries Traverse City, MI 880 1416.22272 0.131 german truck 185.5251763
Dry Beans Cass City, MI 770 1239.19488 0.131 german truck 162.3345293
Grain Decatur, IL 780 1255.28832 0.131 german truck 164.4427699
Grapes Springville, NY 620 997.79328 0.131 german truck 130.7109197
Lettuce Fresno, CA 2600 4184.2944 0.131 german truck 548.1425664
Nuts Albany, GA 560 901.23264 0.131 german truck 118.0614758
Onions Statesboro, GA 400 643.7376 0.131 german truck 84.3296256
Onions Millen, GA 360 579.36384 0.131 german truck 75.89666304
Oranges Avon Park, FL 700 1126.5408 0.131 german truck 147.5768448
Peaches Allendale, SC 320 514.99008 0.131 german truck 67.46370048
Pears Vacaville, CA 2800 4506.1632 0.131 german truck 590.3073792
Peas Stanley, ND 1740 2800.25856 0.131 german truck 366.8338714 Pickles, Cucumbers Milford, DE 360 579.36384 0.131 german truck 75.89666304
Potatoes Pocatello, ID 2240 3604.93056 0.131 german truck 472.2459034
Rice Pine Bluff, AR 880 1416.22272 0.131 german truck 185.5251763
Strawberries Plant City, FL 700 1126.5408 0.131 german truck 147.5768448
Sugar Zachary, LA 920 1480.59648 0.131 german truck 193.9581389
Tomatoes Fresno, CA 2600 4184.2944 0.131 german truck 548.1425664
Wheat Salina, KS 1200 1931.2128 0.131 german truck 252.9888768
Meats
Beef Cows Danville, KY 500 804.672 0.131 german truck 105.412032
Lamb Midland, TX 1500 2414.016 0.131 german truck 316.236096
Milk Cows Appleton, WI 980 1577.15712 0.131 german truck 206.6075827
Pigs Greenville, NC 115 185.07456 0.131 german truck 24.24476736
Poultry Gastonia, NC 160 257.49504 0.131 german truck 33.73185024
Turkey Greenville, NC 115 185.07456 0.131 german truck 24.24476736
Total CO2e (kg) 6931.895224
Total CO2e (tons) 6.931895224
ProBas provides a CO2e conversion factor of 0.131 kg of CO2e per distance traveled in
kilometers of a mid-sized truck. By multiplying this conversion factor by all the food distances,
total CO2e emission values were calculated, and listed at the bottom of Table 5.
19 ProBas database

23
Figure 4.
Database Results Comparison
0
5
10
15
20
25
30
Soda Bread Milk Cheese Butter Beef Pork Poultry Tofu Fruit Veg
Food Category
CO2e
Em
issi
ons
Fact
or (k
g CO
2e)
Bon Appetit
ProBas
Figure 5.
Carbon Intensity for Various Food Products, Waste Processing, and Package Production
0
50
100
150
200
250
300
Drinks(Pepsi)
Bread(Flowers) Mi
lk
DairyBeef
Pork
Lamb
SeafoodEggs
Poultry
Fruits
Vegetables
Beans
Bread/Grains
Potatoes
Fats
Nuts
Tofu
Sugar
Garbage
Packaging
BonAppetit
ProBas
tons CO2e/ton Food[Annua]

24
Conclusions
Each table above sums food quantities provided by CDS and multiplied out to represent a year’s
supply of that food, and the relative CO2e from both databases used. Pepsi, Flowers and PET
data was provided in separate invoices applicable to both Lenoir and Rams Head, so were
calculated independently to avoid double-counting. Figure 4 compares annual kilograms of food
to annual kilograms of CO2e emissions according to ProBas and Bon Appétit databases. More
detailed graphs can be found attached to the final spreadsheet, but all conclusions draw on the
information are illustrated by Figure 4 and Charts 1 and 2. Specific values for information
referenced are available in Tables 1 to 4, and in more detail in the attached spreadsheet.
Table 5 provides the CO2e emissions from the transportation of staple items. The
inaccuracies require that these estimates of emissions from food-miles not be added to the final
CO2e emission total for CDS. Although these values only show the emissions due to one trip
from the farm to UNC-Chapel Hill, it should be noted that transportation emissions have only a
small significance when compared to other carbon intensive factors discussed in this report.
Overall, this data serves to illustrate current CDS practices and trends, rather than provide
a concrete emissions total. From trends in comparing annual weight of food groups and annual
CO2e impacts according to two different databases, insightful conclusions can be drawn.
Looking at the annual food weights, a few groups are prominent in sheer quantity, but
often those with the largest CO2e impact are entirely different. By weight, vegetables, fruits and
milk are clearly the most abundant food categories, closely followed by bread (bearing in mind
there are two bread totals) and potatoes. As staples to a balanced diet, it is both unsurprising and
reassuring that produce far and away constitutes the most purchased categories, while bread and
potatoes are also unsurprising leaders. While milk is a fairly dense liquid, its leading annual
tonnage is indicative of a Western diet, which is heavily dependent on dairy products. All of
these groups are dietary staples, and so have a unique position in CO2e analysis and reduction,
which will be discussed later.
Contrasting to the ―heaviest‖ food groups, entirely different groups can be identified as
―carbon hotspots.‖ Carbon hotspots are groups of food products that have unusually high CO2e
intensity per weight, that is, have the highest associated levels of emissions per unit of weight.
Identifying hotspots is an effective initial carbon reduction measure, as these products provide
the most dramatic impact reductions for the least reduction in actual weight of food. Figure 5
clearly depicts the most severe carbon hotspot according to both databases: beef. The CO2e
impact of beef is 3.6 times larger than poultry, the next most impactful category. The extremity
of beef’s impact is such that removing beef entirely would achieve more carbon reduction than
eliminating all fruit, vegetables, pork, lamb, seafood, poultry and Pepsi products.20,21
The next
most severe carbon hotspots are poultry, closely followed by fruit according to Bon Appétit,
while according to the ProBas database dairy is a much more carbon intensive value than both
poultry and fruit. The drawbacks and advantages of this database discrepancy will be discussed
later, but in any case, poultry and dairy can be established as carbon hotspots, both within the top
four most intensive categories, if different per database.
20 Using Bon Appétit values. Using ProBas values, removing all of those categories would achieve a reduction of
104 tons more than would removing beef. However, the specifics of ProBas’ beef data will be discussed later.
21 It would actually reduce about 8 more tons of CO2e/year than removing all of those categories would.

25
Along these lines, several categories jump out as carbon intensive food groups, while not
necessarily being carbon ―hotspots‖. The difference is it would take a much more significant
reduction in food purchasing to effect a truly significant reduction in carbon, or their annual
quantity is so low their impact is less extreme. Groups with a consistently high impact across
both databases include all meat products, dairy, eggs, and sugars. This categorization merely
indicates that for each kilogram of such food types produced and consumed, a much larger
quantity of CO2e is produced. As both databases agree that these groups are generally more
energy and CO2e intensive, it is fair to conclude that this is where the bulk of CDS emissions is
found, and so should be prioritized in reduction strategies.
At the other end of the spectrum, several food groups retain extremely high carbon
efficiency, occasionally even incurring less CO2e output than their annual weight. Vegetables,
beans, bread, nuts, tofu and potatoes are the key low-carbon food groups. Interestingly, these are
also several of the ―heaviest‖ staple food groups mentioned above, indicating that a more
traditional agricultural diet dependent on vegetable-based proteins, produce, carbohydrates and
starches is essentially a much more carbon-friendly diet, transferring sun-generated food energy
rather than oil- and corn-bred forms (such as beef). Overall, these groups have a very low
emissions rate per kilogram of food, even those such as bread, which seemingly involve a large
amount of energy (from crops into flour, then flour into dough, then the cooking process), or
vegetables, which necessarily are often transported very long distances. Inherently these numbers
tell us that despite large travel distance, the key emissions must be coming from somewhere else,
as argued by Matthews and Weber above.22
Even using the higher Bon Appétit number,
vegetables incur less CO2e than their annual weight, which is a very powerful statement for such
a broad and multitudinous category. In contrast to picking out high-intensity food groups, these
low-intensity food groups should be the focus for consumption and dietary needs, as their energy
efficiency is much higher than for animal products, as partially illustrated by low relative CO2e
impacts.
From hotspots to high- and low-intensity food groups, there are a still a few outliers that
cannot be included in these definitions. In particular, several food groups are subject to strong
database conflicts, or are the victims of irreconcilable data holes. Some disputed high-intensity
groups serve to provide a more nuanced illustration of their impacts, while resulting in less
decisive conclusions than clear-cut categories. In this regard, Fruit is the key category under
dispute, as ProBas reports an astonishingly low annual CO2e output, while Bon Appétit’s is
surprisingly high. The specific disjoint in play here will be discussed later, but for the purposes
of analysis there is no way to mitigate such extreme unevenness. Other extremely different
groups stem from unfortunate data holes. For example, no remotely representative value for Fats
could be discerned from the Bon Appétit database, resulting in a zero value. ProBas, on the other
hand, did have values for food items in the Fats category; however, they cannot be compared to
an alternative database. A very small amount of values, namely sauces, flavorings and spices,
had no related values whatsoever in either database, and so were not included in any category.
Additional weight with no CO2e value only serves to unnecessarily deflate impact totals, so
instead these culled items are attached to the bottom of respective dining hall spreadsheets.
Furthermore, the impacts of such values are most likely fairly negligible, especially within the
rubric of comparing hotspots, high- and low-intensity foods, where only large differences are
significant.
22 See Literature Review section
26
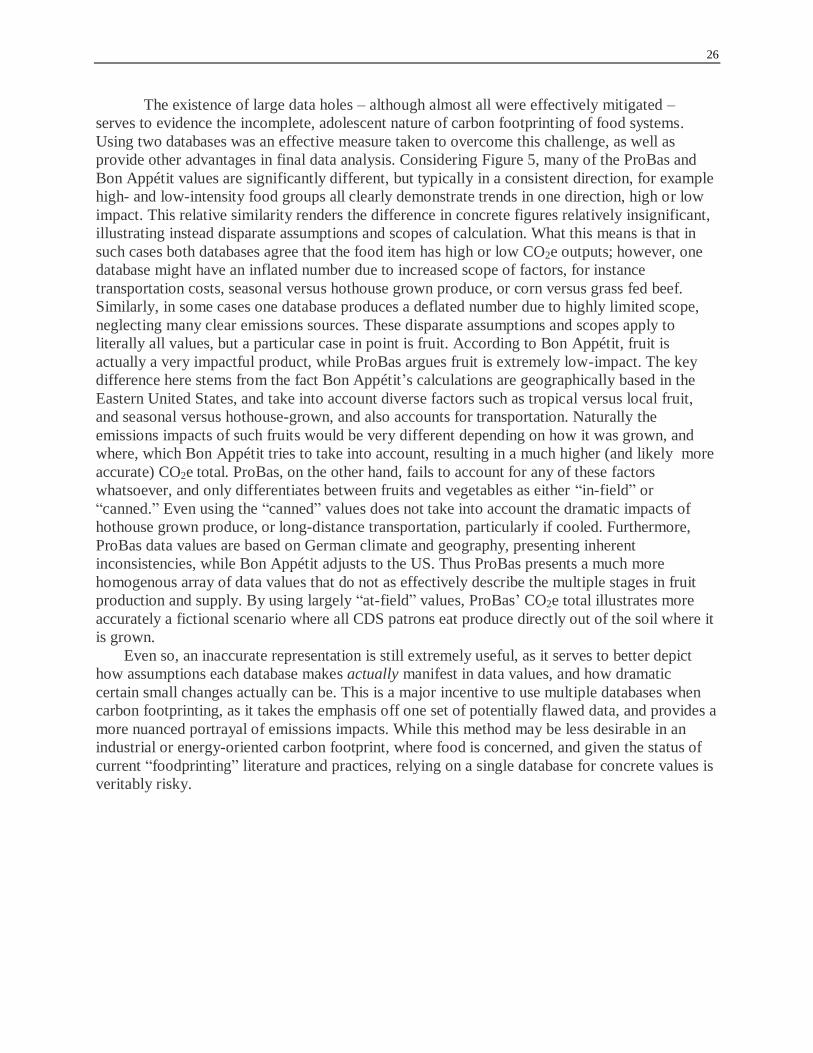
The existence of large data holes – although almost all were effectively mitigated –
serves to evidence the incomplete, adolescent nature of carbon footprinting of food systems.
Using two databases was an effective measure taken to overcome this challenge, as well as
provide other advantages in final data analysis. Considering Figure 5, many of the ProBas and
Bon Appétit values are significantly different, but typically in a consistent direction, for example
high- and low-intensity food groups all clearly demonstrate trends in one direction, high or low
impact. This relative similarity renders the difference in concrete figures relatively insignificant,
illustrating instead disparate assumptions and scopes of calculation. What this means is that in
such cases both databases agree that the food item has high or low CO2e outputs; however, one
database might have an inflated number due to increased scope of factors, for instance
transportation costs, seasonal versus hothouse grown produce, or corn versus grass fed beef.
Similarly, in some cases one database produces a deflated number due to highly limited scope,
neglecting many clear emissions sources. These disparate assumptions and scopes apply to
literally all values, but a particular case in point is fruit. According to Bon Appétit, fruit is
actually a very impactful product, while ProBas argues fruit is extremely low-impact. The key
difference here stems from the fact Bon Appétit’s calculations are geographically based in the
Eastern United States, and take into account diverse factors such as tropical versus local fruit,
and seasonal versus hothouse-grown, and also accounts for transportation. Naturally the
emissions impacts of such fruits would be very different depending on how it was grown, and
where, which Bon Appétit tries to take into account, resulting in a much higher (and likely more
accurate) CO2e total. ProBas, on the other hand, fails to account for any of these factors
whatsoever, and only differentiates between fruits and vegetables as either ―in-field‖ or
―canned.‖ Even using the ―canned‖ values does not take into account the dramatic impacts of
hothouse grown produce, or long-distance transportation, particularly if cooled. Furthermore,
ProBas data values are based on German climate and geography, presenting inherent
inconsistencies, while Bon Appétit adjusts to the US. Thus ProBas presents a much more
homogenous array of data values that do not as effectively describe the multiple stages in fruit
production and supply. By using largely ―at-field‖ values, ProBas’ CO2e total illustrates more
accurately a fictional scenario where all CDS patrons eat produce directly out of the soil where it
is grown.
Even so, an inaccurate representation is still extremely useful, as it serves to better depict
how assumptions each database makes actually manifest in data values, and how dramatic
certain small changes actually can be. This is a major incentive to use multiple databases when
carbon footprinting, as it takes the emphasis off one set of potentially flawed data, and provides a
more nuanced portrayal of emissions impacts. While this method may be less desirable in an
industrial or energy-oriented carbon footprint, where food is concerned, and given the status of
current ―foodprinting‖ literature and practices, relying on a single database for concrete values is
veritably risky.

27
Part II: DINNER AND BEYOND
WASTE EMISSIONS
The focus of this study is on the CO2e emissions associated with the food served by CDS. For
Scope III analysis, it is also important to examine the waste processing practiced by CDS, and
the CO2e emissions resulting from them. Considering how much waste is produced by large
dining facilities such as those on campus, it would be neglectful to ignore its impact. Discounting
waste emissions would underestimate the true CO2e emissions value associated with CDS.
Method
The first step of determining the CO2e emissions associated with waste processing was to
determine how much and what type of waste is generated by CDS. UNC’s Office of Waste
Reduction and Recycling provided these numbers (see ―Amounts of Materials‖), and categorized
each waste type as one of four categories: garbage, cardboard, food scraps (as well as other
compostable material, such as certain paper products), and bottles and cans.23
Since records of
these amounts were not available for after December 2008, comparisons determined at a meeting
with CDS officials were used to project the numbers for January 2009 through June 2009. The
months of September and February; October, November, March, and April; and January, May,
June, July, and August were determined to be comparable in amount of traffic (and thus, food
purchasing and amount of waste). So, for example, to calculate the tons of garbage generated for
the month of January 2009, the amounts for July 2008 and August 2008 were averaged.
The next step was to find a calculator that could determine how much CO2e would be
emitted from land filling, recycling, or composting a certain amount of waste. The
Environmental Protection Agency’s WAste Reduction Model (WARM) is the most
comprehensive, user-friendly, and transparent calculator that was found, and was created using a
reliable method.24
Using the WARM model, the annual and monthly emissions were calculated
for the process of decomposing (in a landfill), recycling, or composting waste. From this data,
the emissions factor per ton of garbage, cardboard, food scraps, and recycling was calculated.
The WARM model also includes a variable for the transportation of waste from its original
location to the facility that processes it.
Assumptions
The main assumption was that the months of September and February; October, November,
March, and April; and January, May, June, July, and August actually are similar in amounts of
traffic. Recycling bottles and cans was assumed to be comparable to recycling what the WARM
model calls ―mixed recyclables,‖ as this was the most similar category that the WARM model
offers as an option.
Using the transportation variable in the WARM model meant assuming that the types of
trucks and fuels used in reality are similar to the types of trucks and fuels referenced in the
WARM model.
23 Alves, Amy and BJ Tipton. Office of Waste Reduction and Recycling Fiscal Year 2008-2009 Trend Report. p.
48. 9 February 2009. 28 April 2009.
24 ―Greenhouse Gas Emissions Sources: 2006 emissions (MMTCO2e).‖ Environmental Protection Agency, (2006).
April 30, 2009. http://epa.gov/climatechange/wycd/waste/calculators/Warm_home.html#click

28
Figure 6. Waste and its fate
Waste (from
Top of Lenoir
and Rams Head in Chapel Hill,
NC)
Garbage Cardboard Bottles and
Cans
Food Scraps
Landfilled at
1514 Eubanks
Road, Chapel
Hill, NC
Composted at
1195 Beal
Road, Goldston,
NC 27252
Recycled by
Paper Stock
Dealers at 4619 Industry Lane,
Durham, NC
27713
Recycled at
1010 East
Pettigrew Street, Durham,
NC 27701
Orange County
contracts with
Waste Industries for
transportation
(4.96 miles)
UNC contracts
with Brooks
Contractors for transportation
(37.97 miles)
Orange County
contracts with
Waste Industries for
transportation
(11 miles)
Contract with
Orange
Recycling Services for
transportation
(11.44 miles)

29
Results
Amounts of materials (in tons) are shown in the following tables.
Table 6.
Top of Lenoir
Month Garbage Cardboard* Compost
Bottles and
Cans
July 2008 10.33 5.72 5.96 0.23
August 2008 13.07 10.29 17.12 0.08
September 2008 27.28 13.96 29.56 0.43
October 2008 35.22 7.63 30.08 0.94
November 2008 28.42 5.78 26.89 0.53
December 2008 11.54 3.71 14.60 0.31
January 2009 11.70 8.01 11.54 0.16
February 2009 27.28 13.96 29.56 0.43
March 2009 31.82 6.71 28.49 0.74
April 2009 31.82 6.71 28.49 0.74
May 2009 11.70 8.01 11.54 0.16
June 2009 11.70 8.01 11.54 0.16
Annual 251.88 98.50 245.37 4.91
*The cardboard compactor for Lenoir is also used by the Student Union
30
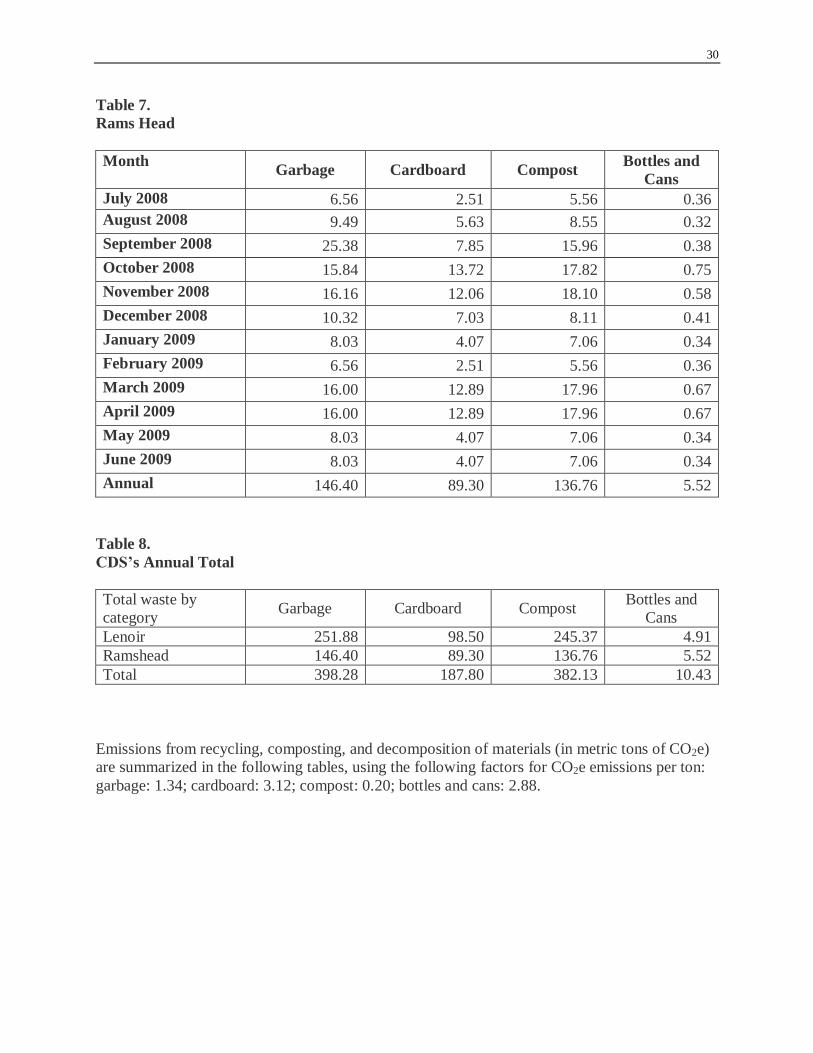
Table 7.
Rams Head
Month Garbage Cardboard Compost
Bottles and
Cans
July 2008 6.56 2.51 5.56 0.36
August 2008 9.49 5.63 8.55 0.32
September 2008 25.38 7.85 15.96 0.38
October 2008 15.84 13.72 17.82 0.75
November 2008 16.16 12.06 18.10 0.58
December 2008 10.32 7.03 8.11 0.41
January 2009 8.03 4.07 7.06 0.34
February 2009 6.56 2.51 5.56 0.36
March 2009 16.00 12.89 17.96 0.67
April 2009 16.00 12.89 17.96 0.67
May 2009 8.03 4.07 7.06 0.34
June 2009 8.03 4.07 7.06 0.34
Annual 146.40 89.30 136.76 5.52
Table 8.
CDS’s Annual Total
Total waste by
category Garbage Cardboard Compost
Bottles and
Cans
Lenoir 251.88 98.50 245.37 4.91
Ramshead 146.40 89.30 136.76 5.52
Total 398.28 187.80 382.13 10.43
Emissions from recycling, composting, and decomposition of materials (in metric tons of CO2e)
are summarized in the following tables, using the following factors for CO2e emissions per ton:
garbage: 1.34; cardboard: 3.12; compost: 0.20; bottles and cans: 2.88.

31
Table 9.
Emissions by Category
Emissions by source Annual
Equivalent to (#) of Cars
on Roadway Each Year
Monthly
Average
Emissions from compost
Lenoir 48 9 4.0
Rams Head 28 5 5.6
Total for compost 76 14 9.6
Emissions from garbage
Lenoir 337 62 28.08
Rams Head 196 48 16.33
Total for garbage 533 110 44.41
Emissions from bottles and cans
Lenoir 14 3 1.17
Rams Head 16 3 1.33
Total for bottles and cans 30 6 2.50
Emissions from cardboard
Lenoir 307 56 25.58
Rams Head 278 51 23.17
Total for cardboard 585 107 48.75
Total for Lenoir 706
Total for Rams Head 519
Combined total 1225
Total annual emissions are estimated at 706 metric tons for Lenoir, and 519 metric tons for Rams
Head, for a grand total of 1,225 metric tons of CO2e.

32
Conclusions Overall, and not surprisingly, the processing of waste generated by CDS accounts for a
significant portion of CDS’s total carbon ―foodprint.‖
Referring to ―CO2e Emissions per Ton of Waste,‖ it becomes apparent that composting
waste is significantly less carbon-intensive than land-filling it. Decomposing garbage creates
significant amounts of ―landfill gas.‖25
Landfill gas is composed of about 50% carbon dioxide,
50% methane (a greenhouse gas roughly 20 times as potent as carbon dioxide), and non-methane
organic compounds. Municipal solid waste landfills accounted for 23% of human-related
methane emissions in the U.S. in 2006. The fact that the Orange County landfill does not utilize
this landfill gas in any way to generate energy means that the gases are allowed to escape into the
atmosphere, creating local smog and global climate change.26
Composting garbage avoids the
creation of these emissions, not to mention it allows matter to be reused productively, and
reduces the need for synthetic fertilizers (which are CO2e-intensive and are responsible for much
ocean eutrophication).
Transportation to waste management facilities does not seem to significantly contribute
to carbon dioxide emissions. However, this does not imply that transportation is negligible.
Since the WARM model measures carbon dioxide equivalent emissions in metric tons (a
relatively large-scale unit), transportation to the waste management facilities (which are located
only five to thirty-four miles away from campus) simply may not be able to affect a number
measured by such a large-scale unit.
25 ―Landfill Methane Outreach Program (LMOP).‖ Environmental Protection Agency. 22 April 2009.
http://www.epa.gov/lmop/overview.htm. 28 April 2009.
26 Some landfills have the capacity to capture, convert, and utilize landfill gas as an energy source.

33
PACKAGING EMISSIONS
In calculating the carbon footprint of CDS, it is important to consider the emissions due to
packaging materials used to transport food to UNC. These materials are varied and abundant,
and are used in both the food’s transportation and preservation.
Method
Packaging materials and their specific quantities were found in the Office of Waste Reduction
and Recycling (OWRR)’s Fiscal Year 2008-2009 Trend Report. The specific CO2e conversion
factors for the production of packaging materials in metric tons were taken from the
Environmental Protection Agency’s (EPA) WAste Reduction Model (WARM).1
OWRR provided numbers only from July through December 2008. Month-to-month
averages, recommended by OWRR and CDS, wre used to calculate the quantities and CO2
equivalencies for the remaining months. The values for July 2008 to December 2008 were
averaged. The averaged value was used for the months of January, May and June. September
values were used for February because CDS believes the two months usually have similar
values. And the averaged values of October and November were used for March and April.
Database Assumptions
OWRR’S Fiscal Year 2008-2009 Trend Report was used to obtain the most accurate carbon
footprint as possible for packaging materials used by CDS. OWRR’s Fiscal Year 2008-2009
Trend Report, specifically page 48, is a record of the total waste produced by CDS from July 8,
2008 to December 8, 2008. The waste is grouped into specific categories and weights. It was
assumed that specific waste materials and measurements listed in OWRR’s trend report would
provide an accurate representation of the types and total weight of packaging material that pass
through CDS.
The packaging materials, based on recommendations from both CDS and OWRR, were
divided into two categories: (1) cardboard and (2) bottles and cans. OWRR was unable to
provide the exact percent composition of the bottles and cans. However, based on OWRR’s
recommendations and council, the category ―Bottles and Cans‖ was divided into two sections:
plastic, accounting for 80% and steel cans, accounting for 20%. The plastic was divided into
three subcategories: HDPE 46%, LDPE 15%, and PET 40%. Because EPA did not provide CO2e
values for plastic, the plastic CO2e was calculated by breaking down the total plastic value into
three percentage-based categories. It was assumed that each subcategory’s CO2e could calculated
using the above method and then added together to obtain a rough estimate of the total plastic
CO2e value. It was also assumed that the CO2e value for steel cans could be added to that of
plastic to produce the total CO2e value for bottles and cans.

34
Results
Table 10.
Emissions from Production of Packaging (in metric tons of CO2e) for Top of Lenoir
*The cardboard compactor for Lenoir is also used by the Student Union
Month Cardboard
Quantity* Cardboard CO2
Equivalent Bottles and Cans
Quantity** Bottles and Cans
CO2 Equivalent
July 2008 5.19 29.01 0.209 0.467
August 2008 9.34 52.21 0.073 0.165
September 2008 12.66 70.77 0.390 0.878
October 2008 6.92 38.68 0.853 1.920
November 2008 5.24 29.29 0.481 1.080
December 2008 3.37 18.84 0.281 0.632
January 2009 7.12 39.80 0.381 0.857
February 2009 12.66 70.77 0.390 0.878
March 2009 6.92 38.68 0.853 1.920
April 2009 6.92 38.68 0.853 1.920
May 2009 7.12 39.80 0.381 0.857
June 2009 7.12 39.80 0.381 0.857
Annual 97.70 546.13 5.910 13.29

35
Table 11.
Emissions from Production of Packaging (in metric tons CO2e) for Rams Head
** OWRR was unable to provide an exact percent composition of the bottles and cans. The
calculations and numbers used to get this number can be found at the end of this section27
27
The below method was also used in the ―Bottles and Cans‖ calculations for Rams Head dining hall.
Based on OWRR’s recommendations and council, the category ―Bottles and Cans‖ was divided into two sections:
plastic accounting for 80% and steel cans accounting for 20%. Furthermore, the plastic can be divided into three
subcategories: HDPE 46%, LDPE 15%, and PET 40%. The CO2 Equivalent calculation for Bottles and Cans, in the
month of July for Top of Lenoir dining hall is displayed below to illustrate how the CO2 emissions are calculated for
the bottles and cans.
0.209 x 20% = 0.042 (Steel Cans) 0.042 x 3.19 (EPA value) = 0.133
0.209 x 80% = 0.167 (Plastics)
0.167 x 46% = 0.076 (HDPE) 0.076 x 1.8 (EPA value) = 0.137
0.167 x 15% = 0.025 (LDPE) 0.025 x 2.29 (EPA value) = 0.056
0.167 x 40% = 0.067 (PET) 0.067 x 2.11 (EPA value) = 0.141
Total CO2 Produced = 0.133 + 0.137 + 0.056 + 0.141 = 0.467 metric tons
Month Cardboard
Quantity Cardboard CO2
Equivalent Bottles and Cans
Quantity** Bottles and Cans
CO2 Equivalent
July 2008 2.27 12.73 0.354 0.776
August 2008 5.11 28.55 0.290 0.653
September 2008 7.12 39.80 0.345 0.754
October 2008 12.44 69.56 0.680 1.530
November 2008 10.94 61.14 0.526 1.180
December 2008 6.38 35.64 0.372 0.838
January 2009 7.38 41.24 0.478 0.955
February 2009 7.12 39.80 0.345 0.754
March 2009 11.69 65.35 0.603 1.360
April 2009 11.69 65.35 0.603 1.360
May 2009 7.38 41.24 0.478 0.955
June 2009 7.38 41.24 0.478 0.955
Annual 96.90 435.05 5.550 10.710

36
Table 12.
Total Emissions from Production of Packaging
Cardboard
Quantity
(metric tons)
Cardboard CO2
Equivalent
(metric tons)
Bottles and Cans
Quantity. metric
tons
Bottles and Cans
CO2e, metric tons
Lenoir 97.70 546.13 5.910 13.290
Rams Head 96.90 435.05 5.550 10.710
Annual 194.60 981.18 11.460 24.000
Conclusions
The above tables display the quantities and CO2e values of the two packaging categories of
cardboard and bottles and cans for an entire year, starting from July 2008 to June 2009. The total
for CO2 equivalent emissions for the packaging material used by Top of Lenoir Dining Hall is
559.42 metric tons, while Rams Head dining hall used packaging responsible for 445.76 metric
tons. Therefore, the CO2 emissions from the packaging materials used by both dining halls total
1005.18 metric tons. Based on the assumptions made about the breakdown of bottles and cans
and their resulting methods of calculations, the resulting CO2e value for bottles and cans was
surprisingly less than that for cardboard. If the values for bottles and cans are accurate, then it
can be assumed that the production of plastics and steel cans is far less carbon-intensive than the
production of cardboard. However, the above CO2e values only account for the production of the
packaging materials and do not address any other aspects of the packaging life cycle analysis. In
other words, the CO2e values for the disposal of the packaging materials or other negative
externalities that result from the production or use of the material are not represented in the
numbers above. For example, cardboard can be composted, which produces less CO2 than other
means of disposal. The entire life cycle analysis for cardboard might reveal that it actually has a
smaller carbon footprint that plastics and steel can. Therefore, it is difficult to make
recommendations based on the above numbers alone. However, based solely on the number
above, the use of plastics and steel cans is less carbon intensive than the use of cardboard in
packaging materials.

37
Part III: LOOKING AHEAD
Conclusion
The results and conclusions presented in sections I and II point to several key findings regarding
the campus dining system at UNC and the worldwide food system as a whole. Based on
calculations and processes detailed above, it is concluded that the total carbon footprint of
Carolina Dining Services is 8,028.98 metric tons. Due to numerous data gaps and assumptions,
the numerical accuracy of the total CO2e emissions produced by UNC’s food and food waste
systems is uncertain. However, the analysis provided in this report allows for the identification
of certain ―carbon hotspots,‖ or unusually carbon-intensive processes.
Results presented in Part II further highlight changes to CDS food purchasing and waste
processing that would most efficiently and effectively reduce CDS’s total carbon footprint. As
meat products were demonstrated to emit the most carbon per pound, implementing changes in
this category offers the most cost-effective means of reducing CDS’ carbon footprint. Research
presented by the University of Surrey concludes that while organic and local foods are widely
considered to be the most environmentally-friendly option, consuming less meat products trumps
both eating locally-sourced food and eating organically-grown food in terms of total CO2e
emissions saved.28
Thus, a person can most effectively decrease the carbon footprint of their diet
by eating a vegetarian versus a meat-eating diet. Furthermore, the results reveal that composting
emits a mere fraction of the emissions associated with landfills. Therefore, every effort should
be made by CDS to expand its composting program, as well as reduce food waste and garbage.
While the results of this report are presented in tons of CO2e emissions, it is important to
note that this unit does not capture the true environmental cost of the world’s food system. In an
analysis of ten foods by Cranfield University for the U.K.’s DEFRA, for all ten foods analyzed,
nitrous oxide (N2O) contributes more to global warming potential (GWP) than does CO2, in
some cases accounting for over 80% of a food’s total GWP.29
Considering only the CO2
emissions of a product or process overlooks the myriad other environmental impacts that stem
from the release of other harmful gases, including nitrous oxide. Emissions of N2O have been
associated with increased ocean eutrophication and deposition of acid rain, as well as climate
change.30
Nitrous oxide, while less abundant in the atmosphere than carbon dioxide, traps heat
310 times more efficiently than CO2, making it a dangerous and important greenhouse gas.31
The Cranfield University report further notes that while N2O emissions are significant, there is
little understanding of how to quantify this type of emission, and even less data relating N2O
emissions to food systems. Thus, while at present it is not feasible to conduct a nitrous oxide-
based footprint analysis of the UNC campus dining system, the disadvantages of considering
only carbon dioxide equivalent emissions should be noted.
28 Brandao, Miguel. ―Life-Cycle Carbon Emissions from Food Systems.‖ 2008. University of Surrey
29 Williams, Adrian. ―Environmental Burdens of Agricultural and Horticultural Commodity Production – LCA.‖
Cranfield University.
30 U.S. EPA. ―Health and Environmental Impacts of NOx‖. 2008
31 U.S. EPA. ―Nitrous Oxide‖. 2006

38
Recommendations
Targeted Approaches to CO2e Reduction
The research and findings of this study illuminated several targeted improvements affecting a
single sector of UNC’s Campus Dining Services that can be made one at a time in order to
gradually reduce the total amount of carbon dioxide equivalent emissions. These measures are
―targeted,‖ as they focus primarily on carbon hotspots and unnecessary carbon emissions. It is
feasible for these recommendations to be implemented in a relatively short time period, and most
of them do not require a monetary investment.
The first of these involves dramatically reducing the amount of beef purchased by CDS.
Beef is the most carbon-intensive (emitting the highest level of CO2e per volume) food product
that CDS currently orders. Thus, it follows that decreasing the amount of beef, more so than any
other food product currently ordered by CDS, would have the greatest impact on CDS’ total
carbon footprint. Thus, through reducing the amount purchased of only a single food item, CDS
could significantly reduce its total CO2e emissions.
The next step CDS could take toward reducing its carbon footprint is reducing the
amount of other high carbon-intensity food products, namely other meats and dairy. High
carbon-intensity products that also are unnecessary or don’t play an important dietary role, such
as soda, should be targeted to be reduced first. It seems that the most carbon-intensive products
tend to be the most expensive as well, so the aforementioned steps would most likely save CDS
money. An innovative idea explaining how to reduce CDS’ purchasing of meat follows (see
―Holistic Approaches to CO2e Reduction‖).
Aside from reducing carbon intensive food purchases on the supply side, influencing
behaviors on the demand side over the short term is also extremely important. Just as removing
trays from the dining hall has led to unexpected reductions in food consumption and waste,
discreetly altering food availability and choices is a very quick and easy way to reduce their
consumption. While much of CDS already depends on food servers to provide portions, as a
simple measure to effect reductions in wasteful consumption, transitioning further away from
self-serve stations is highly recommended. By only providing limited portion sizes, servers
reduce the amount of unnecessary food often taken by patrons. Of course, patrons would be
allowed to come back for seconds if they were still hungry. In all likelihood, though, most
patrons would be satisfied after a single ―normal‖ serving. This initiative would reduce the
amount of total food served (and thus, purchased, wasted, etc.) by CDS, since most people, when
confronted with a self-serve station, pile more food on their plates than they actually need or
want. This initiative would require certain sections of both dining halls to be remodeled, as well
as hiring more employees to work as servers.
The last targeted improvement that CDS should strive to implement involves simply
paying attention to the packaging that food arrives in; in particular, CDS should assess whether
the packaging is excessive, or can be composted. While certain food products that come in less-
than-ideal packaging (plastic wrap, for example, which is not compostable) may be necessary to
buy, it is possible that others can be eliminated from CDS’ menu or replaced with a substitute
that is packaged in less material, or material that can be composted. Purchasing food packaged
in compostable materials, rather than materials that must be thrown away, will significantly
reduce CDS’ carbon footprint.

39
Holistic Approach to CO2e Reduction The following initiatives would serve to increase awareness amongst CDS’ patrons regarding
how their food choices affect CDS’ total carbon footprint, as well as their own individual carbon
footprint. These initiatives would also serve to change behavioral patterns over time, hopefully
causing CDS patrons to make more environmentally sustainable choices.
CDS should consider offering vegetarian-only meal plans, with the option at each meal to
pay an added cost for meat products. In both Top of Lenoir and Rams Head, the layout is
already conducive to such a distinction, as all meat products would simply have to be relocated
to the grill and rotisserie areas. Before entering the meat section, each patron would be required
to swipe their One card a second time, which would either charge to their tuition bill or debit
from their Dining Flex account the appropriate amount determined by CDS officials.
The basic vegetarian meal plan could be cheaper than the traditional plans currently
offered. This may not detract from CDS’ revenue, since meat products are by far the most
expensive products CDS purchases. Requiring a second swipe at the meat section would allow
CDS to track the demand for meat products more accurately, which would inform CDS of the
correct amount of meat to buy per ordering period. This would help CDS avoid purchasing
excessive meat products, saving CDS money. The total cost of the basic meal plan (per meal)
plus the added fee for meat products at a single meal could be approximate to the cost of CDS’
current meal plan (per meal), although this is decision that would need to be made carefully.
Avoiding the purchase of excessive meat products would also reduce CDS’ total carbon
footprint. Furthermore, this initiative would help CDS avoid the creation of more waste, and the
associated CO2e emissions. This initiative would have the added benefit of not only reducing
meat purchasing, but also meat demand. Many college students are money-conscious, and thus a
monetary incentive to reduce one’s consumption of meat would likely decrease the amount of
meals at which he or she eats meat.
Another improvement for CDS to consider is expanding the use of reusable to-go
containers. These were recently introduced to Rams Head and Top of Lenoir. Patrons can buy
access to these containers for $3.50 per year, as opposed to using the traditional Styrofoam
containers for free. In coming years, CDS should completely eliminate usage of the Styrofoam
containers and offer the reusable containers at small or no cost. The money for this project
perhaps could come from a small increase in student fees, assuming students would vote to pass
this referendum. Until this initiative is implemented, CDS should replace the Styrofoam
containers with biodegradable corn-based to-go containers, which can be composted (and even if
they are accidentally thrown away, they biodegrade much quicker than Styrofoam). Boston’s
Northeastern University recently implemented this change.32
Large-Scale Approaches to CO2e Reduction A couple of improvements can be made to the CDS system to reduce its total carbon footprint,
but would require a significant financial investment, as well as an overhaul of the system.
The University should establish space for the purpose of composting. While the
transportation of food scraps to Goldston, NC (where they are composted) does not account for a
huge portion of the emissions associated with the composting process, composting on-site would
further reduce UNC’s total emissions. This change would also save CDS money, since it will no
32 Leahy, Kate. ―SPECIAL REPORT: The Era of Sustainability.‖ Restaurants and Institutions. 15 October 2008.
http://www.rimag.com/article/CA6603586.html. 28 April 2009.

40
longer have to contract with a private company to transfer and compost its food scraps. Also,
having an on-site composting center hopefully will allow CDS and UNC in general to expand the
list of materials that it designates to be composted, diverting waste from landfills, and
significantly reducing UNC’s carbon footprint.
Middlebury College in Vermont recently implemented this practice.33
While Middlebury
College is a much smaller institution, the amount of food scraps composted there (300 tons per
year) is comparable to the amount of food scraps composted at UNC (about 382.13 tons per
year). Middlebury College uses a Passively Aerated Windrow System, which would be ideal for
UNC. This system does not require actively turning the piles of compost, has low start-up and
maintenance costs, reduces odors and pests, and requires little staff time or special skills. The
only materials and items needed to implement this system on UNC’s campus are an acre of land,
a truck to transport compost from the dining halls, a food waste storage container, a concrete
pad, manure, wood chips, and perforated PVC pipes. Manure could be obtained from local
farms. The resulting compost could then be used for campus landscaping purposes, reducing, if
not eliminating, the need to ship fertilizer to UNC, further reducing the University’s emissions.
Finally, if enough compost was made on campus, it could be sold back to local organic farmers,
helping UNC actively sustain an alternative food system, and support local agriculture.
Finally, CDS could shift to purchasing more regional, native, and seasonal produce.
Purchasing local food decreases the amount of emissions from transportation that a food product
creates. However, at a meeting with FLO Foods and CDS officials, it became clear that farms
within 150 miles (the standard definition of a ―local farm‖) simply do not produce enough food
to supply CDS with all the food products it needs to best serve the UNC community. But this
does not mean that CDS should give up on reducing ―food miles‖ altogether. Instead, CDS
should take a regional approach to food purchasing, buying from the entire southeast region. As
CDS currently purchases food from all over the country, this regional approach would help CDS
lower its carbon footprint. Emory University has been practicing this approach to dining hall
food-purchasing since 2003.34
An added benefit of this regional approach, as opposed to a local
approach, is that Emory has been able to be more flexible when choosing the farms it buys from,
for example, dining officials could choose to patronize a very sustainable farm slightly farther
away, rather than a local farm that does not use sustainable agricultural practices.
CDS also should commit to buying more native and seasonal crops. This means
developing a menu based on crops that naturally grow in the region. For example, peanuts
naturally grow year-round in the region, so should be more heavily incorporated into CDS’s
menu as a protein and flavoring option (while remaining an identified ingredient, so that peanut-
sensitive diners can steer clear). CDS’s menu also should change according to what grows best
during the current season. An example of how CDS might do this is only offering apples from
mid-August through late February, since this is the time period when they are in season. Crops
require much less energy-intensive practices, such as building and maintaining a greenhouse,
when they are growing in a suitable region and during the appropriate season. Thus, it follows
that purchasing as many native and seasonal crops as possible would significantly reduce the
portion of CDS’s carbon footprint associated with actual agricultural practices.
33 ―Compost Happens at Middlebury College.‖ http://community.middlebury.edu/~enviroc/compost.html. 28 April
2009. 34 Carlson, Scott. ―Colleges Chew on Local-Food Phenomenon.‖ Chronicle of Higher Education. 26 September
2003. http://www.chronicle.com. 16 April 2009.

41
Future Directions
By analyzing the data found in this primary study and considering the recommendations made,
we developed a number of proposals for a future UNC Institute for the Environment capstone
project. While the spring 2009 group successfully quantified the approximate CO2e emissions of
the dining services, future projects could work toward a goal of improving the accuracy of this
number, while pursuing approaches to reduce it.
With the completion of the spring 2009 study, a huge step has been taken toward a more
comprehensive, replicable investigation of the food industry. However, as discussed before,
certain data holes were inevitable, based on the current state of science in the field of carbon-
footprinting food services. One notable hole is the lack of accurate ―food-miles‖ incorporated in
the final emission totals.
Firstly, as a direct continuation of this project, the next capstone group could partner with
a for-profit company, such as a private consulting firm. This may allow the capstone group
access to previously unattainable data. This group could focus on investigating exactly where
each food item comes from before being shipped to Sysco, which will answer with more
certainty the question—of great current interest to the public—regarding the impact of ―food-
miles.‖
The next idea requires working closely with Carolina Dining Services. Based on the data
presented in this report, a capstone group could quantify the emissions from particular meals
served at Rams Head and Top of Lenoir. The group could create a sample menu of dining hall
meals, and calculate the emissions associated with these meals, adopting a more specific
approach than could be achieved with the holistic scope of this study. The group would provide
the dining halls with displays, similar to the nutritional displays currently in use, which would
indicate to patrons exactly how their meal choices impact the climate.
Being constrained by time, this project did not include the creation of a carbon emissions
calculator. UNC’s dining services would certainly benefit from having a calculator based on the
typical Lenoir and Rams Head menu. Requiring certain computer programming skills, a future
capstone group could create its own calculator, similar to the online user-friendly calculator
created by Bon Appétit. Those who prepare the meals could input into the calculator all the food
items and respective quantities used, and then a total emissions value would be reported. To
make the number more understandable to the everyday dining hall customer, the value could be
reported in hours idling a car or distance traveled in a car. This would allow dining
administrators and chefs to continue advertising carbon dioxide equivalent values no matter how
their menus change over many years to come.
The emission quantities provided in this report alone may not offer enough evidence for
CDS to make serious changes—the changes necessary for the campus to reach carbon neutrality.
If this is the case, they may seek an additional study involving an investigation of eater behavior
which could complement a project in the anthropology department. The project could begin with
simply observing dining hall customers as well as creating surveys to learn why diners eat
certain quantities of food and how they choose exactly what to eat. The project would focus on
feasible, valuable recommendations for reducing the carbon footprint of food on campus. For
example, proposing a practical, but different layout for the dining halls in order to reduce
consumption and waste may be an outcome of this capstone project.