Embed Size (px)
Citation preview

Campus Budget BriefingUC Davis Shared Service Center
May 30, 2014

2|Annual Budget Briefing – May 30, 2014
UC DavisCampus Facts
Started in 1905 as the "farm" for UC Berkeley. Founded as a separate campus in 1959.
Students as of fall 2013: 34,000
4 colleges, 6 professional schools
99 undergraduate majors
90 graduate programs
23 intercollegiate sports (NCAA Division I)
UC Davis accounts for $6.9 billion and 69,000 jobs
22,500 employees (4,100 academic, 14,900 staff, 3,500 students)
Member of the Association of American Universities
1st in the world for agriculture and forestry (QS World University Rankings, 2014)
9th ranked public university by U.S. News & World Report
1st in Sierra Magazine 2012 “Cool Schools” Survey
Health System:• Top Hospital and
"A" Hospital Safety Award, Leapfrog Group
• Consumer Choice Award, National Research Corporation
Research Funding:
• 13th among U.S. ranked public universities
• 21nd among public and private universities
3|Annual Budget Briefing – May 30, 2014
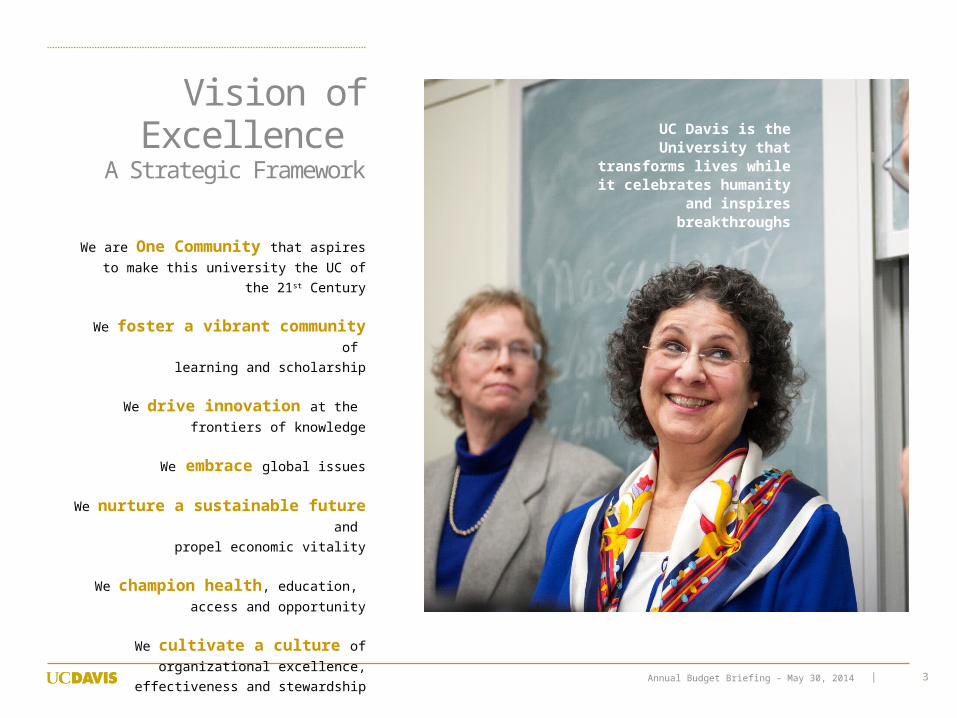
Vision of Excellence
A Strategic Framework
We are One Community that aspires
to make this university the UC of the 21st
Century
We foster a vibrant community of
learning and scholarship
We drive innovation at the
frontiers of knowledge
We embrace global issues
We nurture a sustainable future and
propel economic vitality
We champion health, education,
access and opportunity
We cultivate a culture of
organizational excellence, effectiveness
and stewardship
UC Davis is the University that
transforms lives while it celebrates humanity
and inspires breakthroughs

4|Annual Budget Briefing – May 30, 2014
Annual Budget Process
Financial Stability, Invest in Strengths, Rebuild
Foundation
Fixed costs for state/tuition Estimate %
Benefits, composite rate increase $12.3 33%
Faculty, merit and 3% $13.5 36%
Staff, 3% and contracts $8.5 23%
Deferred Maintenance, renewal $2.8 8%
Total $37.1 100%
CAMPUS BUDGET PROCESS
Call letter – February 24, 2014
Budget meetings – April/May
Faculty Hiring call – April
BALANCED APPROACH
Revenue – 2020, State, Other
Fixed costs – salaries, benefits, retirement, deferred maintenance
Investments – capital (classrooms, maintenance), graduate student support, library, student success (honors, advising)
BUT, CHALLENGES REMAIN
Bridge with reserves
Continue efficiencies – Administration for 21st Century
Tuition policy –multi-year framework is needed
Core fund shortfall of $13M likely to increase to $21 million
State Un-restricted $342 (9%)
Tuition $413 (11%)
Indirect Cost Recovery $124 (3%)
Grants and Contracts $513 (14%)
Federal (Hatch, Pell Grants) $56 (2%)
Sales and Service, Auxiliary$410
(11%) Gifts, Endowments, Interest, Other
$154 (4%)
State Designated and Restricted $46
(1%)
Student Fees $166 (4%)
Medical Center $1,531 (41%)
2013-14 ProjectionsUC Davis Revenue$3.8 billion

5|Annual Budget Briefing – May 30, 2014
Incentive-Based Budget Model
FRAMEWORK
Revenue allocation model; allocates funds to deans not departments
Provost retains portion centrally for cross-subsidy and strategic investments
Incentives drive growth allocations and re-allocations of base
Uses principles and metrics for accountability
PROCESS
White papers as tool to provide analysis and frame policy decisions
Use transition and bridging strategies
Recognize significance of cultural change
MODULES
Undergraduate tuition. Model uses student credit hours, majors and degrees awarded. Incentivizes cross college teaching.
Indirect Cost Recovery. 37% of Indirect Cost Recovery allocated to unit generating revenue.
Summer tuition. Model uses student credit hours with new, direct participation by deans.
Graduate tuition. New model removes NRST barrier for 2nd and 3rd year International PhD students. Incentives for masters and TAs.
Faculty resources. More autonomy for deans and central funds to support Hiring Incentive Program (HIP) Provost allocation. Fund common goods and provide subsidies across academic units.

6|Annual Budget Briefing – May 30, 2014
2020 Initiative
GOALS
Ensure access for California students and increase opportunities for national and international students
Stabilize our finances
Increase tenure-track faculty to strengthen research, teaching and outreach
Internationalize the campus
Boost regional economic development and create new jobs
PROCESS
Task forces – academic resources, enrollment management, facilities
Consultation and refinement of initial proposal
Academic Senate review
Decision to proceed
Implementation plan
FRAMEWORK
5,000 undergraduates – 500 residents and 4,500 national and international; more opportunities for graduate and professional
300 faculty (tenure track and teaching faculty)
Rate of growth adjusted to capacity in human and physical resources

7|Annual Budget Briefing – May 30, 2014
2020 InitiativeEarly Results
Fall 2011 to Fall 2013
UNDERGRADUATE STUDENTS
All applications have increased: residents (+11%), national (+146%), international (+355%); higher selectivity
More applications from underrepresented students: +27%
Added 1,500 undergraduates; proportion national/international increased from 4% to 7%
INVESTMENTS
$26+ million – investments for instructional programs and student success including advising, gateway courses, TAs, classroom enhancements, student counseling, recruitment and yield
Capital Program (new and renewal):
• Classrooms (e.g., 600-seat, Walker Hall, Testing Center)
• Laboratory and Office space
• International Center
• Student Housing
FACULTY
Over 110 searches authorized this year
Received 76 Hiring Incentive Program (HIP) proposals

8|Annual Budget Briefing – May 30, 2014
Staffing Trends2008 to 2013
Core Fund employees 2008 2013 change
Ladder Faculty and Other Academic
1,863 1,775 -5%
Staff 3,287 2,913 -11%
SMG and MSP 289 220 -24%
Students 1,327 1,445 9%
Total 6,766 6,353 -6%
MIDDLE MANAGEMENT FOR ALL FUNDS DECLINED
Number of supervisors declined by 15 percent (~230 FTE)
Staff-to-supervisor ratio increased ~5 staff per supervisor to ~6 staff per supervisor
THE ACADEMIC CORE HAS BEEN OUR HIGHEST PRIORITY FOR STATE FUNDS/TUITION
The number of staff working in general administration units declined from 11% of all employees to 9%.
Number of faculty and academic employees on core sources declined by 90 (5%), while the number of staff declined by 443 (11%).
Among staff, the number of managers and senior professional positions declined by 24% while the number of all other staff positions declined by 11%.

9|Annual Budget Briefing – May 30, 2014
Deferred Maintenance
One TimeFunds$12,754,722 Permanent Allocation
$4,900,000
Debt (Facilities Renewal)
$4,414,000
2005-2013 DM InvestmentRECENT INVESTMENTS
2005-2013 investment: ≈ $22 million
Statewide Energy Partnership Program (SEPP):
2010 -2014: ≈$60 million
Investments are opportunistic and intended to leverage modest base budget (<$1M)
BACKLOG
In 2012, UC Davis worked with a facility asset advisor to determine DM backlog on
campus.
Need of $1.3 billion was identified
One of highest backlogs in the system
FUTURE INVESTMENTS
Chancellor and Provost established biannual allocations as part of campus and health
system budget process to provide a source for a multi-year investment plan of $75
million
Many capital projects include substantial renewal elements
Capital plan also includes many IT infrastructure projects

10|Annual Budget Briefing – May 30, 2014
Research Outcomes and
Initiatives
In 2012-13, research grew to $754 million, making UC Davis the only UC
campus to have experienced a constant increase in
funding in recent years.
In 2012-13, investment in research and scholarship = $18 million
through the Office of Research.
RISE (Research Investment in Science and
Engineering) = $11 million over 3 years
IFHA (Interdisciplinary Frontiers in
Humanities And Arts) = $3.6 million over 3 years
Research Bridge = $3.0 million to increase support of the research bridge
program

11|Annual Budget Briefing – May 30, 2014
The public phase of
The Campaign for UC Davis
began in October 2010 with
the goal of raising $1 Billion
from 100,000 donors.
As of March 2, 2014,
$1.081 billion has been raised from 107,328 donors.
For the 2013-14 academic
year, over $108 million
has been raised to date.

12|Annual Budget Briefing – May 30, 2014
One World,One UC Davis
UC Davis is a global network that is transforming lives, celebrating humanity and inspiring breakthroughs. This message is already integrated in our Health System, Athletics and the World Food Center

13|Annual Budget Briefing – May 30, 2014
Improving the Student
Experience
A blue-ribbon committee identified several issues that need to be
addressed:
AdvisingFinancial AidCounseling
Time-to-degree
In 2013-14, UC Davis is investing more than $20 million in Advising,
TAs, Counseling Services and support for Undocumented Students. We are
also initiating the first Faculty in Residence program in our student
dorms.