Embed Size (px)
Citation preview

Glasgow Theses Service http://theses.gla.ac.uk/
Campos, Joana Monteiro de (2016) TRIB2 in human AML: a biological and clinical investigation. PhD thesis. http://theses.gla.ac.uk/7499/ Copyright and moral rights for this thesis are retained by the author A copy can be downloaded for personal non-commercial research or study This thesis cannot be reproduced or quoted extensively from without first obtaining permission in writing from the Author The content must not be changed in any way or sold commercially in any format or medium without the formal permission of the Author When referring to this work, full bibliographic details including the author, title, awarding institution and date of the thesis must be given
TRIB2 in human AML: a biological and clinical investigation
Joana Monteiro de Campos BSc, MRes
A thesis submitted in fulfilment of the requirements for the degree of Doctor of Philosophy
Institute of Cancer Sciences College of Medical, Veterinary and Life Sciences
University of Glasgow
July 2016
2
Abstract
Acute myeloid leukemia (AML) involves the proliferation, abnormal survival and arrest of
cells at a very early stage of myeloid cell differentiation. The biological and clinical
heterogeneity of this disease complicates treatment and highlights the significance of
understanding the underlying causes of AML, which may constitute potential therapeutic
targets, as well as offer prognostic information. Tribbles homolog 2 (Trib2) is a potent
murine oncogene capable of inducing transplantable AML with complete penetrance. The
pathogenicity of Trib2 is attributed to its ability to induce proteasomal degradation of the
full length isoform of the transcription factor CCAAT/enhancer-binding protein alpha
(C/EBPα p42). The role of TRIB2 in human AML cells, however, has not been
systematically investigated or targeted.
Across human cancers, TRIB2 oncogenic activity was found to be associated with its
elevated expression. In the context of AML, TRIB2 overexpression was suggested to be
associated with the large and heterogeneous subset of cytogenetically normal AML
patients. Based upon the observation that overexpression of TRIB2 has a role in cellular
transformation, the effect of modulating its expression in human AML was examined in a
human AML cell line that expresses high levels of TRIB2, U937 cells. Specific
suppression of TRIB2 led to impaired cell growth, as a consequence of both an increase in
apoptosis and a decrease in cell proliferation. Consistent with these in vitro results, TRIB2
silencing strongly reduced progression of the U937 in vivo xenografts, accompanied by
detection of a lower spleen weight when compared with mice transplanted with TRIB2-
expressing control cells. Gene expression analysis suggested that TRIB2 modulates
apoptosis and cell-cycle sensitivity by influencing the expression of a subset of genes
known to have implications on these phenotypes. Furthermore, TRIB2 was found to be
expressed in a significant subset of AML patient samples analysed. To investigate whether
increased expression of this gene could be afforded prognostic significance, primary AML
cells with dichotomized levels of TRIB2 transcripts were evaluated in terms of their xeno-
engraftment potential, an assay reported to correlate with disease aggressiveness observed
in humans. A small cohort of analysed samples with higher TRIB2 expression did not
associate with preferential leukaemic cell engraftment in highly immune-deficient mice,
hence, not predicting for an adverse prognosis. However, further experiments including a
larger cohort of well characterized AML patients would be needed to clarify TRIB2
significance in the diagnostic setting. Collectively, these data support a functional role for
TRIB2 in the maintenance of the oncogenic properties of human AML cells and suggest
TRIB2 can be considered a rational therapeutic target.
3
Proteasome inhibition has emerged as an attractive target for the development of novel
anti-cancer therapies and results from translational research and clinical trials support the
idea that proteasome inhibitors should be considered in the treatment of AML. The present
study argued that proteasome inhibition would effectively inhibit the function of TRIB2 by
abrogating C/EBPα p42 protein degradation and that it would be an effective
pharmacological targeting strategy in TRIB2-positive AMLs. Here, a number of cell
models expressing high levels of TRIB2 were successfully targeted by treatment with
proteasome inhibitors, as demonstrated by multiple measurements that included increased
cytotoxicity, inhibition of clonogenic growth and anti-AML activity in vivo.
Mechanistically, it was shown that block of the TRIB2 degradative function led to an
increase of C/EBPα p42 and that response was specific to the TRIB2-C/EBPα axis.
Specificity was addressed by a panel of experiments showing that U937 cells (express
detectable levels of endogenous TRIB2 and C/EBPα) treated with the proteasome inhibitor
bortezomib (Brtz) displayed a higher cytotoxic response upon TRIB2 overexpression and
that ectopic expression of C/EBPα rescued cell death. Additionally, in C/EBPα-negative
leukaemia cells, K562 and Kasumi 1, Brtz-induced toxicity was not increased following
TRIB2 overexpression supporting the specificity of the compound on the TRIB2-C/EBPα
axis. Together these findings provide pre-clinical evidence that TRIB2- expressing AML
cells can be pharmacologically targeted with proteasome inhibition due, in part, to
blockage of the TRIB2 proteolytic function on C/EBPα p42.
A large body of evidence indicates that AML arises through the stepwise acquisition of
genetic and epigenetic changes. Mass spectrometry data has identified an interaction
between TRIB2 and the epigenetic regulator Protein Arginine Methyltransferase 5
(PRMT5). Following assessment of TRIB2‟s role in AML cell survival and effective
targeting of the TRIB2-C/EBPα degradation pathway, a putative TRIB2/PRMT5
cooperation was investigated in order to gain a deeper understanding of the molecular
network in which TRIB2 acts as a potent myeloid oncogene. First, a microarray data set
was interrogated for PRMT5 expression levels and the primary enzyme responsible for
symmetric dimethylation was found to be transcribed at significantly higher levels in AML
patients when compared to healthy controls. Next, depletion of PRMT5 in the U937 cell
line was shown to reduce the transformative phenotype in the high expressing TRIB2
AML cells, which suggests that PRMT5 and TRIB2 may cooperate to maintain the
leukaemogenic potential. Importantly, PRMT5 was identified as a TRIB2-interacting
protein by means of a protein tagging approach to purify TRIB2 complexes from 293T

4
cells. These findings trigger further research aimed at understanding the underlying
mechanism and the functional significance of this interplay.
In summary, the present study provides experimental evidence that TRIB2 has an
important oncogenic role in human AML maintenance and, importantly in such a
molecularly heterogeneous disease, provides the rational basis to consider proteasome
inhibition as an effective targeting strategy for AML patients with high TRIB2 expression.
Finally, the identification of PRMT5 as a TRIB2-interacting protein opens a new level of
regulation to consider in AML. This work may contribute to our further understanding and
therapeutic strategies in acute leukaemias.
5
Table of Contents
Abstract .................................................................................................................................. 2
Table of Contents ................................................................................................................... 5
List of Tables.......................................................................................................................... 8
List of Figures ........................................................................................................................ 9
List of Appendices ............................................................................................................... 10
List of Publications .............................................................................................................. 11
Acknowledgement................................................................................................................ 12
Author‟s Declaration ............................................................................................................ 13
List of Abbreviations............................................................................................................ 14
Chapter 1 .............................................................................................................................. 18
Introduction .......................................................................................................................... 18
1.1 Haemopoiesis ........................................................................................................ 19
1.2 Acute Myeloid Leukaemia .................................................................................... 22
1.2.1 History and classification of leukaemia ......................................................... 22
1.2.2 Pathology, epidemiology and etiology of AML ............................................ 23
1.2.3 AML classification ......................................................................................... 24
1.2.4 Molecular pathogenesis of AML ................................................................... 26
1.3 Tribbles .................................................................................................................. 31
1.3.1 Introduction to the Tribbles family ................................................................ 31
1.3.2 Tribbles in AML ............................................................................................ 33
1.3.3 TRIB2 ............................................................................................................. 35
1.4 The proteasome as a therapeutic target ................................................................. 36
1.4.1 The UPS ......................................................................................................... 36
1.4.2 Targeting the UPS .......................................................................................... 40
1.4.3 Mechanisms of anti-cancer activity of proteasome inhibitors ....................... 42
1.5 Aims ...................................................................................................................... 43
Chapter 2: ............................................................................................................................. 44
Materials and Methods ......................................................................................................... 44
2.1 Tissue Culture ........................................................................................................ 45
2.1.1 Culture of cell lines ........................................................................................ 45
2.1.2 Culture of murine primary cells ..................................................................... 46
2.1.3 Culture and recovery of human primary AML cells ...................................... 46
2.1.4 Plasmid vectors .............................................................................................. 47
2.1.5 Virus production ............................................................................................ 48
2.1.6 Virus titration ................................................................................................. 49
2.1.7 Transduction of suspension cells ................................................................... 49
2.1.8 Drugs .............................................................................................................. 49
6
2.2 PCR-based assays .................................................................................................. 50
2.2.1 Primer pair design .......................................................................................... 50
2.2.2 Total RNA extraction ..................................................................................... 52
2.2.3 Reverse Transcription PCR ............................................................................ 52
2.2.4 Standard Polymerase Chain Reaction (PCR) ................................................. 52
2.2.5 Quantitative PCR (qPCR) .............................................................................. 53
2.2.6 High-throughput qPCR – Fluidigm ................................................................ 54
2.3 Western blotting .................................................................................................... 55
2.3.1 Protein lysate preparation ............................................................................... 56
2.3.2 Protein quantification ..................................................................................... 57
2.3.3 Gel electrophoresis ......................................................................................... 57
2.3.4 Membrane transfer ......................................................................................... 58
2.3.5 Immunolabelling ............................................................................................ 58
2.4 Crosslinking Co-Immunoprecipitation analysis from transfected cells ................ 60
2.5 Animal work .......................................................................................................... 61
2.5.1 Ethical issues .................................................................................................. 61
2.5.2 In vivo models ................................................................................................ 62
2.6 Preparation of metaphase murine Trib2 AML cells for karyotyping .................... 65
2.7 Flow cytometry ...................................................................................................... 65
2.7.1 Assessment of surface antigen expression ..................................................... 65
2.7.2 Cell growth analysis ....................................................................................... 66
2.7.3 Annexin V / DAPI staining ............................................................................ 66
2.7.4 Cell cycle analysis using Propidium Iodine (PI) staining .............................. 67
2.7.5 GFP+ cells sorting .......................................................................................... 67
2.7.6 Lineage-Sca1+c-Kit+ (LSK) sorting with lineage depletion ......................... 68
2.8 Statistics ................................................................................................................. 69
Chapter 3 .............................................................................................................................. 70
Characterization of TRIB2 tumorigenic role in human AML ............................................. 70
3.1 Introduction ........................................................................................................... 71
3.2 Aims and Objectives ............................................................................................. 72
3.3 Results ................................................................................................................... 73
3.3.1 TRIB2 oncogenic activity is related to its elevated gene expression ............. 73
3.3.2 Primary murine Trib2-BM derived AML cells propagate AML in serially
transplanted mice ......................................................................................................... 75
3.3.3 Murine Trib2-induced AML exhibits normal cytogenetics ........................... 78
3.3.4 TRIB2 mRNA was detected in a subset of human AML cell lines ................ 79
3.3.5 TRIB2 expression is important in the maintenance of the oncogenic
properties of AML cells ............................................................................................... 81
3.3.6 Maintenance of TRIB2 expression is required for induction of AML in vivo ...
........................................................................................................................ 83
7
3.3.7 TRIB2 knockdown in U937 human AML cells changes expression of a subset
of genes ........................................................................................................................ 85
3.3.8 TRIB2 is expressed in a significant number of AML patient samples ........... 87
3.3.9 Higher expression of TRIB2 in primary human AML samples is not
predictive of preferential engraftment .......................................................................... 89
3.4 Discussion ............................................................................................................. 92
Chapter 4 .............................................................................................................................. 96
Proteasome inhibition selectively targets AML with high TRIB2 expression .................... 96
4.1 Introduction ........................................................................................................... 97
4.2 Aims and Objectives ............................................................................................. 98
4.3 Results ................................................................................................................... 99
4.3.1 Murine Trib2 AML cells are sensitive to Brtz treatment in vitro .................. 99
4.3.2 Brtz preferentially targets murine Trib2 AML cells rather than normal
haemopoietic cells ...................................................................................................... 101
4.3.3 Modulation of TRIB2 levels sensitizes AML cells to cytotoxicity induced by
proteasome inhibition ................................................................................................. 103
4.3.4 Brtz is selectively cytotoxic to high TRIB2 cells via the TRIB2-C/EBPα axis .
...................................................................................................................... 106
4.3.5 High TRIB2 AML cells are chemosensitive to proteasome inhibition in vivo ..
...................................................................................................................... 108
4.3.6 AML patient samples with high TRIB2 expression are sensitive to Brtz
treatment ..................................................................................................................... 110
4.4 Discussion ........................................................................................................... 111
Chapter 5: ........................................................................................................................... 116
Potential implication of arginine methylation in TRIB2-induced AML via PRMT5
interaction ........................................................................................................................... 116
5.1 Introduction ......................................................................................................... 117
5.2 Aims and Objectives ........................................................................................... 120
5.3 Results ................................................................................................................. 120
5.3.1 PRMT5 is elevated in AML ......................................................................... 120
5.3.2 PRMT5 is required for TRIB2-expressing AML cell growth and survival . 121
5.3.3 TRIB2 and PRMT5 interact in physiological conditions ............................. 123
5.4 Discussion ........................................................................................................... 124
Chapter 6: ........................................................................................................................... 128
Conclusions ........................................................................................................................ 128
6.1 Concluding remarks ............................................................................................ 129
Appendices ......................................................................................................................... 132
List of references ................................................................................................................ 175
8
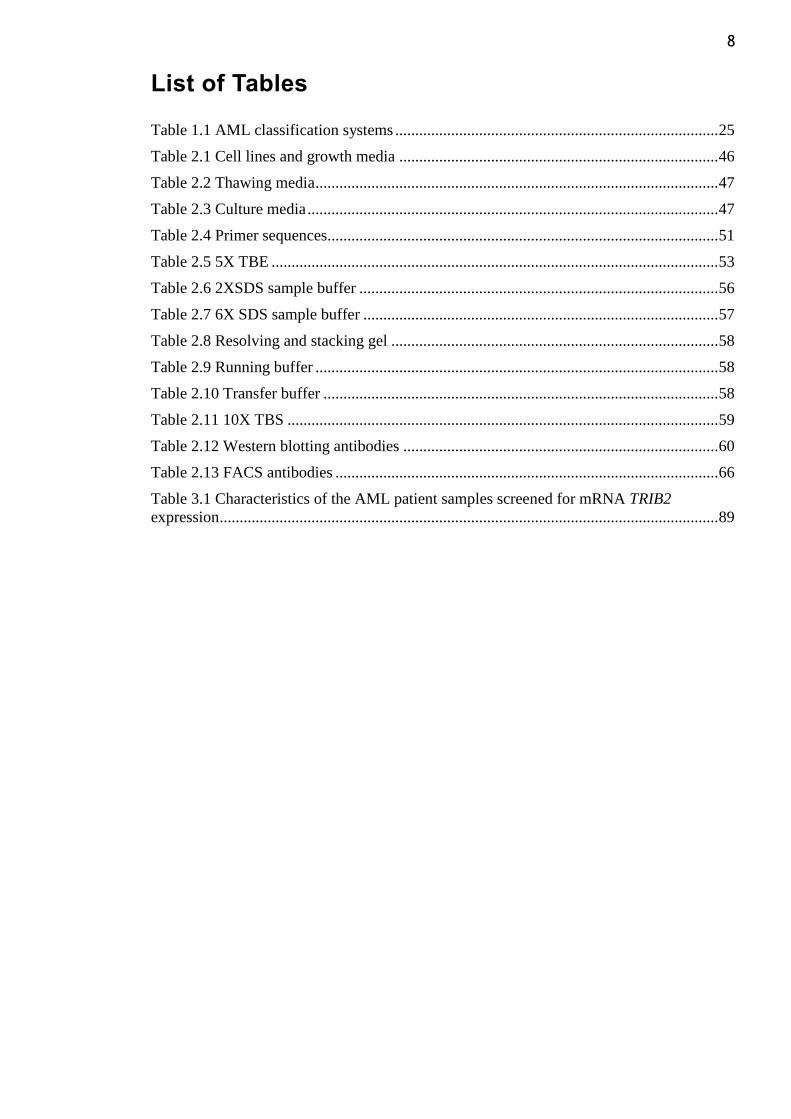
List of Tables
Table 1.1 AML classification systems ................................................................................. 25
Table 2.1 Cell lines and growth media ................................................................................ 46
Table 2.2 Thawing media ..................................................................................................... 47
Table 2.3 Culture media ....................................................................................................... 47
Table 2.4 Primer sequences.................................................................................................. 51
Table 2.5 5X TBE ................................................................................................................ 53
Table 2.6 2XSDS sample buffer .......................................................................................... 56
Table 2.7 6X SDS sample buffer ......................................................................................... 57
Table 2.8 Resolving and stacking gel .................................................................................. 58
Table 2.9 Running buffer ..................................................................................................... 58
Table 2.10 Transfer buffer ................................................................................................... 58
Table 2.11 10X TBS ............................................................................................................ 59
Table 2.12 Western blotting antibodies ............................................................................... 60
Table 2.13 FACS antibodies ................................................................................................ 66
Table 3.1 Characteristics of the AML patient samples screened for mRNA TRIB2
expression ............................................................................................................................. 89
9
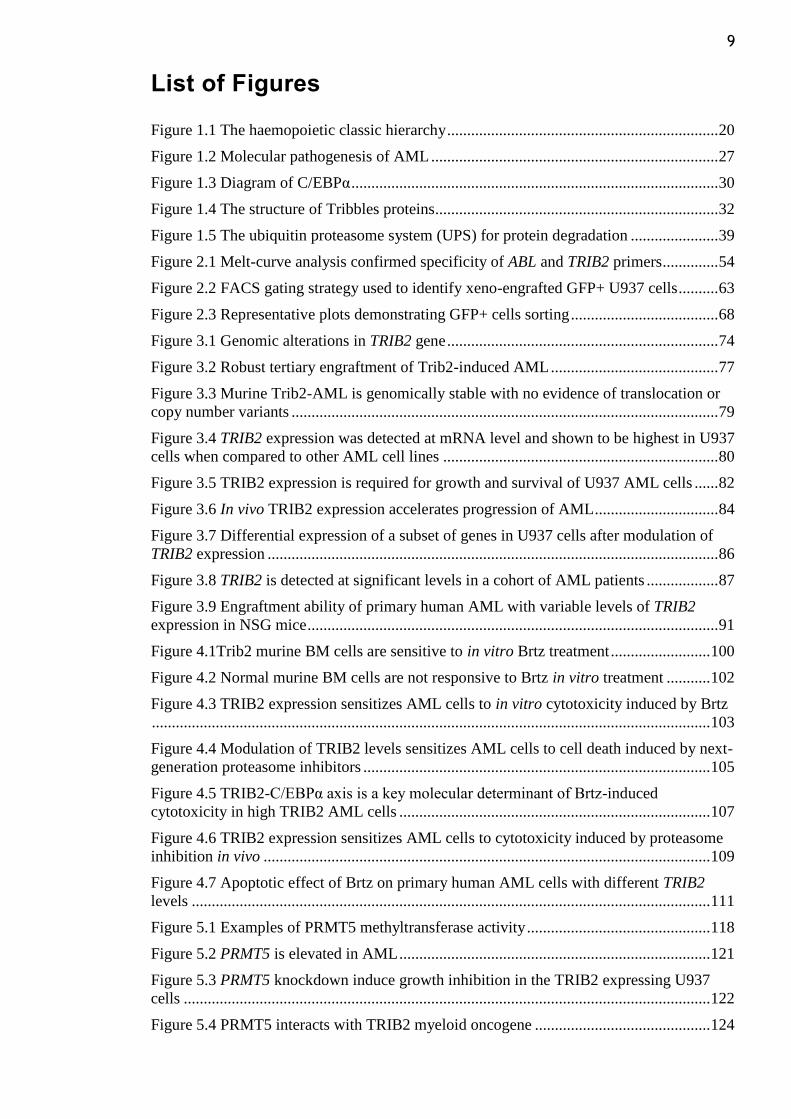
List of Figures
Figure 1.1 The haemopoietic classic hierarchy .................................................................... 20
Figure 1.2 Molecular pathogenesis of AML ........................................................................ 27
Figure 1.3 Diagram of C/EBPα ............................................................................................ 30
Figure 1.4 The structure of Tribbles proteins....................................................................... 32
Figure 1.5 The ubiquitin proteasome system (UPS) for protein degradation ...................... 39
Figure 2.1 Melt-curve analysis confirmed specificity of ABL and TRIB2 primers .............. 54
Figure 2.2 FACS gating strategy used to identify xeno-engrafted GFP+ U937 cells .......... 63
Figure 2.3 Representative plots demonstrating GFP+ cells sorting ..................................... 68
Figure 3.1 Genomic alterations in TRIB2 gene .................................................................... 74
Figure 3.2 Robust tertiary engraftment of Trib2-induced AML .......................................... 77
Figure 3.3 Murine Trib2-AML is genomically stable with no evidence of translocation or
copy number variants ........................................................................................................... 79
Figure 3.4 TRIB2 expression was detected at mRNA level and shown to be highest in U937
cells when compared to other AML cell lines ..................................................................... 80
Figure 3.5 TRIB2 expression is required for growth and survival of U937 AML cells ...... 82
Figure 3.6 In vivo TRIB2 expression accelerates progression of AML ............................... 84
Figure 3.7 Differential expression of a subset of genes in U937 cells after modulation of
TRIB2 expression ................................................................................................................. 86
Figure 3.8 TRIB2 is detected at significant levels in a cohort of AML patients .................. 87
Figure 3.9 Engraftment ability of primary human AML with variable levels of TRIB2
expression in NSG mice ....................................................................................................... 91
Figure 4.1Trib2 murine BM cells are sensitive to in vitro Brtz treatment ......................... 100
Figure 4.2 Normal murine BM cells are not responsive to Brtz in vitro treatment ........... 102
Figure 4.3 TRIB2 expression sensitizes AML cells to in vitro cytotoxicity induced by Brtz
............................................................................................................................................ 103
Figure 4.4 Modulation of TRIB2 levels sensitizes AML cells to cell death induced by next-
generation proteasome inhibitors ....................................................................................... 105
Figure 4.5 TRIB2-C/EBPα axis is a key molecular determinant of Brtz-induced
cytotoxicity in high TRIB2 AML cells .............................................................................. 107
Figure 4.6 TRIB2 expression sensitizes AML cells to cytotoxicity induced by proteasome
inhibition in vivo ................................................................................................................ 109
Figure 4.7 Apoptotic effect of Brtz on primary human AML cells with different TRIB2
levels .................................................................................................................................. 111
Figure 5.1 Examples of PRMT5 methyltransferase activity .............................................. 118
Figure 5.2 PRMT5 is elevated in AML .............................................................................. 121
Figure 5.3 PRMT5 knockdown induce growth inhibition in the TRIB2 expressing U937
cells .................................................................................................................................... 122
Figure 5.4 PRMT5 interacts with TRIB2 myeloid oncogene ............................................ 124
10
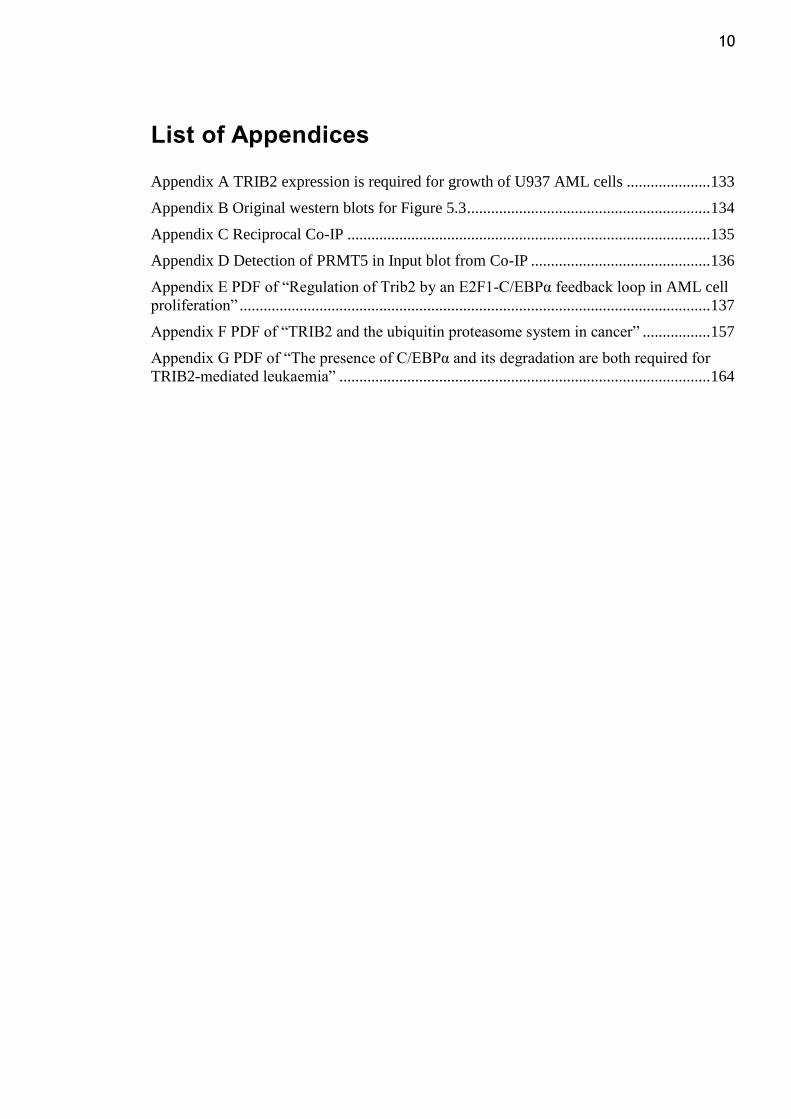
List of Appendices
Appendix A TRIB2 expression is required for growth of U937 AML cells ..................... 133
Appendix B Original western blots for Figure 5.3 ............................................................. 134
Appendix C Reciprocal Co-IP ........................................................................................... 135
Appendix D Detection of PRMT5 in Input blot from Co-IP ............................................. 136
Appendix E PDF of “Regulation of Trib2 by an E2F1-C/EBPα feedback loop in AML cell
proliferation” ...................................................................................................................... 137
Appendix F PDF of “TRIB2 and the ubiquitin proteasome system in cancer” ................. 157
Appendix G PDF of “The presence of C/EBPα and its degradation are both required for
TRIB2-mediated leukaemia” ............................................................................................. 164
11
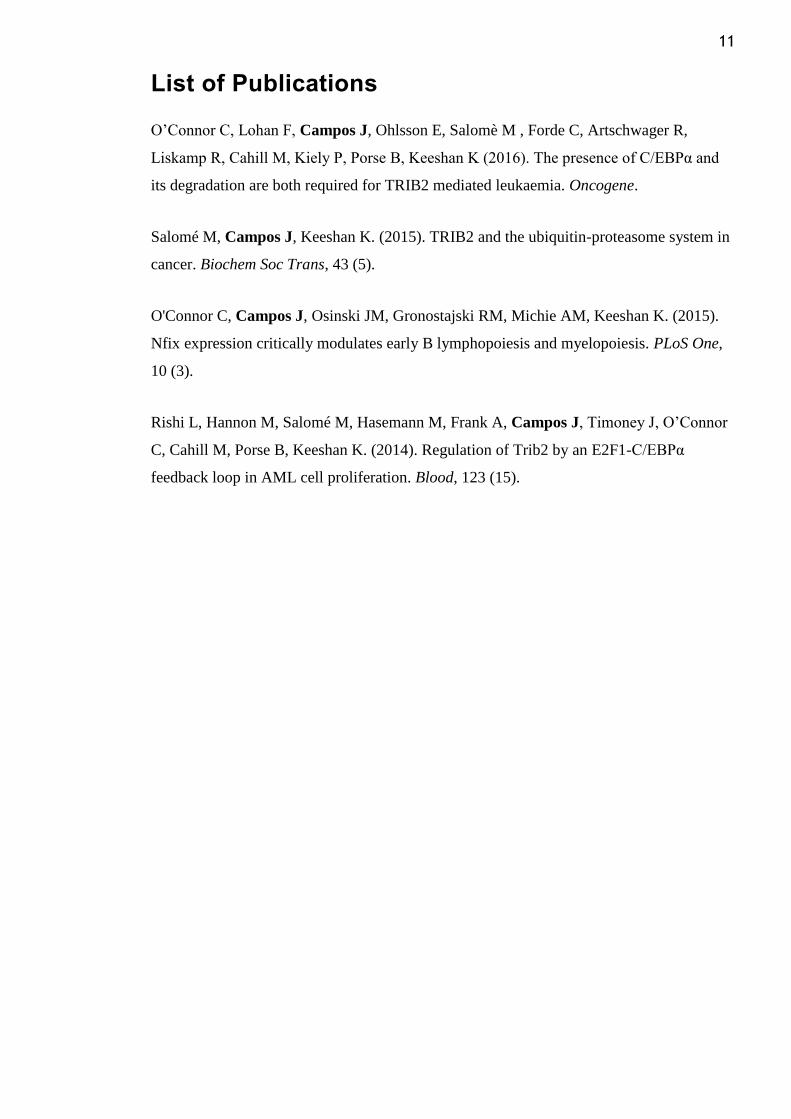
List of Publications
O‟Connor C, Lohan F, Campos J, Ohlsson E, Salomè M , Forde C, Artschwager R,
Liskamp R, Cahill M, Kiely P, Porse B, Keeshan K (2016). The presence of C/EBPα and
its degradation are both required for TRIB2 mediated leukaemia. Oncogene.
Salomé M, Campos J, Keeshan K. (2015). TRIB2 and the ubiquitin-proteasome system in
cancer. Biochem Soc Trans, 43 (5).
O'Connor C, Campos J, Osinski JM, Gronostajski RM, Michie AM, Keeshan K. (2015).
Nfix expression critically modulates early B lymphopoiesis and myelopoiesis. PLoS One,
10 (3).
Rishi L, Hannon M, Salomé M, Hasemann M, Frank A, Campos J, Timoney J, O‟Connor
C, Cahill M, Porse B, Keeshan K. (2014). Regulation of Trib2 by an E2F1-C/EBPα
feedback loop in AML cell proliferation. Blood, 123 (15).
12
Acknowledgement
First and foremost I would like to thank my principal supervisor, Dr. Karen Keeshan, for
her help in directing this project and for providing guidance and assistance when obstacles
were met. I am indebted to her for the scientific training I have received. A significant
mention goes to Professor Tessa Holyoake and all members of the Paul O‟Gorman
Leukaemia Research Centre in Glasgow for creating an inspiring work environment that is
conducive to professional growth. As a result of this, I truly enjoyed my three years of
research. I am particularly grateful to my colleagues with whom I shared office 5. Thank
you for providing constant support at different levels. Earning your friendship was an
invaluable “side effect” of my PhD. This research would have not been possible without
the funding from the Howat foundation, Children with Cancer UK and the Children´s
Leukaemia Research Project. Para a Cila, o Juca e a Rita, o agradecimento mais especial.

13
Author’s Declaration
Except where explicit reference is made to the contribution of others, this work represents
original work carried out by the author and has not been submitted in any form to any other
University.
14
List of Abbreviations
2-HG 2-Hydroxyglutarate
α-KG α-ketoglutarate
ABL V-Abl Abelson Murine Leukaemia Viral Oncogene Homolog
AML Acute Myeloid Leukaemia
ALL Acute Lymphocytic Leukaemia
APL Acute Promyelocytic Leukaemia
ATRA All-Trans Retinoic Acid
ATP Adenosine Triphosphate
BM Bone Marrow
BMT Bone Marrow Transplantation
bp Base pairs
Brtz Bortezomib
BSA Bovine Serum Albumin
C/EBPα CCAAT/enhancer-binding protein alpha
CFC Colony-Forming Cell
Cfz Carfilzomib
C-L Caspase-Like
CLL Chronic Lymphocytic Leukaemia
CLP Common Lymphoid Progenitors
CML Chronic Myeloid Leukaemia
CMP Common Myeloid Progenitors
CN Cytogenetically Normal
CNS Central Nervous System
CNV Copy Number Variation
Co-IP Co-Immunoprecipitation
COP1 Constitutive Photomorphogenic 1
COSMIC Catalogue of Somatic Mutations in Cancer
Ct Cycle Threshold
CT-L Chymotrypsin-Like
d Day
DAPI 4´,6-diamidino-2-phenylindole
DMEM Dulbecco´s Modified Eagle Medium
DMSO Dimethyl Sulfoxide
DNA Deoxyribonucleic Acid
15
DNMT3A DNA (cytosine-5-)-methyltransferase 3 alpha
DUBs Deubiquitinating enzymes
ER Endoplasmic Reticulum
FAB French–American–British
FACS Fluorescence-Activated Cell Sorting
FBS Foetal Bovine Serum
FDA Food and Drug Adminintration
FLT3 FMS-like tyrosine kinase 3
FSA Forward Scatter
GFP Green Fluorescent Protein
GMPs Granulocyte-Macrophage Progenitors
Gy Gray (unit)
h Hours
HoxA9 Homeobox 9
HSCs Haemopoietic Stem Cells
IC50 Half Maximal Inhibitory Concentration
IDH1 Isocitrate dehydrogenase 1
IDH2 Isocitrate dehydrogenase 2
IMDM Isocove´s Modified Dulbecco´s Medium
i.p. intraperitoneal
IRES Internal Ribosome Entry Site
ITD Internal Tandem Duplication
K Lysine
kb Kilobases
kDa Kilodalton
KD Knockdown
LGA Leukemia Gene Atlas
LMPP Lymphoid-primed Multipotent Progenitors
LSK Lineage- Sca1+ c-Kit+ stem cells
LT-HSCs Long-Term reconstituting HSCs
MDa Megadalton
MEP Megakaryocyte-Erythroid Progenitors
MEP50 Methylosome Protein 50
min minutes
MLL Mixed lineage leukaemia
16
MNCs Mononuclear Cells
MPP Multipotent Progenitors
mRNA messenger Ribonucleic Acid
M.W. Molecular Weight
NF-kB Nuclear Factor of kB
NK cells Natural Killer cells
NPM1 Nucleophosmin
n.s Not Significant
NSG non-obese diabetic (NOD)/LtSz-severe combined immunodeficiency
(SCID) IL-2Rγcnull
O/N Overnight
PB Peripheral Blood
PBS Phosphate Buffered Saline
PDCD4 Programmed Cell Death 4
PI Propidium Iodine
PN Product Number
PRMTs Protein Arginine Methyltransferases
PRMT5 Protein Arginine Methyltransferase 5
PTMs Post-Translational Modifications
qPCR Quantitative Polymerase Chain Reaction
R Arginine
RARα Retinoic Acid Receptor α
Rb Retinoblastoma
RPMI 1640 Roswell Park Memorial Institute 1640
RT Room Temperature
RT-PCR Reverse Transcriptase Polymerase Chain Reaction
SD Standard Deviation
SDS-PAGE Sodium Dodecyl Sulphate Polyacrylamide Gel Electrophoresis
sec seconds
SF Peptido Sulfonyl Fluoride
shRNA short-hairpin RNA
Smurf1 Smad ubiquitination regulatory factor 1
snRNP small nuclear Ribonucleoprotein
SSC Side Scatter
ST-HSCs Short-Term reconstituting HSCs
17
T-ALL T-cell ALL
t-AML Therapy-related AML
TCF4 Transcription Factor 4
TET2 Ten-eleven-translocated gene 2
T-L Trypsin-Like
TRIB2 Tribbles homolog 2
Ub Ubiquitin
uORF upstream Open Reading Frame
UPS Ubiquitin Proteasome System
V Volts
WBC White Blood Cell
WHO World Health Organisation
WT Wild Type

18
Chapter 1 Introduction
19
1.1 Haemopoiesis
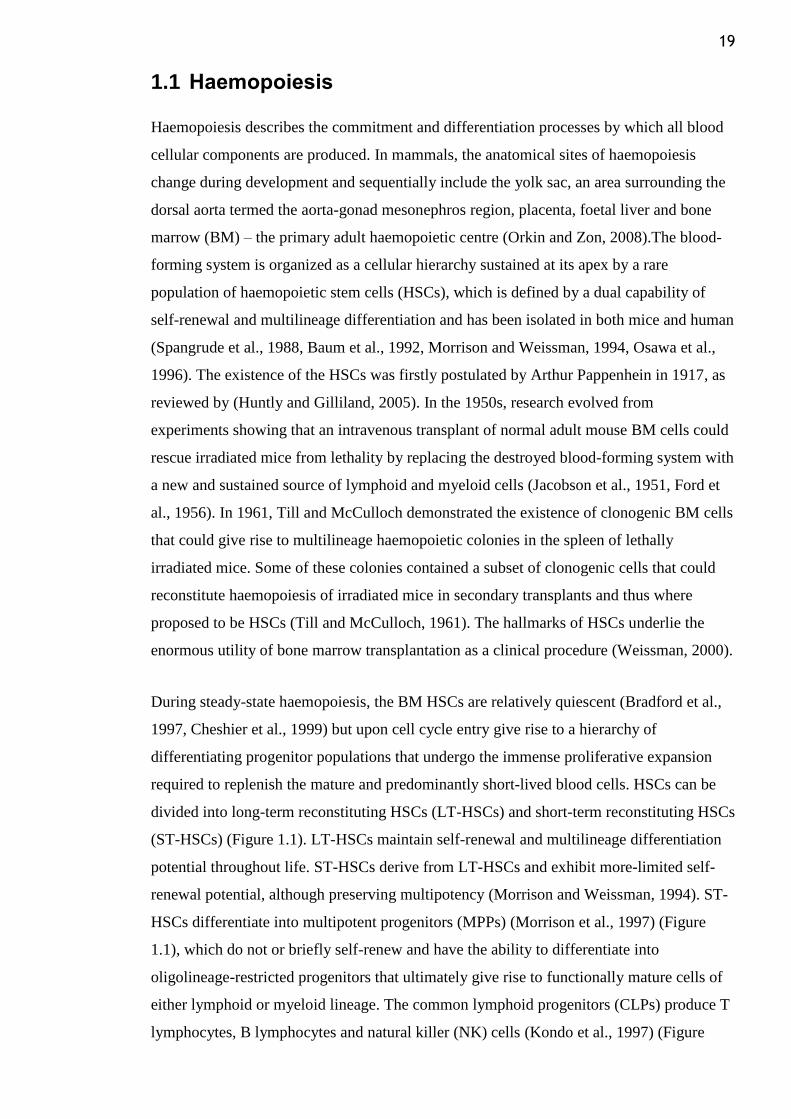
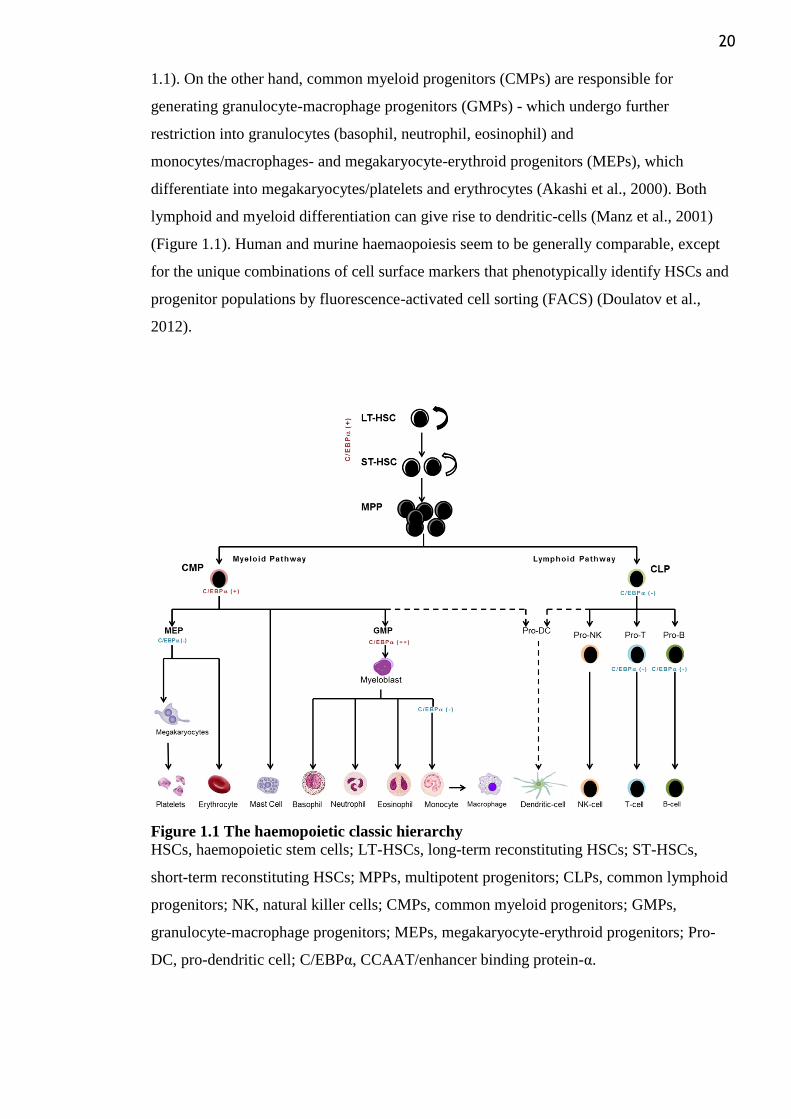
Haemopoiesis describes the commitment and differentiation processes by which all blood
cellular components are produced. In mammals, the anatomical sites of haemopoiesis
change during development and sequentially include the yolk sac, an area surrounding the
dorsal aorta termed the aorta-gonad mesonephros region, placenta, foetal liver and bone
marrow (BM) – the primary adult haemopoietic centre (Orkin and Zon, 2008).The blood-
forming system is organized as a cellular hierarchy sustained at its apex by a rare
population of haemopoietic stem cells (HSCs), which is defined by a dual capability of
self-renewal and multilineage differentiation and has been isolated in both mice and human
(Spangrude et al., 1988, Baum et al., 1992, Morrison and Weissman, 1994, Osawa et al.,
1996). The existence of the HSCs was firstly postulated by Arthur Pappenhein in 1917, as
reviewed by (Huntly and Gilliland, 2005). In the 1950s, research evolved from
experiments showing that an intravenous transplant of normal adult mouse BM cells could
rescue irradiated mice from lethality by replacing the destroyed blood-forming system with
a new and sustained source of lymphoid and myeloid cells (Jacobson et al., 1951, Ford et
al., 1956). In 1961, Till and McCulloch demonstrated the existence of clonogenic BM cells
that could give rise to multilineage haemopoietic colonies in the spleen of lethally
irradiated mice. Some of these colonies contained a subset of clonogenic cells that could
reconstitute haemopoiesis of irradiated mice in secondary transplants and thus where
proposed to be HSCs (Till and McCulloch, 1961). The hallmarks of HSCs underlie the
enormous utility of bone marrow transplantation as a clinical procedure (Weissman, 2000).
During steady-state haemopoiesis, the BM HSCs are relatively quiescent (Bradford et al.,
1997, Cheshier et al., 1999) but upon cell cycle entry give rise to a hierarchy of
differentiating progenitor populations that undergo the immense proliferative expansion
required to replenish the mature and predominantly short-lived blood cells. HSCs can be
divided into long-term reconstituting HSCs (LT-HSCs) and short-term reconstituting HSCs
(ST-HSCs) (Figure 1.1). LT-HSCs maintain self-renewal and multilineage differentiation
potential throughout life. ST-HSCs derive from LT-HSCs and exhibit more-limited self-
renewal potential, although preserving multipotency (Morrison and Weissman, 1994). ST-
HSCs differentiate into multipotent progenitors (MPPs) (Morrison et al., 1997) (Figure
1.1), which do not or briefly self-renew and have the ability to differentiate into
oligolineage-restricted progenitors that ultimately give rise to functionally mature cells of
either lymphoid or myeloid lineage. The common lymphoid progenitors (CLPs) produce T
lymphocytes, B lymphocytes and natural killer (NK) cells (Kondo et al., 1997) (Figure
20
1.1). On the other hand, common myeloid progenitors (CMPs) are responsible for
generating granulocyte-macrophage progenitors (GMPs) - which undergo further
restriction into granulocytes (basophil, neutrophil, eosinophil) and
monocytes/macrophages- and megakaryocyte-erythroid progenitors (MEPs), which
differentiate into megakaryocytes/platelets and erythrocytes (Akashi et al., 2000). Both
lymphoid and myeloid differentiation can give rise to dendritic-cells (Manz et al., 2001)
(Figure 1.1). Human and murine haemaopoiesis seem to be generally comparable, except
for the unique combinations of cell surface markers that phenotypically identify HSCs and
progenitor populations by fluorescence-activated cell sorting (FACS) (Doulatov et al.,
2012).
Figure 1.1 The haemopoietic classic hierarchy
HSCs, haemopoietic stem cells; LT-HSCs, long-term reconstituting HSCs; ST-HSCs,
short-term reconstituting HSCs; MPPs, multipotent progenitors; CLPs, common lymphoid
progenitors; NK, natural killer cells; CMPs, common myeloid progenitors; GMPs,
granulocyte-macrophage progenitors; MEPs, megakaryocyte-erythroid progenitors; Pro-
DC, pro-dendritic cell; C/EBPα, CCAAT/enhancer binding protein-α.
21
Throughout the maturational pathways that direct transition from haemopoietic stem and
progenitor cells to terminally differentiated blood cells, a tightly regulated network of
transcription factors is highly important in defining cellular fates. Examples of these
include Notch-1, GATA-3 and Pax5, which mediate T- and B-cell development; GATA-1
and FOG-1, which are involved in the development of erythrocytes and megakaryocytes;
and PU.1 and C/EBPα, which control the commitment of myeloid cells (Orkin, 2000, Xie
and Orkin, 2007). The role of C/EBPα (further characterized in section 1.2.4) as a master
regulator of granulopoiesis (Zhang et al., 1997) is highlighted in Figure 1.1, where it is
shown to be expressed in HSCs and GMPs, downregulated as CMPs differentiate to MEPs
and absent in precursors of lymphoid cells (Miyamoto et al., 2002). In addition to
transcriptional regulation, signals from the BM niche (microenvironment), including the
ones from cytokines and growth factors, are critical for the early cell fate decisions
(Dorantes-Acosta and Pelayo, 2012). It was once considered that cellular differentiation
was unidirectional, that is, once progenitors have committed to a particular linear pathway
their fate is sealed due to precise combinations of lineage transcription factors and
epigenetic modifications to the chromatin. However, the unidirectional and irreversible
nature of the process has been questioned by a number of findings that, instead, support
plasticity of early progenitor cells. Indeed, cells of one haemopoietic lineage can be
redirected to another through forced expression of carefully chosen transcription factors or
loss of these regulators, a process called cellular reprogramming (Orkin, 2000, Xie and
Orkin, 2007). For example, introducing C/EBPα into B- or T-cells converts them into
functional macrophages (Xie et al., 2004, Laiosa et al., 2006). Ectopic GATA-1 can also
reprogram common B and T progenitor cells into megakaryocytic/erythroid cells (Iwasaki
et al., 2003) while pro-B cells lacking Pax5 (Pax5-/-
) are not restricted in their lineage fate
(Nutt et al., 1999).
The classical view of the blood hierarchy (Figure 1.1) has recently been challenged. In the
murine system, the identification of lymphoid-primed multipotent progenitors (LMPP)
argued that the megakaryocytic/erythroid lineage diverts earlier, without implicitly going
through a shared CMP stage (Adolfsson et al., 2005, Mansson et al., 2007). Recently,
Notta et al. added an additional layer of complexity by suggesting a developmental shift in
the human progenitor cell architecture from the foetus, where many stem and progenitor
cell types are multipotent, to the adult, where the stem cell compartment is multipotent but
the progenitors are unipotent (Notta et al., 2015). While these and other studies challenge
the classical view of haemopoiesis hierarchy, in the absence of a clear consensus on a
revised model, the standard model is still used extensively as an operational paradigm.
22
Defects in the regulatory pathways that control haemopoiesis severely perturb normal
development and lie at the root of haematological malignancies, such as leukaemia.
1.2 Acute Myeloid Leukaemia
Acute Myeloid Leukaemia (AML) is best understood by first describing the larger group of
haemopoietic malignancies in which it is embedded, that is leukaemia.
1.2.1 History and classification of leukaemia
Reports from the early 19th century first establish the possibility that sustained
leukocytosis could occur in the absence of infection. The first published description of a
case of leukaemia in medical literature dates to 1827, when French physician Alfred
Velpeau described a 63-year-old Parisian patient who was noted at post-mortem
examination to have substantial enlargement of the liver and spleen, as well as blood
resembling “gruel”. In 1845, a series of patients who died with enlarged spleens and
changes in the "colours and consistencies of their blood" were reported by the Edinburgh-
based pathologist J.H. Bennett, who used the term "leucocythemia" to describe this
pathological condition. In 1847, the German pathologist Virchow was credited with
coining the term “leukaemia” (Greek for "white blood") to describe the abnormal excess of
white blood cells in patients with the previously reported clinical syndrome (Beutler, 2001,
Piller, 2001, Freireich et al., 2014).
Leukaemia, nowadays a well-recognized distinct entity, is characterized by disruption of
the processes directing self-renewal, differentiation and haemopoietic cell expansion,
which leads to the accumulation of immature, non-functioning neoplastic cells. According
to the American Cancer Society, an estimated 54,270 new cases of leukaemia were
expected in 2015 (3% of total cancers) in the USA (American Cancer Society, 2015).
Clinically and pathologically, the term leukaemia comprises a spectrum of haematological
malignancies that are mainly subdivided in four categories: acute lymphocytic leukaemia
(ALL), acute myeloid leukaemia (AML), chronic lymphocytic leukaemia (CLL) and
chronic myeloid leukaemia (CML). According to progression of the untreated disease and
maturity of the affected cells, leukaemia has traditionally been designated as acute or
chronic. Acute forms of the disease progress rapidly and require prompt treatment. They
target immature cells, causing symptoms to appear quickly. Chronic forms of leukaemia,
on the other hand, target more mature cells and develop over long periods of time, with
23
symptoms arising often at later stages. The second factor in classifying leukaemia concerns
the type of blood cells that are affected: lymphoblastic or myeloid, as outlined in Figure
1.1. Symptoms are generally the same regardless of which cell is affected; the difference is
mainly important for therapeutic-management of the patients. Some forms of leukaemia
are far more common than others and rates of incidence also vary by age. In the USA, the
majority (91%) of leukaemia cases are diagnosed in adults 20 years of age and older.
Among adults, the most common types are CLL (36%) and AML (32%). In contrast, ALL
is most common before age 20, accounting for 76% of cases. Overall leukaemia incidence
rates have been slowly increasing over the past few decades; from 2007 to 2011, rates
increased by 1.6% per year in males and 0.6% per year in females (American Cancer
Society, 2015).
1.2.2 Pathology, epidemiology and etiology of AML
In AML, differentiation block and increased proliferation affect the myeloid lineage and
result in the accumulation of abnormal immature cells (blasts) within the BM and blood,
which are incapable of differentiating towards granulocytes or monocytes (Lowenberg et
al., 1999). Infiltration of blasts, that replace normal cells in these tissues, causes the first
clinical signs and symptoms usually found at presentation of AML - fatigue, haemorrhage
or infections and fever due to decreases in red blood cells (anaemia), platelets
(thrombocytopenia) or neutrophils (neutropenia), respectively. Leukaemic infiltration of
other tissues, including the liver (hepatomegaly), spleen (splenomegaly), skin (leukaemia
cutis), lymph nodes (lymphadenopathy), bone (bone pain) and central nervous system can
produce a variety of other symptoms (Lowenberg et al., 1999). At least 20% of cells in a
BM aspirate or circulating blood need to be blasts of myeloid lineage for disease diagnosis.
Blast lineage is assessed by multiparameter flow cytometry with CD33 and CD13 being
surface markers typically expressed by human myeloid blasts (Estey, 2012).
While it can occur in children (usually during the first two years of life), the prevalence of
AML increases with age and is generally a disease of elderly people with an average age at
diagnosis of 70 years and more common in men than in women. The American Cancer
Society estimated 20,830 new cases of AML (12,730 in men and 8,100 in women) to occur
24
in the USA in 2015, accounting for 32% of all leukaemia cases in adults 20 years of age
and older (American Cancer Society, 2015)1.
The vast majority of AML are sporadic and are the consequence of acquired somatic
alterations in haemopoietic progenitor cells but association with risk factors has been
reported. Congenital disorders such as Fanconi‟s anemia, Bloom‟s, Down‟s, Kostmann‟s
and Diamond-Blackfan syndromes can increase the relative risk of developing AML. Risk
is also increased in individuals with acquired haematologic disorders including the
myeloproliferative and myelodysplastic syndromes and paroxysmal nocturnal
haemoglobinuria. Therapy-related AML (t-AML) may develop as a consequence of
exposure to chemotherapy, including alkylating agents, epipodophyllotoxins and ionizing
radiation. Smoking is also reported as a risk factor to the development of AML associated
with benzene exposure (Gilliland and Tallman, 2002, Estey and Dohner, 2006).
1.2.3 AML classification
AML comprises a group of disorders with great variability regarding clinical course and
response to therapy. Diversity is also detected at the genetic and molecular basis of the
pathology, which can be associated with chromosomal translocations, genetic mutations
and transcription factors perturbations. Such heterogeneity has been used for disease
stratification into specific subgroups to improve prognostication and support risk-adapted
therapeutic management of AML patients. The first proposed standardized method of
classification was that developed in 1976 by the French–American–British (FAB)
Cooperative Group. The FAB system divides AML into seven distinct subtypes (M0 to
M7) according to the myeloid lineage involved/degree of leukaemic-cell differentiation,
and is based on conventional morphologic and histochemical analysis of peripheral blood
(PB) and BM leukaemia blasts (Bennett et al., 1976, Bennett et al., 1985) (Table 1.1).
While this method is still commonly used for morphologic diagnosis, progress made
during recent years in deciphering the molecular basis of AML and in defining new
diagnostic and prognostic markers, refined the classification approach. Hence, new
standardized systems have been proposed, correlating cytogenetic and molecular genetic
information with clinical data. Amongst them, the World Health Organization (WHO)
1 Epidemiology of leukaemia and, in particular, AML here reported are based on the US population since the
most recent and detailed data concerning this subject are provided by the American Cancer Society.
However, information available from Cancer Research UK (www.cancerresearchuk.org) should be
mentioned as well. According to this source, in 2013 AML accounted for 0.8% of all new cancer cases in the
UK, and 32% of all leukaemia types combined. In the same year, there were 2,942 new cases of AML: 1,715
(58%) in males and 1,227 (42%) in females.
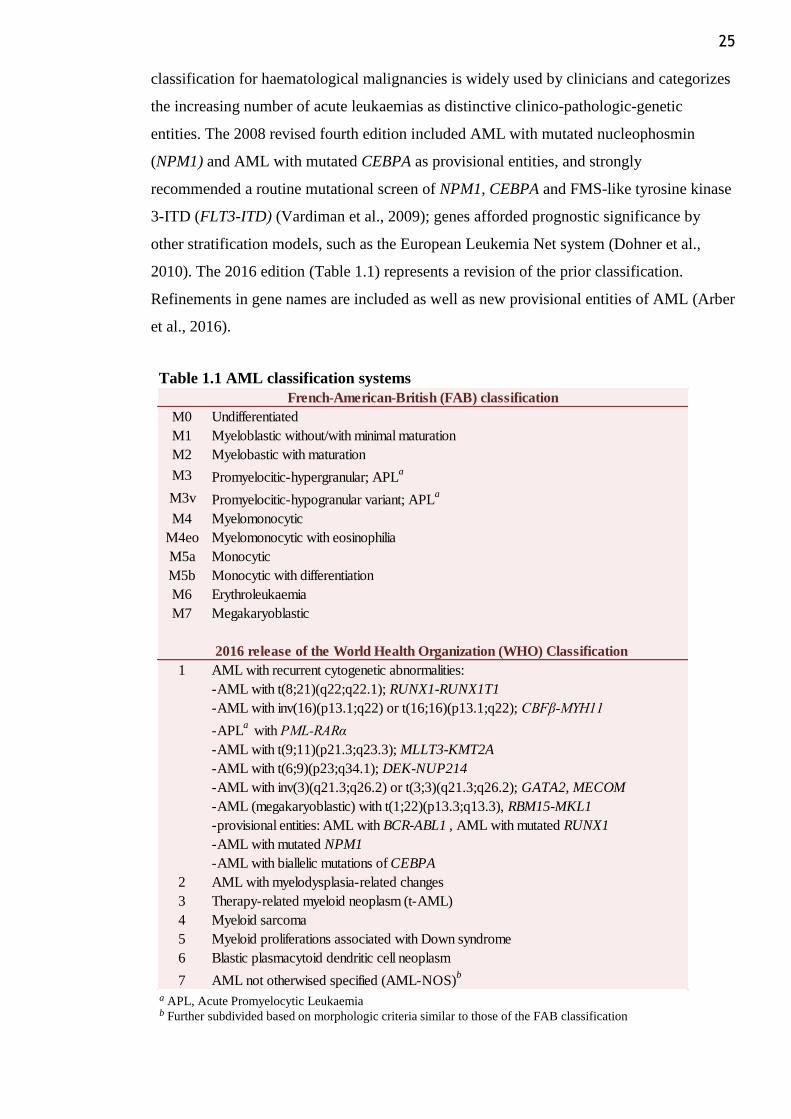
25
classification for haematological malignancies is widely used by clinicians and categorizes
the increasing number of acute leukaemias as distinctive clinico-pathologic-genetic
entities. The 2008 revised fourth edition included AML with mutated nucleophosmin
(NPM1) and AML with mutated CEBPA as provisional entities, and strongly
recommended a routine mutational screen of NPM1, CEBPA and FMS-like tyrosine kinase
3-ITD (FLT3-ITD) (Vardiman et al., 2009); genes afforded prognostic significance by
other stratification models, such as the European Leukemia Net system (Dohner et al.,
2010). The 2016 edition (Table 1.1) represents a revision of the prior classification.
Refinements in gene names are included as well as new provisional entities of AML (Arber
et al., 2016).
Table 1.1 AML classification systems
a APL, Acute Promyelocytic Leukaemiab Further subdivided based on morphologic criteria similar to those of the FAB classification
M0
M1
M2
M3
M3v
M4
M4eo
M5a
M5b Monocytic with differentiation
M6
M7
1 AML with recurrent cytogenetic abnormalities:
-AML with t(8;21)(q22;q22.1); RUNX1-RUNX1T1
-AML with inv(16)(p13.1;q22) or t(16;16)(p13.1;q22); CBFβ-MYH11
-APLa with PML-RARα
-AML with t(9;11)(p21.3;q23.3); MLLT3-KMT2A
-AML with t(6;9)(p23;q34.1); DEK-NUP214
-AML with inv(3)(q21.3;q26.2) or t(3;3)(q21.3;q26.2); GATA2, MECOM
-AML (megakaryoblastic) with t(1;22)(p13.3;q13.3), RBM15-MKL1
-provisional entities: AML with BCR-ABL1 , AML with mutated RUNX1
-AML with mutated NPM1
-AML with biallelic mutations of CEBPA
2 AML with myelodysplasia-related changes
3 Therapy-related myeloid neoplasm (t-AML)
4 Myeloid sarcoma
5 Myeloid proliferations associated with Down syndrome
6 Blastic plasmacytoid dendritic cell neoplasm
7 AML not otherwised specified (AML-NOS)b
Myelomonocytic
Myelomonocytic with eosinophilia
Monocytic
Erythroleukaemia
Megakaryoblastic
2016 release of the World Health Organization (WHO) Classification
French-American-British (FAB) classification
Undifferentiated
Myeloblastic without/with minimal maturation
Myelobastic with maturation
Promyelocitic-hypergranular; APLa
Promyelocitic-hypogranular variant; APLa
26
In addition, large collaborative studies have proposed risk stratification into favourable,
intermediate or adverse groups based upon cytogenetic profile found at presentation
(Grimwade et al., 1998, Grimwade et al., 2001). Non-random, clonal chromosome
aberrations are detected in the leukaemic blasts of approximately 55% of adults with AML
(Dohner and Dohner, 2008) and have long been recognized as important independent
predictors for achievement of complete remission, risk of relapse and overall survival in
AML (Mrozek et al., 2001). Patients carrying t(8;21)(q22;q22) leading to a fusion of
RUNX1 gene to RUNX1T1 gene, inv(16)(p13.1q22) or t(16;16)(p13.1q22) both leading to
the fusion of the CBF and MYH11 genes, or t(15;17) with the resulting PML-RARα
rearrangement generally have a favourable prognosis. On the opposite side of the
spectrum, patients with t(6;9), 11q23 (mixed lineage leukaemia (MLL) gene)
abnormalities, monosomies of chromosomes 7 or 5 or showing complex karyotype
(independent alterations of three or more chromosomes in the absence of t(8;21), inv(16)
or t(16;16) and t(15;17)) have a distinctively poor prognosis (Löwenberg, 2001). The
remaining large group of patients (~45%), with cytogenetically normal AML (CN-AML),
are classified in the intermediate prognostic category (Walker and Marcucci, 2012).
Specific mutations were also recently identified to predict AML outcome and improve risk
stratification independent of historically recognized risk factors. That is the case of FLT3,
NPM1, and C/EBPα recurrent molecular abnormalities, shown to improve risk
stratification for patients with CN-AML (Walker and Marcucci, 2012), as further detailed
below (section 1.2.4.2).
1.2.4 Molecular pathogenesis of AML
1.2.4.1 Two-hit model
The observation that a single mutation appears generally insufficient for overt leukaemia to
develop in mouse models supported the two-hit model of leukaemogenesis (Kelly and
Gilliland, 2002, Speck and Gilliland, 2002). This hypothesis considers AML development
to be a multistep process, requiring the collaboration of two classes (I and II) of mutations
for transformation of a myeloid precursor. Class I mutations confer a survival/proliferation
advantage and those that impair haemopoietic differentiation are included in class II
(Figure 1.2). Survival or proliferative mutations typically involve activation of tyrosine
kinase signaling (FLT3, c-KIT, RAS) or tyrosine phosphatase (PTPN11) pathways, while
defects in myeloid differentiation often result from chromosomal translocations (e.g.,
generation of novel oncogenes such as RUNX1-RUNX1T1 or PML-RARα) or mutations in
27
CEBPA or NPM1 (Gilliland and Tallman, 2002, Renneville et al., 2008). However, not all
the genetic aberrations that have been found in human AML fall within the two categories
(Figure 1.2), implicating that the two-hit model may be an oversimplification. This is best
exemplified by the growing evidence suggesting that changes in the epigenetic landscape
have a role in leukaemia development and maintenance (Greenblatt and Nimer, 2014).
Mutations affecting DNA (cytosine-5-) -methyltransferase 3 alpha (DNMT3A), additional
sex combs like 1 (ASXL1), ten-eleven-translocated gene 2 (TET2) or isocitrate
dehydrogenase 1 (IDH1) and isocitrate dehydrogenase 2 (IDH2) genes were shown to be
implicated in AML and could, therefore, be ascribed to a third important mechanistic
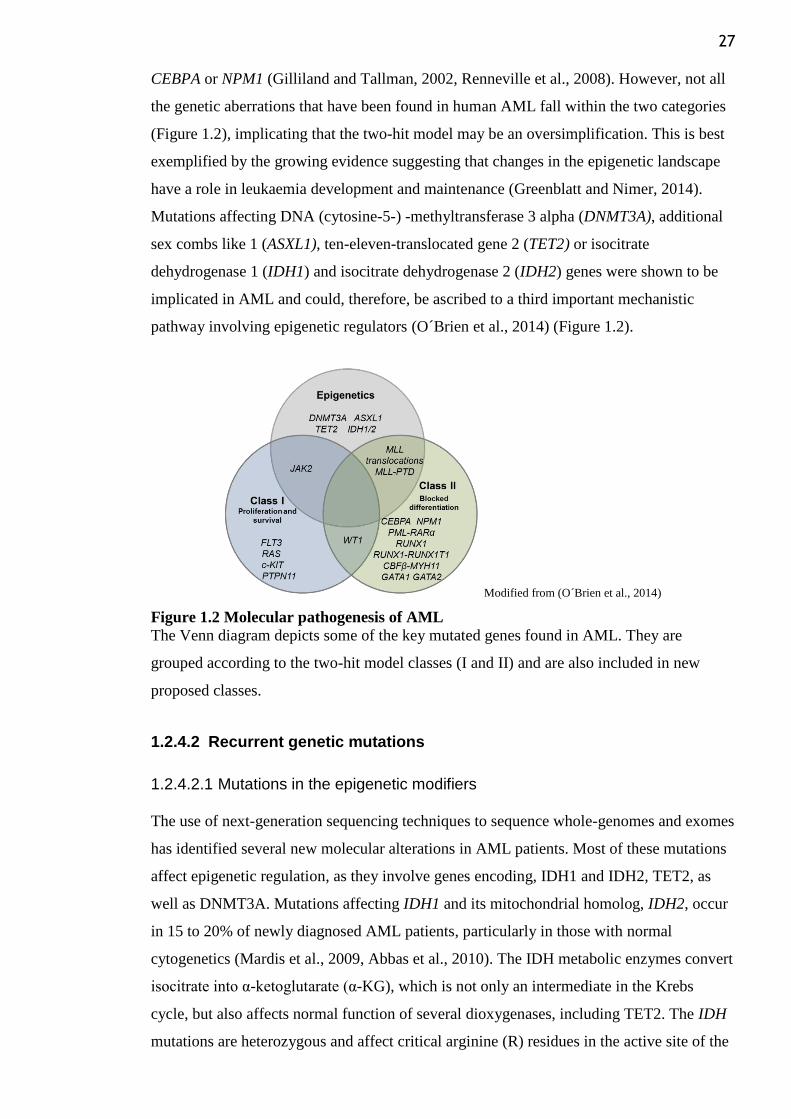
pathway involving epigenetic regulators (O´Brien et al., 2014) (Figure 1.2).
Modified from (O´Brien et al., 2014)
Figure 1.2 Molecular pathogenesis of AML
The Venn diagram depicts some of the key mutated genes found in AML. They are
grouped according to the two-hit model classes (I and II) and are also included in new
proposed classes.
1.2.4.2 Recurrent genetic mutations
1.2.4.2.1 Mutations in the epigenetic modifiers
The use of next-generation sequencing techniques to sequence whole-genomes and exomes
has identified several new molecular alterations in AML patients. Most of these mutations
affect epigenetic regulation, as they involve genes encoding, IDH1 and IDH2, TET2, as
well as DNMT3A. Mutations affecting IDH1 and its mitochondrial homolog, IDH2, occur
in 15 to 20% of newly diagnosed AML patients, particularly in those with normal
cytogenetics (Mardis et al., 2009, Abbas et al., 2010). The IDH metabolic enzymes convert
isocitrate into α-ketoglutarate (α-KG), which is not only an intermediate in the Krebs
cycle, but also affects normal function of several dioxygenases, including TET2. The IDH
mutations are heterozygous and affect critical arginine (R) residues in the active site of the
28
enzyme: R132 in IDH1 and R140 and R172 in IDH2 (Chou et al., 2011). The subsequent
amino acid substitution prevents the normal catalytic function of the enzyme and results in
the conversion of α-KG to 2-Hydroxyglutarate (2-HG), which is a competitor inhibitor of
dioxygenases (Dang et al., 2009). In AML it has been show that the accumulation of this
putative oncogenic metabolite not only blocks the function of TET2 protein, leading to
aberrant DNA methylation, but also impairs histone demethylation and interferes with
normal differentiation of cells. IDH1/2 mutations and TET2 mutations, which lead to loss
of function, are associated with similar epigenetic defects (Figueroa et al., 2010).
Moreover, Chaturvedi and colleagues found that mutant IDH1 in combination with
homeobox 9 (HoxA9) greatly accelerates leukaemogenesis in a murine model (Chaturvedi
et al., 2013). While the prognostic impact of IDH-mutations is still controversial (Thiede,
2012), the effect of mutations in the DNMT3A appears to be more consistent across studies.
DNMT3A mutations are an unfavourable prognosis biomarker in AML (Renneville et al.,
2012, Shivarov et al., 2013). The overall prevalence is ~18-23% and is particularly higher
in CN-AML (29-36%) (Thiede, 2012). The majority of DNMT3A somatic mutations are
missense alterations in the R882 residue located near the carboxyl terminus of the
DNMT3A protein. DNMT3A belongs to a family of DNA-methyltransferases whose role
is to catalyse the addition of methyl groups onto the 5′-position of cytosine residues of
CpG dinucleotides. However, the function and biological consequences of DNMT3A
mutations in AML have yet to be fully elucidated (Im et al., 2014). Ferreira and colleagues
have recently reported that in the absence of MLL-fusion proteins, an alternative pathway
for engaging a leukaemogenic MEIS1-dependent transcriptional program can be mediated
by DNMT3A mutations (Ferreira et al., 2015).
1.2.4.2.2 NPM1
NPM1 is the most common single gene mutated in AML (30-35%) (Thiede, 2012).
Alterations in NPM1 gene encoding a nucleocytoplasmic shuttling protein with prominent
nucleolar localization are almost exclusively detected in AML. They consist of a 4 base
pair (bp)-frameshift mutation occurring in exon 12 that converts a nucleolar localization
signal into a nuclear export signal, resulting in aberrant cytoplasmic localization in the
AML blasts (Falini et al., 2005). 50% of the CN-AML patients are identified with a mutant
NPM1, also frequently associated with alterations in FLT3, DNMT3A and IDH1/2 genes.
As a result, NPM1-mutated AML was defined as a distinct leukaemia entity by the WHO
classification (Table 1.1), shown to be a predictor for a favourable outcome in the absence
of FLIT3-ITD mutations (Dohner et al., 2005, Schnittger et al., 2005, Thiede et al., 2006).
29
1.2.4.2.3 FLIT3
Two major types of mutations affecting the FLIT3 receptor kinase have been described in
AML patients. Internal tandem duplication (ITD) mutations of the juxtamembrane region
are present in 15-20% of AML (Nakao et al., 1996), particularly in certain cytogenetically
defined groups, as CN-AML, t(15;17) and t(6;9). Also, patients carrying NPM1 and
DNMT3A mutations more often display FLIT3-ITD (Thiede, 2012). The other predominant
type of mutations are missense single base pair exchanges in the second tyrosine kinase
domain, typically involving codon D835. They are also more prevalent in patients with
normal karyotype and are commonly detected in association with NPM1 and inv(16)
(Thiede, 2012). Both lead to constitutive activation of the FLT3 protein, expressed on early
haemopoietic progenitor cells, and while FLIT3-ITD mutations are generally associated
with poor outcome (Estey, 2010), debate exists on whether mutations in the tyrosine kinase
domain are either irrelevant for prognosis (Thiede et al., 2002) or associated with inferior
outcome (Whitman et al., 2008).
1.2.4.2.4 CEBPA
CEBPA (19q13.1) encodes the transcription factor C/EBPα and is the most commonly
studied gene in AML, with a mutational frequency of ~9% across this disease. Mutations
are particularly higher in the M2 subtype (up to 20%) and in the CN-AML patients (15%)
(Nerlov, 2004, Thiede, 2012). C/EBPα is a member of the basic-region leucine zipper (BR-
LZ) family of transcription factors and consists of highly homologous C-terminal DNA-
binding (basic-region) and dimerization (leucine zipper) motifs and two less conserved N-
terminal transactivation domains (TAD 1 and TAD 2), via which transcription is activated
(Tenen et al., 1997) (Figure 1.3). C/EBPα was originally isolated as a rat liver transcription
factor regulating hepatic and adipocyte genes (Cao et al., 1991, Watkins et al., 1996,
Timchenko et al., 1996) and controls the proliferation and differentiation of various cell
types (Hendricks-Taylor and Darlington, 1995). Within haemopoiesis, its expression is
detected in early myeloid progenitors, specifically upregulated in myeloid cells undergoing
granulocytic differentiation and rapidly downregulated during the alternative monocytic
pathway (Scott et al., 1992, Radomska et al., 1998). Accordingly, C/EBPα knockout mice,
which die at birth because of severe hypoglycemia, display a complete lack of mature
granulocytes. Adult mice with induced loss of C/EBPα have normal numbers of CMPs but
are devoid of GMPs and consecutive granulocytic stages but not monocytes, indicating that
C/EBP is essential for the transition of CMPs to GMPs (depicted in Figure 1.1) (Wang et
al., 1995, Zhang et al., 2004b). C/EBPα‟s critical role in lineage commitment during
30
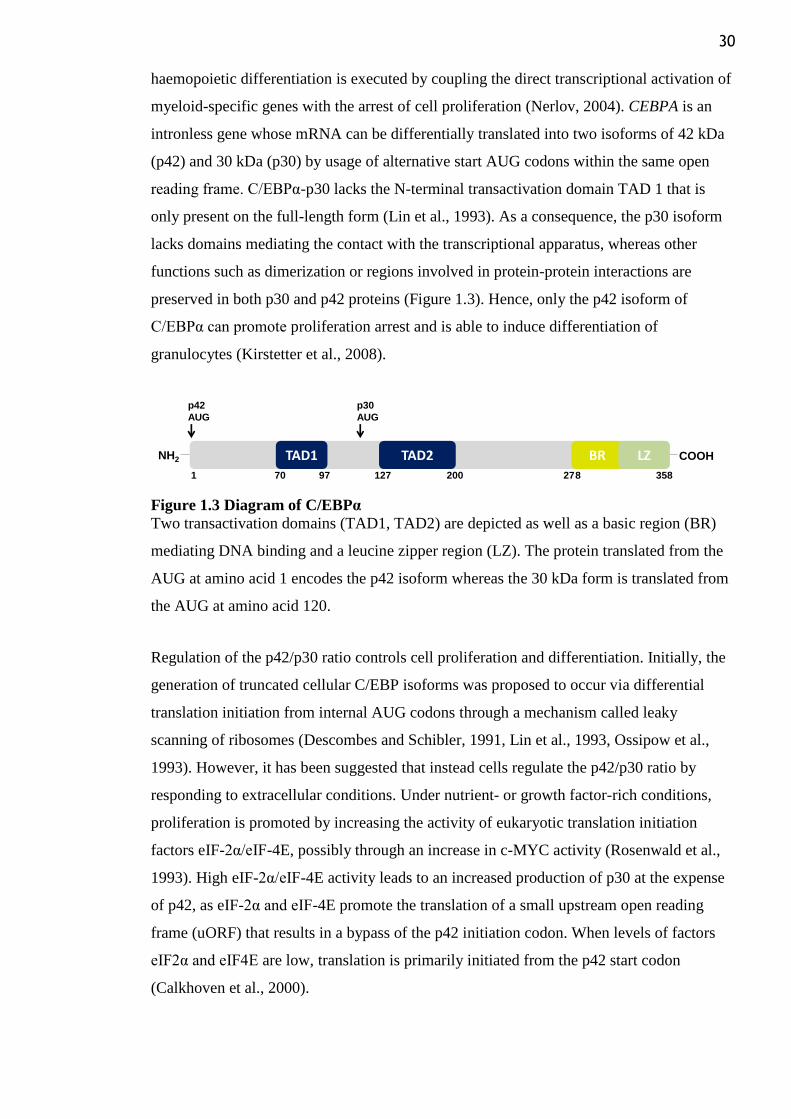
haemopoietic differentiation is executed by coupling the direct transcriptional activation of
myeloid-specific genes with the arrest of cell proliferation (Nerlov, 2004). CEBPA is an
intronless gene whose mRNA can be differentially translated into two isoforms of 42 kDa
(p42) and 30 kDa (p30) by usage of alternative start AUG codons within the same open
reading frame. C/EBPα-p30 lacks the N-terminal transactivation domain TAD 1 that is
only present on the full-length form (Lin et al., 1993). As a consequence, the p30 isoform
lacks domains mediating the contact with the transcriptional apparatus, whereas other
functions such as dimerization or regions involved in protein-protein interactions are
preserved in both p30 and p42 proteins (Figure 1.3). Hence, only the p42 isoform of
C/EBPα can promote proliferation arrest and is able to induce differentiation of
granulocytes (Kirstetter et al., 2008).
Figure 1.3 Diagram of C/EBPα
Two transactivation domains (TAD1, TAD2) are depicted as well as a basic region (BR)
mediating DNA binding and a leucine zipper region (LZ). The protein translated from the
AUG at amino acid 1 encodes the p42 isoform whereas the 30 kDa form is translated from
the AUG at amino acid 120.
Regulation of the p42/p30 ratio controls cell proliferation and differentiation. Initially, the
generation of truncated cellular C/EBP isoforms was proposed to occur via differential
translation initiation from internal AUG codons through a mechanism called leaky
scanning of ribosomes (Descombes and Schibler, 1991, Lin et al., 1993, Ossipow et al.,
1993). However, it has been suggested that instead cells regulate the p42/p30 ratio by
responding to extracellular conditions. Under nutrient- or growth factor-rich conditions,
proliferation is promoted by increasing the activity of eukaryotic translation initiation
factors eIF-2α/eIF-4E, possibly through an increase in c-MYC activity (Rosenwald et al.,
1993). High eIF-2α/eIF-4E activity leads to an increased production of p30 at the expense
of p42, as eIF-2α and eIF-4E promote the translation of a small upstream open reading
frame (uORF) that results in a bypass of the p42 initiation codon. When levels of factors
eIF2α and eIF4E are low, translation is primarily initiated from the p42 start codon
(Calkhoven et al., 2000).
NH2
p42
AUG
COOHBRTAD1 TAD2
p30
AUG
LZ
1 70 97 127 200 278 358

31
The spectrum of CEBPA mutations observed in AML patients includes two main
categories affecting the N- or C-terminus. The N-terminal frame-shift mutations abolish
p42 protein expression while retaining the truncated-C/EBPα isoform (p30), initiated
further downstream from an internal translational start site. The C-terminal mutations
generate in-frame insertions/deletions within the BR-LZ region that compromise DNA
binding of both isoforms and may result in dominant-negative homodimers or
heterodimers with other C/EBP family members (Nerlov, 2004). These two classes of
mutations often co-occur in a biallelic manner and double mutations in CEBPA, but not
single, have been identified as an independent favorable prognostic factor in
cytogenetically normal AML patients by several studies (Wouters et al., 2009, Pabst et al.,
2009, Dufour et al., 2010, Taskesen et al., 2011, Fasan et al., 2014).
Besides mutations in the N- and C-terminus, other molecular mechanisms are responsible
for C/EBPα inactivation or modulation. These include inhibition of transcription due to the
leukaemic fusion protein AML1-ETO (Pabst et al., 2001) or CEBPA promoter methylation
(Wouters et al., 2007), and post-translational modifications, such as phosphorylation of
serine 21 by ERK1/2 (Ross et al., 2004) and the p38 MAP kinase (Geest et al., 2009).
Moreover, C/EBPα protein expression can also be modulated by proteasomal degradation
mediated by Trib1 or Trib2, which are members of the Tribbles family of proteins.
1.3 Tribbles
1.3.1 Introduction to the Tribbles family
The tribbles gene was first identified in the year 2000 in Drosophila mutational screens for
genes that control cell division and migration. Drosophila tribbles was found to mediate
degradation of the CDC25 homolog String, resulting in a protracted G2/M transition
during gastrulation and morphogenesis (Grosshans and Wieschaus, 2000, Mata et al., 2000,
Seher and Leptin, 2000). In addition, Drosophila tribbles was shown to regulate oogenesis
by inducing ubiquitination and proteasomal degradation of the protein encoded by the gene
slow border cells (slbo), the Drosophila homolog of C/EBP transcription factors (Rorth et
al., 2000). Drosophila tribbles was named after the fictional animals featuring Star Trek
television series that first appeared in the episode titled „„The Trouble with Tribbles”.
Phenotype displayed by fly genes are in the origin of their names and Seher et al. (Seher
32
and Leptin, 2000) observed that the over-proliferating mesodermal cells seen in tribbles
mutant embryos resembled these furry and fecund animals.
Tribbles encodes an evolutionarily conserved protein family. Currently, there are three
known mammalian homologs of the tribbles gene: TRIB1⁄C8FW⁄SKIP1,
TRIB2⁄C5FW⁄SKIP2⁄SINK and TRIB3⁄NIPK⁄SKIP3. The first member of the mammalian
Tribbles family to be discovered was TRIB2 as an mRNA upregulated in the dog thyroid
upon stimulation by mitogens (Wilkin et al., 1996, Wilkin et al., 1997). The amino acid
sequences of Tribbles are highly conserved among human and mouse (TRIB1, 97.5%;
TRIB2, 99.2%; TRIB3, 81.2%) and also within the human family of sequences
(TRIB1⁄TRIB2, 71.3%; TRIB1⁄ TRIB3, 53.3%; TRIB2⁄ TRIB3, 53.7%) (Yokoyama and
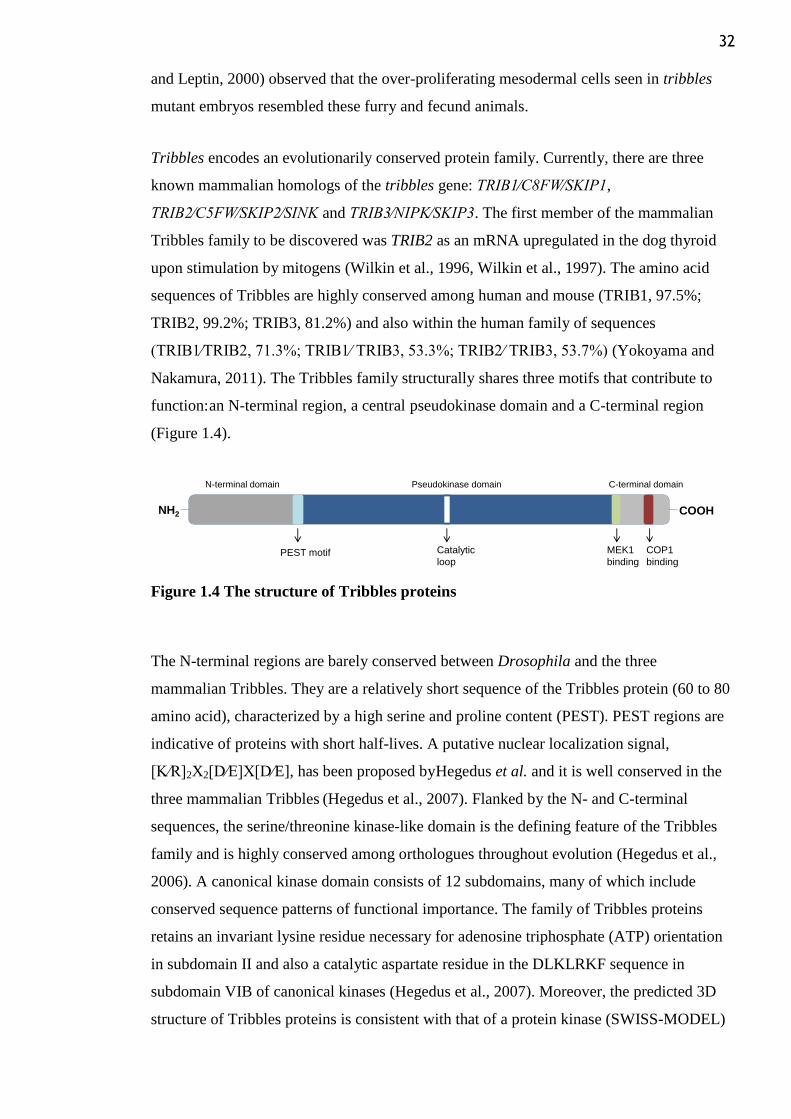
Nakamura, 2011). The Tribbles family structurally shares three motifs that contribute to
function: an N-terminal region, a central pseudokinase domain and a C-terminal region
(Figure 1.4).
Figure 1.4 The structure of Tribbles proteins
The N-terminal regions are barely conserved between Drosophila and the three
mammalian Tribbles. They are a relatively short sequence of the Tribbles protein (60 to 80
amino acid), characterized by a high serine and proline content (PEST). PEST regions are
indicative of proteins with short half-lives. A putative nuclear localization signal,
[K⁄R]2X2[D⁄E]X[D⁄ E], has been proposed by Hegedus et al. and it is well conserved in the
three mammalian Tribbles (Hegedus et al., 2007). Flanked by the N- and C-terminal
sequences, the serine/threonine kinase-like domain is the defining feature of the Tribbles
family and is highly conserved among orthologues throughout evolution (Hegedus et al.,
2006). A canonical kinase domain consists of 12 subdomains, many of which include
conserved sequence patterns of functional importance. The family of Tribbles proteins
retains an invariant lysine residue necessary for adenosine triphosphate (ATP) orientation
in subdomain II and also a catalytic aspartate residue in the DLKLRKF sequence in
subdomain VIB of canonical kinases (Hegedus et al., 2007). Moreover, the predicted 3D
structure of Tribbles proteins is consistent with that of a protein kinase (SWISS-MODEL)
NH2
N-terminal domain C-terminal domainPseudokinase domain
PEST motif
COOH
MEK1
binding
COP1
binding
Catalytic
loop
33
(Hegedus et al., 2007). However, the consensus ATP-binding pocket is highly divergent
between the conventional kinases and the kinase-like domain of Tribbles proteins (Seher
and Leptin, 2000). The complete lack of GXGX2GXV motif in subdomain I, the loss of
histidine and asparagine in HRDLKX2N in the catalytic cleft VIB and lack of the DFG
(Asp-Phe-Gly) triplet in VII are important variations specific to Tribbles. They affect
anchoring of ATP, phosphate transfer and Mg2+ chelation, which is necessary for catalysis
and ATP orientation (Hegedus et al., 2007). Given these sequence characteristics that
define Tribbles as pseudokinases (proteins which have a kinase-like domain lacking
canonical motifs) it is believed that none of the Tribbles possess kinase activity and,
indeed, specific Tribbles substrates are yet to be identified. However, such view has
recently been challenged by Bailey and colleagues that reported a vestigial kinase activity
in TRIB2 and TRIB3 pseudokinases (Bailey et al., 2015). With regards to the Tribbles C-
terminal domain, two important motifs have been identified within this region: an E3
ubiquitin ligase COP1 (constitutive photomorphogenic 1) binding motif [D/E]QXVP[D/E]
that triggers the ubiquitin-proteasome machinery for targeted protein degradation, and a
MEK1 [MAPK (mitogen-activated protein kinase)/ERK (extracellular-signal-regulated
kinase) kinase 1] binding site, ILLHPWF. Both the COP1- and MEK1-binding motifs are
highly conserved in mammalian Tribbles homologues (Qi et al., 2006, Yokoyama and
Nakamura, 2011). The presence of these two distinct protein-binding sites (Figure 1.4)
highlights the functionally diverse roles of Tribbles as scaffold proteins, mediating
degradation and changes to signalling pathways. In support of that, X-Ray structures were
reported for COP1 WD40 domains with the binding motif of TRIB1 (Uljon et al., 2016).
Also, Murphy et al. described the first crystal structure of a Tribbles pseudokinase, that of
TRIB1. Further functional studies showed that TRIB1 recognizes a conserved stretch
within a transactivation domain of C/EBP proteins and a model was suggested by which
TRIB1 acts as a dynamic adapter for recruiting C/EBPs to COP1 (Murphy et al., 2015).
Any of the interaction motifs described in Tribbles can be potentially suitable for small
molecule ligand targeting. Foulkes and colleagues have begun to analyse small molecules
that bind to TRIB2 using differential scanning fluorimetry (DSF) analyses (Foulkes et al.,
2015).
1.3.2 Tribbles in AML
Both Trib2 and Trib1 overexpression can independently drive AML in mouse bone
marrow transplantation (BMT) models (Keeshan et al., 2006, Dedhia et al., 2010). Trib2
and Trib1 transduced cells were found to exhibit growth advantage in vitro, as
34
overexpression of both genes conveyed serial plating potential to murine BM cells (Dedhia
et al., 2010). In the BMT model, Trib2 was found to drive the induction of murine AML
with a robust and short latency. Trib2 promotes monocyte and inhibits granulocytic
differentiation in mice thereby perturbing myeloid development in vivo. However, the
leukaemias that Trib2 gives rise to are clonal and this suggests that a secondary hit is
occurring in order to give rise to overt AML (Keeshan et al., 2006). Both Trib2 and Trib1
can cooperate with other genes to induce murine AML. Trib1, by itself a transforming gene
for myeloid cells, was first discovered as a cooperating gene in a murine model of
HoxA9/Meis1 myeloid leukaemogenesis, in which it was shown to accelerated disease
onset (Jin et al., 2007). Later, it was discovered that Trib2 also cooperates with HoxA9 in
the induction of myeloid leukaemia, as mice reconstituted with HSCs co-transduced with
Trib2 and HoxA9 have an accelerated onset of AML when compared to either gene alone
(Keeshan et al., 2008). Trib2 has also been separately linked to Meis1 leukaemogenic
activity. Trib2 was identified as a downstream target gene of Meis1 in Meis1 ⁄NUP98-
HOXD13 leukaemia cells, being suggested that Trib2 replaces Meis1 function in
leukemogenesis (Argiropoulos et al., 2008).
Unlike Trib2 and Trib1, ectopic expression of Trib3 cannot convey serial plating potential
to transduced murine bone marrow nor can it induce murine AML (Dedhia et al., 2010).
Trib2 and Trib1 differential capacity to induce leukaemia is linked to the ability of these
proteins to degrade the full-length isoform of C/EBPα protein in hematopoietic cells,
inducing a block of myeloid differentiation. Both Trib2 and Trib1 induce this degradation
by complexing with the E3 ligase COP1 and this cooperation has been confirmed by in
vivo experiments (Keeshan et al., 2010, Yoshida et al., 2013). Mutants of both proteins
lacking a conserved COP1-binding site are unable to induce murine AML, indicating that
this binding site is crucial for their leukaemic activity (Keeshan et al., 2010, Yokoyama et
al., 2010).. Trib3, instead, links COP1 ligase to lipid metabolism. Trib3 stimulates lipolysis
during fasting and loss of insulin signalling by triggering the degradation of the enzyme
promoting fatty acid synthesis (acetyl-coenzyme A carboxylase) in adipose tissue (Qi et
al., 2006).
35
1.3.3 TRIB2
TRIB2 was identified as a direct NOTCH1-regulated transcript in a distinct subset of
immature AML with silenced CEBPA and a mixed myeloid/T-lymphoid phenotype
(Keeshan et al., 2006, Wouters et al., 2007). As described above, Trib2 was found to cause
fatal transplantable AML when introduced in murine hematopoietic stem cells in vivo
(Keeshan et al., 2006), but its tumorigenic activity is not limited to leukaemia. In fact, there
is accumulating evidence indicating broad involvement of TRIB2 in both solid and non-
solid malignancies. In melanoma, TRIB2 mediates downregulation of the tumour
suppressor FOXO3a by promoting its cytoplasmic sequestration and impairing its
transcriptional control function (Zanella et al., 2010). In lung cancer, TRIB2 acts as a
tumorigenic driver through a mechanism involving association with the E3 ligase TRIM21
and downregulation of the C/EBPα transcription factor (Zhang et al., 2012, Grandinetti et
al., 2011). TRIB2 was also identified as a critical downstream effecter of Wnt signalling in
liver cancer cells (Wang et al., 2013a). TRIB2 was found to downregulate the Wnt
signalling key factors β-catenin and transcription factor 4 (TCF4) through its associated E3
ligases Smad ubiquitination regulatory factor 1 (Smurf1), βTrCP and COP1. The binding
region of Smurf1 encompasses amino acids 1–5 in the N-terminal region of TRIB2 protein.
The binding region of βTrCP encompasses TRIB2 amino acids 307–323, and the binding
region of COP1 encompasses TRIB2 amino acids 324–343, both in the C-terminal domain.
Deletion of the binding regions of these E3-ligases within the TRIB2 protein abolished its
ability to decrease protein stability of β-catenin and TCF4 (Xu et al., 2014). In T-cell ALL
(T-ALL), TRIB2 was identified as a direct target for upregulation by the oncogenic
transcription factor TAL1 and found to be required for the survival of T-ALL cells (Sanda
et al., 2012).
It is noteworthy that TRIB2 expression was found to be elevated in the cancers in which it
has an oncogenic role, highlighting the importance of understanding how its expression is
governed. Indeed, several mechanisms underlying the regulatory network of TRIB2 have
been identified in different cell contexts. These include the previously mentioned
NOTCH1 (Wouters et al., 2007), MEIS1 (Argiropoulos et al., 2008) and TAL1 (Sanda et
al., 2012), as well as GATA2, FOG1 (Mancini et al., 2012) and PITX1 (Nagel et al., 2011).
A number of microRNAs also regulate the expression levels of TRIB2, including but not
limited to miR-511, miR-1297 (Zhang et al., 2012), miR-99 (Zhang et al., 2013), miR-155
(Palma et al., 2014), and let-7 (Wang et al., 2013c). Moreover, the E3 ligase Smurf1 is also
involved in the ubiquitination and proteasomal degradation of TRIB2 in liver cells, that
36
requires the phosphorylation of TRIB2 at Serine 83 by P70 S6 kinase (P70S6K) (Wang et
al., 2013b). Stability and ubiquitination of TRIB2 in liver cells is additionally thought to be
negatively regulated by the E3 ligase complex SKIP1-CUL1 (Cullin)-F-box (SCF) βTrCP
(Qiao et al., 2013).
Collectively, the current knowledge on TRIB2 points towards a network of both regulatory
molecules and binding partners in which TRIB2 acts as a powerful oncogene. This is an on-
going research, with new mechanisms yet to be identified. Significant for the current study,
previous studies have connected TRIB2 with two protein arginine methyltransferases
(PRMTs). Interaction with PRMT6 was reported by a yeast two-hybrid screening approach
involving short-read second-generation sequencing (Weimann et al., 2013). TRIB2 was
also recently associated with the post-translational modifier PRMT5 by a mass
spectrometry assay (data from Prof Claire Eyers, University of Liverpool, further included
in (Uljon et al., 2016)) and this will be detailed in Chapter 5. It is also significant that the
tumorigenic role of TRIB2 is often associated with its ability to promote degradation of
key substrates, whose stability and downstream targets are affected. This happens via
association with E3 ubiquitin ligase enzymes and engagement of the ubiquitin proteasome
system (UPS), hence considered an attractive therapeutic target and further discussed.
1.4 The proteasome as a therapeutic target
1.4.1 The UPS
Two main routes have been identified for intracellular eukaryotic protein degradation
involving either lysosomes or proteasomes. Transmembrane proteins and proteins that
enter the cell from the extracellular milieu after endocytosis are degraded in lysosomes, a
proteolytic pathway that occurs mostly under stressed conditions. Proteasomes, via the
UPS, are in turn, responsible for the highly selective turnover of intracellular proteins that
occurs either under basal metabolic conditions or stress (Ciechanover, 1994). This
mechanism of proteolysis was discovered at the beginning of the 1980s by Aaron
Ciechanover, Avram Hershko and Irwin Rose, which resulted in the three scientists from
the Fox Chase Cancer Center (Philadelphia, USA) being jointly awarded with the 2004
Nobel Prize in Chemistry for the discovery of “ubiquitin-mediated protein degradation”.
37
The UPS plays a central role in maintaining cellular protein homeostasis through the
targeted degradation of approximately 80% of intracellular proteins. Selected targets are
damaged, misfolded and short-lived regulatory proteins that control critical cellular
functions, including cell cycle control, transcription, DNA damage repair, protein quality
control and antigen presentation. Degradation via the UPS involves two distinct and
consecutive steps: covalent attachment of multiple ubiquitin (Ub) molecules to a protein
substrate and proteasomal degradation (Ciechanover, 1998).
1.4.1.1 Ubiquitination and ubiquitin as a versatile cellular signalling
Ub-labelling of proteins is known as ubiquitination and is mediated by a sequential series
of enzymatic activities. An E1 Ub-activating enzyme, that can be either Ube1 or Ube1-L2,
activates Ub in an ATP-dependent manner and connects it to one of several Ub-
conjugating enzymes (E2). The activated Ub is then transferred to a target protein by a
member of the E3 Ub-ligase family (Hershko and Ciechanover, 1998, Jariel-Encontre et
al., 2008). Anchoring of the Ub moiety to the substrate occurs by covalent attachment to
the amino (-NH2) group of either the N-terminal residue (Breitschopf et al., 1998, Aviel et
al., 2000, Reinstein et al., 2000) or internal lysine(s) (Glickman and Ciechanover, 2002).
Replication of the three-step enzymatic cascade generates a poly-Ub chain that marks the
protein for degradation in the proteasome (Figure 1.5A). Ubiquitination can be reversed
through the action of deubiquitinating enzymes (DUBs). Balance between the opposing
actions of ubiquitin ligases an DUBs plays a critical role in regulating protein turnover and
function (Hochstrasser, 1995).
Ub chains of at least four molecules that form through their lysine residues at position 48
(K48) seem to invariably flag the protein for proteasome-mediated degradation (Thrower
et al., 2000), even if some proteins enter this proteolytic route without the requirement of a
Ub-tag, e.g., ornithine decarboxylase (Murakami et al., 1992), p21/Cip1 (Sheaff et al.,
2000), retinoblastoma (Rb) family of proteins (Kalejta and Shenk, 2003), hypoxia-
inducible factor 1 (Kong et al., 2007), calmodulin and troponin C (Benaroudj et al., 2001).
Given that Ub has seven acceptor lysines, the highly evolutionarily conserved 76-amino-
acid molecule can also be conjugated via its K6, 11, 27, 29,33 and 63, forming chains with
variable lengths and linkage types (Ikeda and Dikic, 2008). Ub can also modify substrate
proteins in its monomeric form. Such different post-translational modifications serve,
however, alternative purposes to proteolytic degradation. Mono-ubiquitination instead
controls cellular processes such as regulation of transcription, DNA repair, cellular
38
localization, epigenetic events and protein trafficking in the endocytic pathway (Hicke,
2001, Raiborg et al., 2006). Also the formation of K63-linked poly-ubiquitin chains seem
to serve purposes that partially overlap those of the mono-ubiquitination, including
intracellular trafficking, transcription, DNA repair and replication (Pickart and Eddins,
2004, Haglund and Dikic, 2005).
1.4.1.2 Proteasomal degradation
Substrate proteins tagged with K48-linked Ub polymers are degraded to small peptides by
the 26S proteasome. The 26S or constitutive proteasome is a multi-subunit complex
localized in both the nucleus and the cytoplasm of eukaryotes. It combines two 19S
regulatory caps, which contain ATPases and act as a recognition and entry site for proteins
destined for proteolysis, with a central core termed the 20S proteasome (Figure 1.5B). In
the 19S particle, free and recyclable Ub molecules are released and the target protein is
unfolded, linearized and fed into the 20S proteasome (Groll et al., 2000, Navon and
Goldberg, 2001), a cylindrical structure composed of four heptameric rings that create a
chamber for proteolysis to occur. The two outer rings are composed of -subunits, whereas
seven distinct -subunits form the two inner rings. At least 3 of the -subunits harbor the
proteolytically active sites of the proteasome (Groll et al., 1997) that are classified upon
preference to cleave after a particular amino acid residue. The three catalytic activities,
chymotrypsin-like (CT-L), trypsin-like (T-L) and caspase-like (C-L) are encoded by
separate polypeptides, 5, 2 and 1, respectively (Figure 1.5B).
An alternative proteasome isoform known as the immunoproteasome can be formed
predominantly in haemopoietic cells and in cells that have been exposed to gamma-
interferon (IFN-) or particular proinflammatory cytokines (Akiyama et al., 1994,
Stohwasser et al., 1997, Sijts and Kloetzel, 2011). The immunoproteasome expresses
subunits LMP7, MECL1 and LMP2 in place of 5, 2 and 1, altering the proteasome to
favour the generation of antigenic peptides to be presented by the major histocompatibility
complex (MHC) class 1 molecules and, thus, potentiating the immune system response
(Rock et al., 1994).
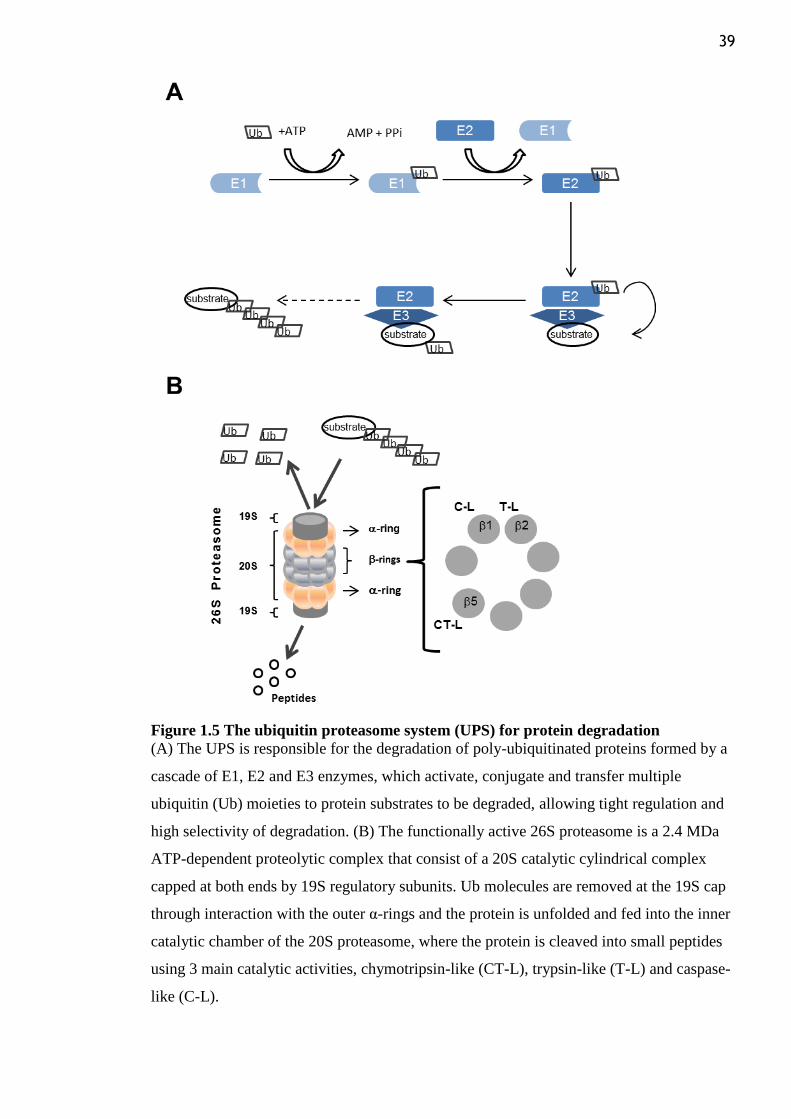
39
Figure 1.5 The ubiquitin proteasome system (UPS) for protein degradation
(A) The UPS is responsible for the degradation of poly-ubiquitinated proteins formed by a
cascade of E1, E2 and E3 enzymes, which activate, conjugate and transfer multiple
ubiquitin (Ub) moieties to protein substrates to be degraded, allowing tight regulation and
high selectivity of degradation. (B) The functionally active 26S proteasome is a 2.4 MDa
ATP-dependent proteolytic complex that consist of a 20S catalytic cylindrical complex
capped at both ends by 19S regulatory subunits. Ub molecules are removed at the 19S cap
through interaction with the outer α-rings and the protein is unfolded and fed into the inner
catalytic chamber of the 20S proteasome, where the protein is cleaved into small peptides
using 3 main catalytic activities, chymotripsin-like (CT-L), trypsin-like (T-L) and caspase-
like (C-L).
40
Given the important role that the UPS plays in regulating protein stability and thus normal
cellular function, it is not surprising that aberrant activity of this system has been
implicated in a variety of pathologies, including Alzheimer´s Disease (Keller et al., 2000a),
ischaemic stress (Keller et al., 2000b), diabetes (Broca et al., 2014) and cancer (Arlt et al.,
2009, Yu et al., 2009), in which haematological malignancies are included (Crawford and
Irvine, 2013). UPS abnormalities have been described as a result of deregulation in
regulatory pathways that are mediated by proteasome substrates, rather than specific
defects in proteasome structure or function (Adams, 2004).
1.4.2 Targeting the UPS
Targeting intracellular protein turnover by inhibiting the UPS has recently emerged as a
rational strategy for cancer therapy. The catalytic molecular properties of the proteasome
have been exploited chemically and pharmacological interference with UPS-mediated
proteolysis has been validated by a class of compounds collectively referred to as
proteasome inhibitors.
The possibility of targeting the proteasome for cancer therapeutics, although initially
doubted due to the essential role the UPS plays in critical biological processes, was well
supported by a wealth of experimental data. Pre-clinical results showed proteasome
inhibitors to be well tolerated with activity against in vivo models bearing human
malignancies (Orlowski et al., 1998). Moreover, it has been demonstrated that malignant
cells harbor elevated proteasome activity compared with normal cells (Arlt et al., 2009, Ma
et al., 2009) and have been shown to be relatively more sensitive to the effects of
proteasome inhibitors than their non-malignant counterparts. This differential susceptibility
was suggested to be associated with a higher dependency of highly proliferative malignant
cells on the proteasome system to remove aberrant proteins. Another explanation is that
inhibition of the proteasome activity interferes with cell-cycle or apoptosis molecules that
have caused the development or maintenance of the cancerous phenotype (Adams et al.,
1999)
Most proteasome inhibitors are based on peptides that serve as active-site analogs, which
bind to the proteasome subunits. Eight classes of proteasome inhibitors have been
recognized across natural compounds and synthetic molecules (peptide aldehydes, peptide
vinyl sulfones, syrbactins, peptide boronates, peptide epoxyketones, peptide
ketoaldehydes, β-lactones and oxatiazol-2-ones). Only representative members of some
41
classes have reached the stage of clinical trials investigations in cancer. Many have failed
due to the lack of specificity and/or toxicity in preclinical studies. Potent inhibition of the
CT-L activity of the proteasome is a shared property of the clinically relevant proteasome
inhibitors (Bennett and Kirk, 2008) and is suggested to be a necessary feature of these
drugs to produce an anti-tumor response (Parlati et al., 2009).
1.4.2.1 Bortezomib
The modified dipeptidyl boronic acid bortezomib (Brtz, former name PS-341, brand name
Velcade) (Palombella et al., 1998, Adams et al., 1999) was the first proteasome inhibitor to
be introduced into medical practice. Supported by preclinical and clinical studies, the US
Food and Drug Administration (FDA) approved in 2003 and 2006 the use of Brtz for the
treatment of multiple myeloma and mantle cell lymphoma, respectively (Kane et al., 2003,
Kane et al., 2007). Moreover, the selective and reversible inhibitor of the CT-L (β5 and
LMP7) subunit has shown in vitro and in vivo activity against a variety of other
haematological malignancies and solid tumours, either as a single agent or as a part of
combination therapy (Chen et al., 2011). Therapeutic proteasome inhibition has shown,
however, better results in blood cancers than in solid tumours (Orlowski and Kuhn, 2008)
and this could be due to the fact that leukaemic cells express high levels of proteasomes
(Kumatori et al., 1990).
1.4.2.2 Other UPS inhibitors
The development of Brtz has transformed the treatment of multiple myeloma and mantle
cell lymphoma. Following on its success, efforts are focused on the development of
second-generation proteasome inhibitors and small molecule inhibitors of other UPS
components. The core aim is to extend the spectrum of Brtz efficacy, hampered by the
appearance of dose-limiting toxicity (particularly peripheral neuropathy), limited activity
in solid tumours and drug-resistance. Recently, the FDA approved the epoxyketone peptide
carfilzomib for the treatment of relapsed/refractory multiple myeloma, while oprozomib,
ixazomib, marizomib and delanzomib have already reached clinical trials investigation
(Crawford and Irvine, 2013). The activity of immunoproteasome-specific inhibitors is also
currently being investigated and thought to be particularly efficacious for the treatment of
haematologic maliganacies. The immunoproteasomes are predominantly expressed in cells
of haemopoietic origin. Targeting them alone can, therefore, provide a certain amount of
specificity and an opportunity to overcome toxicities associated with proteasome
inhibition. Enzymes upstream of the proteasome are also being actively explored as
42
selective targets. In this category, compounds directed at E1, E2, E3 and DUB enzymes
have been developed to block aberrant pathways in malignant cells (Crawford and Irvine,
2013). Other examples of therapeutic agents that interfere with UPS action include an
inhibitor of the 19S ATPase reported to impair the degradation of folded proteins (Lim et
al., 2007) and the Nutlins, which inhibit the interaction of the E3 ligase MDM2 with the
tumour-suppressor protein p53 (Vassilev et al., 2004).
1.4.3 Mechanisms of anti-cancer activity of proteasome inhibitors
Although molecular mechanisms underlying proteasome inhibitors´ anti-cancer activity are
not fully elucidated, it is clear that multiple pathways are involved, as detailed in several
reviews (Almond and Cohen, 2002, Adams, 2004, Nencioni et al., 2007, Crawford and
Irvine, 2013). One of the first mechanisms of action attributed to proteasome inhibitors
was suppression of the nuclear factor kB (NF-kB) signaling pathway, which has a critical
role in multiple myeloma pathogenesis, hence the first disease to be considered a target for
proteasome inhibition therapy (Hideshima et al., 2001). While contradicted by recent
studies (Dolcet et al., 2006, Hideshima et al., 2009), proteasome inhibition was shown to
block activation of the inflammation-associated transcription factor NF-kB by preventing
degradation of its inhibitory molecule IkB, which in response to stress (e.g. neoplasia and
chemotherapy) becomes phosphorylated, ubiquitinated and deactivated by the 26S multi-
subunit complex. Association of stabilized IkB with NF-kB confines them to inactivity in
the cytoplasm, thereby downregulating levels of NF-kB transcriptional targets (such as IL-
6) and promoting pro-survival pathways (Finco and Baldwin, 1995).
Although the UPS is the predominant non-lysosomal pathway of proteolysis in eukaryotic
cells, proteasome inhibition also has other known effects. Many of these contribute to anti-
tumour activity since proteasome substrates are often known mediators of proliferation and
apoptotic signaling pathways that are deregulated in cancer. Proteasome inhibition has
been proposed to induce apoptosis by stabilizing pro-apoptotic p53, Bax proteins and
NOXA, while reducing levels of anti-apoptotic proteins such as Bcl-2 and inhibitor of
apoptosis family of protein (Zhang et al., 2004a). Other mechanisms ascribed to
proteasome inhibitors are disruption of the unfolded protein response (UPR) with pro-
apoptotic endoplasmic reticulum (ER) stress induction (Lee et al., 2003) and increase of
intracellular reactive oxygen species and oxidative stress (Perez-Galan et al., 2006).
Moreover, studies on the proteasome inhibition effect in multiple myeloma cells showed
that it triggers a dual apoptotic pathway of mitochondrial cytochrome c release and
43
caspase-9 activation, as well as activation of Jun kinase and a Fas/caspase-8-dependent
apoptotic pathway (Mitsiades et al., 2002). Proteasome inhibitors were also shown to cause
G2/M cell cycle arrest in cell lines of different origins, namely, ovarian (Bazzaro et al.,
2006), prostate (Adams et al., 1999) and non-small lung cancer (Ling et al., 2002), multiple
myeloma (Buzzeo et al., 2005) and AML (HEL cells) (Colado et al., 2008). The effect on
cell cycle regulation is associated with stabilisation of the tumour suppressor molecule
P27KIP1, which prevents activation of both cyclin D and cyclin E to negatively regulate
progression through the G1/S phase of the cell cycle (Pagano et al., 1995). Furthermore,
proteasome inhibition appears to regulate DNA repair (Motegi et al., 2009) and elicits anti-
angiogenic effects on the tumour microenvironment, including reduced multiple myeloma
cells migratory capacity in response to vascular endothelial growth factor (VEGF) (Podar
et al., 2004, Roccaro et al., 2006). Other effects of proteasome inhibitors appear to promote
cellular survival, such as activating multiple heat-shock protein (HSP) family members,
inducing the stress response protein MKP-1 and promoting activity of the protein kinase
B/Akt pathway. Fortunately, on balance, the net effect is typically a pro-apoptotic one, as
evidenced by the findings of the first study of Brtz (Orlowski and Kuhn, 2008).
Given the central role of the proteasome in protein homeostasis and cellular physiology,
discussion on the ultimate targets of proteasome inhibitors is ongoing and additional
studies are needed to better understand the mechanisms of the apoptotic cascades mediated
by this class of compounds. However, it seems clear that proteasome inhibition holds much
promise as a new investigational avenue for treatment of haematological malignancies and
cancer therapy in general.
1.5 Aims
The following thesis is an investigation on TRIB2 in the context of human AML, from
both a biological and therapeutic angle. Experiments were designed to address the
subsequent specific aims:
1.To evaluate TRIB2 oncogenic properties in human AML cells;
2.To investigate if high TRIB2 AML cells are responsive to proteasome inhibition
treatment;
3.To examine whether TRIB2 interacts with PMRT5.

44
Chapter 2: Materials and Methods
45
2.1 Tissue Culture
Tissue culture was conducted using a laminar air flow hood. An aseptic technique was
maintained with all materials sprayed in 70% alcohol prior to use.
2.1.1 Culture of cell lines
All cell lines were maintained at 37°C with 5% CO2, counted and passaged every two days
with warm fresh medium to maintain a density of ~0.15x10⁶ cells/mL. Cell lines were
passaged for a maximum of 2 months, after which new seed stocks were thawed and tested
for mycoplasma contamination using the MycoAlert mycoplasma detection kit (Lonza, PN
LT07-318) according to the manufacturer‟s instructions.
Adult AML cell lines OCI-AML5 and MUTZ-2, paediatric AML cells SB1690CB and
SBRes, and the human bladder carcinoma cell line 5637 were kindly provided by Dr.
Stefan Meyer (University of Manchester). SBRes cell line was derived from SB1690CB
after selection for resistance to mitomycin-c. All cells were cultured in Roswell Park
Memorial Institute (RPMI) 1640 (Life Technologies, PN 12633-012) medium
supplemented as described in Table 2.1. The 5637 cell line-conditioned media was used as
a source of several functional cytokines, including G-CSF and GM-CSF. Dr. Stefan Meyer
also provided CV1665, CV1785, CV1810 and CV1939 cells. These cell lines are derived
from patients carrying Fanconi anaemia-associated defects and were used as a model of
non-AML cells. The U937, NB4 and Kasumi-1 AML cells were available in-house and
grown in suspension culture (Table 2.1). K562 leukaemic cells were also grown in RPMI
1640 complete medium (Table 2.1). Human embryonic kidney cells 293T cells were used
for lentiviral packaging and transient transfection, and mouse embryonic fibroblast 3T3
cells were grown for virus titration. Both of these adherent cell lines were maintained in
Dulbecco's modified eagle medium (DMEM, Life Technologies, PN 11966-025) complete
media (Table 2.1).
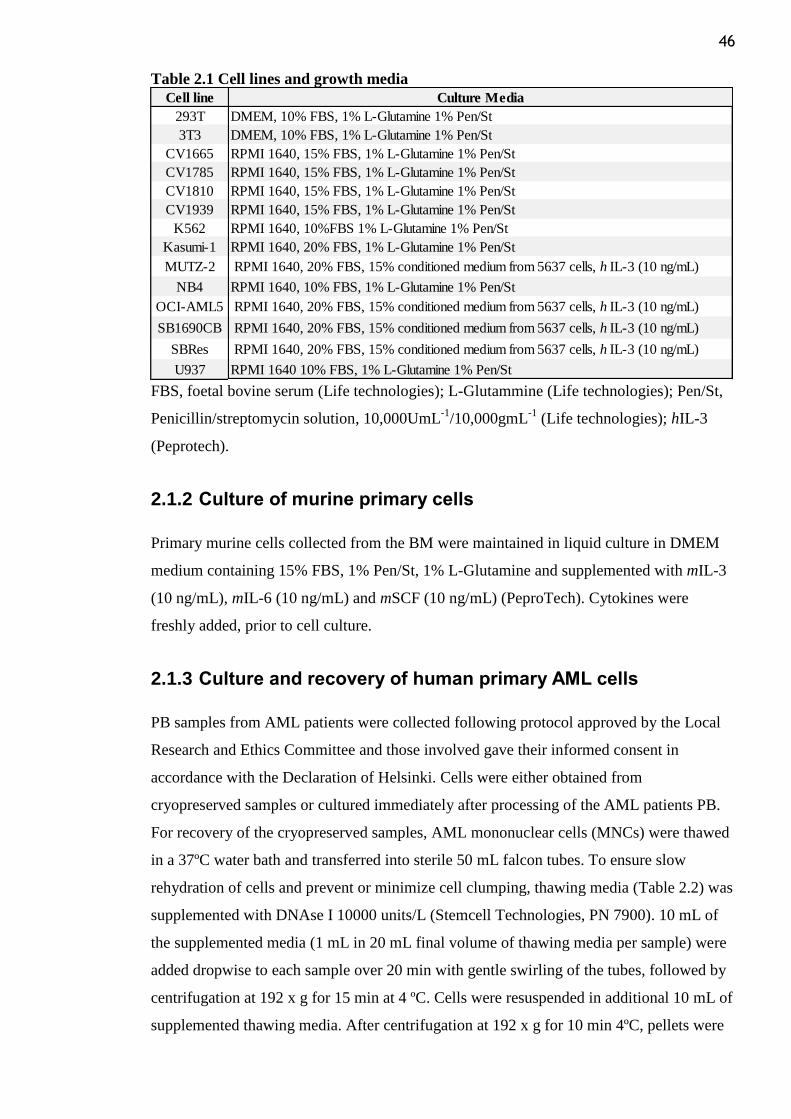
46
Table 2.1 Cell lines and growth media
FBS, foetal bovine serum (Life technologies); L-Glutammine (Life technologies); Pen/St,
Penicillin/streptomycin solution, 10,000UmL-1
/10,000gmL-1
(Life technologies); hIL-3
(Peprotech).
2.1.2 Culture of murine primary cells
Primary murine cells collected from the BM were maintained in liquid culture in DMEM
medium containing 15% FBS, 1% Pen/St, 1% L-Glutamine and supplemented with mIL-3
(10 ng/mL), mIL-6 (10 ng/mL) and mSCF (10 ng/mL) (PeproTech). Cytokines were
freshly added, prior to cell culture.
2.1.3 Culture and recovery of human primary AML cells
PB samples from AML patients were collected following protocol approved by the Local
Research and Ethics Committee and those involved gave their informed consent in
accordance with the Declaration of Helsinki. Cells were either obtained from
cryopreserved samples or cultured immediately after processing of the AML patients PB.
For recovery of the cryopreserved samples, AML mononuclear cells (MNCs) were thawed
in a 37ºC water bath and transferred into sterile 50 mL falcon tubes. To ensure slow
rehydration of cells and prevent or minimize cell clumping, thawing media (Table 2.2) was
supplemented with DNAse I 10000 units/L (Stemcell Technologies, PN 7900). 10 mL of
the supplemented media (1 mL in 20 mL final volume of thawing media per sample) were
added dropwise to each sample over 20 min with gentle swirling of the tubes, followed by
centrifugation at 192 x g for 15 min at 4 ºC. Cells were resuspended in additional 10 mL of
supplemented thawing media. After centrifugation at 192 x g for 10 min 4ºC, pellets were
Cell line Culture Media
293T DMEM, 10% FBS, 1% L-Glutamine 1% Pen/St
3T3 DMEM, 10% FBS, 1% L-Glutamine 1% Pen/St
CV1665 RPMI 1640, 15% FBS, 1% L-Glutamine 1% Pen/St
CV1785 RPMI 1640, 15% FBS, 1% L-Glutamine 1% Pen/St
CV1810 RPMI 1640, 15% FBS, 1% L-Glutamine 1% Pen/St
CV1939 RPMI 1640, 15% FBS, 1% L-Glutamine 1% Pen/St
K562 RPMI 1640, 10%FBS 1% L-Glutamine 1% Pen/St
Kasumi-1 RPMI 1640, 20% FBS, 1% L-Glutamine 1% Pen/St
MUTZ-2 RPMI 1640, 20% FBS, 15% conditioned medium from 5637 cells, h IL-3 (10 ng/mL)
NB4 RPMI 1640, 10% FBS, 1% L-Glutamine 1% Pen/St
OCI-AML5 RPMI 1640, 20% FBS, 15% conditioned medium from 5637 cells, h IL-3 (10 ng/mL)
SB1690CB RPMI 1640, 20% FBS, 15% conditioned medium from 5637 cells, h IL-3 (10 ng/mL)
SBRes RPMI 1640, 20% FBS, 15% conditioned medium from 5637 cells, h IL-3 (10 ng/mL)
U937 RPMI 1640 10% FBS, 1% L-Glutamine 1% Pen/St
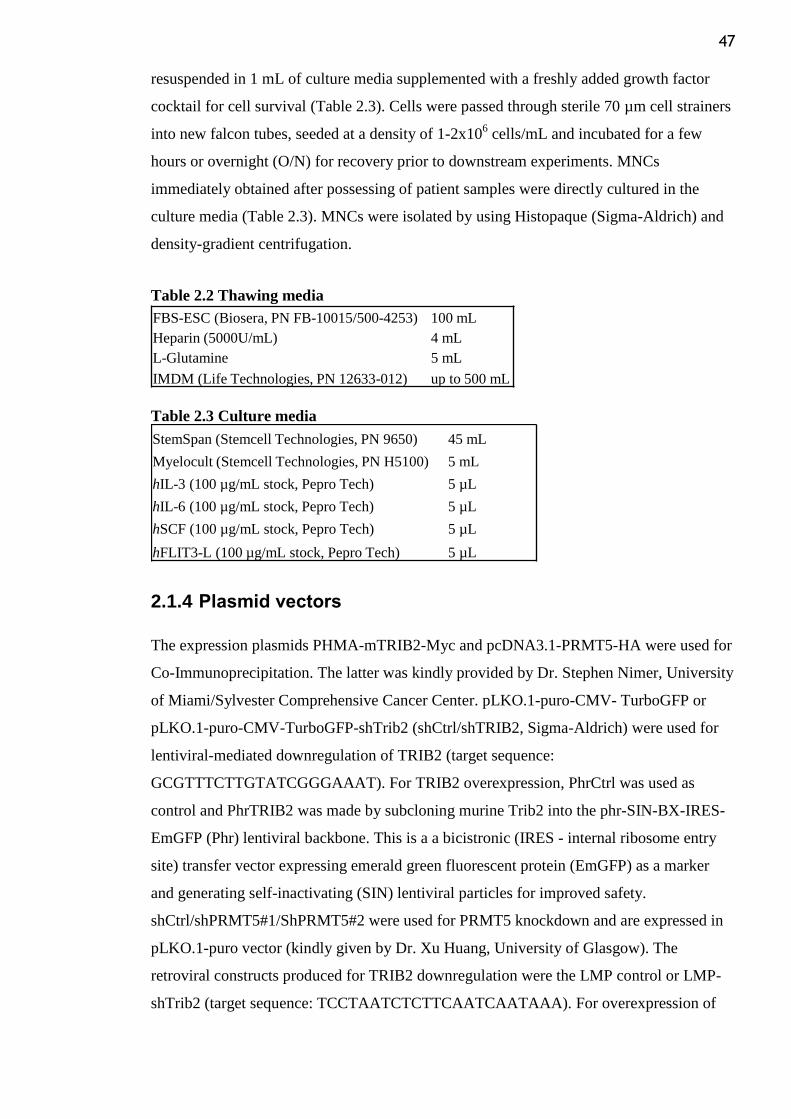
47
resuspended in 1 mL of culture media supplemented with a freshly added growth factor
cocktail for cell survival (Table 2.3). Cells were passed through sterile 70 µm cell strainers
into new falcon tubes, seeded at a density of 1-2x10⁶ cells/mL and incubated for a few
hours or overnight (O/N) for recovery prior to downstream experiments. MNCs
immediately obtained after possessing of patient samples were directly cultured in the
culture media (Table 2.3). MNCs were isolated by using Histopaque (Sigma-Aldrich) and
density-gradient centrifugation.
Table 2.2 Thawing media
Table 2.3 Culture media
2.1.4 Plasmid vectors
The expression plasmids PHMA-mTRIB2-Myc and pcDNA3.1-PRMT5-HA were used for
Co-Immunoprecipitation. The latter was kindly provided by Dr. Stephen Nimer, University
of Miami/Sylvester Comprehensive Cancer Center. pLKO.1-puro-CMV- TurboGFP or
pLKO.1-puro-CMV-TurboGFP-shTrib2 (shCtrl/shTRIB2, Sigma-Aldrich) were used for
lentiviral-mediated downregulation of TRIB2 (target sequence:
GCGTTTCTTGTATCGGGAAAT). For TRIB2 overexpression, PhrCtrl was used as
control and PhrTRIB2 was made by subcloning murine Trib2 into the phr-SIN-BX-IRES-
EmGFP (Phr) lentiviral backbone. This is a a bicistronic (IRES - internal ribosome entry
site) transfer vector expressing emerald green fluorescent protein (EmGFP) as a marker
and generating self-inactivating (SIN) lentiviral particles for improved safety.
shCtrl/shPRMT5#1/ShPRMT5#2 were used for PRMT5 knockdown and are expressed in
pLKO.1-puro vector (kindly given by Dr. Xu Huang, University of Glasgow). The
retroviral constructs produced for TRIB2 downregulation were the LMP control or LMP-
shTrib2 (target sequence: TCCTAATCTCTTCAATCAATAAA). For overexpression of
FBS-ESC (Biosera, PN FB-10015/500-4253) 100 mL
Heparin (5000U/mL) 4 mL
L-Glutamine 5 mL
IMDM (Life Technologies, PN 12633-012) up to 500 mL
StemSpan (Stemcell Technologies, PN 9650) 45 mL
Myelocult (Stemcell Technologies, PN H5100) 5 mL
hIL-3 (100 µg/mL stock, Pepro Tech) 5 µL
hIL-6 (100 µg/mL stock, Pepro Tech) 5 µL
hSCF (100 µg/mL stock, Pepro Tech) 5 µL
hFLIT3-L (100 µg/mL stock, Pepro Tech) 5 µL
48
full-length (42 kDa) C/EBPα, a bicistronic retrovirus (MigR1) was used, containing the
IRES-GFP elements and carrying C/EBPα cDNA lacking the uORF.
2.1.5 Virus production
2.1.5.1 Lentivirus
For lentiviral vectors production, 4.5x10⁶ 293T cells were plated in 10 cm dishes 24 h
before transfection (CaCl2 method). 3-4 h prior to transfection, 10 mL of fresh medium
(Table 2.1) were added to the cells. The lentiviral transfer vector DNA (15 µg), together
with psPAX2 packaging (10 µg) and VSVG envelope plasmid DNA (6 µg) were
combined. Plasmids were previously verified by restriction enzyme digestion (psPAX2
digested with EcoRI renders 1.7 and 4.3 kb fragments, and VSVG digested with BamHI
results in two bands of 1.7 and 4.7 kb). The precipitate was formed by adding 31 μg of
DNA to a final volume of 500 µL dH2O and 61 μL 2.5M CaCl2. The mixture was added
dropwise to 500 µL 2X HEPES-buffered saline (280 mM NaCl, 50 mM HEPES, 1.5 mM
Na2HPO4, pH 7.05) while vortexing the 15 mL falcon tube to vigorously bubble air
through the DNA mix. The solution was incubated at room temperature (RT) for 5 min.
Following this, the solution was added dropwise to the cells. Dishes were rocked gently in
a circular motion to distribute the precipitates, and then returned to the incubator. 12 to 16
h later, the medium was replaced with fresh growth medium supplemented with 2% FBS
and incubated at 5% CO2 for 24 h prior to the initial collection of viral supernatant. A
second collection was made after a further 24 h. The conditioned medium from the two
harvests was centrifuged at 432 x g for 5 min at 4ºC to discard cell debris. Aliquots of viral
supernatants were snap frozen on dry ice and stored at -80ºC.
2.1.5.2 Retrovirus
For retrovirus production, the same protocol described for lentivirus production was
adopted, with the following changes: pCGP (digestion with HindIII renders 4.5 and 6.2 kb
fragments) was used as packaging construct instead of psPAX2. Also, to prepare the DNA
cocktail, CaCl2 was used at 2M and 50 µL 10X NTE buffer (2 M NaCl, 1 M Tris-HCl pH
7.4, 0.25 M EDTA pH 8.0, dH20 up to 100 mL) were also included in the mixture. The
DNA mixture was added to only 3 mL of fresh media and replaced after 6 h transfection
with 4.5 mL of pre-warmed media. Supernatants containing packaged virus particles were
collected after 24, 48 and 72 h.
49
2.1.6 Virus titration
For constructs co-expressing GFP, titres were determined by transducing 3T3 cells. Cells
were seeded the day before transduction at 2×10⁵
in 6 cm dishes. After 24 h, 1 mL of fresh
growth media (Table 2.1) was added to each plate, supplemented with 8 μg/mL polybrene
(Sigma-Aldrich, PN 107689, stock at 4 mg/mL). Titres were determined with 1:10 and
1:100 dilutions of virus stocks added to the 3T3 cells plates. The following day, 2 mL of
fresh growth medium were added to the plates. After further 24 h of incubation, cells were
harvested and GFP expression was determined by flow cytometry using FITC channel on
BD FACSCantoTM
II. Acquired data were analysed using FlowJo software (Treestar, v10).
2.1.7 Transduction of suspension cells
Cells were seeded at 0.2x10⁶/mL on the day before transduction so as to be in the
logarithmic growth phase at the beginning of the experiment. Cells were transduced either
with lentiviral or retroviral constructs. Briefly, cells were harvested and resuspended in
complete culture medium supplemented with extra 10% FBS and polybrene (Sigma-
Aldrich, PN 107689, stock at 4 mg/mL) at 8 µg/mL. Cryopreserved aliquots with 1 mL of
virus supernatant were thawed in a water bath and added into target cells. Cells were
centrifuged for 60 min at 1250 x g and returned to the incubator. After 3-6 h, fresh media
was added to the cells (up to a final volume of 10 mL) for O/N incubation. Selection of
efficiently transduced cells was achieved by either sorting GFP+ cells or treatment with 2
µg/mL puromycin (Sigma-Aldrich, PN P7255, 10 mg/mL stock) for 48 h to eliminate non-
infected cells. Non-transduced cells were included as a control for puromycin selection.
2.1.8 Drugs
Brtz (M.W. 384.24) was purchased from LC laboratories (PN B-1408) and prepared as a
25 mg/mL (65 mM) stock. Peptido sulfonyl fluoride (SF; M.W. 656.85) was provided by
Professor Robert M. Liskamp and Raik Artschwager (School of Chemistry, University of
Glasgow). Drug was prepared as a 21.9 mg/mL (33 mM) stock. Carfilzomib (Cfz; M.W.
719.91) was purchased from LC laboratories (PN C-3022). A 50 mg/mL (69 mM) stock
was made. All drugs were prepared in dimethyl sulphoxide (DMSO) and stored as single
use aliquots at -20ºC.
50
2.1.8.1 In vitro drug treatment
Cells were plated at 0.2x10⁶/mL and were treated with 10 nM Brtz, 500 nM SF, 10 nM Cfz
or DMSO only. After 6, 8, 16 or 24 h cytotoxicity was assessed as described in section 2.8.
Treatment time points are indicated in the related Figure legends.
2.1.8.2 Methylcellulose colony-forming assay of Brtz treated and untreated secondary Trib2 murine cells
Primary Trib2 murine AML cells propagated in secondary transplanted recipients were
collected and treated with Brtz at 10 nM or DMSO. After 24 h, cells were counted by the
trypan blue exclusion. 1.4×10⁴ cells were then plated in duplicate in methylcellulose media
(MethoCult™ GF M3434, Stem Cell Technologies). Colonies were scored at 7 days under
an inverted microscope and analysed by FACS for detection of myeloid cell surface
markers with CD11b-APC and Gr-1-PE or Gr-1-PECy7 antibodies (Table 2.13).
2.1.8.3 In vivo drug treatment
The 25 mg/mL stock of Brtz was diluted on day of treatment with sterile phosphate
buffered saline (PBS). Treated mice were injected with Brtz at a dose of 0.5 mg/kg body
weight.
2.2 PCR-based assays
2.2.1 Primer pair design
Primers for SYBR Green detection and fluidigm assay were designed using Primer-
BLAST software available at NCBI website (http://www.ncbi.nlm.nih.gov/tools/primer-
blast) and following specific considerations. Forward and reverse primers have
approximately 20 bp with similar melting temperature (Tm ; ~60ºC) and a GC content in
the range of 40-60%. All selected primers amplify amplicons within the target genes of
about 100 to 180 bp and were checked for absence of self-complementary capability or
complementary to the other primer in the reaction mixture. This encourages formation of
hairpin structures and primer-dimers that would compete with the template for the use of
primer and reagents and could lower the amplification yield of the desired target region. In
addition, primers are either spanning an intron or overlapping an exon-exon junction to
allow a product obtained from the cDNA to be distinguished from unspliced genomic
DNA contamination. Primers that were found to anneal to sequences other than the
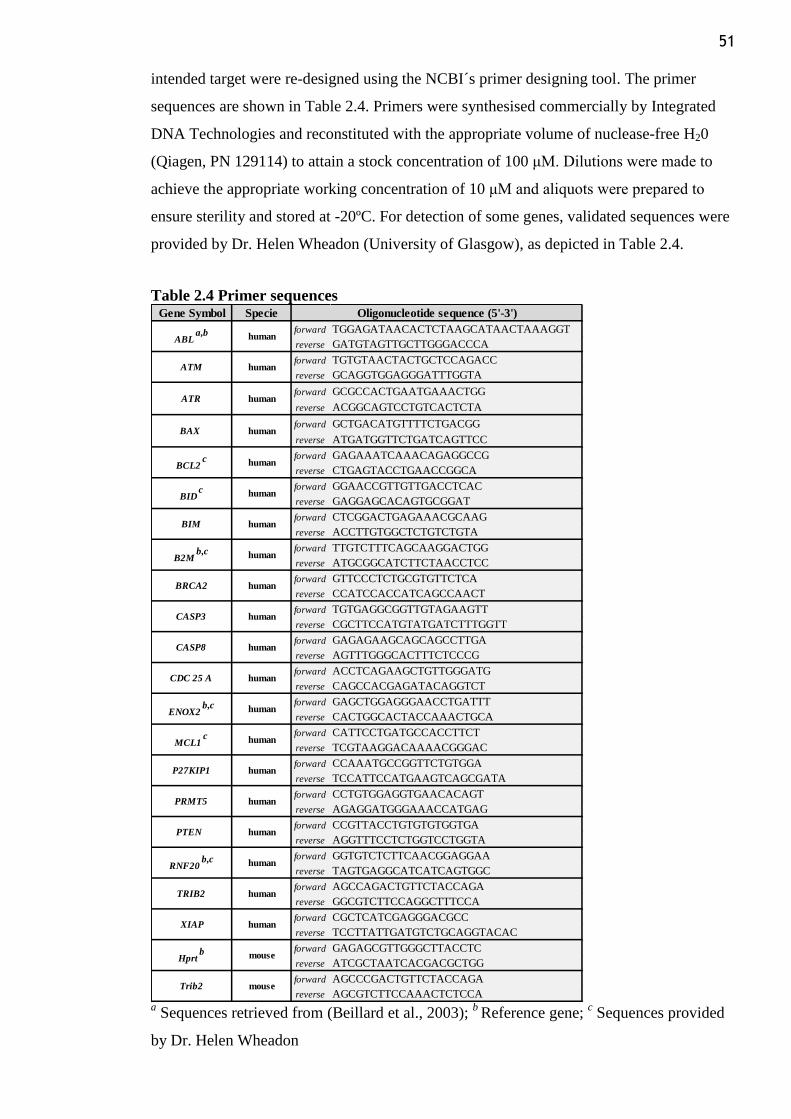
51
intended target were re-designed using the NCBI´s primer designing tool. The primer
sequences are shown in Table 2.4. Primers were synthesised commercially by Integrated
DNA Technologies and reconstituted with the appropriate volume of nuclease-free H20
(Qiagen, PN 129114) to attain a stock concentration of 100 μM. Dilutions were made to
achieve the appropriate working concentration of 10 μM and aliquots were prepared to
ensure sterility and stored at -20ºC. For detection of some genes, validated sequences were
provided by Dr. Helen Wheadon (University of Glasgow), as depicted in Table 2.4.
Table 2.4 Primer sequences
a Sequences retrieved from (Beillard et al., 2003);
b Reference gene;
c Sequences provided
by Dr. Helen Wheadon
Gene Symbol Specie
forward TGGAGATAACACTCTAAGCATAACTAAAGGT
reverse GATGTAGTTGCTTGGGACCCA
forward TGTGTAACTACTGCTCCAGACC
reverse GCAGGTGGAGGGATTTGGTA
forward GCGCCACTGAATGAAACTGG
reverse ACGGCAGTCCTGTCACTCTA
forward GCTGACATGTTTTCTGACGG
reverse ATGATGGTTCTGATCAGTTCC
forward GAGAAATCAAACAGAGGCCG
reverse CTGAGTACCTGAACCGGCA
forward GGAACCGTTGTTGACCTCAC
reverse GAGGAGCACAGTGCGGAT
forward CTCGGACTGAGAAACGCAAG
reverse ACCTTGTGGCTCTGTCTGTA
forward TTGTCTTTCAGCAAGGACTGG
reverse ATGCGGCATCTTCTAACCTCC
forward GTTCCCTCTGCGTGTTCTCA
reverse CCATCCACCATCAGCCAACT
forward TGTGAGGCGGTTGTAGAAGTT
reverse CGCTTCCATGTATGATCTTTGGTT
forward GAGAGAAGCAGCAGCCTTGA
reverse AGTTTGGGCACTTTCTCCCG
forward ACCTCAGAAGCTGTTGGGATG
reverse CAGCCACGAGATACAGGTCT
forward GAGCTGGAGGGAACCTGATTT
reverse CACTGGCACTACCAAACTGCA
forward CATTCCTGATGCCACCTTCT
reverse TCGTAAGGACAAAACGGGAC
forward CCAAATGCCGGTTCTGTGGA
reverse TCCATTCCATGAAGTCAGCGATA
forward CCTGTGGAGGTGAACACAGT
reverse AGAGGATGGGAAACCATGAG
forward CCGTTACCTGTGTGTGGTGA
reverse AGGTTTCCTCTGGTCCTGGTA
forward GGTGTCTCTTCAACGGAGGAA
reverse TAGTGAGGCATCATCAGTGGC
forward AGCCAGACTGTTCTACCAGA
reverse GGCGTCTTCCAGGCTTTCCA
forward CGCTCATCGAGGGACGCC
reverse TCCTTATTGATGTCTGCAGGTACAC
forward GAGAGCGTTGGGCTTACCTC
reverse ATCGCTAATCACGACGCTGG
forward AGCCCGACTGTTCTACCAGA
reverse AGCGTCTTCCAAACTCTCCA
BCL2c human
human
XIAP human
MCL1c human
human
human
human
P27KIP1
PTEN
RNF20b,c
human
human
human
ATR
human
human
BAX human
Oligonucleotide sequence (5'-3')
ABLa,b
TRIB2
PRMT5
human
humanENOX2b,c
human
human
human
BIM
BRCA2
CASP3
CASP8
CDC 25 A
ATM
humanBIDc
Trib2 mouse
Hprtb mouse
human
B2Mb,c
52
2.2.2 Total RNA extraction
An appropriate number of cells (0.2-1x10⁶) were spun and washed in PBS by
centrifugation at 432 x g for 5 min at 4°C before use. The RNeasy Mini Kit (Qiagen, PN
74106) was used as per manufacturer‟s instructions. The resulting RNA was quantified and
examined for purity using a NanoDrop spectrophotometer ND-1000 (Labtech International
Ltd). RNA was kept on ice at all times and stored diluted in nuclease-free H20 at -80ºC.
2.2.3 Reverse Transcription PCR
cDNA was prepared from 1 μg RNA using the High-Capacity cDNA Reverse
Transcription Kit (Applied Biosystems, PN 4368814) according to the manufacturer‟s
instructions. 1 μg of RNA was converted to cDNA in a 20 μL reaction. When low RNA
yields were obtained, the maximum volume of RNA was added to a 20 μL reaction.
Briefly, RNA samples were prepared to a concentration of 1 μg per 13.2 μL in nuclease-
free H20 and mixed with 6.8 μL of pre-prepared 2X reverse transcription master mix in a
PCR tube placed on ice. Components of the master mixture were added to give a final
concentration/reaction of 1X RT-buffer, 4 mM dNTP mix, 1X RT random primers, 2.5
U/µL MultiScribe reverse transcriptase and 1 U/µL RNAase inhibitor. The 20 μL reaction
mixture was run in a MastercyclerTM
PCR machine. Thermal cycling conditions were used
as per the manufacturer‟s instructions: 25ºC for 10 min, 37ºC for 120 min and 85ºC for 5
sec to denature the reverse transcriptase. The reaction was then cooled to 4°C. Synthesised
cDNA prepared from 1 μg of RNA was further diluted to a final volume of 40 μL in
nuclease-free H20 and stored at -20°C.
2.2.4 Standard Polymerase Chain Reaction (PCR)
cDNA samples of human cell lines were amplified by PCR reaction for TRIB2 detection.
Primer sequences are listed in Table 2.4 and were also used for quantitative PCR analysis.
PCR mix was prepared using FastStart High Fidelity PCR System (Roche, PN
03553426001) according to the manufacturer‟s instruction. Components of the mixture
were added to each 0.2 mL PCR tube to give a final concentration per reaction of 1X
reaction buffer, 200 µM of each dNTP, 0.4 µM of each forward and reverse primer, 2.5 U
FastStart High Fidelity Enzyme Blend, 1.8 mM MgCl2, 2 µL of cDNA and ddH20 up to a
final volume of 50 µL. The PCR tubes were heated to 95°C for 2 min and then 35 cycles of
95°C for 30 sec, 57°C for 45 sec and 72°C for 45 sec were set in a PCR Thermo Cycler.
After all cycles finished, the tubes were heated to 72°C for 5 min for final extension and
53
then held at 4°C. PCR products were separated by 1.8% agarose gel electrophoresis in 1X
TBE (5X TBE solution (Table 2.5) diluted in dH20) and visualized by addition of
SybrSafe™ (Invitrogen, PN S33102). A molecular ladder of 100 bp was run with samples
to know the exact size of the PCR products. DNA was visualised under UV illumination,
using the molecular imager® ChemiDoc Chemidoc™ XRS visualisation system.
Table 2.5 5X TBE
2.2.5 Quantitative PCR (qPCR)
qPCR was performed using Fast SYBR® Green Master Mix (Applied Biosystems, PN
4385616). In a MicroAmp Optical 384-well reaction plate (Applied Biosystems, PN
4309849), a total volume of 10 μL/reaction was prepared containing 1X Fast SYBR®
Green Master Mix (SYBR® Green I dye, AmpliTaq® Fast DNA Polymerase (Ultra Pure),
Uracil-DNA glycosylase, dNTPs, ROX™ dye Passive Reference, in addition to optimised
buffer components), 0.25 µM of each primer (forward and reverse at 10 µM) and 1 μL
cDNA, diluted in nuclease-free H2O. For each sample, each gene was assayed in technical
triplicates with reference gene(s) used as internal control(s) to normalize input cDNA.
Genes are indicated in the related Figure legends and primer sequences are listed in Table
2.4. A negative control containing nuclease-free H2O in place of cDNA was included to
reject the possibility of contamination. Plate wells were sealed and the plate was briefly
centrifuged to eliminate any air bubbles and loaded onto a 7900HT Fast Real-Time PCR
System (Applied Biosystems). The standard thermal cycling conditions were used as per
the manufacturer‟s instructions: 95°C for 20 sec followed by 40 cycles of 95°C for 1 sec
and 60°C for 20 sec and a final step of 50°C for 2 min. Data were acquired and analysed
using SDS and RQ manager software (Applied Biosystems). Obtained baseline and
threshold settings were reviewed and manually adjusted when needed. After normalization
to the endogenous control gene(s), levels of gene mRNA expression in each sample were
determined by the 2-ΔΔCT method of relative quantification and reported as fold change
(Schmittgen and Livak, 2008). In the particular case of ABL (V-Abl Abelson Murine
Leukaemia Viral Oncogene Homolog) and TRIB2 mRNA amplification, a melt-curve
profile was generated after qPCR reaction, confirming absence of non-specific
Components and final concentration Amount to add per 1 L
445 mM Tris Base 54 g
445 mM Boric Acid 27.5 g
10mM EDTA (0.5 M, pH 8.0) 20 mL
dH20 up to 1 L
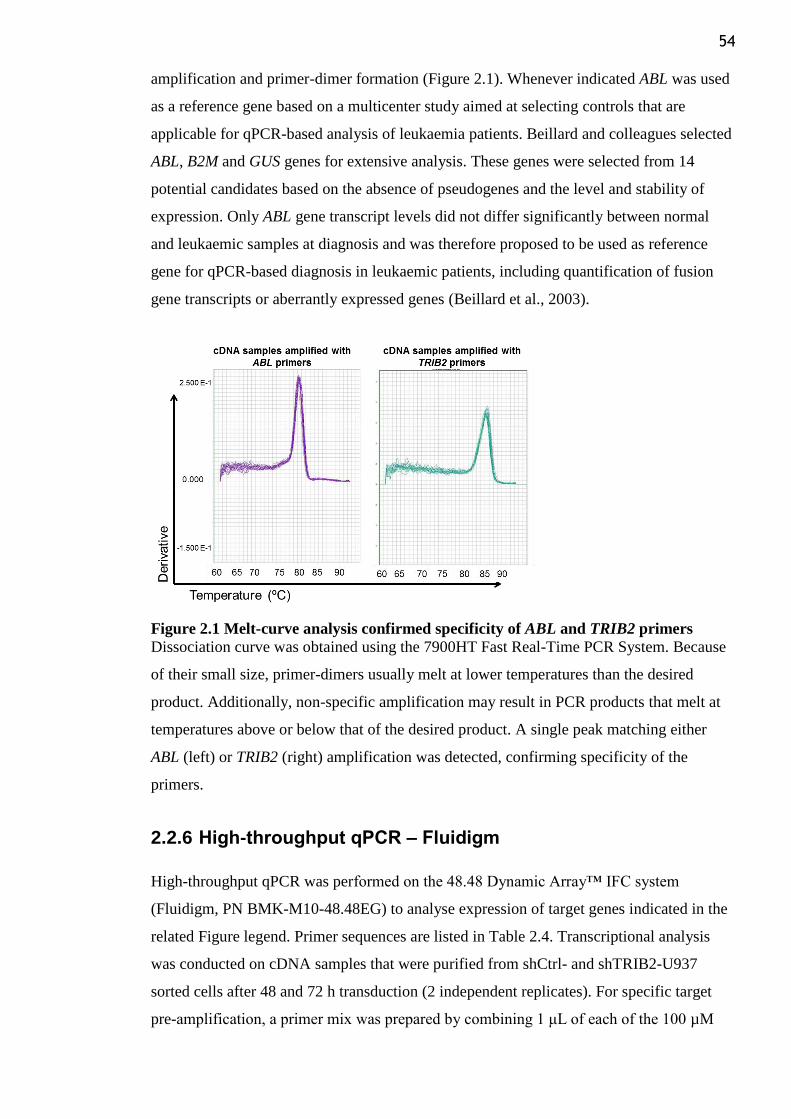
54
amplification and primer-dimer formation (Figure 2.1). Whenever indicated ABL was used
as a reference gene based on a multicenter study aimed at selecting controls that are
applicable for qPCR-based analysis of leukaemia patients. Beillard and colleagues selected
ABL, B2M and GUS genes for extensive analysis. These genes were selected from 14
potential candidates based on the absence of pseudogenes and the level and stability of
expression. Only ABL gene transcript levels did not differ significantly between normal
and leukaemic samples at diagnosis and was therefore proposed to be used as reference
gene for qPCR-based diagnosis in leukaemic patients, including quantification of fusion
gene transcripts or aberrantly expressed genes (Beillard et al., 2003).
Figure 2.1 Melt-curve analysis confirmed specificity of ABL and TRIB2 primers
Dissociation curve was obtained using the 7900HT Fast Real-Time PCR System. Because
of their small size, primer-dimers usually melt at lower temperatures than the desired
product. Additionally, non-specific amplification may result in PCR products that melt at
temperatures above or below that of the desired product. A single peak matching either
ABL (left) or TRIB2 (right) amplification was detected, confirming specificity of the
primers.
2.2.6 High-throughput qPCR – Fluidigm
High-throughput qPCR was performed on the 48.48 Dynamic Array™ IFC system
(Fluidigm, PN BMK-M10-48.48EG) to analyse expression of target genes indicated in the
related Figure legend. Primer sequences are listed in Table 2.4. Transcriptional analysis
was conducted on cDNA samples that were purified from shCtrl- and shTRIB2-U937
sorted cells after 48 and 72 h transduction (2 independent replicates). For specific target
pre-amplification, a primer mix was prepared by combining 1 μL of each of the 100 µM
55
primers to be included on the chip and diluting with TE buffer (Promega, PN V6231) to
make a final volume of 200 µL. A total volume of 5 μL/reaction was prepared containing
3.75 µL of the pre-amplification mixture (1.25 µL primer mix and 2.5 µL Qiagen
Multiplex PCR Kit (Qiagen, PN 206143)) and 1.25 µL of cDNA. The mixture was run in a
MastercyclerTM
PCR machine with the following conditions: 10 min at 95ºC followed by
14 cycles of 95 ºC for 15 s and 60 ºC for 4 min. The pre-amplified cDNAs were treated
with Exonuclease I (New England Biolabs, PN M0293S), 5-fold diluted in 18 L of TE
buffer and stored at -20ºC. For the fluidigm assay, the 48.48 dynamic array was primed in
order to close the interface valves and prevent premature mixing of samples and assays.
The assay mix solutions were prepared by combining 3 μL of 2X Assay loading reagent
(Fluidigm, PN 85000736), 0.3 µL TE buffer and 2.7 μL of each primer pair (from 100 µM
stocks of combined forward and reverse primers). The sample solutions were prepared by
mixing in each tube 3 μL 2X Taqman gene expression master mix (Applied Biosystems,
PN 4369016), 0.3 μL 20X DNA binding dye sample loading reagent (Fluidigm, PN 100-
0388), 0.3 μL 20X Evagreen DNA binding dye (Biotium, PN 31000) and 2.4 μL of the
pre-amplified and Exo I-treated sample. 5μl of each “assay” and “sample” tube were
loaded into their respective inlets on the left and right frames of the chip, respectively. All
“sample” reactions were carried out in triplicate. Note that a non-template control was
loaded in sample inlets number 22, 23 and 24. Next, the dynamic array was placed on the
IFC controller and software interface was used to pressure load the assay components into
reaction chambers. Assay components were automatically combined on-chip.
Subsequently, the dynamic array was transferred to a BioMark Real-Time PCR System for
thermal cycling and fluorescence detection. Amplifications were carried out at 95 ºC for 60
sec followed by 30 cycles of 96 ºC for 5 sec and 60 ºC for 20 sec on the BioMark System.
qRT-PCR analysis software was used to visualise and interact with amplification curves
performed analysis, colour-coded heat maps and Ct data for the run. Data was analysed as
for qPCR, using ABL, B2M, ENOX2 and RNF20 as housekeeping genes.
2.3 Western blotting
Briefly, proteins were isolated, fractionated on a gel based on molecular weight and
transferred to a membrane. Subsequent blotting, against antibodies specific to the proteins
of interest, allowed expression analysis.
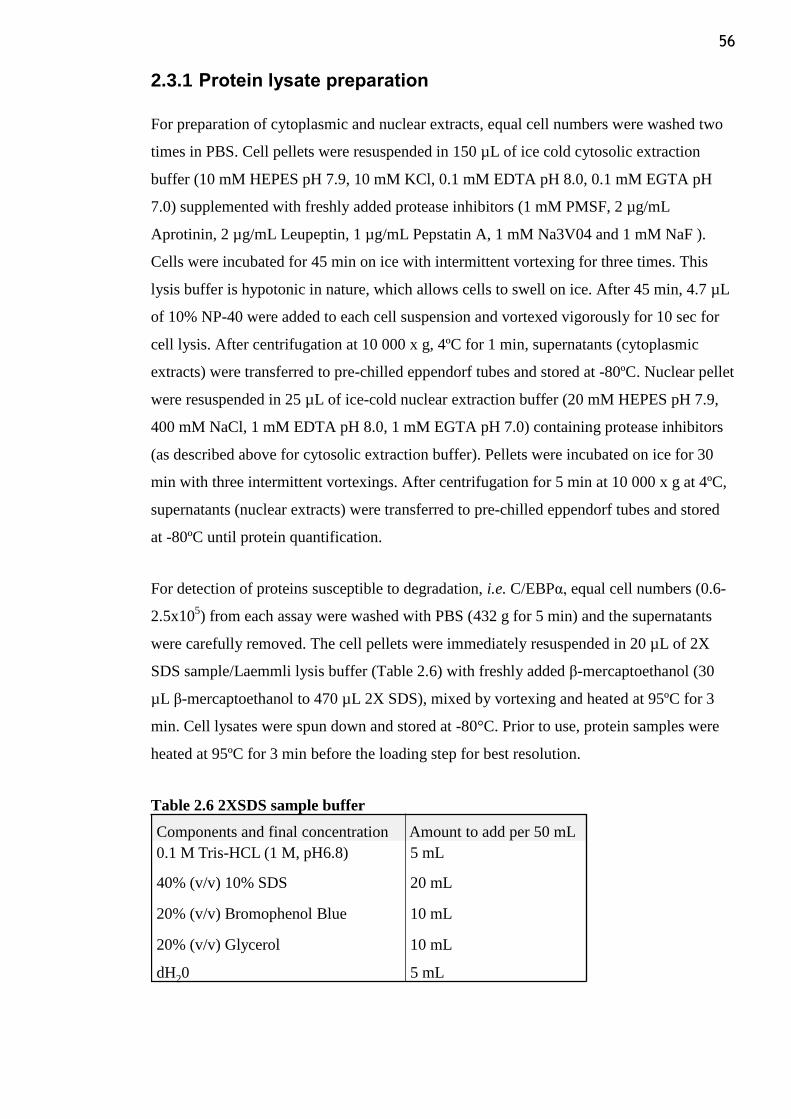
56
2.3.1 Protein lysate preparation
For preparation of cytoplasmic and nuclear extracts, equal cell numbers were washed two
times in PBS. Cell pellets were resuspended in 150 µL of ice cold cytosolic extraction
buffer (10 mM HEPES pH 7.9, 10 mM KCl, 0.1 mM EDTA pH 8.0, 0.1 mM EGTA pH
7.0) supplemented with freshly added protease inhibitors (1 mM PMSF, 2 µg/mL
Aprotinin, 2 µg/mL Leupeptin, 1 µg/mL Pepstatin A, 1 mM Na3V04 and 1 mM NaF ).
Cells were incubated for 45 min on ice with intermittent vortexing for three times. This
lysis buffer is hypotonic in nature, which allows cells to swell on ice. After 45 min, 4.7 µL
of 10% NP-40 were added to each cell suspension and vortexed vigorously for 10 sec for
cell lysis. After centrifugation at 10 000 x g, 4ºC for 1 min, supernatants (cytoplasmic
extracts) were transferred to pre-chilled eppendorf tubes and stored at -80ºC. Nuclear pellet
were resuspended in 25 µL of ice-cold nuclear extraction buffer (20 mM HEPES pH 7.9,
400 mM NaCl, 1 mM EDTA pH 8.0, 1 mM EGTA pH 7.0) containing protease inhibitors
(as described above for cytosolic extraction buffer). Pellets were incubated on ice for 30
min with three intermittent vortexings. After centrifugation for 5 min at 10 000 x g at 4ºC,
supernatants (nuclear extracts) were transferred to pre-chilled eppendorf tubes and stored
at -80ºC until protein quantification.
For detection of proteins susceptible to degradation, i.e. C/EBPα, equal cell numbers (0.6-
2.5x10⁵) from each assay were washed with PBS (432 g for 5 min) and the supernatants
were carefully removed. The cell pellets were immediately resuspended in 20 µL of 2X
SDS sample/Laemmli lysis buffer (Table 2.6) with freshly added β-mercaptoethanol (30
µL β-mercaptoethanol to 470 µL 2X SDS), mixed by vortexing and heated at 95ºC for 3
min. Cell lysates were spun down and stored at -80°C. Prior to use, protein samples were
heated at 95ºC for 3 min before the loading step for best resolution.
Table 2.6 2XSDS sample buffer
Components and final concentration Amount to add per 50 mL
0.1 M Tris-HCL (1 M, pH6.8) 5 mL
40% (v/v) 10% SDS 20 mL
20% (v/v) Bromophenol Blue 10 mL
20% (v/v) Glycerol 10 mL
dH20 5 mL
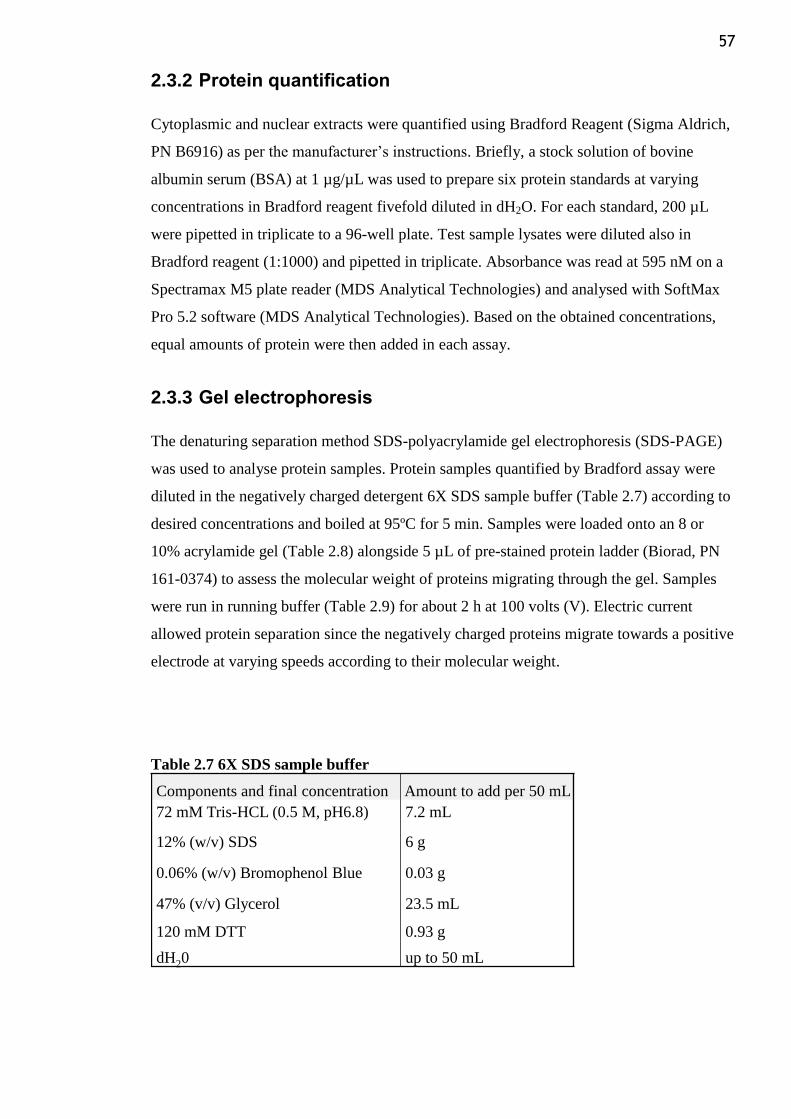
57
2.3.2 Protein quantification
Cytoplasmic and nuclear extracts were quantified using Bradford Reagent (Sigma Aldrich,
PN B6916) as per the manufacturer‟s instructions. Briefly, a stock solution of bovine
albumin serum (BSA) at 1 µg/µL was used to prepare six protein standards at varying
concentrations in Bradford reagent fivefold diluted in dH2O. For each standard, 200 µL
were pipetted in triplicate to a 96-well plate. Test sample lysates were diluted also in
Bradford reagent (1:1000) and pipetted in triplicate. Absorbance was read at 595 nM on a
Spectramax M5 plate reader (MDS Analytical Technologies) and analysed with SoftMax
Pro 5.2 software (MDS Analytical Technologies). Based on the obtained concentrations,
equal amounts of protein were then added in each assay.
2.3.3 Gel electrophoresis
The denaturing separation method SDS-polyacrylamide gel electrophoresis (SDS-PAGE)
was used to analyse protein samples. Protein samples quantified by Bradford assay were
diluted in the negatively charged detergent 6X SDS sample buffer (Table 2.7) according to
desired concentrations and boiled at 95ºC for 5 min. Samples were loaded onto an 8 or
10% acrylamide gel (Table 2.8) alongside 5 µL of pre-stained protein ladder (Biorad, PN
161-0374) to assess the molecular weight of proteins migrating through the gel. Samples
were run in running buffer (Table 2.9) for about 2 h at 100 volts (V). Electric current
allowed protein separation since the negatively charged proteins migrate towards a positive
electrode at varying speeds according to their molecular weight.
Table 2.7 6X SDS sample buffer
Components and final concentration Amount to add per 50 mL
72 mM Tris-HCL (0.5 M, pH6.8) 7.2 mL
12% (w/v) SDS 6 g
0.06% (w/v) Bromophenol Blue 0.03 g
47% (v/v) Glycerol 23.5 mL
120 mM DTT 0.93 g
dH20 up to 50 mL
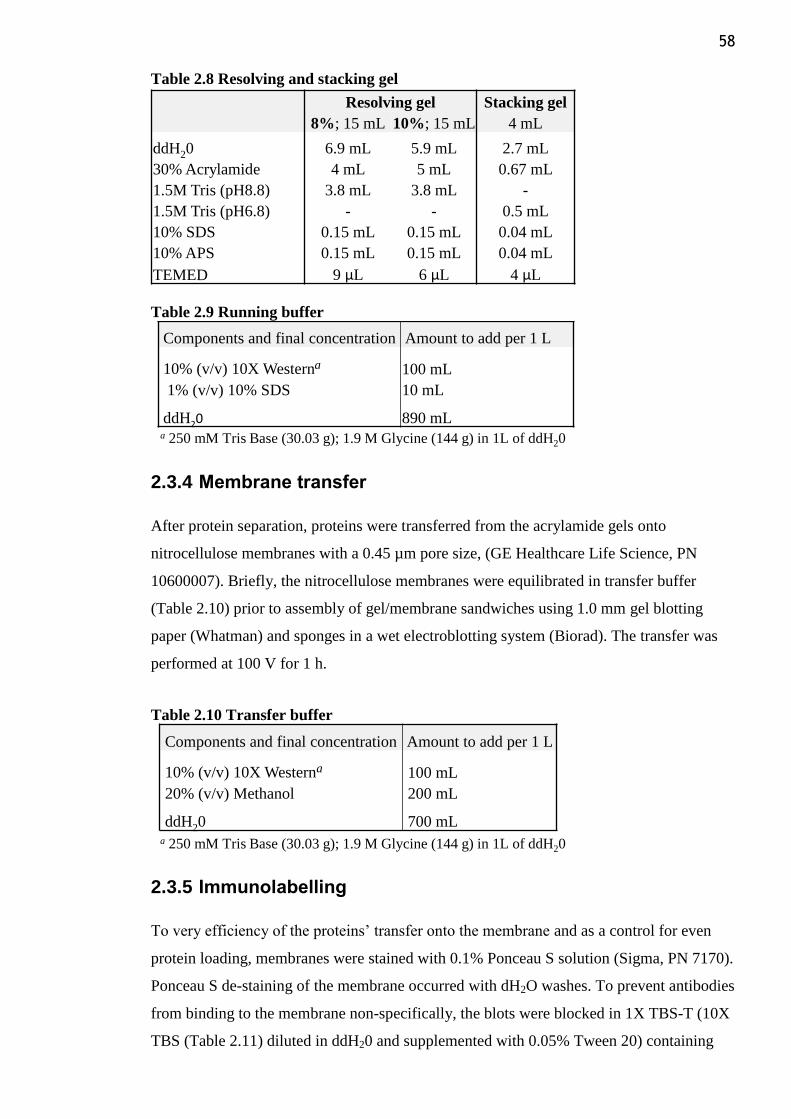
58
Table 2.8 Resolving and stacking gel
Table 2.9 Running buffer
2.3.4 Membrane transfer
After protein separation, proteins were transferred from the acrylamide gels onto
nitrocellulose membranes with a 0.45 µm pore size, (GE Healthcare Life Science, PN
10600007). Briefly, the nitrocellulose membranes were equilibrated in transfer buffer
(Table 2.10) prior to assembly of gel/membrane sandwiches using 1.0 mm gel blotting
paper (Whatman) and sponges in a wet electroblotting system (Biorad). The transfer was
performed at 100 V for 1 h.
Table 2.10 Transfer buffer
2.3.5 Immunolabelling
To very efficiency of the proteins‟ transfer onto the membrane and as a control for even
protein loading, membranes were stained with 0.1% Ponceau S solution (Sigma, PN 7170).
Ponceau S de-staining of the membrane occurred with dH2O washes. To prevent antibodies
from binding to the membrane non-specifically, the blots were blocked in 1X TBS-T (10X
TBS (Table 2.11) diluted in ddH20 and supplemented with 0.05% Tween 20) containing
Resolving gel Stacking gel
8%; 15 mL 10%; 15 mL 4 mL
ddH20 6.9 mL 5.9 mL 2.7 mL
30% Acrylamide 4 mL 5 mL 0.67 mL
1.5M Tris (pH8.8) 3.8 mL 3.8 mL -
1.5M Tris (pH6.8) - - 0.5 mL
10% SDS 0.15 mL 0.15 mL 0.04 mL
10% APS 0.15 mL 0.15 mL 0.04 mL
TEMED 9 µL 6 µL 4 µL
a 250 mM Tris Base (30.03 g); 1.9 M Glycine (144 g) in 1L of ddH20
Components and final concentration Amount to add per 1 L
10% (v/v) 10X Westerna 100 mL
1% (v/v) 10% SDS 10 mL
ddH20 890 mL
a 250 mM Tris Base (30.03 g); 1.9 M Glycine (144 g) in 1L of ddH20
Components and final concentration Amount to add per 1 L
10% (v/v) 10X Westerna 100 mL
20% (v/v) Methanol 200 mL
ddH20 700 mL
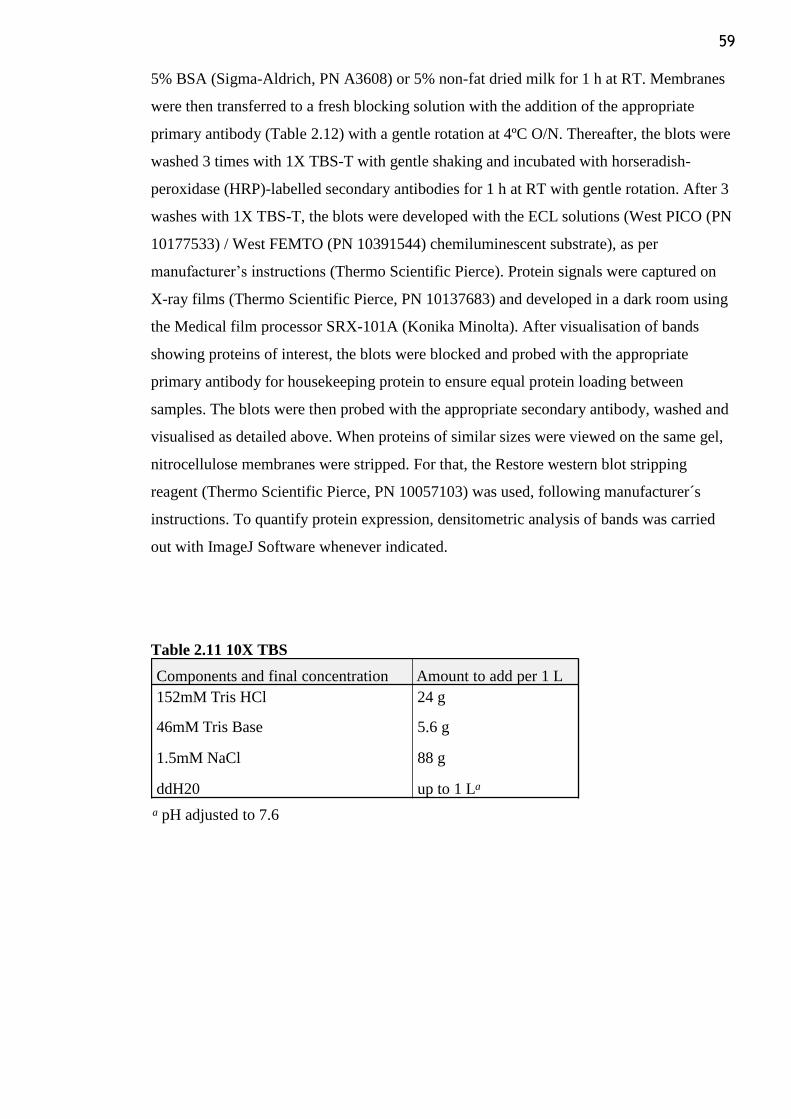
59
5% BSA (Sigma-Aldrich, PN A3608) or 5% non-fat dried milk for 1 h at RT. Membranes
were then transferred to a fresh blocking solution with the addition of the appropriate
primary antibody (Table 2.12) with a gentle rotation at 4ºC O/N. Thereafter, the blots were
washed 3 times with 1X TBS-T with gentle shaking and incubated with horseradish-
peroxidase (HRP)-labelled secondary antibodies for 1 h at RT with gentle rotation. After 3
washes with 1X TBS-T, the blots were developed with the ECL solutions (West PICO (PN
10177533) / West FEMTO (PN 10391544) chemiluminescent substrate), as per
manufacturer‟s instructions (Thermo Scientific Pierce). Protein signals were captured on
X-ray films (Thermo Scientific Pierce, PN 10137683) and developed in a dark room using
the Medical film processor SRX-101A (Konika Minolta). After visualisation of bands
showing proteins of interest, the blots were blocked and probed with the appropriate
primary antibody for housekeeping protein to ensure equal protein loading between
samples. The blots were then probed with the appropriate secondary antibody, washed and
visualised as detailed above. When proteins of similar sizes were viewed on the same gel,
nitrocellulose membranes were stripped. For that, the Restore western blot stripping
reagent (Thermo Scientific Pierce, PN 10057103) was used, following manufacturer´s
instructions. To quantify protein expression, densitometric analysis of bands was carried
out with ImageJ Software whenever indicated.
Table 2.11 10X TBS
Components and final concentration Amount to add per 1 L
152mM Tris HCl 24 g
46mM Tris Base 5.6 g
1.5mM NaCl 88 g
ddH20 up to 1 La
a pH adjusted to 7.6
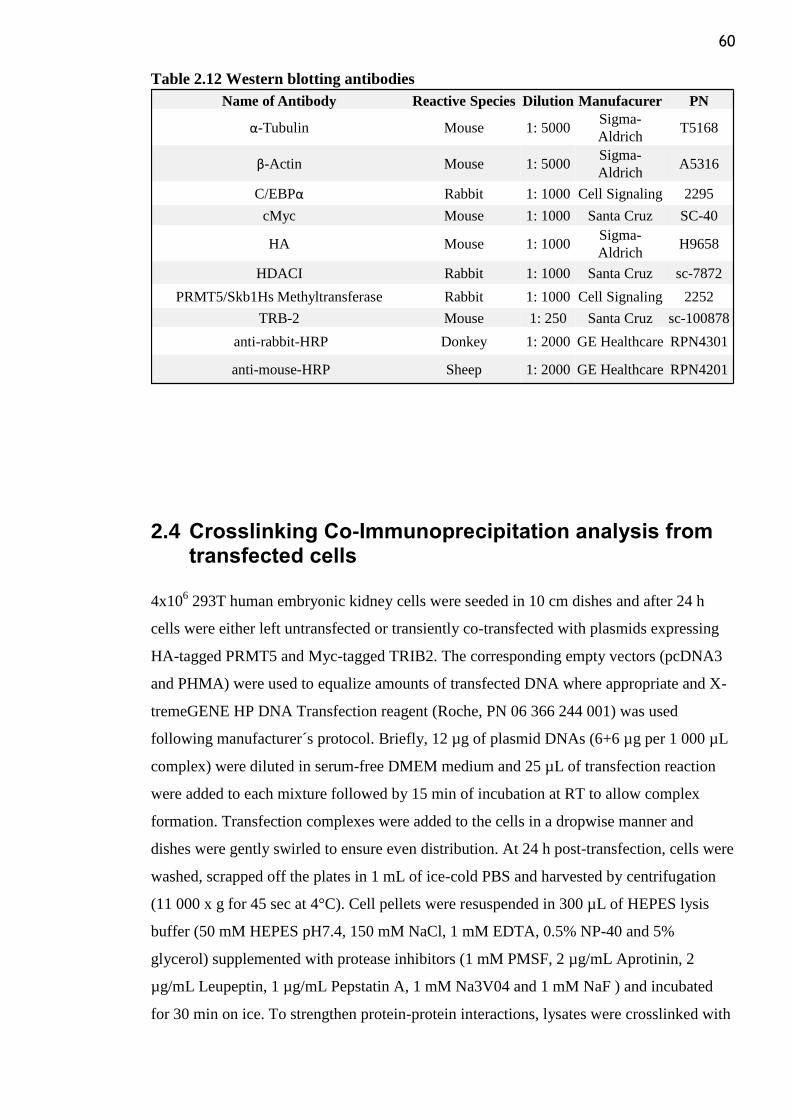
60
Table 2.12 Western blotting antibodies
2.4 Crosslinking Co-Immunoprecipitation analysis from transfected cells
4x10⁶ 293T human embryonic kidney cells were seeded in 10 cm dishes and after 24 h
cells were either left untransfected or transiently co-transfected with plasmids expressing
HA-tagged PRMT5 and Myc-tagged TRIB2. The corresponding empty vectors (pcDNA3
and PHMA) were used to equalize amounts of transfected DNA where appropriate and X-
tremeGENE HP DNA Transfection reagent (Roche, PN 06 366 244 001) was used
following manufacturer´s protocol. Briefly, 12 µg of plasmid DNAs (6+6 µg per 1 000 µL
complex) were diluted in serum-free DMEM medium and 25 µL of transfection reaction
were added to each mixture followed by 15 min of incubation at RT to allow complex
formation. Transfection complexes were added to the cells in a dropwise manner and
dishes were gently swirled to ensure even distribution. At 24 h post-transfection, cells were
washed, scrapped off the plates in 1 mL of ice-cold PBS and harvested by centrifugation
(11 000 x g for 45 sec at 4°C). Cell pellets were resuspended in 300 µL of HEPES lysis
buffer (50 mM HEPES pH7.4, 150 mM NaCl, 1 mM EDTA, 0.5% NP-40 and 5%
glycerol) supplemented with protease inhibitors (1 mM PMSF, 2 µg/mL Aprotinin, 2
µg/mL Leupeptin, 1 µg/mL Pepstatin A, 1 mM Na3V04 and 1 mM NaF ) and incubated
for 30 min on ice. To strengthen protein-protein interactions, lysates were crosslinked with
Name of Antibody Reactive Species Dilution Manufacurer PN
α-Tubulin Mouse 1: 5000Sigma-
AldrichT5168
β-Actin Mouse 1: 5000Sigma-
AldrichA5316
C/EBPα Rabbit 1: 1000 Cell Signaling 2295
cMyc Mouse 1: 1000 Santa Cruz SC-40
HA Mouse 1: 1000Sigma-
AldrichH9658
HDACI Rabbit 1: 1000 Santa Cruz sc-7872
PRMT5/Skb1Hs Methyltransferase Rabbit 1: 1000 Cell Signaling 2252
TRB-2 Mouse 1: 250 Santa Cruz sc-100878
anti-rabbit-HRP Donkey 1: 2000 GE Healthcare RPN4301
anti-mouse-HRP Sheep 1: 2000 GE Healthcare RPN4201
61
1.5 mM DSP (dithiobis (succinimidyl propionate)) prepared according to manufacturer‟s
instructions (Thermo Scientific, PN 22585). After 1 h on ice, reaction was then quenched
with 50 mM Tris pH 7.4 for 30 min on ice. Samples were spun at maximum speed for 45
sec at 4oC and cleared supernatants transferred into new tubes for protein quantification by
Bradford assay (see section 2.3.2). Aliquots containing 50 µg of protein were removed
from each sample (inputs), heated at 95°C for 5 min with 6X SDS sample buffer (Table
2.7) and kept at -20°C until loading. Co-immunoprecipitation (Co-IP) was carried out with
the remaining cell extracts. To eliminate non-specific protein binding, equal amounts of
each protein lysate (4 mg) were incubated with 20 L of immobilised protein A/G
Ultralink (DAPI) (Fisher Scientific, PN 53132) beads at 4°C for 30 min in an eppendorf
rotator. Pre-cleared supernatants were collected upon centrifugation (2 min, full speed at
4°C) and incubated with 20 L of fresh beads and either α-cMyc (1.5 g/mg of protein) or
α-HA (3 µL/sample, concentration not stated on the datasheet) antibodies (Table 2.12). To
capture the immunoprecipitated protein complexes, samples were kept at 4°C under O/N
rotation. The pelleted beads were washed three times with 1 mL of ice-cold HEPES lysis
buffer by centrifugation at maximum speed for 30 sec at 4°C. To elute the immune
complexes from the beads, 25 μL of 2X SDS sample buffer (Table 2.6) were added to each
sample followed by incubation at 95°C for 5 min. Eluates and inputs were analysed in an
8% gel by SDS-PAGE and immunoblotting (as described in section 2.3).
2.5 Animal work
2.5.1 Ethical issues
All animal work was performed in accordance with regulations set by the Animals
Scientific Procedures Act 1986 and UK Home Office regulations. Animals were housed at
the Beatson Institute for Cancer Research at the University of Glasgow. All experiments
were carried out under the author´s personal licence (PIL number I4AE3E6BE) and Dr
Karen Keeshan‟s project licence (PPL number 60/4512). Throughout all animal
experiments, mice were regularly monitored for symptoms of disease (ruffled coat,
hunched back, decreased activity and weight loss) using the project license scoring sheet.
62
2.5.2 In vivo models
2.5.2.1 Tertiary murine Trib2 transplants
Secondary AML cells from the BM of two independent MigR1-Trib2 transplanted
C57BL/6 mice –Trib2 AML#A (79% GFP+ cells) and Trib2 AML#B (74% GFP+ cells)-
were transplanted, respectively, into 4 and 3 sublethally irradiated B6.SJL mice (4.5 Gy, 4h
prior to transplantation), by tail-vein injection of 0.8x 10⁶ nucleated BM cells per recipient
(i.e. tertiary transplanted AML cells). Mice were maintained on 2.5% Baytril (Bayer,
enrofloxacin)-supplemented drinking water until 2 weeks after irradiation. The antibiotic
regimen consisting of Baytril´s active metabolite (ciprofloxacin) has been shown to
efficiently decontaminate aerobic Gram-negative and Gram-positive pathogens without
major effects on haemopoiesis (Velders et al., 2004). Mice were monitored for % of GFP
positive cells by tail-vein bleed at d28, 40, 53 and 65. Critical organs from tertiary
recipients were collected and processed as described in 2.5.2.4 at d56 and 74 after
transplantation, following detection of GFP + cells ≥10% in the PB. This value was used as
a proxy for marked BM infiltration of leukaemic cells, as assessed by a secondary
transplant not shown for the sake of redundancy.
2.5.2.2 Xenotransplantation of U937 AML cells
U937 cells were transduced with shCtrl or shTRIB2 lentivirus and selected 24 h after with
2 µg/mL puromycin (Sigma-Aldrich, PN P7255, 10 mg/mL stock) for 2 days. Transduced
cells were harvested and washed, viable cells were counted using trypan blue exclusion
and % of GFP positive cells was analyzed by FACS analysis on the day of transplant. Non-
irradiated 12 to 18 week-old male non-obese diabetic (NOD)/LtSz-severe combined
immune-deficiency (SCID) IL-2Rγcnull
(NSG) mice were used in the in vivo study. A
standardized number of 1.2x10⁶ cells with equally high expression of GFP (~67%) was
injected via tail vein in the xenograft study of shCtrl (n=5) and shTRIB2 (n=8) transplant.
PB was collected by tail vein bleeding of mice at day 5 and 11. Mice were killed at day 16
after transplantation and critical organs were collected and processed as described in
section 2.5.2.4. To assess human cell engraftment, cells were labelled with anti-human
CD45 antibody conjugated with PE-Cy7 (Table 2.12, Figure 2.2A) and antibody
expression was quantified alongside with % of GFP positive cells by flow cytometry. As a
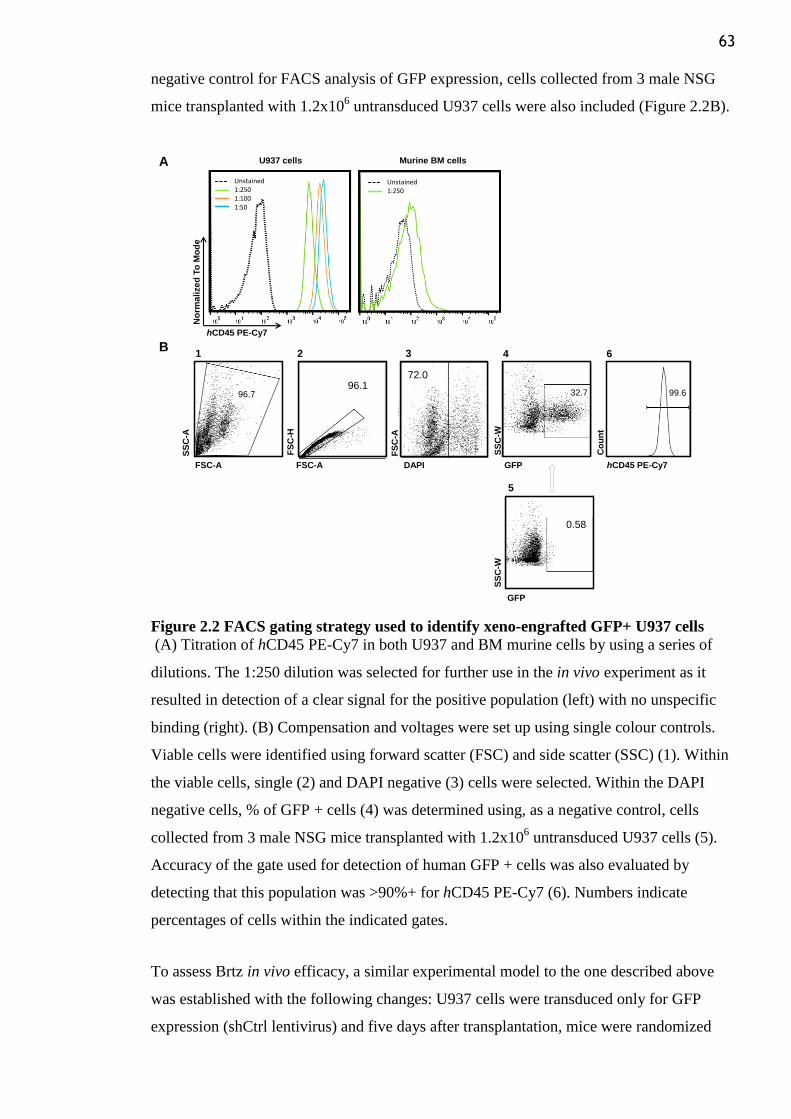
63
negative control for FACS analysis of GFP expression, cells collected from 3 male NSG
mice transplanted with 1.2x10⁶ untransduced U937 cells were also included (Figure 2.2B).
Figure 2.2 FACS gating strategy used to identify xeno-engrafted GFP+ U937 cells
(A) Titration of hCD45 PE-Cy7 in both U937 and BM murine cells by using a series of
dilutions. The 1:250 dilution was selected for further use in the in vivo experiment as it
resulted in detection of a clear signal for the positive population (left) with no unspecific
binding (right). (B) Compensation and voltages were set up using single colour controls.
Viable cells were identified using forward scatter (FSC) and side scatter (SSC) (1). Within
the viable cells, single (2) and DAPI negative (3) cells were selected. Within the DAPI
negative cells, % of GFP + cells (4) was determined using, as a negative control, cells
collected from 3 male NSG mice transplanted with 1.2x10⁶ untransduced U937 cells (5).
Accuracy of the gate used for detection of human GFP + cells was also evaluated by
detecting that this population was >90%+ for hCD45 PE-Cy7 (6). Numbers indicate
percentages of cells within the indicated gates.
To assess Brtz in vivo efficacy, a similar experimental model to the one described above
was established with the following changes: U937 cells were transduced only for GFP
expression (shCtrl lentivirus) and five days after transplantation, mice were randomized
B
GFP
SS
C-W
1 2 3 4 6
5
96.196.7
72.0
32.7 99.6
0.58
FSC-A
SS
C-A
FSC-A
FS
C-H
DAPI
FS
C-A
GFP
SS
C-W
hCD45 PE-Cy7
Co
un
t
No
rma
lize
d T
o M
od
e
hCD45 PE-Cy7
U937 cells Murine BM cells
Unstained1:2501:1001:50
Unstained1:250
A
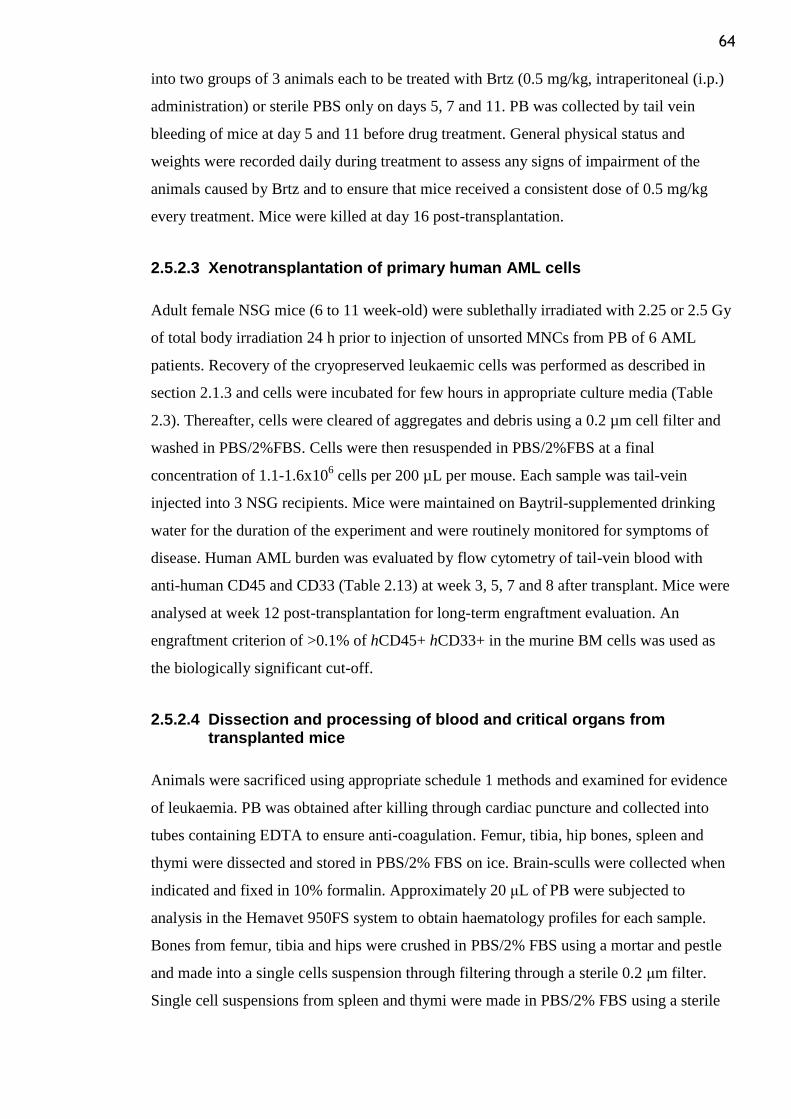
64
into two groups of 3 animals each to be treated with Brtz (0.5 mg/kg, intraperitoneal (i.p.)
administration) or sterile PBS only on days 5, 7 and 11. PB was collected by tail vein
bleeding of mice at day 5 and 11 before drug treatment. General physical status and
weights were recorded daily during treatment to assess any signs of impairment of the
animals caused by Brtz and to ensure that mice received a consistent dose of 0.5 mg/kg
every treatment. Mice were killed at day 16 post-transplantation.
2.5.2.3 Xenotransplantation of primary human AML cells
Adult female NSG mice (6 to 11 week-old) were sublethally irradiated with 2.25 or 2.5 Gy
of total body irradiation 24 h prior to injection of unsorted MNCs from PB of 6 AML
patients. Recovery of the cryopreserved leukaemic cells was performed as described in
section 2.1.3 and cells were incubated for few hours in appropriate culture media (Table
2.3). Thereafter, cells were cleared of aggregates and debris using a 0.2 µm cell filter and
washed in PBS/2%FBS. Cells were then resuspended in PBS/2%FBS at a final
concentration of 1.1-1.6x10⁶ cells per 200 µL per mouse. Each sample was tail-vein
injected into 3 NSG recipients. Mice were maintained on Baytril-supplemented drinking
water for the duration of the experiment and were routinely monitored for symptoms of
disease. Human AML burden was evaluated by flow cytometry of tail-vein blood with
anti-human CD45 and CD33 (Table 2.13) at week 3, 5, 7 and 8 after transplant. Mice were
analysed at week 12 post-transplantation for long-term engraftment evaluation. An
engraftment criterion of >0.1% of hCD45+ hCD33+ in the murine BM cells was used as
the biologically significant cut-off.
2.5.2.4 Dissection and processing of blood and critical organs from transplanted mice
Animals were sacrificed using appropriate schedule 1 methods and examined for evidence
of leukaemia. PB was obtained after killing through cardiac puncture and collected into
tubes containing EDTA to ensure anti-coagulation. Femur, tibia, hip bones, spleen and
thymi were dissected and stored in PBS/2% FBS on ice. Brain-sculls were collected when
indicated and fixed in 10% formalin. Approximately 20 μL of PB were subjected to
analysis in the Hemavet 950FS system to obtain haematology profiles for each sample.
Bones from femur, tibia and hips were crushed in PBS/2% FBS using a mortar and pestle
and made into a single cells suspension through filtering through a sterile 0.2 μm filter.
Single cell suspensions from spleen and thymi were made in PBS/2% FBS using a sterile
65
plunger and filtered. In all tissues red blood cells (RBC) were lysed in RBC lysis buffer
(155 mM NH4Cl, 10 mM KHCO3, 0.1 mM EDTA).
2.6 Preparation of metaphase murine Trib2 AML cells for karyotyping
Total BM derived AML cells collected from two Trib2-leukaemic tertiary recipient mice
were prepared for metaphase stage arrest. 1 mL of cell suspension (~2x10⁶ cells) from each
mouse was treated with 10 µL of demecolcine (Sigma-Aldrish, PN 477-30-5) to increase
the yield of mitotic cells in metaphase. Cell suspensions were retrieved to the incubator for
45 min. Cells were then transferred to 15 mL falcon tubes and spun down at 200 g for 10
min. Tubes were flicked to loosen the pellet and 10 mL of pre-warmed 0.075M KCl
hypotonic solution were added. Cells were vortexed at medium speed and incubated at
37ºC for 15 min. Cells were then centrifuged at 200 x g for 10 min and supernatant
discarded. Pellets were disrupted by flicking the tube in remaining drops of the liquid and 5
mL of freshly prepared methanol:acetic acid (3:1) fixative solution were added dropwise
while vortexing. Extra 5 mL of fixative solution were added. Cells were centrifuged at 200
x g for 10 min and supernatant discarded (leaving about 0.5mL). This step was repeated
one extra time. Cells were resuspended in a small volume of fixative solution (~0.3 mL)
and transferred to a 1.5 mL tube. To confirm the presence of metaphase cells, 5 µL of cell
suspension were dropped on a slide. After waiting a few seconds for the slide to dry, DAPI
(4´, 6´-diamidino-2-phenylindole) was added for fluorescence microscopy analysis. The
slide was examined under oil immersion at 100X magnification using a UV light source.
Extra fixative solution (~1 mL) was added to the preparation, the tubes were sealed with
parafilm and stored at –20ºC until being sent for cytogenetic analysis at Cytocell Ltd
(Cambridge).
2.7 Flow cytometry
2.7.1 Assessment of surface antigen expression
Cells were harvested and washed in PBS. Cell pellets were then resuspended in 50 µL of
PBS containing the appropriate fluorochrome- conjugated antibody (Table 2.13 and
indicated in the related Figure legend). Cells were incubated for 30 min at 4ºC protected
from light. Cells were washed again in PBS and resuspended in 200 µL of PBS prior to
FACS analysis. FACS analysis was performed using a BD FACSCantoTM
II flow
cytometer and acquired data was analysed using FlowJo software (Treestar, v10).
66
Table 2.13 FACS antibodies
2.7.2 Cell growth analysis
To monitor growth of transduced U937 cells, the cells were seeded at 0.15x10⁶/mL after 24
h transduction (GFP+ cells) or 48 h puromycin selection, as indicated in the related Figure
legend. Viable cells were counted by trypan blue exclusion at the indicated time points.
After 48 h counting, cells were split again at 0.15x10⁶/mL. For GFP+ cells, GFP % was
assessed by FACS analysis at each time point and final results are normalized to the
corresponding GFP expression.
2.7.3 Annexin V / DAPI staining
To analyse cells undergoing apoptosis, cells were harvested, washed once in PBS and
resuspended in 100 μL of 1X Hanks‟ Balanced Salt solution (HBSS, Sigma-Aldrich)
containing 1 µL of Annexin V-PE (BD Biosciences, PN 556422) per test. HBSS was used
to ensure the physiological concentration of calcium required for Annexin V to bind to
phosphatidylserine, which is translocated to the extracellular membrane of apoptotic cells.
Cells were incubated for 15 min at RT protected from light. To stop the reaction, 400 μL of
Name of Antibody Reactive Species Clone Format Manufacturer Dilution
CD33 human WM53 APC Biolegend 1: 250
CD45 human HI30 PE Cy7 Biolegend 1: 250
CD11b mouse M1/70 APC eBioscience 1: 250
CD11b mouse M1/70 PE eBioscience 1: 250
Gr-1 mouse RB6-8C5 APC eBioscience 1: 250
Gr-1 mouse RB6-8C5 PE eBioscience 1: 250
Gr-1 mouse RB6-8C5 PE Cy7 eBioscience 1: 250
B220 mouse RA3-6B2 Biotin eBioscience 0.5 µL per 1x10⁷cells
CD3 mouse 17A2 Biotin eBioscience 0.5 µL per 1x10⁷cells
CD8a mouse 53-6.7 Biotin eBioscience 0.5 µL per 1x10⁷cells
CD11b mouse M1/70 Biotin eBioscience 0.5 µL per 1x10⁷cells
CD4 mouse GK1.5 Biotin eBioscience 0.5 µL per 1x10⁷cells
Gr-1 mouse RB6-8C5 Biotin eBioscience 0.5 µL per 1x10⁷cells
Ter119 mouse Ter-119 Biotin eBioscience 0.5 µL per 1x10⁷cells
c-Kit mouse 2B8 APC Cy7 Biolegend 1: 100
Sca-1 mouse D7 PE Cy7 eBioscience 1: 100
Streptavidin - - V450 BD 1: 100
67
1X HBSS were added to each sample and cells were analysed on a BD FACSCantoTM
II
flow cytometer within no more than 30 min post-staining. For combined analysis of
apoptosis and necrosis, 1 µL of the nucleic acid stain DAPI (Sigma-Aldrich, PN 9542,
stock at 1 mg/mL) was included in the 100 µL HBSS/Annexin V mixture. For single
staining with DAPI, the nucleic acid stain was diluted in PBS and added to each sample (1
µg/mL) just prior to FACS analysis. Control tubes containing unstained cells, Annexin V
or DAPI single-stained cells were recorded to set FSC/SSC voltages and compensation.
For data analysis, the FlowJo software (Treestar, v10) was used.
2.7.4 Cell cycle analysis using Propidium Iodine (PI) staining
Cells were harvested upon centrifugation at 432 x g for 5 min at RT and washed in PBS.
Pelleted cells were fixed by adding 1 mL of ice-cold 70% (v/v) ethanol while vortexing,
and stored at -20°C O/N. Before FACS analysis, cells were spun for ethanol removal
followed by one washing with PBS and resuspended in DNA staining solution (PI/RNase
Staining Buffer, BD Pharmingen, PN 550825) for 15 min at RT in the dark. Fluorescence
labelling of the cellular DNA content was used as a measure of cell cycle progression and
was acquired by BD FACSCantoTM
II flow cytometer. When stated, cell cycle profile was
also used to estimate apoptosis (% of cells in Sub-G1 phase). Analysis was performed
using FlowJo software (Treestar, v10).
2.7.5 GFP+ cells sorting
For selection of GFP+ cells, cells were harvested, resuspended in approximately 300 µL of
PBS/2% FBS and passed through a sterile 70 µm cell strainer prior to sorting. Sorting was
performed by Jennifer Cassels using FACSDiva (BD Biosciences, v6.1.2) flow cytometer,
as depicted in Figure 2.3.
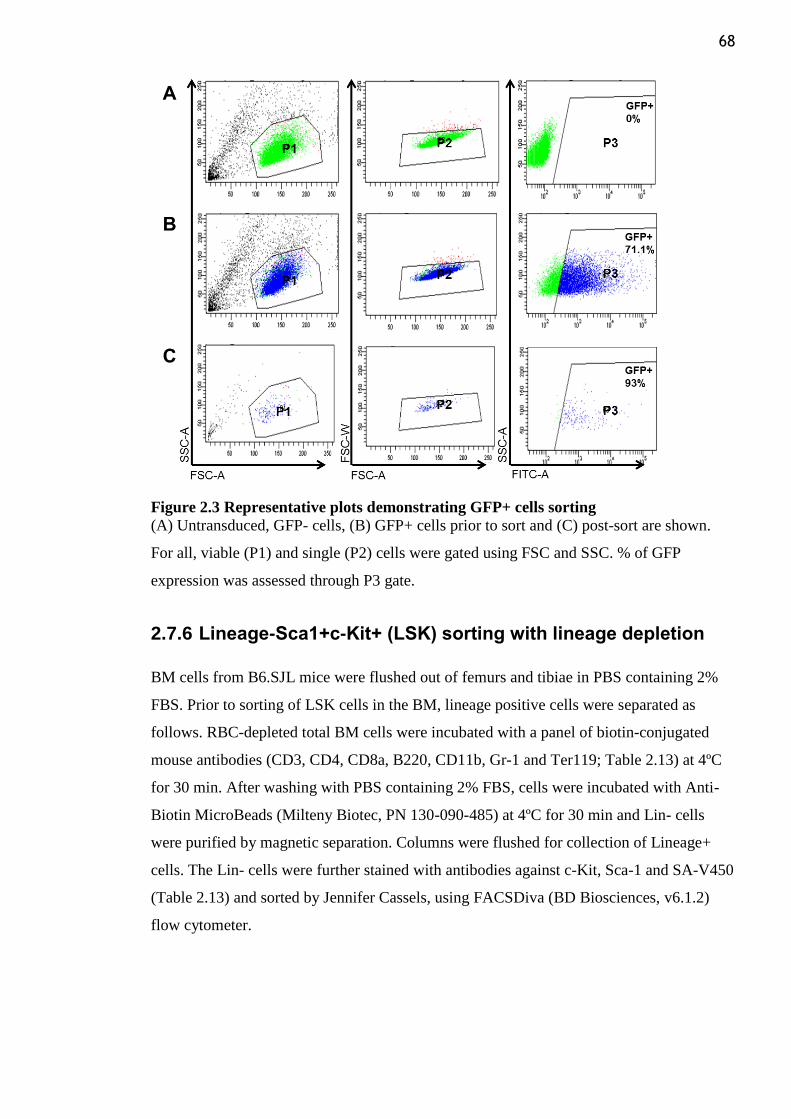
68
Figure 2.3 Representative plots demonstrating GFP+ cells sorting
(A) Untransduced, GFP- cells, (B) GFP+ cells prior to sort and (C) post-sort are shown.
For all, viable (P1) and single (P2) cells were gated using FSC and SSC. % of GFP
expression was assessed through P3 gate.
2.7.6 Lineage-Sca1+c-Kit+ (LSK) sorting with lineage depletion
BM cells from B6.SJL mice were flushed out of femurs and tibiae in PBS containing 2%
FBS. Prior to sorting of LSK cells in the BM, lineage positive cells were separated as
follows. RBC-depleted total BM cells were incubated with a panel of biotin-conjugated
mouse antibodies (CD3, CD4, CD8a, B220, CD11b, Gr-1 and Ter119; Table 2.13) at 4ºC
for 30 min. After washing with PBS containing 2% FBS, cells were incubated with Anti-
Biotin MicroBeads (Milteny Biotec, PN 130-090-485) at 4ºC for 30 min and Lin- cells
were purified by magnetic separation. Columns were flushed for collection of Lineage+
cells. The Lin- cells were further stained with antibodies against c-Kit, Sca-1 and SA-V450
(Table 2.13) and sorted by Jennifer Cassels, using FACSDiva (BD Biosciences, v6.1.2)
flow cytometer.

69
2.8 Statistics
Statistical analyses and graphing were performed either with the Microsoft Office Excel
software or the GraphPad Prism Software (v5.03) using the unpaired, two-tailed Student‟s
t-test. When the Leukemia Gene Atlas (LGA) platform was used as a data analysis tool, the
Welch‟s t-test was selected. *** for P ≤0.001, ** for P ≤0.01 and * for P ≤0.05 were
considered statistically significant and were indicated in the related Figure legends and
graphs. Where n.s. is indicated, the P value is not significant. The results are shown as
mean ± standard deviation (SD).
70
Chapter 3 Characterization of TRIB2 tumorigenic role in
human AML
When indicated, results presented in this chapter have been published in (Rishi et al., 2014,
Salome et al., 2015) and the PDFs of the publications are provided in Appendix E and F.
71
3.1 Introduction
TRIB2 is a pseudokinase that functions as a molecular adaptor mediating degradation and
changes in signaling cascades as reviewed elsewhere (Lohan and Keeshan, 2013). There is
accumulating evidence supporting its tumorigenic activity in a variety of malignancies, i.e.
melanoma (Zanella et al., 2010), lung (Zhang et al., 2012, Grandinetti et al., 2011) and
liver cancer (Wang et al., 2013a), as well as T-ALL (Sanda et al., 2012) (see Chapter 1,
section 1.3.3). Significant for the current study, Keeshan et al. observed that murine BM
cells retrovirally expressing this gene exhibit a growth advantage ex vivo and readily
establish factor-dependent cell lines. In vivo, Trib2-reconstituted mice rapidly develop
AML with a mean latency of 179 days and complete penetrance through a mechanism
involving proteasomal-dependent degradation of C/EBPα p42, which is central to the
induction of granulocytic development (Keeshan et al., 2006). Moreover, mice
reconstituted with HSCs co-transduced with Trib2 and HoxA9 have an accelerated onset of
AML when compared to either gene alone, indicating that these genes may co-operate to
induce leukaemia (Keeshan et al., 2008). The AML oncogene Meis1 may also promote
Trib2 expression, which potentially complements the ability of NUP98-HOXD13 to induce
AML, as shown in another murine BMT model (Argiropoulos et al., 2008). The Trib2 role
as a myeloid oncogene is thus supported by strong experimental data provided by murine
models. In human leukaemic cells, its oncogenic potential has been highlighted by gene
expression profiling studies. Valk et al. analysed 285 patients with de novo AML that was
characterized by cytogenetic and molecular analyses. They used gene-expression profiling
to comprehensively classify the disorder and identified sixteen distinct groups of patients
on the basis of unsupervised cluster analysis (i.e., without taking into account external
information) and strong similarities in molecular signatures (Valk et al., 2004). The same
microarray profiling was subsequently examined to investigate TRIB2 mRNA expression
in human AML patient samples. Based on signals from two different probe sets targeting
this gene, Keeshan et al. found that TRIB2 transcript levels were enhanced in cluster #4
when compared to other subsets. While cluster #4 is one of the two distinct expression
subsets harboring most patients with CEBPA mutations, TRIB2 was primarily elevated in
tumors that did not carry mutations in the myeloid transcription factor CEBPA. This was
suggestive of disruption of normal C/EBPα function by other mechanisms, explaining why
these AMLs shared a CEBPA mutant gene expression signature, while lacking such
mutations (Keeshan et al., 2006). Cluster #4 leukaemias lacking CEBPA mutations were
further defined as a specific subgroup of AML. They were associated with CEBPA
silencing, which was linked to frequent promoter CpG hypermethylation (4/6 patient
72
samples analysed). Comparison of silenced leukaemias to CEBPA mutant cases in cluster
#4 also revealed that genes significantly overexpressed in the first group were related to T-
cells and T-lymphoid development (e.g., CD7). Moreover, CEBPA silenced leukaemias
share an immature myeloid/lymphoid phenotype, as determined by simultaneously
expression of surface markers CD34, CD13, CD7 and terminal
deoxynucleotidyltransferase (TdT). These TRIB2-expressing AMLs lacking CEBPA
mutations were further associated with aberrant activation of NOTCH1 by mutations.
Indeed, TRIB2 was identified as a direct transcriptional target of NOTCH1 (Wouters et al.,
2007).
Altogether, leukaemic murine models and gene expression analyses of human AML
cohorts link TRIB2 to tumors with altered C/EBPα function and suggest that elevated
TRIB2 may have a pathogenic role in a subset of human AML. Therefore, this chapter
aims to further understand the precise role of TRIB2 in the human leukaemic setting by
means of functional analysis that are still lacking.
3.2 Aims and Objectives
The present study hypothesises that TRIB2 will be required for the oncogenic properties of
human AML cells. To address this, the specific aims of this chapter were:
i. To investigate how TRIB2 is altered at the genomic level across a panel of human
tumours;
ii To establish a murine Trib2-AML model as a source of leukaemic cells for further
characterization of TRIB2-driven AML
ii. To perform a phenotypic characterization of the role of TRIB2 in human AML
cells, both in vitro and in vivo; assessing its putative contribution to AML cells survival
iii To investigate the clinical relevance of TRIB2 by means of a transcriptional
analysis in AML patient samples;
iv To investigate whether increased expression of TRIB2 in AML patient samples
correlates with the ability of these cells to engraft in the BM of NSG mice.
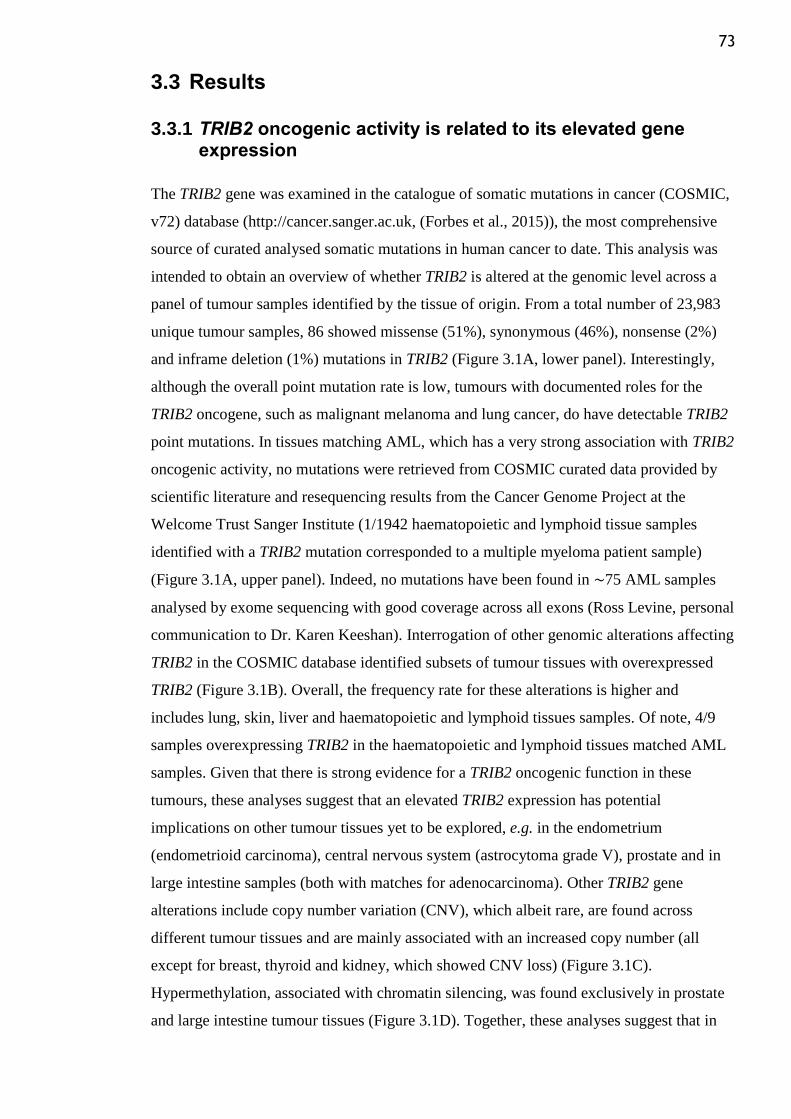
73
3.3 Results
3.3.1 TRIB2 oncogenic activity is related to its elevated gene expression
The TRIB2 gene was examined in the catalogue of somatic mutations in cancer (COSMIC,
v72) database (http://cancer.sanger.ac.uk, (Forbes et al., 2015)), the most comprehensive
source of curated analysed somatic mutations in human cancer to date. This analysis was
intended to obtain an overview of whether TRIB2 is altered at the genomic level across a
panel of tumour samples identified by the tissue of origin. From a total number of 23,983
unique tumour samples, 86 showed missense (51%), synonymous (46%), nonsense (2%)
and inframe deletion (1%) mutations in TRIB2 (Figure 3.1A, lower panel). Interestingly,
although the overall point mutation rate is low, tumours with documented roles for the
TRIB2 oncogene, such as malignant melanoma and lung cancer, do have detectable TRIB2
point mutations. In tissues matching AML, which has a very strong association with TRIB2
oncogenic activity, no mutations were retrieved from COSMIC curated data provided by
scientific literature and resequencing results from the Cancer Genome Project at the
Welcome Trust Sanger Institute (1/1942 haematopoietic and lymphoid tissue samples
identified with a TRIB2 mutation corresponded to a multiple myeloma patient sample)
(Figure 3.1A, upper panel). Indeed, no mutations have been found in ∼75 AML samples
analysed by exome sequencing with good coverage across all exons (Ross Levine, personal
communication to Dr. Karen Keeshan). Interrogation of other genomic alterations affecting
TRIB2 in the COSMIC database identified subsets of tumour tissues with overexpressed
TRIB2 (Figure 3.1B). Overall, the frequency rate for these alterations is higher and
includes lung, skin, liver and haematopoietic and lymphoid tissues samples. Of note, 4/9
samples overexpressing TRIB2 in the haematopoietic and lymphoid tissues matched AML
samples. Given that there is strong evidence for a TRIB2 oncogenic function in these
tumours, these analyses suggest that an elevated TRIB2 expression has potential
implications on other tumour tissues yet to be explored, e.g. in the endometrium
(endometrioid carcinoma), central nervous system (astrocytoma grade V), prostate and in
large intestine samples (both with matches for adenocarcinoma). Other TRIB2 gene
alterations include copy number variation (CNV), which albeit rare, are found across
different tumour tissues and are mainly associated with an increased copy number (all
except for breast, thyroid and kidney, which showed CNV loss) (Figure 3.1C).
Hypermethylation, associated with chromatin silencing, was found exclusively in prostate
and large intestine tumour tissues (Figure 3.1D). Together, these analyses suggest that in
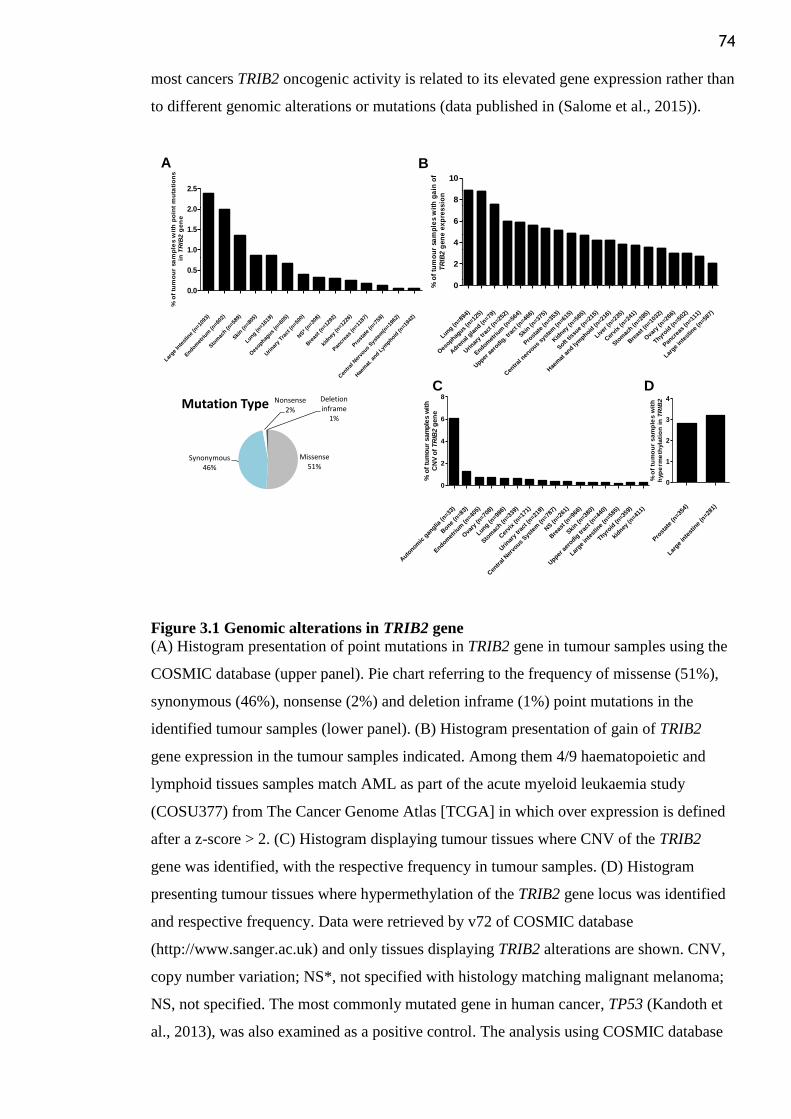
74
most cancers TRIB2 oncogenic activity is related to its elevated gene expression rather than
to different genomic alterations or mutations (data published in (Salome et al., 2015)).
Figure 3.1 Genomic alterations in TRIB2 gene
(A) Histogram presentation of point mutations in TRIB2 gene in tumour samples using the
COSMIC database (upper panel). Pie chart referring to the frequency of missense (51%),
synonymous (46%), nonsense (2%) and deletion inframe (1%) point mutations in the
identified tumour samples (lower panel). (B) Histogram presentation of gain of TRIB2
gene expression in the tumour samples indicated. Among them 4/9 haematopoietic and
lymphoid tissues samples match AML as part of the acute myeloid leukaemia study
(COSU377) from The Cancer Genome Atlas [TCGA] in which over expression is defined
after a z-score > 2. (C) Histogram displaying tumour tissues where CNV of the TRIB2
gene was identified, with the respective frequency in tumour samples. (D) Histogram
presenting tumour tissues where hypermethylation of the TRIB2 gene locus was identified
and respective frequency. Data were retrieved by v72 of COSMIC database
(http://www.sanger.ac.uk) and only tissues displaying TRIB2 alterations are shown. CNV,
copy number variation; NS*, not specified with histology matching malignant melanoma;
NS, not specified. The most commonly mutated gene in human cancer, TP53 (Kandoth et
al., 2013), was also examined as a positive control. The analysis using COSMIC database
A B
Large
Inte
stin
e (n
=109
3)
Endom
etrium
(n=6
02)
Sto
mac
h (n=5
89)
Ski
n (n=8
05)
Lung (n=1
619)
Oes
ophagus
(n=6
05)
Urinar
y Tra
ct (n
=500
)
NS* (n
=308
)
Bre
ast (
n=129
2)
kidney
(n=1
226)
Pan
crea
s (n
=118
7)
Pro
stat
e (n
=758
)
Cen
tral
Ner
vous
Sys
tem
(n=1
962)
Hae
mat
. and L
ymphoid
(n=1
942)
0.0
0.5
1.0
1.5
2.0
2.5
% o
f tu
mo
ur
sa
mp
les w
ith
po
int
mu
tati
on
s
in
TR
IB2
ge
ne
Lung (n=8
94)
Oes
ophagus
(n=12
5)
Adre
nal g
land (n
=79)
Urin
ary
trac
t (n=25
2)
Endomet
rium
(n=56
4)
Upper
aer
odig. t
ract
(n=4
66)
Skin (n
=375)
Prost
ate
(n=3
53)
Cen
tral
ner
vous
syst
em (n
=615
)
Kid
ney (n
=585
)
Soft tis
sue
(n=21
5)
Hae
mat
and ly
mphoid
(n=21
6)
Liver
(n=23
5)
Cer
vix
(n=24
1)
Stom
ach (n
=285)
Bre
ast (
n=1032
)
Ova
ry (n
=266
)
Thyroid
(n=5
02)
Pancr
eas
(n=11
1)
Large
inte
stin
e (n
=587)
0
2
4
6
8
10
% o
f tu
mo
ur
sam
ple
s w
ith
ga
in o
f
TR
IB2
ge
ne
ex
pre
ss
ion
C D
Missense51%
Synonymous46%
Nonsense2%
Deletion inframe
1%
Mutation Type
Auto
nomic
gan
glia (n
=33)
Bone
(n=8
3)
Endomet
rium
(n=4
05)
Ova
ry (n
=708
)
Lung (n=9
86)
Stom
ach (n
=339
)
Cer
vix
(n=1
71)
Urinar
y trac
t (n=2
19)
Cen
tral
Ner
vous
Sys
tem
(n=7
87)
NS (n
=261
)
Bre
ast (
n=966
)
Skin (n
=380
)
Upper
aer
odig tr
act (
n=440
)
Large
inte
stin
e (n
=585
)
Thyroid
(n=3
59)
kidney
(n=4
11)
0
2
4
6
8
% o
f tu
mo
ur
sam
ple
s w
ith
CN
V o
fT
RIB
2 g
en
e
Pro
stat
e (n
=354
)
Large
inte
stin
e (n
=281
)
0
1
2
3
4
% o
f tu
mo
ur
sa
mp
les
wit
h
hyp
erm
eth
yla
tio
n i
nT
RIB
2
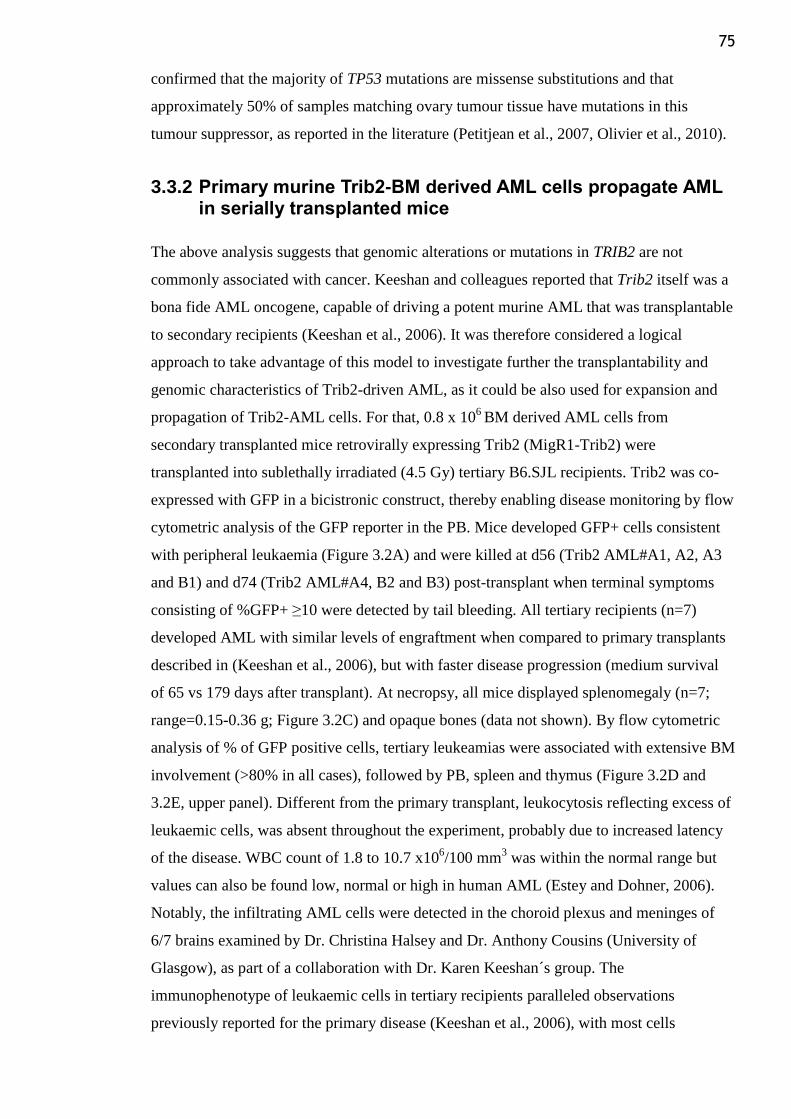
75
confirmed that the majority of TP53 mutations are missense substitutions and that
approximately 50% of samples matching ovary tumour tissue have mutations in this
tumour suppressor, as reported in the literature (Petitjean et al., 2007, Olivier et al., 2010).
3.3.2 Primary murine Trib2-BM derived AML cells propagate AML in serially transplanted mice
The above analysis suggests that genomic alterations or mutations in TRIB2 are not
commonly associated with cancer. Keeshan and colleagues reported that Trib2 itself was a
bona fide AML oncogene, capable of driving a potent murine AML that was transplantable
to secondary recipients (Keeshan et al., 2006). It was therefore considered a logical
approach to take advantage of this model to investigate further the transplantability and
genomic characteristics of Trib2-driven AML, as it could be also used for expansion and
propagation of Trib2-AML cells. For that, 0.8 x 10⁶
BM derived AML cells from
secondary transplanted mice retrovirally expressing Trib2 (MigR1-Trib2) were
transplanted into sublethally irradiated (4.5 Gy) tertiary B6.SJL recipients. Trib2 was co-
expressed with GFP in a bicistronic construct, thereby enabling disease monitoring by flow
cytometric analysis of the GFP reporter in the PB. Mice developed GFP+ cells consistent
with peripheral leukaemia (Figure 3.2A) and were killed at d56 (Trib2 AML#A1, A2, A3
and B1) and d74 (Trib2 AML#A4, B2 and B3) post-transplant when terminal symptoms
consisting of %GFP+ ≥10 were detected by tail bleeding. All tertiary recipients (n=7)
developed AML with similar levels of engraftment when compared to primary transplants
described in (Keeshan et al., 2006), but with faster disease progression (medium survival
of 65 vs 179 days after transplant). At necropsy, all mice displayed splenomegaly (n=7;
range=0.15-0.36 g; Figure 3.2C) and opaque bones (data not shown). By flow cytometric
analysis of % of GFP positive cells, tertiary leukeamias were associated with extensive BM
involvement (>80% in all cases), followed by PB, spleen and thymus (Figure 3.2D and
3.2E, upper panel). Different from the primary transplant, leukocytosis reflecting excess of
leukaemic cells, was absent throughout the experiment, probably due to increased latency
of the disease. WBC count of 1.8 to 10.7 x10⁶/100 mm
3 was within the normal range but
values can also be found low, normal or high in human AML (Estey and Dohner, 2006).
Notably, the infiltrating AML cells were detected in the choroid plexus and meninges of
6/7 brains examined by Dr. Christina Halsey and Dr. Anthony Cousins (University of
Glasgow), as part of a collaboration with Dr. Karen Keeshan´s group. The
immunophenotype of leukaemic cells in tertiary recipients paralleled observations
previously reported for the primary disease (Keeshan et al., 2006), with most cells

76
retaining intermediate expression of Gr-1 and CD11b in the GFP+ population (Figure
3.2E, lower panel) – a characteristic of immature myeloid precursors and murine myeloid
leukaemias (de Guzman et al., 2002, Cozzio et al., 2003). In addition to % of GFP positive
cells, the leukaemic BM cells expressed the expected oncogene, as confirmed by mRNA
detection of higher Trib2 transcript levels (Figure 3.2B). Together, these data extend the
previous study reporting Trib2 as a potent murine myeloid oncogene (Keeshan et al., 2006)
by indicating central nervous system (CNS) involvement and tertiary AML engraftments
and propagation. Importantly, this model was shown to be useful as a valuable resource of
leukaemic cells, as described in the section below.
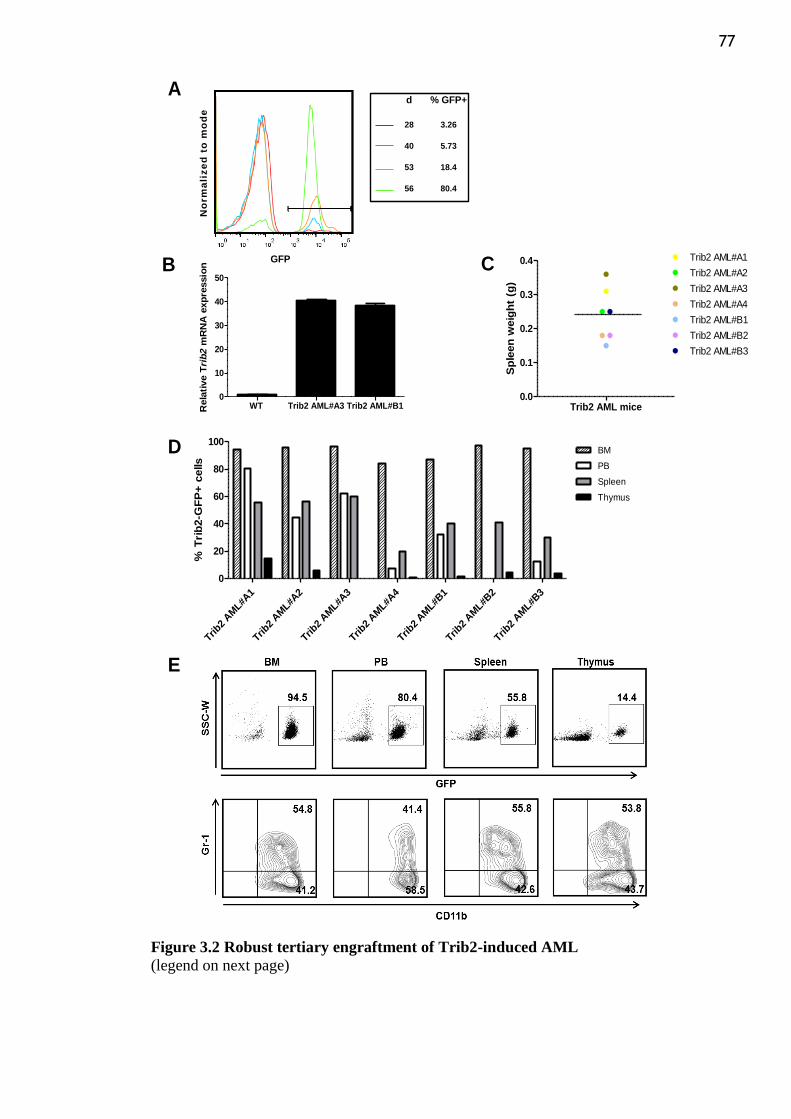
77
Figure 3.2 Robust tertiary engraftment of Trib2-induced AML
(legend on next page)
A
B C
D
E
d % GFP+
28 3.26
40 5.73
53 18.4
56 80.4
GFP
No
rm
ali
ze
d t
o m
od
e
WT Trib2 AML#A3 Trib2 AML#B10
10
20
30
40
50
Rela
tive T
rib
2 m
RN
A e
xp
ressio
n
Trib2
AM
L#A1
Trib2
AM
L#A2
Trib2
AM
L#A3
Trib2
AM
L#A4
Trib2
AM
L#B1
Trib2
AM
L#B2
Trib2
AM
L#B3
0
20
40
60
80
100BM
PB
Spleen
Thymus
% T
rib
2-G
FP
+ c
ells
Trib2 AML mice0.0
0.1
0.2
0.3
0.4 Trib2 AML#A1
Trib2 AML#A2
Trib2 AML#A3
Trib2 AML#A4
Trib2 AML#B1
Trib2 AML#B2
Trib2 AML#B3
Sp
leen
weig
ht
(g)
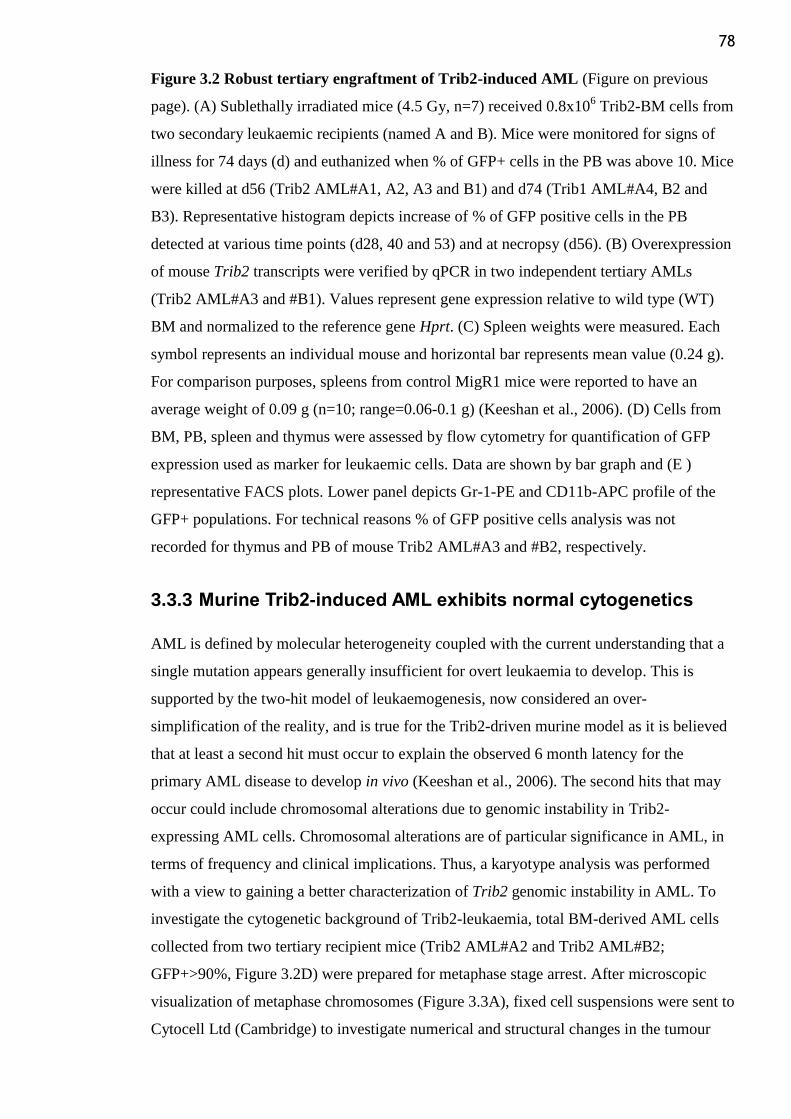
78
Figure 3.2 Robust tertiary engraftment of Trib2-induced AML (Figure on previous
page). (A) Sublethally irradiated mice (4.5 Gy, n=7) received 0.8x10⁶ Trib2-BM cells from
two secondary leukaemic recipients (named A and B). Mice were monitored for signs of
illness for 74 days (d) and euthanized when % of GFP+ cells in the PB was above 10. Mice
were killed at d56 (Trib2 AML#A1, A2, A3 and B1) and d74 (Trib1 AML#A4, B2 and
B3). Representative histogram depicts increase of % of GFP positive cells in the PB
detected at various time points (d28, 40 and 53) and at necropsy (d56). (B) Overexpression
of mouse Trib2 transcripts were verified by qPCR in two independent tertiary AMLs
(Trib2 AML#A3 and #B1). Values represent gene expression relative to wild type (WT)
BM and normalized to the reference gene Hprt. (C) Spleen weights were measured. Each
symbol represents an individual mouse and horizontal bar represents mean value (0.24 g).
For comparison purposes, spleens from control MigR1 mice were reported to have an
average weight of 0.09 g (n=10; range=0.06-0.1 g) (Keeshan et al., 2006). (D) Cells from
BM, PB, spleen and thymus were assessed by flow cytometry for quantification of GFP
expression used as marker for leukaemic cells. Data are shown by bar graph and (E )
representative FACS plots. Lower panel depicts Gr-1-PE and CD11b-APC profile of the
GFP+ populations. For technical reasons % of GFP positive cells analysis was not
recorded for thymus and PB of mouse Trib2 AML#A3 and #B2, respectively.
3.3.3 Murine Trib2-induced AML exhibits normal cytogenetics
AML is defined by molecular heterogeneity coupled with the current understanding that a
single mutation appears generally insufficient for overt leukaemia to develop. This is
supported by the two-hit model of leukaemogenesis, now considered an over-
simplification of the reality, and is true for the Trib2-driven murine model as it is believed
that at least a second hit must occur to explain the observed 6 month latency for the
primary AML disease to develop in vivo (Keeshan et al., 2006). The second hits that may
occur could include chromosomal alterations due to genomic instability in Trib2-
expressing AML cells. Chromosomal alterations are of particular significance in AML, in
terms of frequency and clinical implications. Thus, a karyotype analysis was performed
with a view to gaining a better characterization of Trib2 genomic instability in AML. To
investigate the cytogenetic background of Trib2-leukaemia, total BM-derived AML cells
collected from two tertiary recipient mice (Trib2 AML#A2 and Trib2 AML#B2;
GFP+>90%, Figure 3.2D) were prepared for metaphase stage arrest. After microscopic
visualization of metaphase chromosomes (Figure 3.3A), fixed cell suspensions were sent to
Cytocell Ltd (Cambridge) to investigate numerical and structural changes in the tumour
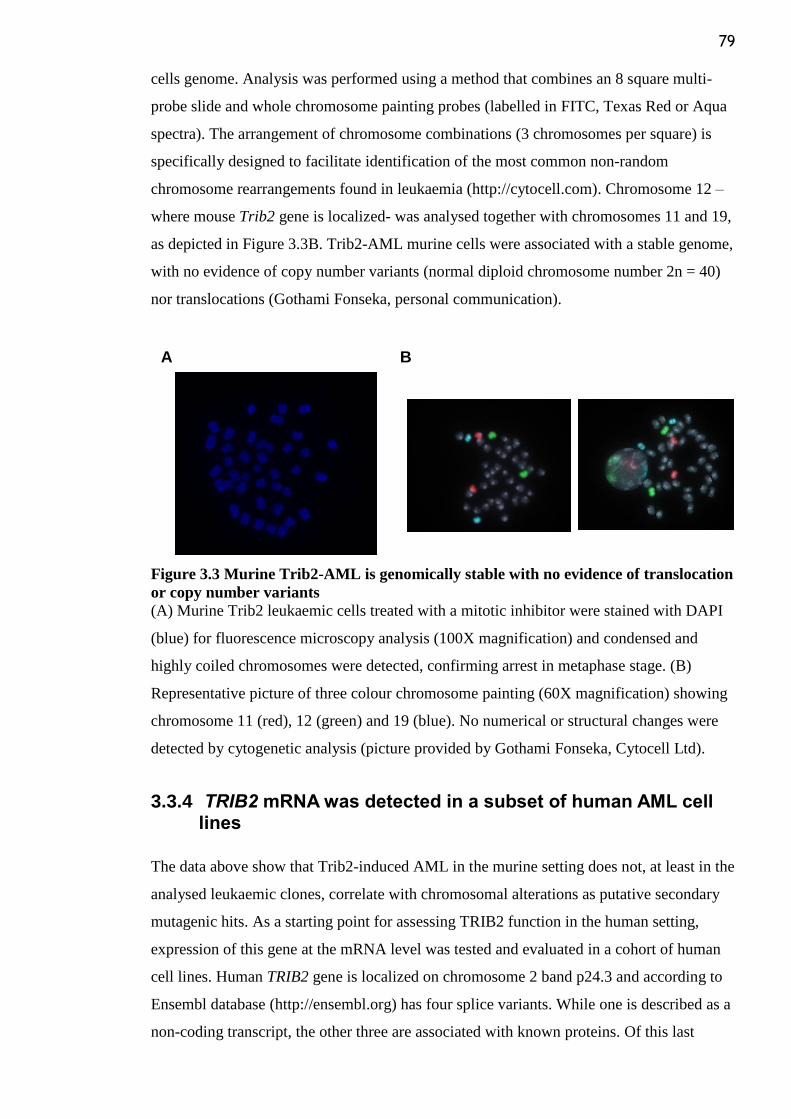
79
cells genome. Analysis was performed using a method that combines an 8 square multi-
probe slide and whole chromosome painting probes (labelled in FITC, Texas Red or Aqua
spectra). The arrangement of chromosome combinations (3 chromosomes per square) is
specifically designed to facilitate identification of the most common non-random
chromosome rearrangements found in leukaemia (http://cytocell.com). Chromosome 12 –
where mouse Trib2 gene is localized- was analysed together with chromosomes 11 and 19,
as depicted in Figure 3.3B. Trib2-AML murine cells were associated with a stable genome,
with no evidence of copy number variants (normal diploid chromosome number 2n = 40)
nor translocations (Gothami Fonseka, personal communication).
Figure 3.3 Murine Trib2-AML is genomically stable with no evidence of translocation
or copy number variants
(A) Murine Trib2 leukaemic cells treated with a mitotic inhibitor were stained with DAPI
(blue) for fluorescence microscopy analysis (100X magnification) and condensed and
highly coiled chromosomes were detected, confirming arrest in metaphase stage. (B)
Representative picture of three colour chromosome painting (60X magnification) showing
chromosome 11 (red), 12 (green) and 19 (blue). No numerical or structural changes were
detected by cytogenetic analysis (picture provided by Gothami Fonseka, Cytocell Ltd).
3.3.4 TRIB2 mRNA was detected in a subset of human AML cell lines
The data above show that Trib2-induced AML in the murine setting does not, at least in the
analysed leukaemic clones, correlate with chromosomal alterations as putative secondary
mutagenic hits. As a starting point for assessing TRIB2 function in the human setting,
expression of this gene at the mRNA level was tested and evaluated in a cohort of human
cell lines. Human TRIB2 gene is localized on chromosome 2 band p24.3 and according to
Ensembl database (http://ensembl.org) has four splice variants. While one is described as a
non-coding transcript, the other three are associated with known proteins. Of this last
BA
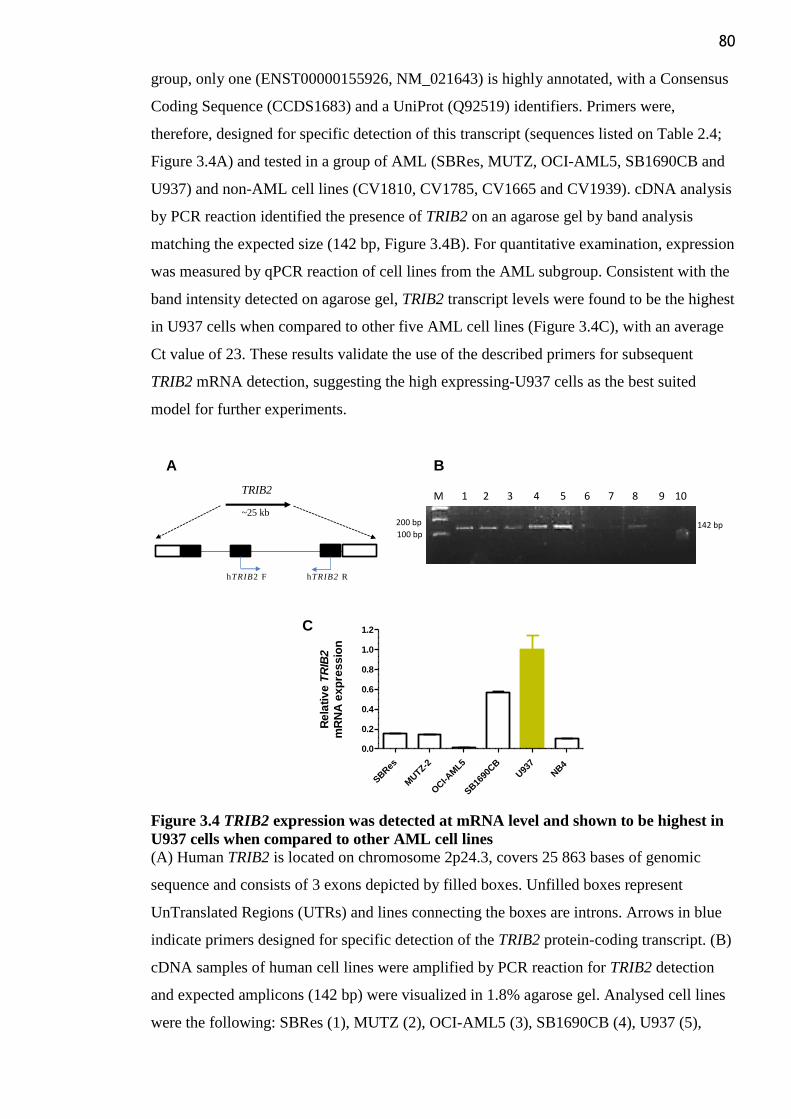
80
group, only one (ENST00000155926, NM_021643) is highly annotated, with a Consensus
Coding Sequence (CCDS1683) and a UniProt (Q92519) identifiers. Primers were,
therefore, designed for specific detection of this transcript (sequences listed on Table 2.4;
Figure 3.4A) and tested in a group of AML (SBRes, MUTZ, OCI-AML5, SB1690CB and
U937) and non-AML cell lines (CV1810, CV1785, CV1665 and CV1939). cDNA analysis
by PCR reaction identified the presence of TRIB2 on an agarose gel by band analysis
matching the expected size (142 bp, Figure 3.4B). For quantitative examination, expression
was measured by qPCR reaction of cell lines from the AML subgroup. Consistent with the
band intensity detected on agarose gel, TRIB2 transcript levels were found to be the highest
in U937 cells when compared to other five AML cell lines (Figure 3.4C), with an average
Ct value of 23. These results validate the use of the described primers for subsequent
TRIB2 mRNA detection, suggesting the high expressing-U937 cells as the best suited
model for further experiments.
Figure 3.4 TRIB2 expression was detected at mRNA level and shown to be highest in
U937 cells when compared to other AML cell lines
(A) Human TRIB2 is located on chromosome 2p24.3, covers 25 863 bases of genomic
sequence and consists of 3 exons depicted by filled boxes. Unfilled boxes represent
UnTranslated Regions (UTRs) and lines connecting the boxes are introns. Arrows in blue
indicate primers designed for specific detection of the TRIB2 protein-coding transcript. (B)
cDNA samples of human cell lines were amplified by PCR reaction for TRIB2 detection
and expected amplicons (142 bp) were visualized in 1.8% agarose gel. Analysed cell lines
were the following: SBRes (1), MUTZ (2), OCI-AML5 (3), SB1690CB (4), U937 (5),
TRIB2
hTRIB2 F hTRIB2 R
~25 kb
M 1 2 3 4 5 6 7 8 9 10
100 bp
200 bp 142 bp
A B
C
SBRes
MUTZ-2
OCI-A
ML5
SB16
90CB
U93
7
NB4
0.0
0.2
0.4
0.6
0.8
1.0
1.2
Re
lati
ve
TR
IB2
mR
NA
ex
pre
ssio
n
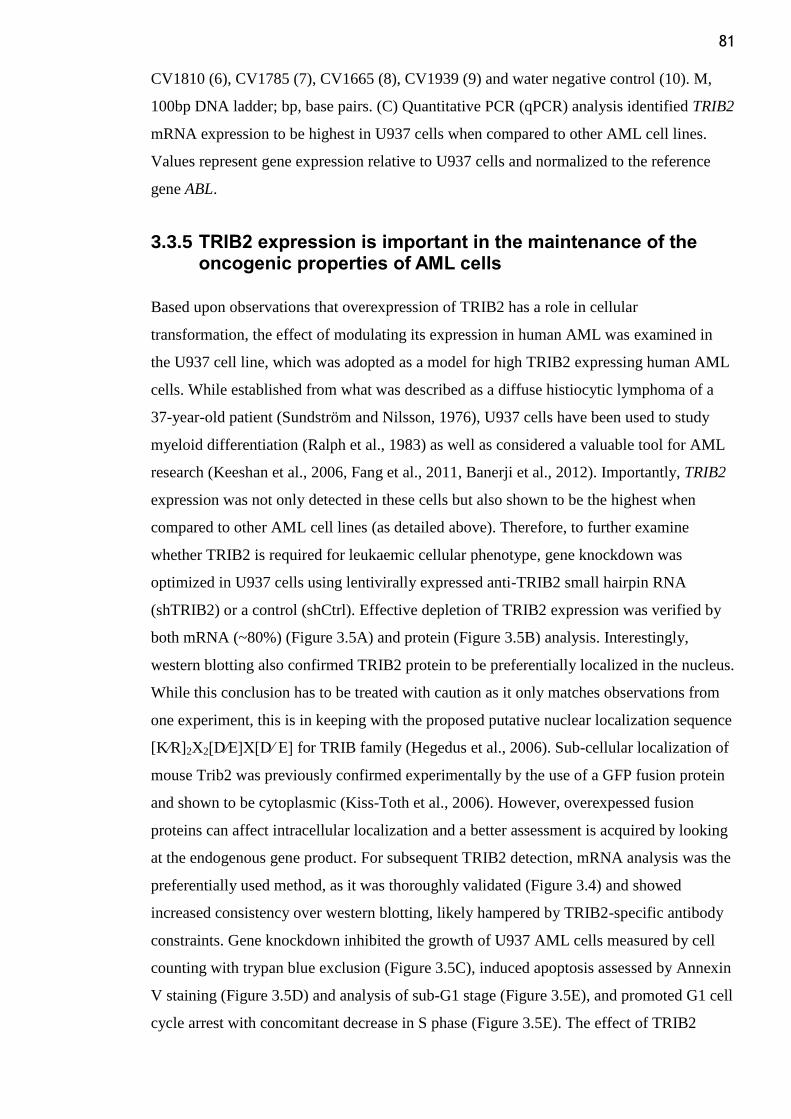
81
CV1810 (6), CV1785 (7), CV1665 (8), CV1939 (9) and water negative control (10). M,
100bp DNA ladder; bp, base pairs. (C) Quantitative PCR (qPCR) analysis identified TRIB2
mRNA expression to be highest in U937 cells when compared to other AML cell lines.
Values represent gene expression relative to U937 cells and normalized to the reference
gene ABL.
3.3.5 TRIB2 expression is important in the maintenance of the oncogenic properties of AML cells
Based upon observations that overexpression of TRIB2 has a role in cellular
transformation, the effect of modulating its expression in human AML was examined in
the U937 cell line, which was adopted as a model for high TRIB2 expressing human AML
cells. While established from what was described as a diffuse histiocytic lymphoma of a
37-year-old patient (Sundström and Nilsson, 1976), U937 cells have been used to study
myeloid differentiation (Ralph et al., 1983) as well as considered a valuable tool for AML
research (Keeshan et al., 2006, Fang et al., 2011, Banerji et al., 2012). Importantly, TRIB2
expression was not only detected in these cells but also shown to be the highest when
compared to other AML cell lines (as detailed above). Therefore, to further examine
whether TRIB2 is required for leukaemic cellular phenotype, gene knockdown was
optimized in U937 cells using lentivirally expressed anti-TRIB2 small hairpin RNA
(shTRIB2) or a control (shCtrl). Effective depletion of TRIB2 expression was verified by
both mRNA (~80%) (Figure 3.5A) and protein (Figure 3.5B) analysis. Interestingly,
western blotting also confirmed TRIB2 protein to be preferentially localized in the nucleus.
While this conclusion has to be treated with caution as it only matches observations from
one experiment, this is in keeping with the proposed putative nuclear localization sequence
[K⁄R]2X2[D⁄E]X[D⁄ E] for TRIB family (Hegedus et al., 2006). Sub-cellular localization of
mouse Trib2 was previously confirmed experimentally by the use of a GFP fusion protein
and shown to be cytoplasmic (Kiss-Toth et al., 2006). However, overexpessed fusion
proteins can affect intracellular localization and a better assessment is acquired by looking
at the endogenous gene product. For subsequent TRIB2 detection, mRNA analysis was the
preferentially used method, as it was thoroughly validated (Figure 3.4) and showed
increased consistency over western blotting, likely hampered by TRIB2-specific antibody
constraints. Gene knockdown inhibited the growth of U937 AML cells measured by cell
counting with trypan blue exclusion (Figure 3.5C), induced apoptosis assessed by Annexin
V staining (Figure 3.5D) and analysis of sub-G1 stage (Figure 3.5E), and promoted G1 cell
cycle arrest with concomitant decrease in S phase (Figure 3.5E). The effect of TRIB2
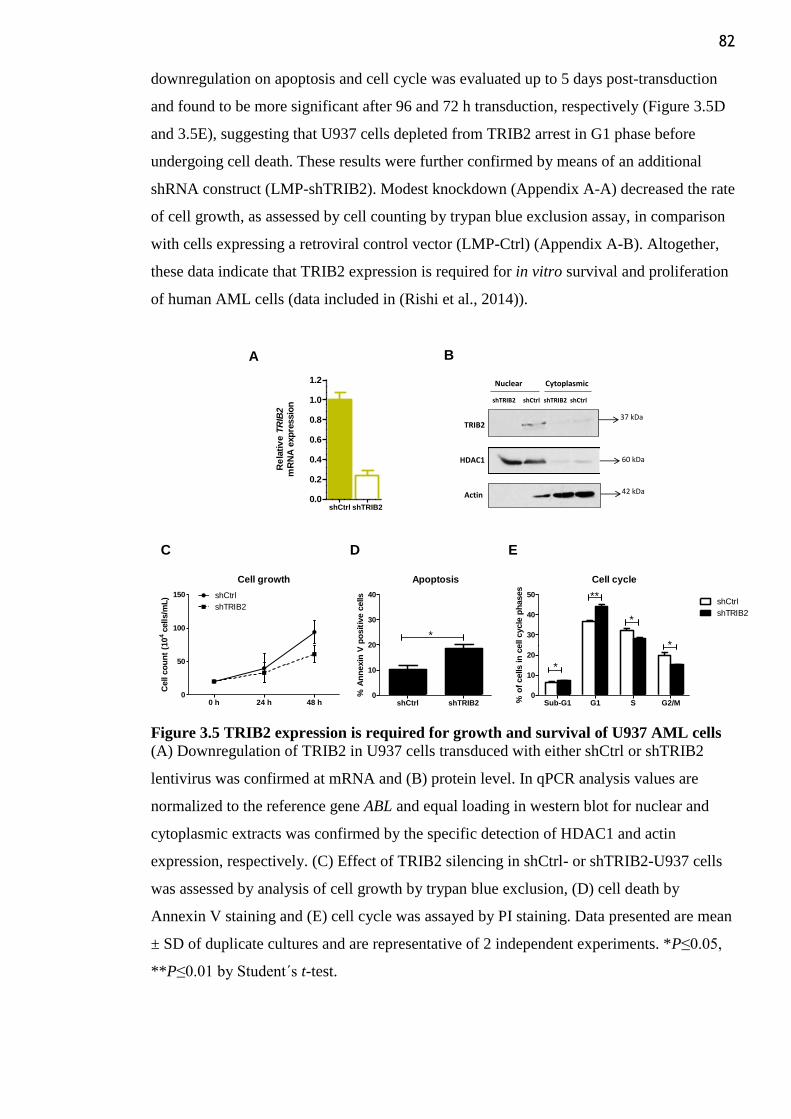
82
downregulation on apoptosis and cell cycle was evaluated up to 5 days post-transduction
and found to be more significant after 96 and 72 h transduction, respectively (Figure 3.5D
and 3.5E), suggesting that U937 cells depleted from TRIB2 arrest in G1 phase before
undergoing cell death. These results were further confirmed by means of an additional
shRNA construct (LMP-shTRIB2). Modest knockdown (Appendix A-A) decreased the rate
of cell growth, as assessed by cell counting by trypan blue exclusion assay, in comparison
with cells expressing a retroviral control vector (LMP-Ctrl) (Appendix A-B). Altogether,
these data indicate that TRIB2 expression is required for in vitro survival and proliferation
of human AML cells (data included in (Rishi et al., 2014)).
Figure 3.5 TRIB2 expression is required for growth and survival of U937 AML cells
(A) Downregulation of TRIB2 in U937 cells transduced with either shCtrl or shTRIB2
lentivirus was confirmed at mRNA and (B) protein level. In qPCR analysis values are
normalized to the reference gene ABL and equal loading in western blot for nuclear and
cytoplasmic extracts was confirmed by the specific detection of HDAC1 and actin
expression, respectively. (C) Effect of TRIB2 silencing in shCtrl- or shTRIB2-U937 cells
was assessed by analysis of cell growth by trypan blue exclusion, (D) cell death by
Annexin V staining and (E) cell cycle was assayed by PI staining. Data presented are mean
± SD of duplicate cultures and are representative of 2 independent experiments. *P≤0.05,
**P≤0.01 by Student´s t-test.
C D E
A B
shTRIB2 shCtrl shTRIB2 shCtrl
Nuclear Cytoplasmic
TRIB2
HDAC1
Actin
37 kDa
60 kDa
42 kDa
shCtrl shTRIB20.0
0.2
0.4
0.6
0.8
1.0
1.2
Re
lati
ve
TR
IB2
mR
NA
exp
ressio
n
Cell growth
0 h 24 h 48 h0
50
100
150 shCtrl
shTRIB2
Cell c
ou
nt
(10
4cell
s/m
L)
Apoptosis
shCtrl shTRIB20
10
20
30
40
*
% A
nn
exin
V p
osit
ive c
ells
Cell cycle
Sub-G1 G1 S G2/M0
10
20
30
40
50shCtrl
shTRIB2
*
*
*
**
% o
f cells in
cell c
ycle
ph
ases
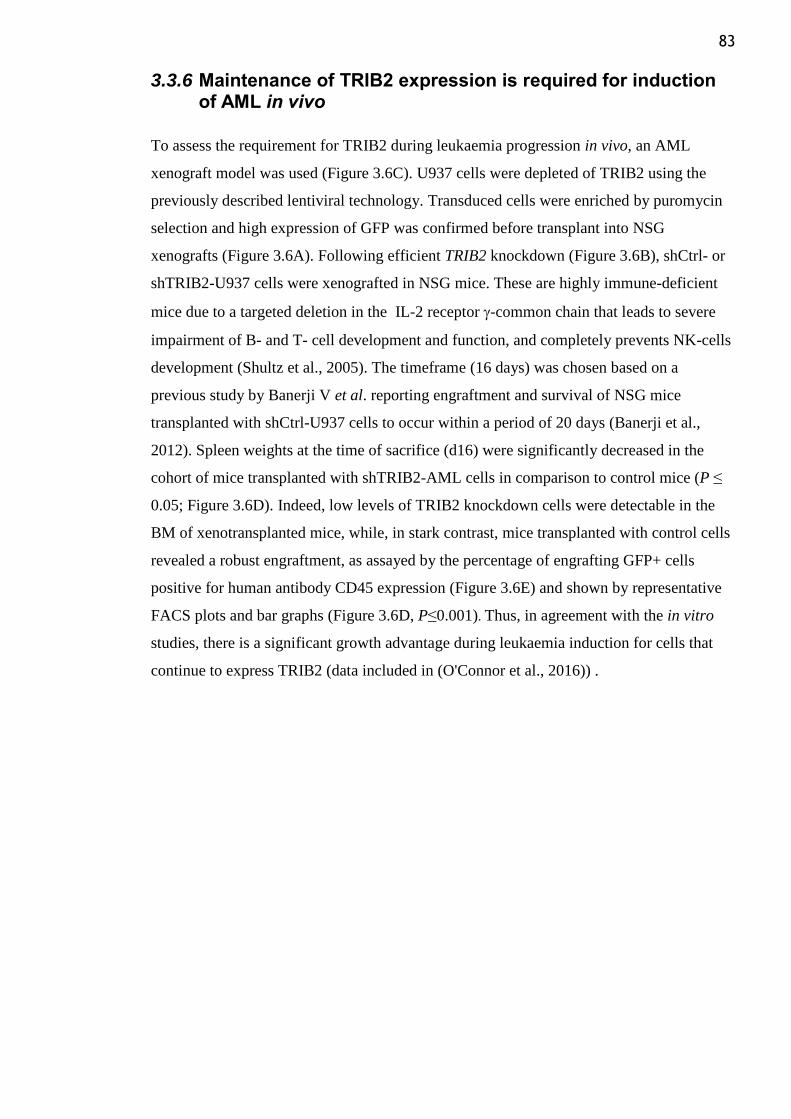
83
3.3.6 Maintenance of TRIB2 expression is required for induction of AML in vivo
To assess the requirement for TRIB2 during leukaemia progression in vivo, an AML
xenograft model was used (Figure 3.6C). U937 cells were depleted of TRIB2 using the
previously described lentiviral technology. Transduced cells were enriched by puromycin
selection and high expression of GFP was confirmed before transplant into NSG
xenografts (Figure 3.6A). Following efficient TRIB2 knockdown (Figure 3.6B), shCtrl- or
shTRIB2-U937 cells were xenografted in NSG mice. These are highly immune-deficient
mice due to a targeted deletion in the IL-2 receptor -common chain that leads to severe
impairment of B- and T- cell development and function, and completely prevents NK-cells
development (Shultz et al., 2005). The timeframe (16 days) was chosen based on a
previous study by Banerji V et al. reporting engraftment and survival of NSG mice
transplanted with shCtrl-U937 cells to occur within a period of 20 days (Banerji et al.,
2012). Spleen weights at the time of sacrifice (d16) were significantly decreased in the
cohort of mice transplanted with shTRIB2-AML cells in comparison to control mice (P ≤
0.05; Figure 3.6D). Indeed, low levels of TRIB2 knockdown cells were detectable in the
BM of xenotransplanted mice, while, in stark contrast, mice transplanted with control cells
revealed a robust engraftment, as assayed by the percentage of engrafting GFP+ cells
positive for human antibody CD45 expression (Figure 3.6E) and shown by representative
FACS plots and bar graphs (Figure 3.6D, P≤0.001). Thus, in agreement with the in vitro
studies, there is a significant growth advantage during leukaemia induction for cells that
continue to express TRIB2 (data included in (O'Connor et al., 2016)) .
84
Figure 3.6 In vivo TRIB2 expression accelerates progression of AML
(A) U937 cells were transduced with shCtrl or shTRIB2 lentivirus and selected after 24 h
with 2 µg/mL puromycin. After 2 days, equally high expression of GFP was detected by
FACS analysis in both transduced cells. (B) TRIB2 gene knockdown was confirmed at the
mRNA level in shTRIB2-U937 cells. Values represent gene expression relative to shCtrl
and normalized to the reference gene ABL (***P≤0.001 by Student´s t-test). (C) Schematic
representation of the AML xenograft study. NSG mice were transplanted with 1.2x10⁶
U937 cells transduced with shCtrl (n=5) or shTRIB2 (n=8) lentivirus. (D) Spleen weights
were measured on day 16 after transplant. Each symbol represents an individual mouse and
horizontal bars represent mean values (*P≤0.05 by Student´s t-test). (E) GFP and hCD45-
PE Cy7 expression in BM were quantified by flow cytometry as a measure of disease
burden in shCtrl- and shTRIB2-U937 mice and data are shown by representative FACS
0 5 11 16
(day)
PB analysis
An
alys
is
shCtrl/shTRIB2 U937 cells
shCtrl shTRIB2
GFP%
SSC
-W
BM
A B
DC
shCtrl shTRIB20
10
20
30
40
50 ***
% G
FP
+h
CD
45+
BM
cells
shCtrl shTRIB20.00
0.05
0.10
0.15*
Sp
leen
weig
ht
(g)
shCtrl shTRIB20.0
0.2
0.4
0.6
0.8
1.0
1.2 ***
Rela
tive
TR
IB2 m
RN
A
exp
ressio
n
Untransduced cells Transduced cells
shCtrl-U937 shTRIB2-U937
62.2% 71.7%
No
rma
lize
d T
o M
od
e
GFP
E
85
pseudocolor plots (left panel) and bar graph (right panel) with means ± SD (***P≤0.001
by Student´s t-test).
3.3.7 TRIB2 knockdown in U937 human AML cells changes expression of a subset of genes
To further explore the molecular mechanisms underlying TRIB2-induced phenotype in
U937 AML cell line, expression of selected apoptosis- and cell cycle-relevant genes was
investigated in these cells after downregulation of TRIB2. U937 cells transduced with
either shCtrl- or shTRIB2-lentivirus were sorted and mRNA from two independent
replicates was collected at 48 and 72 h post-transduction. High-throughput qPCR was
carried out using the 48.48 Dynamic Array™ IFC system (Fluidigm). TRIB2 knockdown
was confirmed in both analyses (Figure 3.7A and B). When comparing expression of genes
in response to TRIB2 silencing, samples collected after 48 h transduction (Figure 3.7A)
showed an increase in expression of the cell cycle regulator genes (ATM, ATR, BRCA2,
PTEN, P27KIP1 and CDC25A) and also of the pro-apoptotic BIM (BCL2-Like11), CASP3,
CASP8 and BAX genes. Even if a concomitant downregulation of the anti-apoptotic genes
(except for XIAP) was not detected, the ratio of pro-apoptotic to anti-apoptotic genes was
increased suggesting that TRIB2 knockdown results in a pro-apoptotic phenotype. The
enhanced mRNA expression of the pro-apoptotic genes when TRIB2 was silenced
correlates with results obtained for the cell death analysis that identified an increase in
apoptosis after TRIB2 knockdown. Expression of the P27KIP1 cyclin-dependent kinase
inhibitor and the pro-apoptotic BIM remained transcriptionally up-regulated at 72 h post
transduction. P27KIP1 encodes a protein that binds to and prevents the activation of cyclin
E-CDK2 or cyclin D-CDK4 complexes, and thus controls the cell cycle progression at G1
phase (Toyoshima and Hunter, 1994). BIM is a BH3-only protein from the BCL-2 family
that is capable of inducing apoptosis (O'Connor et al., 1998). These findings are in line
with the cell cycle arrest and apoptotic phenotypes observed after 72 and 96 h transduction,
respectively (Figure 3.5 D and E). Importantly, the transcriptional changes were detected at
time points (48 and 72 h) that either match or precede the abovementioned phenotypes,
hence, supporting a cause-and-effect relationship. Results therefore suggest that TRIB2
modulates apoptosis and cell-cycle sensitivity by influencing the expression of a subset of
genes known to have implications on these phenotypes. Together the in vitro and in vivo
experiments support the role of TRIB2 in AML cell survival.
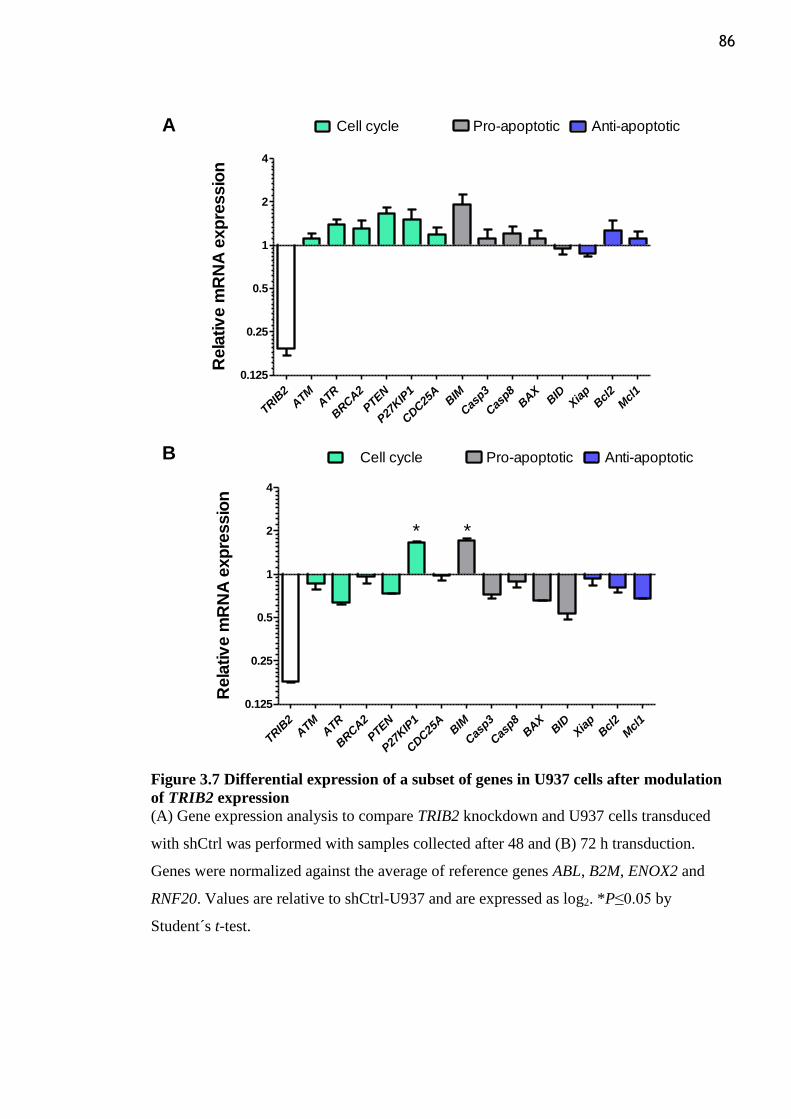
86
Figure 3.7 Differential expression of a subset of genes in U937 cells after modulation
of TRIB2 expression
(A) Gene expression analysis to compare TRIB2 knockdown and U937 cells transduced
with shCtrl was performed with samples collected after 48 and (B) 72 h transduction.
Genes were normalized against the average of reference genes ABL, B2M, ENOX2 and
RNF20. Values are relative to shCtrl-U937 and are expressed as log2. *P≤0.05 by
Student´s t-test.
TRIB
2ATM
ATR
BRCA2
PTE
N
P27
KIP
1
CDC25
ABIM
Cas
p3
Cas
p8BAX
BID
Xia
pBcl
2
Mcl
1
0.125
0.25
0.5
1
2
4
Cell cycle Pro-apoptotic Anti-apoptotic
Rela
tiv
e m
RN
A e
xp
ressio
n
TRIB
2ATM
ATR
BRCA2
PTE
N
P27
KIP
1
CDC25
ABIM
Cas
p3
Cas
p8BAX
BID
Xia
pBcl
2
Mcl
1
0.125
0.25
0.5
1
2
4
* *
Cell cycle Pro-apoptotic Anti-apoptotic
Rela
tiv
e m
RN
A e
xp
ressio
n
A
B
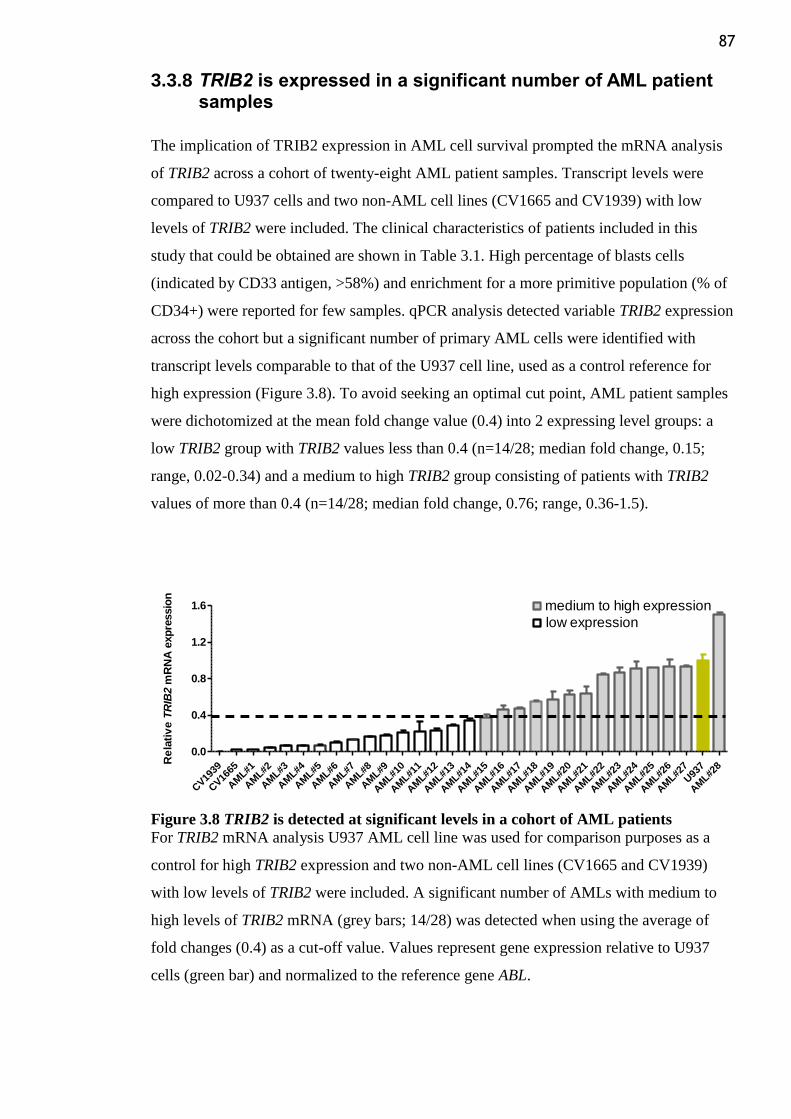
87
3.3.8 TRIB2 is expressed in a significant number of AML patient samples
The implication of TRIB2 expression in AML cell survival prompted the mRNA analysis
of TRIB2 across a cohort of twenty-eight AML patient samples. Transcript levels were
compared to U937 cells and two non-AML cell lines (CV1665 and CV1939) with low
levels of TRIB2 were included. The clinical characteristics of patients included in this
study that could be obtained are shown in Table 3.1. High percentage of blasts cells
(indicated by CD33 antigen, >58%) and enrichment for a more primitive population (% of
CD34+) were reported for few samples. qPCR analysis detected variable TRIB2 expression
across the cohort but a significant number of primary AML cells were identified with
transcript levels comparable to that of the U937 cell line, used as a control reference for
high expression (Figure 3.8). To avoid seeking an optimal cut point, AML patient samples
were dichotomized at the mean fold change value (0.4) into 2 expressing level groups: a
low TRIB2 group with TRIB2 values less than 0.4 (n=14/28; median fold change, 0.15;
range, 0.02-0.34) and a medium to high TRIB2 group consisting of patients with TRIB2
values of more than 0.4 (n=14/28; median fold change, 0.76; range, 0.36-1.5).
Figure 3.8 TRIB2 is detected at significant levels in a cohort of AML patients
For TRIB2 mRNA analysis U937 AML cell line was used for comparison purposes as a
control for high TRIB2 expression and two non-AML cell lines (CV1665 and CV1939)
with low levels of TRIB2 were included. A significant number of AMLs with medium to
high levels of TRIB2 mRNA (grey bars; 14/28) was detected when using the average of
fold changes (0.4) as a cut-off value. Values represent gene expression relative to U937
cells (green bar) and normalized to the reference gene ABL.
CV19
39
CV16
65
AM
L#1
AM
L#2
AM
L#3
AM
L#4
AM
L#5
AM
L#6
AM
L#7
AM
L#8
AM
L#9
AM
L#10
AM
L#11
AM
L#12
AM
L#13
AM
L#14
AM
L#15
AM
L#16
AM
L#17
AM
L#18
AM
L#19
AM
L#20
AM
L#21
AM
L#22
AM
L#23
AM
L#24
AM
L#25
AM
L#26
AM
L#27
U93
7
AM
L#28
0.0
0.4
0.8
1.2
1.6 medium to high expression
low expression
Re
lati
ve
TR
IB2
mR
NA
exp
ressio
n
88
There were no significant differences between low and medium to high TRIB2-expressing
patients with respect to age (median age 65 vs 62, respectively), with the exception of
AML#8 (36-years-old). Moreover, TRIB2 expression levels were randomly distributed
across gender and the FAB classes. Based on the available information regarding
cytogenetic/molecular abnormalities and their prognostic relevance described in the
literature, samples were further classified according to the risk-scoring system (Chapter 1,
section 1.2.3), as depicted in Table 3.1. All 3/10 reported aberrations that predict for poor
prognosis (complex karyotype, t (6;11) and monosomy 7) were found in patients with low
TRIB2 mRNA levels (AML#1, 2 and 13, respectively). Complex karyotype (three or more
different cytogenetic aberrations) and monosomy of chromosome 7 are consistently
associated with unfavourable outcome (Löwenberg, 2001) whereas t (6;11) translocation is
rare in AML but also reported to indicate a poor prognosis (Martineau et al., 1998, Blum et
al., 2004). Abnormalities associated with favorable outcome, t(8;21) and FLT3-WT, were
detected in both low (AML#8) and high (AML#23 and 28) TRIB2 expressing subgroups.
Cytogenetically normal (CN) samples, included in the intermediate risk AML, were also
detected in both cohorts defined based on TRIB2 status. Taken together, these data
identified TRIB2 expression in human AML samples at levels, to some extent (14/28),
comparable to the high expressing U937 AML cell line. Association with the available,
while incomplete, karyotype/molecular information suggests that AML patients with
higher TRIB2 expression are more likely to be associated with the favourable or the
intermediate prognostic subgroups.
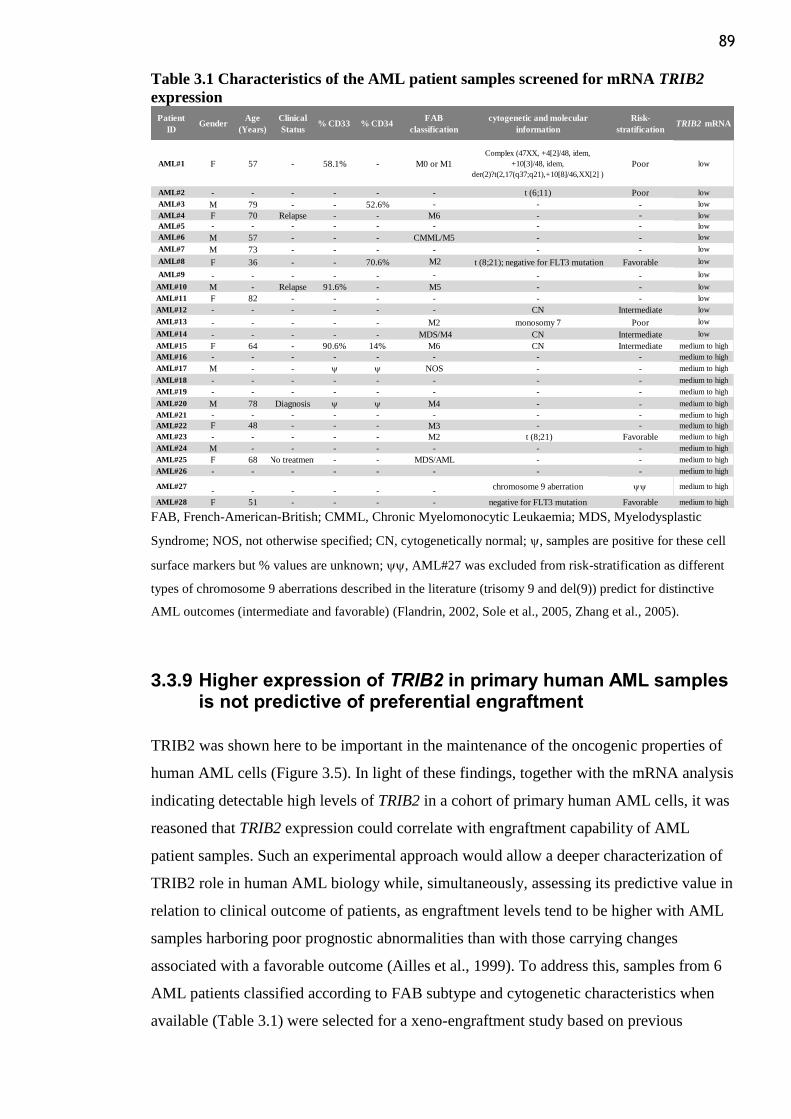
89
Table 3.1 Characteristics of the AML patient samples screened for mRNA TRIB2
expression
FAB, French-American-British; CMML, Chronic Myelomonocytic Leukaemia; MDS, Myelodysplastic
Syndrome; NOS, not otherwise specified; CN, cytogenetically normal; , samples are positive for these cell
surface markers but % values are unknown; , AML#27 was excluded from risk-stratification as different
types of chromosome 9 aberrations described in the literature (trisomy 9 and del(9)) predict for distinctive
AML outcomes (intermediate and favorable) (Flandrin, 2002, Sole et al., 2005, Zhang et al., 2005).
3.3.9 Higher expression of TRIB2 in primary human AML samples is not predictive of preferential engraftment
TRIB2 was shown here to be important in the maintenance of the oncogenic properties of
human AML cells (Figure 3.5). In light of these findings, together with the mRNA analysis
indicating detectable high levels of TRIB2 in a cohort of primary human AML cells, it was
reasoned that TRIB2 expression could correlate with engraftment capability of AML
patient samples. Such an experimental approach would allow a deeper characterization of
TRIB2 role in human AML biology while, simultaneously, assessing its predictive value in
relation to clinical outcome of patients, as engraftment levels tend to be higher with AML
samples harboring poor prognostic abnormalities than with those carrying changes
associated with a favorable outcome (Ailles et al., 1999). To address this, samples from 6
AML patients classified according to FAB subtype and cytogenetic characteristics when
available (Table 3.1) were selected for a xeno-engraftment study based on previous
Patient
IDGender
Age
(Years)
Clinical
Status% CD33 % CD34
FAB
classification
cytogenetic and molecular
information
Risk-
stratificationTRIB2 mRNA
AML#1 F 57 - 58.1% - M0 or M1
Complex (47XX, +4[2]/48, idem,
+10[3]/48, idem,
der(2)?t(2,17(q37;q21),+10[8]/46,XX[2] )
Poor low
AML#2 - - - - - - t (6;11) Poor low
AML#3 M 79 - - 52.6% - - - low
AML#4 F 70 Relapse - - M6 - - low
AML#5 - - - - - - - - low
AML#6 M 57 - - - CMML/M5 - - low
AML#7 M 73 - - - - - - low
AML#8 F 36 - - 70.6% M2 t (8;21); negative for FLT3 mutation Favorable low
AML#9 - - - - - - - - low
AML#10 M - Relapse 91.6% - M5 - - low
AML#11 F 82 - - - - - - low
AML#12 - - - - - - CN Intermediate low
AML#13 - - - - - M2 monosomy 7 Poor low
AML#14 - - - - - MDS/M4 CN Intermediate low
AML#15 F 64 - 90.6% 14% M6 CN Intermediate medium to high
AML#16 - - - - - - - - medium to high
AML#17 M - - NOS - - medium to high
AML#18 - - - - - - - - medium to high
AML#19 - - - - - - - - medium to high
AML#20 M 78 Diagnosis M4 - - medium to high
AML#21 - - - - - - - - medium to high
AML#22 F 48 - - - M3 - - medium to high
AML#23 - - - - - M2 t (8;21) Favorable medium to high
AML#24 M - - - - - - - medium to high
AML#25 F 68 No treatment - - MDS/AML - - medium to high
AML#26 - - - - - - - - medium to high
AML#27- - - - - -
chromosome 9 aberration medium to high
AML#28 F 51 - - - - negative for FLT3 mutation Favorable medium to high
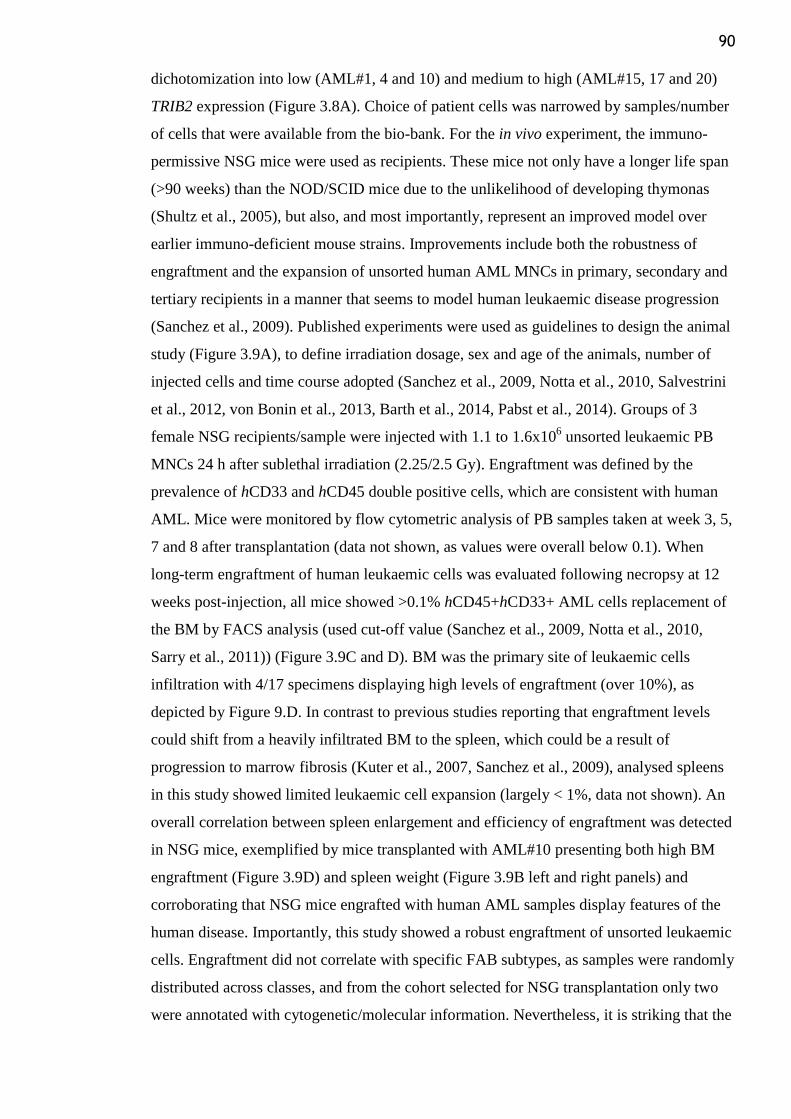
90
dichotomization into low (AML#1, 4 and 10) and medium to high (AML#15, 17 and 20)
TRIB2 expression (Figure 3.8A). Choice of patient cells was narrowed by samples/number
of cells that were available from the bio-bank. For the in vivo experiment, the immuno-
permissive NSG mice were used as recipients. These mice not only have a longer life span
(>90 weeks) than the NOD/SCID mice due to the unlikelihood of developing thymonas
(Shultz et al., 2005), but also, and most importantly, represent an improved model over
earlier immuno-deficient mouse strains. Improvements include both the robustness of
engraftment and the expansion of unsorted human AML MNCs in primary, secondary and
tertiary recipients in a manner that seems to model human leukaemic disease progression
(Sanchez et al., 2009). Published experiments were used as guidelines to design the animal
study (Figure 3.9A), to define irradiation dosage, sex and age of the animals, number of
injected cells and time course adopted (Sanchez et al., 2009, Notta et al., 2010, Salvestrini
et al., 2012, von Bonin et al., 2013, Barth et al., 2014, Pabst et al., 2014). Groups of 3
female NSG recipients/sample were injected with 1.1 to 1.6x10⁶ unsorted leukaemic PB
MNCs 24 h after sublethal irradiation (2.25/2.5 Gy). Engraftment was defined by the
prevalence of hCD33 and hCD45 double positive cells, which are consistent with human
AML. Mice were monitored by flow cytometric analysis of PB samples taken at week 3, 5,
7 and 8 after transplantation (data not shown, as values were overall below 0.1). When
long-term engraftment of human leukaemic cells was evaluated following necropsy at 12
weeks post-injection, all mice showed >0.1% hCD45+hCD33+ AML cells replacement of
the BM by FACS analysis (used cut-off value (Sanchez et al., 2009, Notta et al., 2010,
Sarry et al., 2011)) (Figure 3.9C and D). BM was the primary site of leukaemic cells
infiltration with 4/17 specimens displaying high levels of engraftment (over 10%), as
depicted by Figure 9.D. In contrast to previous studies reporting that engraftment levels
could shift from a heavily infiltrated BM to the spleen, which could be a result of
progression to marrow fibrosis (Kuter et al., 2007, Sanchez et al., 2009), analysed spleens
in this study showed limited leukaemic cell expansion (largely < 1%, data not shown). An
overall correlation between spleen enlargement and efficiency of engraftment was detected
in NSG mice, exemplified by mice transplanted with AML#10 presenting both high BM
engraftment (Figure 3.9D) and spleen weight (Figure 3.9B left and right panels) and
corroborating that NSG mice engrafted with human AML samples display features of the
human disease. Importantly, this study showed a robust engraftment of unsorted leukaemic
cells. Engraftment did not correlate with specific FAB subtypes, as samples were randomly
distributed across classes, and from the cohort selected for NSG transplantation only two
were annotated with cytogenetic/molecular information. Nevertheless, it is striking that the
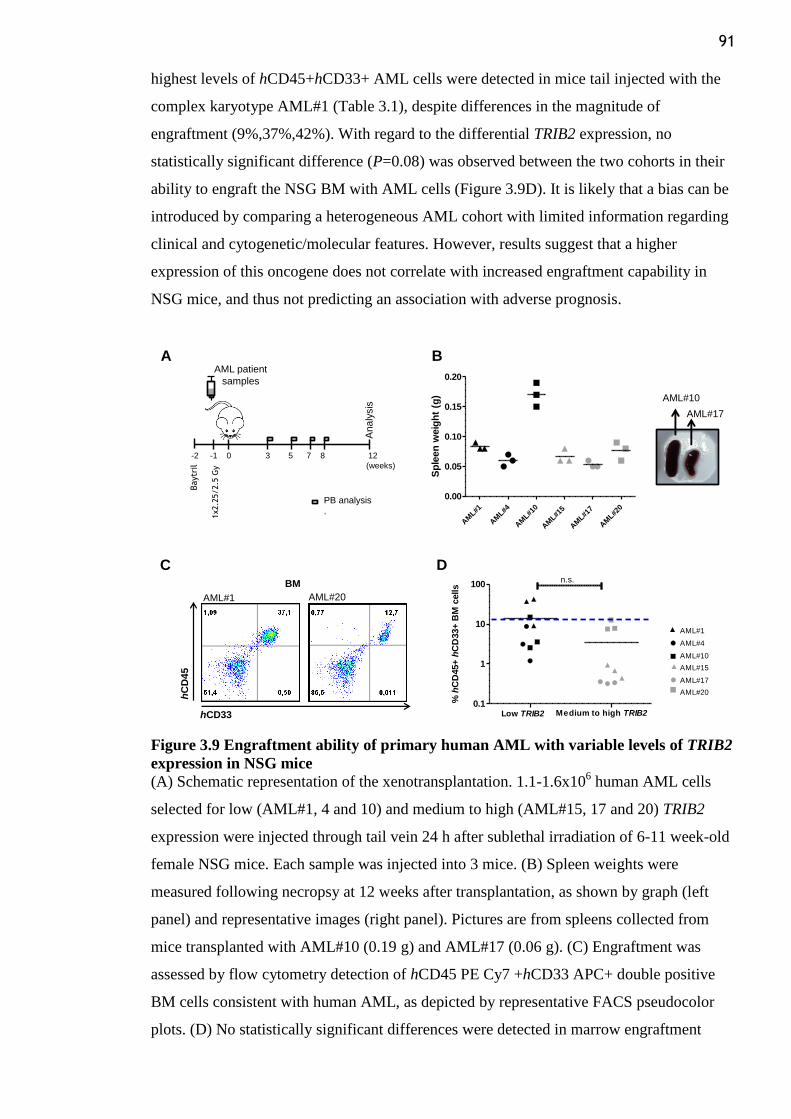
91
highest levels of hCD45+hCD33+ AML cells were detected in mice tail injected with the
complex karyotype AML#1 (Table 3.1), despite differences in the magnitude of
engraftment (9%,37%,42%). With regard to the differential TRIB2 expression, no
statistically significant difference (P=0.08) was observed between the two cohorts in their
ability to engraft the NSG BM with AML cells (Figure 3.9D). It is likely that a bias can be
introduced by comparing a heterogeneous AML cohort with limited information regarding
clinical and cytogenetic/molecular features. However, results suggest that a higher
expression of this oncogene does not correlate with increased engraftment capability in
NSG mice, and thus not predicting an association with adverse prognosis.
Figure 3.9 Engraftment ability of primary human AML with variable levels of TRIB2
expression in NSG mice
(A) Schematic representation of the xenotransplantation. 1.1-1.6x10⁶ human AML cells
selected for low (AML#1, 4 and 10) and medium to high (AML#15, 17 and 20) TRIB2
expression were injected through tail vein 24 h after sublethal irradiation of 6-11 week-old
female NSG mice. Each sample was injected into 3 mice. (B) Spleen weights were
measured following necropsy at 12 weeks after transplantation, as shown by graph (left
panel) and representative images (right panel). Pictures are from spleens collected from
mice transplanted with AML#10 (0.19 g) and AML#17 (0.06 g). (C) Engraftment was
assessed by flow cytometry detection of hCD45 PE Cy7 +hCD33 APC+ double positive
BM cells consistent with human AML, as depicted by representative FACS pseudocolor
plots. (D) No statistically significant differences were detected in marrow engraftment
AML#10
AML#17
BM
hCD33
hC
D4
5
AML#1 AML#20
A B
D
Low TRIB2 Medium to High TRIB20.1
1
10
100 AML#1
AML#4
AML#10
AML#15
BM
AML#17
AML#20
%h
CD
33+
hC
D45+
cells
Low TRIB2 Medium to High TRIB20.1
1
10
100 AML#1
AML#4
AML#10
AML#15
BM
AML#17
AML#20
%h
CD
33+
hC
D45+
cells
Low TRIB2 Medium to High TRIB20.1
1
10
100 AML#1
AML#4
AML#10
AML#15
BM
AML#17
AML#20
%h
CD
33+
hC
D45+
cells
Low TRIB2 Medium to High TRIB20.1
1
10
100 AML#1
AML#4
AML#10
AML#15
BM
AML#17
AML#20
%h
CD
33+
hC
D45+
cells
Low TRIB2 Medium to High TRIB20.1
1
10
100 AML#1
AML#4
AML#10
AML#15
BM
AML#17
AML#20
%h
CD
33+
hC
D45+
cells
Low TRIB2 Medium to High TRIB20.1
1
10
100AML#1
AML#4
AML#10
AML#15
BM
AML#17
AML#20
%hCD33+hCD45+ cells
AM
L#1
AM
L#4
AM
L#10
AM
L#15
AM
L#17
AM
L#20
0.00
0.05
0.10
0.15
0.20
Sp
leen
weig
ht
(g)
Baytr
il
An
aly
sis
AML patient
samples
-2 -1 0 3 5 7 8 12
(weeks)
PB analysis
.
1x2.2
5/2.5
Gy
C
0.1
1
10
100
AML#1
AML#4
AML#10
AML#15
AML#17
AML#20
n.s.
Low TRIB2 Medium to high TRIB2
%h
CD
45+
hC
D33+
BM
cells
92
(> 0.1%) based on low vs medium to high TRIB2 expression. Blue line in bar graph
indicates a high level of engraftment of 10% of murine BM replaced with human AML
(4/18 mice) detected in both cohorts. For (B) and (D), each symbol denotes a single mouse
and horizontal bars represent mean values for a given cohort. Mice transplanted with AML
samples expressing low TRIB2 are highlighted in black whereas grey colour indicates mice
injected with primary leukaemic cells with medium to high TRIB2 expression; n.s., not
significant by Student´s t- test.
3.4 Discussion
TRIB2 has been reported as a cancer driver in a variety of malignancies. Here, it is shown
that in the majority of cancers retrieved from COSMIC database, in which AML is
included, TRIB2 oncogenic activity is related to its elevated gene expression rather than
associated with different genomic alterations or mutations. This conclusion amplifies
previous observations reporting a tumorigenic role for TRIB2 in melanoma and lung cells
found to overexpress this gene (Zanella et al., 2010, Grandinetti et al., 2011). Moreover,
Trib2 ability to induce murine leukaemia also resulted from its overexpression. In addition,
increased expression is unlikely to be a result of elevated gene copy number, as CNV was
rarely found across the different tumours tissues analysed here, underscoring an important
role for regulators of TRIB2 expression in cancer. Indeed, in a recent paper published
during the course of the present study, a feedback loop mechanism for the positive
upregulation of TRIB2 expression in AML was detailed. TRIB2 expression was shown to
be regulated in AML cells by E2F1, that cooperates with the C/EBPα p30 oncogenic
isoform to activate the TRIB2 promoter, while in normal GMPs the wild type C/EBPα p42
is bound to the TRIB2 promoter (Rishi et al., 2014).
The finding that mouse BM cells overexpressing Trib2 gene could be propagated in vivo
for three passages, retaining robust levels of engraftment accompanied by shorter latency,
demonstrates their self-renewal properties and long-term leukaemogenic potential. In
previous work (Keeshan 2006), serial transplantations to tertiary recipients were not
performed. Data presented here show that Trib2 effectively and serially engrafts to tertiary
recipients, maintains the primary AML phenotype and is not associated with secondary
genomic instability characteristics, such as chromosomal alterations. Moreover, central
nervous system (CNS) involvement detected in the tertiary recipients underpins
aggressiveness of Trib2-induced leukaemia, as it can be a serious complication during the
clinical course of patients with AML (Dohner et al., 2010), and hints at a possible use of
93
this model to investigate mechanisms and treatment of CNS leukaemia. When murine
Trib2-BM cells were kayotyped for a more comprehensive analysis of this leukaemia, they
were found in the absence of cytogenetically detectable rearrangements. It is noteworthy
that other single genes reported to be overexpressed in AML (BAALC (Tanner et al., 2001,
Baldus et al., 2003), ERG (Marcucci et al., 2005) and MN1 (Heuser et al., 2005)) have
been associated with adverse human leukaemia prognosis also in the large subset of CN-
AML. This may be indicative that TRIB2 overexpression is rooted in the cytogenetically
normal group, which could be of particular relevance to help defining a heterogeneous
subtype for which the WHO classification fails to predict outcome. Indeed, recent studies
have evaluated the usefulness of global gene-expression profiling to identify prognostic
subgroups within the CN-AML patients (Baldus et al., 2007). TRIB2 overexpression does
not seem, however, to be restricted to this cytogenetic subset of AML since it was shown
to occur in AML patients with abnormal karyotypes (AML#23 and 27, Figure 3.8).
In contrast to the existing knowledge on Trib2 function in driving murine AML in vivo, the
study of TRIB2 role in human AML settings is limited to expression analysis to date. With
that in mind, TRIB2 function in the context of myeloid malignancies was characterized and
strengthened in a human leukaemia setting. Functional assays clearly showed importance
of TRIB2 expression for survival of U937 AML cells in liquid culture, which displayed an
altered cellular phenotype after gene knockdown. TRIB2-specific suppression by means of
two shRNA constructs led to impaired growth, as a consequence of both an increase in
apoptosis and a decrease in cell proliferation. Cell culture-based systems are, however,
limited on their ability to recapitulate primary disease as they cannot replicate cell extrinsic
interactions with the immune cells or BM niche. Murine xenograft models, albeit limited in
their ability to address leukaemia-immune cell interactions, are suitable to explore human
cell specific biology in an in vivo environment (Cook and Pardee, 2013). Moreover, the use
of well-established, easily grown human cell lines in NSG xeno-engraftment studies has
the unique advantage of providing a model that recapitulates human disease in a timeframe
of days or weeks, even if the extent to which they retain features of the original disease in
vivo is a matter of debate (Kamb, 2005). Therefore, lentiviral knockdown of TRIB2 in
U937 AML cells was performed and xenotransplantation into NSG mice used as a
surrogate assay to study the modulating effect of TRIB2 on AML aggressiveness in vivo.
Consistent with the results obtained in vitro, progression of the AML xenografts was
significantly impaired (P≤0.001) following TRIB2 knockdown, accompanied by detection
of a lower spleen weight in this cohort. A significant growth advantage during in vivo
leukaemogenesis for cells that continue to express TRIB2 was, thus, suggested by the short
94
latency U937-NSG model, supporting the view that this gene is functionally important in
the maintenance of the malignant phenotype of human AML cells. Based on the
phenotypic changes observed upon TRIB2 knockdown, it was thus hypothesised that gene
depletion could elicit downstream transcriptional modifications in genes related with the
detected apoptotic response and cell cycle arrest. Indeed the overall expression pattern
observed in cells collected at an earlier time point (48 h after transduction) suggested an
increase in pro-apoptotic genes discreetly supported by a decrease in anti-apoptotic genes.
This gene analysis has led to the identification of a smaller subset of genes that could
explain, to some extent, the observed TRIB2-dependent phenotype. Based on the
observation that the cell-cycle regulator P27KIP1 and BIM, were consistently upregulated
upon TRIB2 knockdown, it was questioned whether FOXO3a, an upstream mediator of
both these genes could be implicated by mediating TRIB2 regulation of both genes. The
pro-apoptotic BIM is a transcriptional target of FOXO, which is in turn downregulated by
TRIB2 in melanoma cells after cytoplasmic sequestration. No change in total FOXO3a
subcellular localization was detected by western blotting after TRIB2 knockdown (data not
shown). Although not extensively explored here, effects on FOXO3a function rather than
expression are possible given the known relationship between TRIB2 and FOXO3a in
melanoma cells (Zanella et al., 2010).
TRIB2 expression analysis in a cohort of AML patient samples revealed a significant
number with elevated transcript levels comparable to that of the U937 cells, the human
AML cell line found to express the highest TRIB2 expression within a group of AML cell
lines. This result disagrees with a previous study reporting TRIB2 expression to be overall
low across AML karyotypes or FAB subtypes assessed from publically available
microarray datasets (Liang et al., 2013). It is conceivable that differences are likely
attributed to the criteria used to define expression levels. Previous studies reporting TRIB2
overexpression in malignant melanoma and lung cancer (Zanella et al., 2010, Grandinetti
et al., 2011) suggest that mRNA analysis of this oncogene would be better assessed by
comparing tumor tissue of a given patient with its matched normal counterpart. In light of
the observed TRIB2 mRNA levels, it would be extremely interesting to evaluate C/EBP
protein status in these samples, given that elevated TRIB2 expression has been linked with
a subset of human AML characterized by deregulation of this transcription factor (Keeshan
et al., 2006) and that C/EBPα is a downstream factor of TRIB2 proteolytic activity. TRIB2
was recently identified as a meaningful biomarker in malignant melanoma, as its
expression strongly correlates with disease stage and clinical prognosis, predicting, as well,
clinical response to chemotherapy (Hill et al., 2015). High risk B-cell chronic lymphocytic
95
leukaemia (B-CLL) patients were also associated with differentially expressed TRIB2
(Johansson et al., 2010). Hence, it would be of interest to know the relapse rate, overall
survival, disease-free survival and complete remission rate of the analysed leukaemic
patients to assess if dichotomization based on TRIB2 expression is meaningful as a
diagnostic marker in the context of AML.
The presence of FLT3 mutations in AML patient samples correlates with an enhanced
ability to engraft in NOD/SCID (Rombouts et al., 2000) and NSG (Sanchez et al., 2009)
mice when compared with FLT3 wild-type-containing human AML. Also, AML harboring
DNMT3A mutations, which predict for adverse outcome, were shown to engraft with
exceptional efficiency (Barth et al., 2014), supporting the view that a correlation exists
between xeno-engraftment potential and disease aggressiveness in humans. With that in
mind, the NSG model was used to investigate the in vivo leukaemia-initiating capacity of
human primary AML cells with dichotomized levels of TRIB2 transcripts while assessing
whether increased expression of this gene could be afforded a prognostic significance. The
severe impairment of NSG innate immunity and the associated prolonged life span have
made them the gold standard for long-term studies of primary human AML engraftment.
Indeed, a global analysis suggests that a robust engraftment can be attained with this
model, as BM was shown to be replaced by >0.1% hCD45+hCD33+ AML cells. When
ability to repopulate NSG mice was analysed in terms of TRIB2 expression, higher
transcript levels in AML patients did not correlate with preferential leukaemic cell
engraftment. However, caution should be used when concluding differences based on
TRIB2 expression since a number of other factors could be implicated in differential levels
of engraftment, namely, elements of BM homing, survival in a foreign niche, expansion in
the absence of specific human growth factors and supporting stromal cells, as well as
intrinsic differences among AML samples (as exemplified by poor-risk associated
AML#1). Further experiments including a larger cohort of well characterized AML
patients would be needed to clarify TRIB2 significance in a diagnostic setting.
Taken together, these findings establish a functional role for deregulated TRIB2 expression
in the pathogenesis of human AML and provided a contextual framework to further
investigate this oncogene as a therapeutic target, as next described.
96
Chapter 4 Proteasome inhibition selectively targets AML
with high TRIB2 expression
When indicated, results presented in this chapter have been published in (O'Connor et al.,
2016) and the PDF of the publication is provided in Appendix G.
97
4.1 Introduction
AML is primarily a disease of elderly people for whom prognosis remains consistently
dismal in spite of the past few decades‟ improvement in the overall outlook for younger
patients. In addition, the mainstays of AML therapy have remained unchanged for the last
30 years (Tallman et al., 2005, Burnett, 2013, Ferrara and Schiffer, 2013). The
combination of cytarabine (e.g., cytosine arabinose, Ara-C) with an anthracycline (e.g.,
daunorubicin, idarubicin) is the backbone of induction therapy, which has become the
standard of care for patients not participating in a clinical trial. These patients receive
cytarabine as a continuous intravenous infusion for 7 consecutive days, while anthracycline
is given for 3 consecutive days as an intravenous push. The tolerance of elderly patients to
this therapy is limited by host-related factors, as well as by the frequent development of
myelodysplasia, unfavourable karyotypes and overexpression of the multidrug-resistance
gene MDR-1 at diagnosis (Smith et al., 2004). The main exception to the traditional
cytotoxic chemotherapy known as “7+3” is the use of all-trans retinoic acid (ATRA), a
derivative of vitamin A (or retinol) that has held great promise for differentiation-based
therapy. ATRA, in combination with low-dose chemotherapy, is effective on the rare M3
acute promyelocytic leukaemia (APL) subtype (5-10% of AML) (Tallmann, 2004).
Typically, this subtype carries the leukaemia-generating PML-RARα fusion protein, which
results from t(15;17) translocation (Melnick and Licht, 1999). Pharmacological
concentrations of the retinoic acid receptor (RAR)-specific ligand ATRA cause a
conformational change of PML-RARα, which acts as a dominant negative inhibitor of the
WT RARα. Co-repressors are then released, normal RARα- responsive gene regulation is
restored and terminal APL cell differentiation into mature granulocytes is induced (Jing
and Waxman, 2007). Unfortunately, ATRA is not clinically useful for other AML
subtypes. Most non-APL leukaemia cells respond to ATRA but only at high
concentrations, which leads to important cytotoxic effects (Gupta et al., 2012). Therefore,
research strategies that seek to further extend treatment efficacy to non-APL cells are key.
The use of small-molecule drugs designed to inhibit the proteasome degradation pathway
has sparked intensive research for the treatment of a variety of cancers, including AML. In
fact, clinical trials for AML patients have been conducted and are currently on going to
evaluate Brtz and identify drug combinations showing therapeutic efficacy. Despite the
lack of single agent activity (Cortes et al., 2004, Horton et al., 2007), Brtz has shown
promising results when used in combination regimens for AML. Two phase I studies for
poor-risk groups demonstrated the feasibility and preliminary clinical activity of Brtz in
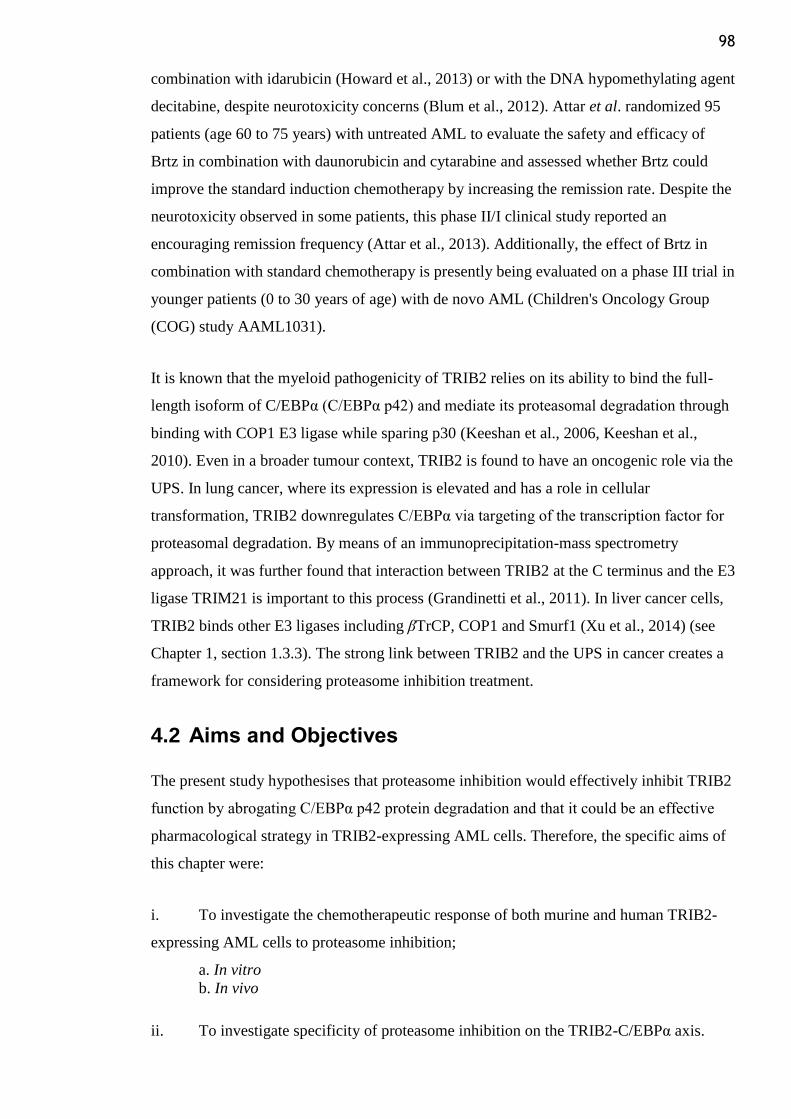
98
combination with idarubicin (Howard et al., 2013) or with the DNA hypomethylating agent
decitabine, despite neurotoxicity concerns (Blum et al., 2012). Attar et al. randomized 95
patients (age 60 to 75 years) with untreated AML to evaluate the safety and efficacy of
Brtz in combination with daunorubicin and cytarabine and assessed whether Brtz could
improve the standard induction chemotherapy by increasing the remission rate. Despite the
neurotoxicity observed in some patients, this phase II/I clinical study reported an
encouraging remission frequency (Attar et al., 2013). Additionally, the effect of Brtz in
combination with standard chemotherapy is presently being evaluated on a phase III trial in
younger patients (0 to 30 years of age) with de novo AML (Children's Oncology Group
(COG) study AAML1031).
It is known that the myeloid pathogenicity of TRIB2 relies on its ability to bind the full-
length isoform of C/EBPα (C/EBPα p42) and mediate its proteasomal degradation through
binding with COP1 E3 ligase while sparing p30 (Keeshan et al., 2006, Keeshan et al.,
2010). Even in a broader tumour context, TRIB2 is found to have an oncogenic role via the
UPS. In lung cancer, where its expression is elevated and has a role in cellular
transformation, TRIB2 downregulates C/EBPα via targeting of the transcription factor for
proteasomal degradation. By means of an immunoprecipitation-mass spectrometry
approach, it was further found that interaction between TRIB2 at the C terminus and the E3
ligase TRIM21 is important to this process (Grandinetti et al., 2011). In liver cancer cells,
TRIB2 binds other E3 ligases including βTrCP, COP1 and Smurf1 (Xu et al., 2014) (see
Chapter 1, section 1.3.3). The strong link between TRIB2 and the UPS in cancer creates a
framework for considering proteasome inhibition treatment.
4.2 Aims and Objectives
The present study hypothesises that proteasome inhibition would effectively inhibit TRIB2
function by abrogating C/EBPα p42 protein degradation and that it could be an effective
pharmacological strategy in TRIB2-expressing AML cells. Therefore, the specific aims of
this chapter were:
i. To investigate the chemotherapeutic response of both murine and human TRIB2-
expressing AML cells to proteasome inhibition;
a. In vitro
b. In vivo
ii. To investigate specificity of proteasome inhibition on the TRIB2-C/EBPα axis.
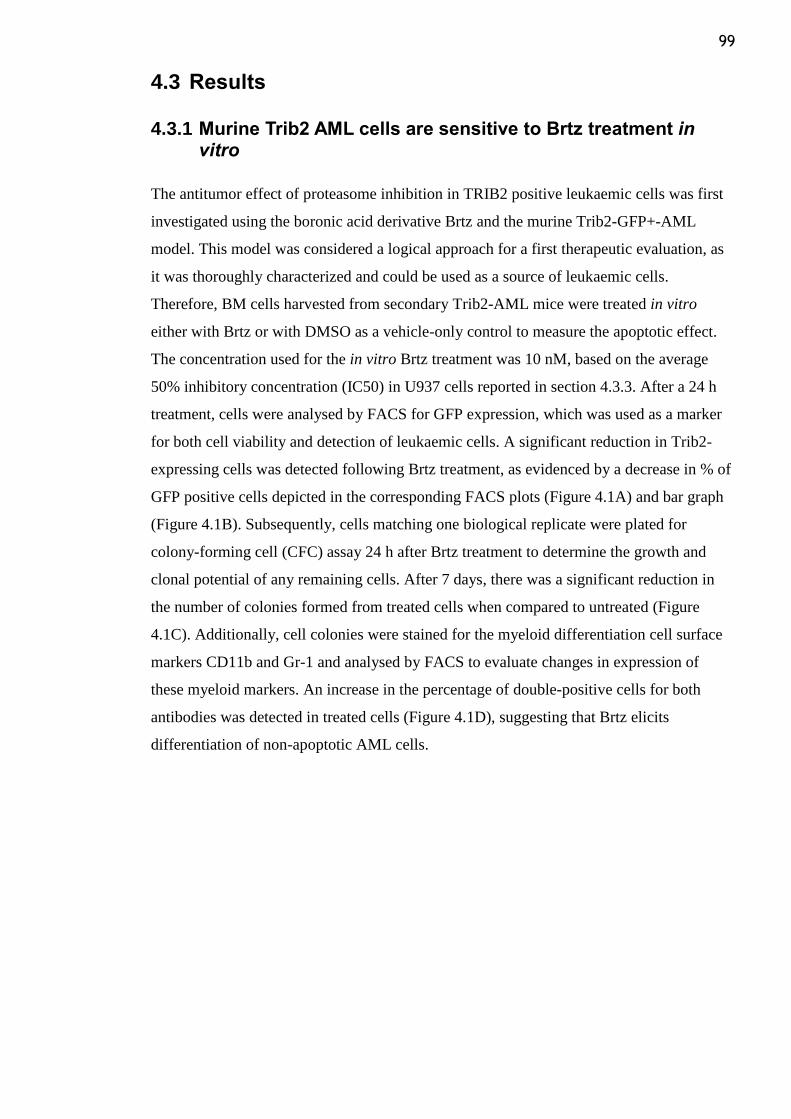
99
4.3 Results
4.3.1 Murine Trib2 AML cells are sensitive to Brtz treatment in vitro
The antitumor effect of proteasome inhibition in TRIB2 positive leukaemic cells was first
investigated using the boronic acid derivative Brtz and the murine Trib2-GFP+-AML
model. This model was considered a logical approach for a first therapeutic evaluation, as
it was thoroughly characterized and could be used as a source of leukaemic cells.
Therefore, BM cells harvested from secondary Trib2-AML mice were treated in vitro
either with Brtz or with DMSO as a vehicle-only control to measure the apoptotic effect.
The concentration used for the in vitro Brtz treatment was 10 nM, based on the average
50% inhibitory concentration (IC50) in U937 cells reported in section 4.3.3. After a 24 h
treatment, cells were analysed by FACS for GFP expression, which was used as a marker
for both cell viability and detection of leukaemic cells. A significant reduction in Trib2-
expressing cells was detected following Brtz treatment, as evidenced by a decrease in % of
GFP positive cells depicted in the corresponding FACS plots (Figure 4.1A) and bar graph
(Figure 4.1B). Subsequently, cells matching one biological replicate were plated for
colony-forming cell (CFC) assay 24 h after Brtz treatment to determine the growth and
clonal potential of any remaining cells. After 7 days, there was a significant reduction in
the number of colonies formed from treated cells when compared to untreated (Figure
4.1C). Additionally, cell colonies were stained for the myeloid differentiation cell surface
markers CD11b and Gr-1 and analysed by FACS to evaluate changes in expression of
these myeloid markers. An increase in the percentage of double-positive cells for both
antibodies was detected in treated cells (Figure 4.1D), suggesting that Brtz elicits
differentiation of non-apoptotic AML cells.
100
Figure 4.1Trib2 murine BM cells are sensitive to in vitro Brtz treatment
(A) BM cells collected from secondary recipient mice with Trib2-induced leukaemia were
treated in vitro with either Brtz (10 nM) or DMSO. After 24 h, GFP expression was
quantified. Data are shown by representative FACS pseudocolor plots and (B)
representative bar graph of 3 independent experiments with mean ± SD of 3 biological
replicates (3 samples x 3 mice, considered as 3 independent experiment performed in
triplicate). (C) Brtz or DMSO treated cells from one biological replicate were plated for
CFC assay. Colonies were scored at day 7 and were normalized to % of GFP positive cells
(error bar represents the mean ± SD of 2 technical replicates). (D) On day 11 of CFC assay
the myeloid phenotype was assessed by FACS analysis of CD11b-PE and Gr-1-APC of the
GFP+ population, as shown by representative contour plots. ***P≤0.001, *P≤0.05 by
Student´s t-test.
A B
C D
GFP- GFP +46.2% 52.3%
GFP- GFP +97.4% 0.12%
DMSO 10nM Brtz
GFP%
FS
C-A
DMSO 10nM Brtz0
10
20
30
40
50
60***
% G
FP
+ c
ells
CFC assay after 24h Brtz treatment
DMSO 10nM Brtz 0
50
100
150
200 *
Trib2 AML
Nu
mb
er
of
co
lon
ies
CD11b
Gr-
1D
MSO
Brt
z
Trib2 AML
41.5 43.5
26.8
58.4 56.4
30.8 69.1 73.2
101
4.3.2 Brtz preferentially targets murine Trib2 AML cells rather than normal haemopoietic cells
To investigate whether targeting the UPS, a universal and broadly active cellular
component, provides the selectivity and specificity required for cancer therapeutics, the
proteasome inhibitor activity was assessed in normal bulk BM cells from wild type mice.
Furthermore, it was evaluated whether a consistent result would be detected in normal BM
stem cell populations. The stem cell populations were purified as outlined in section 2.7.6
of the methods section. Thus, both total normal BM cells and the most primitive (LSK) and
more differentiated (lineage+) populations were treated with Brtz (10 nM) and DMSO for
24 h in vitro as described in section 2.1.8 of Chapter 2. Cell survival was analysed by
staining with Annexin V and DAPI, and no significant differences were detected when
comparing treated versus untreated cells in all populations (Figure 4.2A) at a concentration
shown to have pro-apoptotic effect on Trib2 leukaemic murine BM cells. Consistent with
these results, the myeloid phenotype (CD11b/Gr-1) of LSK and lineage positive cells did
not show any change after the 24 h treatment, which rules out Brtz-induced differentiation
at this time point (Figure 4.2B). Taken together with the data from section 4.3.1, the results
suggest that Brtz is selectively pro-apoptotic towards leukaemic cells, while sparing
normal BM cells.
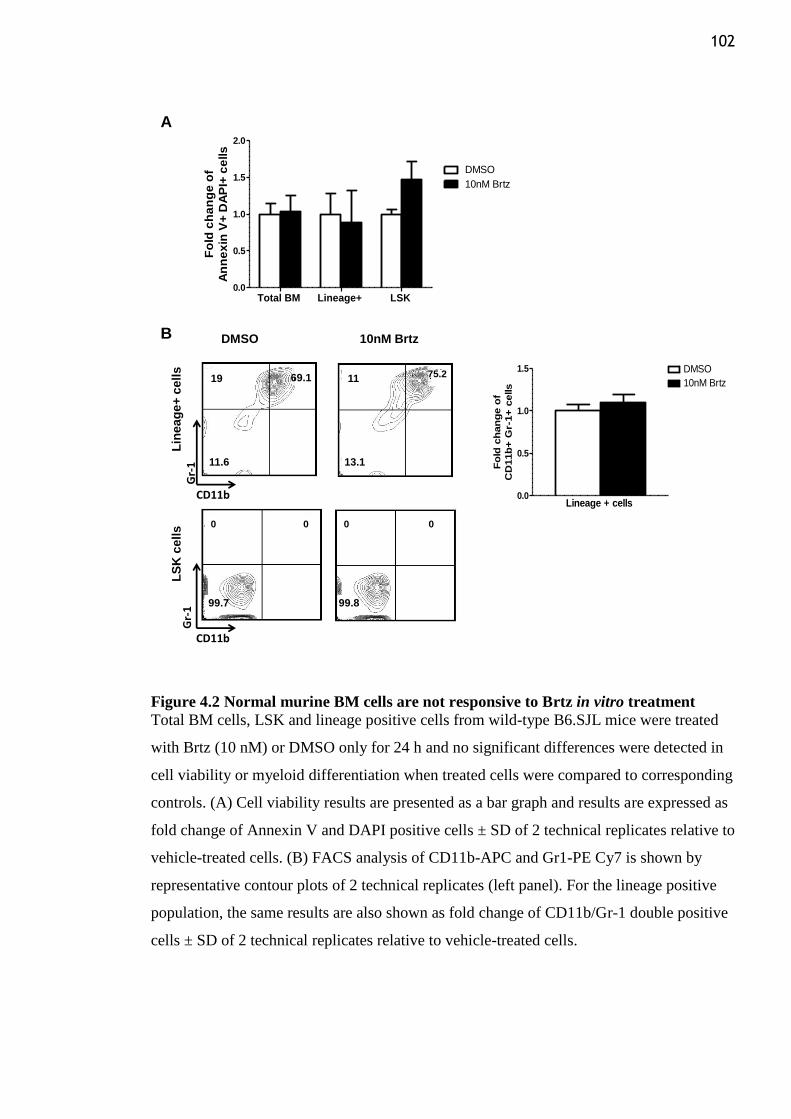
102
Figure 4.2 Normal murine BM cells are not responsive to Brtz in vitro treatment
Total BM cells, LSK and lineage positive cells from wild-type B6.SJL mice were treated
with Brtz (10 nM) or DMSO only for 24 h and no significant differences were detected in
cell viability or myeloid differentiation when treated cells were compared to corresponding
controls. (A) Cell viability results are presented as a bar graph and results are expressed as
fold change of Annexin V and DAPI positive cells ± SD of 2 technical replicates relative to
vehicle-treated cells. (B) FACS analysis of CD11b-APC and Gr1-PE Cy7 is shown by
representative contour plots of 2 technical replicates (left panel). For the lineage positive
population, the same results are also shown as fold change of CD11b/Gr-1 double positive
cells ± SD of 2 technical replicates relative to vehicle-treated cells.
CD11b
Gr-
1
Representative FACS dot plots,2 technical duplicates
Gr-
1
CD11b
Lin
ea
ge
+ c
ell
sL
SK
ce
lls
DMSO 10nM Brtz
0 00
99.899.7
0
19 11
13.111.6
75.269.1
A
B
0.0
0.5
1.0
1.5 DMSO
10nM Brtz
Lineage + cellsF
old
ch
an
ge o
f
CD
11b
+ G
r-1+
cells
Total BM Lineage+ LSK 0.0
0.5
1.0
1.5
2.0
DMSO
10nM Brtz
Fo
ld c
ha
ng
e o
f
An
ne
xin
V+
DA
PI+
ce
lls
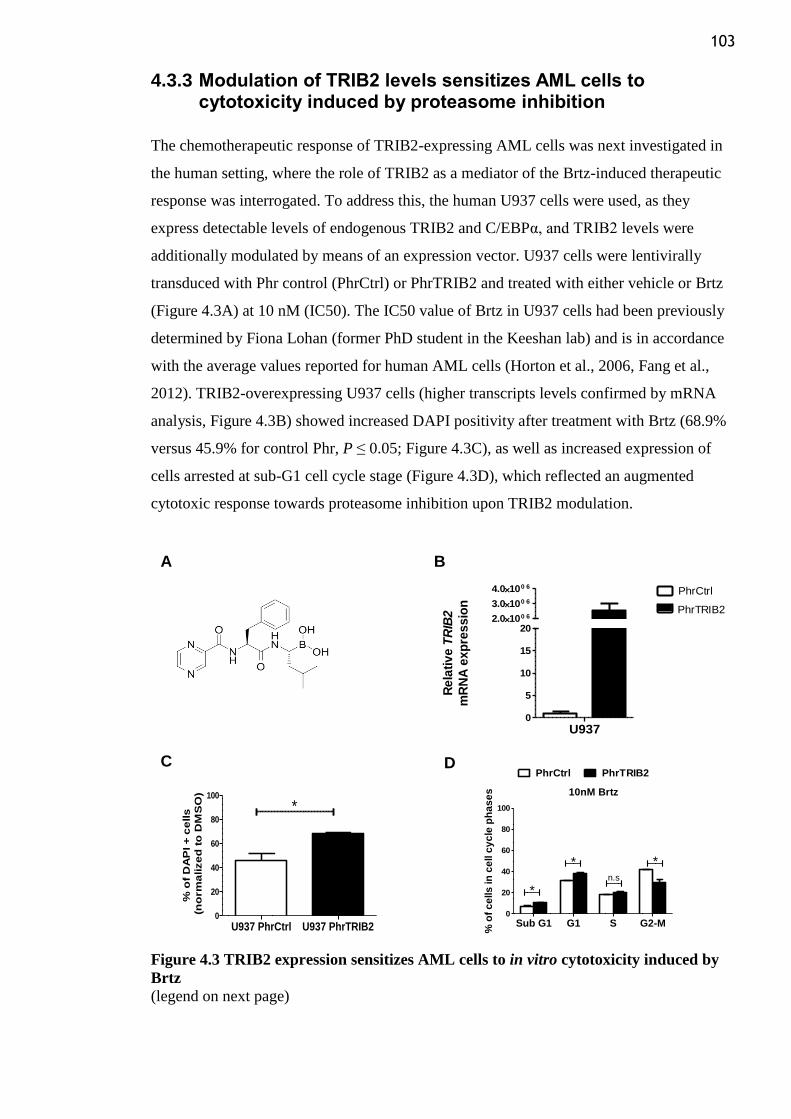
103
4.3.3 Modulation of TRIB2 levels sensitizes AML cells to cytotoxicity induced by proteasome inhibition
The chemotherapeutic response of TRIB2-expressing AML cells was next investigated in
the human setting, where the role of TRIB2 as a mediator of the Brtz-induced therapeutic
response was interrogated. To address this, the human U937 cells were used, as they
express detectable levels of endogenous TRIB2 and C/EBPα, and TRIB2 levels were
additionally modulated by means of an expression vector. U937 cells were lentivirally
transduced with Phr control (PhrCtrl) or PhrTRIB2 and treated with either vehicle or Brtz
(Figure 4.3A) at 10 nM (IC50). The IC50 value of Brtz in U937 cells had been previously
determined by Fiona Lohan (former PhD student in the Keeshan lab) and is in accordance
with the average values reported for human AML cells (Horton et al., 2006, Fang et al.,
2012). TRIB2-overexpressing U937 cells (higher transcripts levels confirmed by mRNA
analysis, Figure 4.3B) showed increased DAPI positivity after treatment with Brtz (68.9%
versus 45.9% for control Phr, P ≤ 0.05; Figure 4.3C), as well as increased expression of
cells arrested at sub-G1 cell cycle stage (Figure 4.3D), which reflected an augmented
cytotoxic response towards proteasome inhibition upon TRIB2 modulation.
Figure 4.3 TRIB2 expression sensitizes AML cells to in vitro cytotoxicity induced by
Brtz
(legend on next page)
A
U9370
5
10
15
202.0100 6
3.0100 6
4.0100 6PhrCtrl
PhrTRIB2
Re
lati
ve
TR
IB2
mR
NA
ex
pre
ssio
n
B
C
10nM Brtz
Sub G1 G1 S G2-M0
20
40
60
80
100
PhrCtrl PhrTRIB2
*
* *n.s
% o
f c
ells
in
ce
ll c
yc
le p
ha
se
s
D
U937 PhrCtrl U937 PhrTRIB20
20
40
60
80
100
*
**
% o
f D
AP
I +
ce
lls
(n
orm
alize
d t
o D
MS
O)
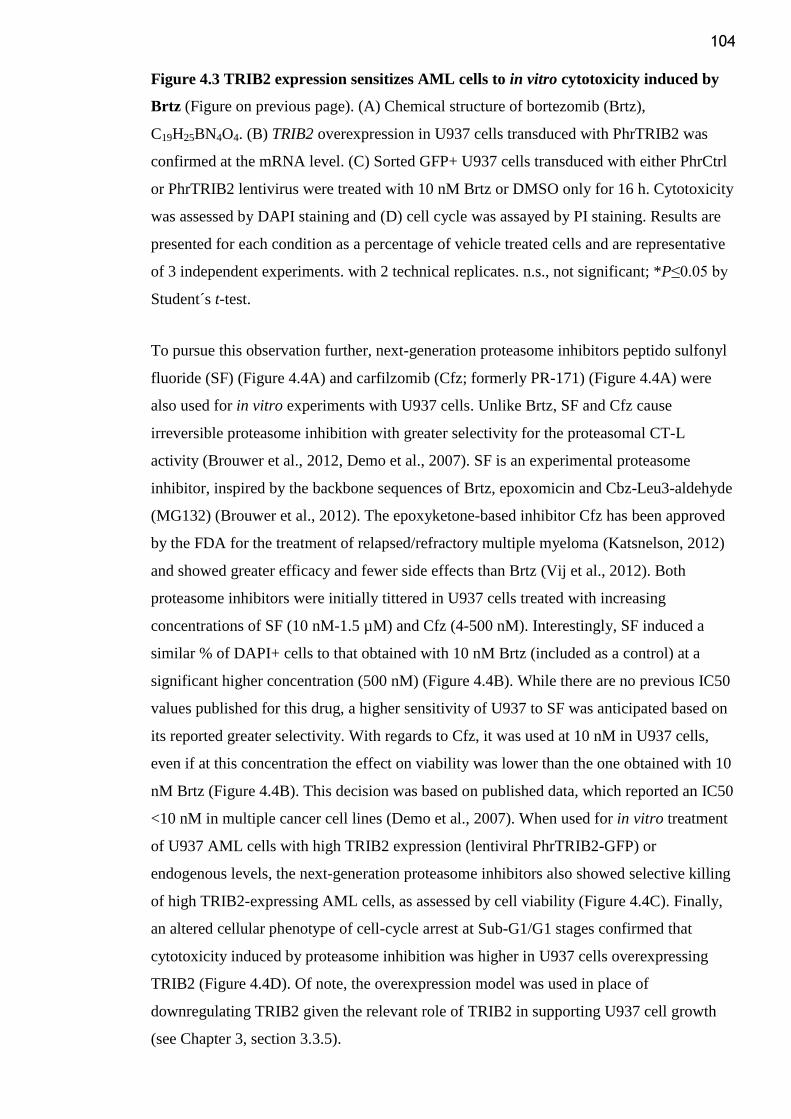
104
Figure 4.3 TRIB2 expression sensitizes AML cells to in vitro cytotoxicity induced by
Brtz (Figure on previous page). (A) Chemical structure of bortezomib (Brtz),
C19H25BN4O4. (B) TRIB2 overexpression in U937 cells transduced with PhrTRIB2 was
confirmed at the mRNA level. (C) Sorted GFP+ U937 cells transduced with either PhrCtrl
or PhrTRIB2 lentivirus were treated with 10 nM Brtz or DMSO only for 16 h. Cytotoxicity
was assessed by DAPI staining and (D) cell cycle was assayed by PI staining. Results are
presented for each condition as a percentage of vehicle treated cells and are representative
of 3 independent experiments. with 2 technical replicates. n.s., not significant; *P≤0.05 by
Student´s t-test.
To pursue this observation further, next-generation proteasome inhibitors peptido sulfonyl
fluoride (SF) (Figure 4.4A) and carfilzomib (Cfz; formerly PR-171) (Figure 4.4A) were
also used for in vitro experiments with U937 cells. Unlike Brtz, SF and Cfz cause
irreversible proteasome inhibition with greater selectivity for the proteasomal CT-L
activity (Brouwer et al., 2012, Demo et al., 2007). SF is an experimental proteasome
inhibitor, inspired by the backbone sequences of Brtz, epoxomicin and Cbz-Leu3-aldehyde
(MG132) (Brouwer et al., 2012). The epoxyketone-based inhibitor Cfz has been approved
by the FDA for the treatment of relapsed/refractory multiple myeloma (Katsnelson, 2012)
and showed greater efficacy and fewer side effects than Brtz (Vij et al., 2012). Both
proteasome inhibitors were initially tittered in U937 cells treated with increasing
concentrations of SF (10 nM-1.5 µM) and Cfz (4-500 nM). Interestingly, SF induced a
similar % of DAPI+ cells to that obtained with 10 nM Brtz (included as a control) at a
significant higher concentration (500 nM) (Figure 4.4B). While there are no previous IC50
values published for this drug, a higher sensitivity of U937 to SF was anticipated based on
its reported greater selectivity. With regards to Cfz, it was used at 10 nM in U937 cells,
even if at this concentration the effect on viability was lower than the one obtained with 10
nM Brtz (Figure 4.4B). This decision was based on published data, which reported an IC50
<10 nM in multiple cancer cell lines (Demo et al., 2007). When used for in vitro treatment
of U937 AML cells with high TRIB2 expression (lentiviral PhrTRIB2-GFP) or
endogenous levels, the next-generation proteasome inhibitors also showed selective killing
of high TRIB2-expressing AML cells, as assessed by cell viability (Figure 4.4C). Finally,
an altered cellular phenotype of cell-cycle arrest at Sub-G1/G1 stages confirmed that
cytotoxicity induced by proteasome inhibition was higher in U937 cells overexpressing
TRIB2 (Figure 4.4D). Of note, the overexpression model was used in place of
downregulating TRIB2 given the relevant role of TRIB2 in supporting U937 cell growth
(see Chapter 3, section 3.3.5).
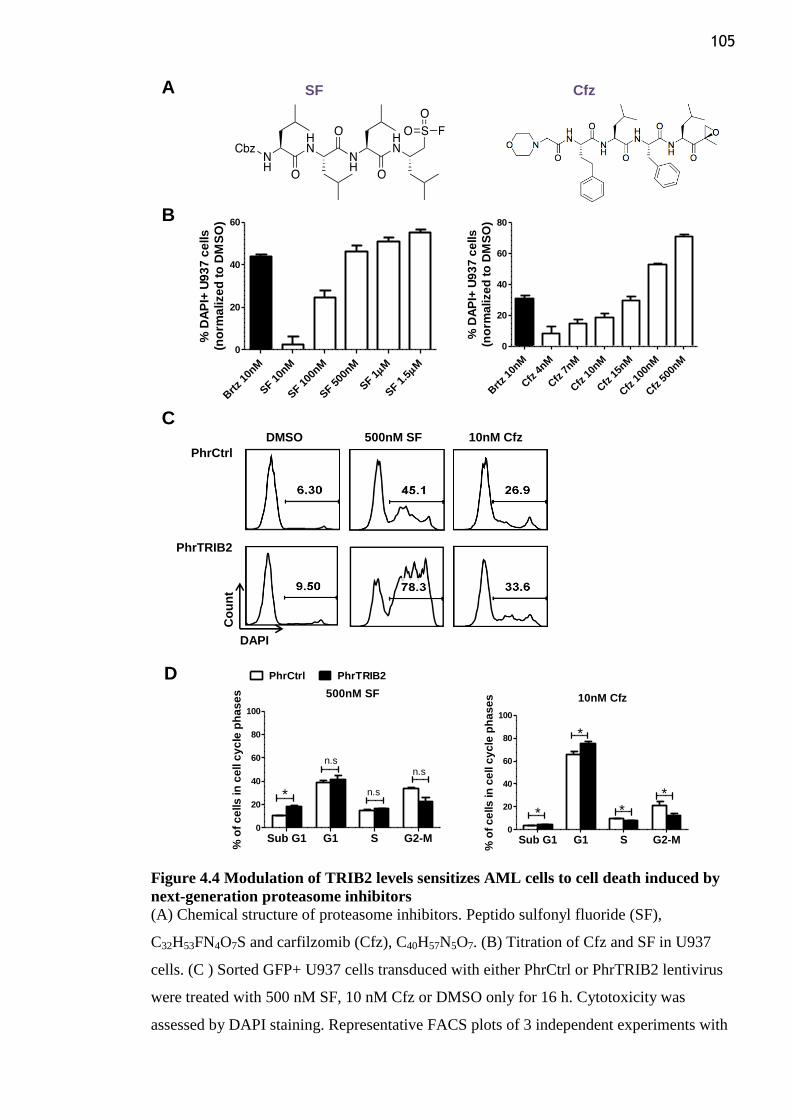
105
Figure 4.4 Modulation of TRIB2 levels sensitizes AML cells to cell death induced by
next-generation proteasome inhibitors
(A) Chemical structure of proteasome inhibitors. Peptido sulfonyl fluoride (SF),
C32H53FN4O7S and carfilzomib (Cfz), C40H57N5O7. (B) Titration of Cfz and SF in U937
cells. (C ) Sorted GFP+ U937 cells transduced with either PhrCtrl or PhrTRIB2 lentivirus
were treated with 500 nM SF, 10 nM Cfz or DMSO only for 16 h. Cytotoxicity was
assessed by DAPI staining. Representative FACS plots of 3 independent experiments with
A
B
C
PhrCtrl
PhrTRIB2
DMSO 500nM SF 10nM Cfz
DAPI
Co
un
t
D
SF Cfz
Brtz 10
nM
SF 1
0nM
SF 1
00nM
SF 5
00nM M
SF 1
M
SF 1
.5
0
20
40
60
% D
AP
I+ U
93
7 c
ells
(no
rma
lize
d t
o D
MS
O)
Brtz 10
nM
Cfz
4nM
Cfz
7nM
Cfz
10n
M
Cfz
15n
M
Cfz
100
nM
Cfz
500
nM
0
20
40
60
80
% D
AP
I+ U
93
7 c
ells
(no
rma
lize
d t
o D
MS
O)
500nM SF
Sub G1 G1 S G2-M0
20
40
60
80
100
*
n.sn.s
n.s
Phr
Legend
% o
f c
ells
in
ce
ll c
yc
le p
ha
se
s 10nM Brtz
Sub G1 G1 S G2-M0
20
40
60
80
100
PhrCtrl PhrTRIB2
*
* *n.s
% o
f c
ells
in
ce
ll c
yc
le p
ha
se
s 10nM Cfz
Sub G1 G1 S G2-M0
20
40
60
80
100
*
*
**
Phr
PhrTRIB2
% o
f c
ells
in
ce
ll c
yc
le p
ha
se
s
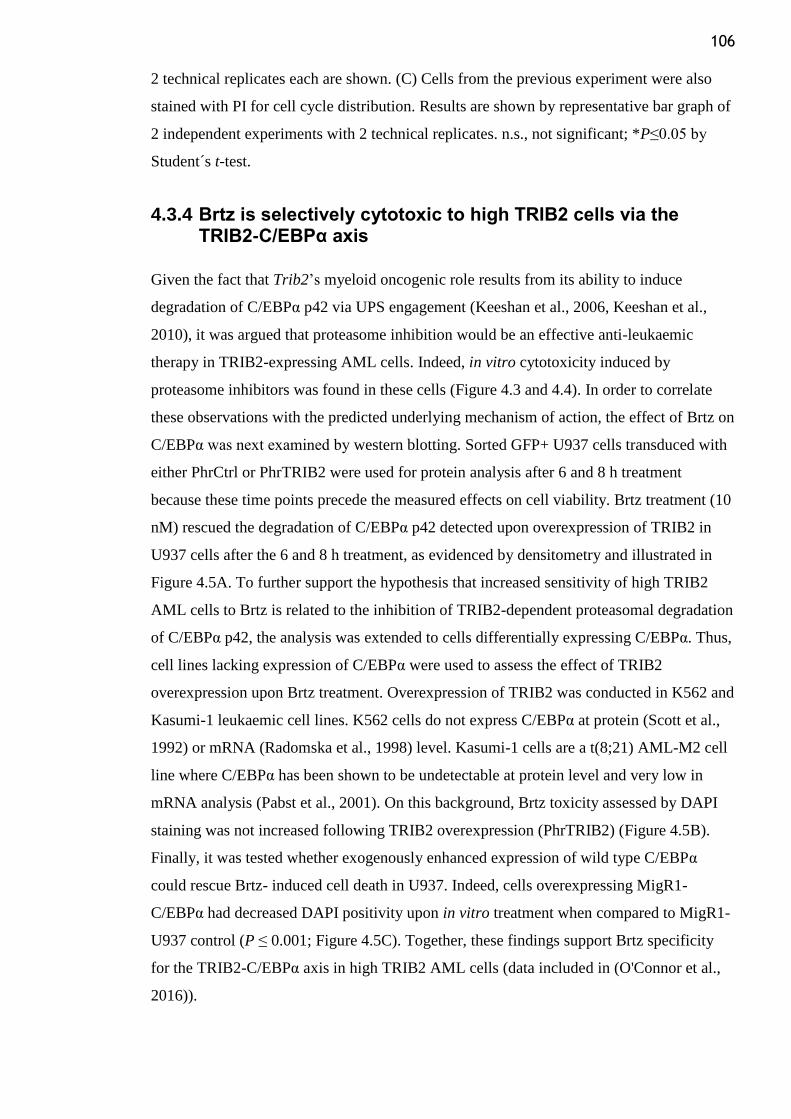
106
2 technical replicates each are shown. (C) Cells from the previous experiment were also
stained with PI for cell cycle distribution. Results are shown by representative bar graph of
2 independent experiments with 2 technical replicates. n.s., not significant; *P≤0.05 by
Student´s t-test.
4.3.4 Brtz is selectively cytotoxic to high TRIB2 cells via the TRIB2-C/EBPα axis
Given the fact that Trib2‟s myeloid oncogenic role results from its ability to induce
degradation of C/EBPα p42 via UPS engagement (Keeshan et al., 2006, Keeshan et al.,
2010), it was argued that proteasome inhibition would be an effective anti-leukaemic
therapy in TRIB2-expressing AML cells. Indeed, in vitro cytotoxicity induced by
proteasome inhibitors was found in these cells (Figure 4.3 and 4.4). In order to correlate
these observations with the predicted underlying mechanism of action, the effect of Brtz on
C/EBPα was next examined by western blotting. Sorted GFP+ U937 cells transduced with
either PhrCtrl or PhrTRIB2 were used for protein analysis after 6 and 8 h treatment
because these time points precede the measured effects on cell viability. Brtz treatment (10
nM) rescued the degradation of C/EBPα p42 detected upon overexpression of TRIB2 in
U937 cells after the 6 and 8 h treatment, as evidenced by densitometry and illustrated in
Figure 4.5A. To further support the hypothesis that increased sensitivity of high TRIB2
AML cells to Brtz is related to the inhibition of TRIB2-dependent proteasomal degradation
of C/EBPα p42, the analysis was extended to cells differentially expressing C/EBPα. Thus,
cell lines lacking expression of C/EBPα were used to assess the effect of TRIB2
overexpression upon Brtz treatment. Overexpression of TRIB2 was conducted in K562 and
Kasumi-1 leukaemic cell lines. K562 cells do not express C/EBPα at protein (Scott et al.,
1992) or mRNA (Radomska et al., 1998) level. Kasumi-1 cells are a t(8;21) AML-M2 cell
line where C/EBPα has been shown to be undetectable at protein level and very low in
mRNA analysis (Pabst et al., 2001). On this background, Brtz toxicity assessed by DAPI
staining was not increased following TRIB2 overexpression (PhrTRIB2) (Figure 4.5B).
Finally, it was tested whether exogenously enhanced expression of wild type C/EBPα
could rescue Brtz- induced cell death in U937. Indeed, cells overexpressing MigR1-
C/EBPα had decreased DAPI positivity upon in vitro treatment when compared to MigR1-
U937 control (P ≤ 0.001; Figure 4.5C). Together, these findings support Brtz specificity
for the TRIB2-C/EBPα axis in high TRIB2 AML cells (data included in (O'Connor et al.,
2016)).
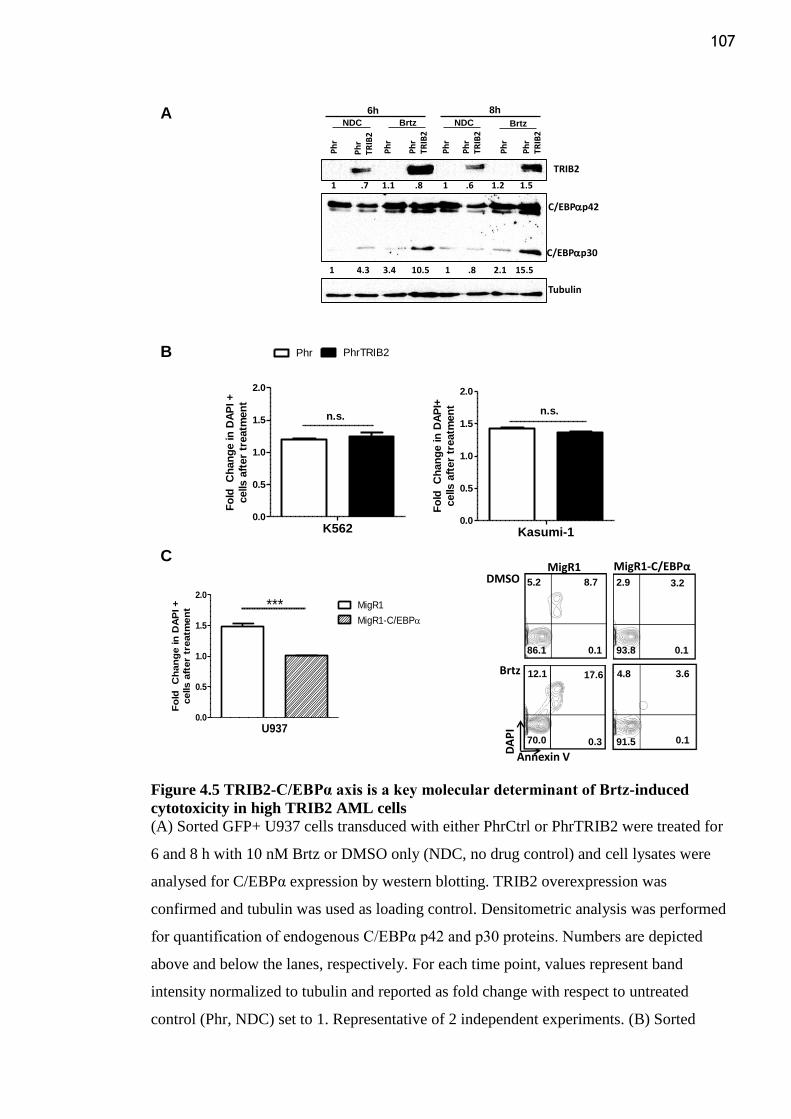
107
Figure 4.5 TRIB2-C/EBPα axis is a key molecular determinant of Brtz-induced
cytotoxicity in high TRIB2 AML cells
(A) Sorted GFP+ U937 cells transduced with either PhrCtrl or PhrTRIB2 were treated for
6 and 8 h with 10 nM Brtz or DMSO only (NDC, no drug control) and cell lysates were
analysed for C/EBPα expression by western blotting. TRIB2 overexpression was
confirmed and tubulin was used as loading control. Densitometric analysis was performed
for quantification of endogenous C/EBPα p42 and p30 proteins. Numbers are depicted
above and below the lanes, respectively. For each time point, values represent band
intensity normalized to tubulin and reported as fold change with respect to untreated
control (Phr, NDC) set to 1. Representative of 2 independent experiments. (B) Sorted
A
B
Ph
rTR
IB2
Ph
r
Ph
rTR
IB2
Ph
r
Ph
rTR
IB2
Ph
r
Ph
rTR
IB2
Ph
r
8h
TRIB2
Tubulin
C/EBPp42
NDC Brtz
6h
BrtzNDC
1 .7 1.1 .8 1 .6 1.2 1.5
C/EBPp30
1 4.3 3.4 10.5 1 .8 2.1 15.5
C
U9370.0
0.5
1.0
1.5
2.0MigR1
MigR1-C/EBP
***
Fo
ld
Ch
an
ge in
DA
PI +
cells a
fter
treatm
en
t
DMSO
Brtz
MigR1
Annexin V
DA
PI
MigR1-C/EBPα8.7 3.2
3.617.6
5.2
12.1
2.9
4.8
Kasumi-10.0
0.5
1.0
1.5
2.0
n.s.
Fo
ld
Ch
an
ge in
DA
PI+
cells a
fter
treatm
en
t
K5620.0
0.5
1.0
1.5
2.0
Phr PhrTRIB2
n.s.
Fo
ld
Ch
an
ge in
DA
PI +
cells a
fter
treatm
en
t
0.1 0.1
0.10.3 91.5
93.8
70.0
86.1
108
GFP+ K562 and Kasumi-1 cells transduced with Phr control or Phr-TRIB2 lentivirus were
treated with 10 nM Brtz or DMSO only for 16 h and analysed by flow cytometry for cell
death by DAPI staining. Results are fold change of DAPI positive cells ± SD of 2/3
technical replicates relative to vehicle-treated cells and are representative of 3 independent
experiments. (n.s, not significant by Student´s t-test). (C) Sorted GFP+ U937 cells
transduced with MigR1 control or MigR1-C/EBPα retrovirus were treated +/- 10 nM Brtz
for 16 h and analysed by flow cytometry for cell death by DAPI staining. Results are
shown by fold change of DAPI positive cells ± SD of 2/3 technical replicates relative to
vehicle-treated cells (left panel) and contour plots (right panel) and are representative of 3
independent experiments (***P≤0.001 by Student´s t-test).
4.3.5 High TRIB2 AML cells are chemosensitive to proteasome inhibition in vivo
To investigate whether chemosensitivity of high TRIB2 AML cells to Brtz could be
recapitulated in vivo and, consequently, assess the potential clinical significance of these
findings, a human AML xenograft model was established. The short latency U937-NSG
model was used, as it was proven to be a fast and robust AML model, here (Chapter 3) and
by others (Banerji et al., 2012). Importantly, it was previously shown that AML
development in this model is tightly correlated with TRIB2 expression (Chapter 3), which
makes this a suitable in vivo setting to investigate the TRIB2-dependent effect of Brtz.
GFP+ U937 (shCtrl lentivirus) cells were, therefore, propagated in NSG recipients. Mice
were treated at d5, 7 and 11 with i.p. injections of PBS or Brtz at the clinically relevant
dose of 0.5 mg/kg (Liu et al., 2013). Blood samples were taken at d5 and 11 before drug
administration and the mice were sacrificed at day 16 (Figure 4.6A), following the same
experimental time course depicted in Chapter 3, section 3.3.6. Brtz significantly impaired
the engraftment of the TRIB2 expressing U937 cells when compared to vehicle-treated
animals, as detected by lower BM % of engrafting GFP+ cells, also positive for human
antibody CD45 expression (Figure 4.6C). The treatment protocol was designed using
previous studies as guidelines for toxicity assessment (Luo et al., 2011, Schueler et al.,
2013, Ying et al., 2013). Importantly, the Brtz dose and schedule were well tolerated
throughout the course of the study. There was no significant weight loss from d0 to d16
(Figure 4.6B , <10%, as defined in (Kamb, 2005),) nor any changes in the overall well-
being of treated mice that would be indicative of drug-associated toxicity. No signs of
gross pathological abnormalities of the major organs were noted at mice necropsy
examination. These findings support Brtz pre-clinical efficacy in TRIB2-expressing AML
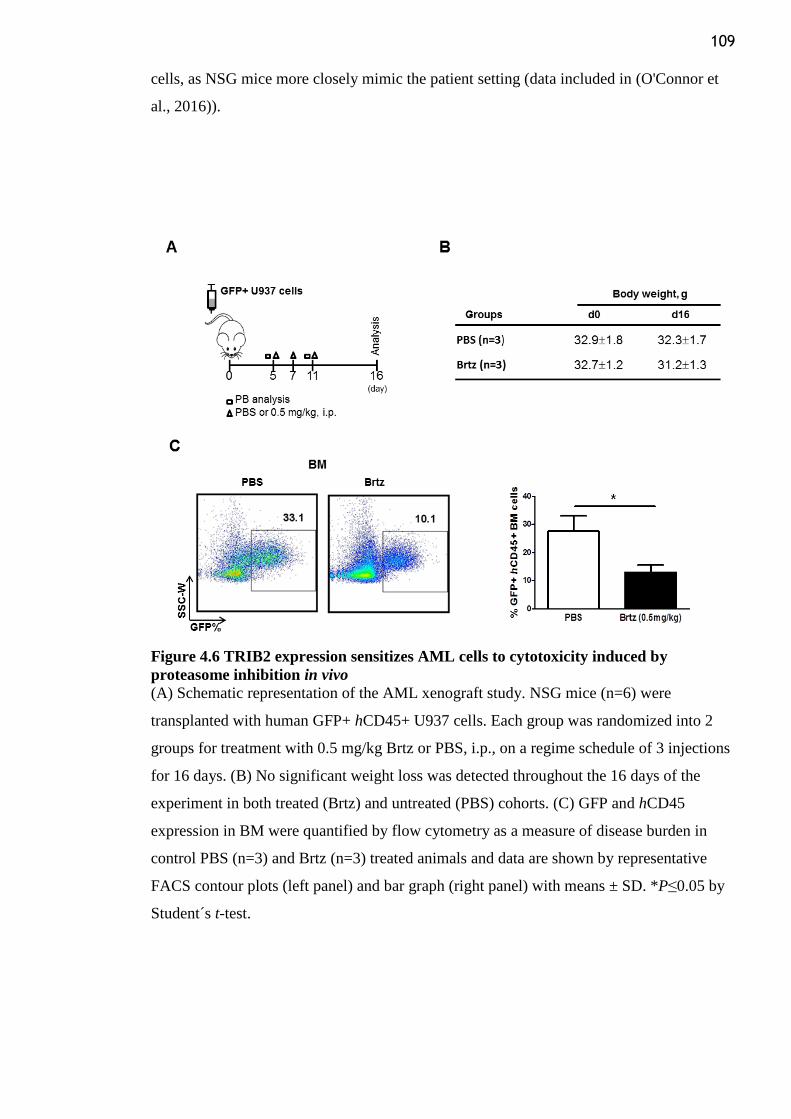
109
cells, as NSG mice more closely mimic the patient setting (data included in (O'Connor et
al., 2016)).
Figure 4.6 TRIB2 expression sensitizes AML cells to cytotoxicity induced by
proteasome inhibition in vivo
(A) Schematic representation of the AML xenograft study. NSG mice (n=6) were
transplanted with human GFP+ hCD45+ U937 cells. Each group was randomized into 2
groups for treatment with 0.5 mg/kg Brtz or PBS, i.p., on a regime schedule of 3 injections
for 16 days. (B) No significant weight loss was detected throughout the 16 days of the
experiment in both treated (Brtz) and untreated (PBS) cohorts. (C) GFP and hCD45
expression in BM were quantified by flow cytometry as a measure of disease burden in
control PBS (n=3) and Brtz (n=3) treated animals and data are shown by representative
FACS contour plots (left panel) and bar graph (right panel) with means ± SD. *P≤0.05 by
Student´s t-test.
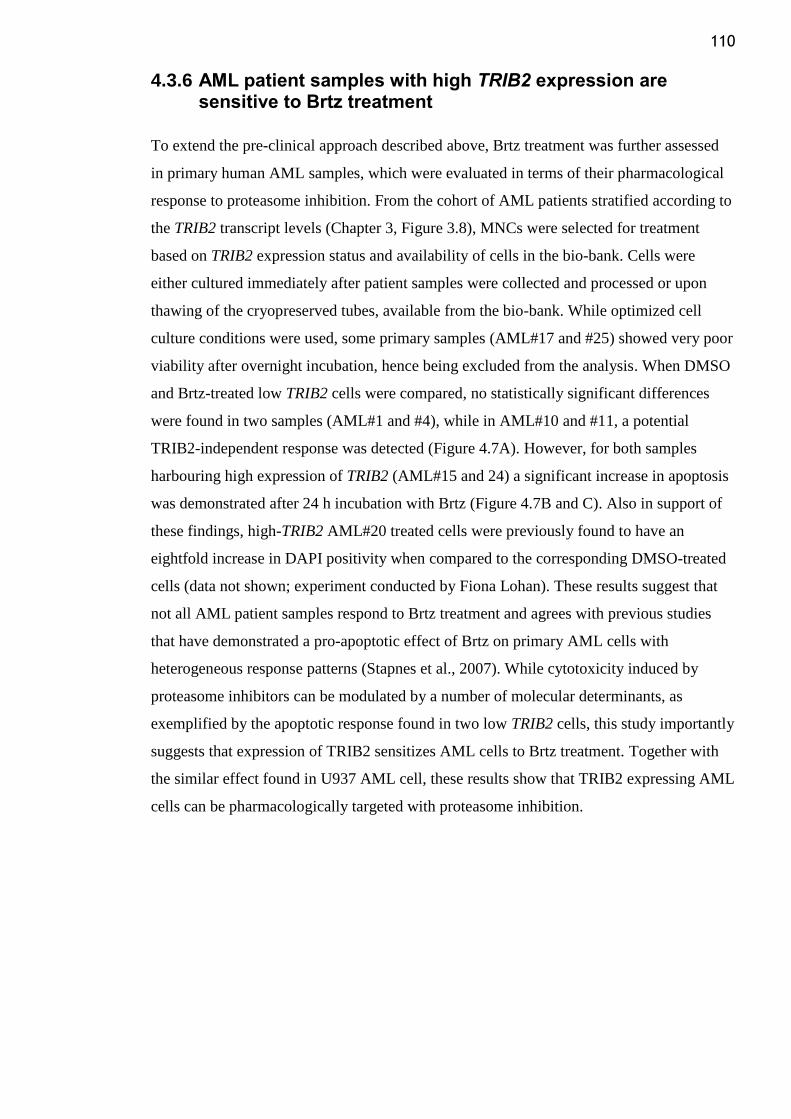
110
4.3.6 AML patient samples with high TRIB2 expression are sensitive to Brtz treatment
To extend the pre-clinical approach described above, Brtz treatment was further assessed
in primary human AML samples, which were evaluated in terms of their pharmacological
response to proteasome inhibition. From the cohort of AML patients stratified according to
the TRIB2 transcript levels (Chapter 3, Figure 3.8), MNCs were selected for treatment
based on TRIB2 expression status and availability of cells in the bio-bank. Cells were
either cultured immediately after patient samples were collected and processed or upon
thawing of the cryopreserved tubes, available from the bio-bank. While optimized cell
culture conditions were used, some primary samples (AML#17 and #25) showed very poor
viability after overnight incubation, hence being excluded from the analysis. When DMSO
and Brtz-treated low TRIB2 cells were compared, no statistically significant differences
were found in two samples (AML#1 and #4), while in AML#10 and #11, a potential
TRIB2-independent response was detected (Figure 4.7A). However, for both samples
harbouring high expression of TRIB2 (AML#15 and 24) a significant increase in apoptosis
was demonstrated after 24 h incubation with Brtz (Figure 4.7B and C). Also in support of
these findings, high-TRIB2 AML#20 treated cells were previously found to have an
eightfold increase in DAPI positivity when compared to the corresponding DMSO-treated
cells (data not shown; experiment conducted by Fiona Lohan). These results suggest that
not all AML patient samples respond to Brtz treatment and agrees with previous studies
that have demonstrated a pro-apoptotic effect of Brtz on primary AML cells with
heterogeneous response patterns (Stapnes et al., 2007). While cytotoxicity induced by
proteasome inhibitors can be modulated by a number of molecular determinants, as
exemplified by the apoptotic response found in two low TRIB2 cells, this study importantly
suggests that expression of TRIB2 sensitizes AML cells to Brtz treatment. Together with
the similar effect found in U937 AML cell, these results show that TRIB2 expressing AML
cells can be pharmacologically targeted with proteasome inhibition.
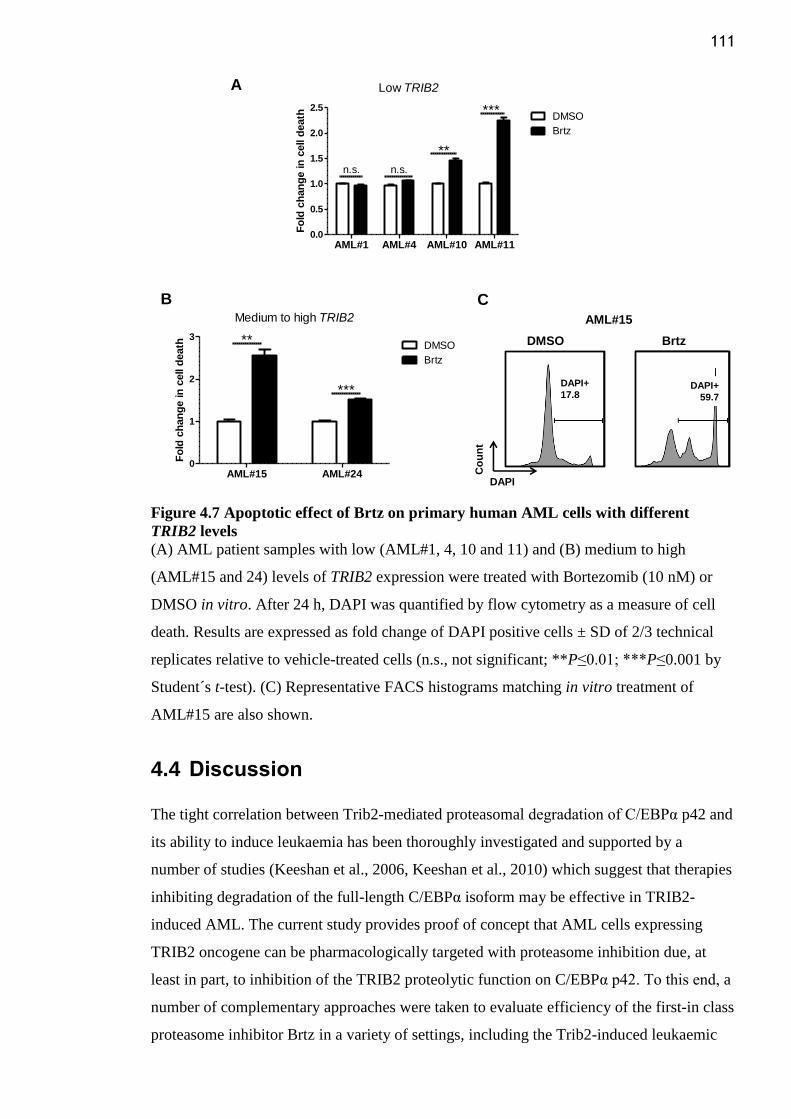
111
Figure 4.7 Apoptotic effect of Brtz on primary human AML cells with different
TRIB2 levels
(A) AML patient samples with low (AML#1, 4, 10 and 11) and (B) medium to high
(AML#15 and 24) levels of TRIB2 expression were treated with Bortezomib (10 nM) or
DMSO in vitro. After 24 h, DAPI was quantified by flow cytometry as a measure of cell
death. Results are expressed as fold change of DAPI positive cells ± SD of 2/3 technical
replicates relative to vehicle-treated cells (n.s., not significant; **P≤0.01; ***P≤0.001 by
Student´s t-test). (C) Representative FACS histograms matching in vitro treatment of
AML#15 are also shown.
4.4 Discussion
The tight correlation between Trib2-mediated proteasomal degradation of C/EBPα p42 and
its ability to induce leukaemia has been thoroughly investigated and supported by a
number of studies (Keeshan et al., 2006, Keeshan et al., 2010) which suggest that therapies
inhibiting degradation of the full-length C/EBPα isoform may be effective in TRIB2-
induced AML. The current study provides proof of concept that AML cells expressing
TRIB2 oncogene can be pharmacologically targeted with proteasome inhibition due, at
least in part, to inhibition of the TRIB2 proteolytic function on C/EBPα p42. To this end, a
number of complementary approaches were taken to evaluate efficiency of the first-in class
proteasome inhibitor Brtz in a variety of settings, including the Trib2-induced leukaemic
AML#15
DMSO Brtz
DAPIC
ou
nt
A
B
DAPI+
17.8DAPI+
59.7
AML#1 AML#4 AML#10 AML#110.0
0.5
1.0
1.5
2.0
2.5DMSO
Brtz
n.s. n.s.
***
**
Low TRIB2
Fo
ld c
han
ge in
cell d
eath
AML#15 AML#240
1
2
3DMSO
Brtz
**
***
Medium to high TRIB2
Fo
ld c
han
ge in
cell d
eath
C
112
mice. Indeed, when murine BM cells collected from secondary recipients were treated in
vitro with Brtz at concentrations in the low nanomolar range, a significant reduction of
Trib2 expressing cells was detected, as evidenced by the decrease in GFP % used as a
surrogate marker for Trib2 expression in this model. Importantly, the current study shows
that the pro-apoptotic effect of Brtz in suspension cultures also affects the more immature
clonogenic subset within the hierarchically organized AML cell population, as
demonstrated by the inhibition of clonogenic growth upon in vitro treatment. The effect of
Brtz treatment on AML colony formation is in agreement with previous studies (Stapnes et
al., 2007, Liu et al., 2013). It should be noted that this is a very important effect, since
these cells are believed to be critical for the genesis and perpetuation of leukaemic disease.
While recent research on the proteasome as a rational therapeutic target has been
predominantly focused on malignant tissue, some studies have investigated the effect of
Brtz on normal cells, due to its clinical relevance for BM toxicity. It has been suggested
that non-malignant human CD34+ BM cells are susceptible to the apoptotic effect of Brtz,
even if at slightly higher concentrations from those used for their AML counterparts
(Stapnes et al., 2007). Moreover, the IC50 of Brtz with CML CD34+38- cells was not
found to be significantly different from the equivalent non-CML cells (Heaney et al.,
2010). In disagreement with such observations, the Brtz effect on normal murine BM cells
showed pro-apoptotic selectively towards the malignant cells, as no evidence of
cytotoxicity was encountered in in vitro assays with different subsets of normal murine
bulk total BM cells, LSK cells or lineage positive cells. A consistent outcome was, in fact,
illustrated by both the most primitive and most differentiated populations, at a
concentration shown to have a pro-apoptotic effect on murine Trib2-AML BM cells. In
line with these results, myeloid cell surface marker staining did not display any change that
could suggest Brtz-induced differentiation. The discrepancy between present study and
published data could be due to species-specific differences and, therefore, caution should
be exercised when extrapolating obtained results to the human situation and could be
further clarified by a dose-response treatment using higher concentration values. Long-
term evaluation using colony-formation assay or effect on normal BM mouse engraftment
would also address this subject.
Brtz was shown to be cytotoxic to a broad range of the 60 human tumour cell lines
examined in the National Cancer Institute pre-clinical screen, which clearly highlights the
potential of proteasome inhibitors as anticancer agents (Adams et al., 1999). However,
different pathways seem to be important in different malignant cells, and the mechanisms
113
whereby these agents elicit cellular responses are not fully understood (Nencioni et al.,
2007). Having shown an effect of Brtz on the viability of murine Trib2-AML cells, the
present study moved on to establish that the response to proteasome inhibition was TRIB2-
dependent. The cause-and-effect relationship between TRIB2 expression and treatment
response was attained by functional studies that measured changes in Brtz-induced
cytotoxicity after modulation of TRIB2 in U937cell line. This was the preferred model
since both TRIB2 and C/EBPα are endogenously expressed. Response of the U937 AML
cells to proteasome inhibition was previously reported by Imajoh-Ohmi et al, who
examined the effect of another selective inhibitor of the proteasome, lactacystin, on U937´
cell proliferation. These authors found that lactacystin induces apoptotic cell death
(Imajoh-Ohmi et al., 1995), without further investigating the underlying molecular
mechanism. In the current study, not only was the increased in vitro cytotoxic response
associated with higher TRIB2 expression, as similar patterns of sensitivity were
successfully recapitulated with the next-generation inhibitors SF and Cfz. Unlike Brtz,
these proteasome inhibitors cause irreversible proteasome inhibition and are thus expected
to have enhanced efficacy, as well as increased clinical applicability.
Furthermore, the response of high TRIB2 AML cells to proteasome inhibition was deemed
to be due to blockage of TRIB2 degradative function on C/EBPα p42. This was supported
by western blotting analysis, which highlighted the molecular interplay between both
proteins by showing a reduction in C/EBP p42 after TRIB2 overexpression and, more
importantly, rescue of the transcription factor´s full length isoform degradation after
proteasome inhibition. These observations mechanistically confirmed the TRIB2-C/EBPα
p42 dynamic and showed that it is indeed altered by Brtz treatment. Specificity was further
addressed and supported by a panel of experiments which showed that 1) ectopic
expression of C/EBPα rescued Brtz- induced death in U937 cells, while 2) TRIB2
overexpression required the presence of C/EBPα to enhance Brtz-induced cell death, since
it was not found in a leukaemia background lacking C/EBPα (K562 and Kasumi-1).
Consistent with these results, it has been shown that a TRIB2 mutant (VPM), unable to
bind the E3 ligase COP1 responsible for TRIB2-mediated C/EBPα degradation (Keeshan
et al., 2010), does not enhance Brtz-induced cell death (experiment conducted by Fiona
Lohan (O'Connor et al., 2016)). Taken together, these findings uncover a novel molecular
mechanism by which Brtz elicits apoptosis in leukaemia cells via modulation of the
TRIB2-C/EBPα p42 axis. As previously reported, the accumulation of K48 ubiquitinated
proteins is thought to mediate Brtz cytotoxicity on a cellular level by triggering ER stress,
autophagy and apoptosis (Obeng et al., 2006, Fang et al., 2012). Therefore, it is likely that
114
the accumulation of K48 ubiquitinated- C/EBP p42 would be implicated in the cell death
response found after proteasome inhibition. Indeed, treatment with the proteasome
inhibitor MG-132 was associated with an accumulation of Ub-conjugated C/EBPα,
consistent with proteasome inhibition (experiment conducted by Caitriona O´Connor
(O'Connor et al., 2016)). In addition, C/EBP p42 stabilization by Brtz could promote the
myeloid maturation programme triggered by this transcription factor. This was suggested
by an increase in myeloid cell surface markers CD11b and Gr-1 in murine Trib2-leukaemic
treated cell colonies (Figure 4.1D). Thus Brtz could be additionally implicated in the
differentiation of cells, which would then senesce. In fact, an analogous role for Brtz was
previously reported by Ying et al, who showed that Brtz synergizes with ATRA in
promoting myeloid differentiation of HL60 and NB4 APL cells. These authors reported
that Brtz elicits this effect by disrupting the ATRA-induced proteasomal degradation of
RARα, the receptor through which ATRA paradoxically also induces myeloid
differentiation (Ying et al., 2013).
The translation of laboratory experiments to the clinical arena is inherently dependent on
the usefulness of mouse models, which produce a tractable preclinical system for testing
new therapeutic approaches in a physiological environment. It was therefore important to
detect Brtz anti-tumour activity in a U937 xenograft model, in which leukaemia burden
was shown to be strongly dependent on TRIB2 expression (Chapter 3). The observation of
a significant inhibition of tumour engraftment, together with minimal body weight loss, is
interpreted by drug developers as indicative of an acceptable therapeutic window in
humans (Kamb, 2005). Moreover, a cytotoxic response was detected in the high expressing
TRIB2 AML patient samples. Together, obtained results support pre-clinical evidence that
AML cells expressing high levels of endogenous TRIB2 can be successfully targeted by
proteasome inhibition.
Given the central role of the proteasome in protein homeostasis and cellular physiology it
is not surprising that discussions on the ultimate targets of proteasome inhibitors are
ongoing. Results here present compelling evidence for a TRIB2-C/EBPα-dependent effect
of Brtz in high TRIB2-expressing AML cells. However, inhibition of the proteasome also
targets other proteins, E3 ligases and their substrates. This, together with the current
understanding on Brtz´s overall ability to elicit cytotoxicity (see Chapter 1), suggests that
other molecular determinants could be also implicated in the cellular cytotoxicity found in
the current study. Such mechanisms could be related to the ones previously described (see
chapter 1) or dependent on TRIB2 expression. The latter are difficult to predict, as there is
115
currently limited knowledge of TRIB2 degradation substrates in general, and indeed
knowledge of TRIB2 as a substrate itself of the UPS in cancer.
To conclude, this study identifies TRIB2 as a novel molecular determinant of cell
sensitivity to Brtz-induced apoptosis, which is achieved, at least partially, by blockage of
C/EBPα proteolytic degradation. These findings are relevant in the context of a
heterogeneous malignancy for which therapy driven by specific molecular subtypes of
AML is thought to be a logical approach. The ATRA-APL example is a paradigm of such
a strategy and other models have shown promising effects, including the case of the toxin-
conjugated anti-CD33 antibody Myelotarg on core-binding factor mutated AML (Walter et
al., 2012) and of FLT3 inhibitors for patients with activating FLT3 mutations (Grunwald
and Levis, 2013). Moreover, TRIB2 has been implicated in non-haemopoietic human
cancers so the proposed mechanism of Brtz action may extend to other malignancies where
TRIB2 has an oncogenic role via UPS involvement. Therefore, this study provides the
critical basis for further investigations into targeting the UPS as an emerging cancer
therapy.
116
Chapter 5: Potential implication of arginine methylation in
TRIB2-induced AML via PRMT5 interaction
117
5.1 Introduction
Despite the widely accepted two-hit model of leukaemogenesis, there is growing evidence
that the epigenetic landscape is important for the development of AML, as highlighted
previously (Chapter 1, section 1.2.4). The term epigenetic encompasses all changes in gene
expression that are not due to alterations in the underlying DNA sequence (Holliday,
1987). Examples of mechanisms that alter the transcriptional potential of a cell include
modifications of DNA cytosine residues and post-translational modifications (PTMs) of
histone proteins via the biochemical processes of acetylation, phosphorylation,
methylation, and others (Musselman et al., 2012). Arginine methylation is an abundant
PTM carried out by a family of 11 protein arginine methyltransferases (PRMTs). Based on
their primary sequence and substrate specificity, PRMTs are designated as PRMT1 to 11.
Except for PRMT2, 10 and 11, they have been shown to catalyse addition of one or two
methyl groups to the guanidino nitrogen atoms of arginine (R) residues in both histones
and non-histone substrates. Depending on whether their catalytic activity towards
dimethylation is asymmetric or symmetric, PRMTs are classified as either type I or type II
enzymes, respectively, even if both types catalyze the formation of monomethylated
arginines as an intermediate (Pal and Sif, 2007).
PRTM5 (14q11.2) was first identified as JAK-binding protein 1 (JBP1) in a yeast two-
hybrid assay (Pollack et al., 1999) and is the major type II arginine methyltransferase
(Branscombe et al., 2001). The complete loss of this enzyme is not compatible with mouse
viability due to the abrogation of pluripotent cells in blastocytes (Tee, 2010). PRMT5 is
reported to participate in several diverse cellular processes through the methylation of a
variety of cytoplasmic and nuclear substrates. Symmetrically methylated histones H3 at R8
and H4/H2A at R3 are well known epigenetic marks of PRMT5 (Pal et al., 2004, Ancelin
et al., 2006) and are generally associated with gene repression (Fabbrizio et al., 2002).
Moreover, PRMT5 represses - globin gene expression through symmetric dimethylation
of H4R3, recruitment of the DNA methyltransferase DNMT3A to the -promoter and
subsequent additional repressive epigenetic marks, indicating a potential crosstalk between
repressive histone modification and DNA methylation (Zhao et al., 2009) (Figure 5.1A).
PRMT5 acts as part of a multimeric complex in concert with a variety of partner proteins
that regulate its activity, as well as localization and substrate specificity. In mammalian
cells, PRMT5 is tightly bound by a 50-kDa WD40 repeat-containing protein dubbed
methylosome protein 50 (MEP50) and together they are assembled as an hetero-octameric
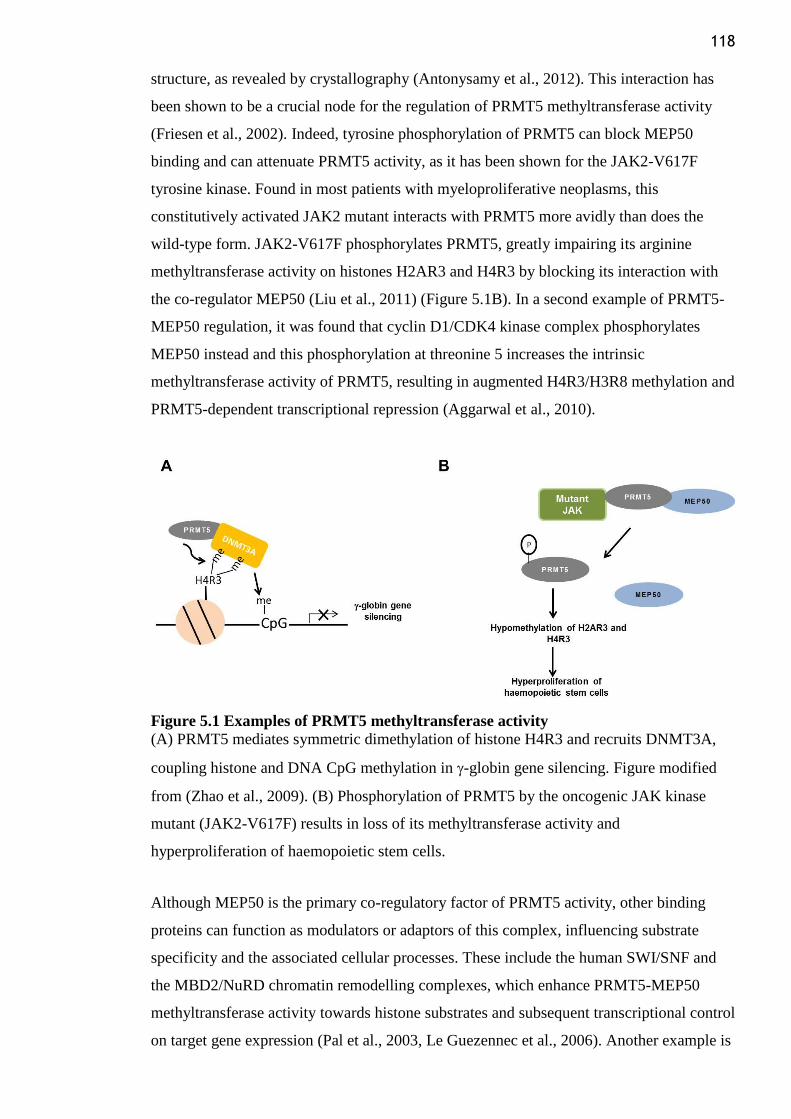
118
structure, as revealed by crystallography (Antonysamy et al., 2012). This interaction has
been shown to be a crucial node for the regulation of PRMT5 methyltransferase activity
(Friesen et al., 2002). Indeed, tyrosine phosphorylation of PRMT5 can block MEP50
binding and can attenuate PRMT5 activity, as it has been shown for the JAK2-V617F
tyrosine kinase. Found in most patients with myeloproliferative neoplasms, this
constitutively activated JAK2 mutant interacts with PRMT5 more avidly than does the
wild-type form. JAK2-V617F phosphorylates PRMT5, greatly impairing its arginine
methyltransferase activity on histones H2AR3 and H4R3 by blocking its interaction with
the co-regulator MEP50 (Liu et al., 2011) (Figure 5.1B). In a second example of PRMT5-
MEP50 regulation, it was found that cyclin D1/CDK4 kinase complex phosphorylates
MEP50 instead and this phosphorylation at threonine 5 increases the intrinsic
methyltransferase activity of PRMT5, resulting in augmented H4R3/H3R8 methylation and
PRMT5-dependent transcriptional repression (Aggarwal et al., 2010).
Figure 5.1 Examples of PRMT5 methyltransferase activity
(A) PRMT5 mediates symmetric dimethylation of histone H4R3 and recruits DNMT3A,
coupling histone and DNA CpG methylation in -globin gene silencing. Figure modified
from (Zhao et al., 2009). (B) Phosphorylation of PRMT5 by the oncogenic JAK kinase
mutant (JAK2-V617F) results in loss of its methyltransferase activity and
hyperproliferation of haemopoietic stem cells.
Although MEP50 is the primary co-regulatory factor of PRMT5 activity, other binding
proteins can function as modulators or adaptors of this complex, influencing substrate
specificity and the associated cellular processes. These include the human SWI/SNF and
the MBD2/NuRD chromatin remodelling complexes, which enhance PRMT5-MEP50
methyltransferase activity towards histone substrates and subsequent transcriptional control
on target gene expression (Pal et al., 2003, Le Guezennec et al., 2006). Another example is
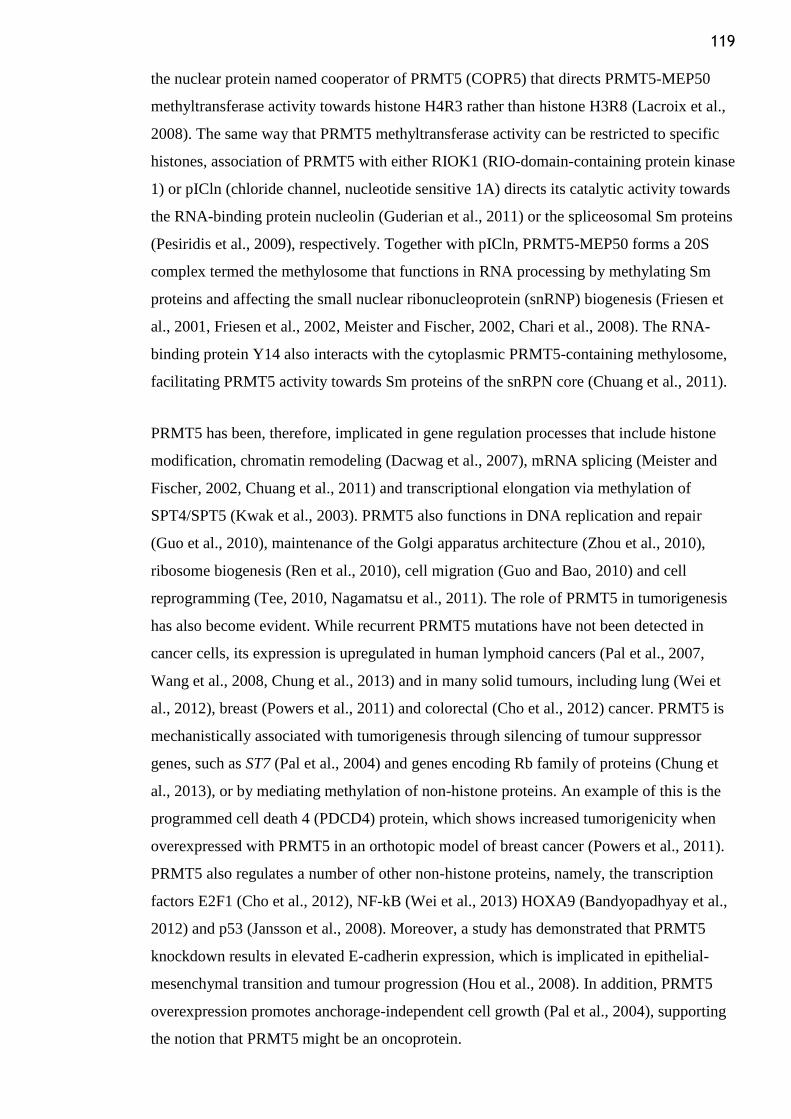
119
the nuclear protein named cooperator of PRMT5 (COPR5) that directs PRMT5-MEP50
methyltransferase activity towards histone H4R3 rather than histone H3R8 (Lacroix et al.,
2008). The same way that PRMT5 methyltransferase activity can be restricted to specific
histones, association of PRMT5 with either RIOK1 (RIO-domain-containing protein kinase
1) or pICln (chloride channel, nucleotide sensitive 1A) directs its catalytic activity towards
the RNA-binding protein nucleolin (Guderian et al., 2011) or the spliceosomal Sm proteins
(Pesiridis et al., 2009), respectively. Together with pICln, PRMT5-MEP50 forms a 20S
complex termed the methylosome that functions in RNA processing by methylating Sm
proteins and affecting the small nuclear ribonucleoprotein (snRNP) biogenesis (Friesen et
al., 2001, Friesen et al., 2002, Meister and Fischer, 2002, Chari et al., 2008). The RNA-
binding protein Y14 also interacts with the cytoplasmic PRMT5-containing methylosome,
facilitating PRMT5 activity towards Sm proteins of the snRPN core (Chuang et al., 2011).
PRMT5 has been, therefore, implicated in gene regulation processes that include histone
modification, chromatin remodeling (Dacwag et al., 2007), mRNA splicing (Meister and
Fischer, 2002, Chuang et al., 2011) and transcriptional elongation via methylation of
SPT4/SPT5 (Kwak et al., 2003). PRMT5 also functions in DNA replication and repair
(Guo et al., 2010), maintenance of the Golgi apparatus architecture (Zhou et al., 2010),
ribosome biogenesis (Ren et al., 2010), cell migration (Guo and Bao, 2010) and cell
reprogramming (Tee, 2010, Nagamatsu et al., 2011). The role of PRMT5 in tumorigenesis
has also become evident. While recurrent PRMT5 mutations have not been detected in
cancer cells, its expression is upregulated in human lymphoid cancers (Pal et al., 2007,
Wang et al., 2008, Chung et al., 2013) and in many solid tumours, including lung (Wei et
al., 2012), breast (Powers et al., 2011) and colorectal (Cho et al., 2012) cancer. PRMT5 is
mechanistically associated with tumorigenesis through silencing of tumour suppressor
genes, such as ST7 (Pal et al., 2004) and genes encoding Rb family of proteins (Chung et
al., 2013), or by mediating methylation of non-histone proteins. An example of this is the
programmed cell death 4 (PDCD4) protein, which shows increased tumorigenicity when
overexpressed with PRMT5 in an orthotopic model of breast cancer (Powers et al., 2011).
PRMT5 also regulates a number of other non-histone proteins, namely, the transcription
factors E2F1 (Cho et al., 2012), NF-kB (Wei et al., 2013) HOXA9 (Bandyopadhyay et al.,
2012) and p53 (Jansson et al., 2008). Moreover, a study has demonstrated that PRMT5
knockdown results in elevated E-cadherin expression, which is implicated in epithelial-
mesenchymal transition and tumour progression (Hou et al., 2008). In addition, PRMT5
overexpression promotes anchorage-independent cell growth (Pal et al., 2004), supporting
the notion that PRMT5 might be an oncoprotein.
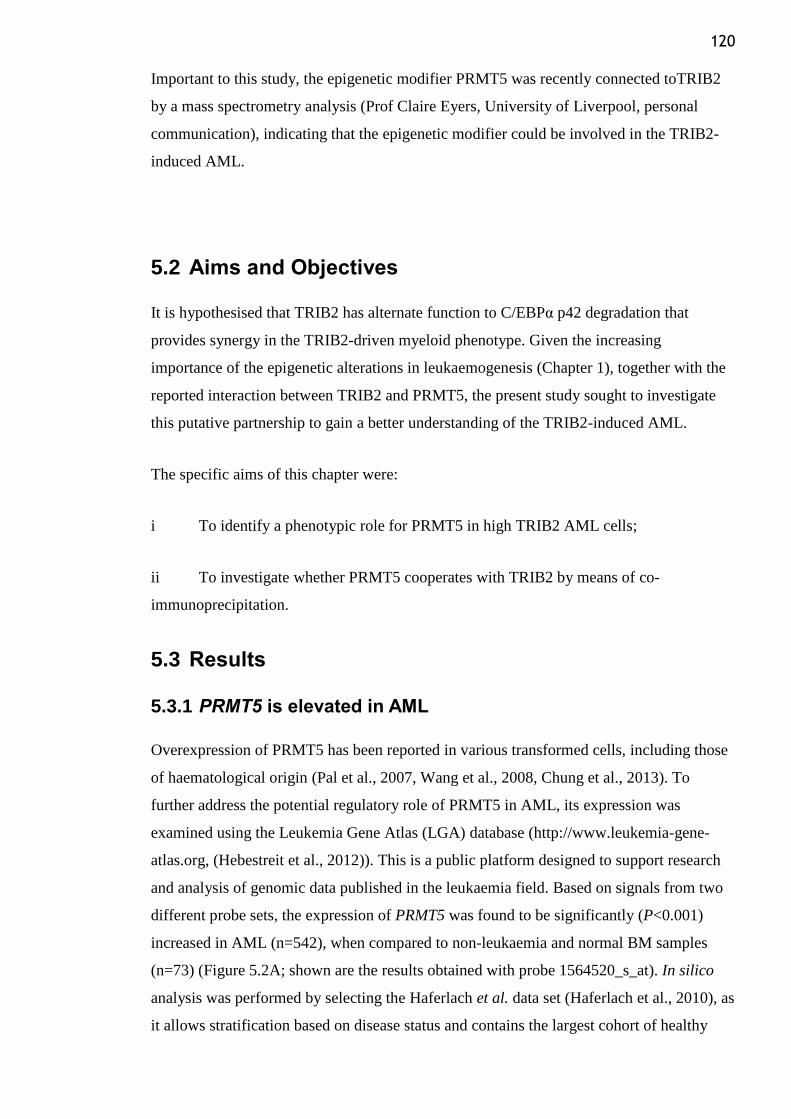
120
Important to this study, the epigenetic modifier PRMT5 was recently connected toTRIB2
by a mass spectrometry analysis (Prof Claire Eyers, University of Liverpool, personal
communication), indicating that the epigenetic modifier could be involved in the TRIB2-
induced AML.
5.2 Aims and Objectives
It is hypothesised that TRIB2 has alternate function to C/EBPα p42 degradation that
provides synergy in the TRIB2-driven myeloid phenotype. Given the increasing
importance of the epigenetic alterations in leukaemogenesis (Chapter 1), together with the
reported interaction between TRIB2 and PRMT5, the present study sought to investigate
this putative partnership to gain a better understanding of the TRIB2-induced AML.
The specific aims of this chapter were:
i To identify a phenotypic role for PRMT5 in high TRIB2 AML cells;
ii To investigate whether PRMT5 cooperates with TRIB2 by means of co-
immunoprecipitation.
5.3 Results
5.3.1 PRMT5 is elevated in AML
Overexpression of PRMT5 has been reported in various transformed cells, including those
of haematological origin (Pal et al., 2007, Wang et al., 2008, Chung et al., 2013). To
further address the potential regulatory role of PRMT5 in AML, its expression was
examined using the Leukemia Gene Atlas (LGA) database (http://www.leukemia-gene-
atlas.org, (Hebestreit et al., 2012)). This is a public platform designed to support research
and analysis of genomic data published in the leukaemia field. Based on signals from two
different probe sets, the expression of PRMT5 was found to be significantly (P<0.001)
increased in AML (n=542), when compared to non-leukaemia and normal BM samples
(n=73) (Figure 5.2A; shown are the results obtained with probe 1564520_s_at). In silico
analysis was performed by selecting the Haferlach et al. data set (Haferlach et al., 2010), as
it allows stratification based on disease status and contains the largest cohort of healthy
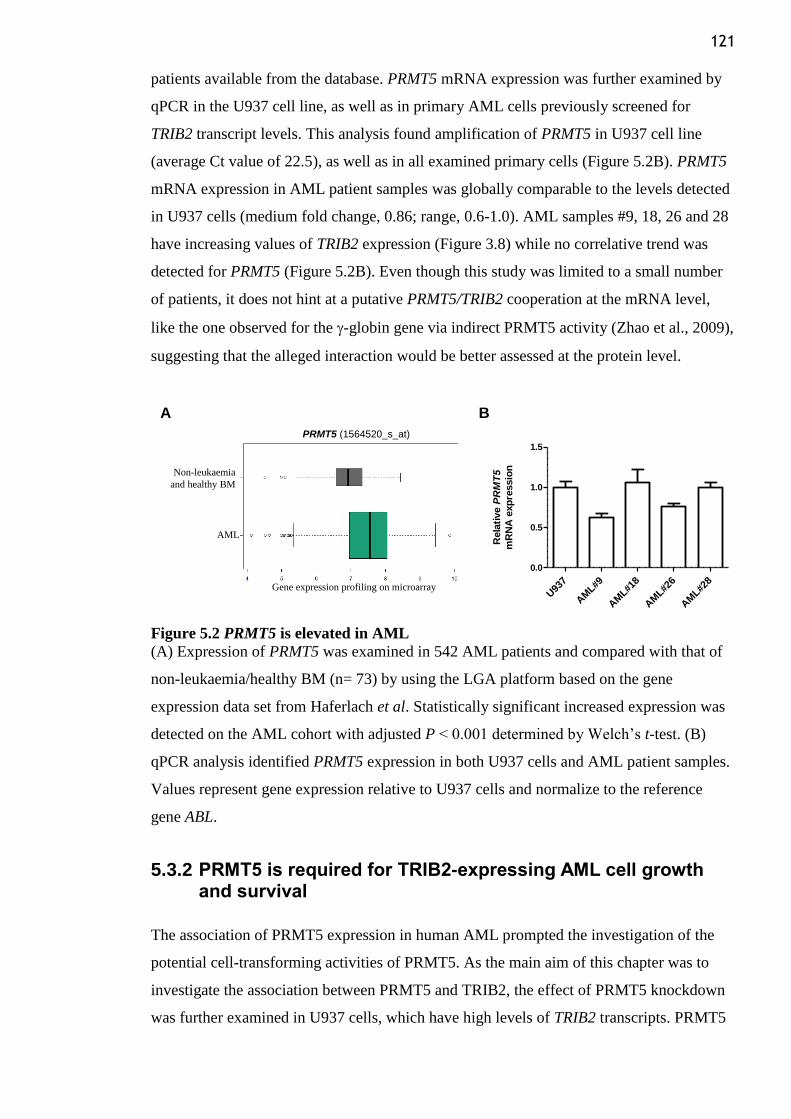
121
patients available from the database. PRMT5 mRNA expression was further examined by
qPCR in the U937 cell line, as well as in primary AML cells previously screened for
TRIB2 transcript levels. This analysis found amplification of PRMT5 in U937 cell line
(average Ct value of 22.5), as well as in all examined primary cells (Figure 5.2B). PRMT5
mRNA expression in AML patient samples was globally comparable to the levels detected
in U937 cells (medium fold change, 0.86; range, 0.6-1.0). AML samples #9, 18, 26 and 28
have increasing values of TRIB2 expression (Figure 3.8) while no correlative trend was
detected for PRMT5 (Figure 5.2B). Even though this study was limited to a small number
of patients, it does not hint at a putative PRMT5/TRIB2 cooperation at the mRNA level,
like the one observed for the -globin gene via indirect PRMT5 activity (Zhao et al., 2009),
suggesting that the alleged interaction would be better assessed at the protein level.
Figure 5.2 PRMT5 is elevated in AML
(A) Expression of PRMT5 was examined in 542 AML patients and compared with that of
non-leukaemia/healthy BM (n= 73) by using the LGA platform based on the gene
expression data set from Haferlach et al. Statistically significant increased expression was
detected on the AML cohort with adjusted P < 0.001 determined by Welch‟s t-test. (B)
qPCR analysis identified PRMT5 expression in both U937 cells and AML patient samples.
Values represent gene expression relative to U937 cells and normalize to the reference
gene ABL.
5.3.2 PRMT5 is required for TRIB2-expressing AML cell growth and survival
The association of PRMT5 expression in human AML prompted the investigation of the
potential cell-transforming activities of PRMT5. As the main aim of this chapter was to
investigate the association between PRMT5 and TRIB2, the effect of PRMT5 knockdown
was further examined in U937 cells, which have high levels of TRIB2 transcripts. PRMT5
PRMT5 (1564520_s_at)
Gene expression profiling on microarray
AML
Non-leukaemia
and healthy BM
A B
U93
7
AM
L#9
AM
L#18
AM
L#26
AM
L#28
0.0
0.5
1.0
1.5
Rela
tive
PR
MT
5
mR
NA
exp
ressio
n
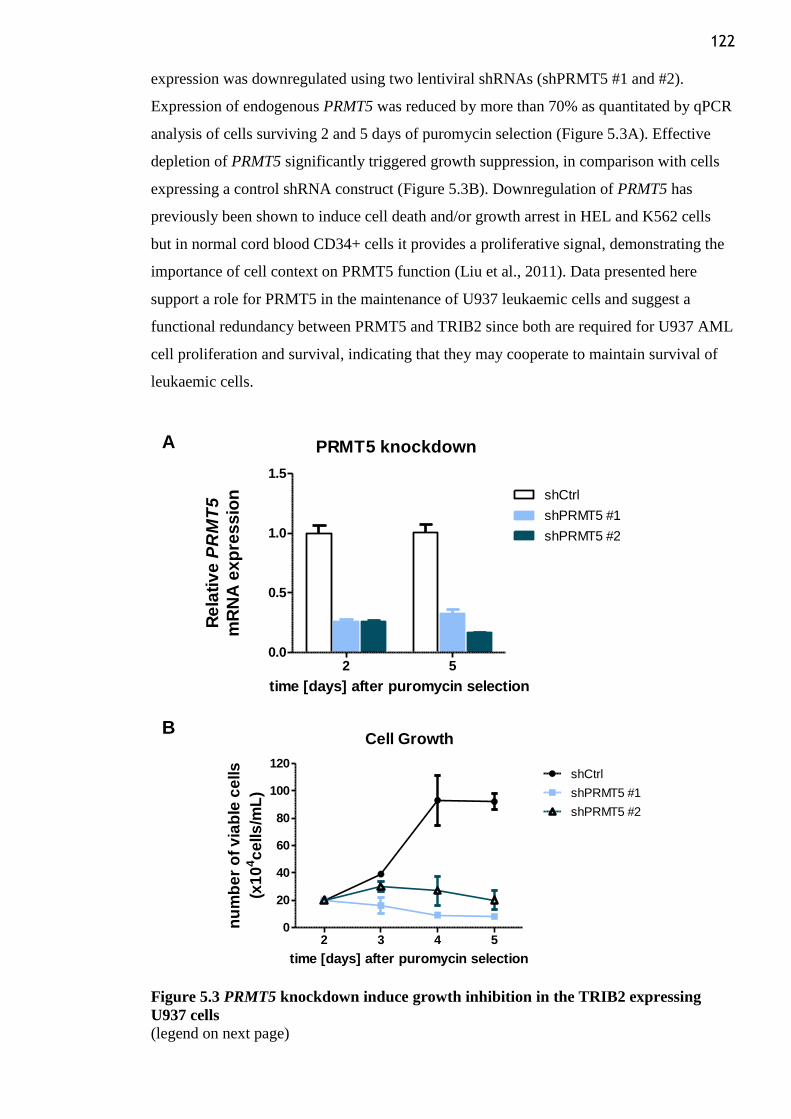
122
expression was downregulated using two lentiviral shRNAs (shPRMT5 #1 and #2).
Expression of endogenous PRMT5 was reduced by more than 70% as quantitated by qPCR
analysis of cells surviving 2 and 5 days of puromycin selection (Figure 5.3A). Effective
depletion of PRMT5 significantly triggered growth suppression, in comparison with cells
expressing a control shRNA construct (Figure 5.3B). Downregulation of PRMT5 has
previously been shown to induce cell death and/or growth arrest in HEL and K562 cells
but in normal cord blood CD34+ cells it provides a proliferative signal, demonstrating the
importance of cell context on PRMT5 function (Liu et al., 2011). Data presented here
support a role for PRMT5 in the maintenance of U937 leukaemic cells and suggest a
functional redundancy between PRMT5 and TRIB2 since both are required for U937 AML
cell proliferation and survival, indicating that they may cooperate to maintain survival of
leukaemic cells.
Figure 5.3 PRMT5 knockdown induce growth inhibition in the TRIB2 expressing
U937 cells
(legend on next page)
A
B
2 50.0
0.5
1.0
1.5
shCtrl
shPRMT5 #1
shPRMT5 #2
PRMT5 knockdown
time [days] after puromycin selection
Re
lati
ve
PR
MT
5
mR
NA
ex
pre
ssio
n
Cell Growth
2 3 4 50
20
40
60
80
100
120shCtrl
shPRMT5 #1
shPRMT5 #2
time [days] after puromycin selection
nu
mb
er
of
via
ble
ce
lls
(x1
04c
ells
/mL
)
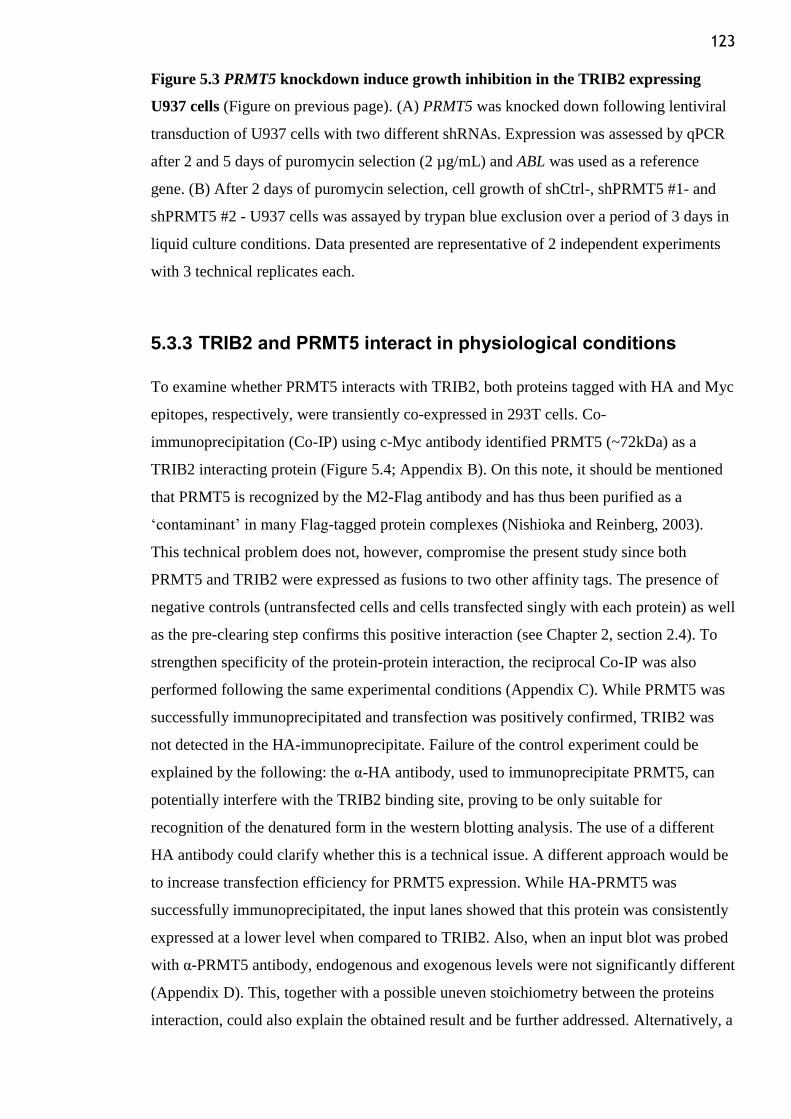
123
Figure 5.3 PRMT5 knockdown induce growth inhibition in the TRIB2 expressing
U937 cells (Figure on previous page). (A) PRMT5 was knocked down following lentiviral
transduction of U937 cells with two different shRNAs. Expression was assessed by qPCR
after 2 and 5 days of puromycin selection (2 µg/mL) and ABL was used as a reference
gene. (B) After 2 days of puromycin selection, cell growth of shCtrl-, shPRMT5 #1- and
shPRMT5 #2 - U937 cells was assayed by trypan blue exclusion over a period of 3 days in
liquid culture conditions. Data presented are representative of 2 independent experiments
with 3 technical replicates each.
5.3.3 TRIB2 and PRMT5 interact in physiological conditions
To examine whether PRMT5 interacts with TRIB2, both proteins tagged with HA and Myc
epitopes, respectively, were transiently co-expressed in 293T cells. Co-
immunoprecipitation (Co-IP) using c-Myc antibody identified PRMT5 (~72kDa) as a
TRIB2 interacting protein (Figure 5.4; Appendix B). On this note, it should be mentioned
that PRMT5 is recognized by the M2-Flag antibody and has thus been purified as a
„contaminant‟ in many Flag-tagged protein complexes (Nishioka and Reinberg, 2003).
This technical problem does not, however, compromise the present study since both
PRMT5 and TRIB2 were expressed as fusions to two other affinity tags. The presence of
negative controls (untransfected cells and cells transfected singly with each protein) as well
as the pre-clearing step confirms this positive interaction (see Chapter 2, section 2.4). To
strengthen specificity of the protein-protein interaction, the reciprocal Co-IP was also
performed following the same experimental conditions (Appendix C). While PRMT5 was
successfully immunoprecipitated and transfection was positively confirmed, TRIB2 was
not detected in the HA-immunoprecipitate. Failure of the control experiment could be
explained by the following: the α-HA antibody, used to immunoprecipitate PRMT5, can
potentially interfere with the TRIB2 binding site, proving to be only suitable for
recognition of the denatured form in the western blotting analysis. The use of a different
HA antibody could clarify whether this is a technical issue. A different approach would be
to increase transfection efficiency for PRMT5 expression. While HA-PRMT5 was
successfully immunoprecipitated, the input lanes showed that this protein was consistently
expressed at a lower level when compared to TRIB2. Also, when an input blot was probed
with α-PRMT5 antibody, endogenous and exogenous levels were not significantly different
(Appendix D). This, together with a possible uneven stoichiometry between the proteins
interaction, could also explain the obtained result and be further addressed. Alternatively, a
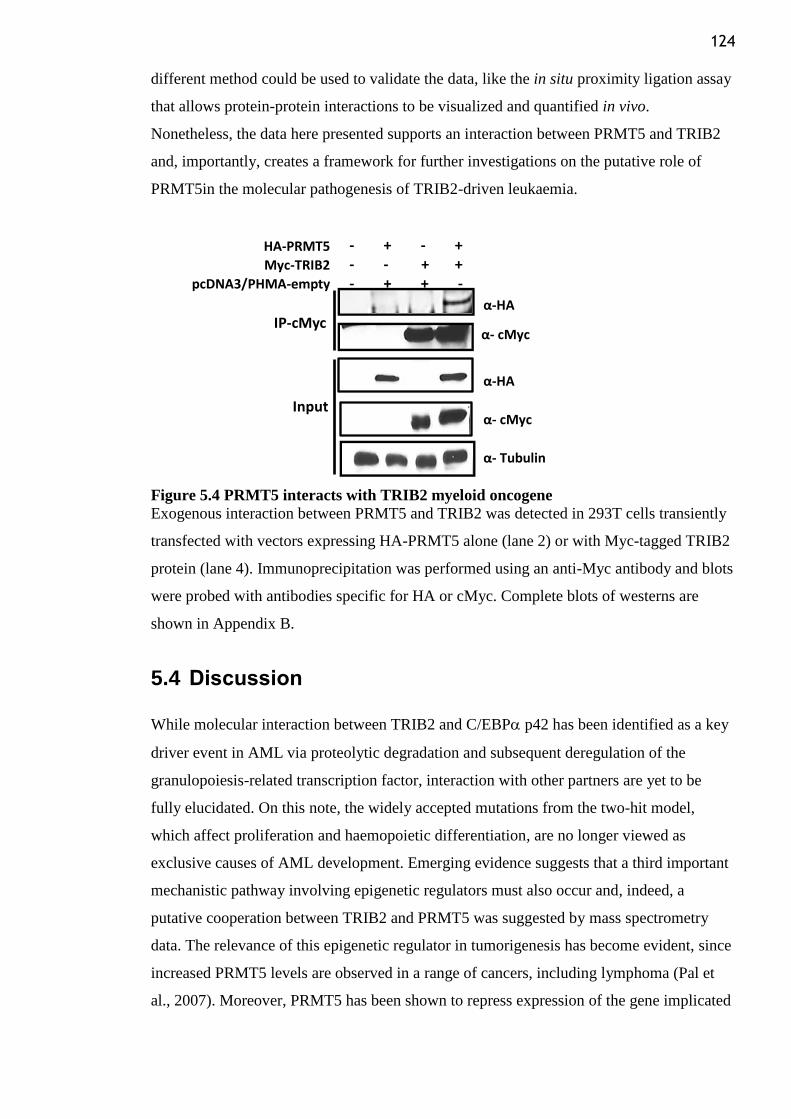
124
different method could be used to validate the data, like the in situ proximity ligation assay
that allows protein-protein interactions to be visualized and quantified in vivo.
Nonetheless, the data here presented supports an interaction between PRMT5 and TRIB2
and, importantly, creates a framework for further investigations on the putative role of
PRMT5in the molecular pathogenesis of TRIB2-driven leukaemia.
Figure 5.4 PRMT5 interacts with TRIB2 myeloid oncogene
Exogenous interaction between PRMT5 and TRIB2 was detected in 293T cells transiently
transfected with vectors expressing HA-PRMT5 alone (lane 2) or with Myc-tagged TRIB2
protein (lane 4). Immunoprecipitation was performed using an anti-Myc antibody and blots
were probed with antibodies specific for HA or cMyc. Complete blots of westerns are
shown in Appendix B.
5.4 Discussion
While molecular interaction between TRIB2 and C/EBP p42 has been identified as a key
driver event in AML via proteolytic degradation and subsequent deregulation of the
granulopoiesis-related transcription factor, interaction with other partners are yet to be
fully elucidated. On this note, the widely accepted mutations from the two-hit model,
which affect proliferation and haemopoietic differentiation, are no longer viewed as
exclusive causes of AML development. Emerging evidence suggests that a third important
mechanistic pathway involving epigenetic regulators must also occur and, indeed, a
putative cooperation between TRIB2 and PRMT5 was suggested by mass spectrometry
data. The relevance of this epigenetic regulator in tumorigenesis has become evident, since
increased PRMT5 levels are observed in a range of cancers, including lymphoma (Pal et
al., 2007). Moreover, PRMT5 has been shown to repress expression of the gene implicated
HA-PRMT5
Myc-TRIB2
pcDNA3/PHMA-empty
- + - +- - + + - + + -
IP-cMycα-HA
Input
α- Tubulin
α-HA
α- cMyc
α- cMyc
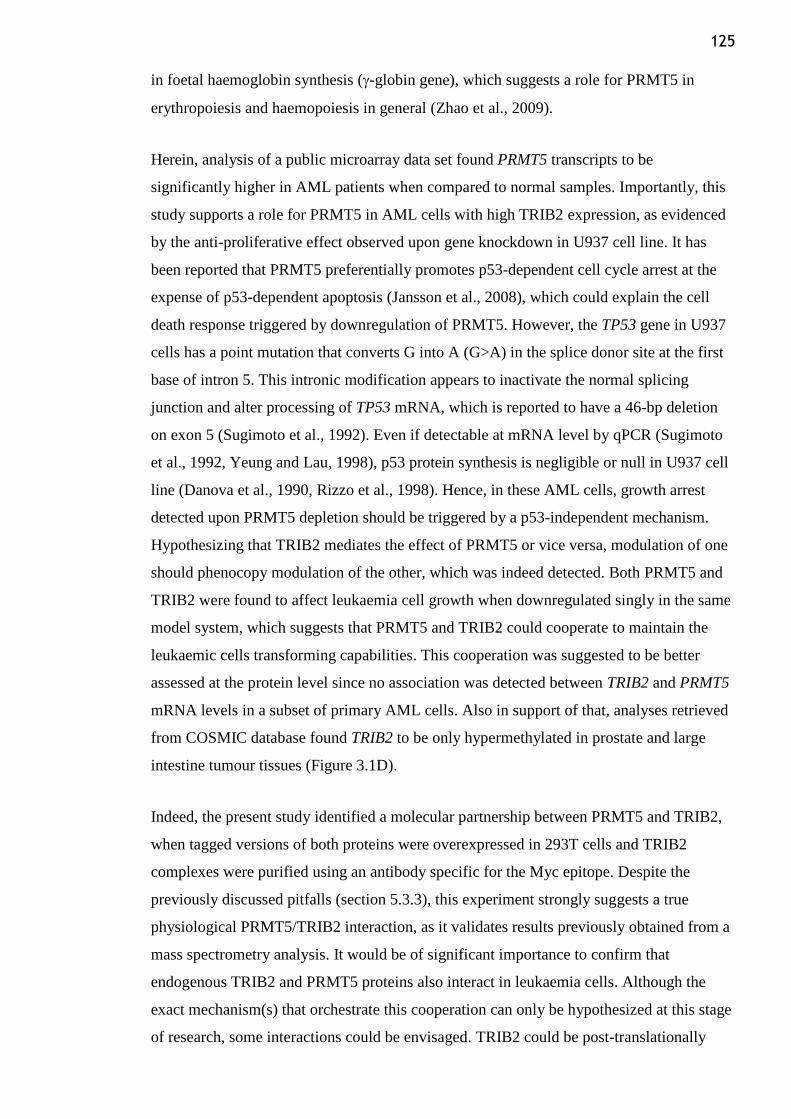
125
in foetal haemoglobin synthesis (-globin gene), which suggests a role for PRMT5 in
erythropoiesis and haemopoiesis in general (Zhao et al., 2009).
Herein, analysis of a public microarray data set found PRMT5 transcripts to be
significantly higher in AML patients when compared to normal samples. Importantly, this
study supports a role for PRMT5 in AML cells with high TRIB2 expression, as evidenced
by the anti-proliferative effect observed upon gene knockdown in U937 cell line. It has
been reported that PRMT5 preferentially promotes p53-dependent cell cycle arrest at the
expense of p53-dependent apoptosis (Jansson et al., 2008), which could explain the cell
death response triggered by downregulation of PRMT5. However, the TP53 gene in U937
cells has a point mutation that converts G into A (G>A) in the splice donor site at the first
base of intron 5. This intronic modification appears to inactivate the normal splicing
junction and alter processing of TP53 mRNA, which is reported to have a 46-bp deletion
on exon 5 (Sugimoto et al., 1992). Even if detectable at mRNA level by qPCR (Sugimoto
et al., 1992, Yeung and Lau, 1998), p53 protein synthesis is negligible or null in U937 cell
line (Danova et al., 1990, Rizzo et al., 1998). Hence, in these AML cells, growth arrest
detected upon PRMT5 depletion should be triggered by a p53-independent mechanism.
Hypothesizing that TRIB2 mediates the effect of PRMT5 or vice versa, modulation of one
should phenocopy modulation of the other, which was indeed detected. Both PRMT5 and
TRIB2 were found to affect leukaemia cell growth when downregulated singly in the same
model system, which suggests that PRMT5 and TRIB2 could cooperate to maintain the
leukaemic cells transforming capabilities. This cooperation was suggested to be better
assessed at the protein level since no association was detected between TRIB2 and PRMT5
mRNA levels in a subset of primary AML cells. Also in support of that, analyses retrieved
from COSMIC database found TRIB2 to be only hypermethylated in prostate and large
intestine tumour tissues (Figure 3.1D).
Indeed, the present study identified a molecular partnership between PRMT5 and TRIB2,
when tagged versions of both proteins were overexpressed in 293T cells and TRIB2
complexes were purified using an antibody specific for the Myc epitope. Despite the
previously discussed pitfalls (section 5.3.3), this experiment strongly suggests a true
physiological PRMT5/TRIB2 interaction, as it validates results previously obtained from a
mass spectrometry analysis. It would be of significant importance to confirm that
endogenous TRIB2 and PRMT5 proteins also interact in leukaemia cells. Although the
exact mechanism(s) that orchestrate this cooperation can only be hypothesized at this stage
of research, some interactions could be envisaged. TRIB2 could be post-translationally
126
methylated by PRMT5, as it is the case of several non-histone proteins, e.g., p53 (Jansson
et al., 2008) and PDCD4 (Powers et al., 2011), with functional consequences on its
activity. Alternatively, and as described for the mutated form of JAK2 (Liu et al., 2011),
TRIB2 could have a regulatory role on PRMT5 methyltransferase activity by altering its
phosphorylation status. This would disrupt the PRMT5-MEP50 hetero-octameric structure
and, ultimately, affect transcription via regulation of specific histones. Such hypothesis
would seem less likely given the fact that a catalytic activity on any substrate has not yet
been reported for the pseudo-kinase TRIB2. However, it has been recently shown that
TRIB2 retains the ability to bind with low affinity to ATP and autophosphorylates in vitro
(Bailey et al., 2015), hence, providing the rationale to pursue this hypothesis further.
Future studies on whether TRIB2 affects the enzymatic activity of PRMT5 towards its
well-known histones epigenetic marks (H2A/H4R3 and H3R8) would provide important
insights on this matter. If changes in histone methylation were found, the functional
consequences of this observation would then have to be determined. It is well established
that post-translational modification of histones represents a fundamental regulatory
mechanism that has an impact on gene expression (Strahl and Allis, 2000) and PRMT5 is
generally regarded as a co-repressor. It would therefore be of interest to identify a potential
subset of genes reciprocally up or downregulated by TRIB2 and PRMT5. Also, since
PRMT5 functions as part of various high molecular weight protein complexes, the
identification of the TRIB2/PRMT5 binding partners could provide important insights on
the potential downstream targets, as they regulate PRMT5 activity, as well as localization
and substrate specificity.
Therefore, the experimental finding of a partnership between PRMT5 and TRIB2 opens a
new level of regulation to consider in AML and empowers further research aimed at
understanding the underlying mechanism and the functional significance of this interplay.
Given the multitude of roles that PRMT5 has in several biological processes, such as RNA
processing, chromatin remodeling and control of gene expression, it is plausible to
hypothesize that PRMT5 and TRIB2 putative cooperation affects a mechanism other than
C/EBPα p42 proteolysis. Instead, this interaction would lead to a crosstalk between
proteasome–dependant degradation of C/EBPα p42 and PRMT5-mediated arginine
methylation, altering the gene expression profile and collaborating to bring about the
TRIB2-driven myeloid phenotype.

127
In conclusion, the discovery of an interaction between PRMT5 and TRIB2 reveals a
potential pathway of regulation in TRIB2-driven leukaemia and sets the stage for further
experiments that will hopefully have important ramifications in the leukaemia field.

128
Chapter 6: Conclusions
129
6.1 Concluding remarks
AML may best be considered an umbrella term for a heterogeneous group of myeloid
leukaemias that are all characterized by proliferation of immature, clonal, myeloid
precursors but differ substantially with regards to the biological cause and clinical features.
Characterization of the molecular events underlying leukaemic growth furnishes distinctive
insights into the nature of the disease and provides useful clues to the prognosis of
individual patients. Indeed, the importance of delineating AML disease entities more
sharply has gained general appreciation, and cytogenetics as well as specific gene
mutations has become part of the essential and standard workup of patients with AML.
While the spectrum of the molecular abnormalities and pathways implicated in AML has
been extended over the last three decades, more precise distinctions are needed. Trib2 is
known to be a potent murine oncogene capable of inducing transplantable AML with
complete penetrance (Keeshan et al., 2006). Here, its tumorigenic role in the context of
myeloid malignancies is characterized and strengthened in a human leukaemic setting.
Data clearly show the importance of TRIB2 increased expression for the in vitro and in
vivo maintenance of the oncogenic properties of AML cells. These findings, together with
the detection of TRIB2 expression in a number of AML patient samples, add significant
value to the current understanding of leukaemogenesis. Since treatment of AML has
evolved side by side with a refinement in the molecular characterization of this
heterogeneous disease, as exemplified by the ATRA-APL case, two important questions
from the clinical point of view emerged from the abovementioned findings. These
questions are related to whether aberrant expression of TRIB2 has prognostic value in the
context of AML and whether high TRIB2 cells can be therapeutically targeted (as
discussed in the following paragraph). The xeno-engraftment study with AML patient
samples harbouring different levels of TRIB2 transcripts predicted an association with less
aggressive leukaemias. These are, however, preliminary results and a more exact
estimation of the prognosis can only be validated in large series of patients by multivariate
analysis encompassing for example the patients´ mutational status of the main recurrent
abnormalities (i.e., NPM1, FLT3, CEBPA and DNMT3A), as well as information regarding
age, WBC count or % of CD33 and CD34+ cells, which also have clinical implications
(Breccia and Lo-Coco, 2011, Gerber et al., 2012).
The growth-promoting and anti-apoptotic effects of TRIB2 in AML cells, herein described,
make it a rational target for antineoplastic agents. An approach to preventing TRIB2
130
tumorigenic role is to inhibit the proteasome, hence blocking degradation of the
granulopoiesis-related C/EBPα p42 via the Ub-proteasome system. The UPS is a selective
method of proteolysis that constitutes a salient example of how fundamental research can
have far-reaching implications for human biology and disease. Identified after 20 years of
research (Hershko, 2005), the Ub-dependent degradation system was found subsequently
to be aberrantly activated in a variety of malignancies, which resulted in the development
of drugs aimed at inhibiting the proteasome function. Indeed, two proteasome inhibitors
(Brtz and Cfz) have entered the clinical arena for the treatment of multiple myeloma and
mantle cell lymphoma. Current research and on-going clinical trials indicate that the full
therapeutic potential of proteasome inhibitors is beginning to be appreciated and suggest
that they will be part of our future armamentarium of drugs against a number of other
diseases. In fact, there is a body of evidence supporting the use of proteasome inhibitors as
a strategy for AML therapy, which may improve the currently unsatisfactory outcome of
the elderly patients. In the present study, it is shown that high TRIB2-expressing AML
cells are predictive for responsiveness to treatment with proteasome inhibition. These cells
can be pharmacologically targeted with Brtz, as well as with next-generation proteasome
inhibitors, due, at least in part, to blockage of the TRIB2 proteolytic function on C/EBPα
p42. The TRIB2- C/EBPα p42 axis can, therefore, be considered a new mechanism
whereby Brtz induces cytotoxicity. This is of particular importance as the apoptotic
cascades induced by proteasome inhibition are not yet fully defined and understanding the
molecular basis for the selectivity of the proteasome inhibitors will aid in their
development as anticancer agents. In addition, the therapeutic strategy and the obtained
results here presented have a potential broader applicability as they support its usefulness
in other AMLs with deregulated proteasome activity. Moreover, TRIB2 has been also
shown to have an oncogenic activity associated with proteasomal-degradation of its targets
in other malignancies (e.g., lung (Grandinetti et al., 2011) and liver (Xu et al., 2014)
cancer), for which the stated therapeutic strategy could as well be considered a logical
approach.
In the light of the main findings described above i.e. characterization of TRIB2 as an
important myeloid oncogene in human AML that can be selectively targeted by
proteasome inhibition, it was thereafter aimed to obtain a deeper understanding of the
processes associated with TRIB2-driven leukaemia, as it is hypothesised that other
molecular pathways are involved. A major mechanistic theme in AML biology is, in fact,
the extensive collaboration among genetic changes, fusion oncoproteins, transcription
factors and chromatin regulators to initiate and sustain an acute leukaemia phenotype
131
characterized by enhanced survival and impaired differentiation. Karyotype analysis of
murine-Trib2 AML cells suggested that TRIB2-driven AML was associated with the CN-
AML, hence excluding chromosomal alterations as the more likely cooperating events. In
pursuing this question, the primary enzyme responsible for symmetric dimethylation,
PRMT5, was identified as a TRIB2 binding partner, supporting previous results obtained
by mass spectrometry analysis, as well as the increasingly importance given to epigenetic
regulators in AML. The identification of an interaction between TRIB2 and PRMT5,
which were also functionally associated by sharing an identical role in AML cell survival,
reveals a potential pathway of regulation in TRIB2-driven AML that implicates the
epigenetic modifier PRMT5. These findings have empowered future studies that are
currently being investigated in the Keeshan lab.
In conclusion, the current study highlights the important oncogenic role of TRIB2 in
human AML maintenance and, significantly in such a molecularly heterogeneous
malignancy, a tailored therapeutic approach is suggested for the treatment of high TRIB2
AML by demonstration of a chemo-sensitive phenotype towards proteasome inhibitors.
These data also define a new molecular mechanism of apoptosis induced by these drugs.
Finally, a framework for further investigations into new TRIB2-AML partners is
established by the identification of PRMT5 as a cooperating protein. Altogether, these
findings have repercussions on the understanding of AML and on the portfolio of potential
therapeutic targets that may improve the outcome of the disease.

132
Appendices
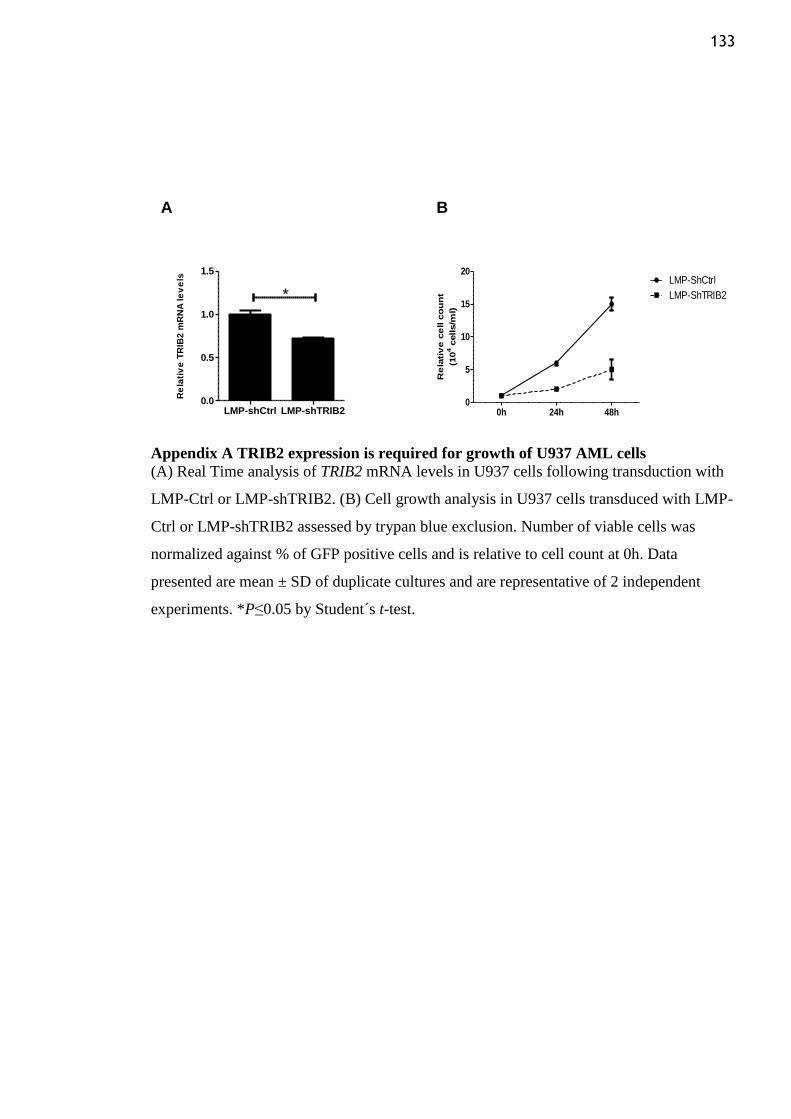
133
Appendix A TRIB2 expression is required for growth of U937 AML cells
(A) Real Time analysis of TRIB2 mRNA levels in U937 cells following transduction with
LMP-Ctrl or LMP-shTRIB2. (B) Cell growth analysis in U937 cells transduced with LMP-
Ctrl or LMP-shTRIB2 assessed by trypan blue exclusion. Number of viable cells was
normalized against % of GFP positive cells and is relative to cell count at 0h. Data
presented are mean ± SD of duplicate cultures and are representative of 2 independent
experiments. *P≤0.05 by Student´s t-test.
LMP-shCtrl LMP-shTRIB20.0
0.5
1.0
1.5
*
Re
lati
ve
TR
IB2
mR
NA
le
ve
ls
A B
0h 24h 48h0
5
10
15
20LMP-ShCtrl
LMP-ShTRIB2
Re
lati
ve
ce
ll c
ou
nt
(10
4 c
ells/m
l)
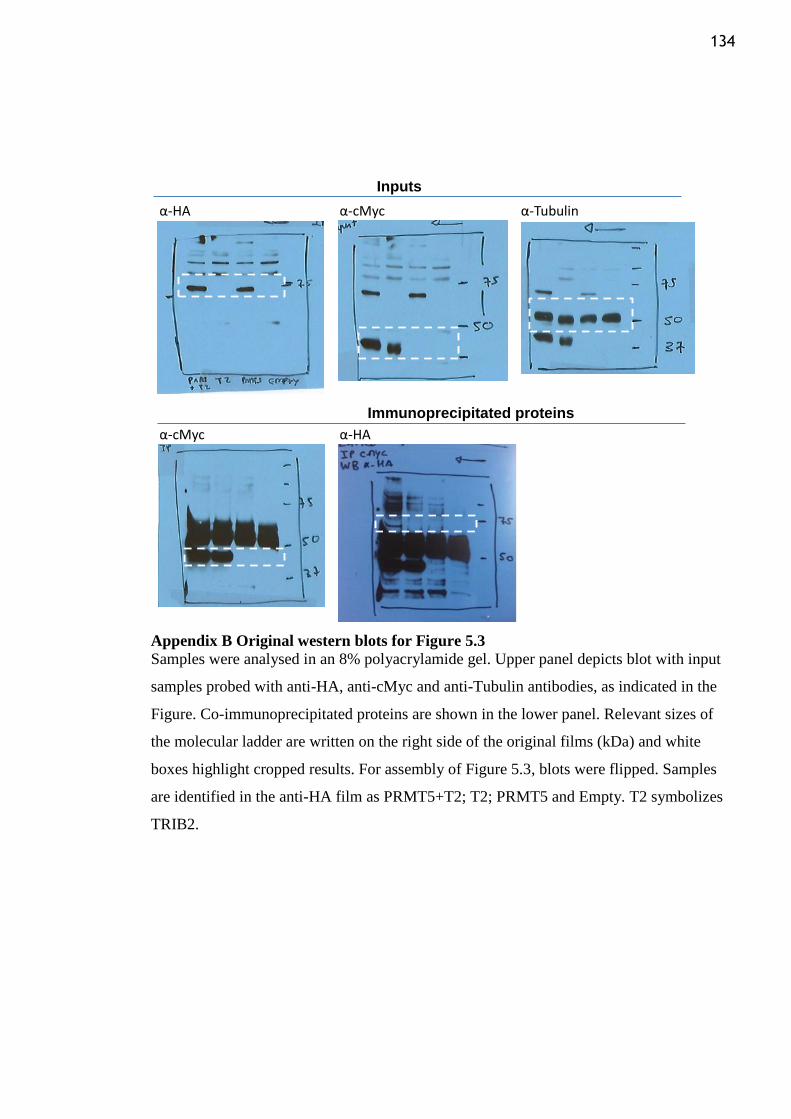
134
Appendix B Original western blots for Figure 5.3
Samples were analysed in an 8% polyacrylamide gel. Upper panel depicts blot with input
samples probed with anti-HA, anti-cMyc and anti-Tubulin antibodies, as indicated in the
Figure. Co-immunoprecipitated proteins are shown in the lower panel. Relevant sizes of
the molecular ladder are written on the right side of the original films (kDa) and white
boxes highlight cropped results. For assembly of Figure 5.3, blots were flipped. Samples
are identified in the anti-HA film as PRMT5+T2; T2; PRMT5 and Empty. T2 symbolizes
TRIB2.
α-HA α-cMyc
α-cMyc
α-Tubulin
α-HA
Inputs
Immunoprecipitated proteins
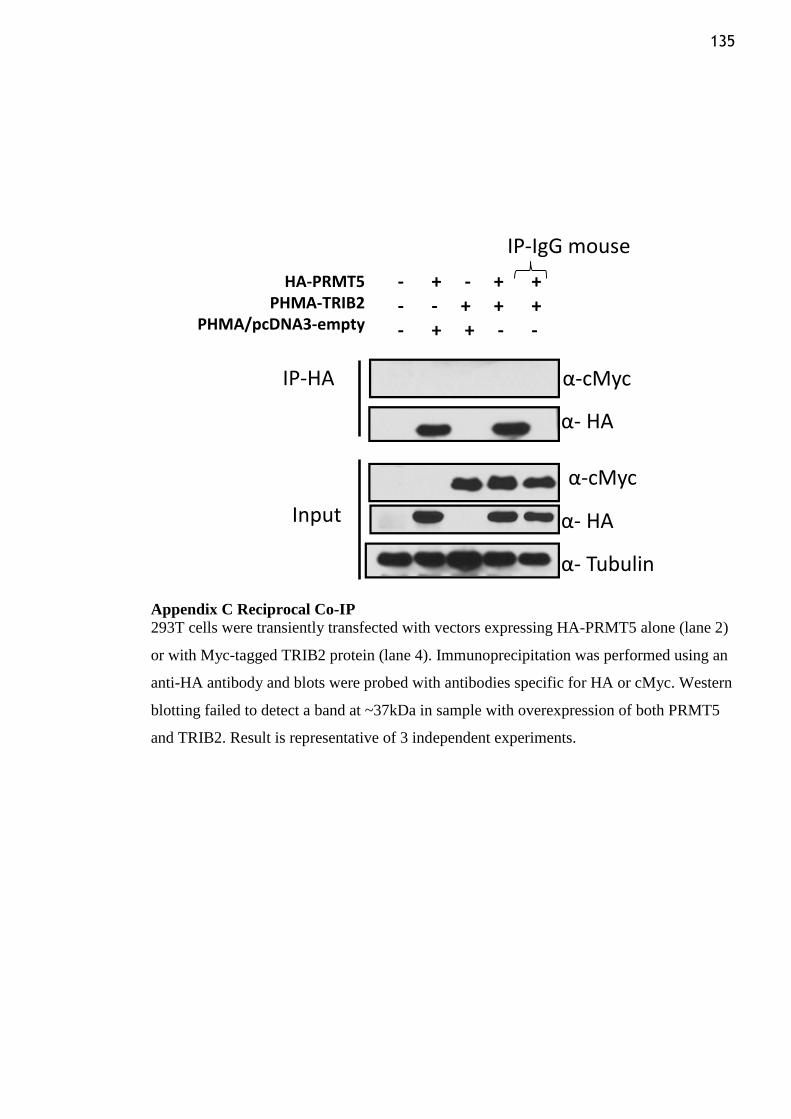
135
Appendix C Reciprocal Co-IP
293T cells were transiently transfected with vectors expressing HA-PRMT5 alone (lane 2)
or with Myc-tagged TRIB2 protein (lane 4). Immunoprecipitation was performed using an
anti-HA antibody and blots were probed with antibodies specific for HA or cMyc. Western
blotting failed to detect a band at ~37kDa in sample with overexpression of both PRMT5
and TRIB2. Result is representative of 3 independent experiments.
HA-PRMT5PHMA-TRIB2
PHMA/pcDNA3-empty
- + - + +- - + + + - + + - -
IP-HA α-cMyc
Input
α- Tubulin
α-cMyc
α- HA
α- HA
IP-IgG mouse
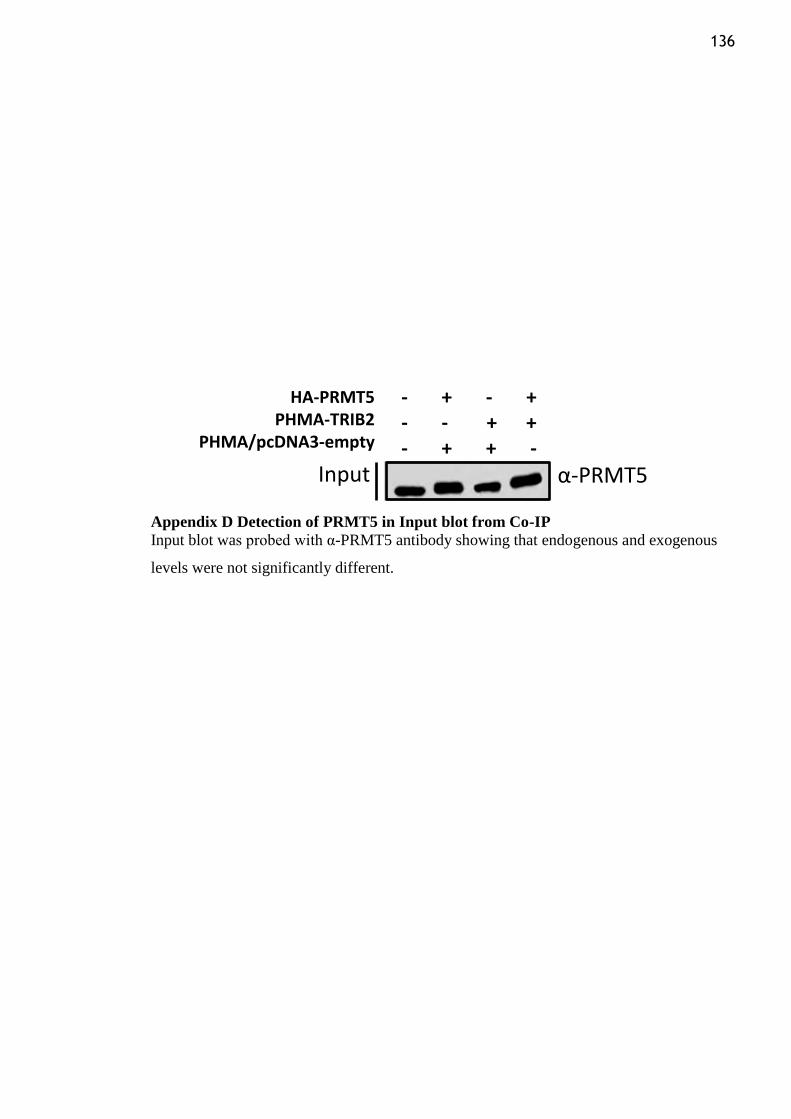
136
Appendix D Detection of PRMT5 in Input blot from Co-IP
Input blot was probed with α-PRMT5 antibody showing that endogenous and exogenous
levels were not significantly different.
HA-PRMT5PHMA-TRIB2
PHMA/pcDNA3-empty
- + - +- - + + - + + -
Input α-PRMT5
137
Appendix E PDF of “Regulation of Trib2 by an E2F1-C/EBPα feedback loop in AML
cell proliferation”
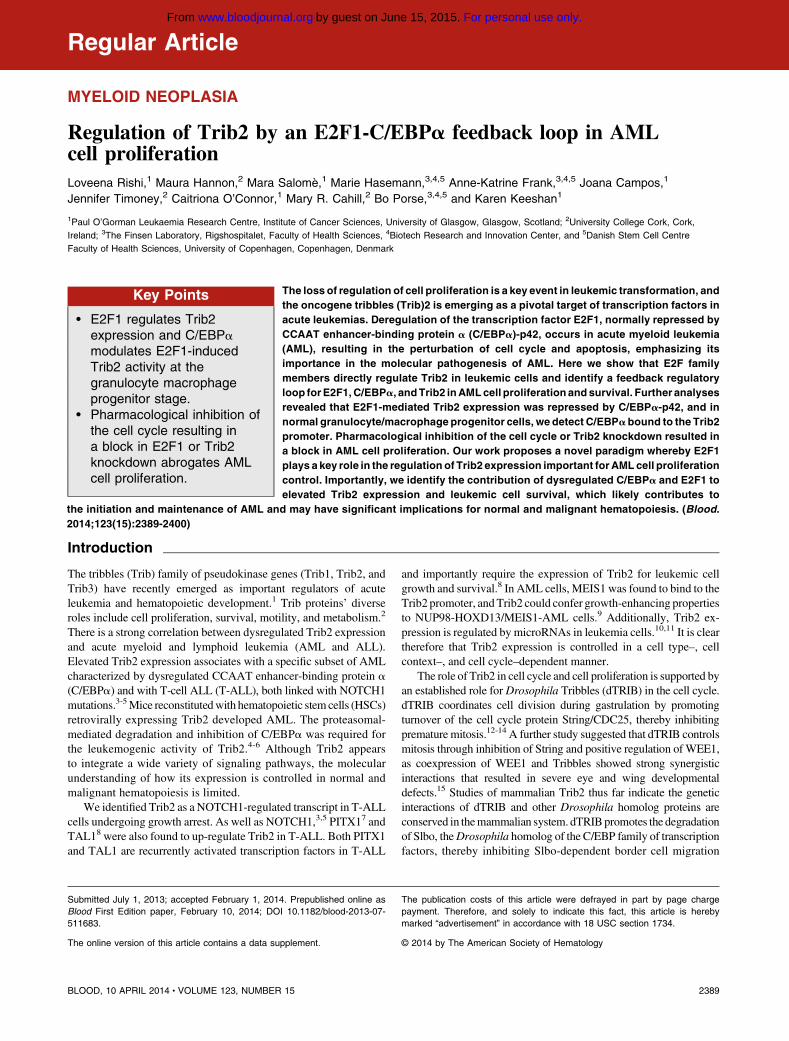
Regular Article
MYELOID NEOPLASIA
Regulation of Trib2 by an E2F1-C/EBPa feedback loop in AMLcell proliferationLoveena Rishi,1 Maura Hannon,2 Mara Salome,1 Marie Hasemann,3,4,5 Anne-Katrine Frank,3,4,5 Joana Campos,1
Jennifer Timoney,2 Caitriona O’Connor,1 Mary R. Cahill,2 Bo Porse,3,4,5 and Karen Keeshan1
1Paul O’Gorman Leukaemia Research Centre, Institute of Cancer Sciences, University of Glasgow, Glasgow, Scotland; 2University College Cork, Cork,
Ireland; 3The Finsen Laboratory, Rigshospitalet, Faculty of Health Sciences, 4Biotech Research and Innovation Center, and 5Danish Stem Cell Centre
Faculty of Health Sciences, University of Copenhagen, Copenhagen, Denmark
Key Points
• E2F1 regulates Trib2expression and C/EBPamodulates E2F1-inducedTrib2 activity at thegranulocyte macrophageprogenitor stage.
• Pharmacological inhibition ofthe cell cycle resulting ina block in E2F1 or Trib2knockdown abrogates AMLcell proliferation.
The loss of regulation of cell proliferation is a key event in leukemic transformation, and
the oncogene tribbles (Trib)2 is emerging as a pivotal target of transcription factors in
acute leukemias. Deregulation of the transcription factor E2F1, normally repressed by
CCAAT enhancer-binding protein a (C/EBPa)-p42, occurs in acute myeloid leukemia
(AML), resulting in the perturbation of cell cycle and apoptosis, emphasizing its
importance in the molecular pathogenesis of AML. Here we show that E2F family
members directly regulate Trib2 in leukemic cells and identify a feedback regulatory
loop forE2F1,C/EBPa, andTrib2 inAMLcell proliferationand survival. Further analyses
revealed that E2F1-mediated Trib2 expression was repressed by C/EBPa-p42, and in
normal granulocyte/macrophage progenitor cells, we detect C/EBPabound to the Trib2
promoter. Pharmacological inhibition of the cell cycle or Trib2 knockdown resulted in
a block in AML cell proliferation. Our work proposes a novel paradigm whereby E2F1
plays a key role in the regulation of Trib2 expression important forAML cell proliferation
control. Importantly, we identify the contribution of dysregulated C/EBPa and E2F1 to
elevated Trib2 expression and leukemic cell survival, which likely contributes to
the initiation and maintenance of AML and may have significant implications for normal and malignant hematopoiesis. (Blood.
2014;123(15):2389-2400)
Introduction
The tribbles (Trib) family of pseudokinase genes (Trib1, Trib2, andTrib3) have recently emerged as important regulators of acuteleukemia and hematopoietic development.1 Trib proteins’ diverseroles include cell proliferation, survival, motility, and metabolism.2
There is a strong correlation between dysregulated Trib2 expressionand acute myeloid and lymphoid leukemia (AML and ALL).Elevated Trib2 expression associates with a specific subset of AMLcharacterized by dysregulated CCAAT enhancer-binding protein a(C/EBPa) and with T-cell ALL (T-ALL), both linked with NOTCH1mutations.3-5Mice reconstitutedwith hematopoietic stem cells (HSCs)retrovirally expressing Trib2 developed AML. The proteasomal-mediated degradation and inhibition of C/EBPa was required forthe leukemogenic activity of Trib2.4-6 Although Trib2 appearsto integrate a wide variety of signaling pathways, the molecularunderstanding of how its expression is controlled in normal andmalignant hematopoiesis is limited.
We identified Trib2 as a NOTCH1-regulated transcript in T-ALLcells undergoing growth arrest. As well as NOTCH1,3,5 PITX17 andTAL18 were also found to up-regulate Trib2 in T-ALL. Both PITX1and TAL1 are recurrently activated transcription factors in T-ALL
and importantly require the expression of Trib2 for leukemic cellgrowth and survival.8 In AML cells, MEIS1 was found to bind to theTrib2 promoter, andTrib2 could confer growth-enhancing propertiesto NUP98-HOXD13/MEIS1-AML cells.9 Additionally, Trib2 ex-pression is regulated by microRNAs in leukemia cells.10,11 It is cleartherefore that Trib2 expression is controlled in a cell type–, cellcontext–, and cell cycle–dependent manner.
The role of Trib2 in cell cycle and cell proliferation is supported byan established role forDrosophila Tribbles (dTRIB) in the cell cycle.dTRIB coordinates cell division during gastrulation by promotingturnover of the cell cycle protein String/CDC25, thereby inhibitingpremature mitosis.12-14 A further study suggested that dTRIB controlsmitosis through inhibition of String and positive regulation of WEE1,as coexpression of WEE1 and Tribbles showed strong synergisticinteractions that resulted in severe eye and wing developmentaldefects.15 Studies of mammalian Trib2 thus far indicate the geneticinteractions of dTRIB and other Drosophila homolog proteins areconserved in themammalian system. dTRIBpromotes the degradationof Slbo, theDrosophila homolog of the C/EBP family of transcriptionfactors, thereby inhibiting Slbo-dependent border cell migration
Submitted July 1, 2013; accepted February 1, 2014. Prepublished online as
Blood First Edition paper, February 10, 2014; DOI 10.1182/blood-2013-07-
511683.
The online version of this article contains a data supplement.
The publication costs of this article were defrayed in part by page charge
payment. Therefore, and solely to indicate this fact, this article is hereby
marked “advertisement” in accordance with 18 USC section 1734.
© 2014 by The American Society of Hematology
BLOOD, 10 APRIL 2014 x VOLUME 123, NUMBER 15 2389
For personal use only.on June 15, 2015. by guest www.bloodjournal.orgFrom
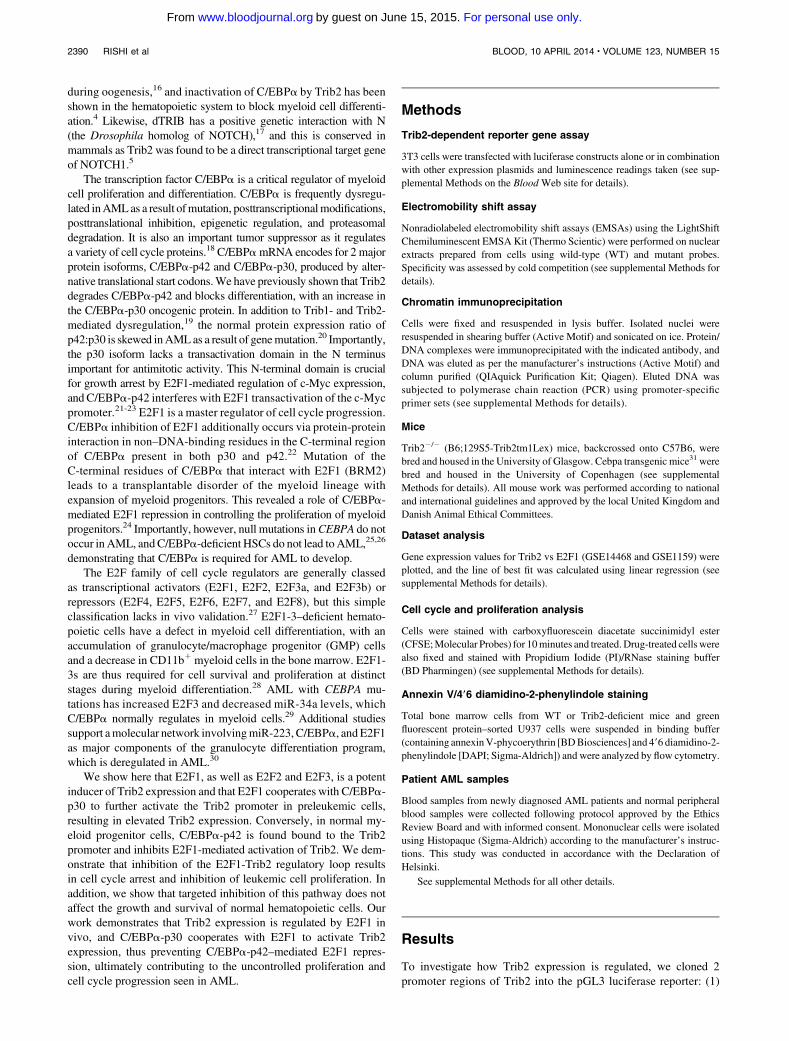
during oogenesis,16 and inactivation of C/EBPa by Trib2 has beenshown in the hematopoietic system to block myeloid cell differenti-ation.4 Likewise, dTRIB has a positive genetic interaction with N(the Drosophila homolog of NOTCH),17 and this is conserved inmammals as Trib2 was found to be a direct transcriptional target geneof NOTCH1.5
The transcription factor C/EBPa is a critical regulator of myeloidcell proliferation and differentiation. C/EBPa is frequently dysregu-lated inAMLas a result ofmutation, posttranscriptionalmodifications,posttranslational inhibition, epigenetic regulation, and proteasomaldegradation. It is also an important tumor suppressor as it regulatesa variety of cell cycle proteins.18 C/EBPamRNA encodes for 2 majorprotein isoforms, C/EBPa-p42 and C/EBPa-p30, produced by alter-native translational start codons.We have previously shown that Trib2degrades C/EBPa-p42 and blocks differentiation, with an increase inthe C/EBPa-p30 oncogenic protein. In addition to Trib1- and Trib2-mediated dysregulation,19 the normal protein expression ratio ofp42:p30 is skewed inAMLas a result of genemutation.20 Importantly,the p30 isoform lacks a transactivation domain in the N terminusimportant for antimitotic activity. This N-terminal domain is crucialfor growth arrest by E2F1-mediated regulation of c-Myc expression,andC/EBPa-p42 interferes with E2F1 transactivation of the c-Mycpromoter.21-23 E2F1 is a master regulator of cell cycle progression.C/EBPa inhibition of E2F1 additionally occurs via protein-proteininteraction in non–DNA-binding residues in the C-terminal regionof C/EBPa present in both p30 and p42.22 Mutation of theC-terminal residues of C/EBPa that interact with E2F1 (BRM2)leads to a transplantable disorder of the myeloid lineage withexpansion of myeloid progenitors. This revealed a role of C/EBPa-mediated E2F1 repression in controlling the proliferation of myeloidprogenitors.24 Importantly, however, null mutations inCEBPA do notoccur in AML, andC/EBPa-deficient HSCs do not lead toAML,25,26
demonstrating that C/EBPa is required for AML to develop.The E2F family of cell cycle regulators are generally classed
as transcriptional activators (E2F1, E2F2, E2F3a, and E2F3b) orrepressors (E2F4, E2F5, E2F6, E2F7, and E2F8), but this simpleclassification lacks in vivo validation.27 E2F1-3–deficient hemato-poietic cells have a defect in myeloid cell differentiation, with anaccumulation of granulocyte/macrophage progenitor (GMP) cellsand a decrease in CD11b1myeloid cells in the bone marrow. E2F1-3s are thus required for cell survival and proliferation at distinctstages during myeloid differentiation.28 AML with CEBPA mu-tations has increased E2F3 and decreased miR-34a levels, whichC/EBPa normally regulates in myeloid cells.29 Additional studiessupport amolecular network involvingmiR-223,C/EBPa, andE2F1as major components of the granulocyte differentiation program,which is deregulated in AML.30
We show here that E2F1, as well as E2F2 and E2F3, is a potentinducer of Trib2 expression and that E2F1 cooperates with C/EBPa-p30 to further activate the Trib2 promoter in preleukemic cells,resulting in elevated Trib2 expression. Conversely, in normal my-eloid progenitor cells, C/EBPa-p42 is found bound to the Trib2promoter and inhibits E2F1-mediated activation of Trib2. We dem-onstrate that inhibition of the E2F1-Trib2 regulatory loop resultsin cell cycle arrest and inhibition of leukemic cell proliferation. Inaddition, we show that targeted inhibition of this pathway does notaffect the growth and survival of normal hematopoietic cells. Ourwork demonstrates that Trib2 expression is regulated by E2F1 invivo, and C/EBPa-p30 cooperates with E2F1 to activate Trib2expression, thus preventing C/EBPa-p42–mediated E2F1 repres-sion, ultimately contributing to the uncontrolled proliferation andcell cycle progression seen in AML.
Methods
Trib2-dependent reporter gene assay
3T3 cells were transfected with luciferase constructs alone or in combinationwith other expression plasmids and luminescence readings taken (see sup-plemental Methods on the BloodWeb site for details).
Electromobility shift assay
Nonradiolabeled electromobility shift assays (EMSAs) using the LightShiftChemiluminescent EMSA Kit (Thermo Scientic) were performed on nuclearextracts prepared from cells using wild-type (WT) and mutant probes.Specificity was assessed by cold competition (see supplemental Methods fordetails).
Chromatin immunoprecipitation
Cells were fixed and resuspended in lysis buffer. Isolated nuclei wereresuspended in shearing buffer (Active Motif) and sonicated on ice. Protein/DNA complexes were immunoprecipitated with the indicated antibody, andDNA was eluted as per the manufacturer’s instructions (Active Motif) andcolumn purified (QIAquick Purification Kit; Qiagen). Eluted DNA wassubjected to polymerase chain reaction (PCR) using promoter-specificprimer sets (see supplemental Methods for details).
Mice
Trib22/2 (B6;129S5-Trib2tm1Lex) mice, backcrossed onto C57B6, werebred and housed in the University of Glasgow. Cebpa transgenic mice31 werebred and housed in the University of Copenhagen (see supplementalMethods for details). All mouse work was performed according to nationaland international guidelines and approved by the local United Kingdom andDanish Animal Ethical Committees.
Dataset analysis
Gene expression values for Trib2 vs E2F1 (GSE14468 and GSE1159) wereplotted, and the line of best fit was calculated using linear regression (seesupplemental Methods for details).
Cell cycle and proliferation analysis
Cells were stained with carboxyfluorescein diacetate succinimidyl ester(CFSE;Molecular Probes) for 10minutes and treated.Drug-treated cellswerealso fixed and stained with Propidium Iodide (PI)/RNase staining buffer(BD Pharmingen) (see supplemental Methods for details).
Annexin V/496 diamidino-2-phenylindole staining
Total bone marrow cells from WT or Trib2-deficient mice and greenfluorescent protein–sorted U937 cells were suspended in binding buffer(containing annexinV-phycoerythrin [BDBiosciences] and 496 diamidino-2-phenylindole [DAPI; Sigma-Aldrich]) and were analyzed by flow cytometry.
Patient AML samples
Blood samples from newly diagnosed AML patients and normal peripheralblood samples were collected following protocol approved by the EthicsReview Board and with informed consent. Mononuclear cells were isolatedusing Histopaque (Sigma-Aldrich) according to the manufacturer’s instruc-tions. This study was conducted in accordance with the Declaration ofHelsinki.
See supplemental Methods for all other details.
Results
To investigate how Trib2 expression is regulated, we cloned 2promoter regions of Trib2 into the pGL3 luciferase reporter: (1)
2390 RISHI et al BLOOD, 10 APRIL 2014 x VOLUME 123, NUMBER 15
For personal use only.on June 15, 2015. by guest www.bloodjournal.orgFrom
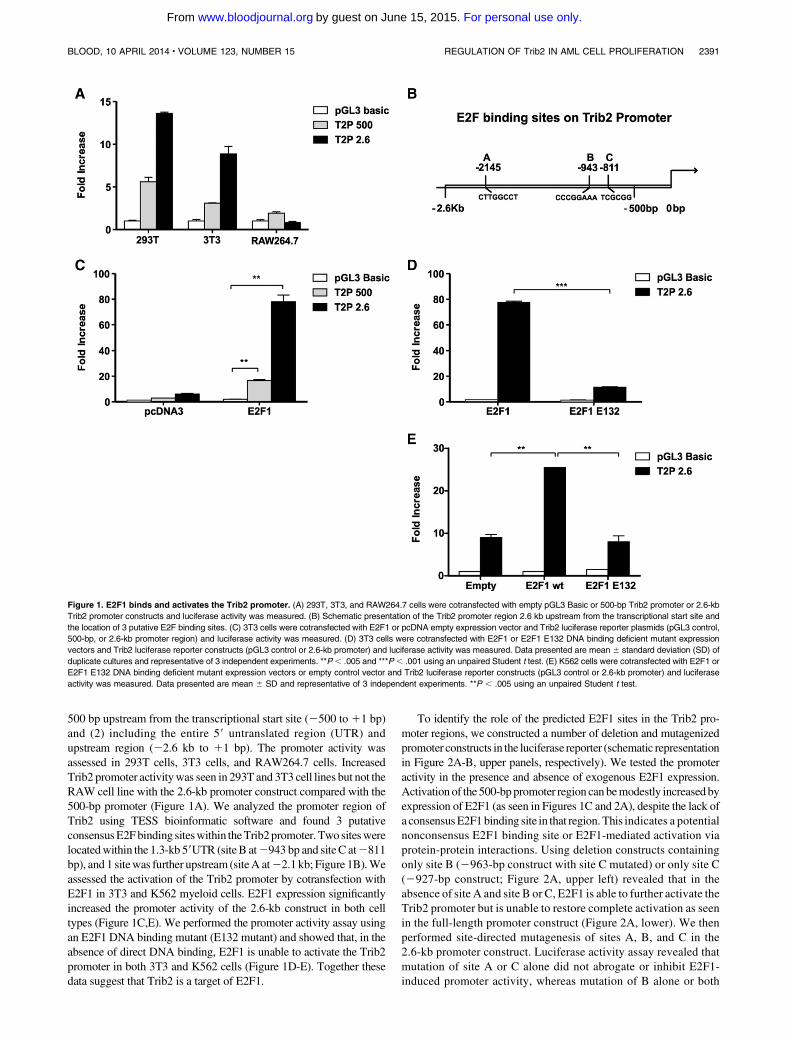
500 bp upstream from the transcriptional start site (2500 to11 bp)and (2) including the entire 59 untranslated region (UTR) andupstream region (22.6 kb to 11 bp). The promoter activity wasassessed in 293T cells, 3T3 cells, and RAW264.7 cells. IncreasedTrib2 promoter activitywas seen in 293T and 3T3 cell lines but not theRAW cell line with the 2.6-kb promoter construct compared with the500-bp promoter (Figure 1A). We analyzed the promoter region ofTrib2 using TESS bioinformatic software and found 3 putativeconsensusE2Fbinding siteswithin theTrib2promoter. Two siteswerelocatedwithin the 1.3-kb 59UTR (siteB at2943 bp and siteC at2811bp), and 1 sitewas further upstream (siteA at22.1 kb; Figure 1B).Weassessed the activation of the Trib2 promoter by cotransfection withE2F1 in 3T3 and K562 myeloid cells. E2F1 expression significantlyincreased the promoter activity of the 2.6-kb construct in both celltypes (Figure 1C,E). We performed the promoter activity assay usingan E2F1 DNA binding mutant (E132 mutant) and showed that, in theabsence of direct DNA binding, E2F1 is unable to activate the Trib2promoter in both 3T3 and K562 cells (Figure 1D-E). Together thesedata suggest that Trib2 is a target of E2F1.
To identify the role of the predicted E2F1 sites in the Trib2 pro-moter regions, we constructed a number of deletion and mutagenizedpromoter constructs in the luciferase reporter (schematic representationin Figure 2A-B, upper panels, respectively). We tested the promoteractivity in the presence and absence of exogenous E2F1 expression.Activation of the 500-bppromoter region canbemodestly increased byexpression of E2F1 (as seen in Figures 1C and 2A), despite the lack ofa consensusE2F1binding site in that region. This indicates a potentialnonconsensus E2F1 binding site or E2F1-mediated activation viaprotein-protein interactions. Using deletion constructs containingonly site B (2963-bp construct with site C mutated) or only site C(2927-bp construct; Figure 2A, upper left) revealed that in theabsence of site A and site B or C, E2F1 is able to further activate theTrib2 promoter but is unable to restore complete activation as seenin the full-length promoter construct (Figure 2A, lower). We thenperformed site-directed mutagenesis of sites A, B, and C in the2.6-kb promoter construct. Luciferase activity assay revealed thatmutation of site A or C alone did not abrogate or inhibit E2F1-induced promoter activity, whereas mutation of B alone or both
Figure 1. E2F1 binds and activates the Trib2 promoter. (A) 293T, 3T3, and RAW264.7 cells were cotransfected with empty pGL3 Basic or 500-bp Trib2 promoter or 2.6-kb
Trib2 promoter constructs and luciferase activity was measured. (B) Schematic presentation of the Trib2 promoter region 2.6 kb upstream from the transcriptional start site and
the location of 3 putative E2F binding sites. (C) 3T3 cells were cotransfected with E2F1 or pcDNA empty expression vector and Trib2 luciferase reporter plasmids (pGL3 control,
500-bp, or 2.6-kb promoter region) and luciferase activity was measured. (D) 3T3 cells were cotransfected with E2F1 or E2F1 E132 DNA binding deficient mutant expression
vectors and Trib2 luciferase reporter constructs (pGL3 control or 2.6-kb promoter) and luciferase activity was measured. Data presented are mean 6 standard deviation (SD) of
duplicate cultures and representative of 3 independent experiments. **P, .005 and ***P, .001 using an unpaired Student t test. (E) K562 cells were cotransfected with E2F1 or
E2F1 E132 DNA binding deficient mutant expression vectors or empty control vector and Trib2 luciferase reporter constructs (pGL3 control or 2.6-kb promoter) and luciferase
activity was measured. Data presented are mean 6 SD and representative of 3 independent experiments. **P , .005 using an unpaired Student t test.
BLOOD, 10 APRIL 2014 x VOLUME 123, NUMBER 15 REGULATION OF Trib2 IN AML CELL PROLIFERATION 2391
For personal use only.on June 15, 2015. by guest www.bloodjournal.orgFrom
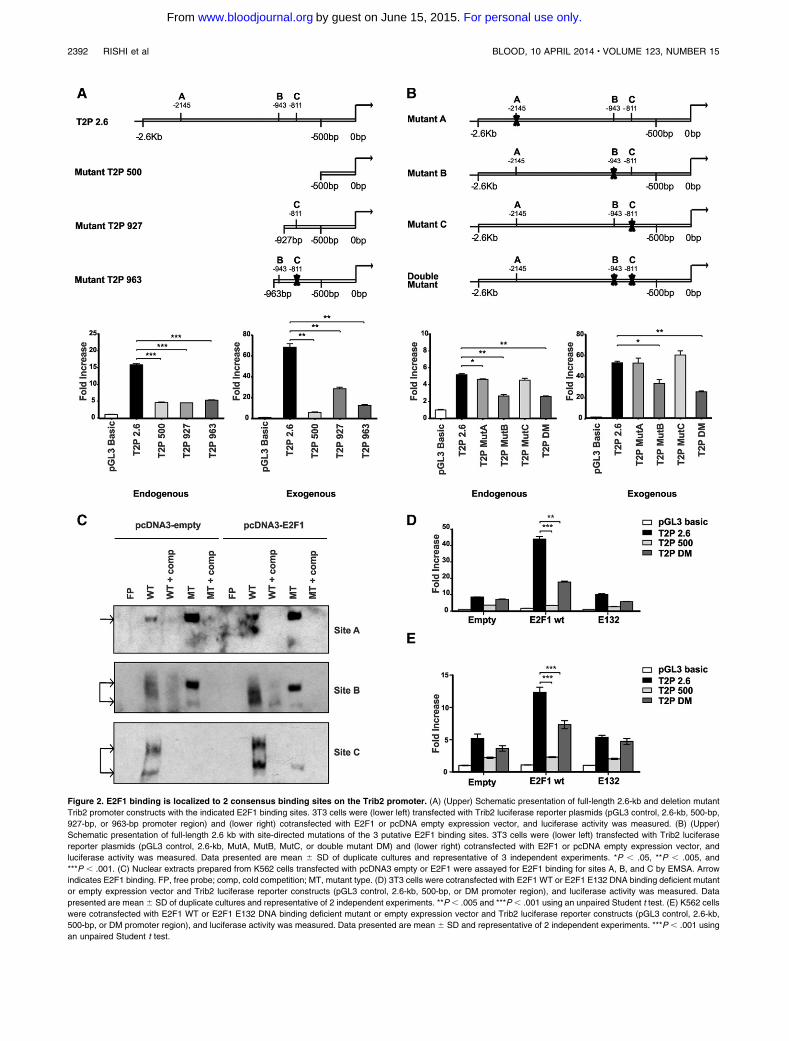
Figure 2. E2F1 binding is localized to 2 consensus binding sites on the Trib2 promoter. (A) (Upper) Schematic presentation of full-length 2.6-kb and deletion mutant
Trib2 promoter constructs with the indicated E2F1 binding sites. 3T3 cells were (lower left) transfected with Trib2 luciferase reporter plasmids (pGL3 control, 2.6-kb, 500-bp,
927-bp, or 963-bp promoter region) and (lower right) cotransfected with E2F1 or pcDNA empty expression vector, and luciferase activity was measured. (B) (Upper)
Schematic presentation of full-length 2.6 kb with site-directed mutations of the 3 putative E2F1 binding sites. 3T3 cells were (lower left) transfected with Trib2 luciferase
reporter plasmids (pGL3 control, 2.6-kb, MutA, MutB, MutC, or double mutant DM) and (lower right) cotransfected with E2F1 or pcDNA empty expression vector, and
luciferase activity was measured. Data presented are mean 6 SD of duplicate cultures and representative of 3 independent experiments. *P , .05, **P , .005, and
***P , .001. (C) Nuclear extracts prepared from K562 cells transfected with pcDNA3 empty or E2F1 were assayed for E2F1 binding for sites A, B, and C by EMSA. Arrow
indicates E2F1 binding. FP, free probe; comp, cold competition; MT, mutant type. (D) 3T3 cells were cotransfected with E2F1 WT or E2F1 E132 DNA binding deficient mutant
or empty expression vector and Trib2 luciferase reporter constructs (pGL3 control, 2.6-kb, 500-bp, or DM promoter region), and luciferase activity was measured. Data
presented are mean 6 SD of duplicate cultures and representative of 2 independent experiments. **P , .005 and ***P , .001 using an unpaired Student t test. (E) K562 cells
were cotransfected with E2F1 WT or E2F1 E132 DNA binding deficient mutant or empty expression vector and Trib2 luciferase reporter constructs (pGL3 control, 2.6-kb,
500-bp, or DM promoter region), and luciferase activity was measured. Data presented are mean 6 SD and representative of 2 independent experiments. ***P , .001 using
an unpaired Student t test.
2392 RISHI et al BLOOD, 10 APRIL 2014 x VOLUME 123, NUMBER 15
For personal use only.on June 15, 2015. by guest www.bloodjournal.orgFrom
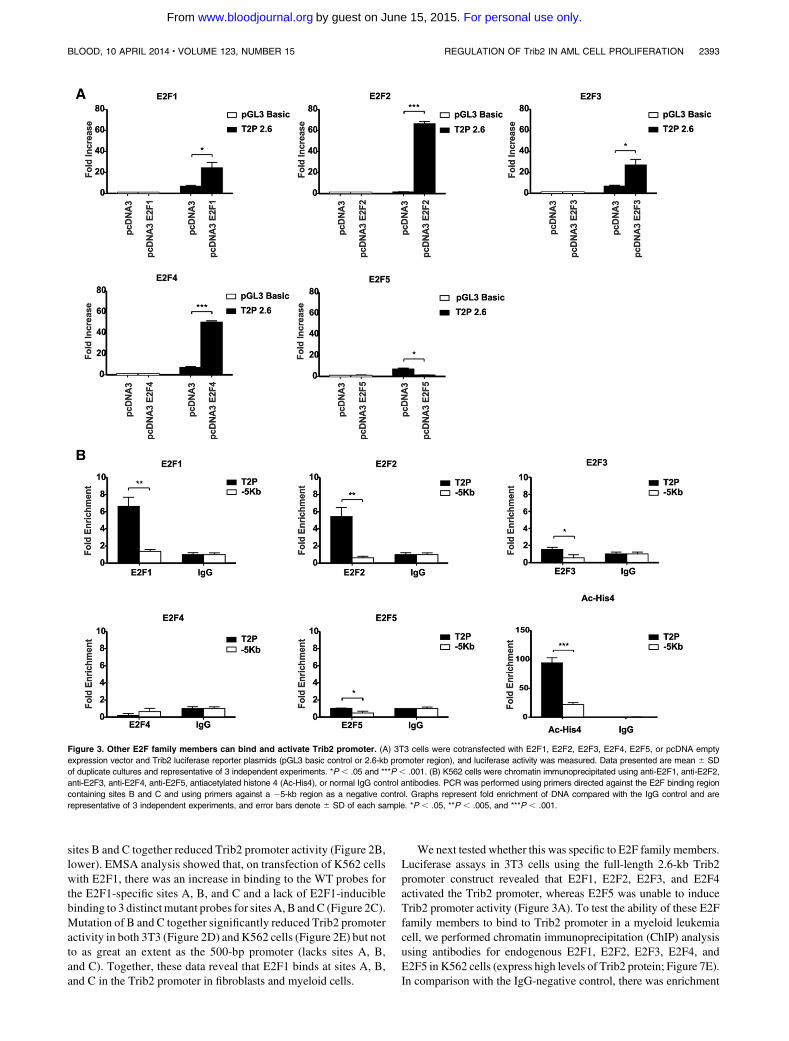
sites B and C together reduced Trib2 promoter activity (Figure 2B,lower). EMSA analysis showed that, on transfection of K562 cellswith E2F1, there was an increase in binding to the WT probes forthe E2F1-specific sites A, B, and C and a lack of E2F1-induciblebinding to 3 distinct mutant probes for sites A, B andC (Figure 2C).Mutation of B and C together significantly reduced Trib2 promoteractivity in both 3T3 (Figure 2D) and K562 cells (Figure 2E) but notto as great an extent as the 500-bp promoter (lacks sites A, B,and C). Together, these data reveal that E2F1 binds at sites A, B,and C in the Trib2 promoter in fibroblasts and myeloid cells.
We next tested whether this was specific to E2F family members.Luciferase assays in 3T3 cells using the full-length 2.6-kb Trib2promoter construct revealed that E2F1, E2F2, E2F3, and E2F4activated the Trib2 promoter, whereas E2F5 was unable to induceTrib2 promoter activity (Figure 3A). To test the ability of these E2Ffamily members to bind to Trib2 promoter in a myeloid leukemiacell, we performed chromatin immunoprecipitation (ChIP) analysisusing antibodies for endogenous E2F1, E2F2, E2F3, E2F4, andE2F5 in K562 cells (express high levels of Trib2 protein; Figure 7E).In comparison with the IgG-negative control, there was enrichment
Figure 3. Other E2F family members can bind and activate Trib2 promoter. (A) 3T3 cells were cotransfected with E2F1, E2F2, E2F3, E2F4, E2F5, or pcDNA empty
expression vector and Trib2 luciferase reporter plasmids (pGL3 basic control or 2.6-kb promoter region), and luciferase activity was measured. Data presented are mean 6 SD
of duplicate cultures and representative of 3 independent experiments. *P , .05 and ***P , .001. (B) K562 cells were chromatin immunoprecipitated using anti-E2F1, anti-E2F2,
anti-E2F3, anti-E2F4, anti-E2F5, antiacetylated histone 4 (Ac-His4), or normal IgG control antibodies. PCR was performed using primers directed against the E2F binding region
containing sites B and C and using primers against a 25-kb region as a negative control. Graphs represent fold enrichment of DNA compared with the IgG control and are
representative of 3 independent experiments, and error bars denote 6 SD of each sample. *P , .05, **P , .005, and ***P , .001.
BLOOD, 10 APRIL 2014 x VOLUME 123, NUMBER 15 REGULATION OF Trib2 IN AML CELL PROLIFERATION 2393
For personal use only.on June 15, 2015. by guest www.bloodjournal.orgFrom
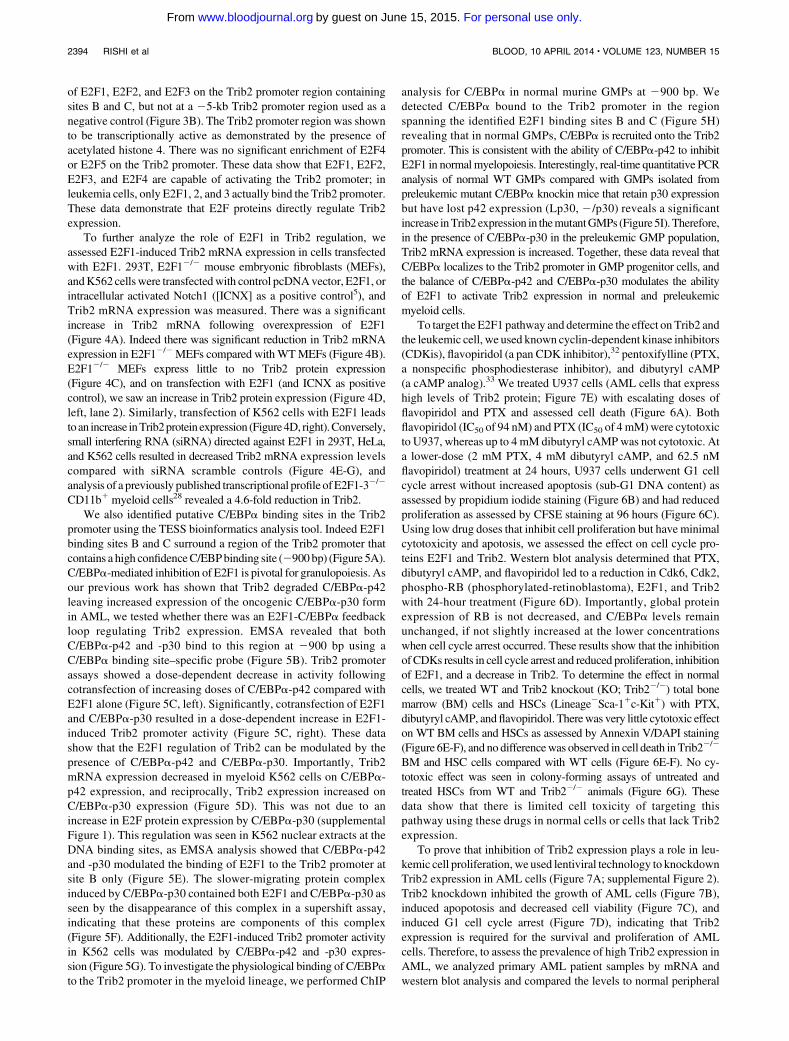
of E2F1, E2F2, and E2F3 on the Trib2 promoter region containingsites B and C, but not at a 25-kb Trib2 promoter region used as anegative control (Figure 3B). The Trib2 promoter region was shownto be transcriptionally active as demonstrated by the presence ofacetylated histone 4. There was no significant enrichment of E2F4or E2F5 on the Trib2 promoter. These data show that E2F1, E2F2,E2F3, and E2F4 are capable of activating the Trib2 promoter; inleukemia cells, only E2F1, 2, and 3 actually bind the Trib2 promoter.These data demonstrate that E2F proteins directly regulate Trib2expression.
To further analyze the role of E2F1 in Trib2 regulation, weassessed E2F1-induced Trib2 mRNA expression in cells transfectedwith E2F1. 293T, E2F12/2 mouse embryonic fibroblasts (MEFs),andK562 cells were transfectedwith control pcDNAvector, E2F1, orintracellular activated Notch1 ([ICNX] as a positive control5), andTrib2 mRNA expression was measured. There was a significantincrease in Trib2 mRNA following overexpression of E2F1(Figure 4A). Indeed there was significant reduction in Trib2 mRNAexpression in E2F12/2MEFs compared withWTMEFs (Figure 4B).E2F12/2 MEFs express little to no Trib2 protein expression(Figure 4C), and on transfection with E2F1 (and ICNX as positivecontrol), we saw an increase in Trib2 protein expression (Figure 4D,left, lane 2). Similarly, transfection of K562 cells with E2F1 leadstoan increase inTrib2protein expression (Figure4D, right).Conversely,small interfering RNA (siRNA) directed against E2F1 in 293T, HeLa,and K562 cells resulted in decreased Trib2 mRNA expression levelscompared with siRNA scramble controls (Figure 4E-G), andanalysis of a previously published transcriptional profile ofE2F1-32/2
CD11b1 myeloid cells28 revealed a 4.6-fold reduction in Trib2.We also identified putative C/EBPa binding sites in the Trib2
promoter using the TESS bioinformatics analysis tool. Indeed E2F1binding sites B and C surround a region of the Trib2 promoter thatcontains a high confidenceC/EBPbinding site (2900 bp) (Figure 5A).C/EBPa-mediated inhibition of E2F1 is pivotal for granulopoiesis. Asour previous work has shown that Trib2 degraded C/EBPa-p42leaving increased expression of the oncogenic C/EBPa-p30 formin AML, we tested whether there was an E2F1-C/EBPa feedbackloop regulating Trib2 expression. EMSA revealed that bothC/EBPa-p42 and -p30 bind to this region at 2900 bp using aC/EBPa binding site–specific probe (Figure 5B). Trib2 promoterassays showed a dose-dependent decrease in activity followingcotransfection of increasing doses of C/EBPa-p42 compared withE2F1 alone (Figure 5C, left). Significantly, cotransfection of E2F1and C/EBPa-p30 resulted in a dose-dependent increase in E2F1-induced Trib2 promoter activity (Figure 5C, right). These datashow that the E2F1 regulation of Trib2 can be modulated by thepresence of C/EBPa-p42 and C/EBPa-p30. Importantly, Trib2mRNA expression decreased in myeloid K562 cells on C/EBPa-p42 expression, and reciprocally, Trib2 expression increased onC/EBPa-p30 expression (Figure 5D). This was not due to anincrease in E2F protein expression by C/EBPa-p30 (supplementalFigure 1). This regulation was seen in K562 nuclear extracts at theDNA binding sites, as EMSA analysis showed that C/EBPa-p42and -p30 modulated the binding of E2F1 to the Trib2 promoter atsite B only (Figure 5E). The slower-migrating protein complexinduced by C/EBPa-p30 contained both E2F1 and C/EBPa-p30 asseen by the disappearance of this complex in a supershift assay,indicating that these proteins are components of this complex(Figure 5F). Additionally, the E2F1-induced Trib2 promoter activityin K562 cells was modulated by C/EBPa-p42 and -p30 expres-sion (Figure 5G). To investigate the physiological binding of C/EBPato the Trib2 promoter in the myeloid lineage, we performed ChIP
analysis for C/EBPa in normal murine GMPs at 2900 bp. Wedetected C/EBPa bound to the Trib2 promoter in the regionspanning the identified E2F1 binding sites B and C (Figure 5H)revealing that in normal GMPs, C/EBPa is recruited onto the Trib2promoter. This is consistent with the ability of C/EBPa-p42 to inhibitE2F1 in normalmyelopoiesis. Interestingly, real-time quantitative PCRanalysis of normal WT GMPs compared with GMPs isolated frompreleukemic mutant C/EBPa knockin mice that retain p30 expressionbut have lost p42 expression (Lp30, 2/p30) reveals a significantincrease inTrib2 expression in themutantGMPs (Figure 5I).Therefore,in the presence of C/EBPa-p30 in the preleukemic GMP population,Trib2 mRNA expression is increased. Together, these data reveal thatC/EBPa localizes to the Trib2 promoter in GMP progenitor cells, andthe balance of C/EBPa-p42 and C/EBPa-p30 modulates the abilityof E2F1 to activate Trib2 expression in normal and preleukemicmyeloid cells.
To target the E2F1 pathway and determine the effect on Trib2 andthe leukemic cell, we used known cyclin-dependent kinase inhibitors(CDKis), flavopiridol (a pan CDK inhibitor),32 pentoxifylline (PTX,a nonspecific phosphodiesterase inhibitor), and dibutyryl cAMP(a cAMP analog).33 We treated U937 cells (AML cells that expresshigh levels of Trib2 protein; Figure 7E) with escalating doses offlavopiridol and PTX and assessed cell death (Figure 6A). Bothflavopiridol (IC50 of 94 nM) and PTX (IC50 of 4 mM)were cytotoxicto U937, whereas up to 4 mM dibutyryl cAMPwas not cytotoxic. Ata lower-dose (2 mM PTX, 4 mM dibutyryl cAMP, and 62.5 nMflavopiridol) treatment at 24 hours, U937 cells underwent G1 cellcycle arrest without increased apoptosis (sub-G1 DNA content) asassessed by propidium iodide staining (Figure 6B) and had reducedproliferation as assessed by CFSE staining at 96 hours (Figure 6C).Using low drug doses that inhibit cell proliferation but have minimalcytotoxicity and apotosis, we assessed the effect on cell cycle pro-teins E2F1 and Trib2. Western blot analysis determined that PTX,dibutyryl cAMP, and flavopiridol led to a reduction in Cdk6, Cdk2,phospho-RB (phosphorylated-retinoblastoma), E2F1, and Trib2with 24-hour treatment (Figure 6D). Importantly, global proteinexpression of RB is not decreased, and C/EBPa levels remainunchanged, if not slightly increased at the lower concentrationswhen cell cycle arrest occurred. These results show that the inhibitionof CDKs results in cell cycle arrest and reduced proliferation, inhibitionof E2F1, and a decrease in Trib2. To determine the effect in normalcells, we treated WT and Trib2 knockout (KO; Trib22/2) total bonemarrow (BM) cells and HSCs (Lineage2Sca-11c-Kit1) with PTX,dibutyryl cAMP, andflavopiridol. Therewas very little cytotoxic effecton WT BM cells and HSCs as assessed by Annexin V/DAPI staining(Figure 6E-F), and no differencewas observed in cell death in Trib22/2
BM and HSC cells compared with WT cells (Figure 6E-F). No cy-totoxic effect was seen in colony-forming assays of untreated andtreated HSCs from WT and Trib22/2 animals (Figure 6G). Thesedata show that there is limited cell toxicity of targeting thispathway using these drugs in normal cells or cells that lack Trib2expression.
To prove that inhibition of Trib2 expression plays a role in leu-kemic cell proliferation, we used lentiviral technology to knockdownTrib2 expression in AML cells (Figure 7A; supplemental Figure 2).Trib2 knockdown inhibited the growth of AML cells (Figure 7B),induced apopotosis and decreased cell viability (Figure 7C), andinduced G1 cell cycle arrest (Figure 7D), indicating that Trib2expression is required for the survival and proliferation of AMLcells. Therefore, to assess the prevalence of high Trib2 expression inAML, we analyzed primary AML patient samples by mRNA andwestern blot analysis and compared the levels to normal peripheral
2394 RISHI et al BLOOD, 10 APRIL 2014 x VOLUME 123, NUMBER 15
For personal use only.on June 15, 2015. by guest www.bloodjournal.orgFrom
blood samples (N1-6), normal lymphoblast cell lines (CV1665 andCV1939), and myeloid leukemic cell lines (K562, U937, ML-1,Kasumi, and SB1690CB). We detected high Trib2 expression in
AML patient samples compared with normal controls (Figure 7E).High E2F1 expression correlated with high Trib2 protein expression(Figure 7E). AML patient datasets were investigated for a correlative
Figure 4. E2F1 regulates Trib2 mRNA and protein expression levels. (A) (Left) E2F12/2 (KO) MEFs, (center) 293T, or (right) K562 cells transfected with E2F1, pcDNA
control, or ICNX as indicated were measured for Trib2 mRNA expression by real-time PCR analyses. Data are presented relative to control pcDNA transfected cells 6 SD of
duplicate cultures. *P , .05, **P , .005, and ***P , .001. (B) WT and E2F12/2 (KO) SV40 MEFs were measured for (left) E2F1 and (right) Trib2 mRNA expression by real-
time PCR analyses. (C) Western blot analyses of E2F1 and Trib2 protein levels in WT and E2F12/2 (KO) MEFs. Actin shown as protein loading control. (D) (Left) E2F12/2
(KO) MEFs or (right) K562 cells were transfected with pcDNA3 empty vector, E2F1, ICNX, or Trib2 as indicated, and western blot analyses were performed for Trib2, E2F1,
and actin as a loading control. (E) 293T, (F) HeLa, and (G) K562 cells were transfected with scrambled control siRNA and siE2F1 (1 or 2 different E2F1 siRNAs as indicated),
and real-time PCR analysis was performed for E2F1 and Trib2. Data are presented relative to control transfected cells and representative of 2 independent experiments. Error
bars denote 6 SD of each sample measured in triplicate. *P , .05, **P , .005, and ***P , .001.
BLOOD, 10 APRIL 2014 x VOLUME 123, NUMBER 15 REGULATION OF Trib2 IN AML CELL PROLIFERATION 2395
For personal use only.on June 15, 2015. by guest www.bloodjournal.orgFrom
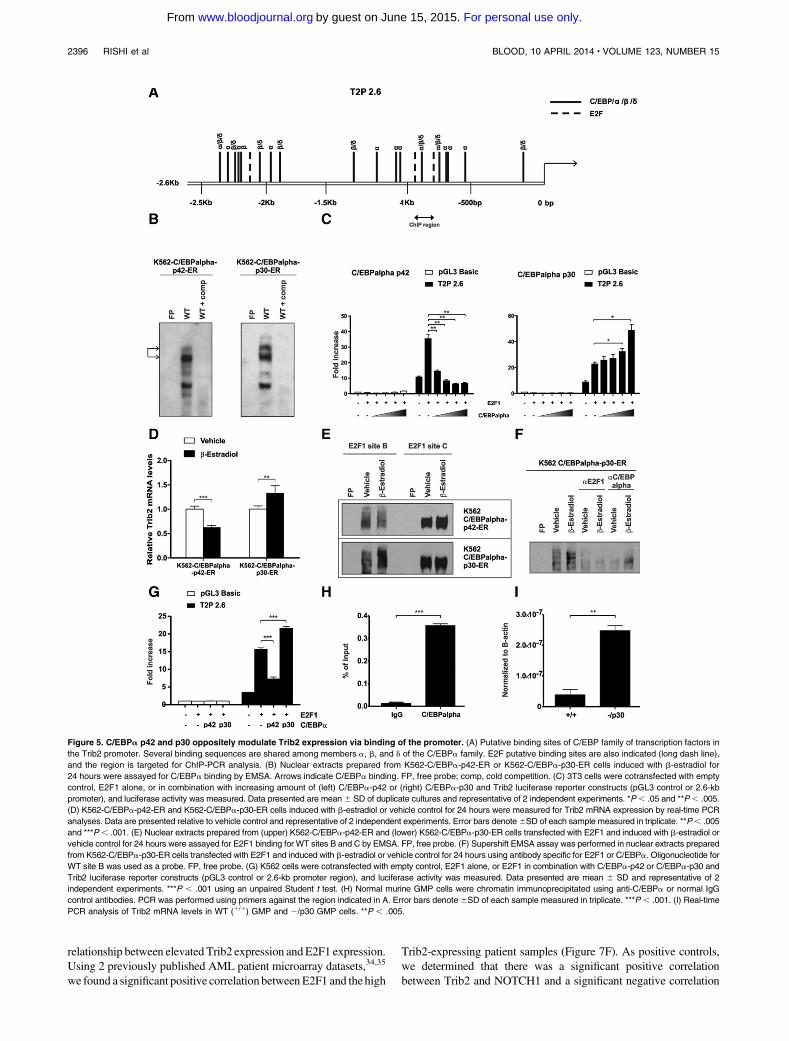
relationship between elevated Trib2 expression andE2F1 expression.Using 2 previously published AML patient microarray datasets,34,35
we found a significant positive correlation between E2F1 and the high
Trib2-expressing patient samples (Figure 7F). As positive controls,we determined that there was a significant positive correlationbetween Trib2 and NOTCH1 and a significant negative correlation
Figure 5. C/EBPa p42 and p30 oppositely modulate Trib2 expression via binding of the promoter. (A) Putative binding sites of C/EBP family of transcription factors in
the Trib2 promoter. Several binding sequences are shared among members a, b, and d of the C/EBPa family. E2F putative binding sites are also indicated (long dash line),
and the region is targeted for ChIP-PCR analysis. (B) Nuclear extracts prepared from K562-C/EBPa-p42-ER or K562-C/EBPa-p30-ER cells induced with b-estradiol for
24 hours were assayed for C/EBPa binding by EMSA. Arrows indicate C/EBPa binding. FP, free probe; comp, cold competition. (C) 3T3 cells were cotransfected with empty
control, E2F1 alone, or in combination with increasing amount of (left) C/EBPa-p42 or (right) C/EBPa-p30 and Trib2 luciferase reporter constructs (pGL3 control or 2.6-kb
promoter), and luciferase activity was measured. Data presented are mean6 SD of duplicate cultures and representative of 2 independent experiments. *P , .05 and **P, .005.
(D) K562-C/EBPa-p42-ER and K562-C/EBPa-p30-ER cells induced with b-estradiol or vehicle control for 24 hours were measured for Trib2 mRNA expression by real-time PCR
analyses. Data are presented relative to vehicle control and representative of 2 independent experiments. Error bars denote6SD of each sample measured in triplicate. **P, .005
and ***P , .001. (E) Nuclear extracts prepared from (upper) K562-C/EBPa-p42-ER and (lower) K562-C/EBPa-p30-ER cells transfected with E2F1 and induced with b-estradiol or
vehicle control for 24 hours were assayed for E2F1 binding for WT sites B and C by EMSA. FP, free probe. (F) Supershift EMSA assay was performed in nuclear extracts prepared
from K562-C/EBPa-p30-ER cells transfected with E2F1 and induced with b-estradiol or vehicle control for 24 hours using antibody specific for E2F1 or C/EBPa. Oligonucleotide for
WT site B was used as a probe. FP, free probe. (G) K562 cells were cotransfected with empty control, E2F1 alone, or E2F1 in combination with C/EBPa-p42 or C/EBPa-p30 and
Trib2 luciferase reporter constructs (pGL3 control or 2.6-kb promoter region), and luciferase activity was measured. Data presented are mean 6 SD and representative of 2
independent experiments. ***P , .001 using an unpaired Student t test. (H) Normal murine GMP cells were chromatin immunoprecipitated using anti-C/EBPa or normal IgG
control antibodies. PCR was performed using primers against the region indicated in A. Error bars denote 6SD of each sample measured in triplicate. ***P , .001. (I) Real-time
PCR analysis of Trib2 mRNA levels in WT (1/1) GMP and 2/p30 GMP cells. **P , .005.
2396 RISHI et al BLOOD, 10 APRIL 2014 x VOLUME 123, NUMBER 15
For personal use only.on June 15, 2015. by guest www.bloodjournal.orgFrom
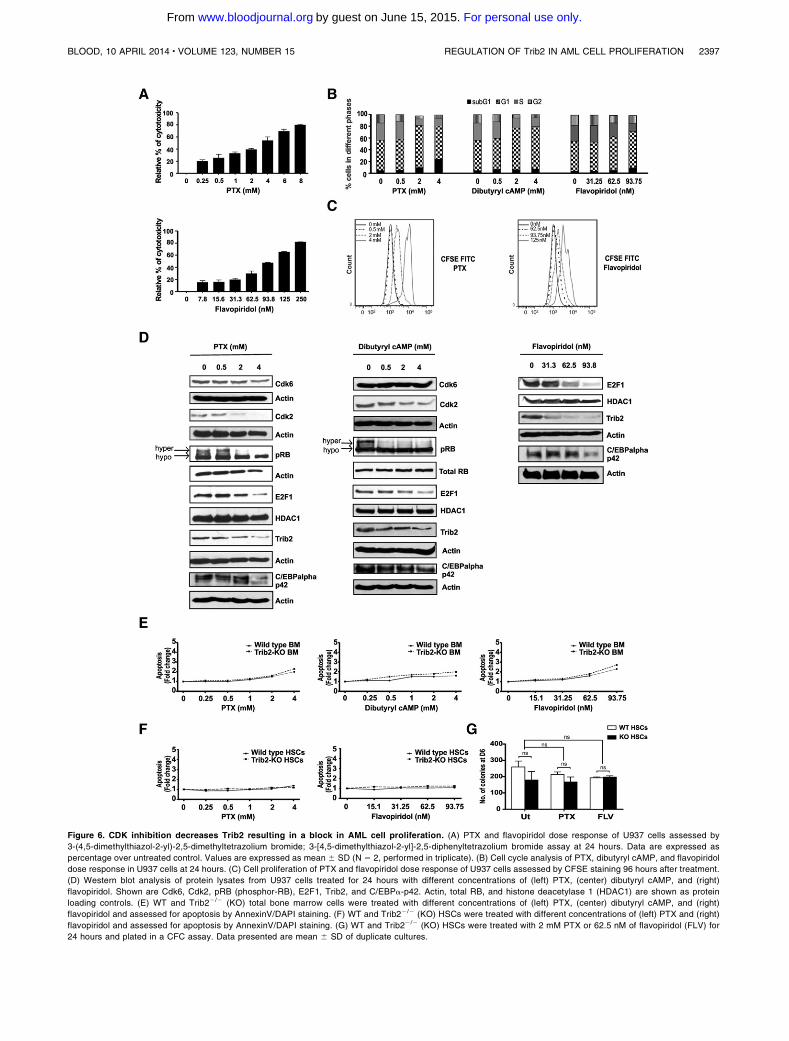
Figure 6. CDK inhibition decreases Trib2 resulting in a block in AML cell proliferation. (A) PTX and flavopiridol dose response of U937 cells assessed by
3-(4,5-dimethylthiazol-2-yl)-2,5-dimethyltetrazolium bromide; 3-[4,5-dimethylthiazol-2-yl]-2,5-diphenyltetrazolium bromide assay at 24 hours. Data are expressed as
percentage over untreated control. Values are expressed as mean 6 SD (N 5 2, performed in triplicate). (B) Cell cycle analysis of PTX, dibutyryl cAMP, and flavopiridol
dose response in U937 cells at 24 hours. (C) Cell proliferation of PTX and flavopiridol dose response of U937 cells assessed by CFSE staining 96 hours after treatment.
(D) Western blot analysis of protein lysates from U937 cells treated for 24 hours with different concentrations of (left) PTX, (center) dibutyryl cAMP, and (right)
flavopiridol. Shown are Cdk6, Cdk2, pRB (phosphor-RB), E2F1, Trib2, and C/EBPa-p42. Actin, total RB, and histone deacetylase 1 (HDAC1) are shown as protein
loading controls. (E) WT and Trib22/2 (KO) total bone marrow cells were treated with different concentrations of (left) PTX, (center) dibutyryl cAMP, and (right)
flavopiridol and assessed for apoptosis by AnnexinV/DAPI staining. (F) WT and Trib22/2 (KO) HSCs were treated with different concentrations of (left) PTX and (right)
flavopiridol and assessed for apoptosis by AnnexinV/DAPI staining. (G) WT and Trib22/2 (KO) HSCs were treated with 2 mM PTX or 62.5 nM of flavopiridol (FLV) for
24 hours and plated in a CFC assay. Data presented are mean 6 SD of duplicate cultures.
BLOOD, 10 APRIL 2014 x VOLUME 123, NUMBER 15 REGULATION OF Trib2 IN AML CELL PROLIFERATION 2397
For personal use only.on June 15, 2015. by guest www.bloodjournal.orgFrom
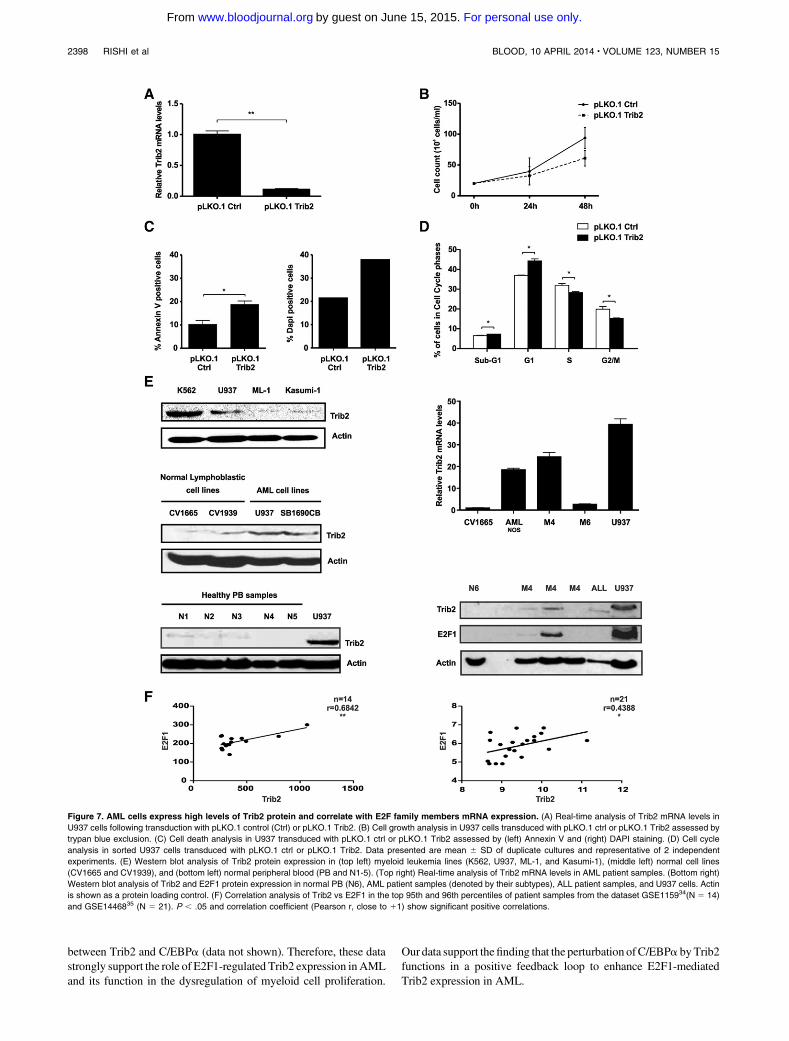
between Trib2 and C/EBPa (data not shown). Therefore, these datastrongly support the role of E2F1-regulated Trib2 expression inAMLand its function in the dysregulation of myeloid cell proliferation.
Our data support thefinding that the perturbation ofC/EBPa byTrib2functions in a positive feedback loop to enhance E2F1-mediatedTrib2 expression in AML.
Figure 7. AML cells express high levels of Trib2 protein and correlate with E2F family members mRNA expression. (A) Real-time analysis of Trib2 mRNA levels in
U937 cells following transduction with pLKO.1 control (Ctrl) or pLKO.1 Trib2. (B) Cell growth analysis in U937 cells transduced with pLKO.1 ctrl or pLKO.1 Trib2 assessed by
trypan blue exclusion. (C) Cell death analysis in U937 transduced with pLKO.1 ctrl or pLKO.1 Trib2 assessed by (left) Annexin V and (right) DAPI staining. (D) Cell cycle
analysis in sorted U937 cells transduced with pLKO.1 ctrl or pLKO.1 Trib2. Data presented are mean 6 SD of duplicate cultures and representative of 2 independent
experiments. (E) Western blot analysis of Trib2 protein expression in (top left) myeloid leukemia lines (K562, U937, ML-1, and Kasumi-1), (middle left) normal cell lines
(CV1665 and CV1939), and (bottom left) normal peripheral blood (PB and N1-5). (Top right) Real-time analysis of Trib2 mRNA levels in AML patient samples. (Bottom right)
Western blot analysis of Trib2 and E2F1 protein expression in normal PB (N6), AML patient samples (denoted by their subtypes), ALL patient samples, and U937 cells. Actin
is shown as a protein loading control. (F) Correlation analysis of Trib2 vs E2F1 in the top 95th and 96th percentiles of patient samples from the dataset GSE115934(N 5 14)
and GSE1446835 (N 5 21). P , .05 and correlation coefficient (Pearson r, close to 11) show significant positive correlations.
2398 RISHI et al BLOOD, 10 APRIL 2014 x VOLUME 123, NUMBER 15
For personal use only.on June 15, 2015. by guest www.bloodjournal.orgFrom
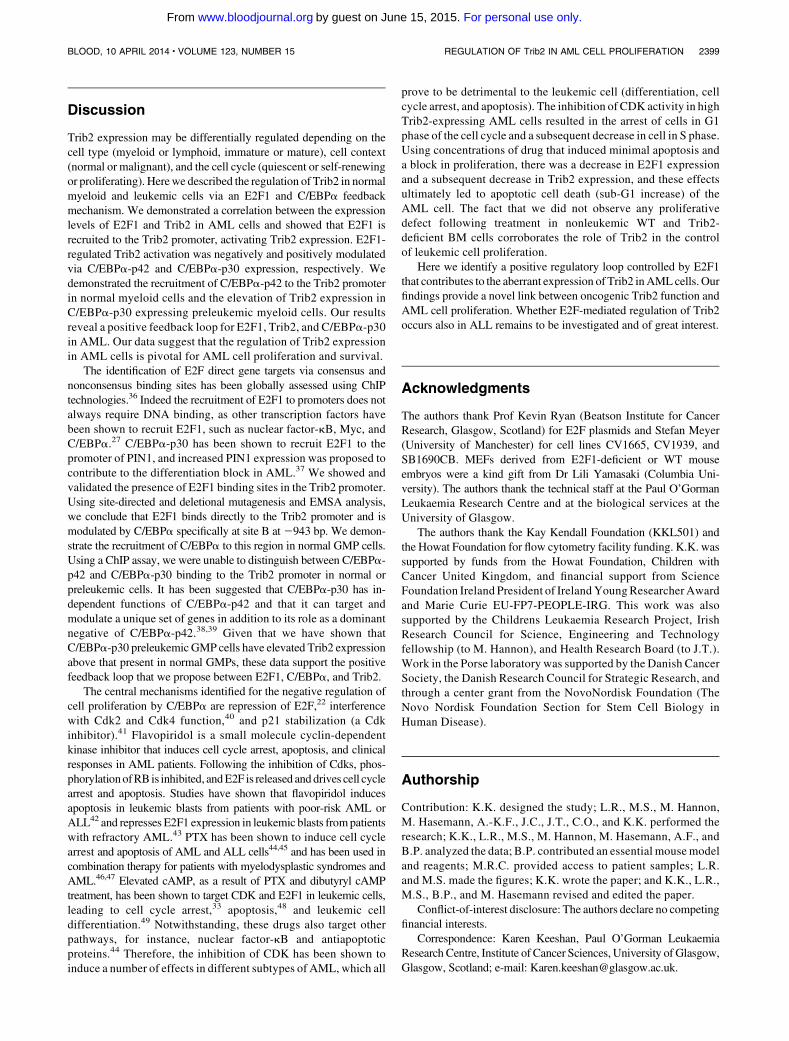
Discussion
Trib2 expression may be differentially regulated depending on thecell type (myeloid or lymphoid, immature or mature), cell context(normal or malignant), and the cell cycle (quiescent or self-renewingor proliferating). Herewe described the regulation of Trib2 in normalmyeloid and leukemic cells via an E2F1 and C/EBPa feedbackmechanism. We demonstrated a correlation between the expressionlevels of E2F1 and Trib2 in AML cells and showed that E2F1 isrecruited to the Trib2 promoter, activating Trib2 expression. E2F1-regulated Trib2 activation was negatively and positively modulatedvia C/EBPa-p42 and C/EBPa-p30 expression, respectively. Wedemonstrated the recruitment of C/EBPa-p42 to the Trib2 promoterin normal myeloid cells and the elevation of Trib2 expression inC/EBPa-p30 expressing preleukemic myeloid cells. Our resultsreveal a positive feedback loop for E2F1, Trib2, and C/EBPa-p30in AML. Our data suggest that the regulation of Trib2 expressionin AML cells is pivotal for AML cell proliferation and survival.
The identification of E2F direct gene targets via consensus andnonconsensus binding sites has been globally assessed using ChIPtechnologies.36 Indeed the recruitment of E2F1 to promoters does notalways require DNA binding, as other transcription factors havebeen shown to recruit E2F1, such as nuclear factor-kB, Myc, andC/EBPa.27 C/EBPa-p30 has been shown to recruit E2F1 to thepromoter of PIN1, and increased PIN1 expression was proposed tocontribute to the differentiation block in AML.37 We showed andvalidated the presence of E2F1 binding sites in the Trib2 promoter.Using site-directed and deletional mutagenesis and EMSA analysis,we conclude that E2F1 binds directly to the Trib2 promoter and ismodulated by C/EBPa specifically at site B at2943 bp. We demon-strate the recruitment of C/EBPa to this region in normal GMP cells.Using a ChIP assay, we were unable to distinguish between C/EBPa-p42 and C/EBPa-p30 binding to the Trib2 promoter in normal orpreleukemic cells. It has been suggested that C/EBPa-p30 has in-dependent functions of C/EBPa-p42 and that it can target andmodulate a unique set of genes in addition to its role as a dominantnegative of C/EBPa-p42.38,39 Given that we have shown thatC/EBPa-p30 preleukemicGMP cells have elevated Trib2 expressionabove that present in normal GMPs, these data support the positivefeedback loop that we propose between E2F1, C/EBPa, and Trib2.
The central mechanisms identified for the negative regulation ofcell proliferation by C/EBPa are repression of E2F,22 interferencewith Cdk2 and Cdk4 function,40 and p21 stabilization (a Cdkinhibitor).41 Flavopiridol is a small molecule cyclin-dependentkinase inhibitor that induces cell cycle arrest, apoptosis, and clinicalresponses in AML patients. Following the inhibition of Cdks, phos-phorylationofRB is inhibited, andE2F is released anddrives cell cyclearrest and apoptosis. Studies have shown that flavopiridol inducesapoptosis in leukemic blasts from patients with poor-risk AML orALL42 and represses E2F1 expression in leukemic blasts frompatientswith refractory AML.43 PTX has been shown to induce cell cyclearrest and apoptosis of AML and ALL cells44,45 and has been used incombination therapy for patients with myelodysplastic syndromes andAML.46,47 Elevated cAMP, as a result of PTX and dibutyryl cAMPtreatment, has been shown to target CDK and E2F1 in leukemic cells,leading to cell cycle arrest,33 apoptosis,48 and leukemic celldifferentiation.49 Notwithstanding, these drugs also target otherpathways, for instance, nuclear factor-kB and antiapoptoticproteins.44 Therefore, the inhibition of CDK has been shown toinduce a number of effects in different subtypes of AML, which all
prove to be detrimental to the leukemic cell (differentiation, cellcycle arrest, and apoptosis). The inhibition of CDK activity in highTrib2-expressing AML cells resulted in the arrest of cells in G1phase of the cell cycle and a subsequent decrease in cell in S phase.Using concentrations of drug that induced minimal apoptosis anda block in proliferation, there was a decrease in E2F1 expressionand a subsequent decrease in Trib2 expression, and these effectsultimately led to apoptotic cell death (sub-G1 increase) of theAML cell. The fact that we did not observe any proliferativedefect following treatment in nonleukemic WT and Trib2-deficient BM cells corroborates the role of Trib2 in the controlof leukemic cell proliferation.
Here we identify a positive regulatory loop controlled by E2F1that contributes to the aberrant expression of Trib2 inAMLcells. Ourfindings provide a novel link between oncogenic Trib2 function andAML cell proliferation. Whether E2F-mediated regulation of Trib2occurs also in ALL remains to be investigated and of great interest.
Acknowledgments
The authors thank Prof Kevin Ryan (Beatson Institute for CancerResearch, Glasgow, Scotland) for E2F plasmids and Stefan Meyer(University of Manchester) for cell lines CV1665, CV1939, andSB1690CB. MEFs derived from E2F1-deficient or WT mouseembryos were a kind gift from Dr Lili Yamasaki (Columbia Uni-versity). The authors thank the technical staff at the Paul O’GormanLeukaemia Research Centre and at the biological services at theUniversity of Glasgow.
The authors thank the Kay Kendall Foundation (KKL501) andthe Howat Foundation for flow cytometry facility funding. K.K. wassupported by funds from the Howat Foundation, Children withCancer United Kingdom, and financial support from ScienceFoundation Ireland President of IrelandYoungResearcher Awardand Marie Curie EU-FP7-PEOPLE-IRG. This work was alsosupported by the Childrens Leukaemia Research Project, IrishResearch Council for Science, Engineering and Technologyfellowship (to M. Hannon), and Health Research Board (to J.T.).Work in the Porse laboratory was supported by the Danish CancerSociety, the Danish Research Council for Strategic Research, andthrough a center grant from the NovoNordisk Foundation (TheNovo Nordisk Foundation Section for Stem Cell Biology inHuman Disease).
Authorship
Contribution: K.K. designed the study; L.R., M.S., M. Hannon,M. Hasemann, A.-K.F., J.C., J.T., C.O., and K.K. performed theresearch; K.K., L.R., M.S., M. Hannon, M. Hasemann, A.F., andB.P. analyzed the data; B.P. contributed an essential mouse modeland reagents; M.R.C. provided access to patient samples; L.R.and M.S. made the figures; K.K. wrote the paper; and K.K., L.R.,M.S., B.P., and M. Hasemann revised and edited the paper.
Conflict-of-interest disclosure: The authors declare no competingfinancial interests.
Correspondence: Karen Keeshan, Paul O’Gorman LeukaemiaResearch Centre, Institute of Cancer Sciences, University of Glasgow,Glasgow, Scotland; e-mail: [email protected].
BLOOD, 10 APRIL 2014 x VOLUME 123, NUMBER 15 REGULATION OF Trib2 IN AML CELL PROLIFERATION 2399
For personal use only.on June 15, 2015. by guest www.bloodjournal.orgFrom
References
1. Liang KL, Rishi L, Keeshan K. Tribbles in acuteleukemia. Blood. 2013;121(21):4265-4270.
2. Dobens LL Jr, Bouyain S. Developmental roles oftribbles protein family members. Dev Dyn. 2012;241(8):1239-1248.
3. Hannon MM, Lohan F, Erbilgin Y, et al. ElevatedTRIB2 with NOTCH1 activation in paediatric/adultT-ALL. Br J Haematol. 2012;158(5):626-634.
4. Keeshan K, He Y, Wouters BJ, et al. Tribbleshomolog 2 inactivates C/EBPalpha and causesacute myelogenous leukemia. Cancer Cell. 2006;10(5):401-411.
5. Wouters BJ, Jorda MA, Keeshan K, et al. Distinctgene expression profiles of acute myeloid/T-lymphoid leukemia with silenced CEBPA andmutations in NOTCH1. Blood. 2007;110(10):3706-3714.
6. Keeshan K, Bailis W, Dedhia PH, et al.Transformation by Tribbles homolog 2 (Trib2)requires both the Trib2 kinase domain and COP1binding. Blood. 2010;116(23):4948-4957.
7. Nagel S, Venturini L, Przybylski GK, et al.Activation of Paired-homeobox gene PITX1by del(5)(q31) in T-cell acute lymphoblasticleukemia. Leuk Lymphoma. 2011;52(7):1348-1359.
8. Sanda T, Lawton LN, Barrasa MI, et al. Coretranscriptional regulatory circuit controlledby the TAL1 complex in human T cell acutelymphoblastic leukemia. Cancer Cell. 2012;22(2):209-221.
9. Argiropoulos B, Palmqvist L, Yung E, et al.Linkage of Meis1 leukemogenic activity to multipledownstream effectors including Trib2 and Ccl3.Exp Hematol. 2008;36(7):845-859.
10. Vaz C, Ahmad HM, Sharma P, et al. Analysis ofmicroRNA transcriptome by deep sequencing ofsmall RNA libraries of peripheral blood. BMCGenomics. 2010;11:288.
11. Zheng YS, Zhang H, Zhang XJ, et al. MiR-100regulates cell differentiation and survival bytargeting RBSP3, a phosphatase-like tumorsuppressor in acute myeloid leukemia.Oncogene.2012;31(1):80-92.
12. Grosshans J, Wieschaus E. A genetic linkbetween morphogenesis and cell division duringformation of the ventral furrow in Drosophila. Cell.2000;101(5):523-531.
13. Mata J, Curado S, Ephrussi A, Rørth P. Tribblescoordinates mitosis and morphogenesis inDrosophila by regulating string/CDC25proteolysis. Cell. 2000;101(5):511-522.
14. Seher TC, Leptin M. Tribbles, a cell-cycle brakethat coordinates proliferation and morphogenesisduring Drosophila gastrulation. Curr Biol. 2000;10(11):623-629.
15. Price DM, Jin Z, Rabinovitch S, Campbell SD.Ectopic expression of the Drosophila Cdk1inhibitory kinases, Wee1 and Myt1, interferes withthe second mitotic wave and disrupts patternformation during eye development. Genetics.2002;161(2):721-731.
16. Hegedus Z, Czibula A, Kiss-Toth E. Tribbles:a family of kinase-like proteins with potentsignalling regulatory function. Cell Signal. 2007;19(2):238-250.
17. Abdelilah-Seyfried S, Chan YM, Zeng C, et al.A gain-of-function screen for genes that affect thedevelopment of the Drosophila adult externalsensory organ. Genetics. 2000;155(2):733-752.
18. Reckzeh K, Cammenga J. Molecular mechanismsunderlying deregulation of C/EBPalpha in acutemyeloid leukemia. Int J Hematol. 2010;91(4):557-568.
19. Dedhia PH, Keeshan K, Uljon S, et al. Differentialability of Tribbles family members to promotedegradation of C/EBPalpha and induce acutemyelogenous leukemia. Blood. 2010;116(8):1321-1328.
20. Pabst T, Mueller BU, Zhang P, et al. Dominant-negative mutations of CEBPA, encoding CCAAT/enhancer binding protein-alpha (C/EBPalpha), inacute myeloid leukemia. Nat Genet. 2001;27(3):263-270.
21. Lin FT, MacDougald OA, Diehl AM, Lane MD.A 30-kDa alternative translation product of theCCAAT/enhancer binding protein alpha message:transcriptional activator lacking antimitotic activity.Proc Natl Acad Sci USA. 1993;90(20):9606-9610.
22. Porse BT, Xu X, Lindberg B, Wewer UM,Friis-Hansen L, Nerlov C; Pedersen TA. E2Frepression by C/EBPalpha is required foradipogenesis and granulopoiesis in vivo. Cell.2001;107(2):247-258.
23. Johansen LM, Iwama A, Lodie TA, et al. c-Myc isa critical target for c/EBPalpha in granulopoiesis.Mol Cell Biol. 2001;21(11):3789-3806.
24. Porse BT, Bryder D, Theilgaard-Monch K, et al.Loss of C/EBP alpha cell cycle control increasesmyeloid progenitor proliferation and transformsthe neutrophil granulocyte lineage. J Exp Med.2005;202(1):85-96.
25. Zhang P, Iwasaki-Arai J, Iwasaki H, et al.Enhancement of hematopoietic stem cellrepopulating capacity and self-renewal in theabsence of the transcription factor C/EBP alpha.Immunity. 2004;21(6):853-863.
26. Heath V, Suh HC, Holman M, et al. C/EBPalphadeficiency results in hyperproliferation ofhematopoietic progenitor cells and disruptsmacrophage development in vitro and in vivo.Blood. 2004;104(6):1639-1647.
27. Chen HZ, Tsai SY, Leone G. Emerging roles ofE2Fs in cancer: an exit from cell cycle control. NatRev Cancer. 2009;9(11):785-797.
28. Trikha P, Sharma N, Opavsky R, et al. E2f1-3 arecritical for myeloid development. J Biol Chem.2011;286(6):4783-4795.
29. Pulikkan JA, Peramangalam PS, Dengler V, et al.C/EBPa regulated microRNA-34a targets E2F3during granulopoiesis and is down-regulated inAML with CEBPA mutations. Blood. 2010;116(25):5638-5649.
30. Pulikkan JA, Dengler V, Peramangalam PS, et al.Cell-cycle regulator E2F1 and microRNA-223comprise an autoregulatory negative feedbackloop in acute myeloid leukemia. Blood. 2010;115(9):1768-1778.
31. Kirstetter P, Schuster MB, Bereshchenko O, et al.Modeling of C/EBPalpha mutant acute myeloidleukemia reveals a common expression signatureof committed myeloid leukemia-initiating cells.Cancer Cell. 2008;13(4):299-310.
32. O’Hare MJ, Hou ST, Morris EJ, et al. Inductionand modulation of cerebellar granule neurondeath by E2F-1. J Biol Chem. 2000;275(33):25358-25364.
33. Williamson EA, Burgess GS, Eder P, Litz-JacksonS, Boswell HS. Cyclic AMP negatively controlsc-myc transcription and G1 cell cycle progressionin p210 BCR-ABL transformed cells: inhibitoryactivity exerted through cyclin D1 and cdk4.Leukemia. 1997;11(1):73-85.
34. Valk PJ, Verhaak RG, Beijen MA, et al.Prognostically useful gene-expression profiles inacute myeloid leukemia. N Engl J Med. 2004;350(16):1617-1628.
35. Wouters BJ, Lowenberg B, Erpelinck-Verschueren CA, van Putten WL, Valk PJ, Delwel
R. Double CEBPA mutations, but not singleCEBPA mutations, define a subgroup of acutemyeloid leukemia with a distinctive geneexpression profile that is uniquely associated witha favorable outcome. Blood. 2009;113(13):3088-3091.
36. Rabinovich A, Jin VX, Rabinovich R, Xu X,Farnham PJ. E2F in vivo binding specificity:comparison of consensus versus nonconsensusbinding sites. Genome Res. 2008;18(11):1763-1777.
37. Pulikkan JA, Dengler V, Peer Zada AA, et al.Elevated PIN1 expression by C/EBPalpha-p30blocks C/EBPalpha-induced granulocyticdifferentiation through c-Jun in AML. Leukemia.2010;24(5):914-923.
38. Wang C, Chen X, Wang Y, Gong J, Hu G.C/EBPalphap30 plays transcriptional regulatoryroles distinct from C/EBPalphap42. Cell Res.2007;17(4):374-383.
39. Geletu M, Balkhi MY, Peer Zada AA, et al.Target proteins of C/EBPalphap30 in AML:C/EBPalphap30 enhances sumoylation ofC/EBPalphap42 via up-regulation of Ubc9.Blood. 2007;110(9):3301-3309.
40. Wang H, Iakova P, Wilde M, et al. C/EBPalphaarrests cell proliferation through direct inhibition ofCdk2 and Cdk4. Mol Cell. 2001;8(4):817-828.
41. Timchenko NA, Harris TE, Wilde M, et al. CCAAT/enhancer binding protein alpha regulates p21protein and hepatocyte proliferation in newbornmice. Mol Cell Biol. 1997;17(12):7353-7361.
42. Karp JE, Ross DD, Yang W, et al. Timedsequential therapy of acute leukemia withflavopiridol: in vitro model for a phase I clinicaltrial. Clin Cancer Res. 2003;9(1):307-315.
43. Nelson DM, Joseph B, Hillion J, Segal J, Karp JE,Resar LM. Flavopiridol induces BCL-2 expressionand represses oncogenic transcription factors inleukemic blasts from adults with refractory acutemyeloid leukemia. Leuk Lymphoma. 2011;52(10):1999-2006.
44. Bravo-Cuellar A, Hernandez-Flores G,Lerma-Dıaz JM, et al. Pentoxifylline and theproteasome inhibitor MG132 induce apoptosisin human leukemia U937 cells through adecrease in the expression of Bcl-2 and Bcl-XLand phosphorylation of p65. J Biomed Sci.2013;20:13.
45. Ogawa R, Streiff MB, Bugayenko A, Kato GJ.Inhibition of PDE4 phosphodiesterase activityinduces growth suppression, apoptosis,glucocorticoid sensitivity, p53, and p21(WAF1/CIP1) proteins in human acute lymphoblasticleukemia cells. Blood. 2002;99(9):3390-3397.
46. Raza A, Qawi H, Lisak L, et al. Patients withmyelodysplastic syndromes benefit from palliativetherapy with amifostine, pentoxifylline, andciprofloxacin with or without dexamethasone.Blood. 2000;95(5):1580-1587.
47. Erikci AA, Ozturk A, Karagoz B, et al. Resultsof combination therapy with amifostine,pentoxifylline, ciprofloxacin and dexamethasonein patients with myelodysplastic syndrome andacute myeloid leukemia. Hematology. 2008;13(5):289-292.
48. Huseby S, Gausdal G, Keen TJ, et al. Cyclic AMPinduces IPC leukemia cell apoptosis via CRE-andCDK-dependent Bim transcription. Cell Death Dis.2011;2:e237.
49. Copsel S, Garcia C, Diez F, et al. Multidrugresistance protein 4 (MRP4/ABCC4) regulatescAMP cellular levels and controls humanleukemia cell proliferation and differentiation.J Biol Chem. 2011;286(9):6979-6988.
2400 RISHI et al BLOOD, 10 APRIL 2014 x VOLUME 123, NUMBER 15
For personal use only.on June 15, 2015. by guest www.bloodjournal.orgFrom
Supplementary methods, figures and legends
Methods
Cell culture, transfection and siRNA knockdown
RAW 264.7 macrophage cells, NIH3T3 cells, 293T, HeLa, and wild type and E2F1-/-
MEFs cells were cultured in DMEM supplemented with 10% FBS. K562 and U937
cells were cultured in RPMI with 10% FBS. K562-C/EBPalpha-p42-ER and K562-
C/EBPalpha-p30-ER cell lines were cultured in RPMI (no phenol red) with 10% FBS
Charcoal stripped. β-estradiol at a concentration of 5µM was used to induce
translocation of the fusion proteins into the nucleus. WT and Trib2-/- bone marrow
cells were cultured in DMEM supplemented with 15% FBS, 6ng/ml IL-3, 5ng/ml IL-
6, 100ng/ml SCF. Transient transfection of expression plasmids was carried out using
Turbofect (Fermentas) or Attractene (Qiagen) transfection reagent according to the
manufacturer’s instructions. Nucleofection of K562, K562-C/EBPalpha-p42-ER and
K562-C/EBPalpha-p30-ER cell lines were carried out using the Amaxa kit for
nucleofection and the Nucleofector™ II device (Amaxa) according to manufacturer’s
instruction. For siRNA transfection, cells were incubated with control siNEG
(Scrambled siRNA, AllStar, Qiagen 1027281) or siRNA directed against E2F1
(Validated E2F1 Flexitube siRNA Qiagen, SI02664410, Hs_E2F1_6 FlexiTube
siRNA) (Qiagen), Hs_E2F1_9 FlexiTube siRNA) (Qiagen).
Trib2-dependent reporter gene assay
3T3 cells were transfected with luciferase constructs alone (firefly luciferase
constructs in pGL3-Basic and the internal control Renilla luciferase plasmid pRL-TK)
or in combination with other expression plasmids using Turbofect transfection reagent
(Fermentas). 24 hours post-transfection Trib2 firefly luminescence readings were
normalised for renilla values and reported relative to a calibrator sample. The two-
tailed unpaired t-test was used to assess the significance of data.
Chromatin Immunoprecipitation
For K562 cell line, cells were fixed in 1% formaldehyde for 10min with agitation.
Fixation was ceased by adding 1ml of 1.25M glycine and incubating for 5 min with
agitation. Cells were pelleted and resuspended in 1ml of lysis buffer (Active Motif)
for 30 mins and dounce homogenised to isolate nuclei. Nuclei were pelleted and
resuspended in 350µl shearing buffer (Active Motif) and sonicated on ice (K562 cells,
5 pulses, 50% duty cycle and 30% output). Sheared chromatin samples were
centrifuge at 15,000 rpm for 10 min at 4º C. Protein/DNA complexes were
immunoprecipitated with indicated antibody, DNA was eluted as per manufacturer’s
instructions (Active Motif) and column purified (QIAquick Purification Kit, Qiagen).
Eluted DNA was subjected to PCR using promoter-specific primer sets (flanking
putative E2F1-binding sites in the Trib2 promoter: Forward 5’-
GGGGAGACGGGGTGATTGCA-3’, Reverse 5’-CGGGCTGGGCGCAGGTA-3’,
negative control -5kb Trib2 Promoter: Forward 5’-
GAGGCTCCGTGGAAAACTCACTTG-3’, Reverse 5’-
TTCCCAACTCTCAAGCGC TCTGC-3’). The two-tailed unpaired t-test was used to
assess the significance of data.
For GMP cells, 500.000 were FACS sorted, fixed and quenched as above for 2 min.
Cells were resuspended in lysis buffer (100mM NaCl, 66mM tris-HCl, 5mM EDTA,
0.3% SDS, 1.5% triton X-100) and incubated for 20 min at RT with vortexing every 5
min. Cell lysates were sonicated (30 cycles, 15 s burst, 30 s break) using a bioruptor
(Diagenode), and centrifuged for 10 min. Protein/DNA complexes were
immunoprecipitated with antibodies for IgG (sc-2027, Santa Cruz) or
C/EBPalpha(14-AA, Santa Cruz) and the complexes were treated with RNase A for
30 min at 37°C followed by addition of SDS (0.5%) and proteinase K (0.5 mg/ml)
and an additional incubation for 16 hours at 37°C. Finally, chromatin complexes were
de-cross-linked by incubation at 65°C for 6 h, phenol-chloroform extracted and
precipitated using NaOAc and EtOH supplemented with glycogen. Eluted DNA was
subjected to qPCR using primers targeting the C/EBPalpha site in the Trib2 promoter:
Forward 5’-AGCTGAGTAGGGAGTGCGCGGAGTA-3’ and Reverse 5’-
TCATCGGAGGAGGATCTGGGACGT-3’.
Electromobility shift assay (EMSA)
For making nuclear extracts, cells were allowed to swell in buffer A (10 mM HEPES
pH 7.9, 10 mM KCl, 0.1 mM EDTA pH 8.0, 0.1 mM EGTA pH 7.0 and protease
inhibitors) for 45 min on ice followed by addition of NP-40, sedimenting the nuclei
by centrifugation for 1 mint at 10,000 rpm and incubating the nuclear pellet in buffer
B (20 mM HEPES pH 7.9, 400 mM NaCl, 1 mM EDTA pH 8.0, 1 mM EGTA pH
7.0 and protease inhibitors) for 30 min on ice and collecting nuclear extract by
centrifugation for 5 min at 10,000 rpm at 4°C. EMSAs were performed using
LightShift Chemiluminescent EMSA Kit (Thermo Scientific). Briefly, 10 µg of
nuclear extract were incubated with 3’-biotin labeled oligonucleotide in a binding
reaction mixture containing 10mM Tris (pH 7.5), 50 mM KCl, 1 mM DTT, 2.5%
glycerol, 5 mM MgCl2, 2 ug BSA, 1 ug poly (dI-dC) for 20 min at 37°C. The DNA-
protein complexes were resolved on 4.5% nondenaturing polyacrylamide gel in 0.5X
Tris borate EDTA at 100 V at 4°C, transferred onto nylon membrane, UV crosslinked
followed by the streptavidin detection of biotinylated oligonucleotides. For the cold
competition, nuclear extracts in the presence of binding buffer were incubated with
100 fold excess of unlabelled oligonucleotide for 15 min at 37°C. After incubation,
labeled oligo was added and proceeded for regular binding reaction.
For supershift assay, nuclear extracts were preincubated with 2µg antibody specific
for E2F1 (sc-193X, Santa Cruz) or C/EBPalpha (sc-61X, Santa Cruz) for 30 min at
room temperature and thereafter were proceeded for binding with oligonucleotide as
described above. The oligonucleotides used for the EMSAs were as follows:
E2F1(site A, wild type) 5’ – ATGTGTTCTTGGCCTAAATACT -3’, E2F1 (siteB,
wild type) 5’-CAGGACCCCCGGAAAGCTCCTG- 3’, E2F1 (site C, wild type) 5’-
GGCTTTGTCGCGGTACCTGT -3’, C/EBPalpha (between site E2F1 site B and C,
wild type) 5’- TCACCGCCCGCACTTCTTGCTTCATCGGAG -3’. The underlined
indicates the putative binding site within murine Trib2 promoter. For mutant, the
sequences of putative binding sites were considerably changed as follows and
underlined: E2F1 (site A, mutant type) 5’- ATGTGTTTAAAAGGCAAATACT -3’,
E2F1 (site B, mutant type) 5’-CAGGACCTGGAATTGGCTCCTG-3’, E2F1 (site C,
mutant type) 5’- GGCTTTGCGCTACTACCTGT -3’, C/EBPalpha (between site
E2F1 site B and C, mutant type) 5’-
TCACCGTGGATTCTTTAAATAATGTCGGAG -3’.
Immunoblotting
Whole cell lysates were prepared using modified radioimmune precipitation assay
buffer (50mM Tris, pH 8.0, containing 0.5% NP-40, 0.25% sodium deoxycholate,
150mM NaCl, 1mM EDTA, with protease and phosphatase inhibitors). Cytoplasmic
lysates were prepared in ice cold lysis buffer (10 mM HEPES pH 7.9, 10 mM KCl,
0.1 mM EDTA pH 8.0, 0.1 mM EGTA pH 7.0, 1 mM DTT, with protease and
phosphatase inhibitors). Nuclear lysates were prepared using ice-cold nuclear
extraction buffer (20 mM HEPES pH 7.9, 400 mM NaCl, 1 mM EDTA pH 8.0, 1 mM
EGTA pH 7.0, 1 mM DTT, with protease and phosphatase inhibitors). Samples were
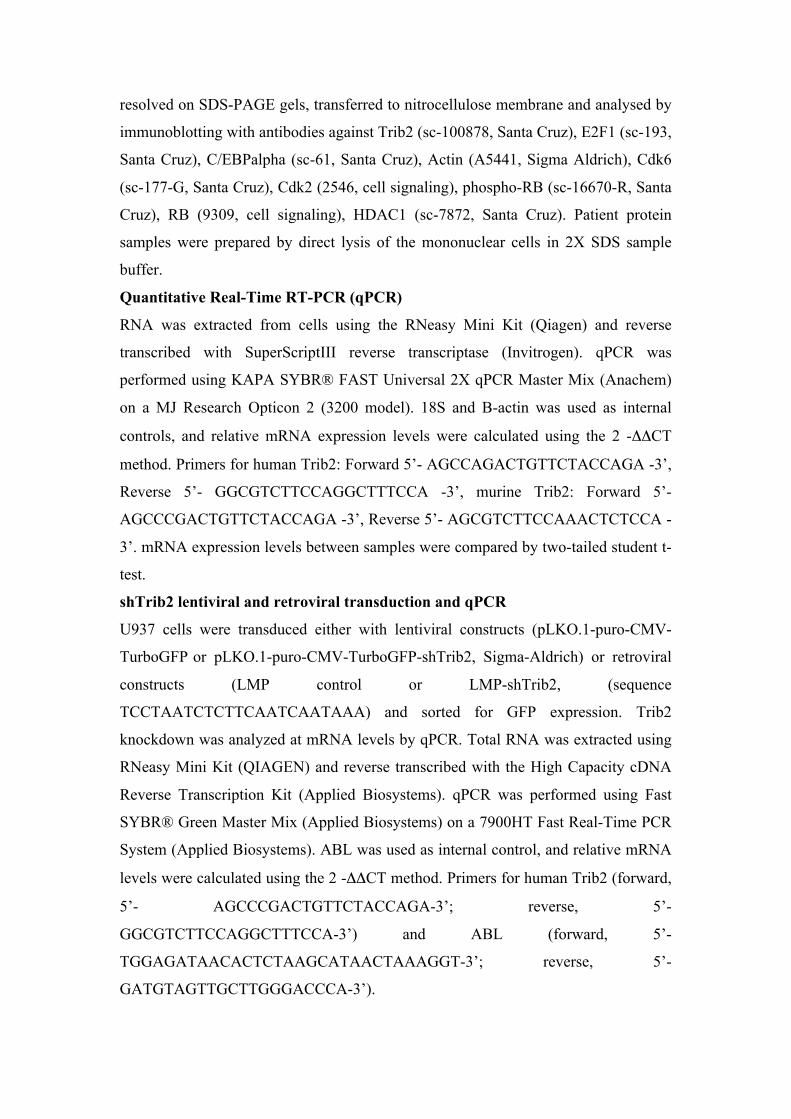
resolved on SDS-PAGE gels, transferred to nitrocellulose membrane and analysed by
immunoblotting with antibodies against Trib2 (sc-100878, Santa Cruz), E2F1 (sc-193,
Santa Cruz), C/EBPalpha (sc-61, Santa Cruz), Actin (A5441, Sigma Aldrich), Cdk6
(sc-177-G, Santa Cruz), Cdk2 (2546, cell signaling), phospho-RB (sc-16670-R, Santa
Cruz), RB (9309, cell signaling), HDAC1 (sc-7872, Santa Cruz). Patient protein
samples were prepared by direct lysis of the mononuclear cells in 2X SDS sample
buffer.
Quantitative Real-Time RT-PCR (qPCR)
RNA was extracted from cells using the RNeasy Mini Kit (Qiagen) and reverse
transcribed with SuperScriptIII reverse transcriptase (Invitrogen). qPCR was
performed using KAPA SYBR® FAST Universal 2X qPCR Master Mix (Anachem)
on a MJ Research Opticon 2 (3200 model). 18S and B-actin was used as internal
controls, and relative mRNA expression levels were calculated using the 2 -ΔΔCT
method. Primers for human Trib2: Forward 5’- AGCCAGACTGTTCTACCAGA -3’,
Reverse 5’- GGCGTCTTCCAGGCTTTCCA -3’, murine Trib2: Forward 5’-
AGCCCGACTGTTCTACCAGA -3’, Reverse 5’- AGCGTCTTCCAAACTCTCCA -
3’. mRNA expression levels between samples were compared by two-tailed student t-
test.
shTrib2 lentiviral and retroviral transduction and qPCR
U937 cells were transduced either with lentiviral constructs (pLKO.1-puro-CMV-
TurboGFP or pLKO.1-puro-CMV-TurboGFP-shTrib2, Sigma-Aldrich) or retroviral
constructs (LMP control or LMP-shTrib2, (sequence
TCCTAATCTCTTCAATCAATAAA) and sorted for GFP expression. Trib2
knockdown was analyzed at mRNA levels by qPCR. Total RNA was extracted using
RNeasy Mini Kit (QIAGEN) and reverse transcribed with the High Capacity cDNA
Reverse Transcription Kit (Applied Biosystems). qPCR was performed using Fast
SYBR® Green Master Mix (Applied Biosystems) on a 7900HT Fast Real-Time PCR
System (Applied Biosystems). ABL was used as internal control, and relative mRNA
levels were calculated using the 2 -ΔΔCT method. Primers for human Trib2 (forward,
5’- AGCCCGACTGTTCTACCAGA-3’; reverse, 5’-
GGCGTCTTCCAGGCTTTCCA-3’) and ABL (forward, 5’-
TGGAGATAACACTCTAAGCATAACTAAAGGT-3’; reverse, 5’-
GATGTAGTTGCTTGGGACCCA-3’).
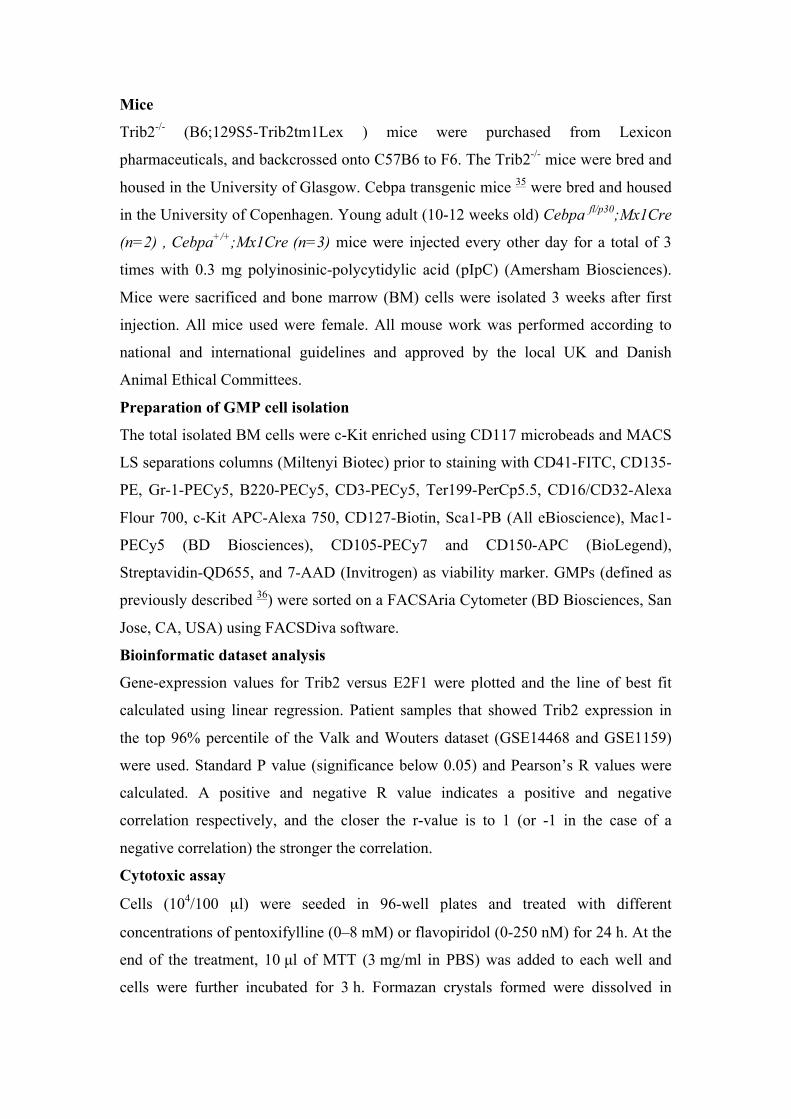
Mice
Trib2-/- (B6;129S5-Trib2tm1Lex ) mice were purchased from Lexicon
pharmaceuticals, and backcrossed onto C57B6 to F6. The Trib2-/- mice were bred and
housed in the University of Glasgow. Cebpa transgenic mice 35 were bred and housed
in the University of Copenhagen. Young adult (10-12 weeks old) Cebpa fl/p30;Mx1Cre
(n=2) , Cebpa+/+;Mx1Cre (n=3) mice were injected every other day for a total of 3
times with 0.3 mg polyinosinic-polycytidylic acid (pIpC) (Amersham Biosciences).
Mice were sacrificed and bone marrow (BM) cells were isolated 3 weeks after first
injection. All mice used were female. All mouse work was performed according to
national and international guidelines and approved by the local UK and Danish
Animal Ethical Committees.
Preparation of GMP cell isolation
The total isolated BM cells were c-Kit enriched using CD117 microbeads and MACS
LS separations columns (Miltenyi Biotec) prior to staining with CD41-FITC, CD135-
PE, Gr-1-PECy5, B220-PECy5, CD3-PECy5, Ter199-PerCp5.5, CD16/CD32-Alexa
Flour 700, c-Kit APC-Alexa 750, CD127-Biotin, Sca1-PB (All eBioscience), Mac1-
PECy5 (BD Biosciences), CD105-PECy7 and CD150-APC (BioLegend),
Streptavidin-QD655, and 7-AAD (Invitrogen) as viability marker. GMPs (defined as
previously described 36) were sorted on a FACSAria Cytometer (BD Biosciences, San
Jose, CA, USA) using FACSDiva software.
Bioinformatic dataset analysis
Gene-expression values for Trib2 versus E2F1 were plotted and the line of best fit
calculated using linear regression. Patient samples that showed Trib2 expression in
the top 96% percentile of the Valk and Wouters dataset (GSE14468 and GSE1159)
were used. Standard P value (significance below 0.05) and Pearson’s R values were
calculated. A positive and negative R value indicates a positive and negative
correlation respectively, and the closer the r-value is to 1 (or -1 in the case of a
negative correlation) the stronger the correlation.
Cytotoxic assay
Cells (104/100 µl) were seeded in 96-well plates and treated with different
concentrations of pentoxifylline (0–8 mM) or flavopiridol (0-250 nM) for 24 h. At the
end of the treatment, 10 µl of MTT (3 mg/ml in PBS) was added to each well and
cells were further incubated for 3 h. Formazan crystals formed were dissolved in
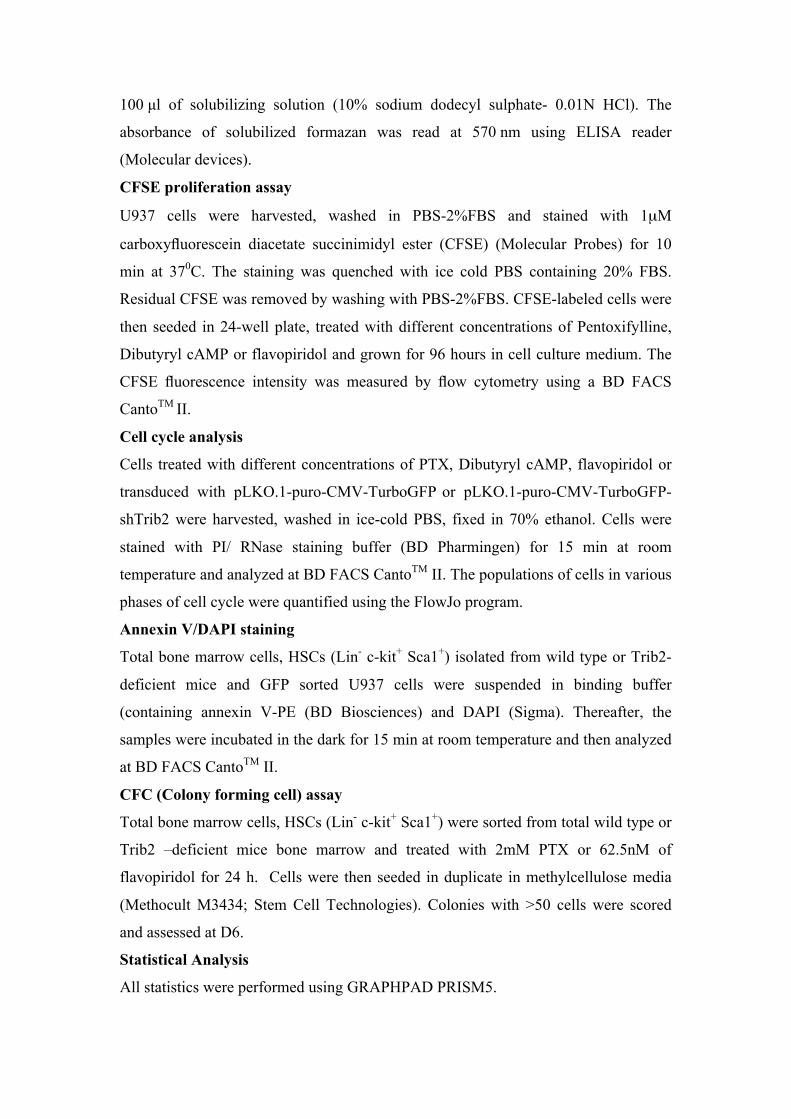
100 µl of solubilizing solution (10% sodium dodecyl sulphate- 0.01N HCl). The
absorbance of solubilized formazan was read at 570 nm using ELISA reader
(Molecular devices).
CFSE proliferation assay
U937 cells were harvested, washed in PBS-2%FBS and stained with 1µM
carboxyfluorescein diacetate succinimidyl ester (CFSE) (Molecular Probes) for 10
min at 370C. The staining was quenched with ice cold PBS containing 20% FBS.
Residual CFSE was removed by washing with PBS-2%FBS. CFSE-labeled cells were
then seeded in 24-well plate, treated with different concentrations of Pentoxifylline,
Dibutyryl cAMP or flavopiridol and grown for 96 hours in cell culture medium. The
CFSE fluorescence intensity was measured by flow cytometry using a BD FACS
CantoTM II.
Cell cycle analysis
Cells treated with different concentrations of PTX, Dibutyryl cAMP, flavopiridol or
transduced with pLKO.1-puro-CMV-TurboGFP or pLKO.1-puro-CMV-TurboGFP-
shTrib2 were harvested, washed in ice-cold PBS, fixed in 70% ethanol. Cells were
stained with PI/ RNase staining buffer (BD Pharmingen) for 15 min at room
temperature and analyzed at BD FACS CantoTM II. The populations of cells in various
phases of cell cycle were quantified using the FlowJo program.
Annexin V/DAPI staining
Total bone marrow cells, HSCs (Lin- c-kit+ Sca1+) isolated from wild type or Trib2-
deficient mice and GFP sorted U937 cells were suspended in binding buffer
(containing annexin V-PE (BD Biosciences) and DAPI (Sigma). Thereafter, the
samples were incubated in the dark for 15 min at room temperature and then analyzed
at BD FACS CantoTM II.
CFC (Colony forming cell) assay
Total bone marrow cells, HSCs (Lin- c-kit+ Sca1+) were sorted from total wild type or
Trib2 –deficient mice bone marrow and treated with 2mM PTX or 62.5nM of
flavopiridol for 24 h. Cells were then seeded in duplicate in methylcellulose media
(Methocult M3434; Stem Cell Technologies). Colonies with >50 cells were scored
and assessed at D6.
Statistical Analysis
All statistics were performed using GRAPHPAD PRISM5.
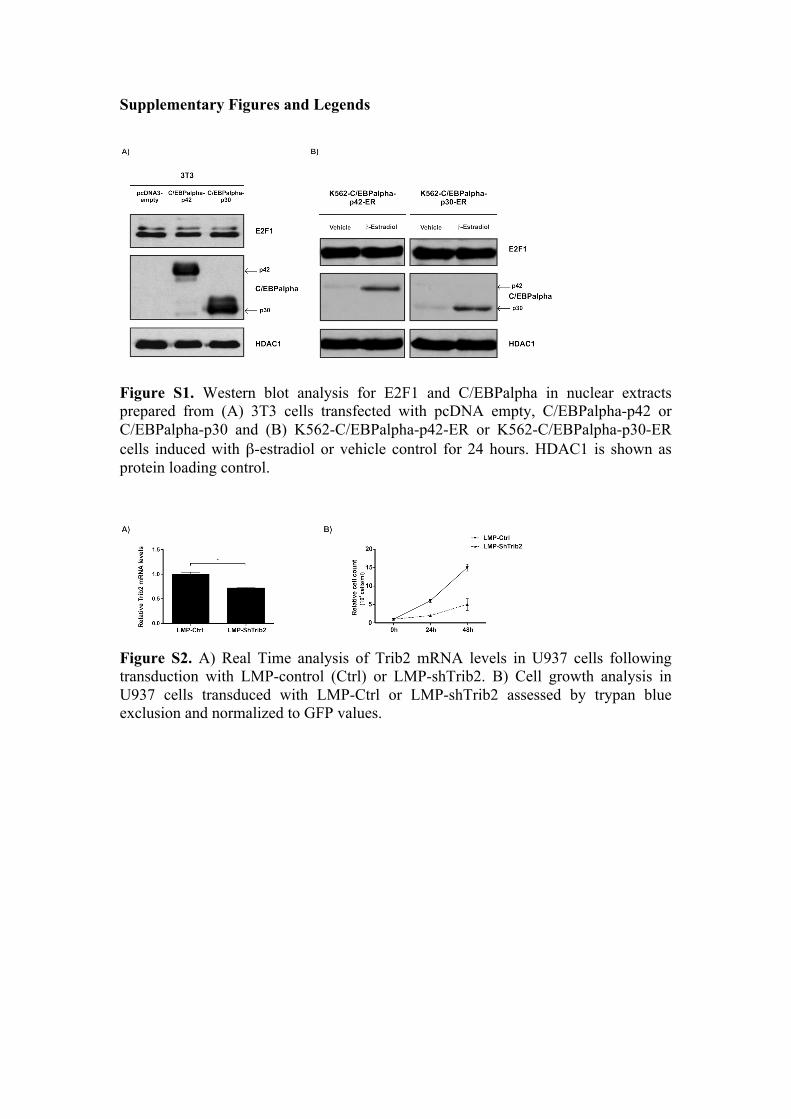
Supplementary Figures and Legends
Figure S1. Western blot analysis for E2F1 and C/EBPalpha in nuclear extracts prepared from (A) 3T3 cells transfected with pcDNA empty, C/EBPalpha-p42 or C/EBPalpha-p30 and (B) K562-C/EBPalpha-p42-ER or K562-C/EBPalpha-p30-ER cells induced with β-estradiol or vehicle control for 24 hours. HDAC1 is shown as protein loading control.
Figure S2. A) Real Time analysis of Trib2 mRNA levels in U937 cells following transduction with LMP-control (Ctrl) or LMP-shTrib2. B) Cell growth analysis in U937 cells transduced with LMP-Ctrl or LMP-shTrib2 assessed by trypan blue exclusion and normalized to GFP values.
157
Appendix F PDF of “TRIB2 and the ubiquitin proteasome system in cancer”
Tribbles pseudokinases on the crossroads of metabolism, cancer, immunity and development 1089
TRIB2 and the ubiquitin proteasome system incancerMara Salome*, Joana Campos* and Karen Keeshan*1
*Paul O’Gorman Leukaemia Research Centre, Institute of Cancer Sciences, University of Glasgow, Glasgow, G12 0ZD, Scotland
AbstractTribbles family of pseudokinase proteins are known to mediate the degradation of target proteins inDrosophila and mammalian systems. The main protein proteolysis pathway in eukaryotic cells is theubiquitin proteasome system (UPS). The tribbles homolog 2 (TRIB2) mammalian family member has beenwell characterized for its role in murine and human leukaemia, lung and liver cancer. One of the mostcharacterized substrates for TRIB2-mediated degradation is the myeloid transcription factor CCAAT enhancerbinding protein α (C/EBPα). However, across a number of cancers, the molecular interactions that take placebetween TRIB2 and factors involved in the UPS are varied and have differential downstream effects. Thisreview summarizes our current knowledge of these interactions and how this information is important forour understanding of TRIB2 in cancer.
TRIB2 gene dysregulation in cancerTribbles homolog 2 (TRIB2) is a pseudokinase that functionsas a molecular adaptor mediating degradation and changesto signalling cascades [1]. TRIB2 is also shown to be apotent oncogene in a variety of malignancies, includingmyeloid [2] and lymphoid [3] leukaemia, melanoma [4], lungcancer [5], and liver cancer [6]. The oncogenic activity ofTRIB2 is linked to its dysregulated expression, rather thanits dysregulation via mutation in the majority of cancers. Weanalysed TRIB2 gene in the catalogue of somatic mutationsin cancer (COSMIC) database (http://cancer.sanger.ac.uk,[7]), the most comprehensive source of curated analysedsomatic mutations in human cancer to date. This analysishas allowed us determine whether TRIB2 is altered atthe genomic level across a panel of tumour samplesidentified by the tissue of origin. From a total numberof 23,983 unique tumour samples, 86 were found withmissense (51%), synonymous (46%), nonsense (2%) andinframe deletion (1%) mutations in TRIB2 (Figure 1A).Interestingly, although the overall point mutation rate is low,tumours with documented roles for TRIB2 oncogene suchas malignant melanoma and lung cancer do have detectableTRIB2 point mutations. In tissues matching acute myeloidleukaemia (AML), which has a very strong association withTRIB2 oncogenic activity, no mutations were retrieved fromCOSMIC curated data provided by scientific literature andresequencing results from the Cancer Genome Project atthe Wellcome Trust Sanger Institute (1/1942 haematopoietic
Key words: cancer, leukaemia, TRIB2, ubiquitin proteasome.
Abbreviations: AML, acute myeloid leukaemia; ATF4, activating transcription factor 4; CNV,
copy number variation; COP1, constitutive photomorphogenesis 1; COSMIC, catalogue of somatic
mutations in cancer; DUBs, deubiquitinases; PI, proteasome inhibitors; SCF, SKP1–CUL1 (Cullin)–F-
box; SMURF1, Smad ubiquitination regulatory factor 1; TRIB2, tribbles homolog 2; UPS, ubiquitin
proteasome system; YAP, Yes-associated protein.1To whom correspondence should be addressed (email [email protected]).
and lymphoid tissue samples identified with a TRIB2mutation corresponded to a multiple myeloma patientsample). Indeed no mutations have been found in ∼75 AMLsamples analysed by exome sequencing with good coverageacross all exons (Ross Levine, personal communication).Interrogation of other genomic alterations affecting TRIB2in the COSMIC database identified subsets of tumourtissues with TRIB2 overexpressed (Figure 1B). Overall thefrequency rate for these alterations is higher and includeslung, skin, liver and haematopoietic and lymphoid tissuessamples. Of note, 4/9 samples overexpressing TRIB2 inthe haematopoietic and lymphoid tissues matched AMLsamples. Given that there is strong evidence for TRIB2oncogenic function in these tumours, these analyses suggestthat elevated TRIB2 expression has potential implicationsin other tumour tissue contexts yet to be explored e.g.endometrium (endometrioid carcinoma), central nervoussystem (astrocytoma grade V), prostate and large intestinesamples (both matching adenocarcinoma). Other TRIB2 genealterations include copy number variation (CNV), whichalbeit rare, are found across different tumours tissues andmainly associated with increased copy number (all exceptfor breast, thyroid and kidney which showed CNV loss)(Figure 1C). Hypermethylation, associated with chromatinsilencing, was found exclusively in prostate and large intestinetumour tissues (Figure 1D). Together these analyses suggestthat TRIB2 oncogenic activity is related to its elevated geneexpression rather than associated with different genomicalterations or mutations.
It is important to understand how TRIB2 gene expressionis regulated given its elevated expression in cancer. TRIB2gene expression has been shown to be regulated by a numberof genes in normal and malignant haematopoietic cells,including NOTCH1 [8], MEIS1 [9], E2F1 and C/EBPα
[10], GATA2 and FOG1 [11], PITX1 [12] and TAL1/E
Biochem. Soc. Trans. (2015) 43, 1089–1094; doi:10.1042/BST20150103 C©2015 Authors; published by Portland Press Limited
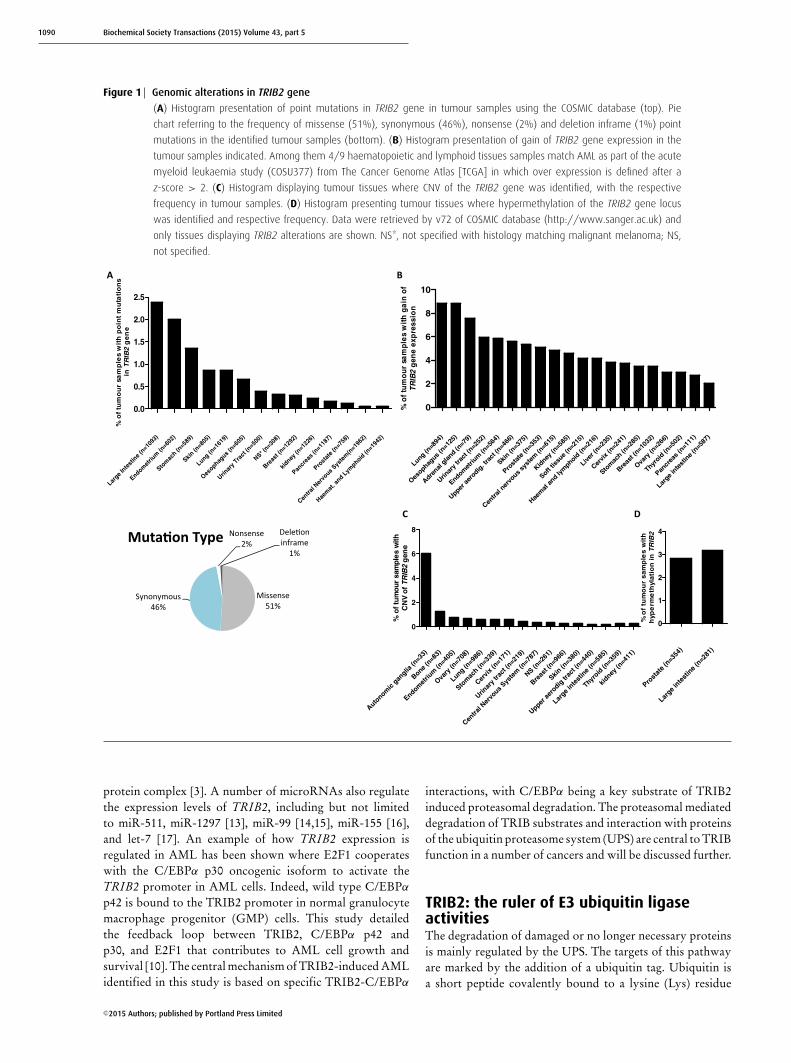
1090 Biochemical Society Transactions (2015) Volume 43, part 5
Figure 1 Genomic alterations in TRIB2 gene
(A) Histogram presentation of point mutations in TRIB2 gene in tumour samples using the COSMIC database (top). Pie
chart referring to the frequency of missense (51%), synonymous (46%), nonsense (2%) and deletion inframe (1%) point
mutations in the identified tumour samples (bottom). (B) Histogram presentation of gain of TRIB2 gene expression in the
tumour samples indicated. Among them 4/9 haematopoietic and lymphoid tissues samples match AML as part of the acute
myeloid leukaemia study (COSU377) from The Cancer Genome Atlas [TCGA] in which over expression is defined after a
z-score > 2. (C) Histogram displaying tumour tissues where CNV of the TRIB2 gene was identified, with the respective
frequency in tumour samples. (D) Histogram presenting tumour tissues where hypermethylation of the TRIB2 gene locus
was identified and respective frequency. Data were retrieved by v72 of COSMIC database (http://www.sanger.ac.uk) and
only tissues displaying TRIB2 alterations are shown. NS*, not specified with histology matching malignant melanoma; NS,
not specified.
BA
Large I
ntest
ine (
n=1093
)
Endomet
rium
(n=60
2)
Stom
ach (n
=589)
Skin (n
=805)
Lung (n=1
619)
Oesophag
us (n=60
5)
Urinar
y Tra
ct (n
=500)
NS* (n=30
8)
Breas
t (n=12
92)
kidney
(n=12
26)
Pancr
eas (
n=1187
)
Prost
ate (
n=758)
Centra
l Ner
vous S
yste
m(n
=1962
)
Haem
at. a
nd Lym
phoid (n
=1942
)
0.0
0.5
1.0
1.5
2.0
2.5
% o
f tu
mo
ur
sam
ple
s w
ith
po
int
mu
tati
on
s i
nTRIB
2g
en
e
Lung (n=8
94)
Oesophag
us (n
=125
)
Adrenal
gla
nd (n=7
9)
Urinar
y tra
ct (n
=252
)
Endomet
rium
(n=5
64)
Upper a
erodig
. tra
ct (n
=466
)
Skin (n
=375
)
Prost
ate
(n=3
53)
Centra
l ner
vous
syst
em (n
=615
)
Kidney
(n=5
85)
Soft tis
sue
(n=2
15)
Haem
at a
nd lym
phoid (n
=216
)
Liver
(n=2
35)
Cervi
x (n
=241
)
Stom
ach (n
=285
)
Breas
t (n=1
032)
Ovary
(n=2
66)
Thyroid
(n=5
02)
Pancr
eas
(n=1
11)
Large
inte
stin
e (n
=587
)
0
2
4
6
8
10
% o
f tu
mo
ur
sam
ple
s w
ith
ga
in o
fTRIB2
gen
e ex
pre
ssio
n
DC
Missense51%
Synonymous46%
Nonsense2%
Dele�on inframe
1%
Muta�on Type
Autonom
ic gan
glia (n
=33)
Bone (n
=83)
Endomet
rium
(n=4
05)
Ovary
(n=7
08)
Lung (n=9
86)
Stom
ach (n
=339
)
Cervix
(n=1
71)
Urinar
y tra
ct (n
=219)
Centra
l Ner
vous S
yste
m (n
=787
)
NS (n=2
61)
Breas
t (n=9
66)
Skin (n
=380
)
Upper ae
rodig
trac
t (n=44
0)
Large i
ntest
ine
(n=5
85)
Thyroid
(n=3
59)
kidney
(n=41
1)
0
2
4
6
8
% o
f tum
our
sam
ple
s w
ith
CN
V o
fTRIB2
gen
e
Prost
ate (
n=354)
Large i
ntest
ine (
n=281
)
0
1
2
3
4
% o
f tu
mo
ur
sa
mp
les
wit
hh
ype
rme
thyl
ati
on
inTRIB
2
protein complex [3]. A number of microRNAs also regulatethe expression levels of TRIB2, including but not limitedto miR-511, miR-1297 [13], miR-99 [14,15], miR-155 [16],and let-7 [17]. An example of how TRIB2 expression isregulated in AML has been shown where E2F1 cooperateswith the C/EBPα p30 oncogenic isoform to activate theTRIB2 promoter in AML cells. Indeed, wild type C/EBPα
p42 is bound to the TRIB2 promoter in normal granulocytemacrophage progenitor (GMP) cells. This study detailedthe feedback loop between TRIB2, C/EBPα p42 andp30, and E2F1 that contributes to AML cell growth andsurvival [10]. The central mechanism of TRIB2-induced AMLidentified in this study is based on specific TRIB2-C/EBPα
interactions, with C/EBPα being a key substrate of TRIB2induced proteasomal degradation. The proteasomal mediateddegradation of TRIB substrates and interaction with proteinsof the ubiquitin proteasome system (UPS) are central to TRIBfunction in a number of cancers and will be discussed further.
TRIB2: the ruler of E3 ubiquitin ligaseactivitiesThe degradation of damaged or no longer necessary proteinsis mainly regulated by the UPS. The targets of this pathwayare marked by the addition of a ubiquitin tag. Ubiquitin isa short peptide covalently bound to a lysine (Lys) residue
C©2015 Authors; published by Portland Press Limited
Tribbles pseudokinases on the crossroads of metabolism, cancer, immunity and development 1091
on the target. This complex protein modification requiresthe activity of at least three enzymes: an E1 ubiquitinactivating enzyme, an E2 ubiquitin conjugating enzymeand an E3 ubiquitin ligase. The E3 ligase family compriseover 1000 enzymes with different substrate specificities.Moreover homologous ubiquitin like proteins (UBL) anddeubiquitinases (DUBs), which hydrolyse ubiquitin moieties,represent additional layers of regulation for the proteolysisof specific targets [18]. In addition to the 26S proteasomecomplex, an immunoproteasome complex is present in cellsof haematopoietic origin and potentially relates to the highersensitivity of proteasome inhibition in leukaemic cells [19].
The first connections between TRIB and protein de-gradation functions were identified in drosophila, wheredrosophila tribbles was shown to promote degradation ofits targets; string (homologous of the mammalian CDC25phosphatase, positive regulator of cell cycle progression) andslow border cells (Slbo) (promoter of cell migration andhomologous of the human C/EBPα) [20]. The membersof the C/EBP family of transcription factors are involvedin regulation of differentiation in many tissues and controlproliferation through interaction with cell cycle proteins.In the haematopoietic system C/EBPα acts as a tumoursuppressor that promotes cell cycle arrest and inducesgranulocytic differentiation through inhibition of E2Factivity [21,22]. Both mammalian TRIB1 and TRIB2 havebeen shown to retain the degradative functions towards theC/EBPα protein and promote C/EBPα p42 degradationand this function underlies their oncogenic potential inleukaemia [2,23,24]. Moreover, TRIB2-dependent C/EBPα
p42 degradation is mediated by the proteasome andconstitutive photomorphogenesis 1 (COP1). COP1 is anE3 ubiquitin ligase recruited by TRIB2 for the interactionwith C/EBPα, suggesting TRIB2 functions as a scaffoldprotein to colocalize the enzyme with its target [25]. TheCOP1 binding site in the C-terminus is conserved among theTRIB family of proteins and indeed COP1 is the E3 ligaseresponsible for TRIB1-mediated degradation of C/EBPα
[23] and TRIB3-mediated degradation of acetyl-coenzymeA carboxylase (ACC) in fasting condition [26]. TRIB2 alsoregulates C/EBPα protein levels in liver cells, and mediatesC/EBPα degradation in lung cancer models [5,6]. In thelatter case, the E3 ligase TRIM21 was identified to functionin TRIB2-mediated C/EBPα degradation. With regard tospecific TRIB2 substrates, another member of the C/EBPfamily, C/EBPβ, has been shown to be degraded by TRIB2in adipogenesis. In this study, TRIB2 functions as a negativeregulator of adipogenesis associated with Akt inhibition [27].Another example of TRIB-dependent degradation of targetproteins in cancer is represented by activating transcriptionfactor 4 (ATF4) which occurs during hypoxia in humantumour cells overexpressing TRIB3 [28]. Interestingly, themurine ortholog of TRIB3 Neuronal cell death-inducibleputative kinase (NIPK) has also been associated with down-regulation of ATF4 transcriptional activity, but in absence ofproteolytic degradation [29]. The protein interaction of ATF4with TRIB2 or TRIB1 as not been reported.
Cell context, especially with regard to protein–proteininteractions is highly relevant in deciphering the function ofmany signalling molecules, including TRIB proteins. TRIB2has been implicated as a positive or negative mediator ofproteasomal degradation. For example, TRIB2 interacts withthe substrate binding subunit of the ubiquitin complexSKP1–CUL1 (Cullin)–F-box (SCF) βTrCP in liver cancercells [6]. This complex is responsible for Yes-associatedprotein (YAP) degradation, but TRIB2 binding on βTrCPsubunit leads to YAP stabilization and transactivation ofYAP target genes. The C-terminal domain of TRIB2 wasshown to be responsible for the interaction with βTrCPin these liver cancer cells. Noteworthy in the same study,TRIB2 also targets C/EBPα for degradation, but this wasnot via βTrCP E3 ligase. As described above, COP1 orTRIM21 are known to mediate TRIB2 dependent C/EBPα
degradation in AML and lung cancer, whereas the E3ligase has not been clarified in liver cells. TRIB2 andthe E3 ligase Smad ubiquitination regulatory factor 1(SMURF1) also interact in liver cancer cells. SMURF1is the enzyme responsible for TRIB2 ubiquitination andproteasomal dependent degradation and SMURF1 inhibitiontriggers TRIB2-dependent carcinogenesis in the liver [30].Nonetheless, TRIB2 is also a partner of SMURF1 in theinhibition of the Wnt signalling effector β-catenin and TCF4.Indeed, deletion of the SMURF1 binding sites on the TRIB2protein abolished its ability to down-regulate β-catenin andtranscription factor 4 (TCF4) [31]. COP1 or βTrCP were alsodescribed as additional modulators in this same pathway [32].Together these data reveal the complexity of TRIB2 and UPSinteractions in liver cancer cells, and highlight the importanceof cell context in TRIB family protein function.
UPS aberration in leukaemiaDysregulation of E3 ligase enzymatic activity has beenreported in different malignancies. Transforming mutant vari-ants of the E3 ubiquitin ligase Casitas B-lineage lymphomaproto-oncogene (cClb) have been found in human myeloidmalignancies and all these mutations were associated withloss of E3 ubiquitin ligase activity in addition to a malignantgain of function [33]. Mutations in the E3 ligase FBW7have been associated with oncogenic signalling mechanismsin different cancers including NOTCH1 activation in T-ALL [34]. Moreover, the recent profiling of the somaticmutation landscape of epigenetic regulators in paediatriccancer identified the deubiquitinase USP7 as one of the mostfrequent mutations in T-ALL [35]. This DUB is associatedwith chromatin remodelling and it is referred as an ‘eraser’among epigenetic modifiers. Its physiological function is tostabilize the histone H2B (as well as other targets), removingubiquitin subunits from the substrates. In 8% of T-ALL casessequence variation translates to loss of function of the proteinand the consequent epigenetic alteration is associated withthe leukaemic disease [35]. This case supports the importantrole of ubiquitination signalling beyond terminal proteindegradation in leukaemic transformation. The proteolytic
C©2015 Authors; published by Portland Press Limited
1092 Biochemical Society Transactions (2015) Volume 43, part 5
pathways of UPS and autophagy in AML cell lines aredirectly involved in the response to chemotherapeutic drugscytarabine and doxorubicin. Studies show that the responseto chemotherapy is highly dependent on the basal level ofactivation of the UPS in leukaemic cells [36]. It is possibleto measure the proteasome expression and activities in theplasma of AML, ALL and MDS patient samples and higherlevels of UPS protein and activities are detectable in patientsplasma samples [37]. Importantly, the levels of proteasomeactivities can be used to risk stratify for the prognosis ofdifferent blood tumours. Since it is likely that the activities de-tected in the AML patients’ plasma is reflecting the activitiesin the leukaemic cells, screening of the proteasome activitiesin the plasma samples from patients could be advantageousnot only as a biomarker, but also to identify the most suitabletherapeutic combination taking advantage of the new drugsavailable in clinical trials targeting the UPS system.
Targeting UPS in blood tumours
Proteasome inhibitorsLeukaemic cells express high levels of proteasomes [38]and this is probably one of the reasons why therapeuticproteasome inhibition has shown better results in bloodcancers than in solid tumours [39]. Multiple toxicitymechanisms of proteasome inhibition have been validated inpreclinical studies. These comprise NFkB inhibition throughstabilization of its regulator IkBα; cell cycle arrest due toderegulation of cyclins and other cell cycle regulator proteins;induction of a proapoptotic state through stabilization ofp53 and Bax and down-regulation of Bcl-2; ROS production;transmembrane mitochondrial potential gradient dissipation;aggresome formation; endoplasmic reticulum (ER) andunfolded protein response (UPR) [40].
Eight classes of proteasome inhibitors (PI) have beenrecognized across natural compounds and synthetic mo-lecules (peptide aldehydes, peptide vinyl sulfones, syrbactins,peptide boronates, peptide α′β ′-epoxyketones, peptideketoaldehydes, β-lactones, and oxatiazol-2-ones). Onlyrepresentative members of some classes have reached the stageof clinical trials investigations in cancer. Many have failed dueto lack of specificity and or toxicity in preclinical studies.The main PIs of interest in the treatment of haematologicalmalignancies include three peptide boronates, two peptideepoxyketones and one marine natural product, β-lactone.The boronate compound Bortezomib (BTZ) is a reversibleinhibitor of the proteasome and the immunoproteasomeand the first PI ever entered in clinical trials [41]. BTZis currently approved for use as single agent or incombination therapies in multiple myeloma or mantle celllymphoma patients. Moreover a number of clinical trialshave been assessing its efficacy in aggressive disease likeacute leukaemias (CALGB (Alliance) Study 10502, COGAAML 1031) [42]. To overcome toxicity and resistancechallenges with BTZ, a great effort has been spent in thedesign and characterization of next generation inhibitors.
Among them Carfilzomib has been approved by the FDAfor the treatment of relapsed/refractory multiple myeloma[43], and Oprozomib, Ixazomib, Marizomib and Delanzomibhave already reached clinical trials investigation. The activityof immunoproteasome specific inhibitors is also currentlybeing assessed in preclinical investigation in models ofimmunological disorders [41].
Other UPS targetsThe recent interest in targeting the UPS system has broughtattention to the identification of druggable targets upstreamof the proteasome, which by their nature are predicted tolead to more specific inhibition and fewer side effects. Inthis category there are E1 activating enzyme inhibitors, E2conjugating enzyme inhibitors, E3 ubiquitin ligases inhibitorsand DUB enzyme inhibitors [44]. Indeed the inhibition of theUBL modifier Nedd8 is currently in clinical trials for AMLand MDS [45]. More than one E3 ligases have been chosen aspotential targets in the drug discovery process for treatmentof haematological malignancies and many small moleculeshave been studied. Examples among the most targeted E3ligases are MDM2, involved in p53 regulation [46], and SCFmulti-subunit E3 ligases [47].
Concluding remarks and future perspectiveGiven that C/EBPα stability is tightly regulated at molecularlevel and that TRIB2 mediated dysregulation of this pathwayis linked to AML, liver and lung carcinogenesis, targetingthe related network of E3 ligases could open new excitingtherapeutic windows, resulting in a more specific and possiblymore effective treatment of these malignancies. There isan urgent need for alternative therapeutic strategies in thetreatment of blood diseases. Increasing interest has beenraised around the modulation of proteolytic pathways such asautophagy and UPS, which often play critical roles in cancercells. TRIB2, as a signalling pathway modulator and bindingpartner of different E3 ubiquitin ligase enzymes has gainedattention over the past decade as a major regulator in solidtumours and different leukaemia subtypes. TRIB2 has beenproposed as a valid biomarker for diagnosis and progressionof melanoma, correlating higher TRIB2 expression levelswith advanced stages of the disease [48]. Given the strongpreclinical data regarding TRIB2 in AML, the screeningof TRIB2 protein expression in leukaemia patients wouldbe extremely useful to complement the current informationavailable on TRIB2 carcinogenesis and mutational profile.
Acknowledgements
We wish to thank the members of the Keeshan lab for thoughtful
discussion and proofreading. We thank the Biochemical society
for travel bursaries to attend the independent meeting Tribbles
Pseudokinases on the Crossroads of Metabolism, Cancer, Immunity
and Development, in Budapest. We also thank the Organising
Committee for covering the registration fees.
C©2015 Authors; published by Portland Press Limited
Tribbles pseudokinases on the crossroads of metabolism, cancer, immunity and development 1093
Funding
KK and JC were supported by the Howat Foundation and Children
with Cancer UK. MS was supported by Friends of Paul O’Gorman
Leukaemia Research Centre.
References1 Lohan, F. and Keeshan, K. (2013) The functionally diverse roles of
tribbles. Biochem. Soc. Trans. 41, 1096–1100 CrossRef PubMed2 Keeshan, K., He, Y., Wouters, B.J., Shestova, O., Xu, L., Sai, H., Rodriguez,
C.G., Maillard, I., Tobias, J.W., Valk, P. et al. (2006) Tribbles homolog 2inactivates C/EBPalpha and causes acute myelogenous leukemia. CancerCell 10, 401–411 CrossRef PubMed
3 Sanda, T., Lawton, L.N., Barrasa, M.I., Fan, Z.P., Kohlhammer, H.,Gutierrez, A., Ma, W., Tatarek, J., Ahn, Y., Kelliher, M.A. et al. (2012) Coretranscriptional regulatory circuit controlled by the TAL1 complex inhuman T cell acute lymphoblastic leukemia. Cancer Cell 22, 209–221CrossRef PubMed
4 Zanella, F., Renner, O., Garcia, B., Callejas, S., Dopazo, A., Peregrina, S.,Carnero, A. and Link, W. (2010) Human TRIB2 is a repressor of FOXO thatcontributes to the malignant phenotype of melanoma cells. Oncogene29, 2973–2982 CrossRef PubMed
5 Grandinetti, K.B., Stevens, T.A., Ha, S., Salamone, R.J., Walker, J.R., Zhang,J., Agarwalla, S., Tenen, D.G., Peters, E.C. and Reddy, V.A. (2011)Overexpression of TRIB2 in human lung cancers contributes totumorigenesis through downregulation of C/EBPα. Oncogene 30,3328–3335 CrossRef PubMed
6 Wang, J., Park, J.S., Wei, Y., Rajurkar, M., Cotton, J.L., Fan, Q., Lewis, B.C.,Ji, H. and Mao, J. (2013) TRIB2 acts downstream of Wnt/TCF in livercancer cells to regulate YAP and C/EBPα function. Mol. Cell 51, 1–15CrossRef PubMed
7 Forbes, S.A., Beare, D., Gunasekaran, P., Leung, K., Bindal, N.,Boutselakis, H., Ding, M., Bamford, S., Cole, C., Ward, S. et al. (2015)COSMIC: exploring the world’s knowledge of somatic mutations inhuman cancer. Nucleic Acids Res. 43, D805–D811 CrossRef PubMed
8 Wouters, B.J., Jorda, M.A., Keeshan, K., Louwers, I.,Erpelinck-Verschueren, C.A.J., Tielemans, D., Langerak, A.W., He, Y.,Yashiro-Ohtani, Y., Zhang, P. et al. (2007) Distinct gene expressionprofiles of acute myeloid/T-lymphoid leukemia with silenced CEBPA andmutations in NOTCH1. Blood 110, 3706–3714 CrossRef PubMed
9 Argiropoulos, B., Palmqvist, L., Yung, E., Kuchenbauer, F., Heuser, M., Sly,L.M., Wan, A., Krystal, G. and Humphries, R.K. (2008) Linkage of Meis1leukemogenic activity to multiple downstream effectors including Trib2and Ccl3. Exp. Hematol. 36, 845–859 CrossRef PubMed
10 Rishi, L., Hannon, M., Salome, M., Hasemann, M., Frank, A.K., Campos, J.,Timoney, J., O’Connor, C., Cahill, M.R., Porse, B. et al. (2014) Regulationof Trib2 by an E2F1-C/EBPalpha feedback loop in AML cell proliferation.Blood 123, 2389–2400 CrossRef PubMed
11 Mancini, E., Sanjuan-Pla, A., Luciani, L., Moore, S., Grover, A., Zay, A.,Rasmussen, K.D., Luc, S., Bilbao, D., Carroll, D.O.A. et al. (2012) FOG-1and GATA-1 act sequentially to specify definitive megakaryocytic anderythroid progenitors. EMBO J. 31, 351–365 CrossRef PubMed
12 Nagel, S., Venturini, L., Przybylski, G.K., Grabarczyk, P., Schneider, B.,Meyer, C., Kaufmann, M., Schmidt, C.A., Scherr, M., Drexler, H.G. et al.(2011) Activation of paired-homeobox gene PITX1 by del(5)(q31) inT-cell acute lymphoblastic leukemia. Leuk. Lymph. 52, 1348–1359CrossRef
13 Zhang, C., Chi, Y.L., Wang, P.Y., Wang, Y.Q., Zhang, Y.X., Deng, J., Lv, C.J.and Xie, S.Y. (2012) miR-511 and miR-1297 inhibit human lungadenocarcinoma cell proliferation by targeting oncogene TRIB2. PLoSONE 7, e46090–e46090 CrossRef PubMed
14 Zhang, L., Li, X., Ke, Z., Huang, L., Liang, Y., Wu, J., Zhang, X., Chen, Y.,Zhang, H. and Luo, X. (2013) MiR-99a may serve as a potential oncogenein pediatric myeloid leukemia. Cancer Cell. Int. 13, 110 CrossRef PubMed
15 Xin, J.-X., Yue, Z., Zhang, S., Jiang, Z.-H., Wang, P.Y., Li, Y.-J., Pang, M. andXie, S.Y. (2013) miR-99 inhibits cervical carcinoma cell proliferation bytargeting TRIB2. Oncol. Lett. 6, 1025–1030 PubMed
16 Palma, C.A., Al Sheikha, D., Lim, T.K., Bryant, A., Vu, T.T., Jayaswal, V. andMa, D.D. (2014) MicroRNA-155 as an inducer of apoptosis and celldifferentiation in Acute Myeloid Leukaemia. Mol. Cancer 13, 79CrossRef PubMed
17 Wang, P.Y., Sun, Y.X., Zhang, S., Pang, M., Zhang, H.-H., Gao, S.-Y., Zhang,C., Lv, C.J. and Xie, S.Y. (2013) Let-7c inhibits A549 cell proliferationthrough oncogenic TRIB2 related factors. FEBS Lett. 587, 2675–2681CrossRef PubMed
18 Komander, D. (2009) The emerging complexity of protein ubiquitination.Biochem. Soc. Trans. 37, 937–953 CrossRef PubMed
19 Niewerth, D., Franke, N.E., Jansen, G., Assaraf, Y.G., van Meerloo, J., Kirk,C.J., Degenhardt, J., Anderl, J., Schimmer, A.D., Zweegman, S. et al.(2013) Higher ratio immune versus constitutive proteasome level asnovel indicator of sensitivity of pediatric acute leukemia cells toproteasome inhibitors. Haematologica 98, 1896–1904 CrossRef PubMed
20 Dobens, Jr, L.L. and Bouyain, S. (2012) Developmental roles of tribblesprotein family members. Dev. Dyn. 241, 1239–1248CrossRef PubMed
21 Keeshan, K., Santilli, G., Corradini, F., Perrotti, D. and Calabretta, B.(2003) Transcription activation function of C/EBPalpha is required forinduction of granulocytic differentiation. Blood 102, 1267–1275CrossRef PubMed
22 Porse, B.T. (2005) Loss of C/EBPα cell cycle control increases myeloidprogenitor proliferation and transforms the neutrophil granulocytelineage. J. Exp. Med. 202, 85–96 CrossRef PubMed
23 Dedhia, P.H., Keeshan, K., Uljon, S., Xu, L., Vega, M.E., Shestova, O.,Zaks-Zilberman, M., Romany, C., Blacklow, S.C. and Pear, W.S. (2010)Differential ability of tribbles family members to promote degradation ofC/EBP and induce acute myelogenous leukemia. Blood 116, 1321–1328CrossRef PubMed
24 Yokoyama, T., Kanno, Y., Yamazaki, Y., Takahara, T., Miyata, S. andNakamura, T. (2010) Trib1 links the MEK1/ERK pathway in myeloidleukemogenesis. Blood 116, 2768–2775 CrossRef PubMed
25 Keeshan, K., Bailis, W., Dedhia, P.H., Vega, M.E., Shestova, O., Xu, L.,Toscano, K., Uljon, S.N., Blacklow, S. C. and Pear, W.S. (2010)Transformation by tribbles homolog 2 (Trib2) requires both the Trib2kinase domain and COP1 binding. Blood 116, 4948–4957CrossRef PubMed
26 Qi, L., Heredia, J.E., Altarejos, J.Y., Screaton, R., Goebel, N., Niessen, S.,Macleod, I.X., Liew, C.W., Kulkarni, R.N., Bain, J. et al. (2006) TRB3 linksthe E3 ubiquitin ligase COP1 to lipid metabolism. Science 312,1763–1766 CrossRef PubMed
27 Naiki, T., Saijou, E., Miyaoka, Y., Sekine, K. and Miyajima, A. (2007) TRB2,a mouse tribbles ortholog, suppresses adipocyte differentiation byinhibiting AKT and C/EBPbeta. J. Biol. Chem. 282, 24075–24082CrossRef PubMed
28 Bowers, A.J., Scully, S. and Boylan, J.F. (2003) SKIP3, a novel Drosophilatribbles ortholog, is overexpressed in human tumors and is regulated byhypoxia. Oncogene 22, 2823–2835 CrossRef PubMed
29 Ord, D. and Ord, T. (2003) Mouse NIPK interacts with ATF4 and affects itstranscriptional activity. Exp. Cell Res. 286, 308–320 CrossRef PubMed
30 Wang, J., Zhang, Y., Weng, W., Qiao, Y., Ma, L., Xiao, W., Yu, Y., Pan, Q.and Sun, F. (2013) Impaired phosphorylation and ubiquitination by P70S6 kinase (P70S6K) and Smad ubiquitination regulatory factor 1 (Smurf1)promotes tribbles homolog 2 (TRIB2) stability and carcinogenic propertyin liver cancer. J. Biol. Chem. 288, 33667–33681 CrossRef PubMed
31 Xu, S., Tong, M., Huang, J., Zhang, Y., Qiao, Y., Weng, W., Liu, W., Wang, J.and Sun, F. (2014) TRIB2 inhibits Wnt/beta-Catenin/TCF4 signalingthrough its associated ubiquitin E3 ligases, beta-TrCP, COP1 and Smurf1,in liver cancer cells. FEBS Lett 588, 4334–4341 CrossRef PubMed
32 Qiao, Y., Zhang, Y. and Wang, J. (2013) Ubiquitin E3 ligase SCF(β-TRCP)regulates TRIB2 stability in liver cancer cells. Biochem. Biophys. Res.Commun. 441, 555–559 CrossRef PubMed
33 Kales, S.C., Ryan, P.E., Nau, M. M. and Lipkowitz, S. (2010) Cbl andhuman myeloid neoplasms: the Cbl oncogene comes of age. Cancer Res.70, 4789–4794 CrossRef PubMed
34 Thompson, B.J., Buonamici, S., Sulis, M.L., Palomero, T., Vilimas, T., Basso,G., Ferrando, A. and Aifantis, I. (2007) The SCFFBW7 ubiquitin ligasecomplex as a tumor suppressor in T cell leukemia. J. Exp. Med. 204,1825–1835 CrossRef PubMed
35 Huether, R., Dong, L., Chen, X., Wu, G., Parker, M., Wei, L., Ma, J.,Edmonson, M.N., Hedlund, E.K., Rusch, M.C. et al. (2014) The landscapeof somatic mutations in epigenetic regulators across 1,000 paediatriccancer genomes. Nat. Commun. 5, 3630 CrossRef PubMed
36 Fernandes, A., Azevedo, M.M., Pereira, O., Sampaio-Marques, B., Paiva,A., Correia-Neves, M., Castro, I. and Ludovico, P. (2014) Proteolyticsystems and AMP-activated protein kinase are critical targets of acutemyeloid leukemia therapeutic approaches. Oncotarget 1–13, in pressPubMed
C©2015 Authors; published by Portland Press Limited
1094 Biochemical Society Transactions (2015) Volume 43, part 5
37 Ma, W., Kantarjian, H., Zhang, X., Wang, X., Estrov, Z., O’Brien, S. andAlbitar, M. (2011) Ubiquitin-proteasome system profiling in acuteleukemias and its clinical relevance. Leuk. Res. 35, 526–533CrossRef PubMed
38 Kumatori, A., Tanaka, K., Inamura, N., Sone, S., Ogura, T., Matsumoto, T.,Tachikawa, T., Shin, S. and Ichihara, A. (1990) Abnormally highexpression of proteasomes in human leukemic cells. Proc. Natl. Acad.Sci. U.S.A. 87, 7071–7075 CrossRef PubMed
39 Orlowski, R.Z. and Kuhn, D.J. (2008) Proteasome inhibitors in cancertherapy: lessons from the first decade. Clin. Cancer Res. 14, 1649–1657CrossRef PubMed
40 Nencioni, A., Grunebach, F., Patrone, F., Ballestrero, A. and Brossart, P.(2007) Proteasome inhibitors: antitumor effects and beyond. Leukemia21, 30–36 CrossRef PubMed
41 Niewerth, D., Jansen, G., Assaraf, Y.G., Zweegman, S., Kaspers, G.J. L. andCloos, J. (2015) Molecular basis of resistance to proteasome inhibitors inhematological malignancies. Drug Resist. Updat. 18, 18–35CrossRef PubMed
42 Attar, E.C., Johnson, J.L., Amrein, P.C., Lozanski, G., Wadleigh, M.,DeAngelo, D.J., Kolitz, J.E., Powell, B.L., Voorhees, P., Wang, E.S. et al.(2013) Bortezomib added to daunorubicin and cytarabine duringinduction therapy and to intermediate-dose cytarabine for consolidationin patients with previously untreated acute myeloid leukemia age 60 to75 years: CALGB (Alliance) Study 10502. J. Clin. Oncol. 31, 923–929CrossRef PubMed
43 Katsnelson, A. (2012) Next-generation proteasome inhibitor approved inmultiple myeloma. Nat. Biotechnol. 30, 1011–1012 CrossRef PubMed
44 Crawford, L.J. and Irvine, A.E. (2013) Targeting the ubiquitin proteasomesystem in haematological malignancies. Blood Rev. 27, 297–304CrossRef PubMed
45 Swords, R.T., Erba, H.P., DeAngelo, D.J., Bixby, D.L., Altman, J.K., Maris,M., Hua, Z., Blakemore, S.J., Faessel, H., Sedarati, F. et al. (2015)Pevonedistat (MLN4924), a First-in-Class NEDD8-activating enzymeinhibitor, in patients with acute myeloid leukaemia and myelodysplasticsyndromes: a phase 1 study. Br. J. Haematol. 169, 534–543CrossRef PubMed
46 Zhao, Y., Aguilar, A., Bernard, D. and Wang, S. (2015) Small-moleculeinhibitors of the MDM2-p53 protein–protein interaction (MDM2inhibitors) in clinical trials for cancer treatment. J. Med. Chem. 58,1038–1052 CrossRef PubMed
47 Chan, C.H., Morrow, J.K., Li, C.F., Gao, Y., Jin, G., Moten, A., Stagg, L.J.,Ladbury, J.E., Cai, Z., Xu, D. et al. (2013) Pharmacological inactivation ofSkp2 SCF ubiquitin ligase restricts cancer stem cell traits and cancerprogression. Cell 154, 556–568 CrossRef PubMed
48 Hill, R., Kalathur, R.K.R., Colaco, L., Brandao, R., Ugurel, S., Futschik, M.and Link, W. (2015) TRIB2 as a biomarker for diagnosis and progressionof melanoma. Carcinogenesis 36, 469–477 CrossRef PubMed
Received 6 May 2015doi:10.1042/BST20150103
C©2015 Authors; published by Portland Press Limited
164
Appendix G PDF of “The presence of C/EBPα and its degradation are both required
for TRIB2-mediated leukaemia”
ORIGINAL ARTICLE
The presence of C/EBPα and its degradation are both requiredfor TRIB2-mediated leukaemiaC O’Connor1, F Lohan1, J Campos1, E Ohlsson2,3,4, M Salomè1, C Forde5, R Artschwager6, RM Liskamp6, MR Cahill7, PA Kiely8,B Porse2,3,4 and K Keeshan1
C/EBPα (p42 and p30 isoforms) is commonly dysregulated in cancer via the action of oncogenes, and specifically in acute myeloidleukaemia (AML) by mutation. Elevated TRIB2 leads to the degradation of C/EBPα p42, leaving p30 intact in AML. Whether thisrelationship is a cooperative event in AML transformation is not known and the molecular mechanism involved remains elusive.Using mouse genetics, our data reveal that in the complete absence of C/EBPα, TRIB2 was unable to induce AML. Only in thepresence of C/EBPα p42 and p30, were TRIB2 and p30 able to cooperate to decrease the latency of disease. We demonstrate thatthe molecular mechanism involved in the degradation of C/EBPα p42 requires site-specific direct interaction between TRIB2 and C/EBPα p42 for the K48-specific ubiquitin-dependent proteasomal degradation of C/EBPα p42. This interaction and ubiquitination isdependent on a critical C terminal lysine residue on C/EBPα. We show effective targeting of this pathway pharmacologically usingproteasome inhibitors in TRIB2-positive AML cells. Together, our data show that excess p30 cooperated with TRIB2 only in thepresence of p42 to accelerate AML, and the direct interaction and degradation of C/EBPα p42 is required for TRIB2-mediated AML.
Oncogene advance online publication, 21 March 2016; doi:10.1038/onc.2016.66
INTRODUCTIONThe C/EBPα (CCAAT/enhancer binding protein α) transcriptionfactor is commonly mutated in acute myeloid leukaemia (AML)and dysregulated in a number of cancers (that is, liver, prostate,lung, squamous cell carcinoma). Mutations in CEBPA occurexclusively in haematological diseases and result in perturbed C/EBPα protein expression and function. C/EBPα promoter methyla-tion perturbs C/EBPα expression in AML,1 chronic myeloidleukaemia2 and head and neck squamous cell carcinoma.3 InAML, oncogene-mediated dysregulation of C/EBPα mRNA expres-sion and/or protein activity occurs in cytogenetically abnormalsubtypes of AML, including AMLs with t(8;21)[AML1-ETO], inv(16)[CBFb-MYH11], t(15;17)[PML-RARA] and t(3;21)(AML-1-MDS-1-Evi-1fusion protein) translocations, and in cytogenetically normal AMLswith FLT3-ITD mutation, or with elevated TRIB2 expression.4 C/EBPα protein is also dysregulated by a number of posttranslationalmodifications including phosphorylation, sumoylation andubiquitination.5
CEBPA is an intronless gene with N terminal transcriptionalactivation domains and a C terminal basic region leucine zipper(LZ) domain. CEBPA mutations, which occur across the entirecoding region, are present in 5% and 10% of childhood and adultAML, respectively.6 Somatic and inherited mutations in CEBPA co-occur, are often biallelic and are found with higher frequency incytogenetically normal AML.7,8 CEBPA is a favourable prognosisfactor in AML, specifically for cases that present with doublemutations in CEBPA, typically an N terminal and a C terminal basicregion LZ gene mutation. C/EBPα protein exists as two isoforms, a
full length C/EBPα p42 isoform classified as a tumour suppressorand an N terminally truncated p30 isoform classified as anoncogene. N terminal mutations typically are frame-shift muta-tions that lead to a premature stop in translation of p42, whileretaining p30 expression. In contrast, C terminal mutationstypically are in-frame insertions/deletions in the LZ domain thatdisrupt DNA binding or dimerization. C/EBPα functions by formingstable homodimers and heterodimers with itself and other C/EBPfamily members, which act to stabilize their protein expression.9
TRIB2 is a potent oncogene capable of inducing fully penetrantAML in murine models, and can cooperate with other AMLoncogenes to disrupt signalling pathways and transcriptionfactors in AML disease.10–13 TRIB2 expression was shown to beelevated in a cohort of AML patients with a mixed myeloid/lymphoid phenotype and a dysregulated CEBPA gene expressionsignature. In fact, TRIB2 leads to the degradation of C/EBPα p42 viaE3 ligase COP1 binding whilst sparing p30 from degradation,resulting in disturbed granulopoiesis. This modulation of C/EBPαwas found to be critical for the induction of AML in vivo.10,13 E2F1cooperates with C/EBPα p30 to activate the Trib2 promoter inpreleukaemic cells resulting in elevated TRIB2 expression. This wasshown to be an important mechanism regulating TRIB2 expressionand survival of AML cells.12
In normal cells, C/EBPα is a key transcription factor in thetransition from the pre-granulocyte macrophage to thegranulocyte-macrophage progenitor stage of differentiation, andin the transcriptional and epigenetic control of haematopoieticstem cell (HSC) self-renewal.14–16 In granulocyte-macrophageprogenitor cells, C/EBPα p42 is found bound to the Trib2 promoter
1Paul O’Gorman Leukaemia Research Centre, Institute of Cancer Sciences, University of Glasgow, Glasgow, UK; 2The Finsen Laboratory, Rigshospitalet, Faculty of Health Sciences,University of Copenhagen, Copenhagen, Denmark; 3Biotech Research and Innovation Center (BRIC), University of Copenhagen, Copenhagen, Denmark; 4Danish Stem Cell Centre(DanStem) Faculty of Health Sciences, University of Copenhagen, Copenhagen, Denmark; 5University College Cork, Cork, Ireland; 6School of Chemistry, University of Glasgow,Glasgow, UK; 7Department of Haematology, Cork University Hospital, Cork, Ireland and 8Department of Life Sciences, Materials and Surface Science Institute and Stokes Institute,University of Limerick, Limerick, Ireland. Correspondence: Dr K Keeshan, Paul O’Gorman Leukaemia Research Centre, Institute of Cancer Sciences, University of Glasgow, 21Shelley Road, Glasgow G12 0XB, UK.E-mail: [email protected] 1 April 2015; revised 6 October 2015; accepted 8 January 2016
Oncogene (2016), 1–10© 2016 Macmillan Publishers Limited All rights reserved 0950-9232/16
www.nature.com/onc
and inhibits E2F1-mediated activation of Trib2. At the HSC stage,C/EBPα acts to prime HSCs for differentiation along the myeloidlineage via DNA binding to regulatory regions of genes inducedduring differentiation.16 Although conditional Cebpa knockoutmice do not develop disease, the loss of Cebpa in adult HSCs leadsto an increased number of functional and proliferative HSCs15,17
and loss of HSC pool maintenance in serial transplantations.16
Cebpa expression is required for AML disease initiation by theoncogene MLL-ENL but not for disease maintenance.18 In contrast,Cebpa is required for the maintenance of Hoxa9/Meis1 AMLdisease.19 Loss of Cebpa did not abrogate BCR/ABL-inducedleukaemia but it did alter the resultant disease phenotype.20 Thus,it appears that a certain threshold of C/EBPα expression isimportant for the development of myeloid leukaemic disease. Thisis supported by the observation that leukaemia-derived CEBPAmutations are virtually never null mutations.21,22 The combinationof N and C terminal mutations have distinct features that result inleukaemia development.23,24 Murine knockin studies investigatingp30 oncogenicity in the absence of C/EBPα p42 showed that p30induced fully penetrant transplantable AML.25 p30 is sufficient forhaematopoietic commitment to the myeloid lineage, it enablestransition from the common myeloid progenitor to thegranulocyte-macrophage progenitor stage. However, it does notretain the ability to control proliferation and myeloid progenitorshave greatly increased self-renewal capacities.25
Although TRIB2 disrupts the ratio of C/EBPα p42:p30 andfunctions to degrade C/EBPα, it is unclear whether the loss ofC/EBPα p42 or the expression of C/EBPα p30 is critical for TRIB2-mediated AML disease. Here, we show using mouse genetics thatthe presence of C/EBPα is paradoxically required for TRIB2-induced AML, and only in the presence of C/EBPα p42, is therea cooperative effect seen with TRIB2 and C/EBPα p30. We dissectthe molecular details of the degradative relationship betweenTRIB2 and C/EBPα p42, and show that the direct interactionbetween TRIB2 and C/EBPα p42 is required for TRIB2-mediatedubiquitin-dependent proteasomal degradation of C/EBPα p42. Weidentify lysine 313 of C/EBPα as a site of TRIB2-mediatedubiquitination. We show that we can target TRIB2 AML cells withproteasome inhibition. Together, these data show that C/EBPαpresence is required for the initiation of TRIB2-induced AML andsubsequent C/EBPα p42/p30 disruption is critical for TRIB2 AMLdisease.
RESULTSC/EBPα p42 accelerates AML in the presence of TRIB2 and excessp30To establish whether C/EBPα is essential for TRIB2-induced AML,we performed a bone marrow (BM) transplant using a previouslydescribed conditional Cebpafl/fl; Mx1Cre mouse model and usedpolyinosinic-polycytidylic acid (pIpC) to facilitate ablation ofCebpa #x003B1; in the haematopoietic compartment. Two weekspost deletion, c-Kit+ haematopoietic stem and progenitor cellsfrom the BM of pIpC-treated control Cebpafl/fl and CebpaΔ/Δ
animals were transduced with either empty MigR1 or MigR1-TRIB2retrovirus. Transduced cells were transplanted into irradiatedrecipients, and monitored for disease progression. As expected, allmice reconstituted with Cebpafl/fl cells expressing TRIB2 developedlethal AML with a median latency of 33 weeks, accompaniedby accumulation of GFP+ cells (mean fraction of Cebpafl/fl GFP-expressing cells 93% +/− 5.2%) in the BM and splenomegaly (datanot shown). In striking contrast, TRIB2-transduced CebpaΔ/Δ
haematopoietic stem and progenitor cells did not give rise toAML (Figure 1a and Supplementary Figure 1B). Notably, 14 monthsafter transplantation, CD45.2+GFP+ cells were detected suggestingthat the TRIB2-expressing CebpaΔ/Δ cells are able to properlyhome to the BM but do not give rise to leukaemia. Therefore,
although TRIB2 functions to degrade C/EBPα p42 leading toAML,10 the complete absence of C/EBPα abrogates TRIB2oncogenicity. Thus, it appears that a certain threshold of C/EBPα(p42 or p30) expression is necessary for the initiation ofTRIB2 AML.Having established the necessity of C/EBPα expression for TRIB2
AML, we next sought to elucidate whether p42 degradation or p30accumulation is the key driver of this pathway, and whether p30can cooperate with TRIB2 to accelerate disease onset.To investigate this, we designed a transplant model which utilizeddonor cells from an established Cebpa conditional knockoutmodel that only expressed p30 isoform (referred to here asCebpaΔ/p30), or were heterozygous for this allele still expressingp42 on one allele (referred to as Cebpafl/p30 cells) (see methodsand Figure 1b). CD45.2+ donor cells from pIpC-treated 8–14-week-old Cebpafl/+, Cebpafl/p30 and Cebpafl/p30; Mx1Cre mice wereharvested 2 weeks post deletion, transduced with MigR1 orMigR1-TRIB2 retrovirus and transplanted into CD45.1+ recipients.CD45.2 and GFP expression were monitored at 7 weeks posttransplant in peripheral blood (Supplementary Figures 1C and D)and every 2 weeks thereafter, showing recipient reconstitutionwith donor cells. The cohort of mice transplanted with TRIB2-transduced Cebpafl/+ cells developed AML disease as previouslypublished10 with a median latency of 49 weeks. However, micetransplanted with TRIB2-transduced Cebpafl/p30 cells developed amuch more aggressive AML with an accelerated latency of29 weeks (Figure 1c) as evidenced by accumulation of GFP+ cellsin the BM, elevated white blood cell counts and splenomegaly(Supplementary Figures 1E-J). Mice transplanted with MigR1transduced CebpaΔ/p30 cells developed AML with a medianlatency of 40 weeks, as expected and previously published forCebpaL/L mice25(‘L’ refers to p30), and no significant acceleration ofthe disease was seen in mice transplanted with TRIB2 transducedCebpaΔ/p30 cells (median latency of 35 weeks) (Figure 1d).Comparing TRIB2 AML in Cebpafl/p30 and CebpaΔ/p30 cohorts, p42accelerated AML in the presence of TRIB2 and excess p30(Figure 1e). Control cohorts of mice transplanted with Cebpafl/p30
and Cebpafl/+ cells transduced with MigR1 as expected did notdevelop any disease. Flow cytometry analysis showed that mice inboth of these groups had normal haematopoietic compartments(Supplementary Figures 1E-I). Flow cytometry analysis revealedthat the leukaemic profile of GFP+ Cebpafl/+-TRIB2, Cebpafl/p30-TRIB2, CebpaΔ/p30-TRIB2 and CebpaΔ/p30-MigR1 AML cells waspredominantly c-Kit+ (Figure 1f). Protein analysis of the leukaemicBM cells between the GFP+ Cebpafl/+-TRIB2, Cebpafl/p30-TRIB2,CebpaΔ/p30-TRIB2 and CebpaΔ/p30-MigR1 AML cells groups verifiedexpected p42 and p30 expression levels in mice (leukaemic ratiop42:p30 in Cebpafl/+-TRIB2 cohort, p42 and increased p30 inCebpafl/p30-TRIB2 and Cebpafl/p30-MigR1 cohort, comparable p30 inthe absence of p42 in CebpaΔ/p30-MigR1 and CebpaΔ/p30-TRIB2cohorts (Figure 1g)). Taken together, these data show that despiteTRIB2 functioning to degrade p42, C/EBPα is essential for theinitiation of TRIB2-mediated AML and only in the presence of C/EBPα p42 is there a cooperative effect seen with p30.
Identification of specific amino acids involved in the TRIB2 andC/EBPα interactionHaving shown the requirement for C/EBPα p42 in the initiation ofTRIB2-induced AML, we next focused on the interaction betweenC/EBPα and TRIB2. We first determined using subcellularfractionation and confocal microscopy that the co-localization ofTRIB2-C/EBPα was nuclear (Supplementary Figures 2A and B).Using GST pull-down experiments, we show that the C terminal LZdomain of C/EBPα is required for the interaction with TRIB2 as aGZ mutant expressing an unrelated LZ could no longer bind TRIB2.However, TRIB2 can still bind a C/EBPα LZ mutant (L12V) that canno longer dimerize, indicating TRIB2 binding to C/EBPα is
Deciphering the C/EBPα and TRIB2 relationshipC O’Connor et al
2
Oncogene (2016), 1 – 10 © 2016 Macmillan Publishers Limited
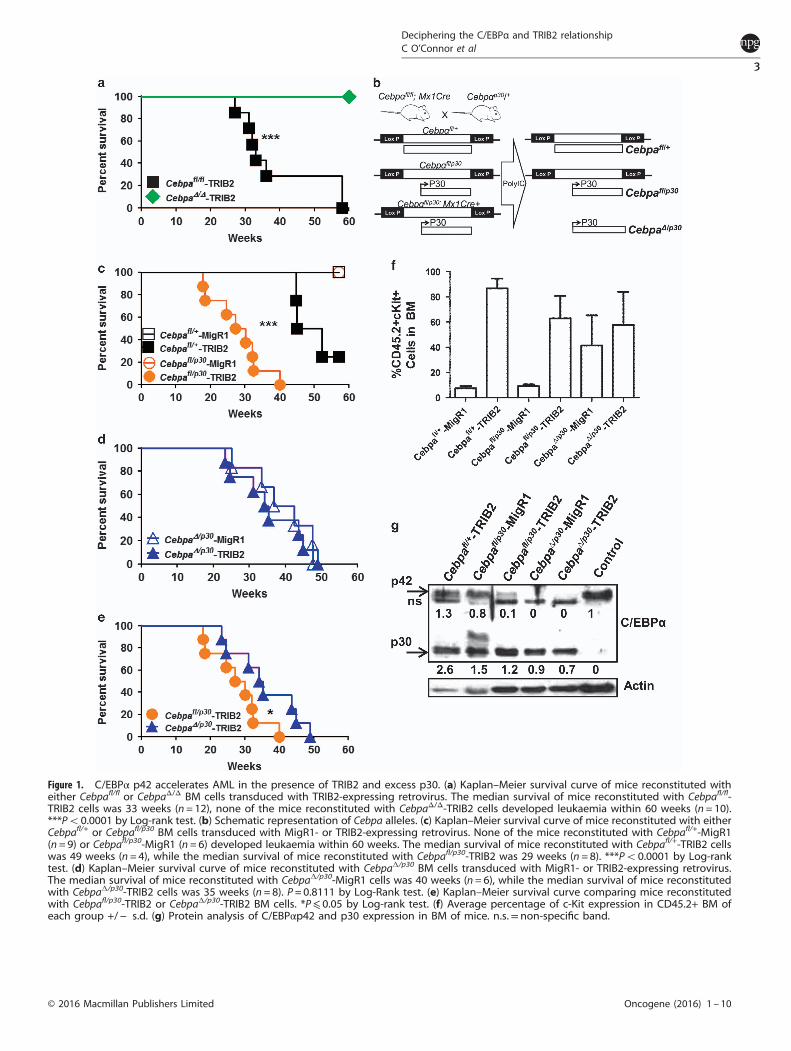
Figure 1. C/EBPα p42 accelerates AML in the presence of TRIB2 and excess p30. (a) Kaplan–Meier survival curve of mice reconstituted witheither Cebpafl/fl or CebpaΔ/Δ BM cells transduced with TRIB2-expressing retrovirus. The median survival of mice reconstituted with Cebpafl/fl-TRIB2 cells was 33 weeks (n = 12), none of the mice reconstituted with CebpaΔ/Δ-TRIB2 cells developed leukaemia within 60 weeks (n= 10).***Po0.0001 by Log-rank test. (b) Schematic representation of Cebpa alleles. (c) Kaplan–Meier survival curve of mice reconstituted with eitherCebpafl/+ or Cebpafl/p30 BM cells transduced with MigR1- or TRIB2-expressing retrovirus. None of the mice reconstituted with Cebpafl/+-MigR1(n= 9) or Cebpafl/p30-MigR1 (n= 6) developed leukaemia within 60 weeks. The median survival of mice reconstituted with Cebpafl/+-TRIB2 cellswas 49 weeks (n = 4), while the median survival of mice reconstituted with Cebpafl/p30-TRIB2 was 29 weeks (n = 8). ***Po0.0001 by Log-ranktest. (d) Kaplan–Meier survival curve of mice reconstituted with CebpaΔ/p30 BM cells transduced with MigR1- or TRIB2-expressing retrovirus.The median survival of mice reconstituted with CebpaΔ/p30-MigR1 cells was 40 weeks (n= 6), while the median survival of mice reconstitutedwith CebpaΔ/p30-TRIB2 cells was 35 weeks (n= 8). P = 0.8111 by Log-Rank test. (e) Kaplan–Meier survival curve comparing mice reconstitutedwith Cebpafl/p30-TRIB2 or CebpaΔ/p30-TRIB2 BM cells. *P⩽ 0.05 by Log-rank test. (f) Average percentage of c-Kit expression in CD45.2+ BM ofeach group +/− s.d. (g) Protein analysis of C/EBPαp42 and p30 expression in BM of mice. n.s.=non-specific band.
Deciphering the C/EBPα and TRIB2 relationshipC O’Connor et al
3
© 2016 Macmillan Publishers Limited Oncogene (2016) 1 – 10
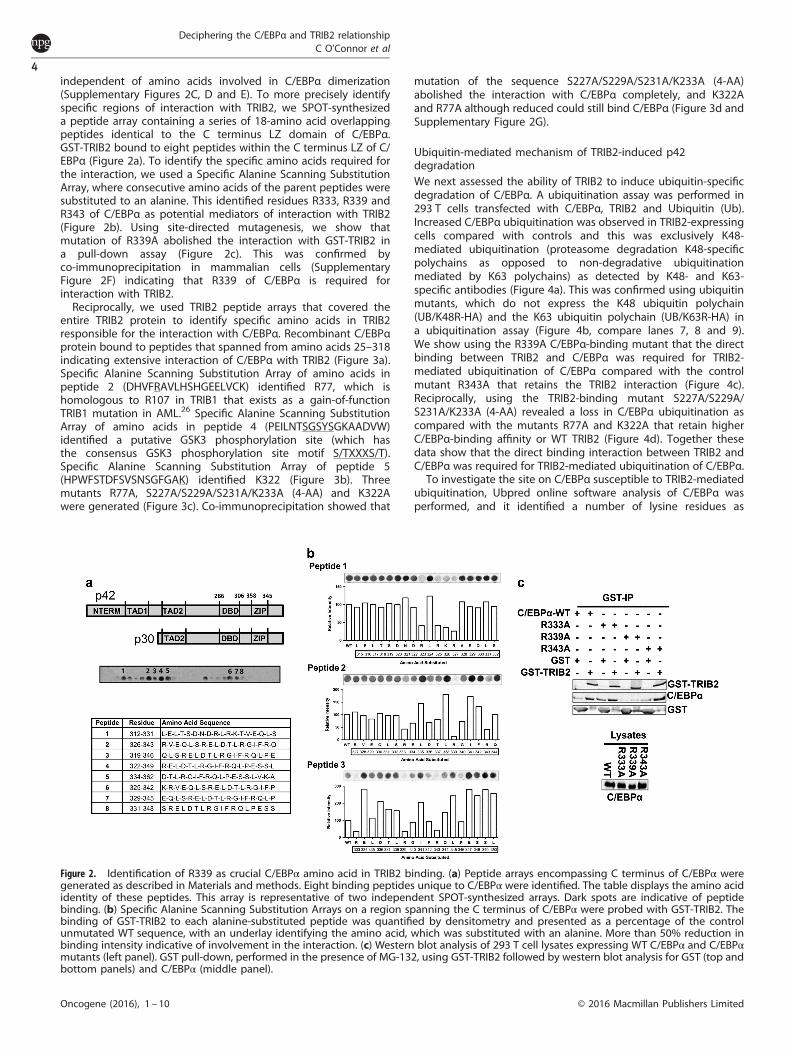
independent of amino acids involved in C/EBPα dimerization(Supplementary Figures 2C, D and E). To more precisely identifyspecific regions of interaction with TRIB2, we SPOT-synthesizeda peptide array containing a series of 18-amino acid overlappingpeptides identical to the C terminus LZ domain of C/EBPα.GST-TRIB2 bound to eight peptides within the C terminus LZ of C/EBPα (Figure 2a). To identify the specific amino acids required forthe interaction, we used a Specific Alanine Scanning SubstitutionArray, where consecutive amino acids of the parent peptides weresubstituted to an alanine. This identified residues R333, R339 andR343 of C/EBPα as potential mediators of interaction with TRIB2(Figure 2b). Using site-directed mutagenesis, we show thatmutation of R339A abolished the interaction with GST-TRIB2 ina pull-down assay (Figure 2c). This was confirmed byco-immunoprecipitation in mammalian cells (SupplementaryFigure 2F) indicating that R339 of C/EBPα is required forinteraction with TRIB2.Reciprocally, we used TRIB2 peptide arrays that covered the
entire TRIB2 protein to identify specific amino acids in TRIB2responsible for the interaction with C/EBPα. Recombinant C/EBPαprotein bound to peptides that spanned from amino acids 25–318indicating extensive interaction of C/EBPα with TRIB2 (Figure 3a).Specific Alanine Scanning Substitution Array of amino acids inpeptide 2 (DHVFRAVLHSHGEELVCK) identified R77, which ishomologous to R107 in TRIB1 that exists as a gain-of-functionTRIB1 mutation in AML.26 Specific Alanine Scanning SubstitutionArray of amino acids in peptide 4 (PEILNTSGSYSGKAADVW)identified a putative GSK3 phosphorylation site (which hasthe consensus GSK3 phosphorylation site motif S/TXXXS/T).Specific Alanine Scanning Substitution Array of peptide 5(HPWFSTDFSVSNSGFGAK) identified K322 (Figure 3b). Threemutants R77A, S227A/S229A/S231A/K233A (4-AA) and K322Awere generated (Figure 3c). Co-immunoprecipitation showed that
mutation of the sequence S227A/S229A/S231A/K233A (4-AA)abolished the interaction with C/EBPα completely, and K322Aand R77A although reduced could still bind C/EBPα (Figure 3d andSupplementary Figure 2G).
Ubiquitin-mediated mechanism of TRIB2-induced p42degradationWe next assessed the ability of TRIB2 to induce ubiquitin-specificdegradation of C/EBPα. A ubiquitination assay was performed in293 T cells transfected with C/EBPα, TRIB2 and Ubiquitin (Ub).Increased C/EBPα ubiquitination was observed in TRIB2-expressingcells compared with controls and this was exclusively K48-mediated ubiquitination (proteasome degradation K48-specificpolychains as opposed to non-degradative ubiquitinationmediated by K63 polychains) as detected by K48- and K63-specific antibodies (Figure 4a). This was confirmed using ubiquitinmutants, which do not express the K48 ubiquitin polychain(UB/K48R-HA) and the K63 ubiquitin polychain (UB/K63R-HA) ina ubiquitination assay (Figure 4b, compare lanes 7, 8 and 9).We show using the R339A C/EBPα-binding mutant that the directbinding between TRIB2 and C/EBPα was required for TRIB2-mediated ubiquitination of C/EBPα compared with the controlmutant R343A that retains the TRIB2 interaction (Figure 4c).Reciprocally, using the TRIB2-binding mutant S227A/S229A/S231A/K233A (4-AA) revealed a loss in C/EBPα ubiquitination ascompared with the mutants R77A and K322A that retain higherC/EBPα-binding affinity or WT TRIB2 (Figure 4d). Together thesedata show that the direct binding interaction between TRIB2 andC/EBPα was required for TRIB2-mediated ubiquitination of C/EBPα.To investigate the site on C/EBPα susceptible to TRIB2-mediated
ubiquitination, Ubpred online software analysis of C/EBPα wasperformed, and it identified a number of lysine residues as
Figure 2. Identification of R339 as crucial C/EBPα amino acid in TRIB2 binding. (a) Peptide arrays encompassing C terminus of C/EBPα weregenerated as described in Materials and methods. Eight binding peptides unique to C/EBPα were identified. The table displays the amino acididentity of these peptides. This array is representative of two independent SPOT-synthesized arrays. Dark spots are indicative of peptidebinding. (b) Specific Alanine Scanning Substitution Arrays on a region spanning the C terminus of C/EBPα were probed with GST-TRIB2. Thebinding of GST-TRIB2 to each alanine-substituted peptide was quantified by densitometry and presented as a percentage of the controlunmutated WT sequence, with an underlay identifying the amino acid, which was substituted with an alanine. More than 50% reduction inbinding intensity indicative of involvement in the interaction. (c) Western blot analysis of 293 T cell lysates expressing WT C/EBPα and C/EBPαmutants (left panel). GST pull-down, performed in the presence of MG-132, using GST-TRIB2 followed by western blot analysis for GST (top andbottom panels) and C/EBPα (middle panel).
Deciphering the C/EBPα and TRIB2 relationshipC O’Connor et al
4
Oncogene (2016), 1 – 10 © 2016 Macmillan Publishers Limited
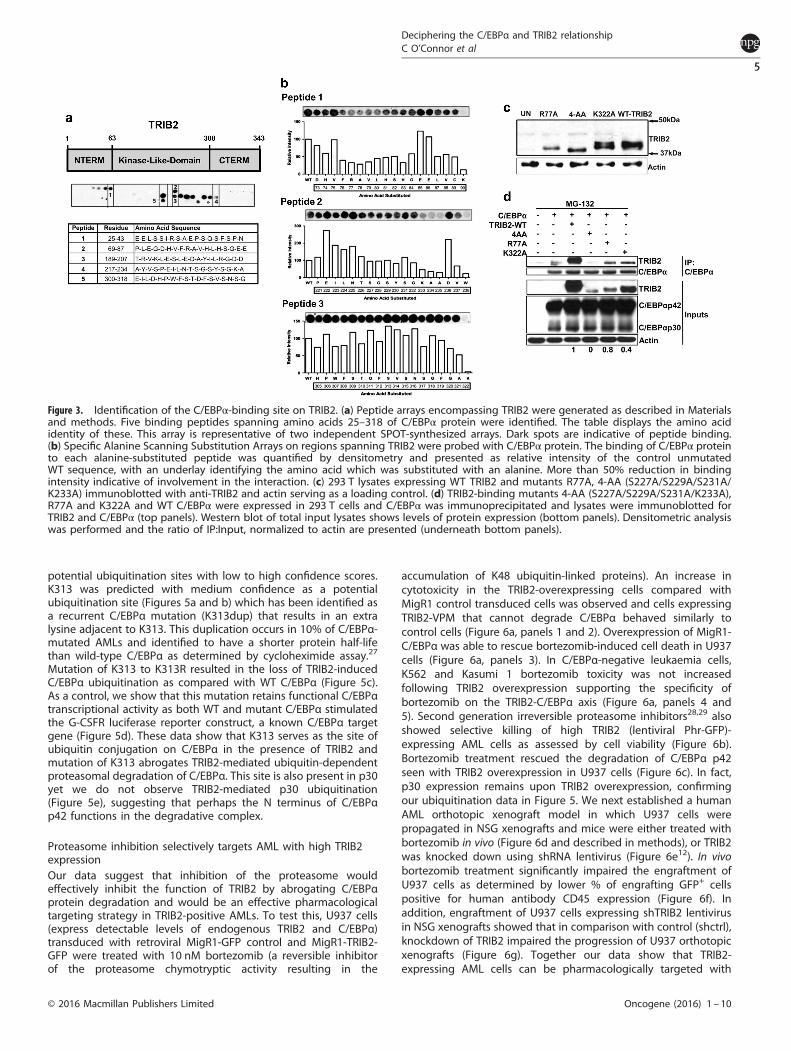
potential ubiquitination sites with low to high confidence scores.K313 was predicted with medium confidence as a potentialubiquitination site (Figures 5a and b) which has been identified asa recurrent C/EBPα mutation (K313dup) that results in an extralysine adjacent to K313. This duplication occurs in 10% of C/EBPα-mutated AMLs and identified to have a shorter protein half-lifethan wild-type C/EBPα as determined by cycloheximide assay.27
Mutation of K313 to K313R resulted in the loss of TRIB2-inducedC/EBPα ubiquitination as compared with WT C/EBPα (Figure 5c).As a control, we show that this mutation retains functional C/EBPαtranscriptional activity as both WT and mutant C/EBPα stimulatedthe G-CSFR luciferase reporter construct, a known C/EBPα targetgene (Figure 5d). These data show that K313 serves as the site ofubiquitin conjugation on C/EBPα in the presence of TRIB2 andmutation of K313 abrogates TRIB2-mediated ubiquitin-dependentproteasomal degradation of C/EBPα. This site is also present in p30yet we do not observe TRIB2-mediated p30 ubiquitination(Figure 5e), suggesting that perhaps the N terminus of C/EBPαp42 functions in the degradative complex.
Proteasome inhibition selectively targets AML with high TRIB2expressionOur data suggest that inhibition of the proteasome wouldeffectively inhibit the function of TRIB2 by abrogating C/EBPαprotein degradation and would be an effective pharmacologicaltargeting strategy in TRIB2-positive AMLs. To test this, U937 cells(express detectable levels of endogenous TRIB2 and C/EBPα)transduced with retroviral MigR1-GFP control and MigR1-TRIB2-GFP were treated with 10 nM bortezomib (a reversible inhibitorof the proteasome chymotryptic activity resulting in the
accumulation of K48 ubiquitin-linked proteins). An increase incytotoxicity in the TRIB2-overexpressing cells compared withMigR1 control transduced cells was observed and cells expressingTRIB2-VPM that cannot degrade C/EBPα behaved similarly tocontrol cells (Figure 6a, panels 1 and 2). Overexpression of MigR1-C/EBPα was able to rescue bortezomib-induced cell death in U937cells (Figure 6a, panels 3). In C/EBPα-negative leukaemia cells,K562 and Kasumi 1 bortezomib toxicity was not increasedfollowing TRIB2 overexpression supporting the specificity ofbortezomib on the TRIB2-C/EBPα axis (Figure 6a, panels 4 and5). Second generation irreversible proteasome inhibitors28,29 alsoshowed selective killing of high TRIB2 (lentiviral Phr-GFP)-expressing AML cells as assessed by cell viability (Figure 6b).Bortezomib treatment rescued the degradation of C/EBPα p42seen with TRIB2 overexpression in U937 cells (Figure 6c). In fact,p30 expression remains upon TRIB2 overexpression, confirmingour ubiquitination data in Figure 5. We next established a humanAML orthotopic xenograft model in which U937 cells werepropagated in NSG xenografts and mice were either treated withbortezomib in vivo (Figure 6d and described in methods), or TRIB2was knocked down using shRNA lentivirus (Figure 6e12). In vivobortezomib treatment significantly impaired the engraftment ofU937 cells as determined by lower % of engrafting GFP+ cellspositive for human antibody CD45 expression (Figure 6f). Inaddition, engraftment of U937 cells expressing shTRIB2 lentivirusin NSG xenografts showed that in comparison with control (shctrl),knockdown of TRIB2 impaired the progression of U937 orthotopicxenografts (Figure 6g). Together our data show that TRIB2-expressing AML cells can be pharmacologically targeted with
Figure 3. Identification of the C/EBPα-binding site on TRIB2. (a) Peptide arrays encompassing TRIB2 were generated as described in Materialsand methods. Five binding peptides spanning amino acids 25–318 of C/EBPα protein were identified. The table displays the amino acididentity of these. This array is representative of two independent SPOT-synthesized arrays. Dark spots are indicative of peptide binding.(b) Specific Alanine Scanning Substitution Arrays on regions spanning TRIB2 were probed with C/EBPα protein. The binding of C/EBPα proteinto each alanine-substituted peptide was quantified by densitometry and presented as relative intensity of the control unmutatedWT sequence, with an underlay identifying the amino acid which was substituted with an alanine. More than 50% reduction in bindingintensity indicative of involvement in the interaction. (c) 293 T lysates expressing WT TRIB2 and mutants R77A, 4-AA (S227A/S229A/S231A/K233A) immunoblotted with anti-TRIB2 and actin serving as a loading control. (d) TRIB2-binding mutants 4-AA (S227A/S229A/S231A/K233A),R77A and K322A and WT C/EBPα were expressed in 293 T cells and C/EBPα was immunoprecipitated and lysates were immunoblotted forTRIB2 and C/EBPα (top panels). Western blot of total input lysates shows levels of protein expression (bottom panels). Densitometric analysiswas performed and the ratio of IP:Input, normalized to actin are presented (underneath bottom panels).
Deciphering the C/EBPα and TRIB2 relationshipC O’Connor et al
5
© 2016 Macmillan Publishers Limited Oncogene (2016) 1 – 10
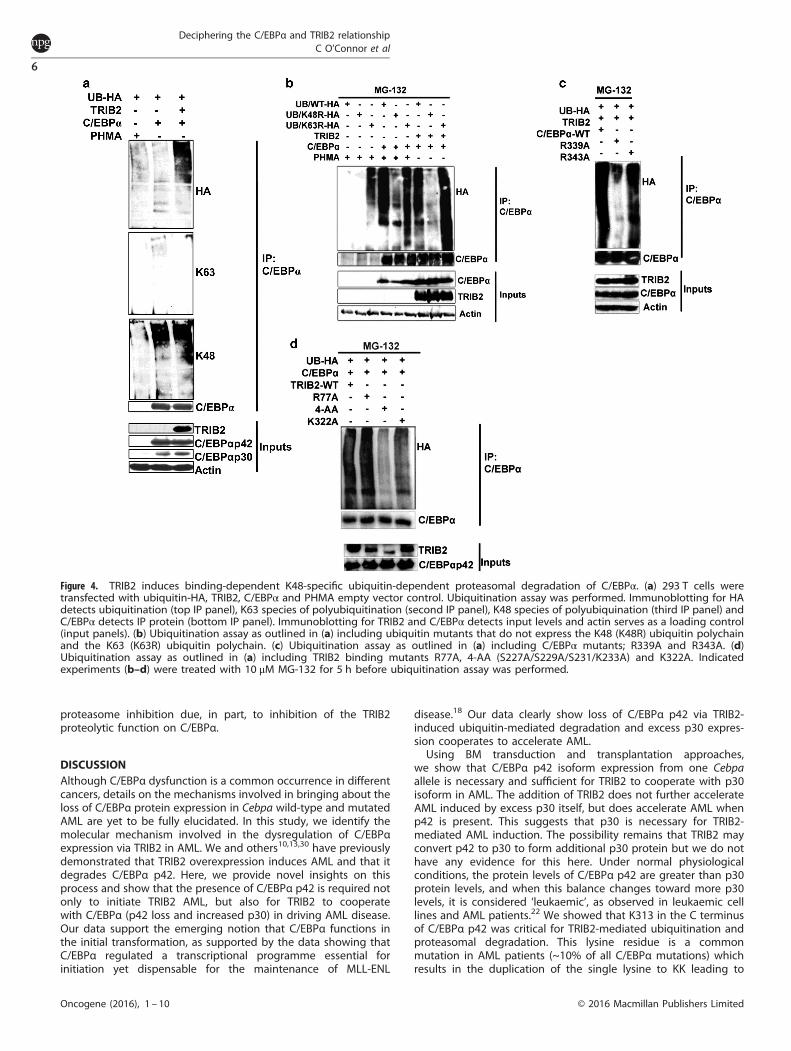
proteasome inhibition due, in part, to inhibition of the TRIB2proteolytic function on C/EBPα.
DISCUSSIONAlthough C/EBPα dysfunction is a common occurrence in differentcancers, details on the mechanisms involved in bringing about theloss of C/EBPα protein expression in Cebpa wild-type and mutatedAML are yet to be fully elucidated. In this study, we identify themolecular mechanism involved in the dysregulation of C/EBPαexpression via TRIB2 in AML. We and others10,13,30 have previouslydemonstrated that TRIB2 overexpression induces AML and that itdegrades C/EBPα p42. Here, we provide novel insights on thisprocess and show that the presence of C/EBPα p42 is required notonly to initiate TRIB2 AML, but also for TRIB2 to cooperatewith C/EBPα (p42 loss and increased p30) in driving AML disease.Our data support the emerging notion that C/EBPα functions inthe initial transformation, as supported by the data showing thatC/EBPα regulated a transcriptional programme essential forinitiation yet dispensable for the maintenance of MLL-ENL
disease.18 Our data clearly show loss of C/EBPα p42 via TRIB2-induced ubiquitin-mediated degradation and excess p30 expres-sion cooperates to accelerate AML.Using BM transduction and transplantation approaches,
we show that C/EBPα p42 isoform expression from one Cebpaallele is necessary and sufficient for TRIB2 to cooperate with p30isoform in AML. The addition of TRIB2 does not further accelerateAML induced by excess p30 itself, but does accelerate AML whenp42 is present. This suggests that p30 is necessary for TRIB2-mediated AML induction. The possibility remains that TRIB2 mayconvert p42 to p30 to form additional p30 protein but we do nothave any evidence for this here. Under normal physiologicalconditions, the protein levels of C/EBPα p42 are greater than p30protein levels, and when this balance changes toward more p30levels, it is considered ‘leukaemic’, as observed in leukaemic celllines and AML patients.22 We showed that K313 in the C terminusof C/EBPα p42 was critical for TRIB2-mediated ubiquitination andproteasomal degradation. This lysine residue is a commonmutation in AML patients (~10% of all C/EBPα mutations) whichresults in the duplication of the single lysine to KK leading to
Figure 4. TRIB2 induces binding-dependent K48-specific ubiquitin-dependent proteasomal degradation of C/EBPα. (a) 293 T cells weretransfected with ubiquitin-HA, TRIB2, C/EBPα and PHMA empty vector control. Ubiquitination assay was performed. Immunoblotting for HAdetects ubiquitination (top IP panel), K63 species of polyubiquitination (second IP panel), K48 species of polyubiquination (third IP panel) andC/EBPα detects IP protein (bottom IP panel). Immunoblotting for TRIB2 and C/EBPα detects input levels and actin serves as a loading control(input panels). (b) Ubiquitination assay as outlined in (a) including ubiquitin mutants that do not express the K48 (K48R) ubiquitin polychainand the K63 (K63R) ubiquitin polychain. (c) Ubiquitination assay as outlined in (a) including C/EBPα mutants; R339A and R343A. (d)Ubiquitination assay as outlined in (a) including TRIB2 binding mutants R77A, 4-AA (S227A/S229A/S231/K233A) and K322A. Indicatedexperiments (b–d) were treated with 10 μM MG-132 for 5 h before ubiquitination assay was performed.
Deciphering the C/EBPα and TRIB2 relationshipC O’Connor et al
6
Oncogene (2016), 1 – 10 © 2016 Macmillan Publishers Limited
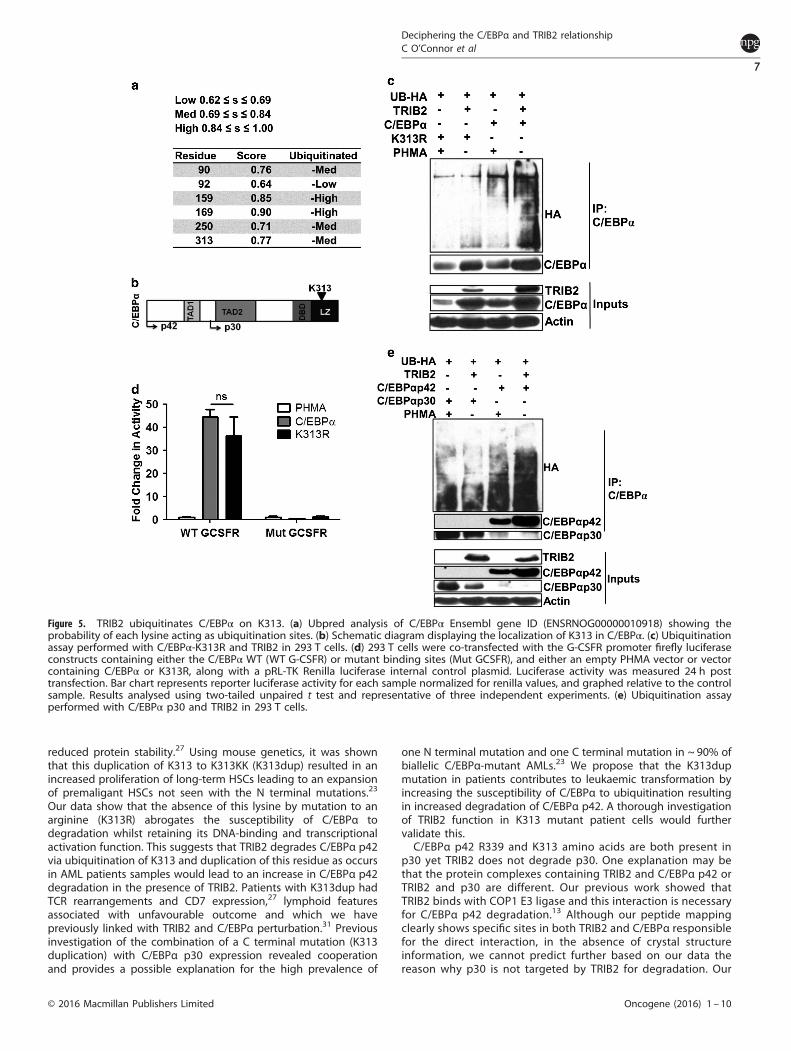
reduced protein stability.27 Using mouse genetics, it was shownthat this duplication of K313 to K313KK (K313dup) resulted in anincreased proliferation of long-term HSCs leading to an expansionof premaligant HSCs not seen with the N terminal mutations.23
Our data show that the absence of this lysine by mutation to anarginine (K313R) abrogates the susceptibility of C/EBPα todegradation whilst retaining its DNA-binding and transcriptionalactivation function. This suggests that TRIB2 degrades C/EBPα p42via ubiquitination of K313 and duplication of this residue as occursin AML patients samples would lead to an increase in C/EBPα p42degradation in the presence of TRIB2. Patients with K313dup hadTCR rearrangements and CD7 expression,27 lymphoid featuresassociated with unfavourable outcome and which we havepreviously linked with TRIB2 and C/EBPα perturbation.31 Previousinvestigation of the combination of a C terminal mutation (K313duplication) with C/EBPα p30 expression revealed cooperationand provides a possible explanation for the high prevalence of
one N terminal mutation and one C terminal mutation in ~ 90% ofbiallelic C/EBPα-mutant AMLs.23 We propose that the K313dupmutation in patients contributes to leukaemic transformation byincreasing the susceptibility of C/EBPα to ubiquitination resultingin increased degradation of C/EBPα p42. A thorough investigationof TRIB2 function in K313 mutant patient cells would furthervalidate this.C/EBPα p42 R339 and K313 amino acids are both present in
p30 yet TRIB2 does not degrade p30. One explanation may bethat the protein complexes containing TRIB2 and C/EBPα p42 orTRIB2 and p30 are different. Our previous work showed thatTRIB2 binds with COP1 E3 ligase and this interaction is necessaryfor C/EBPα p42 degradation.13 Although our peptide mappingclearly shows specific sites in both TRIB2 and C/EBPα responsiblefor the direct interaction, in the absence of crystal structureinformation, we cannot predict further based on our data thereason why p30 is not targeted by TRIB2 for degradation. Our
Figure 5. TRIB2 ubiquitinates C/EBPα on K313. (a) Ubpred analysis of C/EBPα Ensembl gene ID (ENSRNOG00000010918) showing theprobability of each lysine acting as ubiquitination sites. (b) Schematic diagram displaying the localization of K313 in C/EBPα. (c) Ubiquitinationassay performed with C/EBPα-K313R and TRIB2 in 293 T cells. (d) 293 T cells were co-transfected with the G-CSFR promoter firefly luciferaseconstructs containing either the C/EBPα WT (WT G-CSFR) or mutant binding sites (Mut GCSFR), and either an empty PHMA vector or vectorcontaining C/EBPα or K313R, along with a pRL-TK Renilla luciferase internal control plasmid. Luciferase activity was measured 24 h posttransfection. Bar chart represents reporter luciferase activity for each sample normalized for renilla values, and graphed relative to the controlsample. Results analysed using two-tailed unpaired t test and representative of three independent experiments. (e) Ubiquitination assayperformed with C/EBPα p30 and TRIB2 in 293 T cells.
Deciphering the C/EBPα and TRIB2 relationshipC O’Connor et al
7
© 2016 Macmillan Publishers Limited Oncogene (2016) 1 – 10
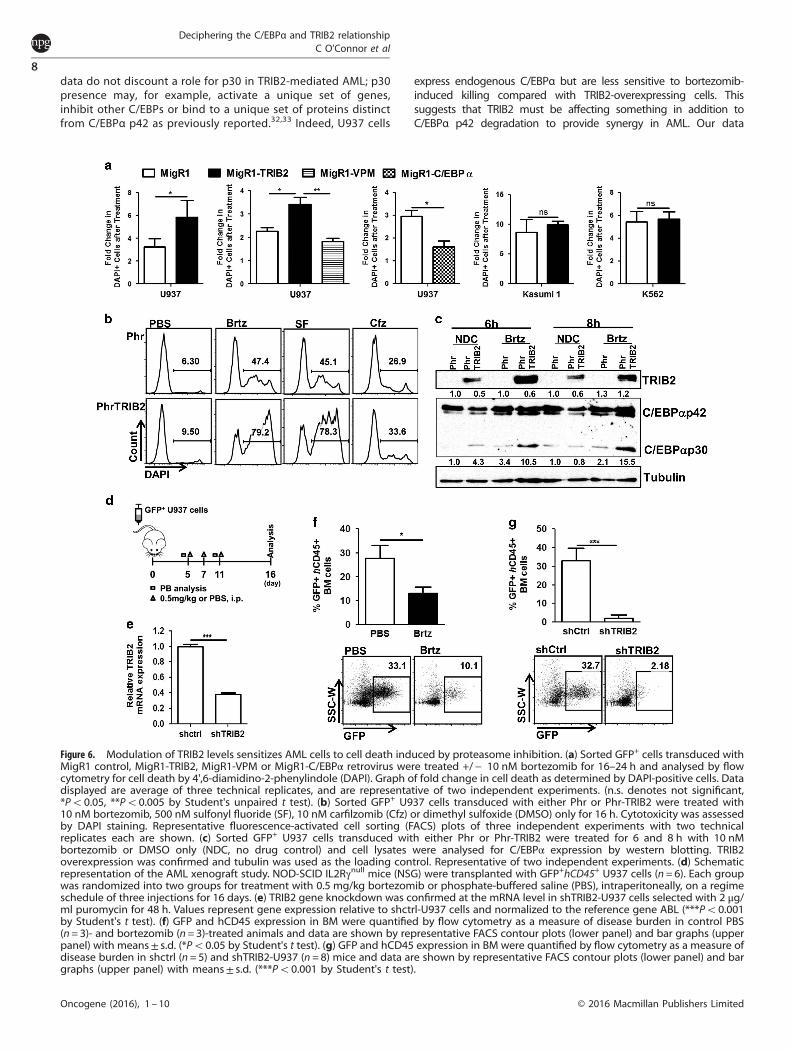
data do not discount a role for p30 in TRIB2-mediated AML; p30presence may, for example, activate a unique set of genes,inhibit other C/EBPs or bind to a unique set of proteins distinctfrom C/EBPα p42 as previously reported.32,33 Indeed, U937 cells
express endogenous C/EBPα but are less sensitive to bortezomib-induced killing compared with TRIB2-overexpressing cells. Thissuggests that TRIB2 must be affecting something in addition toC/EBPα p42 degradation to provide synergy in AML. Our data
Figure 6. Modulation of TRIB2 levels sensitizes AML cells to cell death induced by proteasome inhibition. (a) Sorted GFP+ cells transduced withMigR1 control, MigR1-TRIB2, MigR1-VPM or MigR1-C/EBPα retrovirus were treated +/− 10 nM bortezomib for 16–24 h and analysed by flowcytometry for cell death by 4',6-diamidino-2-phenylindole (DAPI). Graph of fold change in cell death as determined by DAPI-positive cells. Datadisplayed are average of three technical replicates, and are representative of two independent experiments. (n.s. denotes not significant,*Po0.05, **Po0.005 by Student's unpaired t test). (b) Sorted GFP+ U937 cells transduced with either Phr or Phr-TRIB2 were treated with10 nM bortezomib, 500 nM sulfonyl fluoride (SF), 10 nM carfilzomib (Cfz) or dimethyl sulfoxide (DMSO) only for 16 h. Cytotoxicity was assessedby DAPI staining. Representative fluorescence-activated cell sorting (FACS) plots of three independent experiments with two technicalreplicates each are shown. (c) Sorted GFP+ U937 cells transduced with either Phr or Phr-TRIB2 were treated for 6 and 8 h with 10 nMbortezomib or DMSO only (NDC, no drug control) and cell lysates were analysed for C/EBPα expression by western blotting. TRIB2overexpression was confirmed and tubulin was used as the loading control. Representative of two independent experiments. (d) Schematicrepresentation of the AML xenograft study. NOD-SCID IL2Rγnull mice (NSG) were transplanted with GFP+hCD45+ U937 cells (n= 6). Each groupwas randomized into two groups for treatment with 0.5 mg/kg bortezomib or phosphate-buffered saline (PBS), intraperitoneally, on a regimeschedule of three injections for 16 days. (e) TRIB2 gene knockdown was confirmed at the mRNA level in shTRIB2-U937 cells selected with 2 μg/ml puromycin for 48 h. Values represent gene expression relative to shctrl-U937 cells and normalized to the reference gene ABL (***Po0.001by Student's t test). (f) GFP and hCD45 expression in BM were quantified by flow cytometry as a measure of disease burden in control PBS(n= 3)- and bortezomib (n= 3)-treated animals and data are shown by representative FACS contour plots (lower panel) and bar graphs (upperpanel) with means± s.d. (*Po0.05 by Student's t test). (g) GFP and hCD45 expression in BM were quantified by flow cytometry as a measure ofdisease burden in shctrl (n= 5) and shTRIB2-U937 (n = 8) mice and data are shown by representative FACS contour plots (lower panel) and bargraphs (upper panel) with means± s.d. (***Po0.001 by Student's t test).
Deciphering the C/EBPα and TRIB2 relationshipC O’Connor et al
8
Oncogene (2016), 1 – 10 © 2016 Macmillan Publishers Limited
support further investigations into the proteomic profiling of AML,with a focus on the involvement of C/EBPα ubiquitination and theneed for an in-depth understanding of the C/EBPα ubiquitinregulatory pathway in normal versus leukaemic (CEBPA WT andmutant) settings.Whilst TRIB2 itself is an oncogene capable of driving AML, the
molecular interaction identified here between TRIB2 and C/EBPαleading to dysregulated C/EBPα may have implications in othermodels of AML and indeed other cancers. It is clear that the loss ofC/EBPα function is a common occurrence in a number of differentcancer types. What is not clear at this point is the extent of theinvolvement of TRIB2 function across different haematologicalmalignancies and other cancers. To date, cooperation betweenTRIB proteins and other oncogenes in AML has been demon-strated, most often with Hoxa9 and Meis1, suggesting that TRIB2protein function downstream of commonly occurring oncogenicevents may impact on C/EBPα.34,35 TRIB2 is found elevated in lungcancer and associated with the E3 ligase TRIM21.30 In liver cancercells, TRIB2 associated with other E3 ligases including β-TrCP,COP1 and Smurf1.36 Thus, there is a strong link between TRIB2 andthe ubiquitin-proteasome system in cancer.As shown here, high TRIB2-expressing cells are sensitive
to bortezomib-induced cellular toxicity. However, inhibition ofthe proteasome also targets other proteins, E3 ligases and theirsubstrates. We currently have limited knowledge of TRIB2degradation substrates in general, and indeed knowledge ofTRIB2 as a substrate itself of the ubiquitin-proteasome system incancer. This study highlights the important molecular interplaybetween TRIB2 and C/EBPα in driving AML, and providesa framework for further investigations into targeting theubiquitin-proteasome system as an emerging cancer therapy.
MATERIALS AND METHODSMurine BM transduction and transplantationCebpafl/fl; Mx1cre were crossed to Cebpa+/p30 (25p30 referred to as ‘L’ allelepreviously) to yield Cebpafl/+; Mx1Cre, Cebpafl/p30; Mx1cre, Cebpafl/+ andCebpafl/p30. Genotyping and evaluation of Cebpa excision methodsprovided in Supplementary Information. Eight- to 14-week-old Cebpafl/fl,Cebpafl/fl; Mx1Cre, Cebpafl/+, Cebpafl/p30 and Cebpafl/p30; Mx1Cre mice werepIpC-treated (three injections every second day with 300 ug pIpC) to excisethe Cebpa allele. Resultant genotypes are Cebpafl/fl (expressing solely p42alleles which can give rise to p30), CebpaΔ/Δ (null for p42 and p30), Cebpafl/+
(expressing solely p42 alleles which can give rise to p30), Cebpafl/p30
(expressing one p42 and one solely p30 allele) and Cebpafl/p30; Mx1Cre(referred to as CebpaΔ/p30, solely expressing one p30 allele) (Figure 1b). Twoweeks post deletion, CD45.2+ BM cells were collected and either c-Kit-purifiedby magnetic-activated cell sorting (Figure 1a), or total BM (Figures 1c and d)was transduced with 40% titre-matched retrovirus in the presence of IL3, IL6and SCF. Freshly transduced unsorted cells (1×10⁶ Figure 1a, 3×10⁶
Figure 1c) were injected by tail vein into lethally irradiated CD45.1+ recipientsgenerating Cebpafl/fl-TRIB2 (n=12), CebpaΔ/Δ-TRIB2 (n=10), Cebpafl/+-MigR1(n=9), Cebpafl/+-TRIB2 (n=4), Cebpafl/p30-MigR1 (n=6), Cebpafl/p30-TRIB2(n=8), CebpaΔ/p30-MigR1 (n=6), CebpaΔ/p30-TRIB2 (n=8). Mice were mon-itored for 14 months and killed when they developed physical signs of disease(behavioural changes, laboured breathing, hunched posture) or high whiteblood cell counts. For NOD-SCID IL2Rγnull (NSG) mice Xenograft transplanta-tion, 1×10⁶ U937 cells transduced with shTRIB2-GFP (n=5) or shCtrl-GFP(N=8) were transplanted into non-irradiated NSG mice via tail vein injection.To assess bortezomib in vivo efficacy, GFP ctrl transduced U937 cells wereinjected, and 5 days post injection, mice were randomized and treated witheither bortezomib (0.5 mg/kg, n=3) or phosphate-buffered saline (intraper-itoneal administration, n=3) at days 5, 7 and 11 post transplant, which waswell tolerated. Mice were killed on day 16. Animals were maintained at theUniversity of Copenhagen and the University of Glasgow, housed inaccordance with their respective institutional guidelines. All work was carriedout under the approval of the Danish Ethical Committee and the Home Officeof the United Kingdom.
Flow cytometryCell suspensions were stained on ice in fluorescence-activated cell sortingbuffer (phosphate-buffered saline pH 7.0, 10 mM Hepes, 0.02% sodiumazide, 0.2% bovine serum albumin). Analytical flow cytometry wasperformed on a FACS Canto (Becton Dickinson), sorting was performedon a FACS Aria II (Becton Dickinson, Oxford, UK) and data were analysedusing FlowJo software (Treestar, Version 10, Ashland, OR, USA). Dead cellswere excluded using 40 ,6-diamidino-2-phenylindole and doublets excludedbased on FSC-H and FSC-A. For apoptosis assays, Annexin V-PE (BDBiosciences 556422) or Annexin V-APC (BD Biosciences 550475, Oxford, UK)was used.Details of vectors, antibodies, cell culture/transfections and real-time
PCR provided in Supplementary Information.
Ubiquitination assay, co-immunoprecipitation and westernblotting293 T cells transfected with described vectors were treated with 10 μMMG-132 5 h prior to lysis where indicated. For ubiquitination assay, cellswere lysed in 1% SDS, sonicated and supernatants precleared withProtein G Sepharose 4 fast flow beads (GE Healthcare, Amersham, UK),then incubated with C/EBPα antibody overnight. For co-immunopreci-pitation, cells were lysed in Tris buffer (50 mM Tris pH 7.4, 150 mM NaCl,1 mM EDTA, 0.5% NP-40, 5% glycerol, with protease and phosphataseinhibitors) and precleared lysates were incubated with C/EBPα antibodyovernight. Whole cell proteins were isolated by RIPA lysis buffer (50 mMTris, pH 8.0, containing 0.5% NP-40, 0.25% sodium deoxycholate,150 mM NaCl, 1 mM EDTA, 20 mM N-Ethylmaleimide with proteaseand phosphatase inhibitors) or by direct lysis (2 × SDS sample buffer).Details of antibodies provided in Supplementary Information. For GST-IP,3 mg of indicated cell lysate was added to 50 μl of GSH slurry with pull-down performed using 25 ug of GST or GST-TRIB2 (details of GST proteinproduction are provided in Supplementary Information). Densitometricanalysis of bands was carried out with ImageJ Software. n⩾ 3 for allco-immunoprecipitation and ubiquitination assays.
Spot synthesis of peptides and overlay analysisPeptide arrays were performed as previously described37,38 (n= 2) anddetails are provided in Supplementary Information. Briefly, peptide arraysencompassing the C terminus of C/EBPα and the entire TRIB2 protein weregenerated and incubated with GST-TRIB2 or purified C-teminal C/EBPα(Genway, San Diego, CA, USA). Arrays were incubated with secondaryantibodies and bound protein detected using ECL or the Odyssey InfraredImaging System (LI-COR Biosciences, Cambridge, UK).
Statistical analysisStatisitcal analysis and graphing was performed on GraphPad Prism(version 5.03). When comparing two groups, an unpaired, two-tailedStudent’s t test was used. The Log-rank test was used to compare groupson a survival curves. Statistical significance was attained when the P value⩽ 0.05 and was indicated in the related figure legends and graphs.
CONFLICT OF INTERESTThe authors declare no conflict of interest.
ACKNOWLEDGEMENTSWe thank all the technical staff at the Paul O’Gorman Leukaemia Research Centre.We thank the Cancer Research UK Glasgow Centre (C596/A18076) and the BiologicalService Unit facilities at the Cancer Research UK Beatson Institute (C596/A17196) andthe Biological Services at the University of Glasgow. We thank Ruaidhrí Carmody forreagents and critical review of the work. We thank the Kay Kendall foundation(KKL501) and the Howat foundation for Flow cytometry facility funding. Work in theKeeshan lab was supported by the Howat Foundation and Children with Cancer UK.CO’C was supported by Childrens Leukaemia Research Project grant. PK wassupported by Science Foundation Ireland Infrastructure award and the Mid-WesternCancer Foundation. Work in the Porse lab was supported by a centre grant from theNovoNordisk Foundation (The Novo Nordisk Foundation Section for Stem CellBiology in Human Disease).
Deciphering the C/EBPα and TRIB2 relationshipC O’Connor et al
9
© 2016 Macmillan Publishers Limited Oncogene (2016) 1 – 10
AUTHOR CONTRIBUTIONSKK designed the study. FL, CO’C, CF, EO, MS and JC performed the research.BP provided transgenic mouse models. BP, PK, RL, RA and MC providedessential reagents and expertise. KK, FL, CO’C, MS, EO and JC analysed the data.CO’C and FL made the figures. KK wrote the paper. All authors edited the paper.
REFERENCES1 Fasan A, Alpermann T, Haferlach C, Grossmann V, Roller A, Kohlmann A et al.
Frequency and prognostic impact of CEBPA proximal, distal and core promotermethylation in normal karyotype AML: a study on 623 cases. PLoS One 2013;8: e54365.
2 Annamaneni S, Kagita S, Gorre M, Digumarti RR, Satti V, Battini MR. Methylationstatus of CEBPAgene promoter in chronic myeloid leukemia. Hematology 2014;19: 42–44.
3 Bennett KL, Hackanson B, Smith LT, Morrison CD, Lang JC, Schuller DE et al. Tumorsuppressor activity of CCAAT/enhancer binding protein is epigeneticallydown-regulated in head and neck squamous cell carcinoma. Cancer Res 2007; 67:4657–4664.
4 Paz-Priel I, Friedman A. C/EBPalpha dysregulation in AML and ALL. Crit Rev Oncog2011; 16: 93–102.
5 Friedman AD. C/EBPα in normal and malignant myelopoiesis. Int J Hematol 2015;101: 330–341.
6 Taskesen E, Bullinger L, Corbacioglu A, Sanders MA, Erpelinck CAJ, Wouters BJet al. Prognostic impact, concurrent genetic mutations, and gene expressionfeatures of AML with CEBPA mutations in a cohort of 1182 cytogenetically normalAML patients: further evidence for CEBPA double mutant AML as a distinctivedisease entity. Blood 2011; 117: 2469–2475.
7 Pabst T, Eyholzer M, Haefliger S, Schardt J, Mueller BU. Somatic CEBPA mutationsare a frequent second event in families with germline CEBPA mutations andfamilial acute myeloid leukemia. J Clin Oncol 2008; 26: 5088–5093.
8 Fasan A, Haferlach C, Alpermann T, Jeromin S, Grossmann V, Eder C et al. The roleof different genetic subtypes of CEBPA mutated AML. Leukemia 2014; 28:794–803.
9 Hattori T, Ohoka N, Inoue Y, Hayashi H, Onozaki K. C/EBP family transcriptionfactors are degraded by the proteasome but stabilized by forming dimer.Oncogene 2003; 22: 1273–1280.
10 Keeshan K, He Y, Wouters BJ, Shestova O, Xu L, Sai H et al. Tribbles homolog2 inactivates C/EBPalpha and causes acute myelogenous leukemia. Cancer Cell2006; 10: 401–411.
11 Keeshan K, Shestova O, Ussin L, Pear WS. Tribbles homolog 2 (Trib2) and HoxA9cooperate to accelerate acute myelogenous leukemia. Blood Cells Mol Dis 2008;40: 119–121.
12 Rishi L, Hannon M, Salomè M, Hasemann M, Frank A-K, Campos J et al. Regulationof Trib2 by an E2F1-C/EBPalpha feedback loop in AML cell proliferation. Blood2014; 123: 2389–2400.
13 Keeshan K, Bailis W, Dedhia PH, Vega ME, Shestova O, Xu L et al. Transformationby Tribbles homolog 2 (Trib2) requires both the Trib2 kinase domain and COP1binding. Blood 2010; 116: 4948–4957.
14 Mancini E, Sanjuan-Pla A, Luciani L, Moore S, Grover A, Zay A et al. FOG-1and GATA-1 act sequentially to specify definitive megakaryocytic and erythroidprogenitors. EMBO J 2011; 8;:1–15.
15 Ye M, Zhang H, Amabile G, Yang H, Staber PB, Zhang P et al. C/EBPa controlsacquisition and maintenance of adult haematopoietic stem cell quiescence.Nat Cell Biol 2013; 15: 385–394.
16 Hasemann MS, Lauridsen FKB, Waage J, Jakobsen JS, Frank A-K, Schuster MB et al.C/EBPα is required for long-term self-renewal and lineage priming of hemato-poietic stem cells and for the maintenance of epigenetic configurations inmultipotent progenitors. PLoS Genet 2014; 10: e1004079–e1004079.
17 Zhang P, Iwasaki-Arai J, Iwasaki H, Fenyus ML, Dayaram T, Owens BM et al.Enhancement of hematopoietic stem cell repopulating capacity and self-renewalin the absence of the transcription factor C/EBP alpha. Immunity 2004; 21:853–863.
18 Ohlsson E, Hasemann MS, Willer A, Lauridsen FK, Rapin N, Jendholm J et al.Initiation of MLL-rearranged AML is dependent on C/EBPα. J Exp Med 2013; 211:5–13.
19 Collins C, Wang J, Miao H, Bronstein J, Nawer H, Xu T et al. C/EBP is an essentialcollaborator in Hoxa9/Meis1-mediated leukemogenesis. Proc Natl Acad Sci USA2014; 111: 9899–9904.
20 Wagner K, Zhang P, Rosenbauer F, Drescher B, Kobayashi S, Radomska HS et al.Absence of the transcription factor CCAAT enhancer binding protein alpha resultsin loss of myeloid identity in bcr/abl-induced malignancy. Proc Natl Acad Sci USA2006; 103: 6338–6343.
21 Pabst T, Mueller BU, Zhang P, Radomska HS, Narravula S, Schnittger S et al.Dominant-negative mutations of CEBPA, encoding CCAAT/enhancer bindingprotein-alpha (C/EBPalpha), in acute myeloid leukemia. Nat Genet 2001; 27:263–270.
22 Leroy H, Roumier C, Huyghe P, Biggio V, Fenaux P, Preudhomme C. CEBPA pointmutations in hematological malignancies. Leukemia 2005; 19: 329–334.
23 Bereshchenko O, Mancini E, Moore S, Bilbao D, Månsson R, Luc S et al. Hemato-poietic stem cell expansion precedes the generation of committed myeloidleukemia-initiating cells in C/EBPα mutant AML. Cancer Cell 2009; 16: 390–400.
24 Quintana-Bustamante O, Lan-Lan Smith S, Griessinger E, Reyal Y, Vargaftig J, ListerTA et al. Overexpression of wild-type or mutants forms of CEBPA alter normalhuman hematopoiesis. Leukemia 2012; 26: 1537–1546.
25 Kirstetter PP, Schuster MB, Bereshchenko OO, Moore SS, Dvinge HH, Kurz EE et al.Modeling of C/EBPalpha mutant acute myeloid leukemia reveals a commonexpression signature of committed myeloid leukemia-initiating cells. Cancer Cell2008; 13: 299–310.
26 Yokoyama T, Toki T, Aoki Y, Kanezaki R, Park M-J, Kanno Y et al. Identification ofTRIB1 R107L gain-of-function mutation in human acute megakaryocytic leukemia.Blood 2012; 119: 2608–2611.
27 Carnicer MJ, Lasa A, Buschbeck M, Serrano E, Carricondo M, Brunet S et al.K313dup is a recurrent CEBPA mutation in de novo acute myeloidleukemia (AML). Ann Hematol 2008; 87: 819–827.
28 Brouwer AJ, Jonker A, Werkhoven P, Kuo E, Li N, Gallastegui N et al. Peptidosulfonyl fluorides as new powerful proteasome inhibitors. J Med Chem 2012; 55:10995–11003.
29 Claudia Andreu-Vieyra JRB, Berenson JR. Carfilzomib in multiple myeloma. ExpertOpin Biol Ther 2014; 14: 1685–1699.
30 Grandinetti KB, Stevens TA, Ha S, Salamone RJ, Walker JR, Zhang J et al.Overexpression of TRIB2 in human lung cancers contributes to tumorigenesisthrough downregulation of C/EBPalpha. Oncogene 2011; 14: 1–8.
31 Wouters BJ, Jorda MA, Keeshan K, Louwers I, Erpelinck-Verschueren CA, Tielemans Det al. Distinct gene expression profiles of acute myeloid/T-lymphoid leukemiawith silenced CEBPA and mutations in NOTCH1. Blood 2007; 110: 3706–3714.
32 Geletu M, Balkhi MY, Peer Zada AA, Christopeit M, Pulikkan JA, Trivedi AK et al.Target proteins of C/EBP p30 in AML: C/EBP p30 enhances sumoylation ofC/EBP p42 via up-regulation of Ubc9. Blood 2007; 110: 3301–3309.
33 Pulikkan JA, Dengler V, Zada AAP, Kawasaki A, Geletu M, Pasalic Z et al. ElevatedPIN1 expression by C/EBPalpha-p30 blocks C/EBPalpha-induced granulocyticdifferentiation through c-Jun in AML. Leukemia 2010; 24: 914–923.
34 Trivedi AK, Bararia D, Christopeit M, PeerZada AA, Singh SM, Kieser A et al.Proteomic identification of C/EBP-DBD multiprotein complex: JNK1 activates stemcell regulator C/EBPα by inhibiting its ubiquitination. Oncogene 2006; 26:1789–1801.
35 Jin G, Yamazaki Y, Takuwa M, Takahara T, Kaneko K, Kuwata T et al. Trib1 and Evi1cooperate with Hoxa and Meis1 in myeloid leukemogenesis. Blood 2007; 109:3998–4005.
36 Xu S, Tong M, Huang J, Zhang Y, Qiao Y, Weng W et al. TRIB2 inhibits Wnt/beta-Catenin/TCF4 signaling through its associated ubiquitin E3 ligases, beta-TrCP,COP1 and Smurf1, in liver cancer cells. FEBS Lett 2014; 588: 4334–4341.
37 Frank R. The SPOT-synthesis technique. Synthetic peptide arrays on membranesupports--principles and applications. J Immunol Methods 2002; 267: 13–26.
38 Colleran A, Collins PE, O'Carroll C, Ahmed A, Mao X, McManus B et al.Deubiquitination of NF-kappaB by ubiquitin-specific protease-7 promotes tran-scription. Proc Natl Acad Sci USA 2013; 110: 618–623.
Supplementary Information accompanies this paper on the Oncogene website (http://www.nature.com/onc)
Deciphering the C/EBPα and TRIB2 relationshipC O’Connor et al
10
Oncogene (2016), 1 – 10 © 2016 Macmillan Publishers Limited
175
List of references
ABBAS, S., LUGTHART, S., KAVELAARS, F. G., SCHELEN, A., KOENDERS, J. E.,
ZEILEMAKER, A., VAN PUTTEN, W. J., RIJNEVELD, A. W., LOWENBERG,
B. & VALK, P. J. 2010. Acquired mutations in the genes encoding IDH1 and IDH2
both are recurrent aberrations in acute myeloid leukemia: prevalence and
prognostic value. Blood, 116, 2122-6.
ADAMS, J. 2004. The proteasome: a suitable antineoplastic target. Nat Rev Cancer, 4,
349-360.
ADAMS, J., PALOMBELLA, V. J., SAUSVILLE, E. A., JOHNSON, J., DESTREE, A.,
LAZARUS, D. D., MAAS, J., PIEN, C. S., PRAKASH, S. & ELLIOTT, P. J. 1999.
Proteasome inhibitors: a novel class of potent and effective antitumor agents.
Cancer Res, 59, 2615-22.
ADOLFSSON, J., MANSSON, R., BUZA-VIDAS, N., HULTQUIST, A., LIUBA, K.,
JENSEN, C. T., BRYDER, D., YANG, L., BORGE, O. J., THOREN, L. A.,
ANDERSON, K., SITNICKA, E., SASAKI, Y., SIGVARDSSON, M. &
JACOBSEN, S. E. 2005. Identification of Flt3+ lympho-myeloid stem cells lacking
erythro-megakaryocytic potential a revised road map for adult blood lineage
commitment. Cell, 121, 295-306.
AGGARWAL, P., VAITES, L. P., KIM, J. K., MELLERT, H., GURUNG, B.,
NAKAGAWA, H., HERLYN, M., HUA, X., RUSTGI, A. K., MCMAHON, S. B.
& DIEHL, J. A. 2010. Nuclear cyclin D1/CDK4 kinase regulates CUL4 expression
and triggers neoplastic growth via activation of the PRMT5 methyltransferase.
Cancer Cell, 18, 329-40.
AILLES, L. E., GERHARD, B., KAWAGOE, H. & HOGGE, D. E. 1999. Growth
characteristics of acute myelogenous leukemia progenitors that initiate malignant
hematopoiesis in nonobese diabetic/severe combined immunodeficient mice.
Blood, 94, 1761-72.
AKASHI, K., TRAVER, D., MIYAMOTO, T. & WEISSMAN, I. L. 2000. A clonogenic
common myeloid progenitor that gives rise to all myeloid lineages. Nature, 404,
193-197.
AKIYAMA, K., KAGAWA, S., TAMURA, T., SHIMBARA, N., TAKASHINA, M.,
KRISTENSEN, P., HENDIL, K. B., TANAKA, K. & ICHIHARA, A. 1994.
Replacement of proteasome subunits X and Y by LMP7 and LMP2 induced by
interferon-gamma for acquirement of the functional diversity responsible for
antigen processing. FEBS Lett, 343, 85-8.
ALMOND, J. B. & COHEN, G. M. 2002. The proteasome: a novel target for cancer
chemotherapy. Leukemia, 16, 433-43.
AMERICAN CANCER SOCIETY, A. C. S. 2015. Cancer Facts & Figures 2015. Atlanta:
American Cancer Society.
ANCELIN, K., LANGE, U. C., HAJKOVA, P., SCHNEIDER, R., BANNISTER, A. J.,
KOUZARIDES, T. & SURANI, M. A. 2006. Blimp1 associates with Prmt5 and
directs histone arginine methylation in mouse germ cells. Nat Cell Biol, 8, 623-30.
ANTONYSAMY, S., BONDAY, Z., CAMPBELL, R. M., DOYLE, B., DRUZINA, Z.,
GHEYI, T., HAN, B., JUNGHEIM, L. N., QIAN, Y., RAUCH, C., RUSSELL, M.,
SAUDER, J. M., WASSERMAN, S. R., WEICHERT, K., WILLARD, F. S.,
ZHANG, A. & EMTAGE, S. 2012. Crystal structure of the human PRMT5:MEP50
complex. Proceedings of the National Academy of Sciences of the United States of
America, 109, 17960-17965.
ARBER, D. A., ORAZI, A., HASSERJIAN, R., THIELE, J., BOROWITZ, M. J., LE
BEAU, M. M., BLOOMFIELD, C. D., CAZZOLA, M. & VARDIMAN, J. W.
176
2016. The 2016 revision to the World Health Organization classification of myeloid
neoplasms and acute leukemia. Blood, 127, 2391-405.
ARGIROPOULOS, B., PALMQVIST, L., YUNG, E., KUCHENBAUER, F., HEUSER,
M., SLY, L. M., WAN, A., KRYSTAL, G. & HUMPHRIES, R. K. 2008. Linkage
of Meis1 leukemogenic activity to multiple downstream effectors including Trib2
and Ccl3. Exp Hematol, 36, 845-59.
ARLT, A., BAUER, I., SCHAFMAYER, C., TEPEL, J., MUERKOSTER, S. S.,
BROSCH, M., RODER, C., KALTHOFF, H., HAMPE, J., MOYER, M. P.,
FOLSCH, U. R. & SCHAFER, H. 2009. Increased proteasome subunit protein
expression and proteasome activity in colon cancer relate to an enhanced activation
of nuclear factor E2-related factor 2 (Nrf2). Oncogene, 28, 3983-96.
ATTAR, E. C., JOHNSON, J. L., AMREIN, P. C., LOZANSKI, G., WADLEIGH, M.,
DEANGELO, D. J., KOLITZ, J. E., POWELL, B. L., VOORHEES, P., WANG, E.
S., BLUM, W., STONE, R. M., MARCUCCI, G., BLOOMFIELD, C. D., MOSER,
B. & LARSON, R. A. 2013. Bortezomib added to daunorubicin and cytarabine
during induction therapy and to intermediate-dose cytarabine for consolidation in
patients with previously untreated acute myeloid leukemia age 60 to 75 years:
CALGB (Alliance) study 10502. J Clin Oncol, 31, 923-9.
AVIEL, S., WINBERG, G., MASSUCCI, M. & CIECHANOVER, A. 2000. Degradation
of the epstein-barr virus latent membrane protein 1 (LMP1) by the ubiquitin-
proteasome pathway. Targeting via ubiquitination of the N-terminal residue. J Biol
Chem, 275, 23491-9.
BAILEY, F. P., BYRNE, D. P., ORUGANTY, K., EYERS, C. E., NOVOTNY, C. J.,
SHOKAT, K. M., KANNAN, N. & EYERS, P. A. 2015. The Tribbles 2 (TRB2)
pseudokinase binds to ATP and autophosphorylates in a metal-independent manner.
Biochem J, 467, 47-62.
BALDUS, C. D., MROZEK, K., MARCUCCI, G. & BLOOMFIELD, C. D. 2007. Clinical
outcome of de novo acute myeloid leukaemia patients with normal cytogenetics is
affected by molecular genetic alterations: a concise review. Br J Haematol, 137,
387-400.
BALDUS, C. D., TANNER, S. M., RUPPERT, A. S., WHITMAN, S. P., ARCHER, K. J.,
MARCUCCI, G., CALIGIURI, M. A., CARROLL, A. J., VARDIMAN, J. W.,
POWELL, B. L., ALLEN, S. L., MOORE, J. O., LARSON, R. A., KOLITZ, J. E.,
DE LA CHAPELLE, A. & BLOOMFIELD, C. D. 2003. BAALC expression
predicts clinical outcome of de novo acute myeloid leukemia patients with normal
cytogenetics: a Cancer and Leukemia Group B Study. Blood, 102, 1613-8.
BANDYOPADHYAY, S., HARRIS, D. P., ADAMS, G. N., LAUSE, G. E., MCHUGH,
A., TILLMAAND, E. G., MONEY, A., WILLARD, B., FOX, P. L. &
DICORLETO, P. E. 2012. HOXA9 methylation by PRMT5 is essential for
endothelial cell expression of leukocyte adhesion molecules. Mol Cell Biol, 32,
1202-13.
BANERJI, V., FRUMM, S. M., ROSS, K. N., LI, L. S., SCHINZEL, A. C., HAHN, C. K.,
KAKOZA, R. M., CHOW, K. T., ROSS, L., ALEXE, G., TOLLIDAY, N.,
INGUILIZIAN, H., GALINSKY, I., STONE, R. M., DEANGELO, D. J., ROTI,
G., ASTER, J. C., HAHN, W. C., KUNG, A. L. & STEGMAIER, K. 2012. The
intersection of genetic and chemical genomic screens identifies GSK-3α as a target
in human acute myeloid leukemia. The Journal of Clinical Investigation, 122, 935-
947.
BARTH, B., KEASEY, N., WANG, X., SHANMUGAVELANDY, S., RAMPAL, R.,
HRICIK, T., CABOT, M., KESTER, M., WANG, H., L, S., M, T., LEVINE, R.,
LOUGHRAN JR., T. & CLAXTON, D. 2014. Engraftment of Human Primary
Acute Myeloid Leukemia Defined by Integrated Genetic Profiling in
177
NOD/SCID/IL2rγnull Mice for Preclinical Ceramide-Based Therapeutic
Evaluation. Journal of Leukemia, 2, 1-4.
BAUM, C. M., WEISSMAN, I. L., TSUKAMOTO, A. S., BUCKLE, A. M. & PEAULT,
B. 1992. Isolation of a candidate human hematopoietic stem-cell population.
Proceedings of the National Academy of Sciences of the United States of America,
89, 2804-2808.
BAZZARO, M., LEE, M. K., ZOSO, A., STIRLING, W. L., SANTILLAN, A., SHIH IE,
M. & RODEN, R. B. 2006. Ubiquitin-proteasome system stress sensitizes ovarian
cancer to proteasome inhibitor-induced apoptosis. Cancer Res, 66, 3754-63.
BEILLARD, E., PALLISGAARD, N., VAN DER VELDEN, V. H., BI, W., DEE, R.,
VAN DER SCHOOT, E., DELABESSE, E., MACINTYRE, E., GOTTARDI, E.,
SAGLIO, G., WATZINGER, F., LION, T., VAN DONGEN, J. J., HOKLAND, P.
& GABERT, J. 2003. Evaluation of candidate control genes for diagnosis and
residual disease detection in leukemic patients using 'real-time' quantitative reverse-
transcriptase polymerase chain reaction (RQ-PCR) - a Europe against cancer
program. Leukemia, 17, 2474-86.
BENAROUDJ, N., TARCSA, E., CASCIO, P. & GOLDBERG, A. L. 2001. The unfolding
of substrates and ubiquitin-independent protein degradation by proteasomes.
Biochimie, 83, 311-8.
BENNETT, J. M., CATOVSKY, D., DANIEL, M. T., FLANDRIN, G., GALTON, D. A.,
GRALNICK, H. R. & SULTAN, C. 1976. Proposals for the classification of the
acute leukaemias. French-American-British (FAB) co-operative group. Br J
Haematol, 33, 451-8.
BENNETT, J. M., CATOVSKY, D., DANIEL, M. T., FLANDRIN, G., GALTON, D. A.,
GRALNICK, H. R. & SULTAN, C. 1985. Proposed revised criteria for the
classification of acute myeloid leukemia. A report of the French-American-British
Cooperative Group. Ann Intern Med, 103, 620-5.
BENNETT, M. K. & KIRK, C. J. 2008. Development of proteasome inhibitors in oncology
and autoimmune diseases. Curr Opin Drug Discov Devel, 11, 616-25.
BEUTLER, E. 2001. The treatment of acute leukemia: past, present, and future. Leukemia,
15, 658-661.
BLUM, W., MROZEK, K., RUPPERT, A. S., CARROLL, A. J., RAO, K. W.,
PETTENATI, M. J., ANASTASI, J., LARSON, R. A. & BLOOMFIELD, C. D.
2004. Adult de novo acute myeloid leukemia with t(6;11)(q27;q23): results from
Cancer and Leukemia Group B Study 8461 and review of the literature. Cancer,
101, 1420-7.
BLUM, W., SCHWIND, S., TARIGHAT, S. S., GEYER, S., EISFELD, A. K.,
WHITMAN, S., WALKER, A., KLISOVIC, R., BYRD, J. C., SANTHANAM, R.,
WANG, H., CURFMAN, J. P., DEVINE, S. M., JACOB, S., GARR, C.,
KEFAUVER, C., PERROTTI, D., CHAN, K. K., BLOOMFIELD, C. D.,
CALIGIURI, M. A., GREVER, M. R., GARZON, R. & MARCUCCI, G. 2012.
Clinical and pharmacodynamic activity of bortezomib and decitabine in acute
myeloid leukemia. Blood, 119, 6025-31.
BRADFORD, G. B., WILLIAMS, B., ROSSI, R. & BERTONCELLO, I. 1997.
Quiescence, cycling, and turnover in the primitive hematopoietic stem cell
compartment. Exp Hematol, 25, 445-53.
BRANSCOMBE, T. L., FRANKEL, A., LEE, J. H., COOK, J. R., YANG, Z., PESTKA,
S. & CLARKE, S. 2001. PRMT5 (Janus kinase-binding protein 1) catalyzes the
formation of symmetric dimethylarginine residues in proteins. J Biol Chem, 276,
32971-6.
BRECCIA, M. & LO-COCO, F. 2011. Gemtuzumab ozogamicin for the treatment of acute
promyelocytic leukemia: mechanisms of action and resistance, safety and efficacy.
Expert Opin Biol Ther, 11, 225-34.
178 BREITSCHOPF, K., BENGAL, E., ZIV, T., ADMON, A. & CIECHANOVER, A. 1998.
A novel site for ubiquitination: the N-terminal residue, and not internal lysines of
MyoD, is essential for conjugation and degradation of the protein. Embo j, 17,
5964-73.
BROCA, C., VARIN, E., ARMANET, M., TOURREL-CUZIN, C., BOSCO, D., DALLE,
S. & WOJTUSCISZYN, A. 2014. Proteasome dysfunction mediates high glucose-
induced apoptosis in rodent beta cells and human islets. PLoS One, 9, e92066.
BROUWER, A. J., JONKER, A., WERKHOVEN, P., KUO, E., LI, N., GALLASTEGUI,
N., KEMMINK, J., FLOREA, B. I., GROLL, M., OVERKLEEFT, H. S. &
LISKAMP, R. M. J. 2012. Peptido Sulfonyl Fluorides as New Powerful
Proteasome Inhibitors. Journal of Medicinal Chemistry, 55, 10995-11003.
BURNETT, A. K. 2013. The Challenge of AML in Older Patients. Mediterr J Hematol
Infect Dis, 5, e2013038.
BUZZEO, R., ENKEMANN, S., NIMMANAPALLI, R., ALSINA, M., LICHTENHELD,
M. G., DALTON, W. S. & BEAUPRE, D. M. 2005. Characterization of a
R115777-resistant human multiple myeloma cell line with cross-resistance to PS-
341. Clin Cancer Res, 11, 6057-64.
CALKHOVEN, C. F., MÜLLER, C. & LEUTZ, A. 2000. Translational control of C/EBPα
and C/EBPβ isoform expression. Genes & Development, 14, 1920-1932.
CAO, Z., UMEK, R. M. & MCKNIGHT, S. L. 1991. Regulated expression of three C/EBP
isoforms during adipose conversion of 3T3-L1 cells. Genes Dev, 5, 1538-52.
CHARI, A., GOLAS, M. M., KLINGENHÄGER, M., NEUENKIRCHEN, N., SANDER,
B., ENGLBRECHT, C., SICKMANN, A., STARK, H. & FISCHER, U. 2008. An
Assembly Chaperone Collaborates with the SMN Complex to Generate
Spliceosomal SnRNPs. Cell, 135, 497-509.
CHATURVEDI, A., ARAUJO CRUZ, M. M., JYOTSANA, N., SHARMA, A., YUN, H.,
GORLICH, K., WICHMANN, M., SCHWARZER, A., PRELLER, M., THOL, F.,
MEYER, J., HAEMMERLE, R., STRUYS, E. A., JANSEN, E. E., MODLICH, U.,
LI, Z., SLY, L. M., GEFFERS, R., LINDNER, R., MANSTEIN, D. J.,
LEHMANN, U., KRAUTER, J., GANSER, A. & HEUSER, M. 2013. Mutant
IDH1 promotes leukemogenesis in vivo and can be specifically targeted in human
AML. Blood, 122, 2877-87.
CHEN, D., FREZZA, M., SCHMITT, S., KANWAR, J. & DOU, Q. P. 2011. Bortezomib
as the First Proteasome Inhibitor Anticancer Drug: Current Status and Future
Perspectives. Current Cancer Drug Targets, 11, 239-253.
CHESHIER, S. H., MORRISON, S. J., LIAO, X. & WEISSMAN, I. L. 1999. In vivo
proliferation and cell cycle kinetics of long-term self-renewing hematopoietic stem
cells. Proc Natl Acad Sci U S A, 96, 3120-5.
CHO, E. C., ZHENG, S., MUNRO, S., LIU, G., CARR, S. M., MOEHLENBRINK, J.,
LU, Y. C., STIMSON, L., KHAN, O., KONIETZNY, R., MCGOURAN, J.,
COUTTS, A. S., KESSLER, B., KERR, D. J. & THANGUE, N. B. 2012. Arginine
methylation controls growth regulation by E2F-1. Embo j, 31, 1785-97.
CHOU, W. C., LEI, W. C., KO, B. S., HOU, H. A., CHEN, C. Y., TANG, J. L., YAO, M.,
TSAY, W., WU, S. J., HUANG, S. Y., HSU, S. C., CHEN, Y. C., CHANG, Y. C.,
KUO, K. T., LEE, F. Y., LIU, M. C., LIU, C. W., TSENG, M. H., HUANG, C. F.
& TIEN, H. F. 2011. The prognostic impact and stability of Isocitrate
dehydrogenase 2 mutation in adult patients with acute myeloid leukemia.
Leukemia, 25, 246-53.
CHUANG, T.-W., PENG, P.-J. & TARN, W.-Y. 2011. The Exon Junction Complex
Component Y14 Modulates the Activity of the Methylosome in Biogenesis of
Spliceosomal Small Nuclear Ribonucleoproteins. Journal of Biological Chemistry,
286, 8722-8728.
179 CHUNG, J., KARKHANIS, V., TAE, S., YAN, F., SMITH, P., AYERS, L. W.,
AGOSTINELLI, C., PILERI, S., DENIS, G. V., BAIOCCHI, R. A. & SIF, S. 2013.
Protein arginine methyltransferase 5 (PRMT5) inhibition induces lymphoma cell
death through reactivation of the retinoblastoma tumor suppressor pathway and
polycomb repressor complex 2 (PRC2) silencing. J Biol Chem, 288, 35534-47.
CIECHANOVER, A. 1994. The ubiquitin-proteasome proteolytic pathway. Cell, 79, 13-
21.
CIECHANOVER, A. 1998. The ubiquitin-proteasome pathway: on protein death and cell
life. Embo j, 17, 7151-60.
COLADO, E., ALVAREZ-FERNANDEZ, S., MAISO, P., MARTIN-SANCHEZ, J.,
VIDRIALES, M. B., GARAYOA, M., OCIO, E. M., MONTERO, J. C.,
PANDIELLA, A. & SAN MIGUEL, J. F. 2008. The effect of the proteasome
inhibitor bortezomib on acute myeloid leukemia cells and drug resistance
associated with the CD34+ immature phenotype. Haematologica, 93, 57-66.
COOK, G. J. & PARDEE, T. S. 2013. Animal Models of Leukemia: Any closer to the real
thing? Cancer metastasis reviews, 32, 63-76.
CORTES, J., THOMAS, D., KOLLER, C., GILES, F., ESTEY, E., FADERL, S.,
GARCIA-MANERO, G., MCCONKEY, D., RUIZ, S. L., GUERCIOLINI, R.,
WRIGHT, J. & KANTARJIAN, H. 2004. Phase I study of bortezomib in refractory
or relapsed acute leukemias. Clin Cancer Res, 10, 3371-6.
COZZIO, A., PASSEGUE, E., AYTON, P. M., KARSUNKY, H., CLEARY, M. L. &
WEISSMAN, I. L. 2003. Similar MLL-associated leukemias arising from self-
renewing stem cells and short-lived myeloid progenitors. Genes Dev, 17, 3029-35.
CRAWFORD, L. J. & IRVINE, A. E. 2013. Targeting the ubiquitin proteasome system in
haematological malignancies. Blood Rev, 27, 297-304.
DACWAG, C. S., OHKAWA, Y., PAL, S., SIF, S. & IMBALZANO, A. N. 2007. The
Protein Arginine Methyltransferase Prmt5 Is Required for Myogenesis because It
Facilitates ATP-Dependent Chromatin Remodeling. Molecular and Cellular
Biology, 27, 384-394.
DANG, L., WHITE, D. W., GROSS, S., BENNETT, B. D., BITTINGER, M. A.,
DRIGGERS, E. M., FANTIN, V. R., JANG, H. G., JIN, S., KEENAN, M. C.,
MARKS, K. M., PRINS, R. M., WARD, P. S., YEN, K. E., LIAU, L. M.,
RABINOWITZ, J. D., CANTLEY, L. C., THOMPSON, C. B., VANDER
HEIDEN, M. G. & SU, S. M. 2009. Cancer-associated IDH1 mutations produce 2-
hydroxyglutarate. Nature, 462, 739-744.
DANOVA, M., GIORDANO, M., MAZZINI, G. & RICCARDI, A. 1990. Expression of
p53 protein during the cell cycle measured by flow cytometry in human leukemia.
Leuk Res, 14, 417-22.
DE GUZMAN, C. G., WARREN, A. J., ZHANG, Z., GARTLAND, L., ERICKSON, P.,
DRABKIN, H., HIEBERT, S. W. & KLUG, C. A. 2002. Hematopoietic stem cell
expansion and distinct myeloid developmental abnormalities in a murine model of
the AML1-ETO translocation. Mol Cell Biol, 22, 5506-17.
DEDHIA, P. H., KEESHAN, K., ULJON, S., XU, L., VEGA, M. E., SHESTOVA, O.,
ZAKS-ZILBERMAN, M., ROMANY, C., BLACKLOW, S. C. & PEAR, W. S.
2010. Differential ability of Tribbles family members to promote degradation of
C/EBPalpha and induce acute myelogenous leukemia. Blood, 116, 1321-8.
DEMO, S. D., KIRK, C. J., AUJAY, M. A., BUCHHOLZ, T. J., DAJEE, M., HO, M. N.,
JIANG, J., LAIDIG, G. J., LEWIS, E. R., PARLATI, F., SHENK, K. D., SMYTH,
M. S., SUN, C. M., VALLONE, M. K., WOO, T. M., MOLINEAUX, C. J. &
BENNETT, M. K. 2007. Antitumor activity of PR-171, a novel irreversible
inhibitor of the proteasome. Cancer Res, 67, 6383-91.
180 DESCOMBES, P. & SCHIBLER, U. 1991. A liver-enriched transcriptional activator
protein, LAP, and a transcriptional inhibitory protein, LIP, are translated from the
same mRNA. Cell, 67, 569-79.
DOHNER, H., ESTEY, E. H., AMADORI, S., APPELBAUM, F. R., BUCHNER, T.,
BURNETT, A. K., DOMBRET, H., FENAUX, P., GRIMWADE, D., LARSON, R.
A., LO-COCO, F., NAOE, T., NIEDERWIESER, D., OSSENKOPPELE, G. J.,
SANZ, M. A., SIERRA, J., TALLMAN, M. S., LOWENBERG, B. &
BLOOMFIELD, C. D. 2010. Diagnosis and management of acute myeloid
leukemia in adults: recommendations from an international expert panel, on behalf
of the European LeukemiaNet. Blood, 115, 453-74.
DOHNER, K. & DOHNER, H. 2008. Molecular characterization of acute myeloid
leukemia. Haematologica, 93, 976-82.
DOHNER, K., SCHLENK, R. F., HABDANK, M., SCHOLL, C., RUCKER, F. G.,
CORBACIOGLU, A., BULLINGER, L., FROHLING, S. & DOHNER, H. 2005.
Mutant nucleophosmin (NPM1) predicts favorable prognosis in younger adults
with acute myeloid leukemia and normal cytogenetics: interaction with other gene
mutations. Blood, 106, 3740-6.
DOLCET, X., LLOBET, D., ENCINAS, M., PALLARES, J., CABERO, A.,
SCHOENENBERGER, J. A., COMELLA, J. X. & MATIAS-GUIU, X. 2006.
Proteasome inhibitors induce death but activate NF-kappaB on endometrial
carcinoma cell lines and primary culture explants. J Biol Chem, 281, 22118-30.
DORANTES-ACOSTA, E. & PELAYO, R. 2012. Lineage switching in acute leukemias: a
consequence of stem cell plasticity? Bone Marrow Res, 2012, 406796.
DOULATOV, S., NOTTA, F., LAURENTI, E. & DICK, J. E. 2012. Hematopoiesis: a
human perspective. Cell Stem Cell, 10, 120-36.
DUFOUR, A., SCHNEIDER, F., METZELER, K. H., HOSTER, E., SCHNEIDER, S.,
ZELLMEIER, E., BENTHAUS, T., SAUERLAND, M. C., BERDEL, W. E.,
BUCHNER, T., WORMANN, B., BRAESS, J., HIDDEMANN, W.,
BOHLANDER, S. K. & SPIEKERMANN, K. 2010. Acute myeloid leukemia with
biallelic CEBPA gene mutations and normal karyotype represents a distinct genetic
entity associated with a favorable clinical outcome. J Clin Oncol, 28, 570-7.
ESTEY, E. 2010. High cytogenetic or molecular genetic risk acute myeloid leukemia.
Hematology Am Soc Hematol Educ Program, 2010, 474-80.
ESTEY, E. & DOHNER, H. 2006. Acute myeloid leukaemia. Lancet, 368, 1894-907.
ESTEY, E. H. 2012. Acute myeloid leukemia: 2012 update on diagnosis, risk stratification,
and management. Am J Hematol, 87, 89-99.
FABBRIZIO, E., EL MESSAOUDI, S., POLANOWSKA, J., PAUL, C., COOK, J. R.,
LEE, J. H., NEGRE, V., ROUSSET, M., PESTKA, S., LE CAM, A. & SARDET,
C. 2002. Negative regulation of transcription by the type II arginine
methyltransferase PRMT5. EMBO Rep, 3, 641-5.
FALINI, B., MECUCCI, C., TIACCI, E., ALCALAY, M., ROSATI, R., PASQUALUCCI,
L., LA STARZA, R., DIVERIO, D., COLOMBO, E., SANTUCCI, A., BIGERNA,
B., PACINI, R., PUCCIARINI, A., LISO, A., VIGNETTI, M., FAZI, P., MEANI,
N., PETTIROSSI, V., SAGLIO, G., MANDELLI, F., LO-COCO, F., PELICCI, P.
G. & MARTELLI, M. F. 2005. Cytoplasmic nucleophosmin in acute myelogenous
leukemia with a normal karyotype. N Engl J Med, 352, 254-66.
FANG, J., RHYASEN, G., BOLANOS, L., RASCH, C., VARNEY, M., WUNDERLICH,
M., GOYAMA, S., JANSEN, G., CLOOS, J., RIGOLINO, C., CORTELEZZI, A.,
MULLOY, J. C., OLIVA, E. N., CUZZOLA, M. & STARCZYNOWSKI, D. T.
2012. Cytotoxic effects of bortezomib in myelodysplastic syndrome/acute myeloid
leukemia depend on autophagy-mediated lysosomal degradation of TRAF6 and
repression of PSMA1. Blood, 120, 858-67.
181 FANG, Y., ZHOU, X., LIN, M., YING, M., LUO, P., ZHU, D., LOU, J., YANG, B. &
HE, Q. 2011. Inhibition of all-trans-retinoic acid-induced proteasome activation
potentiates the differentiating effect of retinoid in acute myeloid leukemia cells.
Mol Carcinog, 50, 24-35.
FASAN, A., HAFERLACH, C., ALPERMANN, T., JEROMIN, S., GROSSMANN, V.,
EDER, C., WEISSMANN, S., DICKER, F., KOHLMANN, A., SCHINDELA, S.,
KERN, W., HAFERLACH, T. & SCHNITTGER, S. 2014. The role of different
genetic subtypes of CEBPA mutated AML. Leukemia, 28, 794-803.
FERRARA, F. & SCHIFFER, C. A. 2013. Acute myeloid leukaemia in adults. The Lancet,
381, 484-495.
FERREIRA, H. J., HEYN, H., VIZOSO, M., MOUTINHO, C., VIDAL, E., GOMEZ, A.,
MARTINEZ-CARDUS, A., SIMO-RIUDALBAS, L., MORAN, S., JOST, E. &
ESTELLER, M. 2015. DNMT3A mutations mediate the epigenetic reactivation of
the leukemogenic factor MEIS1 in acute myeloid leukemia. Oncogene.
FIGUEROA, M. E., ABDEL-WAHAB, O., LU, C., WARD, P. S., PATEL, J., SHIH, A.,
LI, Y., BHAGWAT, N., VASANTHAKUMAR, A., FERNANDEZ, H. F.,
TALLMAN, M. S., SUN, Z., WOLNIAK, K., PEETERS, J. K., LIU, W., CHOE,
S. E., FANTIN, V. R., PAIETTA, E., LOWENBERG, B., LICHT, J. D.,
GODLEY, L. A., DELWEL, R., VALK, P. J., THOMPSON, C. B., LEVINE, R. L.
& MELNICK, A. 2010. Leukemic IDH1 and IDH2 mutations result in a
hypermethylation phenotype, disrupt TET2 function, and impair hematopoietic
differentiation. Cancer Cell, 18, 553-67.
FINCO, T. S. & BALDWIN, A. S. 1995. Mechanistic aspects of NF-kappa B regulation:
The emerging role of phosphorylation and proteolysis. Immunity, 3, 263-272.
FLANDRIN, G. 2002. Classification of acute myeloid leukemias. Atlas Genet Cytogenet
Oncol Haematol. , 6, 215-219.
FORBES, S. A., BEARE, D., GUNASEKARAN, P., LEUNG, K., BINDAL, N.,
BOUTSELAKIS, H., DING, M., BAMFORD, S., COLE, C., WARD, S., KOK, C.
Y., JIA, M., DE, T., TEAGUE, J. W., STRATTON, M. R., MCDERMOTT, U. &
CAMPBELL, P. J. 2015. COSMIC: exploring the world's knowledge of somatic
mutations in human cancer. Nucleic Acids Res, 43, D805-11.
FORD, C. E., HAMERTON, J. L., BARNES, D. W. H. & LOUTIT, J. F. 1956.
Cytological Identification of Radiation-Chimaeras. Nature, 177, 452-454.
FOULKES, D. M., BYRNE, D. P., BAILEY, F. P. & EYERS, P. A. 2015. Tribbles
pseudokinases: novel targets for chemical biology and drug discovery? Biochem
Soc Trans, 43, 1095-103.
FREIREICH, E. J., WIERNIK, P. H. & STEENSMA, D. P. 2014. The Leukemias: A Half-
Century of Discovery. Journal of Clinical Oncology, 32, 3463-3469.
FRIESEN, W. J., PAUSHKIN, S., WYCE, A., MASSENET, S., PESIRIDIS, G. S., VAN
DUYNE, G., RAPPSILBER, J., MANN, M. & DREYFUSS, G. 2001. The
Methylosome, a 20S Complex Containing JBP1 and pICln, Produces
Dimethylarginine-Modified Sm Proteins. Molecular and Cellular Biology, 21,
8289-8300.
FRIESEN, W. J., WYCE, A., PAUSHKIN, S., ABEL, L., RAPPSILBER, J., MANN, M.
& DREYFUSS, G. 2002. A novel WD repeat protein component of the
methylosome binds Sm proteins. J Biol Chem, 277, 8243-7.
GEEST, C. R., BUITENHUIS, M., LAARHOVEN, A. G., BIERINGS, M. B., BRUIN, M.
C., VELLENGA, E. & COFFER, P. J. 2009. p38 MAP kinase inhibits neutrophil
development through phosphorylation of C/EBPalpha on serine 21. Stem Cells, 27,
2271-82.
GERBER, J. M., SMITH, B. D., NGWANG, B., ZHANG, H., VALA, M. S.,
MORSBERGER, L., GALKIN, S., COLLECTOR, M. I., PERKINS, B., LEVIS,
M. J., GRIFFIN, C. A., SHARKIS, S. J., BOROWITZ, M. J., KARP, J. E. &
182
JONES, R. J. 2012. A clinically relevant population of leukemic CD34(+)CD38(-)
cells in acute myeloid leukemia. Blood, 119, 3571-7.
GILLILAND, D. G. & TALLMAN, M. S. 2002. Focus on acute leukemias. Cancer Cell, 1,
417-20.
GLICKMAN, M. H. & CIECHANOVER, A. 2002. The ubiquitin-proteasome proteolytic
pathway: destruction for the sake of construction. Physiol Rev, 82, 373-428.
GRANDINETTI, K. B., STEVENS, T. A., HA, S., SALAMONE, R. J., WALKER, J. R.,
ZHANG, J., AGARWALLA, S., TENEN, D. G., PETERS, E. C. & REDDY, V. A.
2011. Overexpression of TRIB2 in human lung cancers contributes to
tumorigenesis through downregulation of C/EBPalpha. Oncogene, 30, 3328-35.
GREENBLATT, S. M. & NIMER, S. D. 2014. Chromatin modifiers and the promise of
epigenetic therapy in acute leukemia. Leukemia, 28, 1396-1406.
GRIMWADE, D., WALKER, H., HARRISON, G., OLIVER, F., CHATTERS, S.,
HARRISON, C. J., WHEATLEY, K., BURNETT, A. K. & GOLDSTONE, A. H.
2001. The predictive value of hierarchical cytogenetic classification in older adults
with acute myeloid leukemia (AML): analysis of 1065 patients entered into the
United Kingdom Medical Research Council AML11 trial. Blood, 98, 1312-20.
GRIMWADE, D., WALKER, H., OLIVER, F., WHEATLEY, K., HARRISON, C.,
HARRISON, G., REES, J., HANN, I., STEVENS, R., BURNETT, A. &
GOLDSTONE, A. 1998. The importance of diagnostic cytogenetics on outcome in
AML: analysis of 1,612 patients entered into the MRC AML 10 trial. The Medical
Research Council Adult and Children's Leukaemia Working Parties. Blood, 92,
2322-33.
GROLL, M., BAJOREK, M., KOHLER, A., MORODER, L., RUBIN, D. M., HUBER, R.,
GLICKMAN, M. H. & FINLEY, D. 2000. A gated channel into the proteasome
core particle. Nat Struct Biol, 7, 1062-7.
GROLL, M., DITZEL, L., LOWE, J., STOCK, D., BOCHTLER, M., BARTUNIK, H. D.
& HUBER, R. 1997. Structure of 20S proteasome from yeast at 2.4 A resolution.
Nature, 386, 463-71.
GROSSHANS, J. & WIESCHAUS, E. 2000. A genetic link between morphogenesis and
cell division during formation of the ventral furrow in Drosophila. Cell, 101, 523-
31.
GRUNWALD, M. R. & LEVIS, M. J. 2013. FLT3 inhibitors for acute myeloid leukemia: a
review of their efficacy and mechanisms of resistance. Int J Hematol, 97, 683-94.
GUDERIAN, G., PETER, C., WIESNER, J., SICKMANN, A., SCHULZE-OSTHOFF, K.,
FISCHER, U. & GRIMMLER, M. 2011. RioK1, a New Interactor of Protein
Arginine Methyltransferase 5 (PRMT5), Competes with pICln for Binding and
Modulates PRMT5 Complex Composition and Substrate Specificity. The Journal
of Biological Chemistry, 286, 1976-1986.
GUO, S. & BAO, S. 2010. srGAP2 Arginine Methylation Regulates Cell Migration and
Cell Spreading through Promoting Dimerization. Journal of Biological Chemistry,
285, 35133-35141.
GUO, Z., ZHENG, L., XU, H., DAI, H., ZHOU, M., PASCUA, M. R., CHEN, Q. M. &
SHEN, B. 2010. Methylation of FEN1 suppresses nearby phosphorylation and
facilitates PCNA binding. Nat Chem Biol, 6, 766-73.
GUPTA, K., GULEN, F., SUN, L., AGUILERA, R., CHAKRABARTI, A., KISELAR, J.,
AGARWAL, M. K. & WALD, D. N. 2012. GSK3 is a regulator of RAR-mediated
differentiation. Leukemia, 26, 1277-85.
HAFERLACH, T., KOHLMANN, A., WIECZOREK, L., BASSO, G., KRONNIE, G. T.,
BENE, M. C., DE VOS, J., HERNANDEZ, J. M., HOFMANN, W. K., MILLS, K.
I., GILKES, A., CHIARETTI, S., SHURTLEFF, S. A., KIPPS, T. J., RASSENTI,
L. Z., YEOH, A. E., PAPENHAUSEN, P. R., LIU, W. M., WILLIAMS, P. M. &
FOA, R. 2010. Clinical utility of microarray-based gene expression profiling in the
183
diagnosis and subclassification of leukemia: report from the International
Microarray Innovations in Leukemia Study Group. J Clin Oncol, 28, 2529-37.
HAGLUND, K. & DIKIC, I. 2005. Ubiquitylation and cell signaling. Embo j, 24, 3353-9.
HEANEY, N. B., PELLICANO, F., ZHANG, B., CRAWFORD, L., CHU, S., KAZMI, S.
M., ALLAN, E. K., JORGENSEN, H. G., IRVINE, A. E., BHATIA, R. &
HOLYOAKE, T. L. 2010. Bortezomib induces apoptosis in primitive chronic
myeloid leukemia cells including LTC-IC and NOD/SCID repopulating cells.
Blood, 115, 2241-50.
HEBESTREIT, K., GROTTRUP, S., EMDEN, D., VEERKAMP, J., RUCKERT, C.,
KLEIN, H. U., MULLER-TIDOW, C. & DUGAS, M. 2012. Leukemia gene atlas-a
public platform for integrative exploration of genome-wide molecular data. PLoS
One, 7, e39148.
HEGEDUS, Z., CZIBULA, A. & KISS-TOTH, E. 2006. Tribbles: novel regulators of cell
function; evolutionary aspects. Cell Mol Life Sci, 63, 1632-41.
HEGEDUS, Z., CZIBULA, A. & KISS-TOTH, E. 2007. Tribbles: A family of kinase-like
proteins with potent signalling regulatory function. Cellular Signalling, 19, 238-
250.
HENDRICKS-TAYLOR, L. R. & DARLINGTON, G. J. 1995. Inhibition of cell
proliferation by C/EBP alpha occurs in many cell types, does not require the
presence of p53 or Rb, and is not affected by large T-antigen. Nucleic Acids
Research, 23, 4726-4733.
HERSHKO, A. 2005. The ubiquitin system for protein degradation and some of its roles in
the control of the cell division cycle. Cell Death Differ, 12, 1191-7.
HERSHKO, A. & CIECHANOVER, A. 1998. The ubiquitin system. Annu Rev Biochem,
67, 425-79.
HEUSER, M., WINGEN, L. U., STEINEMANN, D., CARIO, G., VON NEUHOFF, N.,
TAUSCHER, M., BULLINGER, L., KRAUTER, J., HEIL, G., DOHNER, H.,
SCHLEGELBERGER, B. & GANSER, A. 2005. Gene-expression profiles and
their association with drug resistance in adult acute myeloid leukemia.
Haematologica, 90, 1484-92.
HICKE, L. 2001. Protein regulation by monoubiquitin. Nat Rev Mol Cell Biol, 2, 195-201.
HIDESHIMA, T., IKEDA, H., CHAUHAN, D., OKAWA, Y., RAJE, N., PODAR, K.,
MITSIADES, C., MUNSHI, N. C., RICHARDSON, P. G., CARRASCO, R. D. &
ANDERSON, K. C. 2009. Bortezomib induces canonical nuclear factor-kappaB
activation in multiple myeloma cells. Blood, 114, 1046-52.
HIDESHIMA, T., RICHARDSON, P., CHAUHAN, D., PALOMBELLA, V. J.,
ELLIOTT, P. J., ADAMS, J. & ANDERSON, K. C. 2001. The proteasome
inhibitor PS-341 inhibits growth, induces apoptosis, and overcomes drug resistance
in human multiple myeloma cells. Cancer Res, 61, 3071-6.
HILL, R., KALATHUR, R. K., COLACO, L., BRANDAO, R., UGUREL, S.,
FUTSCHIK, M. & LINK, W. 2015. TRIB2 as a biomarker for diagnosis and
progression of melanoma. Carcinogenesis, 36, 469-77.
HOCHSTRASSER, M. 1995. Ubiquitin, proteasomes, and the regulation of intracellular
protein degradation. Curr Opin Cell Biol, 7, 215-23.
HOLLIDAY, R. 1987. The inheritance of epigenetic defects. Science, 238, 163-70.
HORTON, T. M., GANNAVARAPU, A., BLANEY, S. M., D'ARGENIO, D. Z., PLON,
S. E. & BERG, S. L. 2006. Bortezomib interactions with chemotherapy agents in
acute leukemia in vitro. Cancer Chemother Pharmacol, 58, 13-23.
HORTON, T. M., PATI, D., PLON, S. E., THOMPSON, P. A., BOMGAARS, L. R.,
ADAMSON, P. C., INGLE, A. M., WRIGHT, J., BROCKMAN, A. H., PATON,
M. & BLANEY, S. M. 2007. A phase 1 study of the proteasome inhibitor
bortezomib in pediatric patients with refractory leukemia: a Children's Oncology
Group study. Clin Cancer Res, 13, 1516-22.
184 HOU, Z., PENG, H., AYYANATHAN, K., YAN, K.-P., LANGER, E. M., LONGMORE,
G. D. & RAUSCHER, F. J. 2008. The LIM Protein AJUBA Recruits Protein
Arginine Methyltransferase 5 To Mediate SNAIL-Dependent Transcriptional
Repression. Molecular and Cellular Biology, 28, 3198-3207.
HOWARD, D. S., LIESVELD, J., PHILLIPS, G. L., 2ND, HAYSLIP, J., WEISS, H.,
JORDAN, C. T. & GUZMAN, M. L. 2013. A phase I study using bortezomib with
weekly idarubicin for treatment of elderly patients with acute myeloid leukemia.
Leuk Res, 37, 1502-8.
HUNTLY, B. J. & GILLILAND, D. G. 2005. Leukaemia stem cells and the evolution of
cancer-stem-cell research. Nat Rev Cancer, 5, 311-21.
IKEDA, F. & DIKIC, I. 2008. Atypical ubiquitin chains: new molecular signals. 'Protein
Modifications: Beyond the Usual Suspects' review series. EMBO Rep, 9, 536-42.
IM, A. P., SEHGAL, A. R., CARROLL, M. P., SMITH, B. D., TEFFERI, A., JOHNSON,
D. E. & BOYIADZIS, M. 2014. DNMT3A and IDH mutations in acute myeloid
leukemia and other myeloid malignancies: associations with prognosis and
potential treatment strategies. Leukemia, 28, 1774-83.
IMAJOH-OHMI, S., KAWAGUCHI, T., SUGIYAMA, S., TANAKA, K., OMURA, S. &
KIKUCHI, H. 1995. Lactacystin, a specific inhibitor of the proteasome, induces
apoptosis in human monoblast U937 cells. Biochem Biophys Res Commun, 217,
1070-7.
IWASAKI, H., MIZUNO, S.-I., WELLS, R. A., CANTOR, A. B., WATANABE, S. &
AKASHI, K. 2003. GATA-1 Converts Lymphoid and Myelomonocytic Progenitors
into the Megakaryocyte/Erythrocyte Lineages. Immunity, 19, 451-462.
JACOBSON, L. O., SIMMONS, E. L., MARKS, E. K. & ELDREDGE, J. H. 1951.
Recovery from radiation injury. Science, 113, 510-11.
JANSSON, M., DURANT, S. T., CHO, E. C., SHEAHAN, S., EDELMANN, M.,
KESSLER, B. & LA THANGUE, N. B. 2008. Arginine methylation regulates the
p53 response. Nat Cell Biol, 10, 1431-9.
JARIEL-ENCONTRE, I., BOSSIS, G. & PIECHACZYK, M. 2008. Ubiquitin-independent
degradation of proteins by the proteasome. Biochim Biophys Acta, 1786, 153-77.
JIN, G., YAMAZAKI, Y., TAKUWA, M., TAKAHARA, T., KANEKO, K., KUWATA,
T., MIYATA, S. & NAKAMURA, T. 2007. Trib1 and Evi1 cooperate with Hoxa
and Meis1 in myeloid leukemogenesis. Blood, 109, 3998-4005.
JING, Y. & WAXMAN, S. 2007. The design of selective and non-selective combination
therapy for acute promyelocytic leukemia. Curr Top Microbiol Immunol, 313, 245-
69.
JOHANSSON, P., EISELE, L., KLEIN-HITPASS, L., SELLMANN, L., DUHRSEN, U.,
DURIG, J. & NUCKEL, H. 2010. Percentage of smudge cells determined on
routine blood smears is a novel prognostic factor in chronic lymphocytic leukemia.
Leuk Res, 34, 892-8.
KALEJTA, R. F. & SHENK, T. 2003. Proteasome-dependent, ubiquitin-independent
degradation of the Rb family of tumor suppressors by the human cytomegalovirus
pp71 protein. Proc Natl Acad Sci U S A, 100, 3263-8.
KAMB, A. 2005. What's wrong with our cancer models? Nat Rev Drug Discov, 4, 161-5.
KANDOTH, C., MCLELLAN, M. D., VANDIN, F., YE, K., NIU, B., LU, C., XIE, M.,
ZHANG, Q., MCMICHAEL, J. F., WYCZALKOWSKI, M. A., LEISERSON, M.
D. M., MILLER, C. A., WELCH, J. S., WALTER, M. J., WENDL, M. C., LEY, T.
J., WILSON, R. K., RAPHAEL, B. J. & DING, L. 2013. Mutational landscape and
significance across 12 major cancer types. Nature, 502, 333-339.
KANE, R. C., BROSS, P. F., FARRELL, A. T. & PAZDUR, R. 2003. Velcade: U.S. FDA
approval for the treatment of multiple myeloma progressing on prior therapy.
Oncologist, 8, 508-13.
185 KANE, R. C., DAGHER, R., FARRELL, A., KO, C. W., SRIDHARA, R., JUSTICE, R. &
PAZDUR, R. 2007. Bortezomib for the treatment of mantle cell lymphoma. Clin
Cancer Res, 13, 5291-4.
KATSNELSON, A. 2012. Next-generation proteasome inhibitor approved in multiple
myeloma. Nat Biotech, 30, 1011-1012.
KEESHAN, K., BAILIS, W., DEDHIA, P. H., VEGA, M. E., SHESTOVA, O., XU, L.,
TOSCANO, K., ULJON, S. N., BLACKLOW, S. C. & PEAR, W. S. 2010.
Transformation by Tribbles homolog 2 (Trib2) requires both the Trib2 kinase
domain and COP1 binding. Blood, 116, 4948-57.
KEESHAN, K., HE, Y., WOUTERS, B. J., SHESTOVA, O., XU, L., SAI, H.,
RODRIGUEZ, C. G., MAILLARD, I., TOBIAS, J. W., VALK, P., CARROLL,
M., ASTER, J. C., DELWEL, R. & PEAR, W. S. 2006. Tribbles homolog 2
inactivates C/EBPalpha and causes acute myelogenous leukemia. Cancer Cell, 10,
401-11.
KEESHAN, K., SHESTOVA, O., USSIN, L. & PEAR, W. S. 2008. Tribbles homolog 2
(Trib2) and HoxA9 cooperate to accelerate acute myelogenous leukemia. Blood
Cells Mol Dis, 40, 119-21.
KELLER, J. N., HANNI, K. B. & MARKESBERY, W. R. 2000a. Impaired proteasome
function in Alzheimer's disease. J Neurochem, 75, 436-9.
KELLER, J. N., HUANG, F. F., ZHU, H., YU, J., HO, Y. S. & KINDY, T. S. 2000b.
Oxidative stress-associated impairment of proteasome activity during ischemia-
reperfusion injury. J Cereb Blood Flow Metab, 20, 1467-73.
KELLY, L. M. & GILLILAND, D. G. 2002. Genetics of myeloid leukemias. Annu Rev
Genomics Hum Genet, 3, 179-98.
KIRSTETTER, P., SCHUSTER, M. B., BERESHCHENKO, O., MOORE, S., DVINGE,
H., KURZ, E., THEILGAARD-MÖNCH, K., MÅNSSON, R., PEDERSEN, T. Å.,
PABST, T., SCHROCK, E., PORSE, B. T., JACOBSEN, S. E. W., BERTONE, P.,
TENEN, D. G. & NERLOV, C. 2008. Modeling of C/EBPα Mutant Acute Myeloid
Leukemia Reveals a Common Expression Signature of Committed Myeloid
Leukemia-Initiating Cells. Cancer Cell, 13, 299-310.
KISS-TOTH, E., WYLLIE, D. H., HOLLAND, K., MARSDEN, L., JOZSA, V., OXLEY,
K. M., POLGAR, T., QWARNSTROM, E. E. & DOWER, S. K. 2006. Functional
mapping and identification of novel regulators for the Toll/Interleukin-1 signalling
network by transcription expression cloning. Cell Signal, 18, 202-14.
KONDO, M., WEISSMAN, I. L. & AKASHI, K. 1997. Identification of clonogenic
common lymphoid progenitors in mouse bone marrow. Cell, 91, 661-72.
KONG, X., ALVAREZ-CASTELAO, B., LIN, Z., CASTANO, J. G. & CARO, J. 2007.
Constitutive/hypoxic degradation of HIF-alpha proteins by the proteasome is
independent of von Hippel Lindau protein ubiquitylation and the transactivation
activity of the protein. J Biol Chem, 282, 15498-505.
KUMATORI, A., TANAKA, K., INAMURA, N., SONE, S., OGURA, T.,
MATSUMOTO, T., TACHIKAWA, T., SHIN, S. & ICHIHARA, A. 1990.
Abnormally high expression of proteasomes in human leukemic cells. Proc Natl
Acad Sci U S A, 87, 7071-5.
KUTER, D. J., BAIN, B., MUFTI, G., BAGG, A. & HASSERJIAN, R. P. 2007. Bone
marrow fibrosis: pathophysiology and clinical significance of increased bone
marrow stromal fibres. Br J Haematol, 139, 351-62.
KWAK, Y. T., GUO, J., PRAJAPATI, S., PARK, K. J., SURABHI, R. M., MILLER, B.,
GEHRIG, P. & GAYNOR, R. B. 2003. Methylation of SPT5 regulates its
interaction with RNA polymerase II and transcriptional elongation properties. Mol
Cell, 11, 1055-66.
LACROIX, M., MESSAOUDI, S. E., RODIER, G., LE CAM, A., SARDET, C. &
FABBRIZIO, E. 2008. The histone‐binding protein COPR5 is required for nuclear
186
functions of the protein arginine methyltransferase PRMT5. EMBO reports, 9, 452-
458.
LAIOSA, C. V., STADTFELD, M., XIE, H., DE ANDRES-AGUAYO, L. & GRAF, T.
2006. Reprogramming of Committed T Cell Progenitors to Macrophages and
Dendritic Cells by C/EBPα and PU.1 Transcription Factors. Immunity, 25, 731-744.
LE GUEZENNEC, X., VERMEULEN, M., BRINKMAN, A. B., HOEIJMAKERS, W. A.
M., COHEN, A., LASONDER, E. & STUNNENBERG, H. G. 2006. MBD2/NuRD
and MBD3/NuRD, Two Distinct Complexes with Different Biochemical and
Functional Properties. Molecular and Cellular Biology, 26, 843-851.
LEE, A. H., IWAKOSHI, N. N., ANDERSON, K. C. & GLIMCHER, L. H. 2003.
Proteasome inhibitors disrupt the unfolded protein response in myeloma cells. Proc
Natl Acad Sci U S A, 100, 9946-51.
LIANG, K. L., RISHI, L. & KEESHAN, K. 2013. Tribbles in acute leukemia. Blood, 121,
4265-70.
LIM, H. S., ARCHER, C. T. & KODADEK, T. 2007. Identification of a peptoid inhibitor
of the proteasome 19S regulatory particle. J Am Chem Soc, 129, 7750-1.
LIN, F. T., MACDOUGALD, O. A., DIEHL, A. M. & LANE, M. D. 1993. A 30-kDa
alternative translation product of the CCAAT/enhancer binding protein alpha
message: transcriptional activator lacking antimitotic activity. Proceedings of the
National Academy of Sciences of the United States of America, 90, 9606-9610.
LING, Y. H., LIEBES, L., NG, B., BUCKLEY, M., ELLIOTT, P. J., ADAMS, J., JIANG,
J. D., MUGGIA, F. M. & PEREZ-SOLER, R. 2002. PS-341, a novel proteasome
inhibitor, induces Bcl-2 phosphorylation and cleavage in association with G2-M
phase arrest and apoptosis. Mol Cancer Ther, 1, 841-9.
LIU, C. Y., SHIAU, C. W., KUO, H. Y., HUANG, H. P., CHEN, M. H., TZENG, C. H. &
CHEN, K. F. 2013. Cancerous inhibitor of protein phosphatase 2A determines
bortezomib-induced apoptosis in leukemia cells. Haematologica, 98, 729-38.
LIU, F., ZHAO, X., PERNA, F., WANG, L., KOPPIKAR, P., ABDEL-WAHAB, O.,
HARR, M. W., LEVINE, R. L., XU, H., TEFFERI, A., DEBLASIO, A., HATLEN,
M., MENENDEZ, S. & NIMER, S. D. 2011. JAK2V617F-mediated
phosphorylation of PRMT5 downregulates its methyltransferase activity and
promotes myeloproliferation. Cancer Cell, 19, 283-94.
LOHAN, F. & KEESHAN, K. 2013. The functionally diverse roles of tribbles. Biochem
Soc Trans, 41, 1096-100.
LÖWENBERG, B. 2001. Prognostic factors in acute myeloid leukaemia. Best Practice &
Research Clinical Haematology, 14, 65-75.
LOWENBERG, B., DOWNING, J. R. & BURNETT, A. 1999. Acute myeloid leukemia. N
Engl J Med, 341, 1051-62.
LUO, P., LIN, M., LI, L., YANG, B. & HE, Q. 2011. The proteasome inhibitor bortezomib
enhances ATRA-induced differentiation of neuroblastoma cells via the JNK
mitogen-activated protein kinase pathway. PLoS One, 6, e27298.
MA, W., KANTARJIAN, H., BEKELE, B., DONAHUE, A. C., ZHANG, X., ZHANG, Z.
J., O'BRIEN, S., ESTEY, E., ESTROV, Z., CORTES, J., KEATING, M., GILES,
F. & ALBITAR, M. 2009. Proteasome Enzymatic Activities in Plasma as Risk
Stratification of Patients with Acute Myeloid Leukemia and Advanced
Myelodysplastic Syndrome. Clinical cancer research : an official journal of the
American Association for Cancer Research, 15, 3820-3826.
MANCINI, E., SANJUAN-PLA, A., LUCIANI, L., MOORE, S., GROVER, A., ZAY, A.,
RASMUSSEN, K. D., LUC, S., BILBAO, D., O'CARROLL, D., JACOBSEN, S.
E. & NERLOV, C. 2012. FOG-1 and GATA-1 act sequentially to specify definitive
megakaryocytic and erythroid progenitors. Embo j, 31, 351-65.
MANSSON, R., HULTQUIST, A., LUC, S., YANG, L., ANDERSON, K., KHARAZI, S.,
AL-HASHMI, S., LIUBA, K., THOREN, L., ADOLFSSON, J., BUZA-VIDAS,
187
N., QIAN, H., SONEJI, S., ENVER, T., SIGVARDSSON, M. & JACOBSEN, S.
E. 2007. Molecular evidence for hierarchical transcriptional lineage priming in fetal
and adult stem cells and multipotent progenitors. Immunity, 26, 407-19.
MANZ, M. G., TRAVER, D., MIYAMOTO, T., WEISSMAN, I. L. & AKASHI, K. 2001.
Dendritic cell potentials of early lymphoid and myeloid progenitors. Blood, 97,
3333-41.
MARCUCCI, G., BALDUS, C. D., RUPPERT, A. S., RADMACHER, M. D., MROZEK,
K., WHITMAN, S. P., KOLITZ, J. E., EDWARDS, C. G., VARDIMAN, J. W.,
POWELL, B. L., BAER, M. R., MOORE, J. O., PERROTTI, D., CALIGIURI, M.
A., CARROLL, A. J., LARSON, R. A., DE LA CHAPELLE, A. &
BLOOMFIELD, C. D. 2005. Overexpression of the ETS-related gene, ERG,
predicts a worse outcome in acute myeloid leukemia with normal karyotype: a
Cancer and Leukemia Group B study. J Clin Oncol, 23, 9234-42.
MARDIS, E. R., DING, L., DOOLING, D. J., LARSON, D. E., MCLELLAN, M. D.,
CHEN, K., KOBOLDT, D. C., FULTON, R. S., DELEHAUNTY, K. D.,
MCGRATH, S. D., FULTON, L. A., LOCKE, D. P., MAGRINI, V. J., ABBOTT,
R. M., VICKERY, T. L., REED, J. S., ROBINSON, J. S., WYLIE, T., SMITH, S.
M., CARMICHAEL, L., ELDRED, J. M., HARRIS, C. C., WALKER, J., PECK, J.
B., DU, F., DUKES, A. F., SANDERSON, G. E., BRUMMETT, A. M., CLARK,
E., MCMICHAEL, J. F., MEYER, R. J., SCHINDLER, J. K., POHL, C. S.,
WALLIS, J. W., SHI, X., LIN, L., SCHMIDT, H., TANG, Y., HAIPEK, C.,
WIECHERT, M. E., IVY, J. V., KALICKI, J., ELLIOTT, G., RIES, R. E.,
PAYTON, J. E., WESTERVELT, P., TOMASSON, M. H., WATSON, M. A.,
BATY, J., HEATH, S., SHANNON, W. D., NAGARAJAN, R., LINK, D. C.,
WALTER, M. J., GRAUBERT, T. A., DIPERSIO, J. F., WILSON, R. K. & LEY,
T. J. 2009. Recurring mutations found by sequencing an acute myeloid leukemia
genome. N Engl J Med, 361, 1058-66.
MARTINEAU, M., BERGER, R., LILLINGTON, D. M., MOORMAN, A. V. &
SECKER-WALKER, L. M. 1998. The t(6;11)(q27;q23) translocation in acute
leukemia: a laboratory and clinical study of 30 cases. EU Concerted Action 11q23
Workshop participants. Leukemia, 12, 788-91.
MATA, J., CURADO, S., EPHRUSSI, A. & RORTH, P. 2000. Tribbles coordinates
mitosis and morphogenesis in Drosophila by regulating string/CDC25 proteolysis.
Cell, 101, 511-22.
MEISTER, G. & FISCHER, U. 2002. Assisted RNP assembly: SMN and PRMT5
complexes cooperate in the formation of spliceosomal UsnRNPs. The EMBO
Journal, 21, 5853-5863.
MELNICK, A. & LICHT, J. D. 1999. Deconstructing a disease: RARalpha, its fusion
partners, and their roles in the pathogenesis of acute promyelocytic leukemia.
Blood, 93, 3167-215.
MITSIADES, N., MITSIADES, C. S., POULAKI, V., CHAUHAN, D., FANOURAKIS,
G., GU, X., BAILEY, C., JOSEPH, M., LIBERMANN, T. A., TREON, S. P.,
MUNSHI, N. C., RICHARDSON, P. G., HIDESHIMA, T. & ANDERSON, K. C.
2002. Molecular sequelae of proteasome inhibition in human multiple myeloma
cells. Proc Natl Acad Sci U S A, 99, 14374-9.
MIYAMOTO, T., IWASAKI, H., REIZIS, B., YE, M., GRAF, T., WEISSMAN, I. L. &
AKASHI, K. 2002. Myeloid or lymphoid promiscuity as a critical step in
hematopoietic lineage commitment. Dev Cell, 3, 137-47.
MORRISON, S. J., WANDYCZ, A. M., HEMMATI, H. D., WRIGHT, D. E. &
WEISSMAN, I. L. 1997. Identification of a lineage of multipotent hematopoietic
progenitors. Development, 124, 1929-39.
188 MORRISON, S. J. & WEISSMAN, I. L. 1994. The long-term repopulating subset of
hematopoietic stem cells is deterministic and isolatable by phenotype. Immunity, 1,
661-73.
MOTEGI, A., MURAKAWA, Y. & TAKEDA, S. 2009. The vital link between the
ubiquitin-proteasome pathway and DNA repair: impact on cancer therapy. Cancer
Lett, 283, 1-9.
MROZEK, K., HEINONEN, K. & BLOOMFIELD, C. D. 2001. Clinical importance of
cytogenetics in acute myeloid leukaemia. Best Pract Res Clin Haematol, 14, 19-47.
MURAKAMI, Y., MATSUFUJI, S., KAMEJI, T., HAYASHI, S., IGARASHI, K.,
TAMURA, T., TANAKA, K. & ICHIHARA, A. 1992. Ornithine decarboxylase is
degraded by the 26S proteasome without ubiquitination. Nature, 360, 597-9.
MURPHY, J. M., NAKATANI, Y., JAMIESON, S. A., DAI, W., LUCET, I. S. & MACE,
P. D. 2015. Molecular Mechanism of CCAAT-Enhancer Binding Protein
Recruitment by the TRIB1 Pseudokinase. Structure, 23, 2111-21.
MUSSELMAN, C. A., LALONDE, M. E., COTE, J. & KUTATELADZE, T. G. 2012.
Perceiving the epigenetic landscape through histone readers. Nat Struct Mol Biol,
19, 1218-27.
NAGAMATSU, G., KOSAKA, T., KAWASUMI, M., KINOSHITA, T., TAKUBO, K.,
AKIYAMA, H., SUDO, T., KOBAYASHI, T., OYA, M. & SUDA, T. 2011. A
Germ Cell-specific Gene, Prmt5, Works in Somatic Cell Reprogramming. The
Journal of Biological Chemistry, 286, 10641-10648.
NAGEL, S., VENTURINI, L., PRZYBYLSKI, G. K., GRABARCZYK, P., SCHNEIDER,
B., MEYER, C., KAUFMANN, M., SCHMIDT, C. A., SCHERR, M., DREXLER,
H. G. & MACLEOD, R. A. F. 2011. Activation of Paired-homeobox gene PITX1
by del(5)(q31) in T-cell acute lymphoblastic leukemia. Leukemia & Lymphoma, 52,
1348-1359.
NAKAO, M., YOKOTA, S., IWAI, T., KANEKO, H., HORIIKE, S., KASHIMA, K.,
SONODA, Y., FUJIMOTO, T. & MISAWA, S. 1996. Internal tandem duplication
of the flt3 gene found in acute myeloid leukemia. Leukemia, 10, 1911-8.
NAVON, A. & GOLDBERG, A. L. 2001. Proteins are unfolded on the surface of the
ATPase ring before transport into the proteasome. Mol Cell, 8, 1339-49.
NENCIONI, A., GRUNEBACH, F., PATRONE, F., BALLESTRERO, A. & BROSSART,
P. 2007. Proteasome inhibitors: antitumor effects and beyond. Leukemia, 21, 30-6.
NERLOV, C. 2004. C/EBP[alpha] mutations in acute myeloid leukaemias. Nat Rev
Cancer, 4, 394-400.
NISHIOKA, K. & REINBERG, D. 2003. Methods and tips for the purification of human
histone methyltransferases. Methods, 31, 49-58.
NOTTA, F., DOULATOV, S. & DICK, J. E. 2010. Engraftment of human hematopoietic
stem cells is more efficient in female NOD/SCID/IL-2Rgc-null recipients. Blood,
115, 3704-7.
NOTTA, F., ZANDI, S., TAKAYAMA, N., DOBSON, S., GAN, O. I., WILSON, G.,
KAUFMANN, K. B., MCLEOD, J., LAURENTI, E., DUNANT, C. F.,
MCPHERSON, J. D., STEIN, L. D., DROR, Y. & DICK, J. E. 2015. Distinct
routes of lineage development reshape the human blood hierarchy across ontogeny.
Science.
NUTT, S. L., HEAVEY, B., ROLINK, A. G. & BUSSLINGER, M. 1999. Commitment to
the B-lymphoid lineage depends on the transcription factor Pax5. Nature, 401, 556-
62.
O'CONNOR, C., LOHAN, F., CAMPOS, J., OHLSSON, E., SALOME, M., FORDE, C.,
ARTSCHWAGER, R., LISKAMP, R. M., CAHILL, M. R., KIELY, P. A., PORSE,
B. & KEESHAN, K. 2016. The presence of C/EBPα and its degradation are both
required for TRIB2-mediated leukaemia. Oncogene.
189 O'CONNOR, L., STRASSER, A., O'REILLY, L. A., HAUSMANN, G., ADAMS, J. M.,
CORY, S. & HUANG, D. C. 1998. Bim: a novel member of the Bcl-2 family that
promotes apoptosis. Embo j, 17, 384-95.
O´BRIEN, E., PRIDEAUX, S. & CHEVASSUT, T. 2014. The Epigenetic Landscape of
Acute Myeloid Leukemia. Advances in Hematology, 2014, 103175.
OBENG, E. A., CARLSON, L. M., GUTMAN, D. M., HARRINGTON, W. J., JR., LEE,
K. P. & BOISE, L. H. 2006. Proteasome inhibitors induce a terminal unfolded
protein response in multiple myeloma cells. Blood, 107, 4907-16.
OLIVIER, M., HOLLSTEIN, M. & HAINAUT, P. 2010. TP53 Mutations in Human
Cancers: Origins, Consequences, and Clinical Use. Cold Spring Harbor
Perspectives in Biology, 2, a001008.
ORKIN, S. H. 2000. Diversification of haematopoietic stem cells to specific lineages. Nat
Rev Genet, 1, 57-64.
ORKIN, S. H. & ZON, L. I. 2008. Hematopoiesis: An Evolving Paradigm for Stem Cell
Biology. Cell, 132, 631-644.
ORLOWSKI, R. Z., ESWARA, J. R., LAFOND-WALKER, A., GREVER, M. R.,
ORLOWSKI, M. & DANG, C. V. 1998. Tumor growth inhibition induced in a
murine model of human Burkitt's lymphoma by a proteasome inhibitor. Cancer
Res, 58, 4342-8.
ORLOWSKI, R. Z. & KUHN, D. J. 2008. Proteasome inhibitors in cancer therapy: lessons
from the first decade. Clin Cancer Res, 14, 1649-57.
OSAWA, M., HANADA, K., HAMADA, H. & NAKAUCHI, H. 1996. Long-term
lymphohematopoietic reconstitution by a single CD34-low/negative hematopoietic
stem cell. Science, 273, 242-5.
OSSIPOW, V., DESCOMBES, P. & SCHIBLER, U. 1993. CCAAT/enhancer-binding
protein mRNA is translated into multiple proteins with different transcription
activation potentials. Proceedings of the National Academy of Sciences of the
United States of America, 90, 8219-8223.
PABST, C., KROSL, J., FARES, I., BOUCHER, G., RUEL, R., MARINIER, A.,
LEMIEUX, S., HEBERT, J. & SAUVAGEAU, G. 2014. Identification of small
molecules that support human leukemia stem cell activity ex vivo. Nat Methods,
11, 436-42.
PABST, T., EYHOLZER, M., FOS, J. & MUELLER, B. U. 2009. Heterogeneity within
AML with CEBPA mutations; only CEBPA double mutations, but not single
CEBPA mutations are associated with favourable prognosis. Br J Cancer, 100,
1343-6.
PABST, T., MUELLER, B. U., HARAKAWA, N., SCHOCH, C., HAFERLACH, T.,
BEHRE, G., HIDDEMANN, W., ZHANG, D. E. & TENEN, D. G. 2001. AML1-
ETO downregulates the granulocytic differentiation factor C/EBPalpha in t(8;21)
myeloid leukemia. Nat Med, 7, 444-51.
PAGANO, M., TAM, S. W., THEODORAS, A. M., BEER-ROMERO, P., DEL SAL, G.,
CHAU, V., YEW, P. R., DRAETTA, G. F. & ROLFE, M. 1995. Role of the
ubiquitin-proteasome pathway in regulating abundance of the cyclin-dependent
kinase inhibitor p27. Science, 269, 682-5.
PAL, S., BAIOCCHI, R. A., BYRD, J. C., GREVER, M. R., JACOB, S. T. & SIF, S.
2007. Low levels of miR-92b/96 induce PRMT5 translation and H3R8/H4R3
methylation in mantle cell lymphoma. Embo j, 26, 3558-69.
PAL, S. & SIF, S. 2007. Interplay between chromatin remodelers and protein arginine
methyltransferases. J Cell Physiol, 213, 306-15.
PAL, S., VISHWANATH, S. N., ERDJUMENT-BROMAGE, H., TEMPST, P. & SIF, S.
2004. Human SWI/SNF-associated PRMT5 methylates histone H3 arginine 8 and
negatively regulates expression of ST7 and NM23 tumor suppressor genes. Mol
Cell Biol, 24, 9630-45.
190 PAL, S., YUN, R., DATTA, A., LACOMIS, L., ERDJUMENT-BROMAGE, H.,
KUMAR, J., TEMPST, P. & SIF, S. 2003. mSin3A/Histone Deacetylase 2- and
PRMT5-Containing Brg1 Complex Is Involved in Transcriptional Repression of the
Myc Target Gene cad. Molecular and Cellular Biology, 23, 7475-7487.
PALMA, C. A., AL SHEIKHA, D., LIM, T. K., BRYANT, A., VU, T. T., JAYASWAL,
V. & MA, D. D. 2014. MicroRNA-155 as an inducer of apoptosis and cell
differentiation in Acute Myeloid Leukaemia. Mol Cancer, 13, 79.
PALOMBELLA, V. J., CONNER, E. M., FUSELER, J. W., DESTREE, A., DAVIS, J. M.,
LAROUX, F. S., WOLF, R. E., HUANG, J., BRAND, S., ELLIOTT, P. J.,
LAZARUS, D., MCCORMACK, T., PARENT, L., STEIN, R., ADAMS, J. &
GRISHAM, M. B. 1998. Role of the proteasome and NF-kappaB in streptococcal
cell wall-induced polyarthritis. Proc Natl Acad Sci U S A, 95, 15671-6.
PARLATI, F., LEE, S. J., AUJAY, M., SUZUKI, E., LEVITSKY, K., LORENS, J. B.,
MICKLEM, D. R., RUURS, P., SYLVAIN, C., LU, Y., SHENK, K. D. &
BENNETT, M. K. 2009. Carfilzomib can induce tumor cell death through selective
inhibition of the chymotrypsin-like activity of the proteasome. Blood, 114, 3439-
47.
PEREZ-GALAN, P., ROUE, G., VILLAMOR, N., MONTSERRAT, E., CAMPO, E. &
COLOMER, D. 2006. The proteasome inhibitor bortezomib induces apoptosis in
mantle-cell lymphoma through generation of ROS and Noxa activation independent
of p53 status. Blood, 107, 257-64.
PESIRIDIS, G. S., DIAMOND, E. & VAN DUYNE, G. D. 2009. Role of pICLn in
Methylation of Sm Proteins by PRMT5. Journal of Biological Chemistry, 284,
21347-21359.
PETITJEAN, A., ACHATZ, M. I., BORRESEN-DALE, A. L., HAINAUT, P. &
OLIVIER, M. 2007. TP53 mutations in human cancers: functional selection and
impact on cancer prognosis and outcomes. Oncogene, 26, 2157-65.
PICKART, C. M. & EDDINS, M. J. 2004. Ubiquitin: structures, functions, mechanisms.
Biochim Biophys Acta, 1695, 55-72.
PILLER, G. 2001. Leukaemia - a brief historical review from ancient times to 1950. Br J
Haematol, 112, 282-92.
PODAR, K., SHRINGARPURE, R., TAI, Y. T., SIMONCINI, M., SATTLER, M.,
ISHITSUKA, K., RICHARDSON, P. G., HIDESHIMA, T., CHAUHAN, D. &
ANDERSON, K. C. 2004. Caveolin-1 is required for vascular endothelial growth
factor-triggered multiple myeloma cell migration and is targeted by bortezomib.
Cancer Res, 64, 7500-6.
POLLACK, B. P., KOTENKO, S. V., HE, W., IZOTOVA, L. S., BARNOSKI, B. L. &
PESTKA, S. 1999. The human homologue of the yeast proteins Skb1 and Hsl7p
interacts with Jak kinases and contains protein methyltransferase activity. J Biol
Chem, 274, 31531-42.
POWERS, M. A., FAY, M. M., FACTOR, R. E., WELM, A. L. & ULLMAN, K. S. 2011.
Protein arginine methyltransferase 5 accelerates tumor growth by arginine
methylation of the tumor suppressor programmed cell death 4. Cancer Res, 71,
5579-87.
QI, L., HEREDIA, J. E., ALTAREJOS, J. Y., SCREATON, R., GOEBEL, N., NIESSEN,
S., MACLEOD, I. X., LIEW, C. W., KULKARNI, R. N., BAIN, J., NEWGARD,
C., NELSON, M., EVANS, R. M., YATES, J. & MONTMINY, M. 2006. TRB3
links the E3 ubiquitin ligase COP1 to lipid metabolism. Science, 312, 1763-6.
QIAO, Y., ZHANG, Y. & WANG, J. 2013. Ubiquitin E3 ligase SCFβ-TRCP regulates
TRIB2 stability in liver cancer cells. Biochemical and Biophysical Research
Communications, 441, 555-559.
RADOMSKA, H. S., HUETTNER, C. S., ZHANG, P., CHENG, T., SCADDEN, D. T. &
TENEN, D. G. 1998. CCAAT/enhancer binding protein alpha is a regulatory
191
switch sufficient for induction of granulocytic development from bipotential
myeloid progenitors. Mol Cell Biol, 18, 4301-14.
RAIBORG, C., SLAGSVOLD, T. & STENMARK, H. 2006. A new side to ubiquitin.
Trends Biochem Sci, 31, 541-4.
RALPH, P., HARRIS, P. E., PUNJABI, C. J., WELTE, K., LITCOFSKY, P. B., HO, M.
K., RUBIN, B. Y., MOORE, M. A. & SPRINGER, T. A. 1983. Lymphokine
inducing "terminal differentiation" of the human monoblast leukemia line U937: a
role for gamma interferon. Blood, 62, 1169-75.
REINSTEIN, E., SCHEFFNER, M., OREN, M., CIECHANOVER, A. & SCHWARTZ, A.
2000. Degradation of the E7 human papillomavirus oncoprotein by the ubiquitin-
proteasome system: targeting via ubiquitination of the N-terminal residue.
Oncogene, 19, 5944-50.
REN, J., WANG, Y., LIANG, Y., ZHANG, Y., BAO, S. & XU, Z. 2010. Methylation of
Ribosomal Protein S10 by Protein-arginine Methyltransferase 5 Regulates
Ribosome Biogenesis. Journal of Biological Chemistry, 285, 12695-12705.
RENNEVILLE, A., BOISSEL, N., NIBOUREL, O., BERTHON, C., HELEVAUT, N.,
GARDIN, C., CAYUELA, J. M., HAYETTE, S., REMAN, O., CONTENTIN, N.,
BORDESSOULE, D., PAUTAS, C., BOTTON, S., REVEL, T., TERRE, C.,
FENAUX, P., THOMAS, X., CASTAIGNE, S., DOMBRET, H. &
PREUDHOMME, C. 2012. Prognostic significance of DNA methyltransferase 3A
mutations in cytogenetically normal acute myeloid leukemia: a study by the Acute
Leukemia French Association. Leukemia, 26, 1247-54.
RENNEVILLE, A., ROUMIER, C., BIGGIO, V., NIBOUREL, O., BOISSEL, N.,
FENAUX, P. & PREUDHOMME, C. 2008. Cooperating gene mutations in acute
myeloid leukemia: a review of the literature. Leukemia, 22, 915-31.
RISHI, L., HANNON, M., SALOME, M., HASEMANN, M., FRANK, A. K., CAMPOS,
J., TIMONEY, J., O'CONNOR, C., CAHILL, M. R., PORSE, B. & KEESHAN, K.
2014. Regulation of Trib2 by an E2F1-C/EBPalpha feedback loop in AML cell
proliferation. Blood, 123, 2389-400.
RIZZO, M. G., ZEPPARONI, A., CRISTOFANELLI, B., SCARDIGLI, R., CRESCENZI,
M., BLANDINO, G., GIULIACCI, S., FERRARI, S., SODDU, S. & SACCHI, A.
1998. Wt-p53 action in human leukaemia cell lines corresponding to different
stages of differentiation. Br J Cancer, 77, 1429-38.
ROCCARO, A. M., HIDESHIMA, T., RAJE, N., KUMAR, S., ISHITSUKA, K., YASUI,
H., SHIRAISHI, N., RIBATTI, D., NICO, B., VACCA, A., DAMMACCO, F.,
RICHARDSON, P. G. & ANDERSON, K. C. 2006. Bortezomib mediates
antiangiogenesis in multiple myeloma via direct and indirect effects on endothelial
cells. Cancer Res, 66, 184-91.
ROCK, K. L., GRAMM, C., ROTHSTEIN, L., CLARK, K., STEIN, R., DICK, L.,
HWANG, D. & GOLDBERG, A. L. 1994. Inhibitors of the proteasome block the
degradation of most cell proteins and the generation of peptides presented on MHC
class I molecules. Cell, 78, 761-71.
ROMBOUTS, W. J., BLOKLAND, I., LOWENBERG, B. & PLOEMACHER, R. E. 2000.
Biological characteristics and prognosis of adult acute myeloid leukemia with
internal tandem duplications in the Flt3 gene. Leukemia, 14, 675-83.
RORTH, P., SZABO, K. & TEXIDO, G. 2000. The level of C/EBP protein is critical for
cell migration during Drosophila oogenesis and is tightly controlled by regulated
degradation. Mol Cell, 6, 23-30.
ROSENWALD, I. B., RHOADS, D. B., CALLANAN, L. D., ISSELBACHER, K. J. &
SCHMIDT, E. V. 1993. Increased expression of eukaryotic translation initiation
factors eIF-4E and eIF-2 alpha in response to growth induction by c-myc.
Proceedings of the National Academy of Sciences of the United States of America,
90, 6175-6178.
192 ROSS, S. E., RADOMSKA, H. S., WU, B., ZHANG, P., WINNAY, J. N., BAJNOK, L.,
WRIGHT, W. S., SCHAUFELE, F., TENEN, D. G. & MACDOUGALD, O. A.
2004. Phosphorylation of C/EBPalpha inhibits granulopoiesis. Mol Cell Biol, 24,
675-86.
SALOME, M., CAMPOS, J. & KEESHAN, K. 2015. TRIB2 and the ubiquitin proteasome
system in cancer. Biochem Soc Trans, 43, 1089-94.
SALVESTRINI, V., ZINI, R., ROSSI, L., GULINELLI, S., MANFREDINI, R.,
BIANCHI, E., PIACIBELLO, W., CAIONE, L., MIGLIARDI, G., RICCIARDI,
M. R., TAFURI, A., ROMANO, M., SALATI, S., DI VIRGILIO, F., FERRARI,
S., BACCARANI, M., FERRARI, D. & LEMOLI, R. M. 2012. Purinergic
signaling inhibits human acute myeloblastic leukemia cell proliferation, migration,
and engraftment in immunodeficient mice. Blood, 119, 217-26.
SANCHEZ, P. V., PERRY, R. L., SARRY, J. E., PERL, A. E., MURPHY, K., SWIDER,
C. R., BAGG, A., CHOI, J. K., BIEGEL, J. A., DANET-DESNOYERS, G. &
CARROLL, M. 2009. A robust xenotransplantation model for acute myeloid
leukemia. Leukemia, 23, 2109-17.
SANDA, T., LAWTON, L. N., BARRASA, M. I., FAN, Z. P., KOHLHAMMER, H.,
GUTIERREZ, A., MA, W., TATAREK, J., AHN, Y., KELLIHER, M. A.,
JAMIESON, C. H., STAUDT, L. M., YOUNG, R. A. & LOOK, A. T. 2012. Core
transcriptional regulatory circuit controlled by the TAL1 complex in human T cell
acute lymphoblastic leukemia. Cancer Cell, 22, 209-21.
SARRY, J.-E., MURPHY, K., PERRY, R., SANCHEZ, P. V., SECRETO, A., KEEFER,
C., SWIDER, C. R., STRZELECKI, A.-C., CAVELIER, C., XE, CHER, C.,
MANSAT-DE MAS, V., XE, RONIQUE, DELABESSE, E., DANET-
DESNOYERS, G. & CARROLL, M. 2011. Human acute myelogenous leukemia
stem cells are rare and heterogeneous when assayed in NOD/SCID/IL2Rγc-
deficient mice. The Journal of Clinical Investigation, 121, 384-395.
SCHMITTGEN, T. D. & LIVAK, K. J. 2008. Analyzing real-time PCR data by the
comparative C(T) method. Nat Protoc, 3, 1101-8.
SCHNITTGER, S., SCHOCH, C., KERN, W., MECUCCI, C., TSCHULIK, C.,
MARTELLI, M. F., HAFERLACH, T., HIDDEMANN, W. & FALINI, B. 2005.
Nucleophosmin gene mutations are predictors of favorable prognosis in acute
myelogenous leukemia with a normal karyotype. Blood, 106, 3733-9.
SCHUELER, J., WIDER, D., KLINGNER, K., SIEGERS, G. M., MAY, A. M., WASCH,
R., FIEBIG, H. H. & ENGELHARDT, M. 2013. Intratibial injection of human
multiple myeloma cells in NOD/SCID IL-2Rgamma(null) mice mimics human
myeloma and serves as a valuable tool for the development of anticancer strategies.
PLoS One, 8, e79939.
SCOTT, L. M., CIVIN, C. I., RORTH, P. & FRIEDMAN, A. D. 1992. A novel temporal
expression pattern of three C/EBP family members in differentiating
myelomonocytic cells. Blood, 80, 1725-35.
SEHER, T. C. & LEPTIN, M. 2000. Tribbles, a cell-cycle brake that coordinates
proliferation and morphogenesis during Drosophila gastrulation. Current Biology,
10, 623-629.
SHEAFF, R. J., SINGER, J. D., SWANGER, J., SMITHERMAN, M., ROBERTS, J. M. &
CLURMAN, B. E. 2000. Proteasomal turnover of p21Cip1 does not require
p21Cip1 ubiquitination. Mol Cell, 5, 403-10.
SHIVAROV, V., GUEORGUIEVA, R., STOIMENOV, A. & TIU, R. 2013. DNMT3A
mutation is a poor prognosis biomarker in AML: Results of a meta-analysis of 4500
AML patients. Leukemia Research, 37, 1445-1450.
SHULTZ, L. D., LYONS, B. L., BURZENSKI, L. M., GOTT, B., CHEN, X., CHALEFF,
S., KOTB, M., GILLIES, S. D., KING, M., MANGADA, J., GREINER, D. L. &
HANDGRETINGER, R. 2005. Human lymphoid and myeloid cell development in
193
NOD/LtSz-scid IL2R gamma null mice engrafted with mobilized human
hemopoietic stem cells. J Immunol, 174, 6477-89.
SIJTS, E. J. & KLOETZEL, P. M. 2011. The role of the proteasome in the generation of
MHC class I ligands and immune responses. Cell Mol Life Sci, 68, 1491-502.
SMITH, M., BARNETT, M., BASSAN, R., GATTA, G., TONDINI, C. & KERN, W.
2004. Adult acute myeloid leukaemia. Crit Rev Oncol Hematol, 50, 197-222.
SOLE, F., LUNO, E., SANZO, C., ESPINET, B., SANZ, G. F., CERVERA, J.,
CALASANZ, M. J., CIGUDOSA, J. C., MILLA, F., RIBERA, J. M., BUREO, E.,
MARQUEZ, M. L., ARRANZ, E. & FLORENSA, L. 2005. Identification of novel
cytogenetic markers with prognostic significance in a series of 968 patients with
primary myelodysplastic syndromes. Haematologica, 90, 1168-78.
SPANGRUDE, G. J., HEIMFELD, S. & WEISSMAN, I. L. 1988. Purification and
characterization of mouse hematopoietic stem cells. Science, 241, 58-62.
SPECK, N. A. & GILLILAND, D. G. 2002. Core-binding factors in haematopoiesis and
leukaemia. Nat Rev Cancer, 2, 502-513.
STAPNES, C., DOSKELAND, A. P., HATFIELD, K., ERSVAER, E., RYNINGEN, A.,
LORENS, J. B., GJERTSEN, B. T. & BRUSERUD, O. 2007. The proteasome
inhibitors bortezomib and PR-171 have antiproliferative and proapoptotic effects
on primary human acute myeloid leukaemia cells. Br J Haematol, 136, 814-28.
STOHWASSER, R., STANDERA, S., PETERS, I., KLOETZEL, P. M. & GROETTRUP,
M. 1997. Molecular cloning of the mouse proteasome subunits MC14 and MECL-
1: reciprocally regulated tissue expression of interferon-gamma-modulated
proteasome subunits. Eur J Immunol, 27, 1182-7.
STRAHL, B. D. & ALLIS, C. D. 2000. The language of covalent histone modifications.
Nature, 403, 41-45.
SUGIMOTO, K., TOYOSHIMA, H., SAKAI, R., MIYAGAWA, K., HAGIWARA, K.,
ISHIKAWA, F., TAKAKU, F., YAZAKI, Y. & HIRAI, H. 1992. Frequent
mutations in the p53 gene in human myeloid leukemia cell lines. Blood, 79, 2378-
83.
SUNDSTRÖM, C. & NILSSON, K. 1976. Establishment and characterization of a human
histiocytic lymphoma cell line (U-937). International Journal of Cancer, 17, 565-
577.
TALLMAN, M. S., GILLILAND, D. G. & ROWE, J. M. 2005. Drug therapy for acute
myeloid leukemia. Blood, 106, 1154-63.
TALLMANN, M. S. 2004. Curative therapeutic approaches to APL. Ann Hematol, 83
Suppl 1, S81-2.
TANNER, S. M., AUSTIN, J. L., LEONE, G., RUSH, L. J., PLASS, C., HEINONEN, K.,
MROZEK, K., SILL, H., KNUUTILA, S., KOLITZ, J. E., ARCHER, K. J.,
CALIGIURI, M. A., BLOOMFIELD, C. D. & DE LA CHAPELLE, A. 2001.
BAALC, the human member of a novel mammalian neuroectoderm gene lineage, is
implicated in hematopoiesis and acute leukemia. Proc Natl Acad Sci U S A, 98,
13901-6.
TASKESEN, E., BULLINGER, L., CORBACIOGLU, A., SANDERS, M. A.,
ERPELINCK, C. A., WOUTERS, B. J., VAN DER POEL-VAN DE
LUYTGAARDE, S. C., DAMM, F., KRAUTER, J., GANSER, A., SCHLENK, R.
F., LOWENBERG, B., DELWEL, R., DOHNER, H., VALK, P. J. & DOHNER, K.
2011. Prognostic impact, concurrent genetic mutations, and gene expression
features of AML with CEBPA mutations in a cohort of 1182 cytogenetically
normal AML patients: further evidence for CEBPA double mutant AML as a
distinctive disease entity. Blood, 117, 2469-75.
TEE, W. W. 2010. Prmt5 is essential for early mouse development and acts in the
cytoplasm to maintain ES cell pluripotency. Genes Dev., 24, 2772-2777.
194 TENEN, D. G., HROMAS, R., LICHT, J. D. & ZHANG, D. E. 1997. Transcription
factors, normal myeloid development, and leukemia. Blood, 90, 489-519.
THIEDE, C. 2012. Impact of mutational analysis in acute myeloid leukemia. Haematology
Education: the education programme for the annual congress of the European
Haematology Association, 6, 33-40.
THIEDE, C., KOCH, S., CREUTZIG, E., STEUDEL, C., ILLMER, T., SCHAICH, M. &
EHNINGER, G. 2006. Prevalence and prognostic impact of NPM1 mutations in
1485 adult patients with acute myeloid leukemia (AML). Blood, 107, 4011-20.
THIEDE, C., STEUDEL, C., MOHR, B., SCHAICH, M., SCHAKEL, U.,
PLATZBECKER, U., WERMKE, M., BORNHAUSER, M., RITTER, M.,
NEUBAUER, A., EHNINGER, G. & ILLMER, T. 2002. Analysis of FLT3-
activating mutations in 979 patients with acute myelogenous leukemia: association
with FAB subtypes and identification of subgroups with poor prognosis. Blood, 99,
4326-35.
THROWER, J. S., HOFFMAN, L., RECHSTEINER, M. & PICKART, C. M. 2000.
Recognition of the polyubiquitin proteolytic signal. Embo j, 19, 94-102.
TILL, J. E. & MCCULLOCH, E. A. 1961. A Direct Measurement of the Radiation
Sensitivity of Normal Mouse Bone Marrow Cells. Radiation Research, 14, 213-
222.
TIMCHENKO, N. A., WILDE, M., NAKANISHI, M., SMITH, J. R. & DARLINGTON,
G. J. 1996. CCAAT/enhancer-binding protein alpha (C/EBP alpha) inhibits cell
proliferation through the p21 (WAF-1/CIP-1/SDI-1) protein. Genes Dev, 10, 804-
15.
TOYOSHIMA, H. & HUNTER, T. 1994. p27, a novel inhibitor of G1 cyclin-Cdk protein
kinase activity, is related to p21. Cell, 78, 67-74.
ULJON, S., XU, X., DURZYNSKA, I., STEIN, S., ADELMANT, G., MARTO, J. A.,
PEAR, W. S. & BLACKLOW, S. C. 2016. Structural Basis for Substrate
Selectivity of the E3 Ligase COP1. Structure, 24, 687-96.
VALK, P. J., VERHAAK, R. G., BEIJEN, M. A., ERPELINCK, C. A., BARJESTEH
VAN WAALWIJK VAN DOORN-KHOSROVANI, S., BOER, J. M.,
BEVERLOO, H. B., MOORHOUSE, M. J., VAN DER SPEK, P. J.,
LOWENBERG, B. & DELWEL, R. 2004. Prognostically useful gene-expression
profiles in acute myeloid leukemia. N Engl J Med, 350, 1617-28.
VARDIMAN, J. W., THIELE, J., ARBER, D. A., BRUNNING, R. D., BOROWITZ, M.
J., PORWIT, A., HARRIS, N. L., LE BEAU, M. M., HELLSTROM-LINDBERG,
E., TEFFERI, A. & BLOOMFIELD, C. D. 2009. The 2008 revision of the World
Health Organization (WHO) classification of myeloid neoplasms and acute
leukemia: rationale and important changes. Blood, 114, 937-51.
VASSILEV, L. T., VU, B. T., GRAVES, B., CARVAJAL, D., PODLASKI, F.,
FILIPOVIC, Z., KONG, N., KAMMLOTT, U., LUKACS, C., KLEIN, C.,
FOTOUHI, N. & LIU, E. A. 2004. In vivo activation of the p53 pathway by small-
molecule antagonists of MDM2. Science, 303, 844-8.
VELDERS, G. A., VAN OS, R., HAGOORT, H., VERZAAL, P., GUIOT, H. F.,
LINDLEY, I. J., WILLEMZE, R., OPDENAKKER, G. & FIBBE, W. E. 2004.
Reduced stem cell mobilization in mice receiving antibiotic modulation of the
intestinal flora: involvement of endotoxins as cofactors in mobilization. Blood, 103,
340-6.
VIJ, R., WANG, M., KAUFMAN, J. L., LONIAL, S., JAKUBOWIAK, A. J., STEWART,
A. K., KUKRETI, V., JAGANNATH, S., MCDONAGH, K. T., ALSINA, M.,
BAHLIS, N. J., REU, F. J., GABRAIL, N. Y., BELCH, A., MATOUS, J. V., LEE,
P., ROSEN, P., SEBAG, M., VESOLE, D. H., KUNKEL, L. A., WEAR, S. M.,
WONG, A. F., ORLOWSKI, R. Z. & SIEGEL, D. S. 2012. An open-label, single-
195
arm, phase 2 (PX-171-004) study of single-agent carfilzomib in bortezomib-naive
patients with relapsed and/or refractory multiple myeloma. Blood, 119, 5661-70.
VON BONIN, M., WERMKE, M., COSGUN, K. N., THIEDE, C., BORNHAUSER, M.,
WAGEMAKER, G. & WASKOW, C. 2013. In vivo expansion of co-transplanted
T cells impacts on tumor re-initiating activity of human acute myeloid leukemia in
NSG mice. PLoS One, 8, e60680.
WALKER, A. & MARCUCCI, G. 2012. Molecular prognostic factors in cytogenetically
normal acute myeloid leukemia. Expert Rev Hematol, 5, 547-58.
WALTER, R. B., APPELBAUM, F. R., ESTEY, E. H. & BERNSTEIN, I. D. 2012. Acute
myeloid leukemia stem cells and CD33-targeted immunotherapy. Blood, 119, 6198-
208.
WANG, J., PARK, J. S., WEI, Y., RAJURKAR, M., COTTON, J. L., FAN, Q., LEWIS,
B. C., JI, H. & MAO, J. 2013a. TRIB2 acts downstream of Wnt/TCF in liver cancer
cells to regulate YAP and C/EBPalpha function. Mol Cell, 51, 211-25.
WANG, J., ZHANG, Y., WENG, W., QIAO, Y., MA, L., XIAO, W., YU, Y., PAN, Q. &
SUN, F. 2013b. Impaired phosphorylation and ubiquitination by p70 S6 kinase
(p70S6K) and Smad ubiquitination regulatory factor 1 (Smurf1) promote tribbles
homolog 2 (TRIB2) stability and carcinogenic property in liver cancer. J Biol
Chem, 288, 33667-81.
WANG, L., PAL, S. & SIF, S. 2008. Protein arginine methyltransferase 5 suppresses the
transcription of the RB family of tumor suppressors in leukemia and lymphoma
cells. Mol Cell Biol, 28, 6262-77.
WANG, N. D., FINEGOLD, M. J., BRADLEY, A., OU, C. N., ABDELSAYED, S. V.,
WILDE, M. D., TAYLOR, L. R., WILSON, D. R. & DARLINGTON, G. J. 1995.
Impaired energy homeostasis in C/EBP alpha knockout mice. Science, 269, 1108-
12.
WANG, P. Y., SUN, Y. X., ZHANG, S., PANG, M., ZHANG, H. H., GAO, S. Y.,
ZHANG, C., LV, C. J. & XIE, S. Y. 2013c. Let-7c inhibits A549 cell proliferation
through oncogenic TRIB2 related factors. FEBS Lett, 587, 2675-81.
WATKINS, P. J., CONDREAY, J. P., HUBER, B. E., JACOBS, S. J. & ADAMS, D. J.
1996. Impaired proliferation and tumorigenicity induced by CCAAT/enhancer-
binding protein. Cancer Res, 56, 1063-7.
WEI, H., WANG, B., MIYAGI, M., SHE, Y., GOPALAN, B., HUANG, D. B., GHOSH,
G., STARK, G. R. & LU, T. 2013. PRMT5 dimethylates R30 of the p65 subunit to
activate NF-kappaB. Proc Natl Acad Sci U S A, 110, 13516-21.
WEI, T. Y., JUAN, C. C., HISA, J. Y., SU, L. J., LEE, Y. C., CHOU, H. Y., CHEN, J. M.,
WU, Y. C., CHIU, S. C., HSU, C. P., LIU, K. L. & YU, C. T. 2012. Protein
arginine methyltransferase 5 is a potential oncoprotein that upregulates G1
cyclins/cyclin-dependent kinases and the phosphoinositide 3-kinase/AKT signaling
cascade. Cancer Sci, 103, 1640-50.
WEIMANN, M., GROSSMANN, A., WOODSMITH, J., OZKAN, Z., BIRTH, P.,
MEIERHOFER, D., BENLASFER, N., VALOVKA, T., TIMMERMANN, B.,
WANKER, E. E., SAUER, S. & STELZL, U. 2013. A Y2H-seq approach defines
the human protein methyltransferase interactome. Nat Meth, 10, 339-342.
WEISSMAN, I. L. 2000. Translating stem and progenitor cell biology to the clinic:
barriers and opportunities. Science, 287, 1442-6.
WHITMAN, S. P., RUPPERT, A. S., RADMACHER, M. D., MROZEK, K., PASCHKA,
P., LANGER, C., BALDUS, C. D., WEN, J., RACKE, F., POWELL, B. L.,
KOLITZ, J. E., LARSON, R. A., CALIGIURI, M. A., MARCUCCI, G. &
BLOOMFIELD, C. D. 2008. FLT3 D835/I836 mutations are associated with poor
disease-free survival and a distinct gene-expression signature among younger
adults with de novo cytogenetically normal acute myeloid leukemia lacking FLT3
internal tandem duplications. Blood, 111, 1552-9.
196 WILKIN, F., SAVONET, V., RADULESCU, A., PETERMANS, J., DUMONT, J. E. &
MAENHAUT, C. 1996. Identification and characterization of novel genes
modulated in the thyroid of dogs treated with methimazole and propylthiouracil. J
Biol Chem, 271, 28451-7.
WILKIN, F., SUAREZ-HUERTA, N., ROBAYE, B., PEETERMANS, J., LIBERT, F.,
DUMONT, J. E. & MAENHAUT, C. 1997. Characterization of a phosphoprotein
whose mRNA is regulated by the mitogenic pathways in dog thyroid cells. Eur J
Biochem, 248, 660-8.
WOUTERS, B. J., JORDÀ, M. A., KEESHAN, K., LOUWERS, I., ERPELINCK-
VERSCHUEREN, C. A. J., TIELEMANS, D., LANGERAK, A. W., HE, Y.,
YASHIRO-OHTANI, Y., ZHANG, P., HETHERINGTON, C. J., VERHAAK, R.
G. W., VALK, P. J. M., LÖWENBERG, B., TENEN, D. G., PEAR, W. S. &
DELWEL, R. 2007. Distinct gene expression profiles of acute myeloid/T-lymphoid
leukemia with silenced CEBPA and mutations in NOTCH1. Blood, 110, 3706-
3714.
WOUTERS, B. J., LOWENBERG, B., ERPELINCK-VERSCHUEREN, C. A., VAN
PUTTEN, W. L., VALK, P. J. & DELWEL, R. 2009. Double CEBPA mutations,
but not single CEBPA mutations, define a subgroup of acute myeloid leukemia
with a distinctive gene expression profile that is uniquely associated with a
favorable outcome. Blood, 113, 3088-91.
XIE, H. & ORKIN, S. H. 2007. Immunology: Changed destiny. Nature, 449, 410-411.
XIE, H., YE, M., FENG, R. & GRAF, T. 2004. Stepwise reprogramming of B cells into
macrophages. Cell, 117, 663-76.
XU, S., TONG, M., HUANG, J., ZHANG, Y., QIAO, Y., WENG, W., LIU, W., WANG,
J. & SUN, F. 2014. TRIB2 inhibits Wnt/beta-Catenin/TCF4 signaling through its
associated ubiquitin E3 ligases, beta-TrCP, COP1 and Smurf1, in liver cancer cells.
FEBS Lett, 588, 4334-41.
YEUNG, M. C. & LAU, A. S. 1998. Tumor suppressor p53 as a component of the tumor
necrosis factor-induced, protein kinase PKR-mediated apoptotic pathway in human
promonocytic U937 cells. J Biol Chem, 273, 25198-202.
YING, M., ZHOU, X., ZHONG, L., LIN, N., JING, H., LUO, P., YANG, X., SONG, H.,
YANG, B. & HE, Q. 2013. Bortezomib sensitizes human acute myeloid leukemia
cells to all-trans-retinoic acid-induced differentiation by modifying the
RARalpha/STAT1 axis. Mol Cancer Ther, 12, 195-206.
YOKOYAMA, T., KANNO, Y., YAMAZAKI, Y., TAKAHARA, T., MIYATA, S. &
NAKAMURA, T. 2010. Trib1 links the MEK1/ERK pathway in myeloid
leukemogenesis. Blood, 116, 2768-75.
YOKOYAMA, T. & NAKAMURA, T. 2011. Tribbles in disease: Signaling pathways
important for cellular function and neoplastic transformation. Cancer Sci, 102,
1115-22.
YOSHIDA, A., KATO, J. Y., NAKAMAE, I. & YONEDA-KATO, N. 2013. COP1 targets
C/EBPalpha for degradation and induces acute myeloid leukemia via Trib1. Blood,
122, 1750-60.
YU, J. C., DING, S. L., CHANG, C. H., KUO, S. H., CHEN, S. T., HSU, G. C., HSU, H.
M., HOU, M. F., JUNG, L. Y., CHENG, C. W., WU, P. E. & SHEN, C. Y. 2009.
Genetic susceptibility to the development and progression of breast cancer
associated with polymorphism of cell cycle and ubiquitin ligase genes.
Carcinogenesis, 30, 1562-70.
ZANELLA, F., RENNER, O., GARCIA, B., CALLEJAS, S., DOPAZO, A.,
PEREGRINA, S., CARNERO, A. & LINK, W. 2010. Human TRIB2 is a repressor
of FOXO that contributes to the malignant phenotype of melanoma cells.
Oncogene, 29, 2973-82.
197 ZHANG, C., CHI, Y. L., WANG, P. Y., WANG, Y. Q., ZHANG, Y. X., DENG, J., LV, C.
J. & XIE, S. Y. 2012. miR-511 and miR-1297 inhibit human lung adenocarcinoma
cell proliferation by targeting oncogene TRIB2. PLoS One, 7, e46090.
ZHANG, D. E., ZHANG, P., WANG, N. D., HETHERINGTON, C. J., DARLINGTON,
G. J. & TENEN, D. G. 1997. Absence of granulocyte colony-stimulating factor
signaling and neutrophil development in CCAAT enhancer binding protein alpha-
deficient mice. Proc Natl Acad Sci U S A, 94, 569-74.
ZHANG, H. G., WANG, J., YANG, X., HSU, H. C. & MOUNTZ, J. D. 2004a. Regulation
of apoptosis proteins in cancer cells by ubiquitin. Oncogene, 23, 2009-15.
ZHANG, L., LI, X., KE, Z., HUANG, L., LIANG, Y., WU, J., ZHANG, X., CHEN, Y.,
ZHANG, H. & LUO, X. 2013. MiR-99a may serve as a potential oncogene in
pediatric myeloid leukemia. Cancer Cell International, 13, 1-11.
ZHANG, L., YANG, W., HUBBARD, A. E. & SMITH, M. T. 2005. Nonrandom
aneuploidy of chromosomes 1, 5, 6, 7, 8, 9, 11, 12, and 21 induced by the benzene
metabolites hydroquinone and benzenetriol. Environ Mol Mutagen, 45, 388-96.
ZHANG, P., IWASAKI-ARAI, J., IWASAKI, H., FENYUS, M. L., DAYARAM, T.,
OWENS, B. M., SHIGEMATSU, H., LEVANTINI, E., HUETTNER, C. S.,
LEKSTROM-HIMES, J. A., AKASHI, K. & TENEN, D. G. 2004b. Enhancement
of hematopoietic stem cell repopulating capacity and self-renewal in the absence of
the transcription factor C/EBP alpha. Immunity, 21, 853-63.
ZHAO, Q., RANK, G., TAN, Y. T., LI, H., MORITZ, R. L., SIMPSON, R. J., CERRUTI,
L., CURTIS, D. J., PATEL, D. J., ALLIS, C. D., CUNNINGHAM, J. M. & JANE,
S. M. 2009. PRMT5-mediated methylation of histone H4R3 recruits DNMT3A,
coupling histone and DNA methylation in gene silencing. Nat Struct Mol Biol, 16,
304-311.
ZHOU, Z., SUN, X., ZOU, Z., SUN, L., ZHANG, T., GUO, S., WEN, Y., LIU, L.,
WANG, Y., QIN, J., LI, L., GONG, W. & BAO, S. 2010. PRMT5 regulates Golgi
apparatus structure through methylation of the golgin GM130. Cell Res, 20, 1023-
1033.