Embed Size (px)
Citation preview
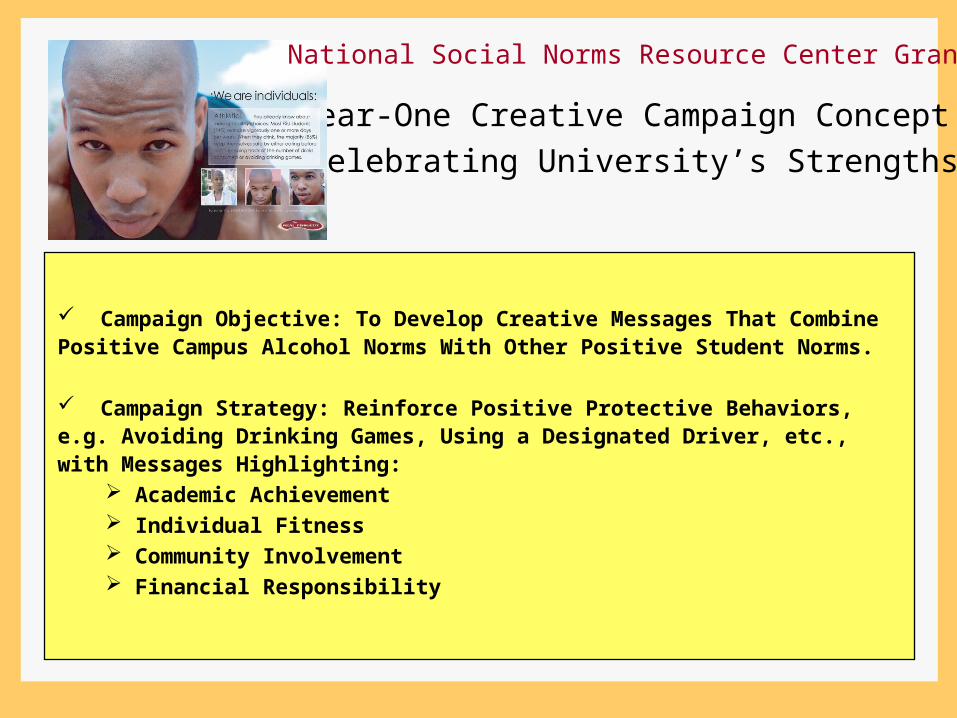
Campaign Objective: To Develop Creative Messages That Combine Positive Campus Alcohol Norms With Other Positive Student Norms.
Campaign Strategy: Reinforce Positive Protective Behaviors, e.g. Avoiding Drinking Games, Using a Designated Driver, etc., with Messages Highlighting:
Academic Achievement Individual Fitness Community Involvement Financial Responsibility
Year-One Creative Campaign Concept:“Celebrating University’s Strengths”
National Social Norms Resource Center Grant

Campaign Objective: To Develop Creative Messages That Highlight the 0-4 Drinking Norm in a Tone That is Fun, Energetic, and ‘In Your Face’
Campaign Strategy: Highlight Non-Offensive Stereotypes of FSU Students Challenge Audience to Reconsider Their Opinion of a ‘Typical Student’ Reinforce Norm That ‘Typical Students’ have 0-4 Drinks When They Party Reinforce Positive Protective Behaviors, e.g. Avoiding Drinking Games, Using a Designated Driver, etc.
Year-Two Creative Campaign Concept:“Typical Student”
National Social Norms Resource Center Grant

Campaign Objective: Use Humor to Highlight Student Drinking Norms in a Tone That Acknowledges Student Skepticism About Campaign Statistics
Campaign Strategy: Provide Subtle Reasons Why Campaign Statistics Are Credible Reinforce Norm That Most Students Have 4 or Fewer Drinks When They Party or Do Not Drink At All Reinforce Positive Protective Behaviors, e.g. Avoiding Drinking Games, Using a Designated Driver, etc.
Year-Three Creative Campaign Concept:“Skeptical Bubble”
National Social Norms Resource Center Grant

High-Risk Drinking Rates 2002-2004
50.60%
46.30%43.60%
20.00%
40.00%
60.00%
NCH A Criteria
2002
2003
2004
N = 1,350 (2002); N = 1,572 (2003); N = 1,322 (2004)
13.8% Change02 - 04
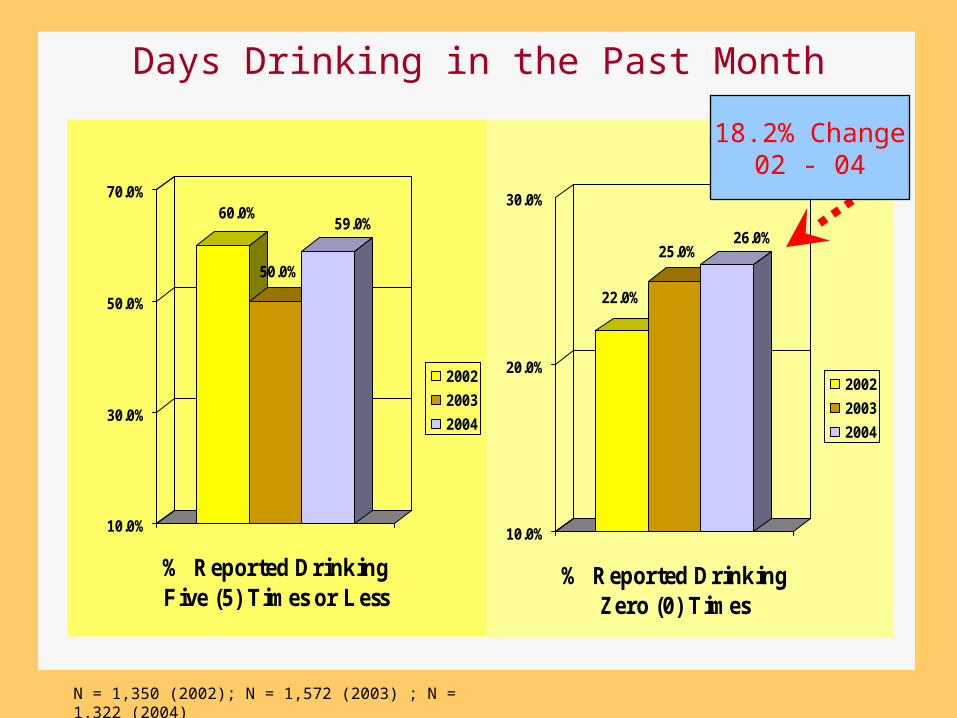
Days Drinking in the Past Month
N = 1,350 (2002); N = 1,572 (2003) ; N = 1,322 (2004)
60.0%
50.0%
59.0%
10.0%
30.0%
50.0%
70.0%
% Reported Drinking Five (5) Times or Less
2002
2003
2004
22.0%
25.0%26.0%
10.0%
20.0%
30.0%
% Reported DrinkingZero (0) Times
2002
2003
2004
18.2% Change02 - 04

N = 1,350 (2002); N = 1,572 (2003); N = 1,322 (2004)
High-Risk Drinking in the Past 2 Weeks
46.0%
43.0%42.0%
20.0%
30.0%
40.0%
50.0%
% Reported At Least One (1)Episode of High-Risk Drinking
2002
2003
2004

N = 1,350 (2002); N = 1,572 (2003); N = 1,322 (2004)
Driving After High-Risk Drinking
83.0% 84.0%
86.0%
20.0%
40.0%
60.0%
80.0%
100.0%
% Reported They Did Not DriveAfter Having 5 or More Drinks In
One Sitting
2002
2003
2004

N = 1,350 (2002); N = 1,572 (2003); N = 1,322 (2004)
Protective Behaviors
Protective behaviors include such things as pacing drinks to 1 or fewer per hour, avoiding
drinking games, determining in advance not to exceed a certain number of drinks, etc.
81.0% 79.0%
92.0%
20.0%
40.0%
60.0%
80.0%
100.0%
% R eported They Alw ays or Usually Engage in at Least O ne Protective
Behavior W hen Drinking
2002
2003
2004

0%10%20%30%40%50%60%70%
Use D
esig
nated
Driver
Eat
Before
hand
Keep T
rack
of Drin
ks
Avoid
Drin
king
Games
Protective Behaviors
Per
cen
t o
f S
tud
ents
2002
2003
2004
Use of Protective Behaviors 2002-2004

‘Number Drinks Consumed ‘Last Time Partied/Socialized’
National Social Norms Resource Center Grant2002 – 2004 NCHA Survey Results
26.2
67.3
1.0 1.10.9
24.2
31.6
74.872.8
0
10
20
30
4050
60
70
80
2002:Zero
2003:Zero
2004:Zero
2002:1-4
2003:1-4
2004:1-4
2002:5+
2003:5+
2004:5+
17.3 20.9 20.9
32.1 33.435.5
50.645.7 43.6
0
10
20
30
40
50
60
2002:
Zero
2003:
Zero
2004:
Zero
2002:
1-4
2003:
1-4
2004:
1-4
2002:
5+
2003:
5+
2004:
5+
Actual Perceived
N = 1,350 (2002); N = 1,572 (2003); N = 1,322 (2004)


![POSITIVE PARENTING CAMPAIGN - rrfss.calrussell/resources/datadictionaries/Positiv… · Web view[If “yes” to word of mouth] You mentioned you learned about [fill campaign name]](https://img.pdfslide.us/doc/110x75/5b993ace09d3f207308b5566/positive-parenting-campaign-rrfssca-lrussellresourcesdatadictionariespositiv.jpg)