Embed Size (px)
Citation preview
UNIVERSITY OFCAMBRIDGE
Cambridge Working Papers in Economics
Was Brazil’s recent growth acceleration the
world’s most overrated boom?
José Gabriel Palma
CWPE 1248
Was Brazil’s recent growth acceleration the world’s most overrated boom?
(Or, never in the field of economics has so much euphoria been generated by so few accomplishments)
José Gabriel Palma
Cambridge Working Papers in Economics (CWPE) 1248 Available at http://www.econ.cam.ac.uk/dae/repec/cam/pdf/cwpe1248.pdf
ABSTRACT
As soon as international financial markets felt reassured in 2003 by the surprisingly neo-liberal orientation of President Lula’s government, the ‘spot-the-new-Latin-tiger’ financial brigade became dazzled by Brazil — they just couldn’t have enough of it. So much so, that they had little difficulty in turning a blind eye to the obvious fact that (except for several commodities, finance, and a small number of other activities) Brazil’s economic performance since the beginning of neo-liberal reforms (c.1990) had been remarkably poor. This not only contrasted with its own performance pre-1980, but also with what was happening in Asia. I shall argue that the weakness of the new neo-liberal paradigm is rooted as much in its intrinsic flaws as in the particular way it was implemented. As in the rest of Latin America, Brazil’s economic reforms were undertaken primarily as a result of its perceived economic weaknesses — i.e., there was an attitude of ‘throwing in the towel’ vis-à-vis the previous state-led import substituting industrialisation strategy, because most politicians and economists interpreted the 1982 debt crisis as conclusive evidence that it had led the region into a cul-de-sac. As Hirschman has argued, policy-making has a strong component of ‘path-dependency’; as a result, people often stick with policies after they have achieved their aims, and those policies have become counterproductive. This leads to such frustration and disappointment with existing policies and institutions that is not uncommon to lead to a ‘rebound effect’. An extreme example of this phenomenon is post-1982 Latin America, where the core of the discourse that followed ended up simply emphasising the need to reverse as many aspects of the previous development strategy as possible. This helps to explain the peculiar set of priorities, the rigidity and the messianic attitude with which the reforms were implemented in Brazil, as well as their poor outcome. As the then President of Brazil’s Central Bank explained at the time, their main task was “...to undo forty years of stupidity.” With this ‘reverse-gear’ attitude, this experiment in economic reform almost inevitably ended up as an exercise in ‘not-very-creative-destruction’ — especially vis-à-vis its manufacturing industry. Something very different happened in Asia, where economic reforms were often intended (rightly or wrongly) as a more targeted and pragmatic mechanism to overcome specific economic and financial constraints. Instead of implementing reforms as a mechanism to reverse existing industrialisation strategies, in Asia they were put into practice in order to continue and strengthen ambitious processes of industrialisation. Although the Brazilian economy has been unable to deliver sustainable productivity-growth since the beginning of economic reforms (just a few short growth-dashes), Brazilian-style neo-liberal capitalism became unrivalled when it came to offering world-class commodities, an abundance of precarious (mostly service) jobs, stylish retail, extremely lucrative finance, and the ‘purity of beliefs.’ Key words: Ideology, Neo-liberalism, Productivity, Employment, Investment, Income
distribution, Premature De-industrialisation, ‘middle-income trap’, financialisation.
JEL classifications: B52, D31, E20, F13, F59, H54, J20, L50, N16, N36, O16, O40, P50
A shortened version of this paper will be published in C. Pitelis (ed.), The BRICs and Beyond, Cambridge University Press.
2
"Brazil: the country of the future — and it will always be!"
Brazilian saying
“Lula knows how to please the élite.”
Former Brazilian President
“Domination is more effective if it delegates the violence on which it rests to the dominated.”
“Today the appeal to newness, of no matter what kind, provided only that it is archaic enough, has become universal.”
Theodor Adorno
“[Latin America has] a narcissistic tendency to use reality as a mirror for self-contemplation. [... It also has] too many self-satisfied citizens.
[... Yet] human history is the product of discontent.”
José Ortega y Gasset
“The real purpose of socialism is to overcome and advance beyond the predatory phase of human development.”
Albert Einstein
“People usually prefer to fail through conventional means rather than to succeed through unconventional ones.”
John M Keynes
Introduction1
Except for several commodities, finance, and a small number of other activities, Brazil’s (and Latin America’s) economic performance since the beginning of neo-liberal reforms (c. 1990) has been poor — and in manufacturing, extremely poor. This not only contrasts with its own performance pre-1980, but also with what has happened in Asia during this period. I shall argue that the weakness of the region’s new paradigm is rooted as much in its intrinsic flaws as in the particular way it has been implemented. Keynes once said (discussing Say’s Law) that Ricardo conquered England as completely as the Holy Inquisition conquered Spain; the same could be said for neo-liberalism in Latin America: it has conquered the region, including many in its left-wing intelligentsia, as completely (and fiercely) as the Inquisition conquered Spain. This process has been so successful that it has actually had the effect of ‘closing the imagination’ to conceptualising alternatives.
1 This paper builds on previous work (Palma, 2006, and 2010). I would like to thank Paulo Arantes, Stephanie Blankenburg, Antonio David, Jonathan DiJohn, Jorge Fiori, José Luis Fiori, Juliano Fiori, Samer Frangie, Gaspar González, Daniel Hahn, Geoff Harcourt, Jorge Katz, Richard Kozul-Wright, Juan Carlos Moreno-Brid, Guillermo Paraje, Carlota Pérez, Christos Pitelis, Alicia Puyana, Kirsten Sehnbruch, Ignês Sodré, Lance Taylor, Luiz Carlos Bresser-Pereira, Paulo Gala, Nelson Marconi and other friends at the ‘GV’ in São Paulo, participants at two events at the Judge Business School, and my Ph D students at Cambridge (especially the Brazilian ones) for their helpful comments. Participants at several conferences, seminars and courses (such as LAPORDE in São Paulo, and APORDE in Johannesburg) also made helpful suggestions. I am also very grateful to Alice Amsden for the many lively discussions we had on Brazil, before her sudden death; I dedicate this paper to her. The usual caveats apply.
3
In Brazil (and Latin America [LA] in general) the genesis of the new development strategy can be located in a series of negative external and domestic shocks c.1980, when the region was particularly vulnerable. As had happened in the 1930s, these laid the foundations for a radical ideological transformation that led to a new paradigm, this time along the lines of Thatcher’s (Anglo-Saxon-style) neo-liberalism, and Reagan’s US neo-conservatism. This was quite distinct from what was happening in Asia, where reforms were implemented in a much more pragmatic and imaginative way.
Perhaps the key difference between LA and Asia is that in the latter most actors in favour of the reforms (including local capitalist élites, the administrative classes, and most intellectuals — even many in the ‘new’ left) did not have to be convinced that in the real world there are so many distortions, market failures, coordination failures (especially in investment) and financial fragilities that when it came to policy-making the Washington Consensus’s set of ‘first-best’ policies belonged to a fantasy world. And maybe they were also just cynical enough not to get too excited about an ideology (neo-liberalism) that is based mostly on recycled 19th-century ideas wrapped in an ‘end of history’ aura (Frangie and Palma, 2010). So, in Asia one often finds the parallel existence of a seemingly fundamentalistic neo-liberal discourse (to appease the gods of the markets), with a more pragmatic, targeted and sometimes imaginative implementation of reforms. And an ‘irreverent’ pro-growth macro is never far away. In LA, instead, the aim of policy makers (including — and so far especially — those in the ‘new’ left) regarding the neo-liberal orthodoxy is not just the ‘talking the talk’, but the ‘walking the walk’ of that orthodoxy.
In fact, I sometimes wonder whether the unique brand of neo-liberalism bought by so many Latin Americans is just shorthand for ‘nothing left to decide’ — and in the case of the ‘new’ left, of course, ‘nothing left to think about critically’ (Palma, 2009a).2 Indeed, in most of the region the attitude today towards neo-liberal economics, and in particular when it comes to policy-making, resembles Lord Kelvin’s attitude towards physics at the end of the 19th century.3 Then, he famously declared that in physics “there is nothing new to be discovered now. All that remains is more and more precise measurement.” (Kelvin, 1900)
What characterises Brazil’s (and the rest of Latin America’s) economic reforms the most is that they were undertaken primarily as a result of the perceived economic weaknesses of the region — i.e., there was an attitude of ‘throwing in the towel’ vis-à-vis the previous state-led import substituting industrialisation strategy (ISI). Basically, most politicians and economists interpreted the 1982 debt crisis as conclusive evidence that ISI had led the region into a cul-de-sac. As Hirschman has argued (1982), policy-making has a strong component of ‘path-dependency’. As a result, people often stick with policies well after they have achieved their aims (i.e., they have passed their sell-by date), and those policies have even become counterproductive. This leads to such
2 Perhaps the main reason why for the ‘new’ left is so difficult to continue thinking critically in their new, ‘modern’, ideology (and in their new, ‘modern’ relationship to power) is explained by Freud’s idea that “[a]nyone who knows anything of the mental life of human beings is aware that hardly anything is more difficult for them than to give up a pleasure they have once tasted. Really we can never relinquish anything; we only exchange one thing for something else. When we appear to give something up, all we really do is to adopt a substitute.” (1908) 3 Lord Kelvin, one of the most important physicists of the 19th century, played key roles in the development of thermodynamics, electric lighting and transatlantic telecommunication; he was buried next to Isaac Newton in Westminster Abbey.
4
frustration and disappointment with existing policies and institutions that it is not uncommon to experience a ‘rebound effect’. An extreme example of this ‘backlash’ (or ‘reverse shift’) phenomenon is post-1982 LA, where economic reform ended up being mostly about the reversal of the previous development strategy — which, in many aspects, had overstayed its welcome.
From this perspective, what most differentiated LA from Asia was not just the strength with which the new neo-liberal ideology was adopted, but also the form in which the previous one (ISI) was given up. Hirschman called this “LA’s tendency to fracasomania” (1982). So, perhaps it should not be surprising that the discourse of the reforms ended up resembling a compass whose 'magnetic north' was simply the reversal of as many aspects of the previous development strategy as possible — as Gustavo Franco (when President of Brazil’s Central Bank) explained, the main task of economic reform in Cardoso’s first government was “[...] to undo forty years of stupidity [besteira] […]” (Veja, 15/11/1996). With this ‘reverse-gear’ attitude (in which almost anything previously considered as ‘virtue’ became ‘vice’, and vice-versa), the Brazilian experiment in economic reform and financial liberalisation almost inevitably ended up as an exercise in ‘not-very-creative-destruction’. The mere idea that alternatives to neo-liberal reforms could exist increasingly met with a mixture of amusement and contempt. Franco again: "[The alternative now] is to be neo-liberal or neo-idiotic [neo-burros].” (Ibid.) And, of course, ‘burros’ belong in (intellectual) Gulags.
From this perspective, perhaps what led to economic reforms being implemented so differently in LA and in many countries in Asia (remarkably rigid in the former, pragmatically in the latter) is that in the former policy-makers of most political persuasions, including the ‘new’ left, were eager to believe that neo-liberalism and the Washington Consensus were a set of ingenious tricks devised by Dumbledore, while in the latter they instinctively knew that (most likely) they were the work of Voldemort…
In this respect, I would argue that perhaps one reason why ‘pure’ ideology is so important in LA (past and present) is that there is little else in the form of social cohesion. This helps to explain the peculiar set of priorities and the rigidity with which the reforms were implemented in LA, as well as their poor outcome, as distinct from many Asian countries — where economic reforms were implemented not as a messianic endeavour but (rightly or wrongly) as a more targeted and pragmatic mechanism to help lift specific pressing economic and financial constraints in order to continue and strengthen their existing ambitious industrialisation strategies.
1.— The collapse of Brazil’s (and Latin America’s) growth rate post-1980 is unique in the Third World
As is well known, the beginning of neo-liberal reforms instituted by Reagan and Thatcher was followed by a slowdown of the world economy. This was also associated with the complex transition from the ‘mass-production-for-mass-consumption’ techno-economic paradigm to the age of information and telecommunications, with its more knowledge-intensive and flexible production techniques (Pérez, 2002). The average annual growth rate of the world economy fell from 4.9% (1950-1980) to 3.3% (1980-2011; GGDC, 2012). However, Brazil’s growth-rate collapse was extreme, even in this context (from 6.8% to 2.6%, respectively). The fall in the rest of LA’s was nearly as remarkable — excluding Brazil, the average regional rate fell by half (from 5% to 2.6%).
5
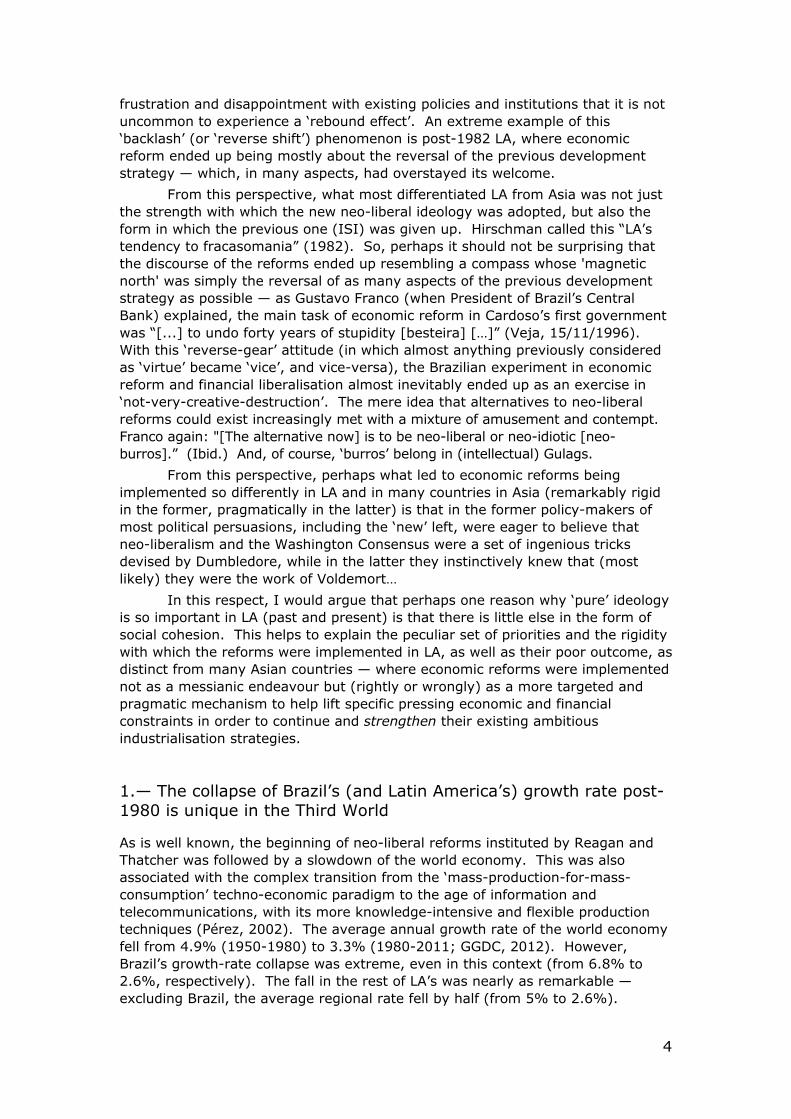
The exception to the general slowdown in the world economy was, of course, the ‘third-tier’ NICs (China, India, and Vietnam). Elsewhere in the developing world, the ‘second-tier’ NICs (Malaysia, Thailand, Indonesia) managed (on average) to keep their growth-rate stable despite the 1997 financial crisis, while in the ‘first-tier’ NICs (Korea, Hong-Kong, Singapore, Taiwan), and in North Africa and Sub-Saharan Africa growth-rates declined, but by a relatively small margin. As mentioned above, Brazil’s rate, instead, fell by nearly two-thirds, while non-Brazil LA saw its growth rate nearly halved. For example, if one ranks all countries of the database (excluding oil-exporting Middle Eastern countries) by GDP-growth rate (94 countries), Brazil’s growth-ranking collapses from a ‘top-ten’ position between 1950 and 1980, to a pretty disappointing 58th (1980-2011 — or to 53rd if the 1980s are not taken into account). In turn, the growth-ranking of the other Latin giant, Mexico, falls from 13th to 65th (or to 59th for 1990-2011). What a contrast with China (41st to 1st), India (69th to 5th), or Vietnam (80th to 2nd). The divergent paths of Brazil, India and China become evident in Figure 1.
FIGURE 1 Brazil’s GDP per capita as a multiple of India’s and China’s
GDP per capita, 1950-2010
● a and b mark the start of the (unorthodox) process of economic reforms of India and China; a: after three years in opposition, Indira Gandhi is re-elected to serve what would be her fourth (and last) term in office; b: Deng Xiaoping’s speech to the Third Plenary Session of the Party's Eleventh Central Committee.
● Source: WDI (2012, data in constant 2000-US$). The series were brought back to 1950 using GGDC (2012). 3-year moving averages.
6
Although from a Gerschenkronian (or Kuznetsian) perspective, one would have expected some ‘catching-up’ by lower-income Asian countries, the extent of the post-1980 gains is truly remarkable — with their post-1980 catching-up resembling the downhill part of a vertical loop in a roller coaster. Therefore, as far as GDP-growth is concerned, the obvious question is, of course, what does post-1980 Brazil have in common with India and China to be lumped together with them in the same category (BRIC)? The same goes for Russia.
Figure 1 also confirms that (as opposed to what is usually assumed) Brazil’s relative growth weakness is not confined to the difficult 1980s. Moreover, LA’s disappointing post-1980 performance is fairly homogenous — see Figure 2.
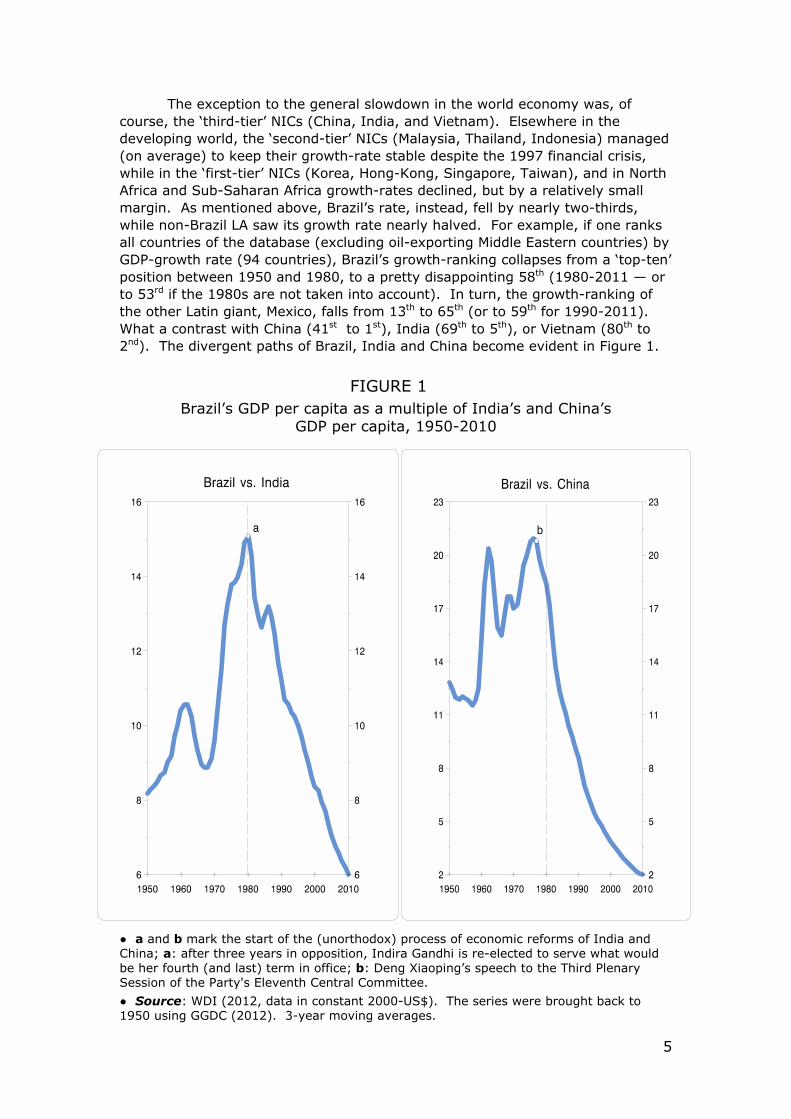
FIGURE 2
● Regions: LA = Latin America; EA = East and South East Asia; EU = European Union (excluding Germany because of unification); n-2 = second-tier NICs; naf = North Africa; SA = South Asia; ss-a* = Sub-Saharan Africa (excluding South Africa); and W = ‘world’ (weighted average for the 97 countries of the source).
● Countries: a&n = Australia and New Zealand; ar = Argentina; bo = Bolivia; br = Brazil; ch = Chile (ch* = Chile 1950-72 and 1972-2008; 1972 is chosen as a cutting year to avoid the distorting effect of 1973, the year of the military coup); China*, rate of growth 1980-2011 = 8.7%; co = Colombia; cr = Costa Rica; dr = Dominican Republic e = Ecuador; gt = Guatemala; mx = Mexico; pe = Peru; us = United States; ur = Uruguay; ve = Venezuela; and za = South Africa (za* = South Africa 1994-2011 — the ANC period). Unless otherwise stated, these acronyms will be used throughout the paper.
● Source: GGDC (2012; data in constant 2011-US$, EKS PPPs). The GGDC dataset only provides information for 13 Latin American countries (all included in the graph). Unless otherwise stated, this will be the source of all data on GDP, employment and labour productivity in this paper.
7
While LA was growing relatively fast between 1950 and 1980 (on average, 5.5% p.a.), the range of growth-rates among countries was rather wide (from 2.1% [Uruguay] to 6.8% [Brazil]). And when the region was growing at less than half that rate in the latter period (1980-2011), 9 of the 13 countries of the database appear within a remarkably narrow range — between 2% (Venezuela) and 2.9% (Peru and Ecuador). Furthermore, Colombia was also part of that group until 2003 (emerging only slightly from this group after that), leaving only Costa Rica, Chile and the Dominican Republic properly outside this thin (and disappointing) band — with growth-rates of 4%, 4.4% and 4.6%, respectively.4 In other words (and in contrast to Tolstoy’s remarks in the opening passage of Anna Karenina)5, when, on average, LA was ‘happily’ expanding at 5.5% p.a. (i.e., doubling output every 13 years), countries were growing in their own distinctive way; and when they grew later on at a sad average of just 2.6% p.a. (i.e., doubling their output only every 27 years), they did so resembling one another!
Moreover, in LA only Chile managed to grow faster in the second period (3.5% and 4.4%, respectively), with Uruguay growing practically at the same pace (2.1% and 2.2%). In Chile, however, economic reforms began in 1973, so a more meaningful comparison would be between pre-1973-ISI (1950-1972) and post-1973-reform periods. In this case, the growth rate is actually the same in both periods (4%; see ‘ch*’ in Figure 2). Figure 2 also confirms the remarkable growth-collapse of Brazil and Mexico, with only Japan doing worse — except for manufacturing (see below Section 10), where Brazil takes the dubious honour of being awarded ‘the wooden spoon’ in terms of the collapse of growth-rates pre- and post-1980: in this case, of all the countries for which the WDI (2011) provides information, the plunge of Brazil’s growth-rates is the largest in the world (from 9.5% p.a. in the former period to 1.3% in the latter). From this perspective, what is truly remarkable is how Brazil managed to fire everybody’s imagination with such a disappointing performance. In fact, while its GDP was growing so slowly that it would take 80 years to double it in per capita terms (or 45, if the slightly faster pace between 1990 and 2011 is continued), it convinced the world that it deserved to be regarded as being of the same fabric as countries that were doubling their GDP per capita every 8 years (China), or every 15 (India).
However, at least now you know: if you ever need a PR-agent to boost your image, get a Brazilian one!
4 Despite rapidly declining population growth, the difference between the two periods is even more remarkable in per capita terms. In the former (1950-1980) countries in the region were on average doubling their GDP per capita every 25 years; however, at the speed in which they were growing in the latter period (when they were struggling to get to a 1% rate of per capita growth), it would have taken them 87 years to do the same. 5 “All happy families resemble one another, each unhappy family is unhappy in its own way."
8
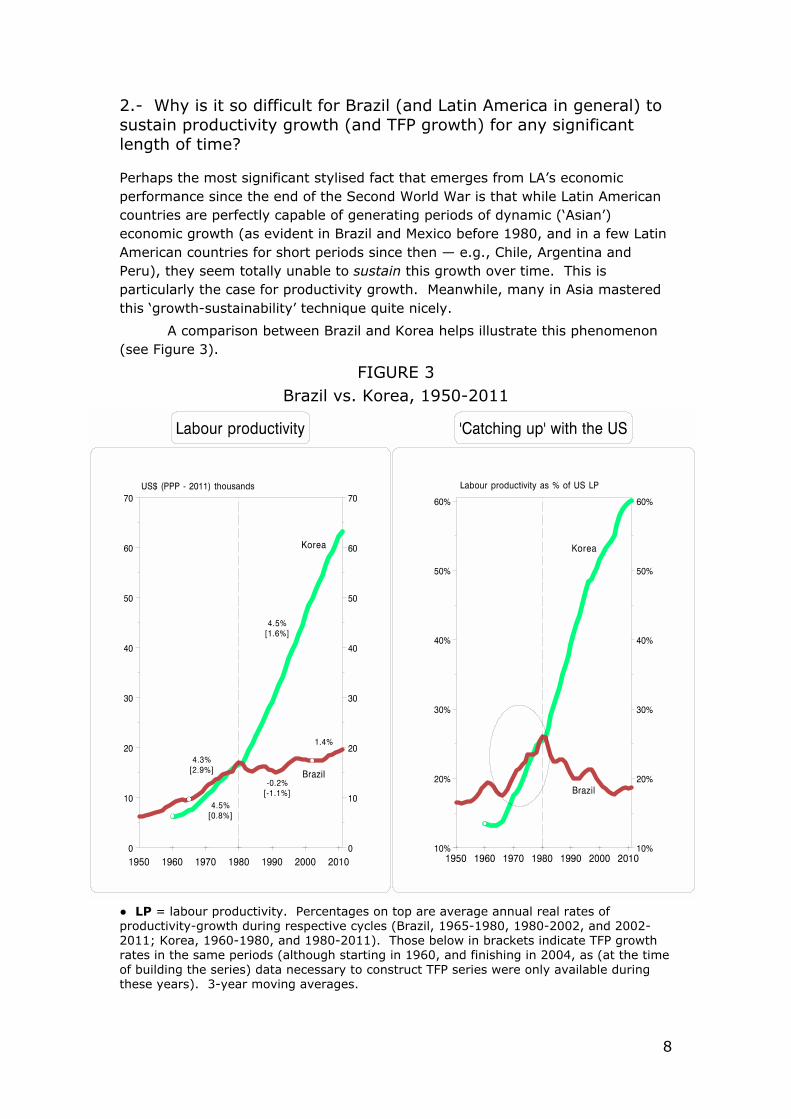
2.- Why is it so difficult for Brazil (and Latin America in general) to sustain productivity growth (and TFP growth) for any significant length of time?
Perhaps the most significant stylised fact that emerges from LA’s economic performance since the end of the Second World War is that while Latin American countries are perfectly capable of generating periods of dynamic (‘Asian’) economic growth (as evident in Brazil and Mexico before 1980, and in a few Latin American countries for short periods since then — e.g., Chile, Argentina and Peru), they seem totally unable to sustain this growth over time. This is particularly the case for productivity growth. Meanwhile, many in Asia mastered this ‘growth-sustainability’ technique quite nicely.
A comparison between Brazil and Korea helps illustrate this phenomenon (see Figure 3).
FIGURE 3 Brazil vs. Korea, 1950-2011
● LP = labour productivity. Percentages on top are average annual real rates of productivity-growth during respective cycles (Brazil, 1965-1980, 1980-2002, and 2002-2011; Korea, 1960-1980, and 1980-2011). Those below in brackets indicate TFP growth rates in the same periods (although starting in 1960, and finishing in 2004, as (at the time of building the series) data necessary to construct TFP series were only available during these years). 3-year moving averages.
9
● Sources: productivity, GGDC (2012; for Korea, and other Asian countries, the GGDC database only provides data on employment since 1960). TFP, calculations made by Anish Acharya and author, using the Hall and Jones (1999) methodology for decomposing output per worker); see Acharya (2009), and Palma (2010).
In terms of productivity, Brazil (like Mexico) was just about ‘keeping up with the Asian Joneses’ before 1980. In fact, by 1980 Brazil’s overall productivity level was still higher than Korea’s (US$18,045 and 16,240, respectively — data in constant 2011-US$, EKS PPPs). Furthermore, in terms of TFP (keeping in mind the major problems associated with both its concept, and its measurement) before 1980 Brazil had a rate three times higher than Korea — indicating, basically, that Brazil could achieve a rate of productivity-growth similar to that of Korea, but with a much lower rate of investment. However, after 1980 the fortunes of these two countries moved in opposite directions: while Korea (despite 1997) kept its productivity growth intact (4.5% p.a.) — and managed to double its TFP growth-rate — Brazil’s productivity and TFP growth-rates collapsed to the point of becoming negative for over two decades after 1980 (the latter one highly negative). As a result, (and despite the post-2002 recovery in Brazil) by 2011 Korea’s average productivity levels were more than 3 times those of Brazil’s (US$64,000 and 19,700, respectively; constant 2011-US$, EKS PPPs). So, while Korea was closing its productivity gap with the US very rapidly — up from 25% (1980) to 60% (2011) — Brazil was falling behind (in a cyclical fashion) — down from 28% to 19% of US’s productivity levels, respectively.
As has been widely reported (and is evident in Figure 3), the Brazilian economy moved into a more dynamic growth-cycle (led mostly by a boom in commodities, finance, and household credit) after 2002, which was quickly resumed in 2010 after the 2009 slowdown (in part due to a pre-presidential election expenditure boom). The main domestic stimulus for this (short) growth acceleration was a credit-driven consumption and real state boom; thus, the domestic credit to private sector jumped from 31% of GDP in 2005 to 53% in 2008 (WDI, 2012), and the Domestic credit provided by the banking sector increased from 75% of GDP in 2005 to 97% in 2008 (Ibid.). At the same time, Brazil’s housing credit (one of the lowest in the world among middle-income countries6) jumped from R$7 billion in 2005 to R$70 billion in 2011 (with a predicted R$85 billion for 2012; see http://www.caixa.gov.br).
However, given Brazil’s interest rates, this credit boom could only have a short-term positive impact on growth, as financial fragilities in the household sector soon began to hit despite still relatively low levels of household debt.7 Therefore, while productivity growth reached an average annual rate of 1.4% between the starting point of the cycle (2002, the year of the election of President Lula da Silva) and 2011, this was an average made of different components. For example, while productivity growth posted a rate of 5% in 2007 and one of 4% in 2010, by 2011 it was already down to 0.7%, and even became negative in 2012 (despite the continuation of the highly balance-of-payments
6 The last available statistic places the housing credit in Brazil at only 5% of GDP; meanwhile, Mexico’s ratio was 13%, Chile’s 14%, Poland 19%, Hungary 25%, South Africa 31%, and Korea 37%. In some OECD countries (such as Switzerland, Denmark and the Netherlands) this ratio reaches over 100% (http://www.hypo.org/Content/Default.asp? pageId=414). 7 In Brazil, the household debt to income ratio is currently only just above 40%, while that of the UK is about 170%, Canada’s 150%, Japan 130%, and the US’s 110%.
10
beneficial boom in commodity-prices and the tsunami of inflows, including FDI). In other words, and despite a growing collective optimism (reaching levels of euphoria towards the end of Lula’s presidency, in both Brazil and the financial press), Brazil’s productivity-acceleration could not be sustained (as predicted; see Palma, 2010).8 At the same time, the growing financial fragilities of the household sector led a Financial Times analyst to warn recently that Brazil may be heading for a subprime crisis. In his opinion,
“Brazil has been on a credit binge ... [and] the Brazilian borrower base is paying “real” interest of circa 20-25 per cent against a norm of 1-3 per cent in most countries. ... For consumers specifically, the ramifications are serious as the debt service burden has risen to 24 per cent of disposable income. ... To put this into context, the US consumer “blew up” when the debt service burden hit 14 per cent (with a current read of approximately 12 per cent). In other words, the Brazilian consumer has twice the debt load from a cash flow perspective relative to a US consumer who is still widely regarded as being over leveraged. The situation in Brazil is worryingly similar to the sub-prime crisis in the US. A lot of credit is being pushed by the banks at high rates to consumers who ultimately won’t be able to service the debt. (http://www.ft.com/cms/s/0/eca47380-3dc4-11e0-ae2a-00144feabdc0.html# axzz1fnWFZDrI).
Moreover, a senior analyst of the same newspaper also warns us of the problems that this, and the sharp slowdown of the economy, is already creating in Brazilian banks, “[b]oth homegrown names [... and] foreign-owned operators [...].” The common problem across the sector is “an uncomfortable squeeze on profitability stemming from lower revenue on one side and higher bad debt charges on the other.” (http://www.ft.com/cms/s/0/d208d83c-2769-11e2-abcb-00144feabdc0. html#axzz2BWN 3I99x).
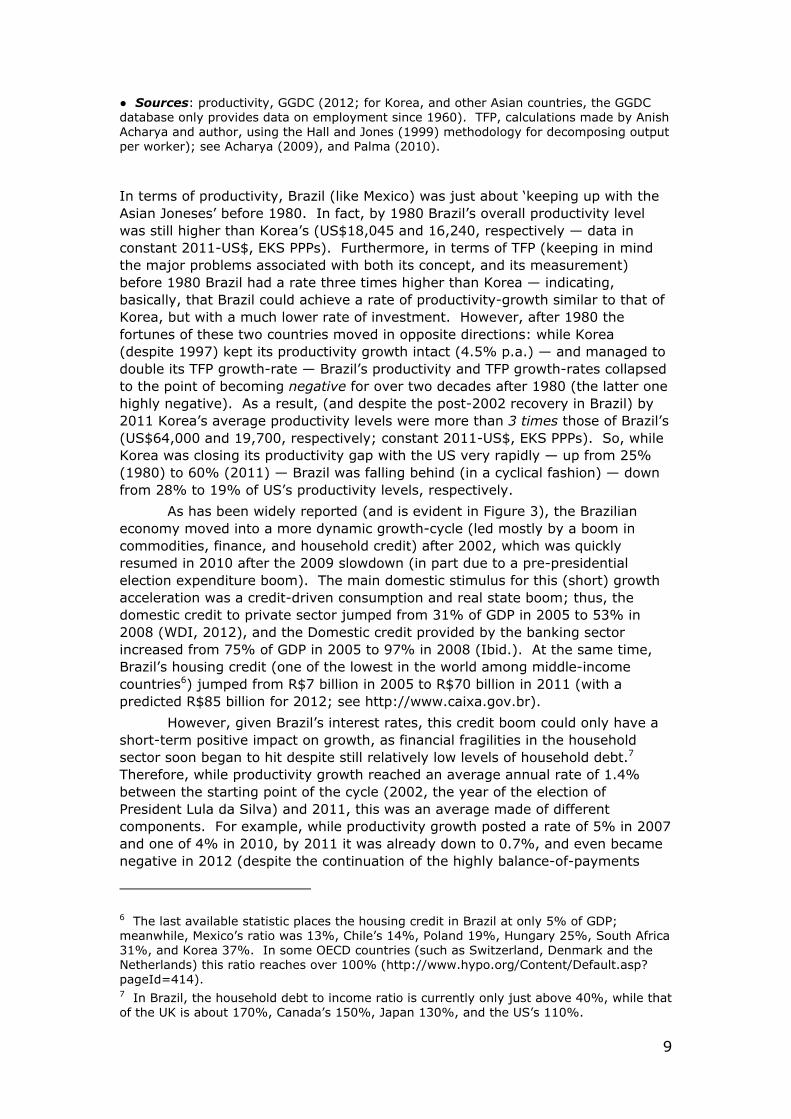
The difficulty in sustaining periods of productivity growth is also evident in the four Latin American countries in the left-hand panel of Figure 4, which are included in this graph because they are the only ones in the region that experienced at least some years of rapid productivity growth after 1980. However, in them, all productivity growth stopped abruptly after a relatively short period — and TFP growth became negative after that point.
8 In early 2011 I gave a lecture on Brazil in a course for executives in a business school in the UK, and at the end of the course one participant (a CEO of a multinational) wrote in his comments that he hoped I was wrong in my prediction that Brazil would not be able to sustain its growth-acceleration, as his firm had just bought a Brazilian company — and, due to the remarkable bubble in M&A, they had to pay a fortune for it! This clearly indicated what was going on: irrespective of the actual performance of the Brazilian economy, and of the actual prospects for future returns on one’s investment, Brazil had become a place that one could not afford not to be in...
Furthermore, in LA, bubbles in the stock market are often used for the flotation of domestic private corporations just to be sold to foreign capital. As a result, there is a large private sector wealth effect that fuels more financial speculation, conspicuous consumption and capital flight, but leads to little or no new investment. This does not happen in Asia, where corporations are rarely floated in the stock market just to make them attractive to ‘gringos.’ As The New York Times reported recently on a meeting with a Chilean businessman in his mid-40s, “[...] he was now considering offers from companies to buy a majority of his mining assets [because] “I am not so happy working so much, it is very stressful.” (http://www.nytimes.com/2010/11/20/world/americas/20chile.html)
11
FIGURE 4
Latin America (4) and Asia (3): productivity growth, 1950-2010
● Percentages above the lines are average annual real rates of productivity-growth during respective cycles; those in brackets below the lines indicate TFP growth rates between the end of the respective post-economic reform growth period and 2004 (last year for which TFP-data are availability). Arg = Argentina; and Urug = Uruguay.
● Source: productivity, GGDC (2012); TFP, Acharya (2009), and Palma (2010).
As it is evident in Figure 4, as far as productivity growth is concerned, post-1980 Latin American countries became (at best) good sprinters. Meanwhile many Asian tigers became top marathon-runners (a skill that crucially includes the ability to hold one’s nerve more effectively in both sides of the economic cycle). The Chilean case is probably the most notable, in that its high productivity-growth period lasted a bit longer, but also stopped abruptly (in 1998) without having experienced a financial crisis (as in Argentina) or political crisis (Peru). Chile needed only two relatively minor aftershocks (or contagion) from the Asian financial crisis (1997) and the Russia default (1998) — and (this being LA) a needless amplification of these shocks via an over-reaction by its Central Bank (following the region’s ‘tough’ monetarist neo-liberal tradition — or, as I prefer to call it, following the region’s ‘macho-monetarist’ tradition (Palma, 2006).
Subsequently productivity growth practically vanished (0.9% between then and 2010), becoming actually stagnant in ‘per-hour-worked’ terms — and
12
even negative in TFP terms.9 How different from the three Asian countries of Figure 4 (each representing one of the three NIC groups — with China reaching 7.1% and Taiwan 4.3%), or from other Asian countries that also managed dynamic productivity growth during the three decades between 1980 and 2010, such as Korea (4.5%), Vietnam (4.1%), India (4%), Thailand (3.7%), Hong-Kong (3.3%), Sri Lanka (3.2%), Malaysia (3%), Singapore (3%), Cambodia (3%), Bangladesh (2.4%), or Pakistan (2.4%), among others. LA’s average for this period (0.3%) seems to belong to a different world — and one that also includes the Philippines (0.5%), LA’s honorary country in Asia. Even if the 1980s are excluded (due to LA’s debt crisis and its aftermath — the misleadingly called ‘lost decade’), and the period is restricted to the post-reform 1990-2010 one, LA’s average productivity growth (1.3%) is just a fraction of that of most Asian countries (China 8.5%, Vietnam 4.7%, India 4.5%, Cambodia 4%, Taiwan 3.8%, Korea 3.8%, Malaysia 3.2%, Thailand 3.1%, Bangladesh 3%, and so on).
In fact, in Figure 4 Indonesia is included (even though it is the least dynamic of the ‘second-tier’ NICs) because its experience is particularly relevant for a comparison with LA. Not only was it the hardest hit by the 1997 financial crisis, but also its whole post-independence history has been turbulent, plagued by natural disasters, separatism, poverty, genocide and corruption (the latter two especially during Suharto’s three-decade-long presidency). Also, since the end of its oil-boom, Indonesia largely abandoned its (somewhat megalomaniac) industrial policy, and soon acquired a Latin-American-style proclivity for premature financialisation and monetarist-macro.10 Yet, even then, no Latin American country has managed Indonesia’s productivity growth-rate since 1990.
From this perspective, the most challenging question emerging from the above is why is it that Latin American countries, although perfectly capable of generating periods of dynamic productivity growth, are totally unable to sustain dynamic economic growth in time — as so many countries in Asia are capable of doing? This is particularly true for Brazil, a country that grew Asian style for 15 years before 1980, and has struggled ever since — with its recent partial recovery having already run out of steam.
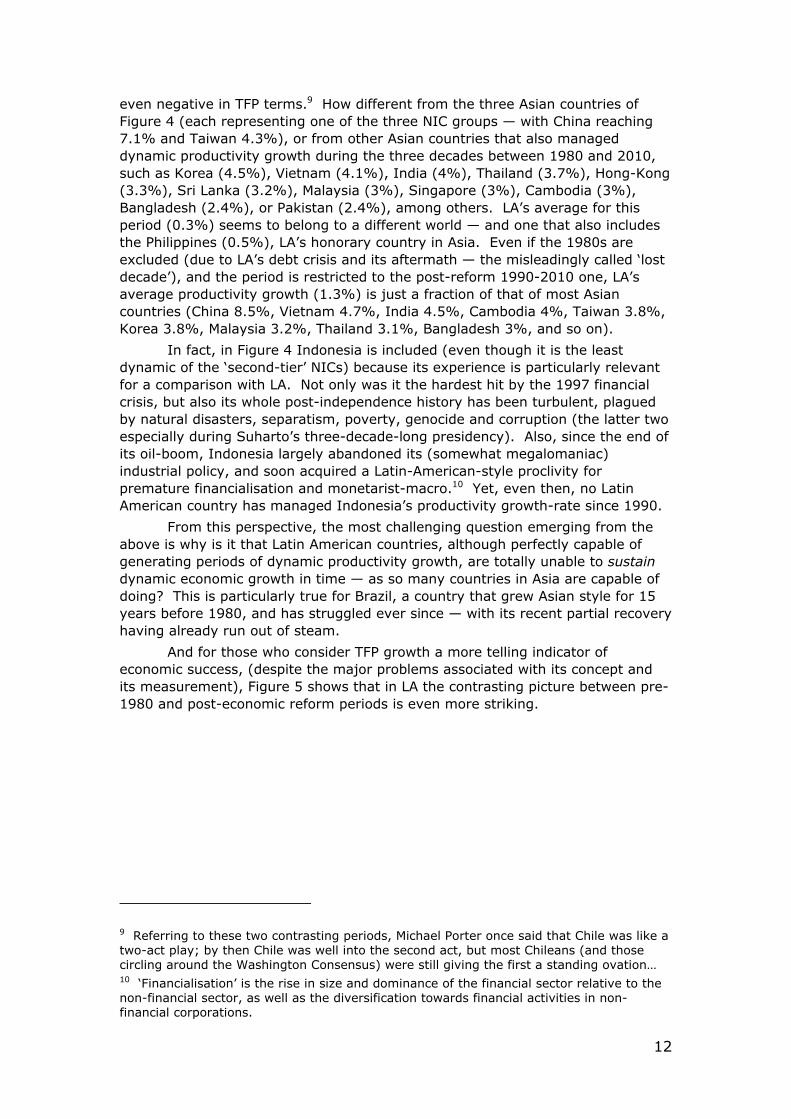
And for those who consider TFP growth a more telling indicator of economic success, (despite the major problems associated with its concept and its measurement), Figure 5 shows that in LA the contrasting picture between pre-1980 and post-economic reform periods is even more striking.
9 Referring to these two contrasting periods, Michael Porter once said that Chile was like a two-act play; by then Chile was well into the second act, but most Chileans (and those circling around the Washington Consensus) were still giving the first a standing ovation… 10 ‘Financialisation’ is the rise in size and dominance of the financial sector relative to the non-financial sector, as well as the diversification towards financial activities in non-financial corporations.
13
FIGURE 5
● 1960 = 1. Ko = Korea; Thai = Thailand; and Tai = Taiwan. Brazil pre-1980 rate (3.3% p.a.) corresponds to the period 1967-1980; China’s 2005 figure was 3.2). Percentages shown in the right-hand side of the graph are TFP growth rates between 1990 and 2005 (i.e., the period of full-blown neo-liberal economic reform throughout LA). 3-year moving averages.
● Source: Calculations made by Anish Acharya and author, using the Hall and Jones (1999) methodology for decomposing output per worker; data were available only until 2005 (2004 for some countries). Acharya (2009), and Palma (2010).
Basically, in half of LA TFP growth was been negative since economic reform (c. 1990), and in some countries it has been stagnant (see Palma, 2010). As a result, in the post-1990 reform-period LA’s TFP average is actually slightly negative and well below those of Asia, South Africa, the EU and the US (Ibid.). That was clearly not the case between 1960 and 1980, when only a few countries in the Mediterranean EU, Japan and Taiwan posted higher TFP growth-rates than LA’s average — and none higher than Brazil.
Much has been said regarding Krugman’s ‘TFP-critique’ of East Asia —paraphrasing Lord Byron’s poem, as if all their success came down to just "blood, sweat, and tears", and none to imagination or creativity. From my point of view, perhaps the worst consequence of the neo-classical ‘Solow-type thinking’ on growth, even if unintended, is the (almost contemptuous) disregard for factor accumulation — as if in the process of development the capacity to learn how to achieve rapid rates of accumulation of physical capital and labour could be easily dismissed as ‘not the real thing.’ In any case, Figure 5 shows that in the post-1990 period (i.e., post-neo-liberal economic-reforms) even these more moderate Asian TFP-rates are well above Brazil’s TFP-stagnation — and of LA’s average negative rate (in half of the countries of the region TFP-growth was negative after 1990, in two others was zero [including Brazil], and in another two was practically

14
stagnant; see Palma, 2010). That was not the case with pre-1980 LA, and certainly not in pre-1980 Brazil.
So, for those who follow the Washington Consensus, the most challenging question must be how was it that in most of LA TFP growth became negative (or at best stagnant, as in Brazil) after the implementation of full-blown economic reform? And the well-rehearsed answer that what is needed to reverse this is yet more of the same neo-liberal reforms by now sounds increasingly hollow.
3.- Sectoral diversities and Brazil’s ‘one-thing-at-a-time’ process of catching-up
Figure 6 measures the relative productivity gaps between Brazil and the US in commodities, manufacturing and services between 1950 and 2007.
FIGURE 6
● com = commodities (primary sector); mf = manufacturing; and serv = services.
● Each line is an index number (1950 = 100) of the ratio of labour productivities between Brazil and the US (each in real terms and domestic currencies). An increase implies ‘catching up’ with the respective labour productivity in the US, and a decline a falling behind. 3-year moving averages.
● Source: GGDC (2009; unfortunately, the source has not updated this databank).
Brazil’s productivity gaps throughout the whole 1950-2007 period show very clearly LA’s ‘one-thing-at-a-time’ style of catching-up. While pre-1980 ISI succeeded in significantly closing the manufacturing productivity gap, this happened at the expense of commodities; the opposite was the case afterwards. One big difference, however, is that (as in East Asia) the pre-1980 manufacturing catching-up also managed to pull services à-la-Hirschman. This goes a long way
15
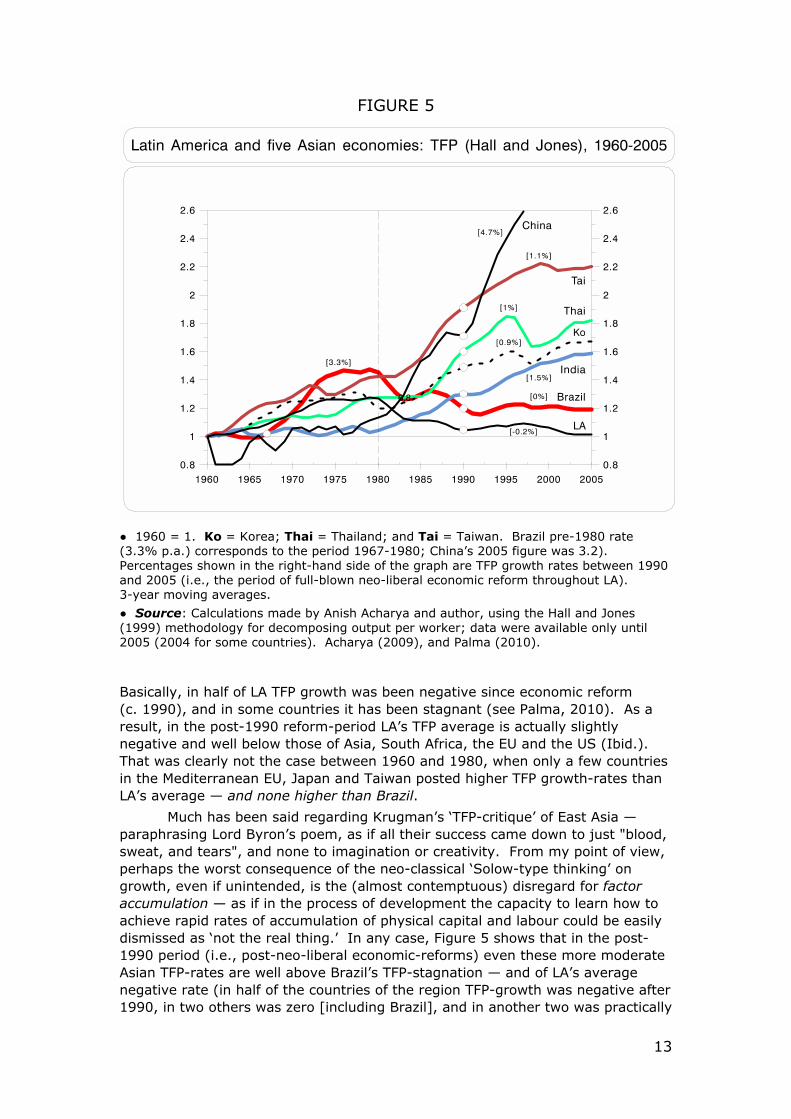
to explaining the differences in the aggregate productivity growth rates between the two periods. Another one, of course, is the superior growth-enhancing characteristic of manufacturing due to its dynamic economies of scale, spillover effects, and so on. And yet another is the fact that the post-1980 commodities’ catching-up (as evident in Brazil, Mexico and Argentina, but not in Chile — see Figure 7) was really only a narrow mining phenomenon.
FIGURE 7
Brazil, Mexico, Argentina and Chile: relative productivity gaps with the US since 1980
● agr = agriculture, forestry and fishing; min = mining and quarrying; mf = manufacturing; and serv = services.
● As Figure 6 (1980 = 100). An increase implies ‘catching up’ with the respective labour productivity in the US, and a decline a falling behind. 3-year moving averages.
● Source: GGDC (2009; as mentioned above, the source has not updated this sectoral databank since 2009).
Perhaps the most surprising aspect of Figure 7 is the relative decline in agricultural productivity vis-à-vis the US in Brazil, Mexico and Argentina. However, this does not mean that in LA this sector has not gone through major
16
transformations. In fact, in several countries a technological revolution in agriculture has been unfolding, which has altered the organisation of production and the social relations in the rural sector (see, for example, Katz, 2004). In many cases, ‘sowing pools’ and ‘cero tillage’ production arrangements have replaced the traditional farmer. And this technological and organisational change has not come about only because of the influence of multinationals; it has also been the result of domestic technological efforts involving R&D carried out both by public institutes (such as Fiocruz or Embrapa in Brazil, INTA and Instituto Malbran in Argentina, INIA in Chile), and local companies (see Katz, 2004). However, as these transformations in agriculture have also taken place in the US, even in Argentina (and despite the remarkable boom in soya) the overall agriculture productivity gap with the US widened vis-à-vis 1980 (with a recovery in the 1990s). The same happened in Brazil.
The primary commodities revitalization has also had the added advantage of benefiting from the post-9/11 surge in commodity prices — which has actually strengthened after a brief interlude following the 2008 global financial crash. Yet, as this phenomenon has been fuelled by massive speculation, it may well prove to be no more than a short-term bubble; although it is possible that it could last for longer, as long as China and India continue to surge ahead, and (over-liquid, extremely uncertain, and increasingly lacking in imagination) financial markets continue to be attracted by commodities. In other words, as the post-2008 (commodity-price and inflow) recovery has been so fragile, candles should be lit for speculators continuing to believe that commodities will remain the sole one-way bet and that China and India will continue their (forced) march toward their rightful place under the sun.
However, the key question here, as well as with the mining, timber and fisheries’ technological revolution, is why they have had so little capacity to pull the rest of the economy with them. Basically, what is happening is that while a few activities in the primary sector have succeed in forging ahead in their efforts to ‘catch-up’ with their counterparts in rich nations, the bulk of the economy is being left behind — with manufacturing being left well behind (see Figures 6, 7 and 8, and section 10). ‘Convergence’, therefore, seems to be a far more complex phenomenon than is implicit in neo-classical models. This is a remarkable fact that (with few exceptions; see Katz, 2004) finds little emphasis in the literature.
Panel D synthesises Chile’s better 1986-1998 GDP performance. What took place was mostly an investment-led burst of productivity growth in agriculture, forestry and fishing (10% p.a.), and increased productivity in services (3.3%, backed up by infrastructural investment and business construction — see Palma, 2010). The growth of productivity in mining only started in the mid-1990s (oddly enough, when other sectors began to falter), reaching 11% p.a. in 1994-2003. In addition, after falling behind in the 1980s, the productivity gap in manufacturing stabilised (although, in part, this was due to a particularly rapid decline in manufacturing employment and premature de-industrialisation in Chile; see below).
One phenomenon apparent from Panel B is Mexico’s particularly poor overall performance. For reasons of space, I cannot analyse this here in detail (see Palma, 2005a) but, basically, an economy with FDI levels and access to the US markets that policy-makers in other developing countries can only (day)dream of, has performed particularly disappointingly in terms of productivity growth — falling behind the US in all sectors.
17
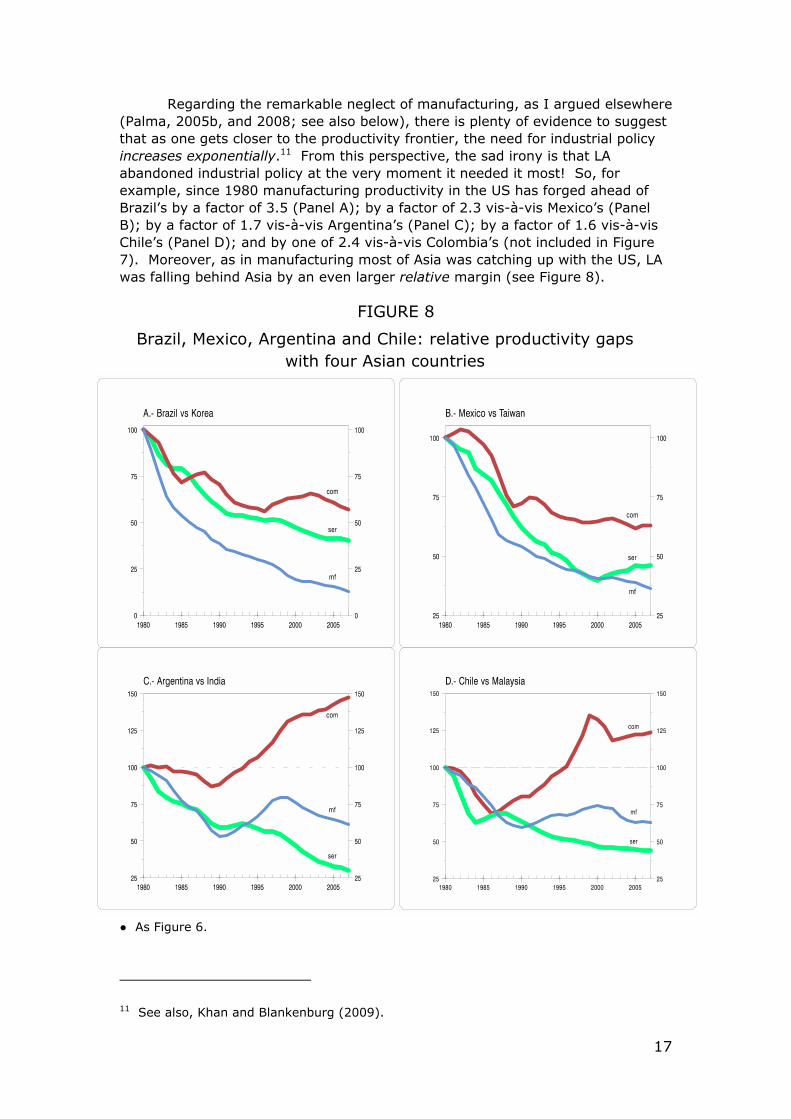
Regarding the remarkable neglect of manufacturing, as I argued elsewhere (Palma, 2005b, and 2008; see also below), there is plenty of evidence to suggest that as one gets closer to the productivity frontier, the need for industrial policy increases exponentially.11 From this perspective, the sad irony is that LA abandoned industrial policy at the very moment it needed it most! So, for example, since 1980 manufacturing productivity in the US has forged ahead of Brazil’s by a factor of 3.5 (Panel A); by a factor of 2.3 vis-à-vis Mexico’s (Panel B); by a factor of 1.7 vis-à-vis Argentina’s (Panel C); by a factor of 1.6 vis-à-vis Chile’s (Panel D); and by one of 2.4 vis-à-vis Colombia’s (not included in Figure 7). Moreover, as in manufacturing most of Asia was catching up with the US, LA was falling behind Asia by an even larger relative margin (see Figure 8).
FIGURE 8
Brazil, Mexico, Argentina and Chile: relative productivity gaps with four Asian countries
● As Figure 6.
11 See also, Khan and Blankenburg (2009).
18
The collapse of Brazil’s productivity in manufacturing relative to Korea’s is truly remarkable: since 1980, manufacturing productivity in Korea has already forged ahead of Brazil’s by a factor of 7.5 (Panel A). In turn, Mexico fell behind Taiwan by a factor of 2.8 (Panel B); Argentina vis-à-vis India (in a cyclical fashion) by a factor of 1.6, and in services by one of 3.4 (Panel C); and Chile vis-à-vis Malaysia (during the 1980s) by a factor of 1.6, and in services by one of 2.4 (Panel D).
In September 2011 The Economist joined the prevailing regional economic euphoria — based exclusively on the fact that after a soft landing from the 2007/2008 global financial crisis, a few countries of the region experienced an acceleration of their growth rate led entirely by a boom in commodity-prices, finance and real estate — and predicted that what is coming may well be a ‘Latin American decade’, with Brazil as its powerhouse. If the subject was football, music, literature, the film industry, cuisine, or exotic tourism that might well be the case; it would also be possible to see this happening in the rôle played by the region, especially Brazil, in certain aspects of international politics. But it looks rather unlikely in terms of economic performance — other than in commodities and finance. But who knows? The 2010s might indeed surprise us, the sceptics, and end up as the Latin American decade (in fact, even more implausible events have occurred before), but so far (2012) the hard evidence is overwhelmingly on the side of yet another ‘Asian decade’ — and yet another Latin American falling behind (except, of course, for Brazil’s capacity for ‘PR’ — including, of course, for the well-known capacity of ‘story-telling’ to convince the story-tellers themselves!)
4.— In Brazil after 1980 (and Latin America in general), the decline in GDP-growth was ‘absorbed’ mostly by productivity, leaving the growth of employment practically unaffected
The only positive side of LA’s poor productivity-growth record is that it is not only associated with low levels of investment, slow technological change (except for some commodities), de-industrialisation, a monetarist macro, and so on, but it is also associated with rapid employment creation (and an increased ‘formalisation’ of employment). A new comparison between Brazil and Korea helps explain this additional contrast between LA and Asia — now in terms of how a rapid decline in GDP-growth after 1980 is ‘absorbed’ in Brazil mostly by labour productivity, while a (small) decline in Korea’s GDP-growth is entirely ‘absorbed’ by employment (Figure 9).
19
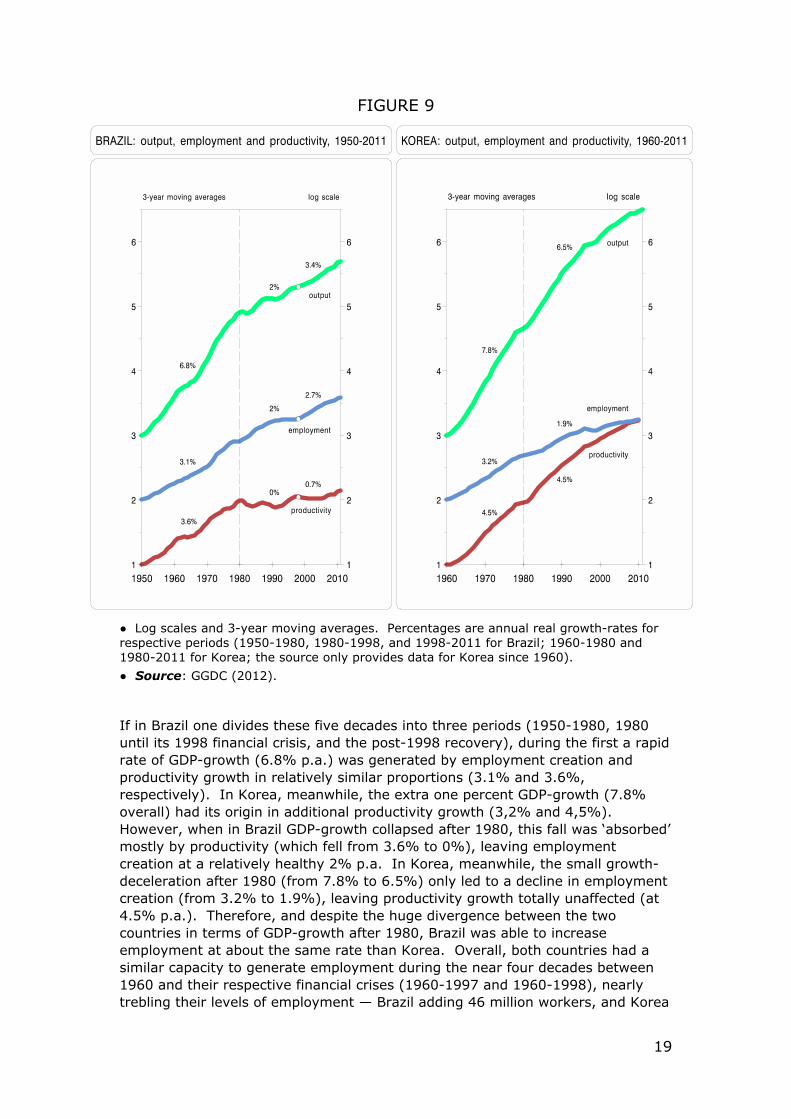
FIGURE 9
● Log scales and 3-year moving averages. Percentages are annual real growth-rates for respective periods (1950-1980, 1980-1998, and 1998-2011 for Brazil; 1960-1980 and 1980-2011 for Korea; the source only provides data for Korea since 1960).
● Source: GGDC (2012).
If in Brazil one divides these five decades into three periods (1950-1980, 1980 until its 1998 financial crisis, and the post-1998 recovery), during the first a rapid rate of GDP-growth (6.8% p.a.) was generated by employment creation and productivity growth in relatively similar proportions (3.1% and 3.6%, respectively). In Korea, meanwhile, the extra one percent GDP-growth (7.8% overall) had its origin in additional productivity growth (3,2% and 4,5%). However, when in Brazil GDP-growth collapsed after 1980, this fall was ‘absorbed’ mostly by productivity (which fell from 3.6% to 0%), leaving employment creation at a relatively healthy 2% p.a. In Korea, meanwhile, the small growth-deceleration after 1980 (from 7.8% to 6.5%) only led to a decline in employment creation (from 3.2% to 1.9%), leaving productivity growth totally unaffected (at 4.5% p.a.). Therefore, and despite the huge divergence between the two countries in terms of GDP-growth after 1980, Brazil was able to increase employment at about the same rate than Korea. Overall, both countries had a similar capacity to generate employment during the near four decades between 1960 and their respective financial crises (1960-1997 and 1960-1998), nearly trebling their levels of employment — Brazil adding 46 million workers, and Korea
20
13 million.12 That was certainly not the case with productivity-growth — as in Brazil, labour productivity ‘absorbed’ almost all the deceleration in GDP-growth after 1980, by 2011 Korea’s average labour productivity was 3.2 times higher than Brazil’s (having been almost identical in 1980).
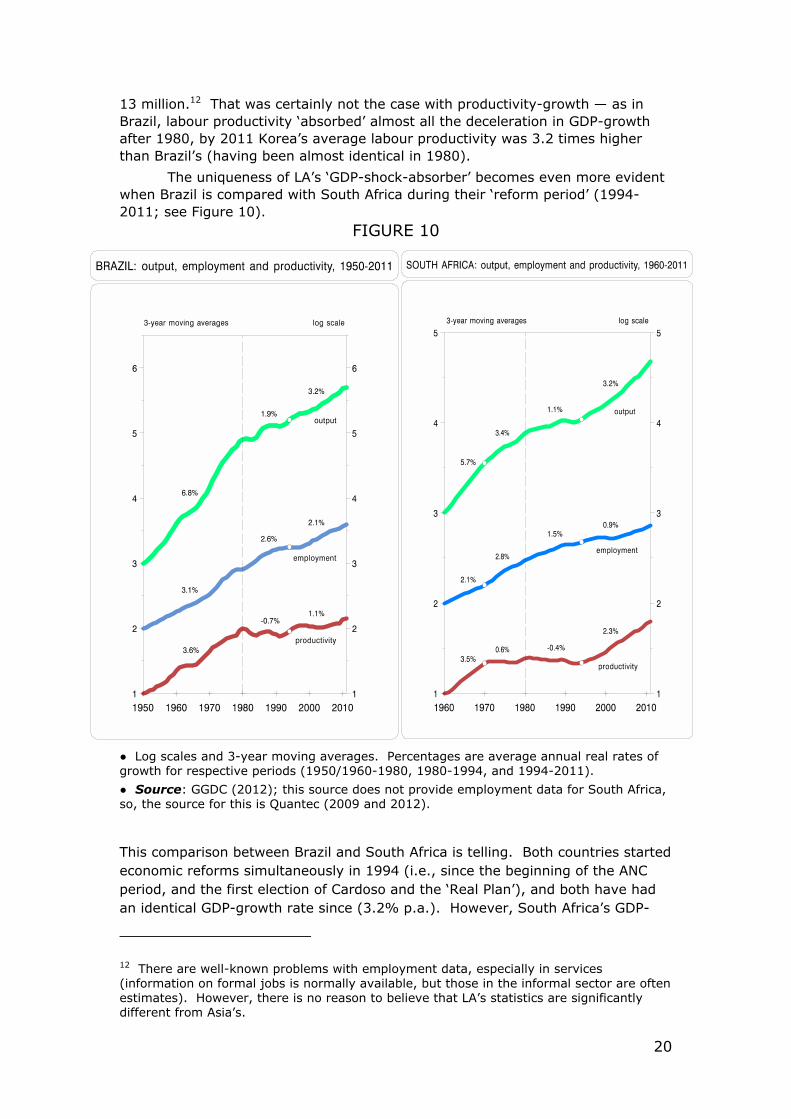
The uniqueness of LA’s ‘GDP-shock-absorber’ becomes even more evident when Brazil is compared with South Africa during their ‘reform period’ (1994-2011; see Figure 10).
FIGURE 10
● Log scales and 3-year moving averages. Percentages are average annual real rates of growth for respective periods (1950/1960-1980, 1980-1994, and 1994-2011).
● Source: GGDC (2012); this source does not provide employment data for South Africa, so, the source for this is Quantec (2009 and 2012).
This comparison between Brazil and South Africa is telling. Both countries started economic reforms simultaneously in 1994 (i.e., since the beginning of the ANC period, and the first election of Cardoso and the ‘Real Plan’), and both have had an identical GDP-growth rate since (3.2% p.a.). However, South Africa’s GDP-
12 There are well-known problems with employment data, especially in services (information on formal jobs is normally available, but those in the informal sector are often estimates). However, there is no reason to believe that LA’s statistics are significantly different from Asia’s.
21
growth is led mostly by productivity-growth, while Brazil’s is led mainly by employment-growth. There are, of course, many differences between the two countries, but the fact that in Brazil the Workers’ Party (PT) became the capitalist élite’s best friend (particularly after the election of Lula), while in South Africa COSATU, one of the ANC dominant forces — and despite the growing neo-liberal orientation in the ANC government’s core policy-making — remained a militant organisation, undoubtedly had a lot to do with this.13
So, for example, while Brazil increased its service employment by more than one-half during this period (1994-2011), South Africa did so by only one third. As Figure 11 below indicates, from this perspective South Africa’s main problem during the ANC period is that it ended up with East Asian levels of employment elasticities (0.3), but Latin American levels of GDP-growth (3.2%).14 The end result was a quarter of its labour force unemployed. As Figures 6 and 7 did above for LA, Figure 21 (Appendix 1) measures the relative productivity gaps between South Africa and the US in commodities, manufacturing and services since 1970.
The main lesson from the contrast between South Africa and Brazil is that even in this (so-called) globalised world there are still significant degrees of freedom regarding the labour-intensity of output. And if LA has chosen a labour-intensive growth-path and South Africa a productivity-led one, this has been mostly for endogenous political economy reasons.
Table 2 (in Appendix 2) shows that this contrast in terms of GDP ‘shock-absorbers’ (productivity in Latin America; employment in Asia and South Africa) also applies to the other countries of each region.
13 What happened recently in the massacre of 36 workers at a miner’s strike at Marikana, a platinum mine owned by Lonmin — with some well-known ‘black-empowered’ ANC captains in its board of directors — is a telling example. Also, the emergence of an alternative, and much more militant, miners’ union (The Association of Mineworkers and Construction Union, the AMCU), which accuses the traditional union (The National Union of Mineworkers, the NUM) of being too close to the government and management, is another indication of things to come in South Africa. Finally, and most worryingly of all, this type of event (including government insensitivity/police corruption/an excess supply of ANC-oligarchs/increased inequality/growingly bureaucratic traditional unions/and so on) ends up helping the corrupt-populist discourse (à-la-Mugabe) of leaders such as Julius Malema (alias ‘Ju Ju’), a convicted fraudster and money-launderer, who was recently expelled from the ANC (after having reached the position of President of the ANC Youth League). He was expelled from the ANC after a series of ‘hate speeches’ in which he called for the murder of white people. That wasn’t the way things were supposed to play out in Mandela’s ‘Rainbow Nation.’ 14 Here employment elasticities are understood simply as the ratio of the rate of growth of employment and of GDP.
22
5.- Brazil’s (and Latin America’s) unique post-reform combination of high employment elasticities and low productivity growth
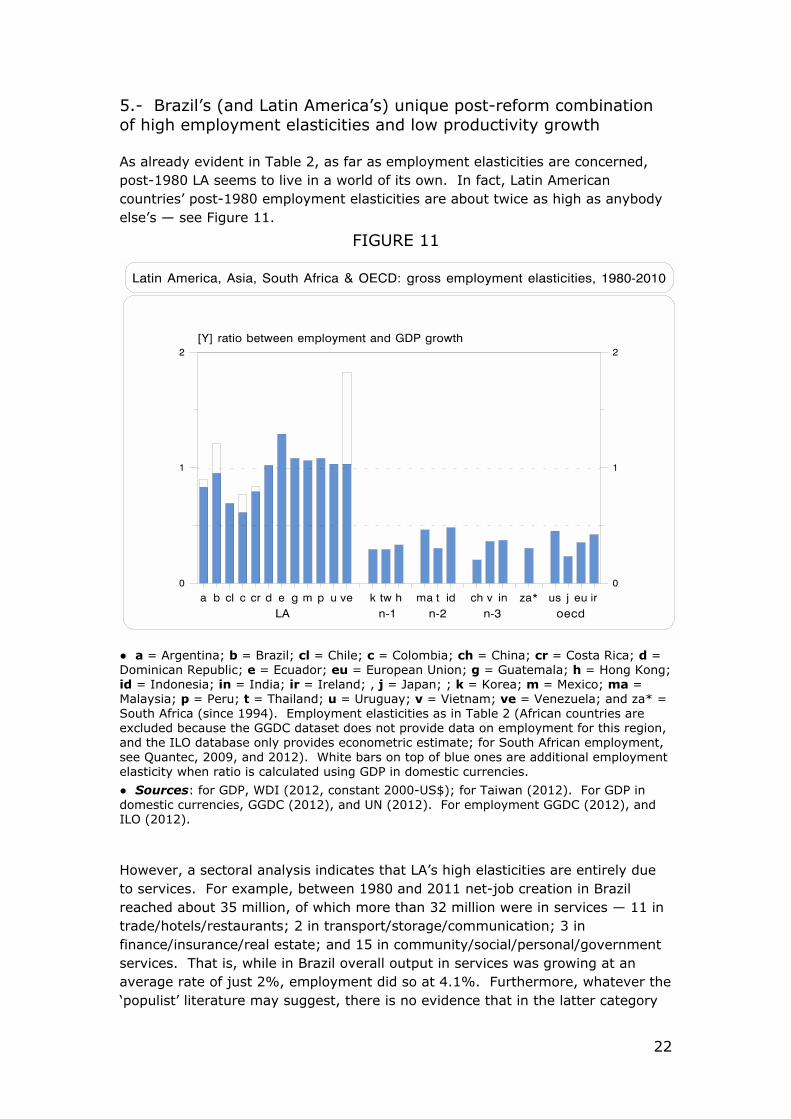
As already evident in Table 2, as far as employment elasticities are concerned, post-1980 LA seems to live in a world of its own. In fact, Latin American countries’ post-1980 employment elasticities are about twice as high as anybody else’s — see Figure 11.
FIGURE 11
● a = Argentina; b = Brazil; cl = Chile; c = Colombia; ch = China; cr = Costa Rica; d = Dominican Republic; e = Ecuador; eu = European Union; g = Guatemala; h = Hong Kong; id = Indonesia; in = India; ir = Ireland; , j = Japan; ; k = Korea; m = Mexico; ma = Malaysia; p = Peru; t = Thailand; u = Uruguay; v = Vietnam; ve = Venezuela; and za* = South Africa (since 1994). Employment elasticities as in Table 2 (African countries are excluded because the GGDC dataset does not provide data on employment for this region, and the ILO database only provides econometric estimate; for South African employment, see Quantec, 2009, and 2012). White bars on top of blue ones are additional employment elasticity when ratio is calculated using GDP in domestic currencies.
● Sources: for GDP, WDI (2012, constant 2000-US$); for Taiwan (2012). For GDP in domestic currencies, GGDC (2012), and UN (2012). For employment GGDC (2012), and ILO (2012).
However, a sectoral analysis indicates that LA’s high elasticities are entirely due to services. For example, between 1980 and 2011 net-job creation in Brazil reached about 35 million, of which more than 32 million were in services — 11 in trade/hotels/restaurants; 2 in transport/storage/communication; 3 in finance/insurance/real estate; and 15 in community/social/personal/government services. That is, while in Brazil overall output in services was growing at an average rate of just 2%, employment did so at 4.1%. Furthermore, whatever the ‘populist’ literature may suggest, there is no evidence that in the latter category
23
these are mainly government jobs — in Brazil, for example, the overall employment elasticities of services reached 2.2, while excluding the latter sub-sector this increases to 3.5 (4.1% employment-growth vs. 1.2% output-growth).
At the same time, and going against the expectations of those in the Washington Consensus, other than in the Central American ‘maquila’ industry (an industry that exists mostly due to artificially-created trade restrictions in the US, which gave Mexico and some Central American countries preferential access to its markets) there is little evidence that increased employment creation relates (in a Heckscher–Ohlin-Samuelson fashion) to export expansion following trade liberalisation. This is especially true in commodities. In fact, not only did employment in the primary sector decline in most countries (Brazil lost 2 million jobs in them), but also, with a few exceptions, there is no evidence that the jobs created in services are associated with the commodity boom in any significant way.
There are, of course, many political economy issues that emerge from LA’s high employment elasticities, and the rôle played in it by the informal sector, that cannot be analysed here.15 However, I would like to mention at least one: the historical legacy of the ‘new’ left. Whatever one’s views on the ‘new’ left, its emergence certainly helped reduce the traditional ‘workers-paranoia’ of the region’s capitalist élites. Basically, when the ‘new’ left in LA became convinced that it could not get the political power to implement its own agenda, it decided to gain power to implement someone else’s agenda.16 In fact, Mrs. Thatcher was right when she proudly proclaimed in one of her last interviews that ‘New Labour’ was her greatest political achievement — implying a sort of ‘ideological Stockholm Syndrome’. Likewise, perhaps the greatest political achievement of Pinochet (and similar military dictators) is the Latin American ‘new’ left. So, as far as employment was concerned, there was not much point in the region’s capitalist élites continuing with their traditional anti-labour bias. Here the above comparison between Brazil and South Africa is telling.
Figure 22 (in Appendix 3), in turn, indicates that in LA during the post-1990 reform period there is a contrasting relationship between investment and productivity growth, on the one hand, and between investment and employment growth, on the other — negative for the former (best represented by a highly significant negative ‘productivity dummy’), and positive for the latter (best represented by a highly significant positive employment one).
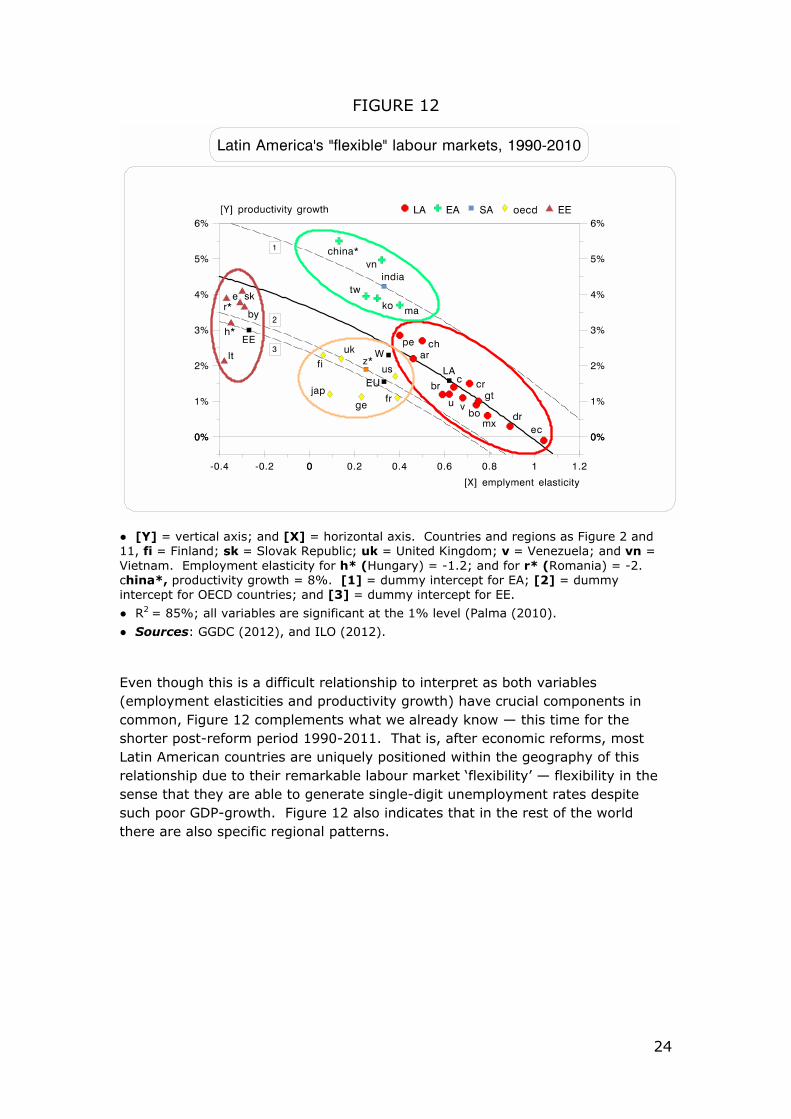
The fundamental point here is whether LA’s ability to generate high employment elasticities may well affect investment and GDP-growth negatively. More specifically, the two critical questions are: what is the nature of the relationship between LA’s high employment elasticities and low productivity growth? And (crucially), if there is a fundamental relationship between the two, which is the direction of causality? See Figure 12.
15 One is the remarkable idealisation of the informal sector by some neo-liberal aficionados, which led De Soto (1989), for example — following Milton Friedman’s glowing remarks on the Italian black market — to proclaim that it was the only real ‘market economy’, the future of humanity! 16 See, for example, Arantes, 2007; Oliveira, 2006; and Palma 2009a.
24
FIGURE 12
● [Y] = vertical axis; and [X] = horizontal axis. Countries and regions as Figure 2 and 11, fi = Finland; sk = Slovak Republic; uk = United Kingdom; v = Venezuela; and vn = Vietnam. Employment elasticity for h* (Hungary) = -1.2; and for r* (Romania) = -2. china*, productivity growth = 8%. [1] = dummy intercept for EA; [2] = dummy intercept for OECD countries; and [3] = dummy intercept for EE.
● R2 = 85%; all variables are significant at the 1% level (Palma (2010).
● Sources: GGDC (2012), and ILO (2012).
Even though this is a difficult relationship to interpret as both variables (employment elasticities and productivity growth) have crucial components in common, Figure 12 complements what we already know — this time for the shorter post-reform period 1990-2011. That is, after economic reforms, most Latin American countries are uniquely positioned within the geography of this relationship due to their remarkable labour market ‘flexibility’ — flexibility in the sense that they are able to generate single-digit unemployment rates despite such poor GDP-growth. Figure 12 also indicates that in the rest of the world there are also specific regional patterns.
25
6.— Brazil’s (and Latin America’s) remarkably poor investment effort and its political economy
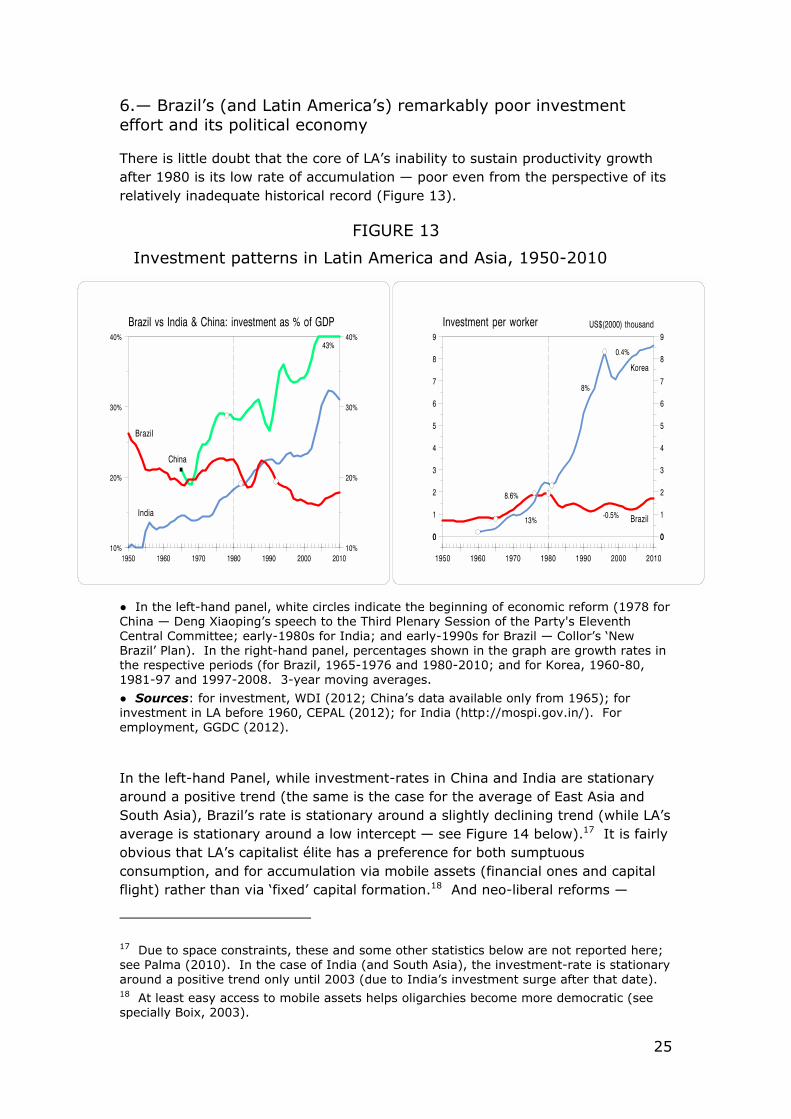
There is little doubt that the core of LA’s inability to sustain productivity growth after 1980 is its low rate of accumulation — poor even from the perspective of its relatively inadequate historical record (Figure 13).
FIGURE 13
Investment patterns in Latin America and Asia, 1950-2010
● In the left-hand panel, white circles indicate the beginning of economic reform (1978 for China — Deng Xiaoping’s speech to the Third Plenary Session of the Party's Eleventh Central Committee; early-1980s for India; and early-1990s for Brazil — Collor’s ‘New Brazil’ Plan). In the right-hand panel, percentages shown in the graph are growth rates in the respective periods (for Brazil, 1965-1976 and 1980-2010; and for Korea, 1960-80, 1981-97 and 1997-2008. 3-year moving averages.
● Sources: for investment, WDI (2012; China’s data available only from 1965); for investment in LA before 1960, CEPAL (2012); for India (http://mospi.gov.in/). For employment, GGDC (2012).
In the left-hand Panel, while investment-rates in China and India are stationary around a positive trend (the same is the case for the average of East Asia and South Asia), Brazil’s rate is stationary around a slightly declining trend (while LA’s average is stationary around a low intercept — see Figure 14 below).17 It is fairly obvious that LA’s capitalist élite has a preference for both sumptuous consumption, and for accumulation via mobile assets (financial ones and capital flight) rather than via ‘fixed’ capital formation.18 And neo-liberal reforms —
17 Due to space constraints, these and some other statistics below are not reported here; see Palma (2010). In the case of India (and South Asia), the investment-rate is stationary around a positive trend only until 2003 (due to India’s investment surge after that date). 18 At least easy access to mobile assets helps oligarchies become more democratic (see specially Boix, 2003).
26
despite all their efforts towards defining and enforcing property rights, and so many other ‘market-friendly’ policies aimed at incentivising investment — have had little impact on that. Even the slight increase in investment in Brazil during the surprisingly positive environment after 9/11 (particularly in terms of access to finance and terms of trade) is unremarkable vis-à-vis those of Asia. Basically, in LA between 2002 and (pre-global financial crisis) 2007 while the ratio of the stock of financial assets to GDP jumped from 106% to 182%, the average investment rate for the whole region only improved from 18% (2001) to 20.4% (2007 — this ratio is similar to its historical average since 1970; see IMF, 2012a, WDI, 2012, and Figure 14 below). And in Brazil, while the capitalisation of the stock market grew in the five years between 9/11 and the beginning of the current global financial crisis at a staggering rate (57% p.a. in real dollar term; or by a factor of 10), private investment kept hovering below 15% of GDP (the harmonic mean for this period was low even for Brazilian standards: 14.4% of GDP).19 So, not surprisingly, in Brazil, the ‘coefficient of financialisation’ — the ratio of the stock of non-monetary financial assets to the stock of productive capital — increased from 7% at the beginning of economic reform (1991) to 40% in 2009 (See Bruno, 2010). Not much evidence here of the supposed revitalising effects of ‘financial-deepening’ on investment and productivity growth promised by McKinnon and Shaw.
In essence, no theory of investment seems to be able to explain LA’s stationarity-around-a-low-intercept behaviour, especially taking place during such a long period, such diverse domestic and international scenarios, and through such divergent development strategies. In turn, Figure 13 (together with the evidence shown in Figures 14 and 15 below) demonstrate that in Brazil — and LA in general — economic reform seems to have unleashed more powerfully the predatory and rentier instincts of the region’s capitalist élites (the former especially during the privatisation period, and the latter during their financialisation one) rather than their Schumpeterian ones.20 In India, as in many other Asian countries, meanwhile, reforms, especially partial financial liberalisation, may have brought complex challenges to the macro and the inevitable financial fragilities (as well as the huge human cost of 'flexible' labour markets, increased inequalities and uncertainties, and so on), but at least in these Asian countries the rate of accumulation increased after their implementation.21 In LA, meanwhile, the cloud did not even have that silver lining.
Furthermore, in the very few cases in LA where investment actually increased after reforms, as in Chile (see Palma, 2010), it is not obvious why it took so long for it to happen (over ten years after the beginning of reforms), let alone why it ran out of steam so easily afterwards (post-1998). However, in Chile, at least for a time, investment per worker showed dynamic growth; in
19 During this period, the corresponding means for private investment in Korea, China, India and Vietnam were 23.5%, 24.6%, 21.7%, and 23.1%, respectively. The harmonic mean is one of the three Pythagorean means, and is more appropriate for the average of rates. 20 For the Russian-style predatory process of privatisation in LA, see, for example, Mönckeberg (2001); Wolf (2007); and Winter (2007). 21 The same is true, among others, for Malaysia and Thailand.
27
Brazil, instead, (and despite the post-2003 recovery) by 2010 investment per worker was still below its 1980 level. On average, the rest of LA follows on average a pattern similar to Brazil’s, with its 2010 level still below that of 1980. An extreme example is post-1980 Mexico: despite the highest level of FDI per worker in the world, by 2010 its investment per worker still had not recovered its 1980/1981 level. By then, and despite 1997, Korea had a level 3.7 times higher, and Malaysia and Thailand 2.4 times higher. In turn, China’s 2010 level was more than 12 times higher; India’s more than 5 times; and Vietnam had more than trebled this statistic since 1994 (first year that data are available for this country).
Perhaps from this perspective the contrasting productivity growth performance of LA and many in Asia — and the inability of LA to sustain productivity growth — may not be that difficult to explain after all. In Brazil, for example, when between 1965 and 1980 investment per worker grew at an annual rate of 6.8%, productivity grew at East Asian levels (4.3%). Then, when investment per worker subsequently collapsed (falling by about 40% between then and 2004), productivity stagnated. Finally, when investment per worker began to increase again (5.4% p.a. between 2004 and 2011), productivity growth showed some improvement (1.7% p.a.; see Figures 9, 10 and 13 above).
As the Mexican case already indicated, one of the most remarkable stylised facts of LA’s investment behaviour during the ‘liberalised’ period is the mixed impact of inflows — including FDI. Before 1980, when in LA overall inflows (FDI, portfolio and ‘others’) averaged less than US$ 20 billion per year (in 2010-US$), productivity growth reached 2.6% p.a. (3.6% for Brazil). But when they increased by more than three times (1988-2010), productivity growth only reached half the pre-1980 rate (1.2% p.a.; 1.3% for Brazil). Of course the disappointing post-1990 performance in ‘liberalised’ LA has many roots (see Palma, 2010), but there is little doubt that the negative effects of the massive surge of (volatile) inflows is part of that narrative. For example, huge inflows led to a chronic deficiency of effective demand for non-commodity tradable activates, especially manufacturing; this was the outcome of the ‘deadly triad’ of over-valued exchange rates (that switched aggregate demand towards foreign markets); high interest rates (due to ‘tough’ monetary policies to deal with these inflows); and remarkably low levels of public investment by ‘sterilised’ governments (of about 3% of GDP; these were necessary to balance public finances, as part of the ‘sound fundamentals’ shop-window part of the open capital account story).22 Added to this, there was a hugely increased uncertainty (especially due to the volatile nature of inflows) affecting especially private investment. However, the aspect of inflows that is most truly remarkable is shown in Figure 14.
22 While in OECD countries personal income tax collection reaches on average 9% of GDP, in LA it amasses less than 1% — with income tax evasion fluctuating around 50%, equivalent on average to 4.5% of GDP (ECLAC, 2010). From this perspective, there is little doubt that LA confirms Schumpeter’s hypothesis that: “[t]he fiscal history of a people is above all an essential part of its general history” (1918).
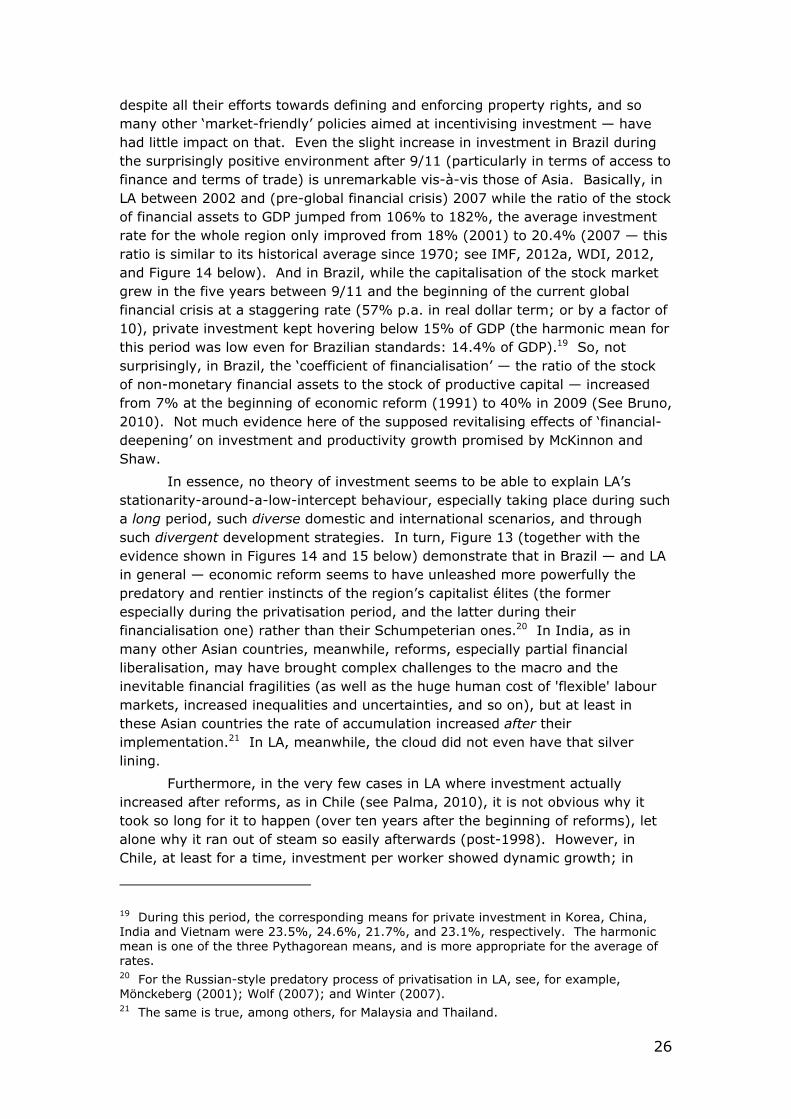
28
FIGURE 14
● The white circle shows the year before the ‘Brady-bonds’ agreement (that helped convert unwanted US bank loans to Latin American countries into a variety of new bonds; at the same time this marks the beginning of economic reform in most countries in the region).
3-year moving averages.
● Sources: ECLAC (2012; investment in current prices).
Basically, a huge surge of inflows of FDI after the ‘Brady-bonds’ agreement and the beginning of economic reform — reaching an average of US$ 75 billion a year between 1988 and 2010 (in 2010-US$; ECLAC, 2012) — has been associated with a remarkably poor rate of investment (as a share of GDP). In fact, despite the growth-acceleration in many countries after the post-2003 commodity-price boom and the new surge in inflows, as well as the rapid recovery after the 2008 crisis, by 2010 the average investment rate of the region (19.7% of GDP) was still below its 1989 Brady-bonds starting point (21.2% — let alone its 1981 peak at 23.4%; WDI, 2012).23 Among the main countries, Brazil and Venezuela, although for different reasons, lagged behind during this 22-year period. In other words, as figure 14 clearly indicates, in LA inflows of FDI equivalent to US$1.5 trillion (1988–2010; 2010 US$) have been associated with a rate of accumulation that is poor even from the perspective of its inadequate historical record — on average just 19% of GDP (17.6% for Brazil; ECLAC, 2011, WDI, 2012; see also Palma, 2012).24 During this 22-year period, Korea, Malaysia and Thailand had an
23 In fact, the (already disappointing) 1989 average level for the region (21.2%) was not reached in any single year between then (and the beginning of economic reform) and 2011 (Ibid.). 24 Part of this phenomenon is the fairly unimpressive rôle of mostly rentier Spanish

29
average investment rate of about 30%; China’s one of 36%; India’s was 31% between 2004 and 2010; and Vietnam’s 30% since 1994 (the first year that data are available; WDI, 2012).
So, again, not much support here for the mainstream proposition that DCs are full of investment opportunities, just waiting for the availability of finance (which, supposedly, can only come from rich countries and not from the high proportion of the national income appropriated by their élites). And significant support for the Keynesian proposition that the mere availability of finance does not lead by itself to higher levels of investment.
So the usual argument that one of the main reasons why LA needs capital inflows is because its many investment opportunities are constrained by finance is rather hollow. It is not the case that LA lacks investment opportunities (like those associated with forward and backward linkages of commodity production); the issue that still needs a more elaborate answer is why is it that neither domestic nor foreign capital shows much interest in taking advantage of them? And, again, post-reform LA has shown little support for the mainstream argument that says that all that is required for the happy union between these investment opportunities and foreign finance are ‘prices right’ and ‘institutions right’. The experience of East Asia shows that effective trade and industrial policies, pro-growth macros, and so on are probably much more relevant.
Keith Griffin once wrote that foreign aid may well end up simply substituting domestic savings (Griffin, 1970); well, post-reform LA seems to indicate that in DCs FDI also could have a strong substituting effect on national private investment — except, of course, in Asia.
However, what is still unclear is why (despite the huge share of national income appropriated by the top earners, well-defined and enforced property-rights, ‘pro-market’ reforms, and a tsunami of FDI) every time private investment in LA manages to rise much above 15% of GDP its capitalist élite starts experiencing feelings of vertigo. From this perspective, the most striking political-economy difference between LA and Asia is found in their contrasting relationships between investment and income distribution (Figure 15).
multinationals, only able to operate in (protected) non-tradable activities (including domestic finance and utilities). To paraphrase Oscar Wilde, for LA to have been conquered by Spain once may be regarded as a misfortune; twice looks like carelessness.
30
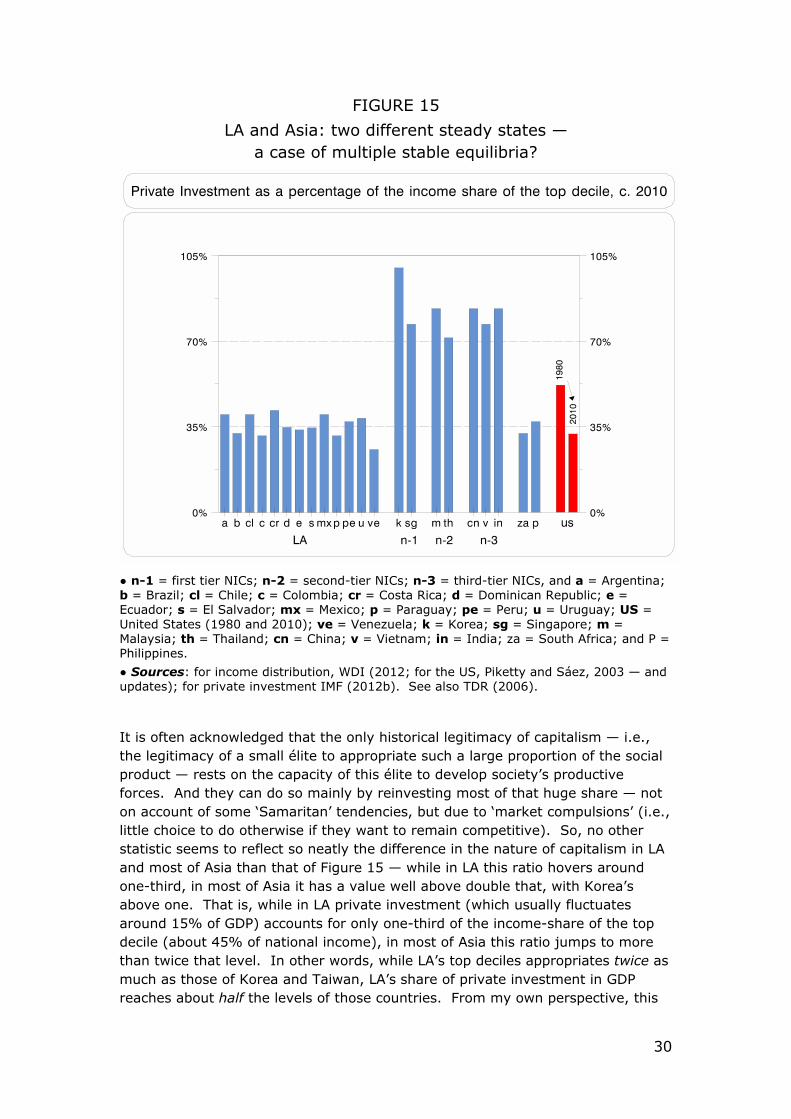
FIGURE 15
LA and Asia: two different steady states — a case of multiple stable equilibria?
● n-1 = first tier NICs; n-2 = second-tier NICs; n-3 = third-tier NICs, and a = Argentina; b = Brazil; cl = Chile; c = Colombia; cr = Costa Rica; d = Dominican Republic; e = Ecuador; s = El Salvador; mx = Mexico; p = Paraguay; pe = Peru; u = Uruguay; US = United States (1980 and 2010); ve = Venezuela; k = Korea; sg = Singapore; m = Malaysia; th = Thailand; cn = China; v = Vietnam; in = India; za = South Africa; and P = Philippines.
● Sources: for income distribution, WDI (2012; for the US, Piketty and Sáez, 2003 — and updates); for private investment IMF (2012b). See also TDR (2006).
It is often acknowledged that the only historical legitimacy of capitalism — i.e., the legitimacy of a small élite to appropriate such a large proportion of the social product — rests on the capacity of this élite to develop society’s productive forces. And they can do so mainly by reinvesting most of that huge share — not on account of some ‘Samaritan’ tendencies, but due to ‘market compulsions’ (i.e., little choice to do otherwise if they want to remain competitive). So, no other statistic seems to reflect so neatly the difference in the nature of capitalism in LA and most of Asia than that of Figure 15 — while in LA this ratio hovers around one-third, in most of Asia it has a value well above double that, with Korea’s above one. That is, while in LA private investment (which usually fluctuates around 15% of GDP) accounts for only one-third of the income-share of the top decile (about 45% of national income), in most of Asia this ratio jumps to more than twice that level. In other words, while LA’s top deciles appropriates twice as much as those of Korea and Taiwan, LA’s share of private investment in GDP reaches about half the levels of those countries. From my own perspective, this
31
is the most crucial characteristic of the (sub-prime) nature of LA’s capitalism, including, of course, Brazil’s: what I like to call ‘the two-times-half-style capitalism’ — i.e., how to create a political settlement that allows for institutional arrangements in which (thanks to weak market compulsions) one can get twice as much (than in Asia), with half the effort.25 And FDI, instead of making a positive impact on that asymmetry, has been happy to accommodate.26 In other words, from this perspective, in LA and Asia capitalism has the two steady states; and they seem to be a good example of what for mainstream thinking would be a contradiction in terms: multiple equilibria with more than one (long-term) stable solution.
Figure 15 also shows that in South Africa (in this respect, LA’s honorary middle-income country in Africa), and in The Philippines (the honorary one in Asia) similar low ratios as those of LA for private investment as a proportion of the income share of the top decile indicate that their capitalist élites have the same Latin preference for having their cake and eating it! Also, as discussed in detail in Palma (2009c), it seems that now with globalisation there is some ‘Latin-contagion’ going around, as LA is now exporting some crucial features of its political settlement and distributional outcome to the US. As Figure 15 indicates, in the latter country, private investment as a percentage of the income share of the top decile has fallen from above half (the year Reagan was elected) to a more relaxed Latin level of just under one-third. Also, what happened in Florida during the 2000 presidential election and in Ohio in that of 2004, and all the massive corruption that has been uncovered in Wall Street since the 2008 global financial crisis maybe are just the sign of things to come in the US — as the electoral fraud engineered there could have come straight from the PRI’s toolbox across the Rio Grande, and the corruption in financial markets straight from LA’s privatisation extravaganza. In other words, and as opposed to Marx’s prediction, now it is the less developed countries that seem to be showing the more industrialised ones the image of their own future!
Figure 16 shows one of the key components of the poor investment effort in LA after neo-liberal reforms — the collapse of public investment.
25 TFP aficionados, however, may well argue that there is a positive twist in this. 26 For example, the share of LA in Banco Santander’s worldwide profits is twice that of its assets, while in its European operations it is exactly the other way round (see Palma, 2010). According to the Financial Times, in Brazil banks (both homegrown ones, and foreign-owned operators) tend to have a 25% return on equity, which is about twice that of their international peers (http://www.ft.com/cms/ s/0/d208d83c-2769-11e2-abcb-001 44feabdc0.html#axzz2BWN 3I99x).
32
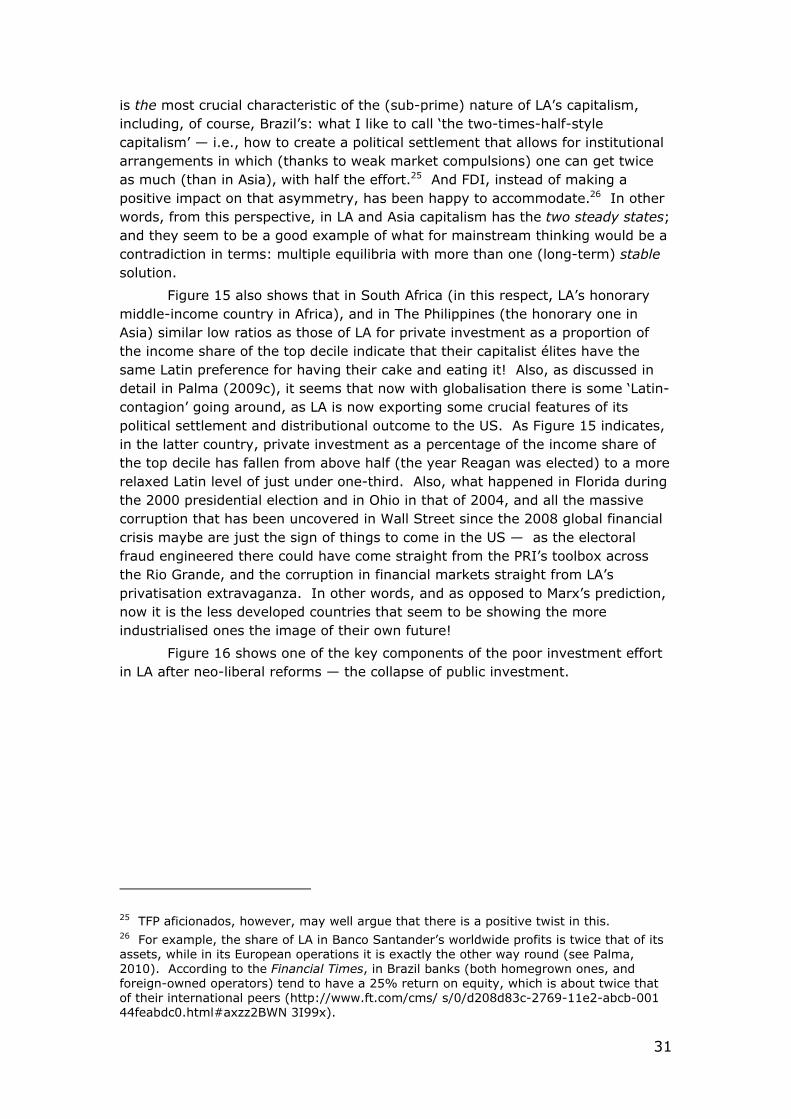
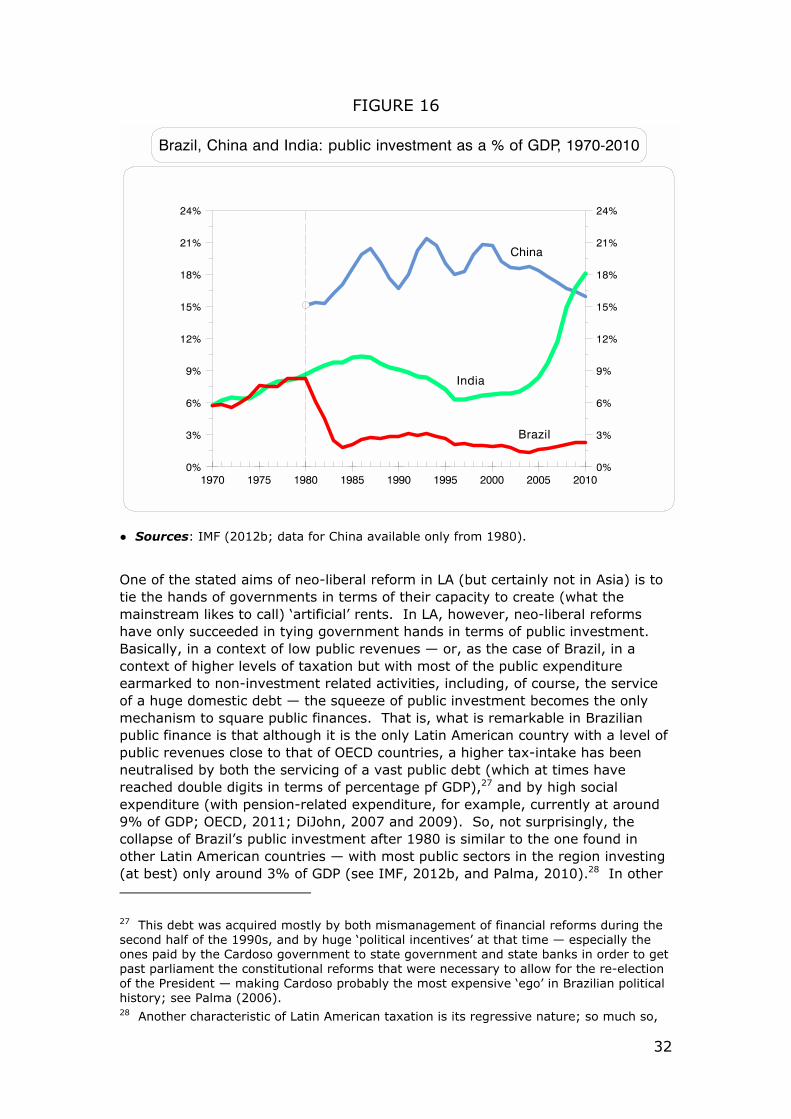
FIGURE 16
● Sources: IMF (2012b; data for China available only from 1980).
One of the stated aims of neo-liberal reform in LA (but certainly not in Asia) is to tie the hands of governments in terms of their capacity to create (what the mainstream likes to call) ‘artificial’ rents. In LA, however, neo-liberal reforms have only succeeded in tying government hands in terms of public investment. Basically, in a context of low public revenues — or, as the case of Brazil, in a context of higher levels of taxation but with most of the public expenditure earmarked to non-investment related activities, including, of course, the service of a huge domestic debt — the squeeze of public investment becomes the only mechanism to square public finances. That is, what is remarkable in Brazilian public finance is that although it is the only Latin American country with a level of public revenues close to that of OECD countries, a higher tax-intake has been neutralised by both the servicing of a vast public debt (which at times have reached double digits in terms of percentage pf GDP),27 and by high social expenditure (with pension-related expenditure, for example, currently at around 9% of GDP; OECD, 2011; DiJohn, 2007 and 2009). So, not surprisingly, the collapse of Brazil’s public investment after 1980 is similar to the one found in other Latin American countries — with most public sectors in the region investing (at best) only around 3% of GDP (see IMF, 2012b, and Palma, 2010).28 In other
27 This debt was acquired mostly by both mismanagement of financial reforms during the second half of the 1990s, and by huge ‘political incentives’ at that time — especially the ones paid by the Cardoso government to state government and state banks in order to get past parliament the constitutional reforms that were necessary to allow for the re-election of the President — making Cardoso probably the most expensive ‘ego’ in Brazilian political history; see Palma (2006). 28 Another characteristic of Latin American taxation is its regressive nature; so much so,
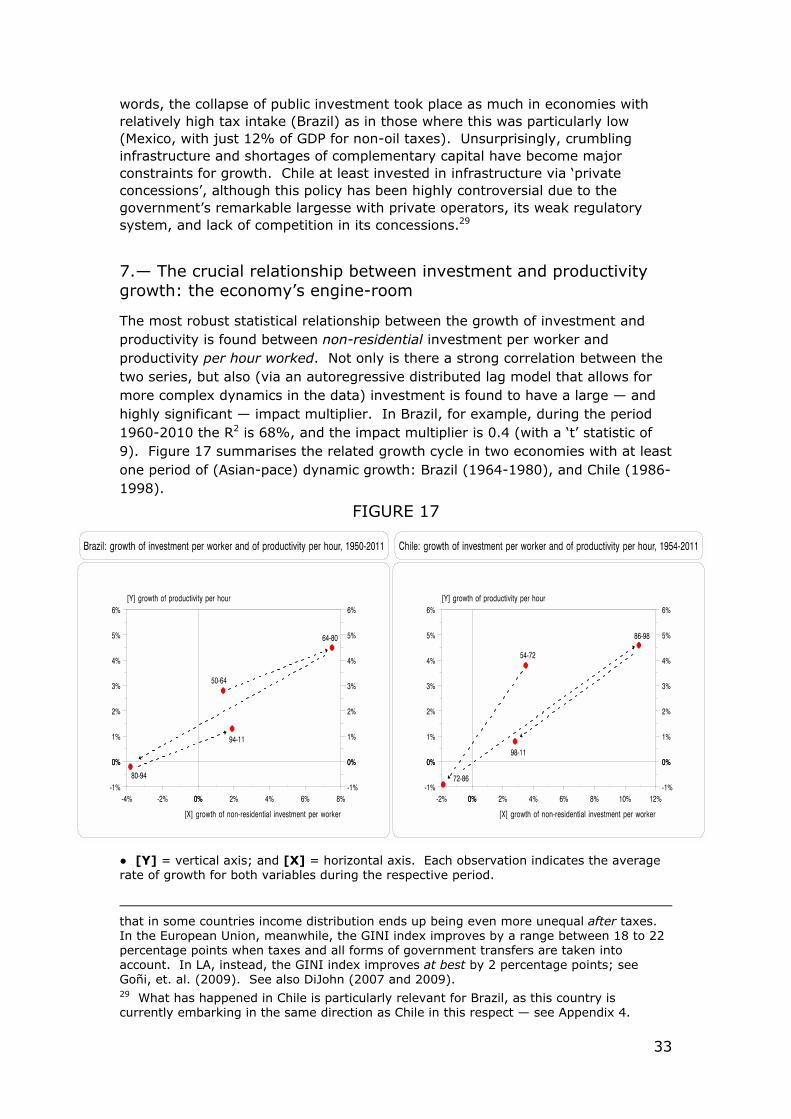
33
words, the collapse of public investment took place as much in economies with relatively high tax intake (Brazil) as in those where this was particularly low (Mexico, with just 12% of GDP for non-oil taxes). Unsurprisingly, crumbling infrastructure and shortages of complementary capital have become major constraints for growth. Chile at least invested in infrastructure via ‘private concessions’, although this policy has been highly controversial due to the government’s remarkable largesse with private operators, its weak regulatory system, and lack of competition in its concessions.29
7.— The crucial relationship between investment and productivity growth: the economy’s engine-room
The most robust statistical relationship between the growth of investment and productivity is found between non-residential investment per worker and productivity per hour worked. Not only is there a strong correlation between the two series, but also (via an autoregressive distributed lag model that allows for more complex dynamics in the data) investment is found to have a large — and highly significant — impact multiplier. In Brazil, for example, during the period 1960-2010 the R2 is 68%, and the impact multiplier is 0.4 (with a ‘t’ statistic of 9). Figure 17 summarises the related growth cycle in two economies with at least one period of (Asian-pace) dynamic growth: Brazil (1964-1980), and Chile (1986-1998).
FIGURE 17
● [Y] = vertical axis; and [X] = horizontal axis. Each observation indicates the average rate of growth for both variables during the respective period.
that in some countries income distribution ends up being even more unequal after taxes. In the European Union, meanwhile, the GINI index improves by a range between 18 to 22 percentage points when taxes and all forms of government transfers are taken into account. In LA, instead, the GINI index improves at best by 2 percentage points; see Goñi, et. al. (2009). See also DiJohn (2007 and 2009). 29 What has happened in Chile is particularly relevant for Brazil, as this country is currently embarking in the same direction as Chile in this respect — see Appendix 4.
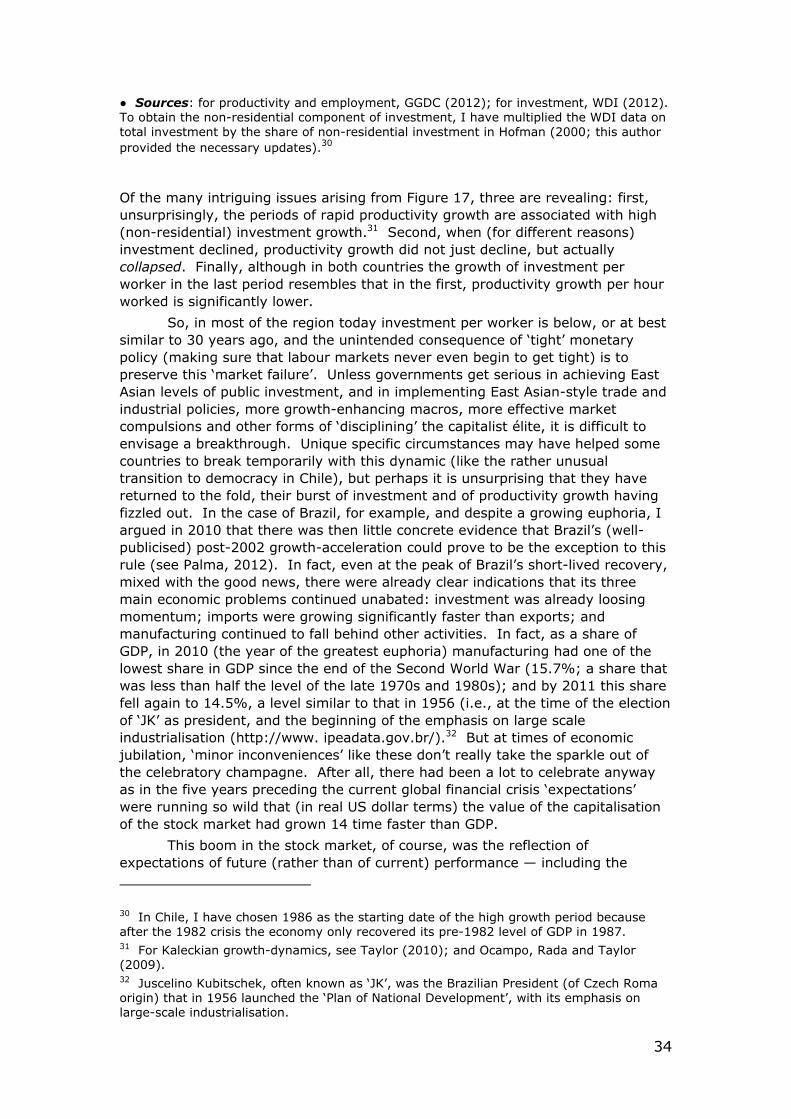
34
● Sources: for productivity and employment, GGDC (2012); for investment, WDI (2012). To obtain the non-residential component of investment, I have multiplied the WDI data on total investment by the share of non-residential investment in Hofman (2000; this author provided the necessary updates).30
Of the many intriguing issues arising from Figure 17, three are revealing: first, unsurprisingly, the periods of rapid productivity growth are associated with high (non-residential) investment growth.31 Second, when (for different reasons) investment declined, productivity growth did not just decline, but actually collapsed. Finally, although in both countries the growth of investment per worker in the last period resembles that in the first, productivity growth per hour worked is significantly lower.
So, in most of the region today investment per worker is below, or at best similar to 30 years ago, and the unintended consequence of ‘tight’ monetary policy (making sure that labour markets never even begin to get tight) is to preserve this ‘market failure’. Unless governments get serious in achieving East Asian levels of public investment, and in implementing East Asian-style trade and industrial policies, more growth-enhancing macros, more effective market compulsions and other forms of ‘disciplining’ the capitalist élite, it is difficult to envisage a breakthrough. Unique specific circumstances may have helped some countries to break temporarily with this dynamic (like the rather unusual transition to democracy in Chile), but perhaps it is unsurprising that they have returned to the fold, their burst of investment and of productivity growth having fizzled out. In the case of Brazil, for example, and despite a growing euphoria, I argued in 2010 that there was then little concrete evidence that Brazil’s (well-publicised) post-2002 growth-acceleration could prove to be the exception to this rule (see Palma, 2012). In fact, even at the peak of Brazil’s short-lived recovery, mixed with the good news, there were already clear indications that its three main economic problems continued unabated: investment was already loosing momentum; imports were growing significantly faster than exports; and manufacturing continued to fall behind other activities. In fact, as a share of GDP, in 2010 (the year of the greatest euphoria) manufacturing had one of the lowest share in GDP since the end of the Second World War (15.7%; a share that was less than half the level of the late 1970s and 1980s); and by 2011 this share fell again to 14.5%, a level similar to that in 1956 (i.e., at the time of the election of ‘JK’ as president, and the beginning of the emphasis on large scale industrialisation (http://www. ipeadata.gov.br/).32 But at times of economic jubilation, ‘minor inconveniences’ like these don’t really take the sparkle out of the celebratory champagne. After all, there had been a lot to celebrate anyway as in the five years preceding the current global financial crisis ‘expectations’ were running so wild that (in real US dollar terms) the value of the capitalisation of the stock market had grown 14 time faster than GDP.
This boom in the stock market, of course, was the reflection of expectations of future (rather than of current) performance — including the
30 In Chile, I have chosen 1986 as the starting date of the high growth period because after the 1982 crisis the economy only recovered its pre-1982 level of GDP in 1987. 31 For Kaleckian growth-dynamics, see Taylor (2010); and Ocampo, Rada and Taylor (2009). 32 Juscelino Kubitschek, often known as ‘JK’, was the Brazilian President (of Czech Roma origin) that in 1956 launched the ‘Plan of National Development’, with its emphasis on large-scale industrialisation.
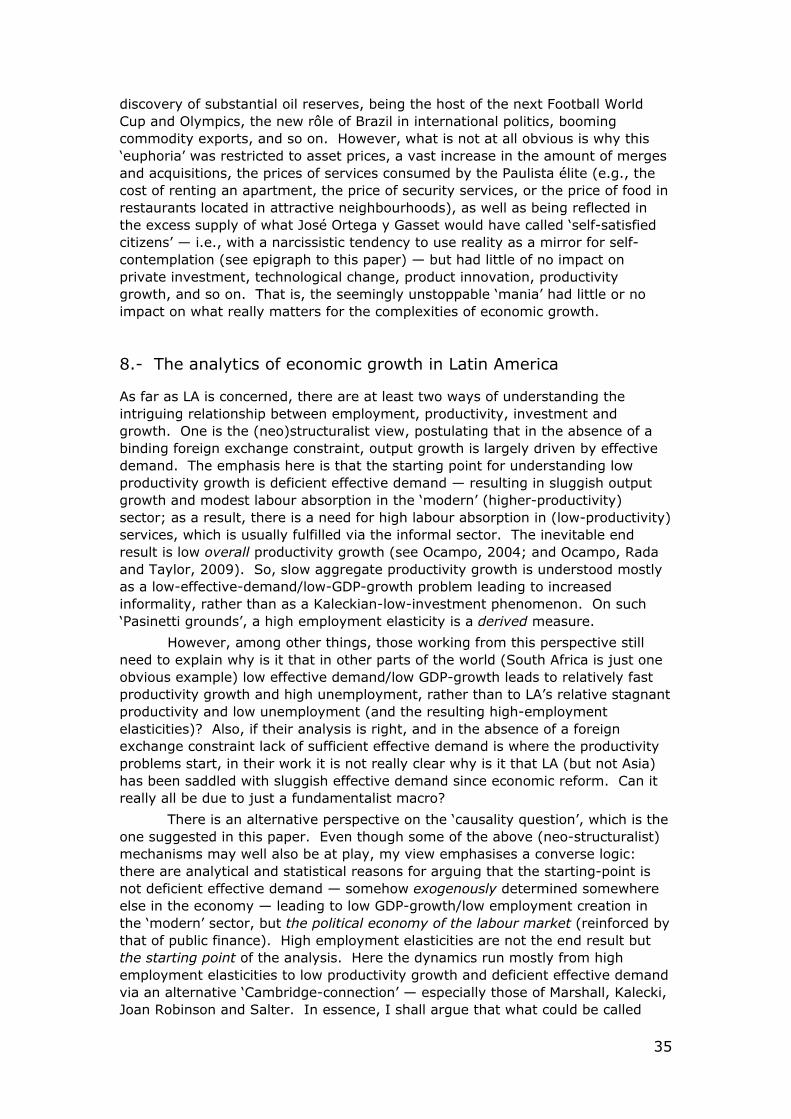
35
discovery of substantial oil reserves, being the host of the next Football World Cup and Olympics, the new rôle of Brazil in international politics, booming commodity exports, and so on. However, what is not at all obvious is why this ‘euphoria’ was restricted to asset prices, a vast increase in the amount of merges and acquisitions, the prices of services consumed by the Paulista élite (e.g., the cost of renting an apartment, the price of security services, or the price of food in restaurants located in attractive neighbourhoods), as well as being reflected in the excess supply of what José Ortega y Gasset would have called ‘self-satisfied citizens’ — i.e., with a narcissistic tendency to use reality as a mirror for self-contemplation (see epigraph to this paper) — but had little of no impact on private investment, technological change, product innovation, productivity growth, and so on. That is, the seemingly unstoppable ‘mania’ had little or no impact on what really matters for the complexities of economic growth.
8.- The analytics of economic growth in Latin America
As far as LA is concerned, there are at least two ways of understanding the intriguing relationship between employment, productivity, investment and growth. One is the (neo)structuralist view, postulating that in the absence of a binding foreign exchange constraint, output growth is largely driven by effective demand. The emphasis here is that the starting point for understanding low productivity growth is deficient effective demand — resulting in sluggish output growth and modest labour absorption in the ‘modern’ (higher-productivity) sector; as a result, there is a need for high labour absorption in (low-productivity) services, which is usually fulfilled via the informal sector. The inevitable end result is low overall productivity growth (see Ocampo, 2004; and Ocampo, Rada and Taylor, 2009). So, slow aggregate productivity growth is understood mostly as a low-effective-demand/low-GDP-growth problem leading to increased informality, rather than as a Kaleckian-low-investment phenomenon. On such ‘Pasinetti grounds’, a high employment elasticity is a derived measure.
However, among other things, those working from this perspective still need to explain why is it that in other parts of the world (South Africa is just one obvious example) low effective demand/low GDP-growth leads to relatively fast productivity growth and high unemployment, rather than to LA’s relative stagnant productivity and low unemployment (and the resulting high-employment elasticities)? Also, if their analysis is right, and in the absence of a foreign exchange constraint lack of sufficient effective demand is where the productivity problems start, in their work it is not really clear why is it that LA (but not Asia) has been saddled with sluggish effective demand since economic reform. Can it really all be due to just a fundamentalist macro?
There is an alternative perspective on the ‘causality question’, which is the one suggested in this paper. Even though some of the above (neo-structuralist) mechanisms may well also be at play, my view emphasises a converse logic: there are analytical and statistical reasons for arguing that the starting-point is not deficient effective demand — somehow exogenously determined somewhere else in the economy — leading to low GDP-growth/low employment creation in the ‘modern’ sector, but the political economy of the labour market (reinforced by that of public finance). High employment elasticities are not the end result but the starting point of the analysis. Here the dynamics run mostly from high employment elasticities to low productivity growth and deficient effective demand via an alternative ‘Cambridge-connection’ — especially those of Marshall, Kalecki, Joan Robinson and Salter. In essence, I shall argue that what could be called
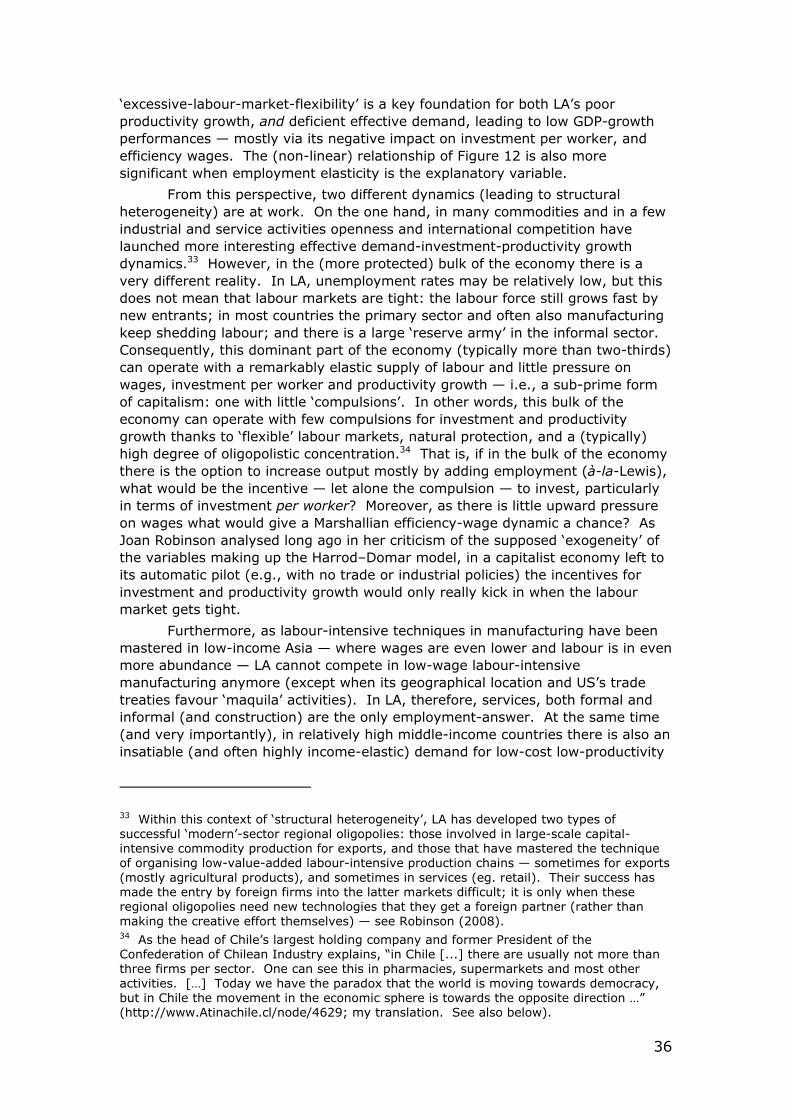
36
‘excessive-labour-market-flexibility’ is a key foundation for both LA’s poor productivity growth, and deficient effective demand, leading to low GDP-growth performances — mostly via its negative impact on investment per worker, and efficiency wages. The (non-linear) relationship of Figure 12 is also more significant when employment elasticity is the explanatory variable.
From this perspective, two different dynamics (leading to structural heterogeneity) are at work. On the one hand, in many commodities and in a few industrial and service activities openness and international competition have launched more interesting effective demand-investment-productivity growth dynamics.33 However, in the (more protected) bulk of the economy there is a very different reality. In LA, unemployment rates may be relatively low, but this does not mean that labour markets are tight: the labour force still grows fast by new entrants; in most countries the primary sector and often also manufacturing keep shedding labour; and there is a large ‘reserve army’ in the informal sector. Consequently, this dominant part of the economy (typically more than two-thirds) can operate with a remarkably elastic supply of labour and little pressure on wages, investment per worker and productivity growth — i.e., a sub-prime form of capitalism: one with little ‘compulsions’. In other words, this bulk of the economy can operate with few compulsions for investment and productivity growth thanks to ‘flexible’ labour markets, natural protection, and a (typically) high degree of oligopolistic concentration.34 That is, if in the bulk of the economy there is the option to increase output mostly by adding employment (à-la-Lewis), what would be the incentive — let alone the compulsion — to invest, particularly in terms of investment per worker? Moreover, as there is little upward pressure on wages what would give a Marshallian efficiency-wage dynamic a chance? As Joan Robinson analysed long ago in her criticism of the supposed ‘exogeneity’ of the variables making up the Harrod–Domar model, in a capitalist economy left to its automatic pilot (e.g., with no trade or industrial policies) the incentives for investment and productivity growth would only really kick in when the labour market gets tight.
Furthermore, as labour-intensive techniques in manufacturing have been mastered in low-income Asia — where wages are even lower and labour is in even more abundance — LA cannot compete in low-wage labour-intensive manufacturing anymore (except when its geographical location and US’s trade treaties favour ‘maquila’ activities). In LA, therefore, services, both formal and informal (and construction) are the only employment-answer. At the same time (and very importantly), in relatively high middle-income countries there is also an insatiable (and often highly income-elastic) demand for low-cost low-productivity
33 Within this context of ‘structural heterogeneity’, LA has developed two types of successful ‘modern’-sector regional oligopolies: those involved in large-scale capital-intensive commodity production for exports, and those that have mastered the technique of organising low-value-added labour-intensive production chains — sometimes for exports (mostly agricultural products), and sometimes in services (eg. retail). Their success has made the entry by foreign firms into the latter markets difficult; it is only when these regional oligopolies need new technologies that they get a foreign partner (rather than making the creative effort themselves) — see Robinson (2008). 34 As the head of Chile’s largest holding company and former President of the Confederation of Chilean Industry explains, “in Chile [...] there are usually not more than three firms per sector. One can see this in pharmacies, supermarkets and most other activities. […] Today we have the paradox that the world is moving towards democracy, but in Chile the movement in the economic sphere is towards the opposite direction …” (http://www.Atinachile.cl/node/4629; my translation. See also below).
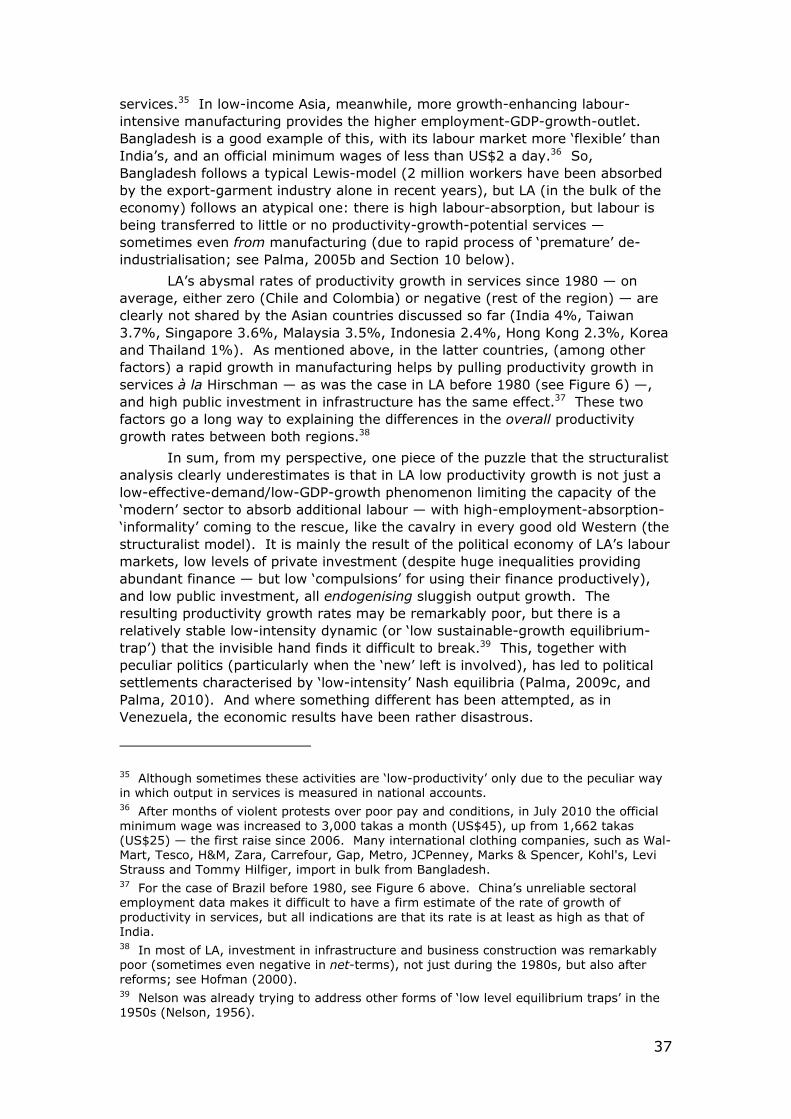
37
services.35 In low-income Asia, meanwhile, more growth-enhancing labour-intensive manufacturing provides the higher employment-GDP-growth-outlet. Bangladesh is a good example of this, with its labour market more ‘flexible’ than India’s, and an official minimum wages of less than US$2 a day.36 So, Bangladesh follows a typical Lewis-model (2 million workers have been absorbed by the export-garment industry alone in recent years), but LA (in the bulk of the economy) follows an atypical one: there is high labour-absorption, but labour is being transferred to little or no productivity-growth-potential services — sometimes even from manufacturing (due to rapid process of ‘premature’ de-industrialisation; see Palma, 2005b and Section 10 below).
LA’s abysmal rates of productivity growth in services since 1980 — on average, either zero (Chile and Colombia) or negative (rest of the region) — are clearly not shared by the Asian countries discussed so far (India 4%, Taiwan 3.7%, Singapore 3.6%, Malaysia 3.5%, Indonesia 2.4%, Hong Kong 2.3%, Korea and Thailand 1%). As mentioned above, in the latter countries, (among other factors) a rapid growth in manufacturing helps by pulling productivity growth in services à la Hirschman — as was the case in LA before 1980 (see Figure 6) —, and high public investment in infrastructure has the same effect.37 These two factors go a long way to explaining the differences in the overall productivity growth rates between both regions.38
In sum, from my perspective, one piece of the puzzle that the structuralist analysis clearly underestimates is that in LA low productivity growth is not just a low-effective-demand/low-GDP-growth phenomenon limiting the capacity of the ‘modern’ sector to absorb additional labour — with high-employment-absorption-‘informality’ coming to the rescue, like the cavalry in every good old Western (the structuralist model). It is mainly the result of the political economy of LA’s labour markets, low levels of private investment (despite huge inequalities providing abundant finance — but low ‘compulsions’ for using their finance productively), and low public investment, all endogenising sluggish output growth. The resulting productivity growth rates may be remarkably poor, but there is a relatively stable low-intensity dynamic (or ‘low sustainable-growth equilibrium-trap’) that the invisible hand finds it difficult to break.39 This, together with peculiar politics (particularly when the ‘new’ left is involved), has led to political settlements characterised by ‘low-intensity’ Nash equilibria (Palma, 2009c, and Palma, 2010). And where something different has been attempted, as in Venezuela, the economic results have been rather disastrous.
35 Although sometimes these activities are ‘low-productivity’ only due to the peculiar way in which output in services is measured in national accounts. 36 After months of violent protests over poor pay and conditions, in July 2010 the official minimum wage was increased to 3,000 takas a month (US$45), up from 1,662 takas (US$25) — the first raise since 2006. Many international clothing companies, such as Wal-Mart, Tesco, H&M, Zara, Carrefour, Gap, Metro, JCPenney, Marks & Spencer, Kohl's, Levi Strauss and Tommy Hilfiger, import in bulk from Bangladesh. 37 For the case of Brazil before 1980, see Figure 6 above. China’s unreliable sectoral employment data makes it difficult to have a firm estimate of the rate of growth of productivity in services, but all indications are that its rate is at least as high as that of India. 38 In most of LA, investment in infrastructure and business construction was remarkably poor (sometimes even negative in net-terms), not just during the 1980s, but also after reforms; see Hofman (2000). 39 Nelson was already trying to address other forms of ‘low level equilibrium traps’ in the 1950s (Nelson, 1956).

38
Ultimately, as long as Brazil does not defy its ‘middle-income growth-trap’ there is the possibility — as in most of LA’s — of an unremarkable steady state. In this scenario, commodities (helped by unprecedented favourable prices) can provide the foreign exchange, services can deliver single-digit unemployment rates (generating a massive amount of precarious, low-productivity and low-wage employment, both formal and informal), while financial markets can provided a great deal of fun — in the five years preceding the global financial crisis (2002-2007), in LA the capitalisation of the stock exchanges increased annually by 45% in real terms, bank assets by 21%, and private and public bonds by 22% and 25% (see IMF, 2012a).
So, what is really wrong in post-reform LA is that neither the really ‘modern’ sector (usually associated with large-scale commodity production, although in Mexico also with its non-maquila manufacturing exports, and in Brazil with many of its ‘BNDES-encouraged’ manufacturing), nor the rest of the formal economy (mostly oriented towards the domestic market, although lately more regionally oriented), or (unsurprisingly) the informal sector are able to generate much of what really matters for the complexities of economic growth — i.e., the externalities and the spill-over effects that may help set in motion processes of cumulative causation that take advantage of dynamic economies of scale, increasing returns, etc.40 That is, those issues which are central to the ‘how-one-thing-leads-to-another’ Hirschmanian growth-philosophy when dealing with such intricate market (and other institutional) structures as those that characterise developing countries — complexities that get even more intricate as developing countries move to middle and high-middle income levels.
Although neo-liberals were just about the only political group who really understood Kalecki’s hypothesis that capitalism cannot endure the political consequences of sustained periods of full employment, Latin American neo-liberals have overshot in the opposite direction: capitalism with clearly insufficient labour market compulsions seems not to work very effectively either. That is, as capitalists practically need not compete with each other in the labour market, there are few market pressures coming from this direction either forcing productivity growth, or the investment levels necessary to back this up.
To perpetuate this, in most countries there is no collective bargaining, strike-breakers are legal, and sub-contracting labour (as a mechanism to bypass even timid labour legislation) is widespread — even in the public sector. At the same time, minimum wages in most countries are set at remarkably low levels (in Mexico, for example, in 2010 the value of the minimum wage was worth just one-third of its 1976 level).41 In fact, the only Latin American neo-liberals that have paid some attention to Churchill’s views that low wages only subsidise inefficient producers are found in the ‘new’ left in Chile and Brazil (as well as in Argentina
40 These are the kind of (difficult-to-model) issues that were usually ignored by traditional (constant-returns-cum-perfect-competition) mainstream economics, and are now tackled (but so far not very successfully) by the ‘new’ growth-traditions in mainstream thought. In ‘new-growth’ theory, for example, growth is now normally modelled as a function of market imperfections that somehow create increasing returns in the process of technical change—but this process is still explicitly modelled as not-sector-specific (see, for example, Aghion and Howitt, 1998; for a critique, see Palma, 2005b). 41 This is the value when its nominal level is deflated by the index of consumer prices; see http://www.inegi.org.mx; see also Palma (2005b). Furthermore, the Mexican Parliament is currently discussing a new labour legislation that should accentuate this — as well as end the little democracy that still exists in Mexican unions (by, for example, making it legal for a union not to have secret ballots).
39
after the 2001 crisis).42 These countries have followed a policy of rising minimum wages and subdivides for the poor, which have not only had a significant impact on poverty alleviation, but have also fostered effective demand.43 However, in these countries, there are still activities in which workers do not have the right to a legal minimum wage, or some other basic right — domestic servants in Chile, for example, an occupation that accounts for 12% of female employment, still do not have a minimum wage, and their legal working hours are 12 per day.44 Moreover, in those activities where minimum wages do apply, they are often ignored; and even in the formal sector, many workers do not have a labour contract.45 And so on. Also, at the first sign of labour markets getting tight, not just ‘independent’ Central Banks, but also ‘progressive’ governments are quick to react. In Chile, for example, in the early 2000s when the market for domestic servants became slightly tight, and meagre wages began to increase, the government (presided over by a member of the Socialist Party) immediately opened up immigration from Peru — many things are possible in LA, but middle classes unable to afford domestic servants is not one of them.
9.– Exports as a faltering engine of growth: the ‘middle-income export-trap’
As far as exports are concerned, LA moved from a situation in which pre-1980 exports and GDP were growing in the long-run at the same pace (5.5% p.a. between 1950 and 1980; ECLAC, 2012, data in US$-2000), to one where exports grew more than twice as fast as GDP (1980-2010). However, the latter happened simply because exports continued to grow at the same pace (5.5%), while GDP-growth collapsed to 2.6% p.a. (WDI, 2012).46 These post-1980 rates became even more disproportional in Mexico (8.4% and 2.3%), and in Brazil (6.8% and 2.6%, respectively, having been 6.9% and 7% before 1980; Ibid.). As in the pre-1980 ISI period, income elasticities for imports were certainly higher than one, a unitary GDP-elasticity for exports created an inevitable foreign exchange constraint on growth (and a resulting accumulation of foreign debt). Therefore, a pro-exports policy re-engineering was surely inevitable. However, the one chosen has not been the most effective ‘export-led’ growth model: in fact, even taking into account only the post-reform period (i.e., not counting the difficult
42 In his speech to the House of Commons proposing the legislation to create ‘Trade Boards’ to regulate workers’ remuneration in industries with low wages (28 April 1909), for example, Churchill explained that the Boards were necessary in industries where the bargaining strength of employers greatly outweighed that of workers. According to him, “[...] where you have what we call sweated trades, you have no organisation, no parity of bargaining, the good employer is undercut by the bad, and the bad employer is undercut by the worst.” For an analysis of the minimum wage in Britain, see http://www.iatge.de/ aktuell/veroeff/2005/gr2005-01.pdf. 43 In Brazil, the poverty rate has been halved since 1991 (OECD, 2011). And in Chile, the amount necessary to cover a ‘basket of basic needs’ for an average-sized family (i.e., the poverty line for the average family) fell from 4.3 minimum wages to 2.4 during the 1990s (reaching the landmark of 2 in 2005). See Infante, et. al. (2003); and Palma (2011). 44 According to the main household survey, in 2006 their average working week actually reached 75 hours; see http://www.mideplan.cl/casen/. 45 In Chile, in 2000, half of the workers in non-agricultural firms that earned the minimum wage or less did not have a labour contract; see Infante, Marinakis and Velasco, (2003). 46 This source (WDI) also confirms the pre-1980 symmetry between exports and GDP-growth — 5.2% and 5.5%, respectively, for the period 1960-1980 (in this database there is no data for the 1950s; see WDI, 2012.
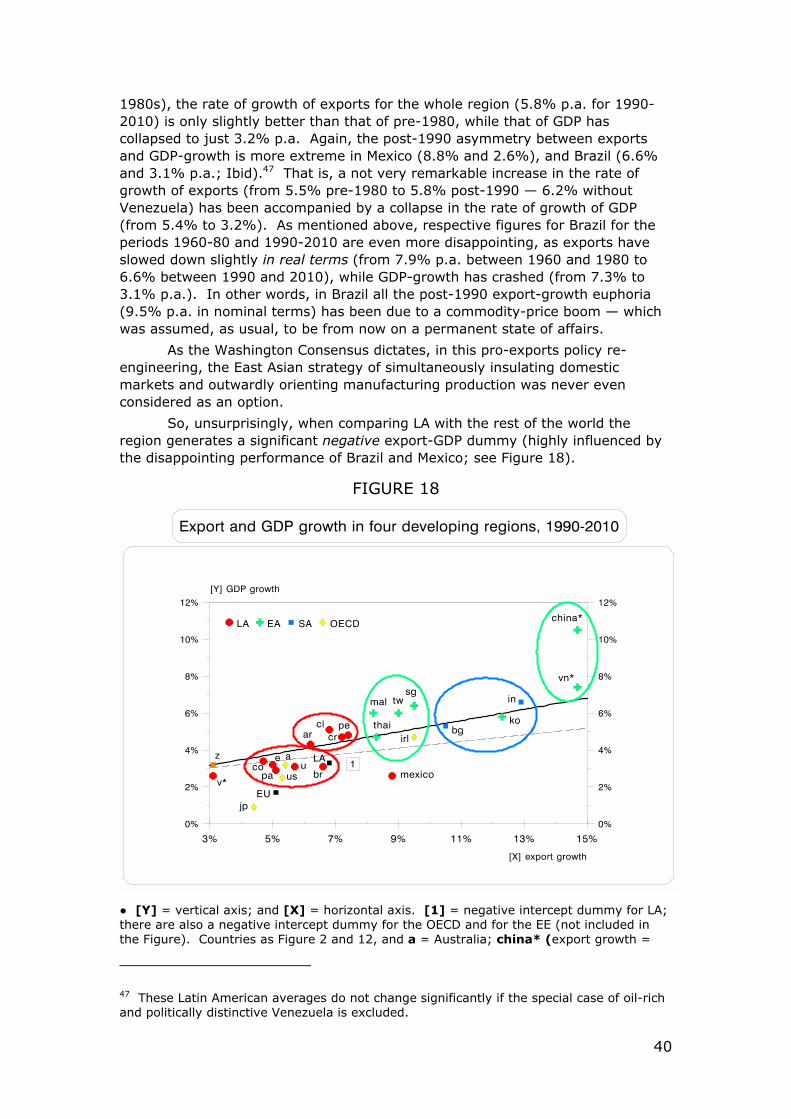
40
1980s), the rate of growth of exports for the whole region (5.8% p.a. for 1990-2010) is only slightly better than that of pre-1980, while that of GDP has collapsed to just 3.2% p.a. Again, the post-1990 asymmetry between exports and GDP-growth is more extreme in Mexico (8.8% and 2.6%), and Brazil (6.6% and 3.1% p.a.; Ibid).47 That is, a not very remarkable increase in the rate of growth of exports (from 5.5% pre-1980 to 5.8% post-1990 — 6.2% without Venezuela) has been accompanied by a collapse in the rate of growth of GDP (from 5.4% to 3.2%). As mentioned above, respective figures for Brazil for the periods 1960-80 and 1990-2010 are even more disappointing, as exports have slowed down slightly in real terms (from 7.9% p.a. between 1960 and 1980 to 6.6% between 1990 and 2010), while GDP-growth has crashed (from 7.3% to 3.1% p.a.). In other words, in Brazil all the post-1990 export-growth euphoria (9.5% p.a. in nominal terms) has been due to a commodity-price boom — which was assumed, as usual, to be from now on a permanent state of affairs.
As the Washington Consensus dictates, in this pro-exports policy re-engineering, the East Asian strategy of simultaneously insulating domestic markets and outwardly orienting manufacturing production was never even considered as an option.
So, unsurprisingly, when comparing LA with the rest of the world the region generates a significant negative export-GDP dummy (highly influenced by the disappointing performance of Brazil and Mexico; see Figure 18).
FIGURE 18
● [Y] = vertical axis; and [X] = horizontal axis. [1] = negative intercept dummy for LA; there are also a negative intercept dummy for the OECD and for the EE (not included in the Figure). Countries as Figure 2 and 12, and a = Australia; china* (export growth =
47 These Latin American averages do not change significantly if the special case of oil-rich and politically distinctive Venezuela is excluded.
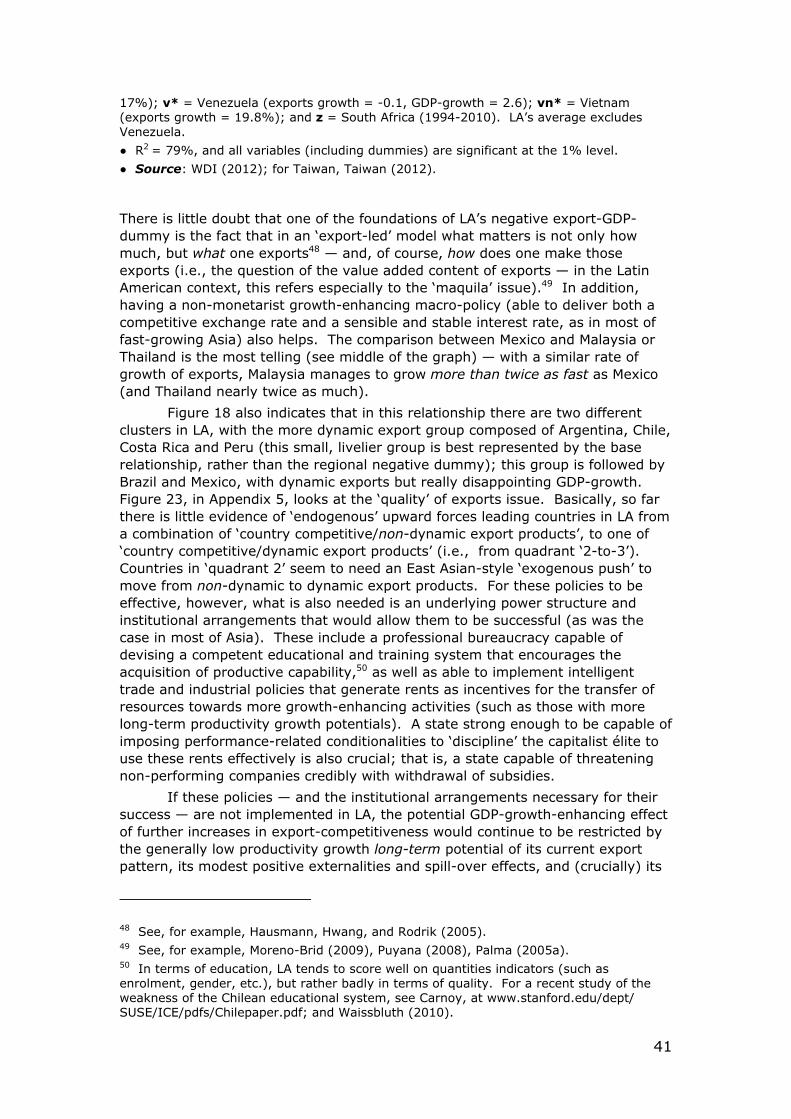
41
17%); v* = Venezuela (exports growth = -0.1, GDP-growth = 2.6); vn* = Vietnam (exports growth = 19.8%); and z = South Africa (1994-2010). LA’s average excludes Venezuela.
● R2 = 79%, and all variables (including dummies) are significant at the 1% level.
● Source: WDI (2012); for Taiwan, Taiwan (2012).
There is little doubt that one of the foundations of LA’s negative export-GDP-dummy is the fact that in an ‘export-led’ model what matters is not only how much, but what one exports48 — and, of course, how does one make those exports (i.e., the question of the value added content of exports — in the Latin American context, this refers especially to the ‘maquila’ issue).49 In addition, having a non-monetarist growth-enhancing macro-policy (able to deliver both a competitive exchange rate and a sensible and stable interest rate, as in most of fast-growing Asia) also helps. The comparison between Mexico and Malaysia or Thailand is the most telling (see middle of the graph) — with a similar rate of growth of exports, Malaysia manages to grow more than twice as fast as Mexico (and Thailand nearly twice as much).
Figure 18 also indicates that in this relationship there are two different clusters in LA, with the more dynamic export group composed of Argentina, Chile, Costa Rica and Peru (this small, livelier group is best represented by the base relationship, rather than the regional negative dummy); this group is followed by Brazil and Mexico, with dynamic exports but really disappointing GDP-growth. Figure 23, in Appendix 5, looks at the ‘quality’ of exports issue. Basically, so far there is little evidence of ‘endogenous’ upward forces leading countries in LA from a combination of ‘country competitive/non-dynamic export products’, to one of ‘country competitive/dynamic export products’ (i.e., from quadrant ‘2-to-3’). Countries in ‘quadrant 2’ seem to need an East Asian-style ‘exogenous push’ to move from non-dynamic to dynamic export products. For these policies to be effective, however, what is also needed is an underlying power structure and institutional arrangements that would allow them to be successful (as was the case in most of Asia). These include a professional bureaucracy capable of devising a competent educational and training system that encourages the acquisition of productive capability,50 as well as able to implement intelligent trade and industrial policies that generate rents as incentives for the transfer of resources towards more growth-enhancing activities (such as those with more long-term productivity growth potentials). A state strong enough to be capable of imposing performance-related conditionalities to ‘discipline’ the capitalist élite to use these rents effectively is also crucial; that is, a state capable of threatening non-performing companies credibly with withdrawal of subsidies.
If these policies — and the institutional arrangements necessary for their success — are not implemented in LA, the potential GDP-growth-enhancing effect of further increases in export-competitiveness would continue to be restricted by the generally low productivity growth long-term potential of its current export pattern, its modest positive externalities and spill-over effects, and (crucially) its
48 See, for example, Hausmann, Hwang, and Rodrik (2005). 49 See, for example, Moreno-Brid (2009), Puyana (2008), Palma (2005a). 50 In terms of education, LA tends to score well on quantities indicators (such as enrolment, gender, etc.), but rather badly in terms of quality. For a recent study of the weakness of the Chilean educational system, see Carnoy, at www.stanford.edu/dept/ SUSE/ICE/pdfs/Chilepaper.pdf; and Waissbluth (2010).
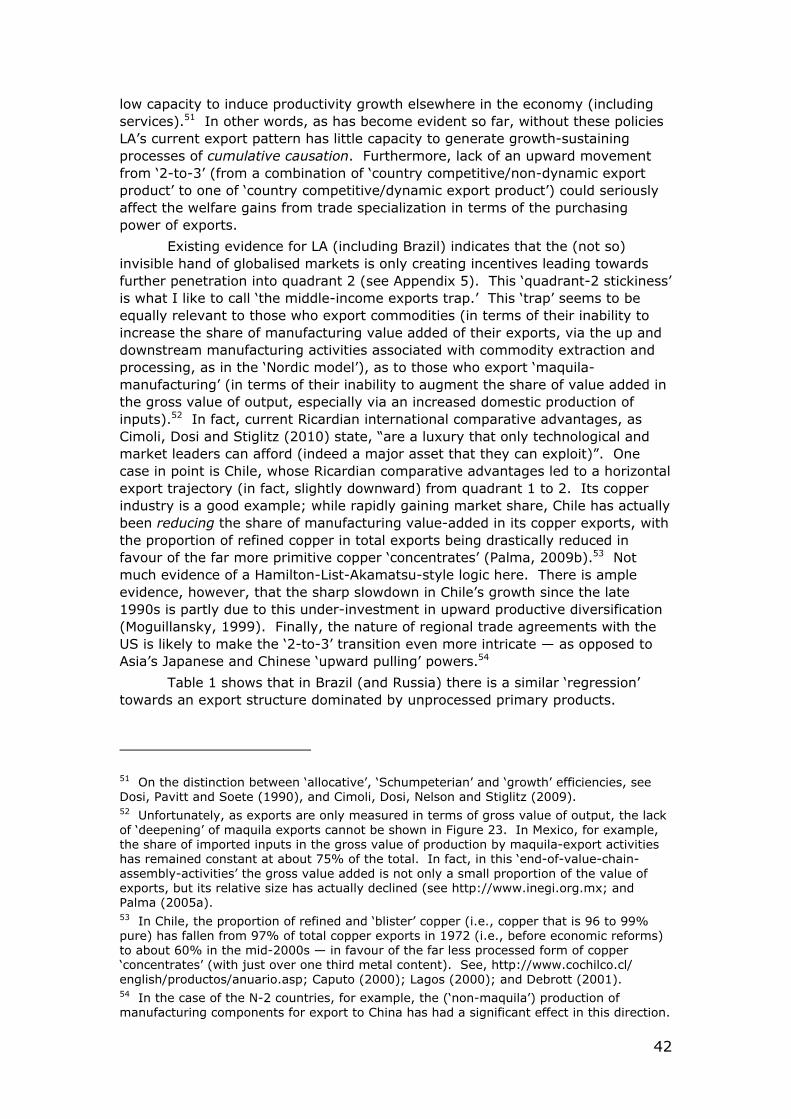
42
low capacity to induce productivity growth elsewhere in the economy (including services).51 In other words, as has become evident so far, without these policies LA’s current export pattern has little capacity to generate growth-sustaining processes of cumulative causation. Furthermore, lack of an upward movement from ‘2-to-3’ (from a combination of ‘country competitive/non-dynamic export product’ to one of ‘country competitive/dynamic export product’) could seriously affect the welfare gains from trade specialization in terms of the purchasing power of exports.
Existing evidence for LA (including Brazil) indicates that the (not so) invisible hand of globalised markets is only creating incentives leading towards further penetration into quadrant 2 (see Appendix 5). This ‘quadrant-2 stickiness’ is what I like to call ‘the middle-income exports trap.’ This ‘trap’ seems to be equally relevant to those who export commodities (in terms of their inability to increase the share of manufacturing value added of their exports, via the up and downstream manufacturing activities associated with commodity extraction and processing, as in the ‘Nordic model’), as to those who export ‘maquila-manufacturing’ (in terms of their inability to augment the share of value added in the gross value of output, especially via an increased domestic production of inputs).52 In fact, current Ricardian international comparative advantages, as Cimoli, Dosi and Stiglitz (2010) state, “are a luxury that only technological and market leaders can afford (indeed a major asset that they can exploit)”. One case in point is Chile, whose Ricardian comparative advantages led to a horizontal export trajectory (in fact, slightly downward) from quadrant 1 to 2. Its copper industry is a good example; while rapidly gaining market share, Chile has actually been reducing the share of manufacturing value-added in its copper exports, with the proportion of refined copper in total exports being drastically reduced in favour of the far more primitive copper ‘concentrates’ (Palma, 2009b).53 Not much evidence of a Hamilton-List-Akamatsu-style logic here. There is ample evidence, however, that the sharp slowdown in Chile’s growth since the late 1990s is partly due to this under-investment in upward productive diversification (Moguillansky, 1999). Finally, the nature of regional trade agreements with the US is likely to make the ‘2-to-3’ transition even more intricate — as opposed to Asia’s Japanese and Chinese ‘upward pulling’ powers.54
Table 1 shows that in Brazil (and Russia) there is a similar ‘regression’ towards an export structure dominated by unprocessed primary products.
51 On the distinction between ‘allocative’, ‘Schumpeterian’ and ‘growth’ efficiencies, see Dosi, Pavitt and Soete (1990), and Cimoli, Dosi, Nelson and Stiglitz (2009). 52 Unfortunately, as exports are only measured in terms of gross value of output, the lack of ‘deepening’ of maquila exports cannot be shown in Figure 23. In Mexico, for example, the share of imported inputs in the gross value of production by maquila-export activities has remained constant at about 75% of the total. In fact, in this ‘end-of-value-chain-assembly-activities’ the gross value added is not only a small proportion of the value of exports, but its relative size has actually declined (see http://www.inegi.org.mx; and Palma (2005a). 53 In Chile, the proportion of refined and ‘blister’ copper (i.e., copper that is 96 to 99% pure) has fallen from 97% of total copper exports in 1972 (i.e., before economic reforms) to about 60% in the mid-2000s — in favour of the far less processed form of copper ‘concentrates’ (with just over one third metal content). See, http://www.cochilco.cl/ english/productos/anuario.asp; Caputo (2000); Lagos (2000); and Debrott (2001). 54 In the case of the N-2 countries, for example, the (‘non-maquila’) production of manufacturing components for export to China has had a significant effect in this direction.
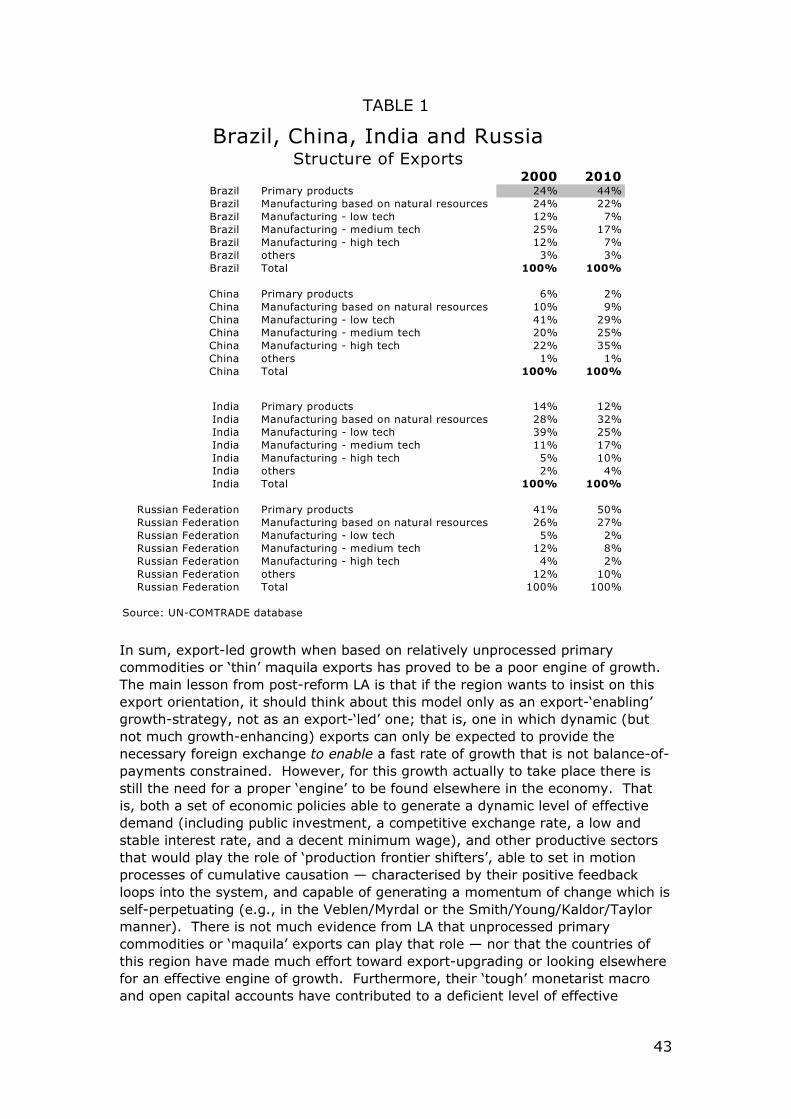
43
TABLE 1
Brazil, China, India and RussiaStructure of Exports
2000 2010Brazil Primary products 24% 44%Brazil Manufacturing based on natural resources 24% 22%Brazil Manufacturing - low tech 12% 7%Brazil Manufacturing - medium tech 25% 17%Brazil Manufacturing - high tech 12% 7%Brazil others 3% 3%Brazil Total 100% 100%
China Primary products 6% 2%China Manufacturing based on natural resources 10% 9%China Manufacturing - low tech 41% 29%China Manufacturing - medium tech 20% 25%China Manufacturing - high tech 22% 35%China others 1% 1%China Total 100% 100%
India Primary products 14% 12%India Manufacturing based on natural resources 28% 32%India Manufacturing - low tech 39% 25%India Manufacturing - medium tech 11% 17%India Manufacturing - high tech 5% 10%India others 2% 4%India Total 100% 100%
Russian Federation Primary products 41% 50%Russian Federation Manufacturing based on natural resources 26% 27%Russian Federation Manufacturing - low tech 5% 2%Russian Federation Manufacturing - medium tech 12% 8%Russian Federation Manufacturing - high tech 4% 2%Russian Federation others 12% 10%Russian Federation Total 100% 100%
Source: UN-COMTRADE database
In sum, export-led growth when based on relatively unprocessed primary commodities or ‘thin’ maquila exports has proved to be a poor engine of growth. The main lesson from post-reform LA is that if the region wants to insist on this export orientation, it should think about this model only as an export-‘enabling’ growth-strategy, not as an export-‘led’ one; that is, one in which dynamic (but not much growth-enhancing) exports can only be expected to provide the necessary foreign exchange to enable a fast rate of growth that is not balance-of-payments constrained. However, for this growth actually to take place there is still the need for a proper ‘engine’ to be found elsewhere in the economy. That is, both a set of economic policies able to generate a dynamic level of effective demand (including public investment, a competitive exchange rate, a low and stable interest rate, and a decent minimum wage), and other productive sectors that would play the role of ‘production frontier shifters’, able to set in motion processes of cumulative causation — characterised by their positive feedback loops into the system, and capable of generating a momentum of change which is self-perpetuating (e.g., in the Veblen/Myrdal or the Smith/Young/Kaldor/Taylor manner). There is not much evidence from LA that unprocessed primary commodities or ‘maquila’ exports can play that role — nor that the countries of this region have made much effort toward export-upgrading or looking elsewhere for an effective engine of growth. Furthermore, their ‘tough’ monetarist macro and open capital accounts have contributed to a deficient level of effective
44
demand by, among other things, switching a disproportionate amount of the aggregate demand towards foreign markets due to overvalued exchange rates.
As Stiglitz always insists, even from the narrow perspective of mainstream economics, in a world full of distortions the lifting of one (e.g., a trade barrier or a capital control) does not necessarily lead to a superior (let alone optimal) equilibrium. Or, as Lipsey and Lancaster demonstrated half a century ago, “if one of the Paretian optimum conditions cannot be fulfilled, a second best optimum situation is achieved only by departing from all other optimum conditions” (1956, p. 12, emphasis added). For example, if policy makers in LA ignore crucial distortions simply because they are out of bounds (such as Asian competitors with 'distorting' trade and industrial policies, and ‘distorting’ pro-growth macros) and design what they — from their mainstream perspective — consider to be 'first-best' policies (and apply, for example, flexible exchange rates, a low and flat import tariff, or abandon trade and industrial policies), then the likely outcome will not even be a 'second-best'. Additionally, if policy makers in LA keep assuming that they live in a world in which the ‘efficient capital market theory’ rules, and continue to implement sweeping financial deregulation and full opening of capital accounts (as if all that mattered in financial markets were self-regulation and market discipline), the likely outcome would be even more financialisation, overvalued exchange rates, and so on.55
Surely it is time to realize that free trade, Ricardian comparative advantages, fully open capital accounts, ‘flexible’ exchange rates, ‘independent’ monetary policy, regressive taxation, liberalized finance, economies on automatic pilot and policy ‘neutrality’, and so on may well be (from a logical point of view) internally coherent in mainstream power-point models, but the real world (perhaps fortunately) is a bit more complicated — so these policies have not led to sustainable growth in a single Latin American economy. Although there is little doubt that the alternative scenario of pro-growth macros, strategic trade and industrial policies, coordination of investment, capital controls, progressive taxation and public sector expenditure, a competent educational and training system that encourages the acquisition of productive capability, and so forth are challenges as big as they come, why should it be that only low- and middle-income Asian countries are capable of mastering this complex course of action effectively? As mentioned above, perhaps LA’s ‘purity of belief’ is just an excuse for not even trying.
To summarize, from the perspective of their own mainstream economic thinking, perhaps the main problem with LA’s neo-liberal economists (of all political denominations) is how a rigid ideology seems to constrain their core policy-making from moving beyond a virtual world of ‘first bests’. As a famous Chicago-trained economist said in a recent interview in Chile, the main problem
55 It is quite remarkable how in LA financial policy is still inspired by the ‘efficient capital markets hypothesis’; i.e., it is still devised assuming that in financial markets prices at all times ‘fully reflect’ all available information, so that there cannot be an endogenous gap between market prices and fundamentals, let alone a bubble. And that stock markets would always ‘self-correct’, because stock prices are supposed to be a ‘random walk’ — i.e., in stock markets there is no scope for profitable speculation (especially under risk neutrality) because smart market players would simply force stock prices to become rational (by taking the other side of trades if prices begin to develop a pattern, as this is bound to have no substance). In other words, for the efficient market theology a ‘rational surfer’ is not one who has fun riding waves, but one who gets drowned trying to create undertows!
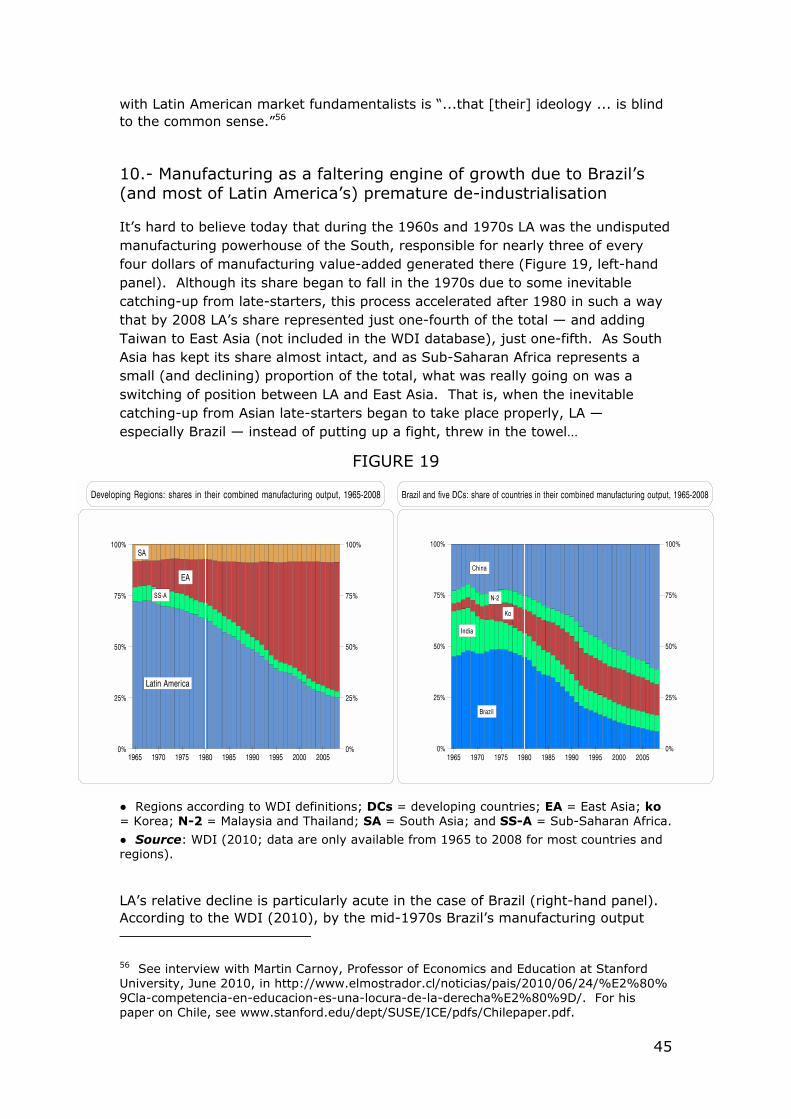
45
with Latin American market fundamentalists is “...that [their] ideology ... is blind to the common sense.”56
10.- Manufacturing as a faltering engine of growth due to Brazil’s (and most of Latin America’s) premature de-industrialisation
It’s hard to believe today that during the 1960s and 1970s LA was the undisputed manufacturing powerhouse of the South, responsible for nearly three of every four dollars of manufacturing value-added generated there (Figure 19, left-hand panel). Although its share began to fall in the 1970s due to some inevitable catching-up from late-starters, this process accelerated after 1980 in such a way that by 2008 LA’s share represented just one-fourth of the total — and adding Taiwan to East Asia (not included in the WDI database), just one-fifth. As South Asia has kept its share almost intact, and as Sub-Saharan Africa represents a small (and declining) proportion of the total, what was really going on was a switching of position between LA and East Asia. That is, when the inevitable catching-up from Asian late-starters began to take place properly, LA — especially Brazil — instead of putting up a fight, threw in the towel…
FIGURE 19
● Regions according to WDI definitions; DCs = developing countries; EA = East Asia; ko = Korea; N-2 = Malaysia and Thailand; SA = South Asia; and SS-A = Sub-Saharan Africa.
● Source: WDI (2010; data are only available from 1965 to 2008 for most countries and regions).
LA’s relative decline is particularly acute in the case of Brazil (right-hand panel). According to the WDI (2010), by the mid-1970s Brazil’s manufacturing output
56 See interview with Martin Carnoy, Professor of Economics and Education at Stanford University, June 2010, in http://www.elmostrador.cl/noticias/pais/2010/06/24/%E2%80% 9Cla-competencia-en-educacion-es-una-locura-de-la-derecha%E2%80%9D/. For his paper on Chile, see www.stanford.edu/dept/SUSE/ICE/pdfs/Chilepaper.pdf.
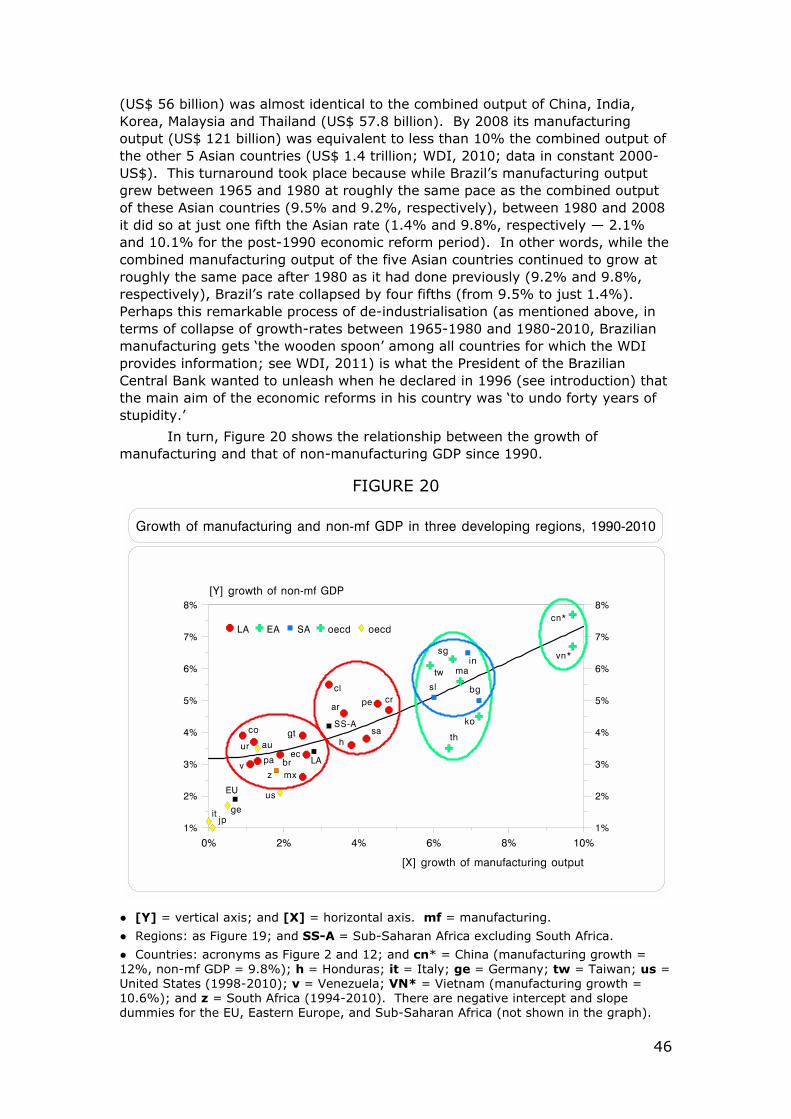
46
(US$ 56 billion) was almost identical to the combined output of China, India, Korea, Malaysia and Thailand (US$ 57.8 billion). By 2008 its manufacturing output (US$ 121 billion) was equivalent to less than 10% the combined output of the other 5 Asian countries (US$ 1.4 trillion; WDI, 2010; data in constant 2000-US$). This turnaround took place because while Brazil’s manufacturing output grew between 1965 and 1980 at roughly the same pace as the combined output of these Asian countries (9.5% and 9.2%, respectively), between 1980 and 2008 it did so at just one fifth the Asian rate (1.4% and 9.8%, respectively — 2.1% and 10.1% for the post-1990 economic reform period). In other words, while the combined manufacturing output of the five Asian countries continued to grow at roughly the same pace after 1980 as it had done previously (9.2% and 9.8%, respectively), Brazil’s rate collapsed by four fifths (from 9.5% to just 1.4%). Perhaps this remarkable process of de-industrialisation (as mentioned above, in terms of collapse of growth-rates between 1965-1980 and 1980-2010, Brazilian manufacturing gets ‘the wooden spoon’ among all countries for which the WDI provides information; see WDI, 2011) is what the President of the Brazilian Central Bank wanted to unleash when he declared in 1996 (see introduction) that the main aim of the economic reforms in his country was ‘to undo forty years of stupidity.’
In turn, Figure 20 shows the relationship between the growth of manufacturing and that of non-manufacturing GDP since 1990.
FIGURE 20
● [Y] = vertical axis; and [X] = horizontal axis. mf = manufacturing. ● Regions: as Figure 19; and SS-A = Sub-Saharan Africa excluding South Africa.
● Countries: acronyms as Figure 2 and 12; and cn* = China (manufacturing growth = 12%, non-mf GDP = 9.8%); h = Honduras; it = Italy; ge = Germany; tw = Taiwan; us = United States (1998-2010); v = Venezuela; VN* = Vietnam (manufacturing growth = 10.6%); and z = South Africa (1994-2010). There are negative intercept and slope dummies for the EU, Eastern Europe, and Sub-Saharan Africa (not shown in the graph).
47
● R2 = 71%; all variables are significant at the 1% level (see Palma, 2010).
● Source: WDI (2012); for Taiwan, Taiwan (2012).
In manufacturing (unlike in exports) LA is best represented by the base regression (i.e., there is no significant Latin American dummy) — i.e., generally poor performance in manufacturing is linked to similarly poor performance in GDP — as opposed to the EU, Eastern Europe and Sub-Saharan Africa, where their even poorer performance in manufacturing generate three different negative regional dummies. As in exports, there is a slightly better cluster — and, as in the export-GDP relationship, it does not include Brazil! This is made up of Argentina, Chile, Costa Rica and Peru (this time followed by the ‘maquila’ countries of Honduras and El Salvador). In addition, the most robust specification for this relationship tends to confirm ‘Kaldorian’ dynamic increasing returns in manufacturing; that was not the case for the (linear) export regression.
Together with low rates of investment (both private and public), a monetarist macro, and lack of upward export capacity diversification, there is little doubt that the remarkable neglect of manufacturing since economic reforms lies at the heart of LA’s productivity problem, especially its long-term sustainability.57
Finally, Figure 24, Appendix 6, builds on my previous work on de-industrialisation (Palma, 2005b, and 2008), this time using an imaginative de-composition methodology, which disaggregates the changes in the share of manufacturing employment into its three main components — the economy-wide labour productivity, the share of manufacturing in GDP, and the labour intensity in manufacturing (i.e., the inverse of labour productivity; see Tregenna, 2009). As I conclude in the Appendix, as far as manufacturing is concerned, not only the 1980s probably deserves the label of ‘lost decade’, but (with few ‘pockets of excellence’ exceptions, such as EMBRAER) the three post-1980 decades in LA might well deserve that label.
Part of the post-reform problem with LA’s manufacturing, of course, was due to the nature of the ISI’s legacy. ISI’s rigid system of protection (in highly-income-unequal domestic markets) resulted in many distortions, as incentives inevitably led to horizontal diversification because there were more rewards for developing new products than for productivity ‘deepening’. In this sense, despite its discourse, ISI did not really have a proper ‘infant industry’ agenda because its logic was not one of temporary protection to help — and push — firms to get to the frontier and become internationally competitive (Pérez, 2008; Díaz-Alejandro, 1989; and Fajnzylber, 1990). Rather, often supposedly ‘infant’ corporations (e.g. General Motors, ITT, General Electric, Bayer or Nestlé) ended up protected with effective rates that sometimes reached four-digits. In fact, there was actually a ‘double play’: with big exceptions (as the already mentioned case of EMBRAER indicates), the manufacturing industry that emerged from ISI found it particularly difficult to adjust to the new open paradigm and the surge of Asia. This was made worse by the speed taken by trade liberalisation, and the unnecessary difficulties and distortions created by monetarist-macros and open capital accounts. But what developed around ISI (including institutions, suppliers and skills) was considerable.58
57 See also Ffrench Davis (2006), Bresser Pereira (2010), and Frenkel and Rapetti (2012). 58 Unfortunately, ISI was not allowed to transform the region’s political configuration either (as a normal process of industrialisation would have done) — military regimes put a
48
However, having said the above, in 1980 I would still have had no hesitation in buying a Brazilian car, hi-fi, or washing machine rather than one of their counterparts in Russia, India or China — let alone having preferred to fly in a Brazilian-made plane rather than one made in any other BRIC!
After trade liberalisation LA’s (relatively fragile) manufacturing not only had to adapt (unnecessarily) hastily to a tough new internationally competitive scenario (due to the remarkable speed of trade liberalisation), but it had to face two further problems. On the supply side, it had to struggle against an Asian ‘double-squeeze’. On the one hand (and as mentioned above), as labour-intensive techniques in manufacturing had been mastered in low-income Asia — where wages are even lower, labour is in abundance, and exchange rates and interest rates are kept ‘artificially’ at levels which are both competitive and stable — LA found it particularly difficult to compete in low-wage, labour-intensive, small-profit-margins manufacturing (except when its geographical location and US’s trade treaties created artificial distortions that favoured ‘maquila’ activities). On the other, LA’s manufacturing also found it difficult to compete with technologically-complex, rapid-product-evolving manufacturing production from high-middle income Asian countries, with their huge investment rates, effective trade and industrial polices, ‘pro-growth’ macros, and outstanding technological-absorpting capabilities.59 From this perspective, what is particularly difficult to understand is what little effort was made by Latin American countries, including Brazil, to develop the obvious manufacturing niche available to them: the up and downstream manufacturing activities associated with commodity extraction and processing.60 It is also difficult to understand how Latin American policy makers and entrepreneurs could have believed that the Latin American economies could adjust effectively to a particularly tough international environment with a hastily devised trade and financial liberalisations, and with an investment rate of just 15% of GDP in the private sector and less than 3% in the public one. From this perspective, perhaps one of the main damages created by a fundamentalistic process of economic reform and financial liberalisation was the delusion that these policies were de facto sufficient conditions for rapid and sustained economic growth.
To summarise, LA’s post-economic reform ‘policy neutrality’ attitude regarding manufacturing (despite the huge distortions in world trade in manufacturing) happened because supposedly ‘the markets-always-know-best’; this led to a process of premature de-industrialisation without an end in sight. In other words, the naïve attitude of ‘let’s assume that all the Paretian optimum conditions are fulfilled’ (including a level playing field in international trade in manufacturing) has led to the supposed ‘first-best’ policies in this respect (e.g., full import liberalisation, policy neutrality, flexible exchange rates, and so on). LA’s ‘manufacturing-catching-up-in-reverse’ (Figures 6, 7 and 8), LA’s huge relative decline in its share of manufacturing output in the South (Figure 19), and the remarkably small change in the three components of manufacturing employment after neo-liberal reforms (Figure 24) should then not come as a surprise; nor should the lack of a sustainable engine of growth, or the productivity slowdown. In Brazil not even an institution such as BNDS has been able to do much about reversing all this. As mentioned above, by 2011 the share of manufacturing in GDP had fallen to 14.5%, less than half its 1980 level.
stop to that. 59 For three views on the rise of Asia, see Amsden (2001), Chang (2006), and Khan (2001). See also Cimoli, Dosi and Stiglitz (2009). See also Ferguson (2011). 60 See Walker and Jourdan (2003), and Palma (2009b).
49
Added to this, on the demand side, Latin American-style neo-liberal capitalism has been characterised by a chronic deficiency of effective demand for its non-commodities tradable sector, especially manufacturing. As mentioned above, this has been the direct outcome of the ‘deadly triad’ of undervalued labour, overvalued exchange rates (backed up by high interest rates), and ‘sterilised’ governments. These are, respectively, the direct outcome of ‘flexible’ labour markets, open capital accounts with ‘tough’ monetarist macros, and governments with their hands (institutionally) tied in terms of implementing effective counter-cyclical action and pro-active public investment.61
In other words, in post-reform LA there is not much evidence in manufacturing of the characteristics that have been associated in the mainstream literature with ‘high-imagination-enabling-countries’ (Friedman, 2007). Rather, evidence (particularly that in the right-hand Panel of Figure 24) points towards countries whose manufacturing sectors have been (defensively) in ‘hibernation’. Not surprisingly, Brazil’s trade-balance in manufacturing deteriorated from a surplus of about $30 billion in 2005 (the year of the beginning of the credit-led consumption-boom), to a deficit of $50 billion in 2011.62 So far, commodities — with their remarkable expansion and price bubble — can pay the bill (in 2011 their sectoral trade-surplus reached $79 billion), but for how long will they continue to be able to do so in an international scenario in which both commodity-prices can easily return to their historical levels (or even collapse, as in the 1980s), and Brazil’s premature (and avoidable) de-industrialisation continues to have no end in sight?
Perhaps the greatest economic damage done by LA’s fundamentalist neo-liberal discourse — so well summarised by Gustavo Franco’s remarks (when President of Brazil’s Central Bank; see above) that the main task of economic reform in Cardoso’s government was “to undo forty years of stupidity”— was the neglect of manufacturing. In fact, this ‘reverse-gear’ attitude not only led to a policymaking that ‘neglected’ manufacturing, but to one in which there was an open hostility to the sector. However, as Rodrik explains, what Latin American policy makers
[...] need to understand [is] how “growth miracles” are made. Except for a handful of small countries that benefited from natural-resource bonanzas, all of the successful economies of the last six decades owe their growth to rapid industrialization. If there is one thing that everyone agrees on about the East Asian recipe, it is that Japan, South Korea, Singapore, Taiwan, and of course China all were exceptionally good at moving their labor from the countryside (or informal activities) to organized manufacturing. Earlier cases of successful economic catch-up, such as the US or Germany, were no different. [...] countries that are able to transform farmers into factory workers reap a huge growth bonus. (http://www.project-syndicate.org/print/no-more-growth-miracles-by-dani-rodrik)
Conditions have of course change — as they always do. And although there is little doubt that under the current world-scenario pro-growth macros, strategic
61 According to a Goldman Sachs analyst, in 2011 Brazil’s real was the world most overvalued major currency (despite some recent devaluations; see http://www.bbc.co.uk/ news/business-11424864). In the same spirit, perhaps Brazil’s recent (but already disappearing) growth acceleration may well be the world's most overrated boom! In turn, in the October 2011 ‘Economist's Big Mac index’ the real comes second (after the Swiss Franc) in terms of degree of overvaluation — 42% vis-à-vis its ‘Big Mac PPP level’ (or the exchange rate that would mean hamburgers cost the same in Brazil than the US); see http://www.economist.com/node/17257797?story_id=17257797. 62 See Cunha (2012).
50
trade and industrial policies, coordination of investment, capital controls, progressive taxation and public expenditure, a competent educational and training system that encourages the acquisition of productive capability, and so forth are challenges as big as they come under current economic conditions, why should it be that only low- and middle-income Asian countries are capable of mastering this complex course of action effectively? Perhaps LA’s ‘purity of belief’ is just an excuse for not even trying — not even in the obvious industrialisation niches available to the region: the up and downstream manufacturing activities associated with commodity extraction and processing (as in the ‘Nordic model’) for those countries rich in commodities, and via an increased domestic production of inputs for those who export ‘maquila-manufacturing’.
Conclusions
In the economic literature, there are three different analytics of growth, but only in one is growth analysed as a ‘sector-specific’ phenomenon (the structuralist/ Post Keynesian/heterodox tradition; see Palma, 2005b, and 2008). From this perspective, LA’s abysmal TFP-record well after economic reform should make those who believe otherwise think again. In particular, how can those in the Washington Consensus — with their emphasis on ‘getting the prices right’ and ‘getting the institutions right’ (but forgetting all about ‘getting the social capital right’)63 — explain that after two decades of putting into practice open capital accounts, free trade, balanced public accounts, well defined and enforced property rights, independent central banks and so on (i.e., well after having set the Latin American economies on automatic pilot and policy neutrality), LA’s TFP record can only be described as appalling? And the well-rehearsed argument that what is needed is yet more of the same sounds increasingly hollow.
Perhaps the main lesson from LA’s experiment with neo-liberal reforms is that the Washington Consensus is just one of the many heaps of ideological recipes still waiting for a theory relevant to the real world (or a bonfire...). How can it explain why so many in Asia do things ‘wrong’ (sometimes very ‘wrong’) but grow fast and in a sustainable way, while LA does almost everything ‘right’ (and with so much ‘credibility’, and scoring so high in the usual indices, such as those of ‘economic freedom’, ‘competitiveness’, and so on) but can only achieve a low-intensity growth dynamic — with all its difficulties in creating, let alone sustaining productivity growth? And why is it that the ‘invisible hand’ does not know how to break this low-intensity growth dynamic? When Keynes said (see epigraph to this paper) that people usually prefer to fail through conventional means rather than to succeed through unconventional ones, he could not have guessed just how accurately his remarks would define LA today.
Yes, Lula’s two-period government (as the 20-year period of ‘Concertación’ government in Chile) probably deserve to be paraded by the World Bank the world over as best practice in poverty alleviation — ‘best practice’ at least in relative terms, because although much more could have been achieved, more was done than in other similar countries, such as South Africa (see The
63 There is little evidence in LA of even an attempt at ‘getting the social capital right’. But this was never really part of the neo-liberal blueprint. As Mrs. Thatcher famously made it clear, from a neo-liberal perspective ‘there is no such a thing as society, just individuals’ (see http://www.margaretthatcher.org/document/106689).
51
Economist, 12/7/08).64 Being perfect magicians, no one but they are supposed to know the necessary tricks for making conflict evaporate, coercion conceal itself, and military regimes become obsolete. But, is it really this what the ‘new’ left is all about? Is it really just about building a scenario in which the minimum wage would eventually be able to cover the cost of a basket of basic necessities; in which most blue-collar workers are on that minimum wage (but with fully ‘flexible’ labour contracts); in which the administrative classes earn just above that; some obliging professionals do a bit better; and all the rest of the social product becomes surplus that is appropriated by the capital élite and their ever-expanding financial markets. Paraphrasing a genius of letters, is this the scenario which now constitutes all “the stuff that (‘progressive’ neo-liberal) dreams are made of?”
And, did they really have to buy the neo-liberal proposition that the only rôle of economic policy is to generate ‘credibility’, and to keep the capitalise elite ‘sweet’ — as opposed to a Keynesian (and Foucauldian) perspective, in which what is necessary for capitalism to work effectively is to keep capitalists on their toes?65 And, do they really have to keep thinking the same even after the current global financial crisis? Because, as if more evidence was necessary, now we know for sure what happens when one does just keep capitalists ‘sweet’.
So, most of Asia gets a capitalism that is pretty unsavoury (with all its contradictions, corruption, unfairness and excuses), but one that at least is capable of developing many of the productive forces of society (despite the fact that financial markets, and sometimes also policy makers, often insist in forging ahead in the wrong direction).66 LA, meanwhile, gets a neo-liberal brand of ‘progressive-sub-prime’ capitalism that is not able to offer much productivity growth — i.e., as mentioned above, LA gets the cloud without that silver lining. This is mostly due to an elite that does not want to know what capitalism is really about, and a bunch of highly-trained economists who still believe that when it comes to policy-making, the first commandment is that one has to turn a blind eye to the real world and always stick to the ‘first-best’ — no matter what.
From the latter perspective (and as mentioned above), perhaps the key difference between LA and many countries in Asia is that policy-makers and academics in the former instinctively believe that the Washington Consensus is a set of ingenious tricks devised solely with the aim of helping DCs in their processes of catching-up, while those in Asia intuitively know that there is a good chance that they actually are the work of those who want to help ‘You-Know-Who’
64 In high middle-income countries, the cost of poverty reduction is relatively so cheap that in Brazil, for example, the much-heralded ‘Bolsa Familia’ programme has a total annual cost of only about 0.5% of GDP (see Fiori, 2008). And according to ECLAC (2010), in eleven of the sixteen Latin American countries studied the cost of a subsidy to each unemployed person equal to the poverty line is below 1% of GDP — and the cost of this unemployment benefit would be below half a percentage point of GDP in six of them, including Brazil and Chile. 65 I would argue that from a Foucauldian perspective the interrelation of progress, discipline, freedom and compulsion also support such a view. 66 India, for example, is an extreme example of this. It has had 30 years of remarkably rapid GDP-growth, leading to a 6-fold increase in output, and a 3.4-fold increase in productivity. However, on the one hand, financial markets and policy makers are increasingly leading the economy into a rapid process of financialisation (with the inevitable bubbles and growing financial fragilities); and, on the other, nowhere is the failure of capitalist economic growth to improve the well-being of the majority of the population more evident (see footnote 70).
52
(he whose name no one dares to speak) — i.e., a set of clever tricks devised in order to help ‘the Dark Lord’ to rise again.
Apparently, in LA market capitalism is a system in which only workers and small firms continuously have to struggle to improve their performance just to survive; for big capital, the rules of the game are more agreeable. What the new neo-liberal paradigm seems not to grasp is that it is one thing to implement reforms in order to create market opportunities, but quite another to ensure that there are sufficient market compulsions to guarantee that these opportunities are taken up.67 As a result, LA’s brand of capitalism is characterised as much by its capacity to generate market opportunities as by its ability to waste them. What LA urgently needs today is new institutions to help create both the required capabilities and the necessary compulsions for productivity growth, especially those that would help to ‘discipline’ the capitalist elite à la EA. It also needs a new structure of property rights — including well-defined and enforced rights on skills à la Japan or Germany.68 And, of course, the ideology to back this up would also help — as Gramsci said, more often than not battles are won or lost on the field of ideology.
Added to this is the already mentioned phenomenon that Latin American-style capitalism has also been characterized by a chronic deficiency of effective demand from the ‘deadly triad’ of undervalued labour (due to 'flexible' labour markets), overvalued exchange rates with high interest rates (due to over-liquid and lacking-imagination international financial markets, open capital accounts and monetarist macros), and ‘sterilized’ governments.
In summary, the region’s growth performance since economic reform may be rather disappointing (particularly in terms of its capacity for both generate, and sustain productivity-growth), but Latin American-style neo-liberal capitalism became unrivalled in the world when it came to offering world-class commodities, an abundance of (precarious, low-productivity and low-wage service) jobs, stylish retail, lucrative finance, and the ‘purity of belief’.69
So, clearly — and despite its huge potentials and major capabilities, a significant increase in the minimum wage and in poverty reduction, some inroads in inequality, and some recent positive changes in economic policy, particularly in terms of a greater Keynesian coordination between fiscal, monetary and exchange rate policies (which lowered the interest rate, made the real a bit less overvalued, and increased investment in infrastructure) — Brazil today is still no 'emerging tiger.’70 But the processes of ‘re-commoditisation’ and financialisation
67 Wood (2002) and Khan (2005). 68 On the necessity of adequate property rights on skills, see especially Pagano (1991). 69 On stylish retail, few can beat ‘Cidade Jardim’, a shopping mall in São Paulo designed as a fortress, to be accessed only by car or helicopter. It has been labelled Brazil’s “vitrine das desigualdades sociais” (Brazil’s shop window to social inequalities). In 2011, 22 new shopping centres were opened in Brazil, bringing the total number across the country to 430; and a further 74 are under construction (http://www.bbc.co.uk/news/business-172706 49). 70 The recent changes in economic policy are in sharp contrast to what is currently happening in Chile; for example, the Chilean Central Bank is still happy to let its currency continue its relentless appreciation — making the Chilean peso in the first nine months of 2012 the currency with the greatest appreciation in the world (http://www.mer.cl/Pages/ NewsDetail.aspx?dt=2012-09-26&PaginaId=2&bodyid=2). And the risk of a major and (probably inevitable) painful correction is apparently of no concern to the Bank. This 19th Century-style hands-off ‘policy-neutrality’ reminds us of that equally old-fashioned nursery rhyme “Oh, The grand old Duke of York; He had ten thousand men; He marched them up
53
were certainly enough to create a most remarkable degree of euphoria around the delusion (national and international) of it having become a ‘virtual tiger’. To adapt Churchill’s formulation, 'never in the field of economics has so much euphoria been generated by so few accomplishments’. With (among many other problems) such ‘macho-monetarist’ macro, dismal investment (both private and public), huge de-industrialisation, and such a heavy debt service burden for the public and the household sectors (with the latter currently having twice the debt load from a cash flow perspective than their US counterparts), can anybody be really surprised that, after a short-growth-sprint (and despite the continuation of particularly favourable terms of trade and FDI inflows), Brazil's economy decelerated from a rate of GDP-growth of 7.5% in 2010, to one of 2.7% in 2011, and just 0.6% during the first half of 2012 (or by 1.2% between mid-2011 and mid-2012)? Or that the main factor of deceleration was manufacturing, which contracted (yet again) during the second quarter of 2012 (by 2.5%)?
As I have argued extensively (see especially Palma 2010), for very specific reasons LA’s main problem vis-à-vis Asia is its incapacity to sustain GDP-growth over time. Latin American countries, including Brazil (and Chile, Costa Rica, Mexico, Argentina and Peru), have certainly been able to have periods of ‘Asian-growth’, but so far they have never been able to sustain that growth. Brazil’s current downfall is a paradigmatic case of this stylised fact. Furthermore, while Asian tigers have become top marathon-runners, in the last decade and a half, Latin American economies have even been downgraded from middle-distance runners to (at best) good sprinters...
And the ‘demise’ of Brazil in the eyes of those who desperately wanted to have a ‘success’ story in LA now seems complete, as investors, mainstream academics and the financial press have began a frantic search for a new potential tiger (to idealise) south of the Rio Grande — a search for a new ‘Great (non-Asian) Emerging Market Hope’.71 So, in their eagerness to discover a new Latin economy where asset prices can be (artificially) driven up, investors are turning their eyes to Mexico. So, Tony Volpon, Nomura’s Head of EM Research for the Americas now talks of Mexico as ‘the new Brazil’ (http://www.bloomberg.com/ video/nomura-s-volpon-on-mexico-s-growth-stocks-p1~A~kOrRqKbpUe4Qax76w. html). And, of course, he (and his colleagues at Namura) predicts that Mexico’s rising star will be “a story based on flexible capital and labor markets.” (How could it not be!) So, Mexico is now “embarking on a trajectory of high growth [that] will mark the birth of a new ... 'jaguar’ country in Latam [Latin America].” (Ibid.). And some Latin economists, always eager to join a bubble (especially if it has ideological connotations), follow suit (e.g., Sebastian Edwards, La Tercera, 18/8/2012).
However, Nomura (and other ‘spot the Latin tiger’ aficionados) forgot to provide empirical evidence to support their view that Mexico, with an average GDP-growth of just 1.6% for the last quinquennium, is now “embarking on a
to the top of the hill; And he marched them down again.” 71 At the same time, terms such as ‘Custo Brasil’ (the extra cost of doing business in Brazil) have now become fashionable. Those who used to idealise Brazil before had probably never noticed that, for example, the cost of electricity for industrial users in Brazil is the third highest in the world — about twice those of China and Korea, and two and a half times that of the US (The Economist, 15/9/2012); or that Brazil has had one of the largest financial intermediation spreads in the world — if not the largest — since financial ‘liberalisation’ (see OECD, 2011). Nor, do they seem to have noticed before the huge costs associated to crumbling infrastructure and shortages of complementary capital — for example, in Brazil to get a ton of soy to a port costs twice as much as in Argentina (http: //www.allaboutfeed.net/PageFiles/10338/001_boerderij-download-AAF10251D01.pdf).
54
trajectory of high growth.” In fact, in order to predict this they have to lower the bar considerably as their own forecasts place Mexican growth in the near future at just 3%-3.5% p.a. (only Barclays dares to predict 4%) — and even this growth depends entirely on cheerful predictions for the US economy.
At the same time, as Brazil has now become passé — almost as simplistically and naïvely as it became eye-catching before — the financial press has also joined the search for the new ‘Latin hope’ (see, for example, the WSJ in http://www.marketwatch.com/special-reports/new-tigers). The only difference is that the WSJ favours Colombia and Peru (rather than Mexico) as the Latin Emerging Market to take on the mantle vacated by Brazil.72
This eagerness to find a new Latin tiger is not only related to investors (or, rather, speculators) in ever more desperate need of new ‘one-way bets’; it also relates to mainstream academics and the financial press associated to the Washington Consensus in ever more desperate need of a new object to idealise — as the old one (Brazil) has now fizzled out. Therefore, the usual dynamics of idealisation gets in motion: when there is an unremitting need to sustain the idealisation of something (in this case, that of the ‘purity’ of economic reform and financial liberalisation — in the face of such poor post-reform performance in LA, including that of the old object of desire, Brazil), what is needed is to search simultaneously for a new object to idealise, and (crucially) for a new one to demonise. In fact, the more evident the flaws in what is being idealised, the stronger the demonisation of the alternative scenario has to be.73
Incidentally, Brazil has also helped those who wanted to follow this dynamic, but the other way round; for example, many left-wing Indian economists who want to demonise India’s rapid economic growth due to its colossal human costs have also chosen Brazil as a model to idealise in terms of its social polices (rising minimum wage, falling poverty, and ‘Bolsa Familia’ programme) — and in their idealisation they have totally glossed over Brazil’s inadequate economic performance. The fragility of such discourse (à-la 1970s Latin American ‘dependency-analysis-style’ — for a critique, see Palma, 1978), of course, consists in its confusing a well-founded socialist critique of India’s capitalist development from the perspective of its failure to improve the well-being of the majority of its population — in fact, for many of them it has actually worsened74 — with the concrete analysis of why globalised capitalism has been
72 However, Brazil still has its loyal fans; ex-President Clinton, for example, recently said that “If I were sitting in a trading-room, betting on the future of emerging markets, I'd bet first in Brazil" (http://www1.folha.uol.com.br/mercado/1144646-bill-clinton-diz-que-brasil-e-numero-1-entre-economias-emergentes.shtml). Also, the ex-British Prime Minister Tony Blair declared in a recent interview that, "In the last 20 years, Brazil has had a history of success and extraordinary progress” (http://www1.folha.uol.com.br/mercado/ 1144691-brasil-precisa-fazer-mudancas-para-continuar-crescendo-diz-tony-blair.shtml); he then proceeded to sign a $5 million consulting deal with the state governments of São Paulo and Rio de Janeiro to advise them on ‘public-private partnerships.’ Only neo-liberals in Latin America (old and new) still believe that the solution for an inefficient public sector monopoly is to ‘to throw in the towel’ and create an inefficient private sector one — as has been devised for Guarulhos; see Appendix 4. 73 For an analysis of the process of idealisation, see Sodré (2012). 74 In India, after 30 years of remarkably rapid GDP-growth, just eight states still account for more poor people than the 26 poorest African countries combined (421 million; data provided by the Multidimensional Poverty Index database, an index that measures the ‘deprivations’ in households — from education and health to assets and services). Furthermore, the ‘intensity’ of the poverty in many parts of India is still today much worse than that in Sub-Saharan Africa (see http://www.ophi.org.uk/policy/multidimensional-

55
able to develop in India, but nowhere near as much in Brazil, many of its productive forces (on its own terms, 'warts and all’). As mentioned above, while the average labour productivity has increased in India since 1980 by more than three-fold, in Brazil it has grown by just 10%.
And in LA, in the same way as Brazil and Venezuela played these two opposite (but totally interrelated) roles during the first decade of this century (the former to be idealised, the latter to be demonised), now Mexico, Colombia and Peru are auditioning for the rôle of the one to idealise — while Argentina offers the new ideal scenario for demonisation.
In an article written in the midst of the First World War, Freud (1915) discussed what he considered to be the three basic characteristics of human beings acting either as individuals or as a group which are related to their capacity (or lack of) to ‘understand’ the real world: a) their ambivalence to reality (due to a deep-rooted ‘fear of the unknown’); b) their predilection for illusion and wishful thinking; and c) their innate aggression. The one particularly relevant to the recent idealisation of Brazil is the second one — as if mainstream economists, policy makers (including, of course, those of the ‘new’ left), and the financial press were determined to prove Freud right in relation to human beings’ predilection for illusion and wishful thinking!
By now it should be obvious that ‘flexible’ labour markets do not transform an oligarchy into a proper capitalist class; even from a neo-liberal perspective surely one can have too much of a good thing. The same happens with the opening of capital accounts excessively reinforcing the domestic élite’s ‘high-appropriation-cum-little-accumulation’ distributive strategies, and its long-standing biases for mobile assets. As mentioned above, in Brazil, for example, the ‘coefficient of financialisation’ (the ratio of the stock of non-monetary financial assets to the stock of productive capital) increased from 7% at the beginning of the economic reforms (1991) to 40% in 2009. What has been truly remarkable is the ingenuity of the neo-liberal ideology in disguising this in a bogus appearance of ‘modernity’ — as Adorno (2006) reminds us (see epigraph to this paper), “Today the appeal to newness, of no matter what kind, provided only that it is archaic enough, has become universal.”
Some economists, like Rodrik (2007), have argued that in LA the contrast between the two periods (pre- and post-economic reform) is based on the fact that during ISI there were incentives to invest (industrial policies), but little market discipline due to lack of competition. In turn, during the reform period there was little incentive to invest, but a lot of market discipline. However, on the latter issue, I think the region is still waiting for the real thing — as the head of Chile’s largest holding company and former President of the Confederation of Chilean Industry explains, “[t]his is a market economy in name only. Competition has disappeared; mergers and acquisitions have led to a huge degree of oligopolistic concentration.” (http://www.atinachile.cl/node/4629).75 Moreover, one should never forget that in many countries in EA the ‘market discipline’ part of the story has had an added ‘state discipline’ component; i.e.,
poverty-index/). Also, as it is by now well-known, the ‘liberalisation’ of India’s agriculture has created such levels of distress in small farmers that it has been associated with over a quarter of a million farmers’ suicides between 1995 and 2010 — the worst-ever recorded wave of suicides of this kind in human history (http://www.thehindu.com/opinion/columns/ sainath/in-16-years-farm-suicides-cross-a-quarter-million/article2577635.ece). 75 According to a recent study, four family-groups (including that of the current Chilean President) control 47% of the assets traded in the Chilean Stock Exchange; see http:// www.emol.com/noticias/economia/detalle/detallenoticias.asp?idnoticia=430194.
56
the ability of the state to threaten non-performing companies credibly with withdrawal of subsidies.
And those in heterodox circles who like to look at the Anglophone periphery as models (i.e., Ireland and New Zealand rather than Korea or Malaysia), and argue that what LA needs in order to be able to replicate the pattern of the Anglophone periphery is an industrial policy that attracts FDI to fill the more challenging technological gaps, create ‘clusters’, and so on, have something to explain: how will middle-income LA ever become a dynamic capitalist endeavour without a proper domestic capitalist class (like those found in some Asian countries)? In this respect, the weakness of post-reform FDI-intensive Mexico is particularly telling; in fact, not only the little or no overall impact of FDI on the region’s investment is one of the most remarkable stylise facts in post-economic reform LA (see Figure 14 above), but also is its increasingly rent-seeking domestic élite. And oddly enough, many pre-1980 structuralist thinkers made the same mistake, expecting (in vain) that FDI would be the force that would transform ISI into a more export-oriented endeavour. Despite its many contributions, FDI was actually part of ISI’s main problem: its anti-learning bias (Pérez, 2008). In addition, even when it was the Latin American domestic firms that had contracts with foreign companies, they normally had to import the technology and use it rigidly as it came; whenever possible, they also had to import the machinery and parts. In the early 1970s, Brazil may have produced more cars than the whole of developing Asia put together, but there was no Hyundai in sight.76
Surely it is time to acknowledge that Latin American economies — and especially Brazil — many already above (some well above) the ten thousand dollar mark in per-capita terms and with huge potentialities, should be perfectly able of relying on their own resources and capabilities when dealing with their main current economic challenges. But for this to happen, at least four interconnected obstacles to growth need to be overcome.
1.- The first is mostly ideological, and relates to the ‘purity of belief’ of most Brazilian (and Latin American in general) neo-liberal economists and policy makers of almost all political persuasions — including those of the ‘new’ left: when it comes to policy making, how to abandon their ‘first best’ fantasy world, and stop de facto assuming ‘complete markets’, ‘automatic stabilisers’, ‘horizontal’ policies (supposed to be ‘neutral’ across sectors), ‘efficient market hypotheses’ and so on. That is, how to give up their self-imposed rôle of ‘keepers of the neo-liberal holy grail’ — the only true believers.77 As Britton (2002) brilliantly explains, ‘fundamentalism’ is not about what you read, it is about how you read it; it is not what you think, it is how you think it; it is not what you believe, it is how you believe it. It is about the difference between ‘I believe that this is a fact’, and ‘this is a fact’. It is the difference between seeking ‘the truth’ and ‘The Truth’. It is about a scenario in which what was believed becomes ‘known’, and what is known becomes ‘a fact’; a scenario in which the ‘purity of
76 Brazil is currently the seventh largest producer of cars in the world (with a yearly output of 3.5 million cars), but the only one among those seven that has no trademarks of its own in the car industry. 77 Otherwise, they should hardly complain if their zombie policy-making is sometimes described as being inspired by ‘voodoo economics’ (see, for example, Krugman, 2010). It is quite remarkable that in LA not only New Classical, but also New Keynesian economists still work within a ‘complete markets paradigm’, and with the strongest version of the ‘efficient markets hypothesis’ (for a critique, see Buiter, 2009).

57
belief’ inevitably gets into conflict with the complexity of the real world. The fear, of course, is that by allowing new ideas or forms into one’s system of belief, they could destroy belief itself. In fact, the more the ‘purity’ of belief in mainstream economics gets into conflict with the complexities of the real world, the more it needs to purge all diversities of ideas — i.e., the more intolerant of dissent it has to be. In other words, in relation to knowledge there seems to be a strong direct relationship between the expectation to understand the real world and the tolerance of dissent — and vice versa!
2.- The second obstacle (clearly associated with the first above) relates to the rôle of the public sector in a neo-liberal economy. Although for all liberal perspectives ‘markets’ are a superior form of social organisation, according to Foucault there are crucial differences between a classical liberal and a neo-liberal understanding of markets. For the former, markets are a ‘quasi-natural’ reality (whose laws have to be respected by the state), while for the latter markets are historical constructions that must be constantly supported by a strong political agency of active governance.78 Accordingly, for classical liberalism the state and markets each have a space, different from each other. For neo-liberalism, instead, the distinction between the space of the state and that of markets disappears; so, the state (and everything else) should be mapped out as a function of the logic of unregulated markets.
This view, of course, is not only different from that of classical liberalism, but is also the opposite of the Keynesian-style liberal understanding of the role of the state, in which the autonomy of the state is the most critical governance issue; this autonomy is essential for the state to be able to improve upon the inevitable sub-optimal equilibria brought about by unregulated markets (and market failures), and for the state to protect society from the excesses of ‘free’ markets. For neo-liberals, instead, market failures are not innate to the logic of capital but have a purely contingent historical nature. As such, the market economy is ‘open’ and should be facilitated through politico-institutional agency by the state. So, for neo-liberals the key governance issue is how to reformulate the political and the social in a way that is harmonic to the rationality of markets; therefore, the fundamental role of government is how to construct a wide-ranging institutional framework that can facilitate (rather than regulate) the workings of ‘free’ markets.79 The bottom
78 That is, for neo-liberals the issue is not the size of the state, but its actual rôle. 79 So, for example, Bush asked polluters to write environmental regulation; and the Chilean government will now delegate to its current private concessionaires the task of identifying new infrastructural projects (particularly roads); so, its new rôle will be restricted to analyse the projects proposed by them (see Appendix 4). And when ‘New Labour’ Gordon Brown (as newly appointed Chancellor of the Exchequer) created in 1997 a new regulatory body for the financial industry (the Financial Service Authority - FSA), he set it not only as an “independent non-governmental body” (i.e., a company limited by guarantee), but one that is actually financed by the financial services industry; furthermore, he appointed ex-bankers as Chairman and as Chief Executive Officer. That is, he set the FSA as operationally independent of Government, funded entirely by the corporations it is supposed to regulate, and led by financial-industry insiders. Thus, ‘New Labour’ found a rather ingenious solution to the problem of “regulatory capture”; if, supposedly, lobbyists inevitably succeed in capturing the regulators, why not make them the regulators in the first place. And this happened not just because ‘New Labour was mostly in the pocket of financial markets (as Bush was in those of polluting industries) — or because Lula ‘knew how to please the élite’ (see epigraph at the beginning of the paper); it also happened because their ideology told them that only the respective industry (and not government, or anybody else) knows what they need in order to thrive. Little they knew (and as it would have been easily predicted by Keynes) that the outcome of that kind of policies in financial markets, for example, was a short-term euphoria followed
58
line, as Foucault says, is that according to neo-liberalism what is needed is “[a] state under the surveillance of the market, rather than a market under the surveillance of the state” (2004: 120)
The outcome of this in Brazil was tying government’s hands in terms of public investment (less than 3% of GDP since c.1990), but not in terms of its continues massive subsidies to big business; so, now Brazil is saddled with a huge domestic debt, crumbling infrastructure and serious shortages of complementary capital — the backbone of its current high ‘Custo Brasil.’ And, of course, a ‘tough’ monetarist macro (that can choke any chance of sustainable growth) was part of this scenario in which ‘the state is under the surveillance of the market.’
3.- The third obstacle, is the current oligopolistic structure, the resulting lack of competition, and the ‘lightly-touched’ regulation of Brazilian financial markets. Brazilian did not need the OECD to tell them that Brazil has had huge financial intermediation spreads since financial liberalisation (see OECD, 2011); or be surprised by the fact that in Banco Santander the share of Brazil in its worldwide profits is twice that of its assets (Palma, 2012); or needed Fecomercio (São Paulo’s Federation of Commerce) to tell them that “the interest rate on credit cards in Brazil’s financial hub of São Paulo averages 238 percent p.a.;” nor they needed the Financial Times to remind them that in Brazil the debt service burden of households has risen to 24 per cent of disposable income (twice the level of the US). For them, this is a daily (and particularly painful) component of the ‘Custo Brasil.’ However, with such profitable domestic financial markets, perhaps it is no surprise that the Latin American ‘new’ left is so welcome at Davos; but it also should come as no surprise (as discussed above) that for the Financial Times “Brazil is currently worryingly similar [to the US prior its] sub-prime crisis.”
4.- And the forth obstacle to growth is the one facing the Brazilian capitalist élite (and LA’s in general): how to overcome their long-standing ‘addiction to near life’; i.e., their addiction to a low-intensity but highly rewarding economic life — the above-mentioned ‘two-times-half-style’ capitalism. And as the ‘Manchester United solution’ is not an option,80 the challenge is how to change this unremarkable steady state resulting from a capitalist élite with inbuilt preferences for ‘low-hanging fruit’ type activities and high inequality (to compensate for that). Unfortunately, so far the opposite seems to be happening, as currently this steady state (with its perennial middle-income trap, or, more precisely, its ‘low sustainable-growth equilibrium-trap’) is being so well nourished by the ‘discreet charm’ of a narcissistic ideology (which, among other things, has almost completely ‘sterilised’ government policy), and by financial and commodity bubbles. Unfortunately (but not surprisingly), the new scenario in which ‘the state is now the one under the surveillance of the market’ has mostly served to reinforce the rent-seeking tendencies (and sometime predatory nature) of the Latin American capitalise élite.
However, you’ve really got to hand it to the Latin American capitalist elite. In the 1950s, 1960s and 1970s they convinced the progressive forces of the region (all the way up to the communist parties) that there was nothing more ‘anti-imperialist’ than to provide them with vast rents for import-substituting
by a colossal financial crisis (see Palma, 2009). 80 If England does not have enough top quality football players to build a world-class team, the ‘Manchester United solution’ is simple: to import most of their players. It would indeed be an interesting scenario if LA were able to import Asian entrepreneurs and policy makers in the same way — and somehow avoid their being sucked in by the siren-style downdraft of their not very progressive political settlements and distributional outcomes’ whirlpool!
59
industrialisation; and that these huge rents, as opposed to what was happening in East Asia at the time, should be given without any form of performance-related conditionality. And now, in the new century, their process of (re)legitimisation has been so successful, and their new technologies of power so effective, that they have convinced the majority of the left not only of “TINA” (“there is no alternative”), and that “there is nothing left to decide” — and even less to think-critically — but that they actually deserve every privilege and reward (and, of course, every rent) that they can get. That is, that the new political settlement (best described by Gore Vidal as “socialism for the rich and capitalism for the rest”) is the best of all worlds — not just for them but for everybody else as well!
In fact, the unique comparative advantage of the Latin American oligarchies seem to lay precisely in being able to use different institutions (sometimes quite astutely) to achieve their fairly immutable goals. Few oligarchies in the world have shown such skills in their struggle for the (anti-Darwinian) ‘persistence of élites’, despite significant institutional change (Acemoglu and Robinson, 2006). Of course they have used violence for this (sometimes extreme violence; in some cases so extreme that the outcome can only be described as genocide, as in Guatemala), but oligarchies in many other parts of the world have been equally vicious at times, and the outcome has been different.
Until these four obstacles to growth are overcome, most likely, (post-neo-liberal reform) Brazil will continue to deserve a tag of the kind: “Brazil: the country of the future (and it will always be!)." In particular, I think that there is little hope of lifting the current Brazilian (and Latin American) growth-traps unless somehow both the Latin American capitalist élites, and the Latin American states acquire the Schumpeterian ambitions found in many of their Asian counterparts — with their Canon-style motto: ‘if anybody can, we can’.
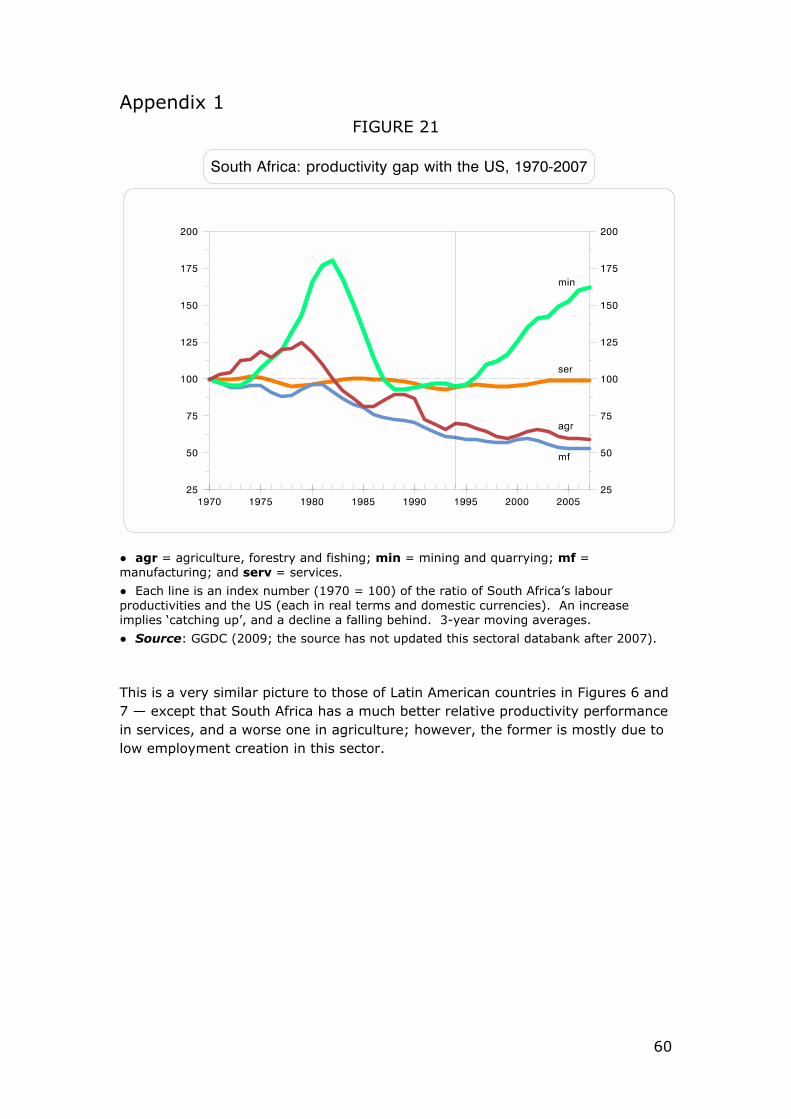
60
Appendix 1 FIGURE 21
● agr = agriculture, forestry and fishing; min = mining and quarrying; mf = manufacturing; and serv = services.
● Each line is an index number (1970 = 100) of the ratio of South Africa’s labour productivities and the US (each in real terms and domestic currencies). An increase implies ‘catching up’, and a decline a falling behind. 3-year moving averages.
● Source: GGDC (2009; the source has not updated this sectoral databank after 2007).
This is a very similar picture to those of Latin American countries in Figures 6 and 7 — except that South Africa has a much better relative productivity performance in services, and a worse one in agriculture; however, the former is mostly due to low employment creation in this sector.
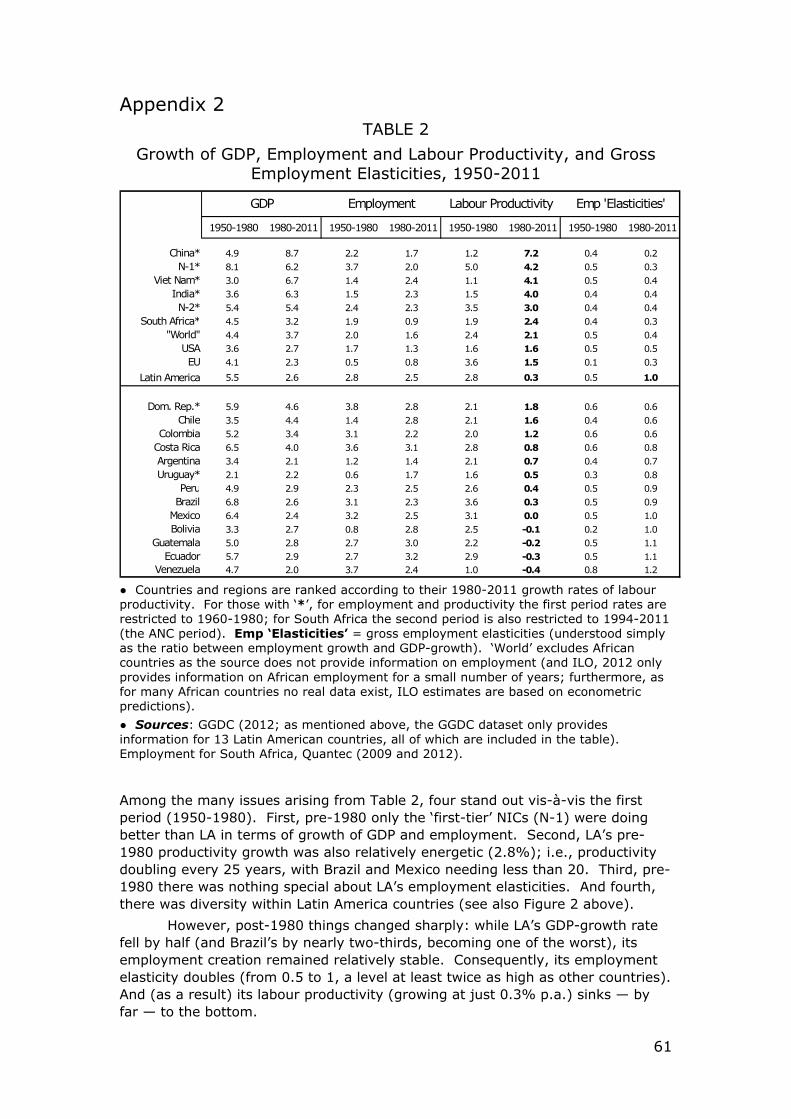
61
Appendix 2 TABLE 2
Growth of GDP, Employment and Labour Productivity, and Gross Employment Elasticities, 1950-2011
1950-1980 1980-2011 1950-1980 1980-2011 1950-1980 1980-2011 1950-1980 1980-2011
China* 4.9 8.7 2.2 1.7 1.2 7.2 0.4 0.2N-1* 8.1 6.2 3.7 2.0 5.0 4.2 0.5 0.3
Viet Nam* 3.0 6.7 1.4 2.4 1.1 4.1 0.5 0.4India* 3.6 6.3 1.5 2.3 1.5 4.0 0.4 0.4N-2* 5.4 5.4 2.4 2.3 3.5 3.0 0.4 0.4
South Africa* 4.5 3.2 1.9 0.9 1.9 2.4 0.4 0.3"World" 4.4 3.7 2.0 1.6 2.4 2.1 0.5 0.4
USA 3.6 2.7 1.7 1.3 1.6 1.6 0.5 0.5EU 4.1 2.3 0.5 0.8 3.6 1.5 0.1 0.3
Latin America 5.5 2.6 2.8 2.5 2.8 0.3 0.5 1.0
Dom. Rep.* 5.9 4.6 3.8 2.8 2.1 1.8 0.6 0.6Chile 3.5 4.4 1.4 2.8 2.1 1.6 0.4 0.6
Colombia 5.2 3.4 3.1 2.2 2.0 1.2 0.6 0.6Costa Rica 6.5 4.0 3.6 3.1 2.8 0.8 0.6 0.8Argentina 3.4 2.1 1.2 1.4 2.1 0.7 0.4 0.7Uruguay* 2.1 2.2 0.6 1.7 1.6 0.5 0.3 0.8
Peru 4.9 2.9 2.3 2.5 2.6 0.4 0.5 0.9Brazil 6.8 2.6 3.1 2.3 3.6 0.3 0.5 0.9
Mexico 6.4 2.4 3.2 2.5 3.1 0.0 0.5 1.0Bolivia 3.3 2.7 0.8 2.8 2.5 -0.1 0.2 1.0
Guatemala 5.0 2.8 2.7 3.0 2.2 -0.2 0.5 1.1Ecuador 5.7 2.9 2.7 3.2 2.9 -0.3 0.5 1.1
Venezuela 4.7 2.0 3.7 2.4 1.0 -0.4 0.8 1.2
GDP Employment Labour Productivity Emp 'Elasticities'
● Countries and regions are ranked according to their 1980-2011 growth rates of labour productivity. For those with ‘*’, for employment and productivity the first period rates are restricted to 1960-1980; for South Africa the second period is also restricted to 1994-2011 (the ANC period). Emp ‘Elasticities’ = gross employment elasticities (understood simply as the ratio between employment growth and GDP-growth). ‘World’ excludes African countries as the source does not provide information on employment (and ILO, 2012 only provides information on African employment for a small number of years; furthermore, as for many African countries no real data exist, ILO estimates are based on econometric predictions).
● Sources: GGDC (2012; as mentioned above, the GGDC dataset only provides information for 13 Latin American countries, all of which are included in the table). Employment for South Africa, Quantec (2009 and 2012).
Among the many issues arising from Table 2, four stand out vis-à-vis the first period (1950-1980). First, pre-1980 only the ‘first-tier’ NICs (N-1) were doing better than LA in terms of growth of GDP and employment. Second, LA’s pre-1980 productivity growth was also relatively energetic (2.8%); i.e., productivity doubling every 25 years, with Brazil and Mexico needing less than 20. Third, pre-1980 there was nothing special about LA’s employment elasticities. And fourth, there was diversity within Latin America countries (see also Figure 2 above).
However, post-1980 things changed sharply: while LA’s GDP-growth rate fell by half (and Brazil’s by nearly two-thirds, becoming one of the worst), its employment creation remained relatively stable. Consequently, its employment elasticity doubles (from 0.5 to 1, a level at least twice as high as other countries). And (as a result) its labour productivity (growing at just 0.3% p.a.) sinks — by far — to the bottom.
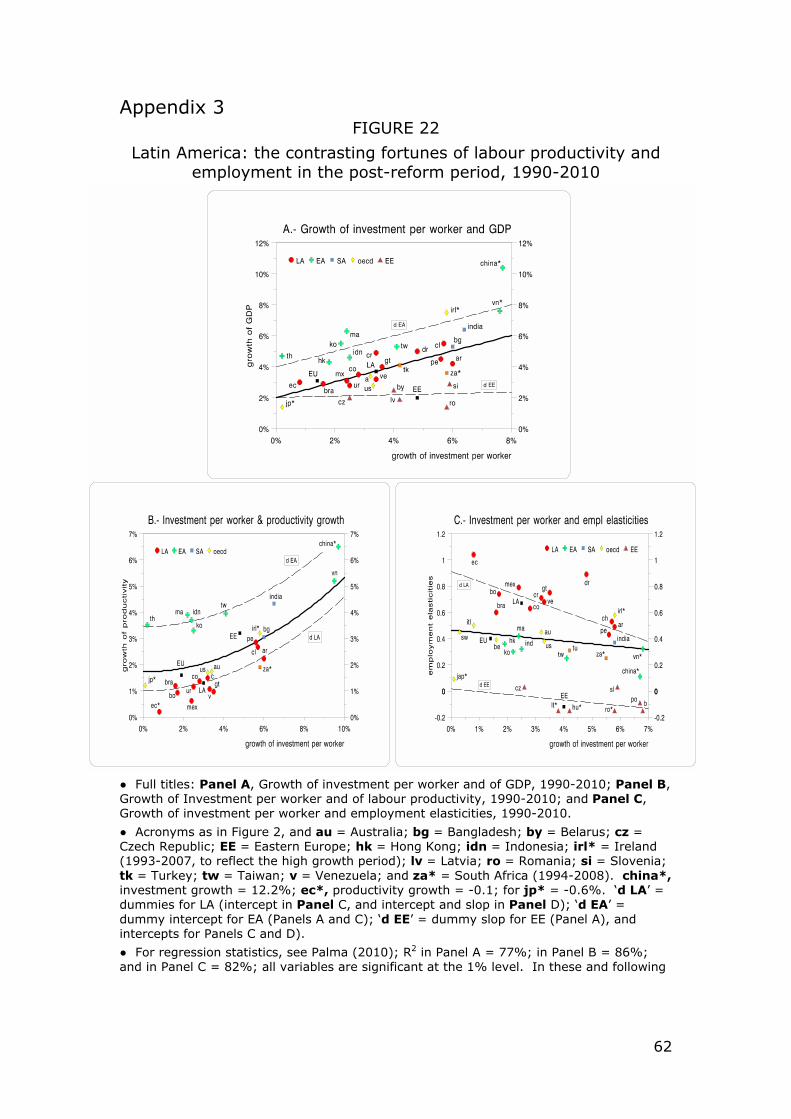
62
Appendix 3 FIGURE 22
Latin America: the contrasting fortunes of labour productivity and employment in the post-reform period, 1990-2010
● Full titles: Panel A, Growth of investment per worker and of GDP, 1990-2010; Panel B, Growth of Investment per worker and of labour productivity, 1990-2010; and Panel C, Growth of investment per worker and employment elasticities, 1990-2010.
● Acronyms as in Figure 2, and au = Australia; bg = Bangladesh; by = Belarus; cz = Czech Republic; EE = Eastern Europe; hk = Hong Kong; idn = Indonesia; irl* = Ireland (1993-2007, to reflect the high growth period); lv = Latvia; ro = Romania; si = Slovenia; tk = Turkey; tw = Taiwan; v = Venezuela; and za* = South Africa (1994-2008). china*, investment growth = 12.2%; ec*, productivity growth = -0.1; for jp* = -0.6%. ‘d LA’ = dummies for LA (intercept in Panel C, and intercept and slop in Panel D); ‘d EA’ = dummy intercept for EA (Panels A and C); ‘d EE’ = dummy slop for EE (Panel A), and intercepts for Panels C and D).
● For regression statistics, see Palma (2010); R2 in Panel A = 77%; in Panel B = 86%; and in Panel C = 82%; all variables are significant at the 1% level. In these and following
63
regressions, ‘t’ statistics are calculated using White’s heteroscedasticity adjusted standard errors.81
● Sources: for GDP and investment, WDI (2012, constant 2000-US$); for Taiwan (2012). For employment GGDC (2009), and ILO (2012).
While in panel B, LA is best represented by a highly significant negative (productivity) dummy, in Panel C, LA generates a highly significant positive (employment) one. However, both dummies cancel each other out, and LA’s relationship between investment and GDP-growth (Panel A) ends up best represented by the base regression.
Appendix 4
As mentioned in the text, what has happened in Chile in terms of its public investment policy in infrastructure via ‘private concessions’ is particularly relevant for Brazil, as this country is currently embarking in the same direction as Chile in this respect. In Chile, this policy has been highly controversial due to the government’s remarkable largesse with private operators, its weak regulatory system, and lack of competition in its concessions. As Engel argues in relation to the Chilean programme of ‘private concessions’,
“[a] substantial part of the investments in infrastructure financed by the system of concessions were not allocated on a competitive base, but by subsequent agreements where there was no competition. So it is highly likely that we pay far more than necessary [for these projects]. We are talking of over US$ 2.5 billion... [Also] today, we have a dispute resolution system that ignores the conditions stipulated in the original contract. Thus, in addition to the US$ 2.5 billion mentioned above that were allocated without competition, the remaining US$ 6 billion invested via concessions were allocated through a mechanism in which competition mattered far less than desired.” (http://cowles.econ.yale.edu/ ~engel/arts/07-presupuesto%20y%20concesiones.pdf; see also Engel, Fischer and Galetovic, 2001).
Furthermore, according to the new public investment policy in infrastructure (particularly roads) just announced by the Chilean government, it is not going to be the public sector anymore (i.e., the Ministry of Public Works) the entity that identifies which are the new infrastructural projects that are necessary for the development of the country (which are then allocated to the private sector via a bidding process). From now on, the government will delegate to the current private concessionaires the task of identifying such projects; so, the new rôle of the public sector will be restricted to the analysis of such projects (those proposed by the current private concessionaires). As Engel’s argues, this is not the most effective way to devise public policies, as the likely outcome of this new policy of ‘leaving the cat in charge of the butcher's shop’ is one in which private
81 For a discussion of the important econometric issues raised by cross-section regressions like these, see Pesaran, et. al. (2000). In particular, one has to understand that these regressions are simply a cross-sectional description of cross-country differences, categorised by the explanatory variable. That is, they should not be interpreted in a ‘predicting’ way, because there are a number of difficulties with a curve estimated from a single cross-section — especially the homogeneity restrictions that are required to hold.
64
concessionaires will tend to identify more projects than what is probably necessary (the more they do, the more they earn); and one in which they are bound to identify projects for which their firms have ‘comparative advantages’ vis-à-vis its competitors (so, they are the one likely to win in the subsequent process of bidding for that specific public contract; see http://blog.latercera.com/ blog/eengel/entry/un_enfoque_ equivocado_en_concesiones).
Regarding Brazil, in the recent privatisation of Guarulhos one could have forgiven people in the 1980s for believing that the solution for an inefficient public sector airport was its privatisation — but after 30 years of experience of privatisation of airports to continue idealising the benefits of privatising ‘natural’ monopolies is a bit much (even for market fundamentalist) given that we now know for certain how they have been pretty much of a disaster all over the world (just think of Heathrow — it makes Guarulhos look efficient). And the reason why a (non-properly regulated) airport in private hands would necessarily end up inefficient (equally, if not more inefficient that a public sector airport, and certainly much more expensive) is that capitalism only works in markets where there is proper competition and spare capacity — otherwise, what would be the point (i.e., the ‘compulsions’) for a private monopoly to behave efficiently? And by definition, that does not happen in ‘natural’ monopolies, such as core airports. The basic point is that capitalism without competition is probably as inefficient as communism without workers control over the bureaucracy... In many Asian countries, at least there are strong governments, prepared to use their power of regulation to make oligopolistic capital work effectively. But, as the Chilean experience shows, this is certainly not the case in Latin America — including Brazil (old and new).
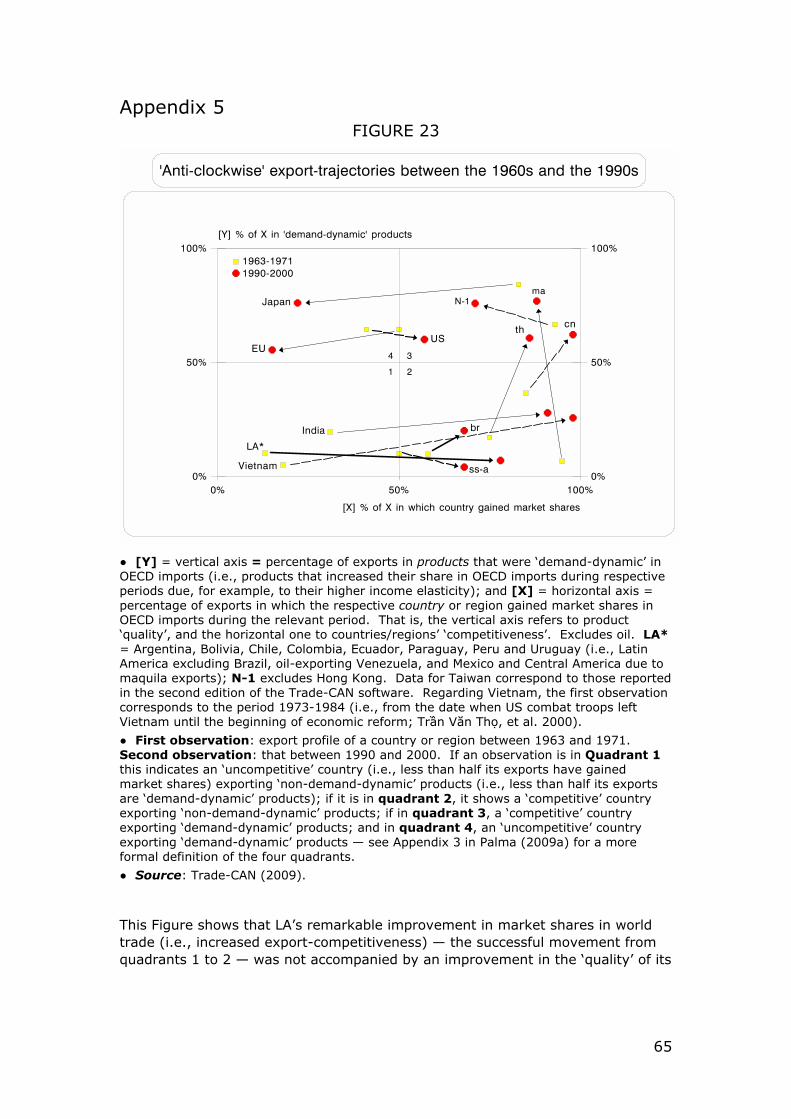
65
Appendix 5 FIGURE 23
● [Y] = vertical axis = percentage of exports in products that were ‘demand-dynamic’ in OECD imports (i.e., products that increased their share in OECD imports during respective periods due, for example, to their higher income elasticity); and [X] = horizontal axis = percentage of exports in which the respective country or region gained market shares in OECD imports during the relevant period. That is, the vertical axis refers to product ‘quality’, and the horizontal one to countries/regions’ ‘competitiveness’. Excludes oil. LA* = Argentina, Bolivia, Chile, Colombia, Ecuador, Paraguay, Peru and Uruguay (i.e., Latin America excluding Brazil, oil-exporting Venezuela, and Mexico and Central America due to maquila exports); N-1 excludes Hong Kong. Data for Taiwan correspond to those reported in the second edition of the Trade-CAN software. Regarding Vietnam, the first observation corresponds to the period 1973-1984 (i.e., from the date when US combat troops left Vietnam until the beginning of economic reform; Trần Văn Thọ, et al. 2000).
● First observation: export profile of a country or region between 1963 and 1971. Second observation: that between 1990 and 2000. If an observation is in Quadrant 1 this indicates an ‘uncompetitive’ country (i.e., less than half its exports have gained market shares) exporting ‘non-demand-dynamic’ products (i.e., less than half its exports are ‘demand-dynamic’ products); if it is in quadrant 2, it shows a ‘competitive’ country exporting ‘non-demand-dynamic’ products; if in quadrant 3, a ‘competitive’ country exporting ‘demand-dynamic’ products; and in quadrant 4, an ‘uncompetitive’ country exporting ‘demand-dynamic’ products — see Appendix 3 in Palma (2009a) for a more formal definition of the four quadrants.
● Source: Trade-CAN (2009).
This Figure shows that LA’s remarkable improvement in market shares in world trade (i.e., increased export-competitiveness) — the successful movement from quadrants 1 to 2 — was not accompanied by an improvement in the ‘quality’ of its
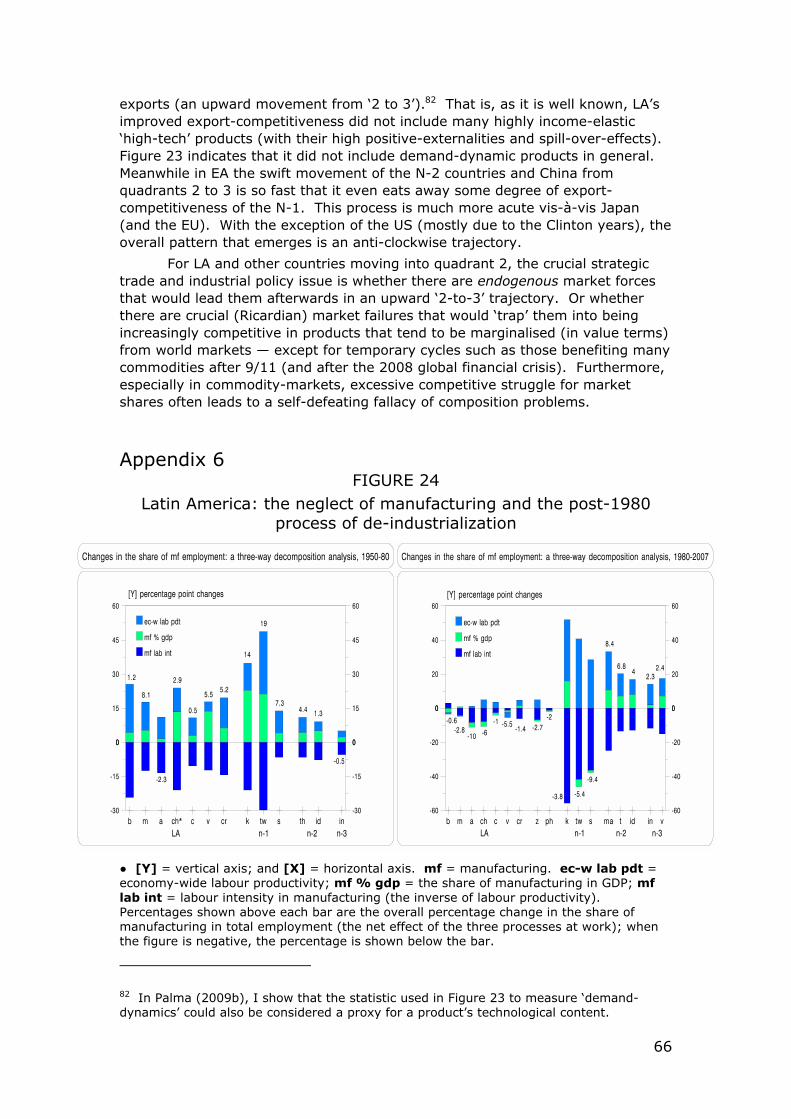
66
exports (an upward movement from ‘2 to 3’).82 That is, as it is well known, LA’s improved export-competitiveness did not include many highly income-elastic ‘high-tech’ products (with their high positive-externalities and spill-over-effects). Figure 23 indicates that it did not include demand-dynamic products in general. Meanwhile in EA the swift movement of the N-2 countries and China from quadrants 2 to 3 is so fast that it even eats away some degree of export-competitiveness of the N-1. This process is much more acute vis-à-vis Japan (and the EU). With the exception of the US (mostly due to the Clinton years), the overall pattern that emerges is an anti-clockwise trajectory.
For LA and other countries moving into quadrant 2, the crucial strategic trade and industrial policy issue is whether there are endogenous market forces that would lead them afterwards in an upward ‘2-to-3’ trajectory. Or whether there are crucial (Ricardian) market failures that would ‘trap’ them into being increasingly competitive in products that tend to be marginalised (in value terms) from world markets — except for temporary cycles such as those benefiting many commodities after 9/11 (and after the 2008 global financial crisis). Furthermore, especially in commodity-markets, excessive competitive struggle for market shares often leads to a self-defeating fallacy of composition problems.
Appendix 6
FIGURE 24 Latin America: the neglect of manufacturing and the post-1980
process of de-industrialization
● [Y] = vertical axis; and [X] = horizontal axis. mf = manufacturing. ec-w lab pdt = economy-wide labour productivity; mf % gdp = the share of manufacturing in GDP; mf lab int = labour intensity in manufacturing (the inverse of labour productivity). Percentages shown above each bar are the overall percentage change in the share of manufacturing in total employment (the net effect of the three processes at work); when the figure is negative, the percentage is shown below the bar.
82 In Palma (2009b), I show that the statistic used in Figure 23 to measure ‘demand-dynamics’ could also be considered a proxy for a product’s technological content.

67
● Countries: acronyms as Figure 2, 10 and 12, and ch* = Chile (1950-73); Malaysia and Vietnam are excluded from the left-hand panel due to lack of data on manufacturing employment.
● Sources: for manufacturing output, WDI (2010). For Taiwan, Taiwan (2010). For manufacturing employment, GGDC (2007) and ILO (2010). Tregenna (2009) was used for the methodology in the ‘three-way decomposition’ analysis.
The main findings in Figure 24 are:
1.- With the exception of Argentina, in LA between 1950 and 1980 changes in the share of employment in manufacturing were all positive, and were the outcome of large changes in its three components (the economy-wide labour productivity; the share of manufacturing in GDP; and the labour intensity in manufacturing — the inverse of labour productivity). These changes were not as large as those of Korea and Taiwan, but were larger than those of Singapore, Thailand, Indonesia and India (see left-hand panel).
2.- That LA’s overall post-1980 decline in the share of manufacturing employment is similar to those of much more advanced, much higher income per capita, N-1 economies, as opposed to the positive changes that took place in other Asian countries with levels of income per capita more similar to those in LA — the N-2 (the right-hand panel shows [above the bars] the positive overall figures for the latter, and the negative ones [below the bars] for LA and the N-1).
3.- Furthermore, Figure 24 (right-hand panel) also shows that LA’s post-1980 decline in the share of employment in manufacturing, although similar in size to those in the N-1 countries, was the result of forces of a very different nature. That is, the remarkably small change in the three components of manufacturing employment after trade liberalisation and neo-liberal reforms suggests that LA adopted a type of ‘standing still’ defensive strategy in this respect.
4.- And, as the evidence from the right-hand panel particularly suggests, post-1980-LA is a paradigmatic example of economic reform and financial liberalisation leading to a ‘not very creative destruction’ of manufacturing.83
83 According to a senior manager of one of the major retail outlets in Chile, about 90% of manufacturing products currently sold in his department store are imports (see http:// diario.elmercurio.com/2010/06/23/economia_y_negocios/economia_y_negocios/noticias/ 35E59938-CA53-43F2-8571-088B44D979E5.htm?id={35E59938-CA53-43F2-8571-088B 44D979E5}).

68
References Acharya, A (2009). ‘The Impact of Globalisation on International Convergence and
Growth’, Cambridge, mimeo. Adorno, T (2006). Minima Moralia: Reflections From Damaged Life, Verso. Aghion, P and P Howitt (1998), Endogenous Growth Theory, MIT Press. Amsden, A (2001). The Rise of "The Rest": Challenges to the West from Late-
Industrializing Economies, OUP. Arantes, P (2007). Extinção, São Paulo, Boitempo Editorial. Acemoglu, D. and J.A. Robinson (2006). Economic Origins of Dictatorship and Democracy,
Cambridge University Press. Boix, C (2003). Democracy and Redistribution, Cambridge University Press. Bresser Pereira, LC (2010). Globalization and Competition, Cambridge University Press. Britton, R (2002). ‘Fundamentalism and Idolatry’, in P Williams, J Knox, J Arundale, and C
Covington (eds.), Terrorism and War: Unconscious Dynamics of Political Violence, Karnack Books Ltd.
Bruno, M (2010). ‘Growth Regimes in Brazil: periodization and macroeconomic implications’, IPEA.
Buiter, W (2009). ‘The unfortunate uselessness of most ’state of the art’ academic monetary economics’, Financial Times, March 3.
Caputo, O (2000). ‘Hacia una Política Nacional del Cobre’, Visiones Económicas, Mayo. CEPAL (2012), Statistical Division, at: www.cepal.org. Chang, H-J (2006). The East Asian Development Experience – The Miracle, the Crisis, and
the Future, Zed Press. Chang, H-J, ed. (2007). Institutional Change and Economic Development, Anthem Press
and United Nations University Press. Cimoli, M, G Dosi and J Stiglitz (eds.), (2009). The Political Economy of Capabilities
Accumulation, Oxford University Press. Cimoli, M, G Dosi, R Nelson and J Stiglitz (2009). ‘Institutions and policy shaping industrial
development’, in Cimoli et. al. (2009). Cunha A M (2012). ‘The Economic, financial and trade relations in Brazil today: a general
panorama and challenges’, mimeo, Cambridge. Debrott, D (2001). ‘Teoría de la Renta y Renta de Recursos Naturales’, Revista
Investigación y Crítica, 5. De Soto, H (1989). The Other Path: The Economic Answer to Terrorism, Basic Books. DiJohn, J (2007). 'The Political Economy of Taxation and Tax Reform in Developing
Countries', in H-J Chang (2007). DiJohn, J (2009). ‘Taxation as State-Building. Reforming Tax Systems for Political Stability
and Sustainable Economic Growth. A Practitioner’s Guide’, FIAS/The World Bank. Díaz-Alejandro, C (1989). Collected Essays, (edited by A Velasco), OUP. Dosi, G, K Pavitt, and L Soete (1990). The Economics of Technical Change and
International Trade, Harvest. Engel, E, R Fischer, and A Galetovic (2001). ‘El Programa Chileno de Concesiones de
Infraestructura: Evaluación, Experiencias y Perspectivas’, available at http://www.cepchile.cl/dms/lang_1/cat_768_indicelibro.html.
Fajnzylber, F (1990). Unavoidable Industrial Restructuring in Latin America, Macmillan. Ferguson, N (2011). Civilization: The West and the Rest, Allen Lane. Ffrench-Davis, R (2006). Reforming Latin America’s Economies: After Market
Fundamentalism, Palgrave Macmillan. Fiori, J. (2008). ‘The ‘New Left’ in power: neo-liberal continuities with social safety nets in
Lula’s Brazil’, M Phil dissertation, Cambridge University. Frangie S (2008). The Good Governance Agenda, Weak States and Economic
Development, PhD thesis, Cambridge University. Frangie S, and JG Palma (2010). ‘Neo-liberalism in theory and in practice’, mimeo, Beirut
and Cambridge. Frenkel, R, and M Rapetti (2012). ‘External Fragility or Deindustrialization: What is the
Main Threat to Latin American Countries in the 2010s?’, World Economic Review, 1. Freud, S (1908). ‘Creative Writers and Daydreaming’, in The Standard Edition of the
Complete Psychological Works of Sigmund Freud, Volume IX, The Hogarth Press and the Institute of Psychoanalysis.
Freud, S (1915). ‘Thoughts for the Times on War and Death’, available at http:// www.panarchy.org/freud/war.1915.html.
69
Friedman, T (2007). The World Is Flat: A Brief History of the Twenty-First Century, Farrar, Straus and Giroux.
GGDC (2009). ‘Groningen Growth and Development Centre, 10-sector database’, in http://www.ggdc.net/.
GGDC (2012). ‘Groningen Growth and Development Centre, Total Economy Database’, in http://www.conference-board.org/economics/.
Goñi, E, H López, and L Servén (2008). ‘Fiscal Reform for Social Equity in Latin America’, World Bank Policy Research Working Paper, No. 4487.
Hall, R and C Jones, (1999). ‘Why do some countries produce so much more output per worker than others?, Quarterly Journal of Economics, 114.
Hausmann, R, J Hwang, and D Rodrik (2005). ‘What You Export Matters’, CID Working Paper No. 123, December.
Hirschman, A (1982). Shifting Involvements: Private Interest and Public Action, Princeton University Press.
Hofman, AA (2000). The economic development of LA in the twentieth century, Elgar. ILO (2012). KILM, Sixth Edition, www.ilo.org. IMF (2012a). ‘Global Financial Stability database’, www.imf.org. IMF (2010b). ‘WEO database’, www.imf.org. India (2012). ‘Statistical Division’, http://mospi.gov.in/. Infante, R, A Marinakis, and J Velasco (2003). ‘Minimum wage in Chile’, ILO Employment
Paper, 2003/52. Katz, J (2004). ‘Market-oriented reforms, globalization and the recent transformation of
Latin American innovation systems’, Oxford Development Studies, (32)3. Kelvin, Lord (W Thomson) (1900). ‘Address to the British Association for the Advancement
of Science’, available at http://www.physics.gla.ac.uk/ Physics3/Kelvin_online. Khan, M (2004). ‘Strategies For State-Led Social Transformation: Rent Management,
Technology Acquisition and Long-Term Growth’, ADB. (available at http:// mercury.soas.ac.uk/users/mk17/Docs/Strategies %20For%20State-Led%20Transformation%20Hanoi.pdf).
Khan, M (2005). ‘The Capitalist Transformation’, in Jomo, KS and Reinert, ES (eds.), The Origins of Development Economics, Zed.
Khan, MH and S Blankenburg (2009). ‘The political economy of industrial policy in Asia and Latin America’, in Cimoli et. al. (2009).
Krugman, P (2010). ‘Redo That Voodoo’, available at http://www.nytimes.com/ 2010/07/16/opinion/16krugman.html?_r=1.
Lagos, JF (2000). ‘Chile, de Exportador de Cobre Refinado a Gran Exportador de Concentrados: ¿la segunda fase exportadora?’, mimeo, Santiago de Chile.
Lipsey, RG and K Lancaster (1956). ‘The General Theory of Second Best’, The Review of Economic Studies, 24(1)
Moguillansky, G (1999). La Inversión en Chile: ¿el fin de un ciclo en expansión?; Fondo de Cultura Económico.
Moreno-Brid, JC, and J Ros (2009). Development and Growth in the Mexican Economy: A Historical Perspective, Oxford University Press.
Nelson, R (1956). ‘A Theory of the Low Level Equilibrium Trap in Underdeveloped Economies’, American Economic Review, May.
Ocampo, JA (2004). Reconstruir el futuro: Globalización, desarrollo y democracia en América Latina, ECLAC.
Ocampo, JA, ed. (2005). Beyond Reforms, Structural Dynamics and Macroeconomic Vulnerability, Stanford University Press and the World Bank.
Ocampo, JA, C Rada and L Taylor, (2009 ). Growth and Policy in Developing Countries: A Structuralist Approach, Columbia University Press.
OECD (2011). OECD Economic Surveys: Brazil, available at http://www.oecd.org/ brazil/economicsurveyofbrazil.htm.
Oliveira, F de (2006). ‘Lula in the Labyrinth’, New Left Review, 42(November). Pagano, U (1991). ‘Property Rights, Asset Specificity, and the Division of Labour under
Alternative Capitalist Relations’, Cambridge Journal of Economics 15(3). Palma, JG (1978). ‘‘Dependency: a formal theory of underdevelopment, or a methodology for
the analysis of concrete situations of underdevelopment?’ World Development, Vol. 6, N. 7/8, July/August 1978. Revised versions of this article were published in P Streeten and R Jolly (eds.) Recent Issues in World Development: A Collection of Survey Articles, Pergamon Press, 1981; and in G M Meier (ed.) Leading Issues in Economic Development, Oxford University Press, 1984, 1990 and 1995 editions.
70
Palma, JG (2005a). ‘The six main stylised facts of the Mexican economy since trade liberalisation and NAFTA’, Journal of Industrial and Corporate Change, December.
Palma, JG (2005b). ‘Four sources of de-industrialisation and a new concept of the Dutch Disease', in JA Ocampo (2005).
Palma, JG (2006). ‘The 1999 financial crisis in Brazil: “macho-monetarism” in action’, Economic and Political Weekly, 41(9).
Palma, JG (2008). De-industrialisation, premature de-industrialisation and the Dutch disease, in The New Palgrave Dictionary of Economics, 2nd edn., Palgrave.
Palma, JG (2009a). ‘Why did the Latin American critical tradition in the social sciences become practically extinct?’, in Blyth, M. (ed.) The Handbook of International Political Economy, Routledge.
Palma, JG (2009b). ‘Flying-geese and waddling-ducks: the different capabilities of East Asia and Latin America to ‘demand-adapt’ and ‘supply-upgrade’ their export productive capacity’, in M Cimoli, G Dosi and J Stiglitz (eds.), (2009).
Palma, JG (2009c). ‘The Revenge of the market on the rentiers: why neo-liberal reports of the end of history turned out to be premature’, Cambridge Journal of Economics 33(4). An extended version can be found in http:// www.econ.cam.ac.uk/dae/repec/cam/pdf/cwpe0927.pdf.
Palma, JG (2010). ‘Why has productivity growth stagnated in most Latin American countries since the neo-liberal reforms?’ in J A Ocampo and J Ros (eds.), The Handbook of Latin American Economics, Oxford University Press. Also at http://www.econ.cam.ac.uk/dae/repec/cam/pdf/cwpe1030. pdf.
Palma, JG (2011). ‘Homogeneous middles vs. heterogeneous tails, and the end of the ‘Inverted-U’: the share of the rich is what it’s all about’, Development and Change 42(1). Also at http://www.econ.cam.ac.uk/dae/repec/cam/ pdf/cwpe1111.pdf.
Palma, JG (2012). ‘How the full opening of the capital account to highly liquid financial markets led Latin America to two and a half cycles of ‘mania, panic and crash’, in G Epstein and M H Wolfson, The Handbook of the Political Economy of Financial Crises, forthcoming, Oxford University Press, 2012. A longer version of this paper is available at http://www.econ.cam. ac.uk/dae/repec/cam/pdf/cwpe1201.pdf).
Pérez, C (2002). Technological Revolutions and Financial Capital, Elgar. Pérez, C (2008). ‘A Vision for Latin America: a resource-based strategy for technological
dynamism and social inclusion’, Globelics WP No.WPG0804. Pesaran H, NU Haque and S Sharma (2000). ‘Neglected heterogeneity and dynamics in
cross-country savings regressions’, in J Krishnakumar and E Ronchetti, (eds.) Panel Data Econometrics — Future Direction, Elsevier Science.
Piketty, T and E Sáez (2003). ‘Income Inequality in the United States, 1913–1998’, Quarterly Journal of Economics, (118)1; data updated to 2010 at http://elsa.berkeley.edu/~saez/TabFig2008.xls.
Puyana, Alicia, (ed.) (2008). La Maquila en México. Los desafíos de la globalización, Flacso.
Quantec (2009 and 2012). ‘South African Standardised Industry Database’, http://www.quantec.co.za/data/easydata-rsa-regional-indicators.
Robinson, WI (2008). Latin America and Global Capitalism, Johns Hopkins. Rodrik, D (2007). One Economics, Many Recipes: Globalization, Institutions, and Economic
Growth, Princeton University Press. Sodré, I (2012). ‘Imparadised in hell’, in Imaginary Existences. Dream, Day Dream,
Phantasy, Fiction, edited by P Roth, forthcoming, Routledge. Taiwan (2010). National Statistics, in http://eng.stat.gov.tw/mp.asp?mp=5. Taylor, L (2010). Maynard’s Revenge: Keynesianism and the Collapse of Free Market
Macroeconomics, Harvard University Press. TDR (1996). Trade and Development Report, UNCTAD. Tràn Van Thọ, Nguyẽn Ngọc Đức, Nguyẽn Van Chỉnh, and Nguyẽn Quán (2000). Kinh té
Viẹt Nam 1955-2000, Nhà xuát bản Thóng Ke. Tregenna, F (2009). ‘Characterising deindustrialisation’, Cambridge Journal of Economics
33(3). WDI (2012). World Development Indicators, www.worldbank.org. Waissbluth, M (2010). ‘Se Acabó el recreo. La desigualdad en Educación’, Debate. Walker, M and P Jourdan (2003). ‘Resource-based sustainable development: an alternative
approach to industrialisation in South Africa’, Minerals & Energy — Raw Materials Report, 18(3).
Wood, EM (2002). The Origins of Capitalism: A Longer View, Verso.


![IMAGES AND PLANE WAVES - TKKlib.tkk.fi/Diss/2006/isbn9512281988/isbn9512281988.pdf[P3] K. Nikoskinen and H. Wall´en, “Application of Kelvin’s inversion to static conducting wedge](https://img.pdfslide.us/doc/110x75/60aa279aa5b98926d7795c25/images-and-plane-waves-p3-k-nikoskinen-and-h-wallen-aoeapplication-of-kelvinas.jpg)