Embed Size (px)
Citation preview

CALTRAIN CUSTOMER SATISFACTION SURVEY JUNE 2013
SUMMARY REPORT
Prepared by
COREY, CANAPARY & GALANIS RESEARCH 447 Sutter Street – Penthouse North San Francisco, CA 94108

Caltrain Customer Satisfaction Survey – June 2013 | Summary Report
1
CONTENTS
INTRODUCTION ............................................................................................. 2 EXECUTIVE SUMMARY ................................................................................. 4 CHARTS – KEY FINDINGS ............................................................................... 5 DETAILED RESULTS ...................................................................................... 15
Station Ratings Station Ratings Overall ................................................................... 16 Station Ratings by Time Period ....................................................... 18 Station Ratings by Type of Service .................................................. 19 Station Ratings by Bike Car ............................................................. 20 Station Ratings by Performance Trend ........................................... 21 Onboard Ratings Onboard Ratings Overall ................................................................. 22 Onboard Ratings by Time Period .................................................... 24 Onboard Ratings by Type of Service ............................................... 25 Onboard Ratings by Bike Car .......................................................... 26 Onboard Ratings by Performance Trend ........................................ 27 Overall Satisfaction with Caltrain ................................................... 28 Overall Satisfaction by Sub‐Groups ................................................ 29 Caltrain Performance Trend ........................................................... 30 Recommendation ........................................................................... 31 Improvement .................................................................................. 33 Boarding Station ............................................................................. 35 Alighting Station ............................................................................. 36
APPENDICES ................................................................................................ 37
A. Questionnaire B. Interviewer Training Instructions C. Schedule D. Test of Statistical Significance
Note: Crosstabulated Tables and Verbatim Comments included under separate cover

Caltrain Customer Satisfaction Survey – June 2013 | Summary Report
2
INTRODUCTION This report details the findings of an onboard survey of Caltrain riders for the annual Caltrain Customer Satisfaction Survey. The fieldwork on this study was conducted in June 2013. In total, 3,774 surveys were distributed, and 2,904 surveys were completed. Of the 2,904 completed surveys, 2,892 were English language surveys and 12 were Spanish language surveys. Key objectives of the survey include:
Reporting trip characteristics, such as peak/off‐peak/Saturday use.
Ratings of 18 specific service characteristics, including six various aspects of Caltrain stations, 11 aspects of onboard service, and one overall assessment of the entire Caltrain experience.
Rider evaluation of Caltrain’s performance trend over the past year
Customer input on potential areas for improvement. This report includes the following key sections: Executive Overview, Charts/Key Findings, Detailed Results, Crosstabulated Tables and Verbatim Comments. The Appendix of this report includes a copy of the questionnaire, interviewer training instructions, information on routes sampled, and data on statistical significance.
Questions regarding this project may be directed to: Christiane Kwok, Caltrain, 650.508.7926.
Methodology and Response Rate The survey was conducted as an onboard self‐administered questionnaire distributed to Caltrain riders. Surveyors boarded pre‐selected trains, and attempted to distribute questionnaires to all passengers on a pre‐selected car of the assigned train. Completed surveys were collected by these surveyors who stayed onboard during the train route.
Specific steps were taken to ensure the highest possible response rate. This included using professional, experienced onboard surveyors on the project, making the questionnaire available in English and Spanish, and providing a business reply mail‐back option for persons who did not have time to complete the survey onboard.

Caltrain Customer Satisfaction Survey – June 2013 | Summary Report
3
The overall response rate (77%) was calculated by dividing the total number of completes (2,904) by all eligible passengers riding on the sampled trains (3,774). Notes:
- “All eligible passengers” includes everyone except: children age 13 and younger and riders who had already participated. - Please see the appendix for additional details on distribution procedures and response rate information.
Field interviewing on this project was conducted on Thursday, June 6, 2013; Saturday, June 8, 2013; Tuesday, June 11, 2013; Wednesday, June 12, 2013; and Thursday, June 13, 2013. Additionally, two supplemental runs were conducted on Thursday, June 20, 2013. The weekday shifts were allocated to allow for surveying during morning and afternoon peak periods, as well as off‐peak periods. Saturday trains were also surveyed at various times of the day. Surveyors returned completed questionnaires to Corey, Canapary & Galanis’ office following the completion of the fieldwork. Data entry, editing, and coding were done in‐house once the questionnaires were returned. Sampling In total, 2,904 completed surveys were conducted. This total equates to a system‐wide margin of error of +/‐ 1.82% (at the 95% confidence level). The sampling on the study was designed to achieve a cross section of riders utilizing trains at various times of the day. Surveys were conducted on weekdays and on Saturday. For this study, we sampled a total of 36 weekday trains and 10 Saturday trains. Of the 36 weekday trains surveyed, 10 were local trains, 8 were bullet trains, and 18 were limited trains. Of the 10 Saturday trains surveyed, eight were local trains and two were bullet trains. For each train sampled, a specific car was selected, and we attempted to survey every passenger in the selected car. Statistically Significant Differences As was mentioned previously, for the total number of respondents (n =2,904) who participated in the survey, the margin of error is +/‐ 1.82% at the 95% confidence level. The margins of error for some key sub‐groups shown in this report are:
- Weekday peak (n = 1,924): +/‐ 2.23% at the 95% confidence level; - Weekday off‐peak (n =566): +/‐ 4.12% at the 95% confidence level; - Saturday (n = 405): +/‐ 4.87% at the 95% confidence level.

Caltrain Customer Satisfaction Survey – June 2013 | Summary Report
4
EXECUTIVE SUMMARY
Overall Satisfaction (station and onboard experience)
The average (mean) score increased to 4.04 from 4.01 in 2012.
81% of riders were somewhat or very satisfied with their overall Caltrain experience, and only 3% were very or somewhat dissatisfied.
Station Specific and Onboard Ratings
Riders were more satisfied with their onboard experience overall, at a mean rating of 4.10, than with their station experience overall, which received a mean rating of 3.97.
The overall station experience rating increased significantly to 3.97 in 2013 from 3.92 in 2012.
There were no statistically significant decreases since 2012. The largest statistically significant increase was “Being informed of delays that exceed 10 minutes,” which increased 0.31 points since 2012, but “Posted information on info. boards” also saw a significant increase of 0.11 since 2012.
The greatest disparity between those who felt Caltrain’s performance is declining over the past year and those who felt it is improving is “Being informed of delays that exceed 10 minutes.” Riders who felt that Caltrain is improving rated it 3.68 and those who felt it is declining rated it 2.57 (1.11 difference).
The overall onboard experience rating remained about the same, from 4.09 in 2012 to 4.10 in 2013. While an increase, it was not statistically significant.
Two of the 10 onboard ratings showed significant improvement when compared with 2012. These were “On‐time arrival at your destination” (from 3.82 in 2012 to 4.01 in 2013) and “Being informed of delays that exceed 10 minutes” (from 3.57 in 2012 to 3.68 in 2013). One of the 10 onboard ratings showed significant decreases when compared with 2012. This was “cleanliness of train exteriors” (from 4.14 in 2012 to 3.22 in 2013).
The greatest disparity between those who felt Caltrain’s performance is declining over the past year and those who felt it is improving is the rating for “On‐time arrival at your destination”. Riders who felt that Caltrain is improving rated this attribute 4.14 and those riders who felt that Caltrain has declined rated this attribute 3.05 (1.09 difference).
Performance Trend, Recommendations, and Priorities for Improvement
Overall, half of Caltrain’s riders (56%) felt that Caltrain’s performance has remained the same. One‐third (39%) felt that Caltrain’s performance has improved.
Most (92%) riders would recommend Caltrain to their friends and family.
Nearly half (45%) of the riders felt that improving frequency should be Caltrain’s highest priority for improvement. Riders also felt Caltrain should communicate service delays better, improve on‐time performance, and reduce crowding.

Caltrain Customer Satisfaction Survey – June 2013 | Summary Report
5
CHARTS – KEY FINDINGS

Caltrain Customer Satisfaction Survey – June 2013 | Summary Report
6
OVERALL SATISFACTION (Asked Question) Q18. Considering both your station and onboard experience, how would you rate your overall Caltrain experience?
Base: Total (2,904)
(See Statistical Table 18)
26%
55%
16%
2% 1%
Very Satisfied (5)
(4) (3) (2) Very Dissatisfied
(1)
81% Very/Somewhat
Satisfied

Caltrain Customer Satisfaction Survey – June 2013 | Summary Report
7
STATION ATTRIBUTE RATINGS (MEAN SCORES – ASKED QUESTIONS)
Mean Score (5 point scale)
Functioning of lights at stations/parking lots .... 4.27
Cleanliness of stations/parking lots .................. 4.03
Posted information on info. boards .................. 3.92
Ease of use of ticket vending machines ............ 3.73
Being informed of delays that exceed 10 minutes ............................................................. 3.48
OVERALL EXPERIENCE AT CALTRAIN STATIONS 3.97
Note: Mean score based on a 5 point scale. 5.00 is the optimal positive score and 1.00 is the lowest score. Base: Total (2,904)
(See Statistical Tables 1‐6)

Caltrain Customer Satisfaction Survey – June 2013 | Summary Report
8
ONBOARD RATINGS (MEAN SCORES – ASKED QUESTIONS)
Mean Score (5 point scale)
Professional appearance of the conductors ..... 4.37
Your sense of personal security while on the train .................................................................. 4.30
Courtesy of conductors ..................................... 4.24
Availability of printed materials ........................ 4.23
Cleanliness of train exteriors ............................ 4.09
On‐time arrival at your destination .................. 4.01
Cleanliness of train interiors ............................. 3.86
Adequacy & clarity of onboard announcements ................................................ 3.68
Being informed of delays that exceed 10 minutes ........................................................ 3.68
Cleanliness of onboard restrooms .................... 3.22
OVERALL EXPERIENCE ONBOARD TRAINS ......... 4.10
Note: Mean score based on a 5 point scale. 5.00 is the optimal positive score and 1.00 is the lowest score. Base: Total (2,904)
(See Statistical Tables 7‐17)

Caltrain Customer Satisfaction Survey – June 2013 | Summary Report
9
AVERAGE SCORES – JUNE 2013
Blank N/A 1 2 3 4 5
Average Mean
ASKED QUESTIONS^
1. Cleanliness of stations/parking lots 68 20 99 532 1,310 875 4.03
2. Functioning of lights at stations 303 14 32 308 1,125 1,122 4.27
3. Posted information on info. boards (schedules, flyers) 143 58 171 587 1,058 887 3.92
4. Ease of use of ticket vending machines 241 136 253 585 917 772 3.73
5. Being informed of delays that exceed 10 minutes 322 211 378 609 733 651 3.48
6. Everything considered, how would you rate your overall experience at Caltrain stations? 33 14 77 584 1,510 686 3.97
7. Courtesy of conductors 103 25 79 344 1,101 1,252 4.24
8. Professional appearance of the conductors 107 8 30 262 1,112 1,385 4.37
9. Availability of printed materials (schedules, brochures, notices) 257 12 84 363 1,016 1,172 4.23
10. Cleanliness of train exteriors 74 22 86 505 1,211 1,006 4.09
11. Cleanliness of train interiors 38 50 187 677 1,159 793 3.86
12. Cleanliness of onboard restrooms 998 165 338 610 491 302 3.22
13. Adequacy and clarity of routine onboard announcements (station delays, special events) 138 111 272 686 1,021 676 3.68
14. Being informed of delays that exceed 10 minutes 378 134 255 573 894 670 3.68
15. On‐time arrival at your destination (within five minutes of scheduled arrival time) 78 53 133 498 1,178 964 4.01
16. Your sense of personal security while on the train 30 8 46 304 1,241 1,275 4.30
17. Everything considered, how would you rate your onboard experience on Caltrain 30 9 48 432 1,556 829 4.10
18. Considering both your station and onboard experience, how would you rate your overall Caltrain 70 23 54 454 1,552 751 4.04
WEIGHTED AVERAGES^^
TOTAL STATIONS AND PARKING (Questions 1. through 6.)^^ 1,110 453 1,010 3,205 6,653 4,993 3.90
TOTAL ONBOARD (Questions 7. through 17.)^^ 2,251 597 1,558 5,254 11,980 10,324 4.01
TOTAL STATIONS AND ONBOARD (Questions 1. through 17.)^^ 1,681 525 1,284 4,230 9,317 7,659 3.97
^Asked question ratings are based on the actual number of responses for each particular question. ^^Weighted averages are calculated as follows: "Total Stations and Parking" is calculated using the total responses for Question 1 through Question 6. "Total Onboard Experience" is calculated using the total responses for Question 7 through Question 17. "Total Stations & Onboard" is calculated by taking the average of "Total Stations and Parking" and "Total Onboard Experience." The total number of responses shown for “Total Stations & Onboard Experience” is thus an average of these two sub‐categories.
(See Statistical Tables 1‐18)

Caltrain Customer Satisfaction Survey – June 2013 | Summary Report
10
MEAN SCORES ‐ 2013 COMPARED TO 2012
SCALE: 1=Poor, 5=Excellent 2013 Mean
2012 Mean
Mean Difference
Statistically Significant?
ASKED QUESTIONS^
1. Cleanliness of stations/parking lots 4.03 4.05 ‐0.02 No
2. Functioning of lights at stations 4.27 4.22 0.05 Yes
3. Posted information on info. Boards (schedules, flyers) 3.92 3.81 0.11 Yes
4. Ease of use of ticket vending machines 3.73 3.77 ‐0.04 No
5. Being informed of delays that exceed 10 minutes 3.48 3.17 0.31 Yes
6. Everything considered, how would you rate your overall experience at Caltrain stations? 3.97 3.92 0.05 Yes
7. Courtesy of conductors 4.24 4.22 0.02 No
8. Professional appearance of the conductors 4.37 4.35 0.02 No
9. Availability of printed materials (schedules, brochures, notices) 4.23 4.22 0.01 No
10. Cleanliness of train exteriors 4.09 4.14 ‐0.05 Yes
11. Cleanliness of train interiors 3.86 3.91 ‐0.05 No
12. Cleanliness of onboard restrooms 3.22 3.23 ‐0.01 No
13. Adequacy and clarity of routine onboard announcements (station delays, special events) 3.68 3.64 0.04 No
14. Being informed of delays that exceed 10 minutes 3.68 3.57 0.11 Yes
15. On‐time arrival at your destination (within five minutes of scheduled arrival time) 4.01 3.82 0.19 Yes
16. Your sense of personal security while on the train 4.30 4.31 ‐0.01 No
17. Everything considered, how would you rate your onboard experience on Caltrain 4.10 4.09 0.01 No
18. Considering both your station and onboard experience, how would you rate your overall Caltrain experience? 4.04 4.01 0.03 No
WEIGHTED AVERAGES^^
TOTAL STATIONS AND PARKING (Questions 1. through 6.) 3.90 3.83 0.07 Yes
TOTAL ONBOARD (Questions 7. through 17.) 4.01 3.98 0.03 Yes
TOTAL STATIONS AND ONBOARD (Questions 1. through 17.) 3.97 3.93 0.04 Yes
^Asked question ratings are based on the actual number of responses for each particular question. ^^Weighted averages are calculated as follows: "Total Stations and Parking" is calculated using the total responses for Question 1. through Question 6. "Total Onboard Experience" is calculated using the total responses for Question 7 through Question 17. "Total Stations & Onboard" is calculated by taking the average of "Total Stations and Parking" and "Total Onboard Experience.
(See Statistical Tables 1‐18)

Caltrain Customer Satisfaction Survey – June 2013 | Summary Report
11
LONG‐TERM TRENDS IN OVERALL SATISFACTION Q18. Considering both your station and onboard experience, how would you rate your overall Caltrain experience?
Mean Scores, Overall Satisfaction, 1998‐2013
Points represent surveys (May 98, Nov 98, May 99, Nov 99, Jun 00, Dec 00, Jul 01, May 02, Jan 05, Jun 05, Dec 05, Jun 06, Jun 07, Jun 08, Jun 09, Jun 10, Jun 11, Dec 12, and Jun 13) No data available for late 2002‐late 2004. Note: In comparing attributes to one another, a statistically significant mean difference, at the 95% confidence level is approximately 0.03 for these overall scores.
(See Historical Data and Statistical Table Q18)
3.96
4.013.97
3.86
3.57
3.98
4.06 4.07 4.09 4.1
3.98
4.05 4.04
3.98 4.00
4.03
3.99 4.01
4.04
3.00
4.00
5.00
Trendline

Caltrain Customer Satisfaction Survey – June 2013 | Summary Report
12
CALTRAIN PERFORMANCE TREND Q19. Has Caltrain performance improved or declined over the past year?
Base: Total (2,904)
(See Statistical Table 19)
39%
6%
56%
Improved
Declined
Stayed the same

Caltrain Customer Satisfaction Survey – June 2013 | Summary Report
13
RECOMMENDATION Q20. Would you recommend Caltrain service to your friends and family?
Base: Total (2,904)
(See Statistical Table 20)
61%
31%
6%2% >1%
Definitely (5)
Probably (4)
Might or Might Not
(3)
Probably Not (2)
Defintely Not (1)
92% Would Recommend

Caltrain Customer Satisfaction Survey – June 2013 | Summary Report
14
IMPROVEMENT PRIORITIES Q21. What areas should be the highest priority for improvement?
MULTIPLE ANSWERS ACCEPTED
Base: Total (2,904) Note: Only responses from 2% or greater of respondents are shown. See Statistical Table 21 for a full list. *Response not listed on survey instrument, but was written as “Other” by respondents
(See Statistical Table 21)
45%
28%
23%
13%
9%
8%
6%
6%
4%
4%
3%
2%
2%
2%
Frequency of service
Communicating service delays
On‐time performance
Seating availability
No concerns
Parking availability
Onboard customer service
Security
Better/More improved ticketing system/machines*
More outlets/Wi‐fi/Internet access/phone coverage/smart apps*
More bike space/cars/tags/bike parking*
Improved restroom onboard*
Cleaner trains*
Reduce cost/Fare is too high*

Caltrain Customer Satisfaction Survey – June 2013 | Summary Report
15
DETAILED RESULTS

Caltrain Customer Satisfaction Survey – June 2013 | Summary Report
16
RATING OF CALTRAIN SERVICE
STATION RATINGS OVERALL The rating for overall experience at Caltrain stations has increased significantly since 2012.
There were no statistically significant decreases since 2012.
The largest statistically significant increase was “Being informed of delays that exceed 10 minutes,” which increased 0.31 points since 2012, but “Posted information in info. boards” also saw a significant increase of 0.11 since 2012.
MEAN SCORES (5 point scale) JUNE 2013 DECEMBER 2012 JUNE 2011
Base: (All Respondents) 2,904* 1,856* 2,417* Functioning of lights at stations .................... 4.27 4.22 4.26 Cleanliness of stations/parking lots ............... 4.03 4.05 4.13 Posted information on info. boards (schedules, flyers) ............................................................. 3.92 3.81 3.79 Ease of use of ticket vending machines ......... 3.73 3.77 3.78 Being informed of delays that exceed 10 minutes .......................................................... 3.48 3.17 3.18
Everything considered, how would you rate your overall experience at Caltrain stations? 3.97 3.92 3.91 Mean score is based on number giving a rating, eliminating not applicable and blanks. The higher the mean the better the rating. Optimum positive mean score = 5.00. Lowest negative mean score possible = 1.00. * Number of passengers 18 years and older responding to the survey. Respondents may or may not have responded to the individual question.
(See Statistical Tables 1‐6)

Caltrain Customer Satisfaction Survey – June 2013 | Summary Report
17
STATION RATINGS OVERALL (continued) N=base of survey participants JUNE 2013 N=2,904* VERY VERY NOT MEAN DECEMBER 2012 N=1,856* SATISFIED DISSATISFIED APPLICABLE SCORE JUNE 2011 N=2,417* 5 4 3 2 1 [ ] (5 Pt. Scale)
‐ ‐ ‐ ‐ ‐ ‐ ‐ ‐ ‐ ‐ ‐ ‐ ‐ ‐ ‐ ‐ ‐ ‐ ‐ ‐ ‐ ‐ read % across ‐ ‐ ‐ ‐ ‐ ‐ ‐ ‐ ‐ ‐ ‐ ‐ ‐ ‐ ‐ ‐ ‐ ‐
Functioning of lights at stations JUNE 2013 .................................. 39 39 11 1 1 10 4.27 DECEMBER 2012 .......................... 39 39 14 2 <1 6 4.22 JUNE 2011 .................................... 40 38 12 1 <1 9 4.26 Cleanliness of stations/parking lots JUNE 2013 .................................. 30 45 19 3 1 2 4.03 DECEMBER 2012 .......................... 32 44 19 3 1 2 4.05 JUNE 2011 .................................... 35 45 16 2 1 1 4.13 Posted information on info. boards JUNE 2013 .................................. 31 20 6 2 2 4 3.92 DECEMBER 2012 .......................... 30 33 25 7 3 3 3.81 JUNE 2011 .................................... 28 34 24 8 3 3 3.79 Ease of use of ticket vending machines JUNE 2013 .................................. 27 32 20 9 5 8 3.73 DECEMBER 2012 .......................... 30 29 22 9 4 7 3.77 JUNE 2011 .................................... 29 31 21 9 4 7 3.78 Being informed of delays that exceed 10 minutes JUNE 2013 .................................. 23 26 21 13 7 10 3.48 DECEMBER 2012 .......................... 17 20 24 15 12 12 3.17 JUNE 2011 .................................... 16 22 22 16 11 13 3.18
Everything considered, how would you rate your overall experience at Caltrain stations? JUNE 2013 .................................. 24 52 20 3 1 1 3.97 DECEMBER 2012 .......................... 23 49 25 2 1 <1 3.92 JUNE 2011 .................................... 22 52 22 3 1 1 3.91 (See Statistical Tables 1‐6) Mean score is based on number giving a rating, eliminating not applicable and blanks. The higher the mean the better the rating. Optimum positive mean score = 5.00. Lowest negative mean score possible = 1.00. * Number of passengers 18 years and older responding to the survey. Respondents may or may not have responded to the individual question.

Caltrain Customer Satisfaction Survey – June 2013 | Summary Report
18
STATION RATINGS BY TIME PERIOD Weekday peak riders rated their overall satisfaction lower than any group by time period, while
Saturday riders rated it the highest.
The greatest disparity between weekday peak riders and Saturday riders is their rating of “Being informed of delays that exceed 10 minutes,” with Saturday riders rating this attribute 3.83, and weekday peak riders rating this same attribute 3.34 (0.49 difference).
Weekday periods saw a significant increase in “Overall experience at Caltrain stations” since 2012. The Saturday period remained the same.
o Weekday Peak: 3.90 (2013) vs. 3.74 (2012) o Weekday Off‐peak: 4.10 (2013) vs. 3.98 (2012) o Saturday: 4.13 (2013) vs. 4.14 (2012)
‐ ‐ ‐ ‐ ‐ ‐ ‐ ‐ ‐ ‐ ‐ ‐ ‐ ‐ ‐ ‐ ‐ ‐ ‐ ‐ ‐ ‐ read across ‐ ‐ ‐ ‐ ‐ ‐ ‐ ‐ ‐ ‐ ‐ ‐ ‐ ‐ ‐ ‐ ‐ ‐ ‐ ‐ ‐ ‐
Overall Weekday Weekday Mean Score Peak Off‐Peak Saturday (Base = All Respondents) (5 point scale) 2,904* 1,924* 566* 411*
Functioning of lights at stations ........... 4.27 4.25 4.31 4.31 Cleanliness of stations/parking lots ...... 4.03 3.98 4.13 4.15 Posted information on info. boards ..... 3.92 3.88 4.03 3.97 Ease of use of ticket vending machines 3.73 3.66 3.87 3.83 Being informed of delays that exceed 10 minutes ........................ 3.48 3.34 3.77 3.83 Overall experience at Caltrain stations 3.97 3.90 4.10 4.13 Mean score is based on number giving a rating, eliminating not applicable and blanks. The higher the mean the better the rating. Optimum positive mean score = 5.00. Lowest negative mean score possible = 1.00. * Number of passengers 18 years and older responding to the survey. Respondents may or may not have responded to the individual question.
(See Statistical Tables 1‐6)

Caltrain Customer Satisfaction Survey – June 2013 | Summary Report
19
STATION RATINGS BY TYPE OF SERVICE Saturday local or bullet riders provided the highest station ratings in every category, while Weekday
Bullet riders provided the lowest. ‐ ‐ ‐ ‐ ‐ ‐ ‐ ‐ ‐ ‐ ‐ ‐ ‐ ‐ ‐ ‐ ‐ ‐ ‐ ‐ ‐ ‐ read across ‐ ‐ ‐ ‐ ‐ ‐ ‐ ‐ ‐ ‐ ‐ ‐ ‐ ‐ ‐ ‐ ‐ ‐ ‐ ‐ ‐ ‐
Overall Weekday Weekday Weekday Saturday Saturday Mean Score Local Limited Bullet Local Bullet
(Base = All Respondents) (5 point scale) 2,904* 491* 1,399* 600* 321* 90*
Functioning of lights at stations ........... 4.27 4.33 4.27 4.21 4.29 4.37 Cleanliness of stations/parking lots ...... 4.03 4.13 3.99 3.95 4.13 4.21 Posted information on info. boards ..... 3.92 4.05 3.89 3.87 3.98 3.90 Ease of use of ticket vending machines 3.73 3.86 3.70 3.59 3.83 3.81 Being informed of delays that exceed 10 minutes ........................ 3.48 3.76 3.38 3.29 3.86 3.72 Overall experience at Caltrain stations 3.97 4.10 3.92 3.88 4.12 4.15 Mean score is based on number giving a rating, eliminating not applicable and blanks. The higher the mean the better the rating. Optimum positive mean score = 5.00. Lowest negative mean score possible = 1.00. * Number of passengers 18 years and older responding to the survey. Respondents may or may not have responded to the individual question.
(See Statistical Tables 1‐7)

Caltrain Customer Satisfaction Survey – June 2013 | Summary Report
20
STATION RATINGS BY BIKE CAR Riders in regular cars are more satisfied than those in bike cars regarding the “Overall experience at
Caltrain stations.”
The largest difference in rating of station attributes comes from each group’s perception of the “Ease of use of ticket vending machines.” Those in bike cars rate the ease of use 0.15 points lower than those riders in regular cars.
‐ ‐ ‐‐ ‐ ‐ ‐ ‐ ‐ ‐‐ ‐‐‐ ‐ ‐ ‐ read across ‐ ‐ ‐ ‐ ‐ ‐ ‐ ‐ ‐‐ ‐ ‐ ‐ ‐
Overall Car Type Mean Score Regular Bike (Base = All Respondents) (5 point scale) 2,904* 1,849* 1,052*
Functioning of lights at stations ........... 4.27 4.27 4.28 Cleanliness of stations/parking lots ...... 4.03 4.03 4.04 Posted information on info. boards ..... 3.92 3.95 3.88 Ease of use of ticket vending machines 3.73 3.78 3.63 Being informed of delays that exceed 10 minutes ........................ 3.48 3.51 3.42 Overall experience at Caltrain stations 3.97 3.99 3.92 Mean score is based on number giving a rating, eliminating not applicable and blanks. The higher the mean the better the rating. Optimum positive mean score = 5.00. Lowest negative mean score possible = 1.00. * Number of passengers 18 years and older responding to the survey. Respondents may or may not have responded to the individual question.
(See Statistical Tables 1‐6)

Caltrain Customer Satisfaction Survey – June 2013 | Summary Report
21
STATION RATINGS BY PERFORMANCE TREND The greatest disparity between those who felt Caltrain’s performance is declining over the past
year and those who felt it is improving is “Being informed of delays that exceed 10 minutes.” Riders who felt that Caltrain is improving rated it 3.68 and those who felt it is declining rated it 2.57 (1.11 difference).
‐ ‐ ‐ ‐ ‐ ‐ ‐ ‐ ‐ ‐ ‐ ‐ ‐ ‐ ‐ ‐ ‐ ‐ ‐ ‐ ‐ ‐ read across ‐ ‐ ‐ ‐ ‐ ‐ ‐ ‐ ‐ ‐ ‐ ‐ ‐ ‐ ‐ ‐ ‐ ‐ ‐ ‐ ‐ ‐
Overall Caltrain’s performance is: Mean Score Improving Declining Staying the same (Base = All Respondents) (5 point scale) 2,904* 999* 148* 1,432*
Functioning of lights at stations ........... 4.27 4.36 3.94 4.21 Cleanliness of stations/parking lots ...... 4.03 4.12 3.63 3.95 Posted information on info. boards ..... 3.92 4.12 3.37 3.83 Ease of use of ticket vending machines 3.73 3.90 3.18 3.65 Being informed of delays that exceed 10 minutes ........................ 3.48 3.68 2.57 3.37 Overall experience at Caltrain stations 3.97 4.11 3.30 3.90 Mean score is based on number giving a rating, eliminating not applicable and blanks. The higher the mean the better the rating. Optimum positive mean score = 5.00. Lowest negative mean score possible = 1.00. * Number of passengers 18 years and older responding to the survey. Respondents may or may not have responded to the individual question.
(See Statistical Tables 1‐6)

Caltrain Customer Satisfaction Survey – June 2013 | Summary Report
22
ONBOARD RATINGS OVERALL The overall onboard experience rating increased slightly from 4.09 in 2012.
Two of the 10 onboard ratings showed significant improvement when compared with 2012. These were “On‐time arrival at your destination” (from 3.82 in 2012 to 4.01 in 2013) and “Being informed of delays that exceed ten minutes” (from 3.57 in 2012 to 3.68 in 2013).
One of the ten onboard ratings showed significant decreases when compared with 2012. This was “cleanliness of train exteriors” (from 4.14 in 2012 to 3.22 in 2013).
MEAN SCORES (5 point scale) JUNE 2013 DECEMBER 2012 JUNE 2011
Base: (All Respondents) 2,904* 1,856* 2,417* Professional appearance of conductors ........... 4.37 4.35 4.35 Your sense of personal security while on the train ................................................................... 4.30 4.31 4.31 Courtesy of conductors ..................................... 4.24 4.22 4.17 Availability of printed materials ....................... 4.23 4.22 4.05 Cleanliness of train exteriors ............................ 4.09 4.14 4.07 On‐time arrival at your destination .................. 4.01 3.82 3.85 Cleanliness of train interiors ............................. 3.86 3.91 3.90 Adequacy and clarity of routine onboard announcements ................................. 3.68 3.64 3.63 Being informed of delays that exceed 10 minutes ........................................................ 3.68 3.57 3.57 Cleanliness of onboard restrooms .................... 3.22 3.23 3.34
Onboard experience (overall) on Caltrain ........ 4.10 4.09 4.07 Mean score is based on number giving a rating, eliminating not applicable and blanks. The higher the mean the better the rating. Optimum positive mean score = 5.00. Lowest negative mean score possible = 1.00. * Number of passengers 18 years and older responding to the survey. Respondents may or may not have responded to the individual question.
(See Statistical Tables 7‐17)

Caltrain Customer Satisfaction Survey – June 2013 | Summary Report
23
ONBOARD RATINGS OVERALL (continued) N=base of survey participants ‐ ‐ ‐ ‐ ‐ ‐ ‐ ‐ ‐ ‐ ‐ ‐‐ ‐ ‐ ‐ ‐ ‐ ‐ ‐ read % across ‐ ‐ ‐ ‐ ‐ ‐ ‐ ‐ ‐ ‐ ‐ ‐ ‐ ‐ ‐ JUNE 2013 N=2,904* VERY VERY NOT MEAN DECEMBER 2012 N=1,856* SATISFIED DISSATISFIED APPLICABLE SCORE JUNE 2011 N=2,417* 5 4 3 2 1 [ ] (5 Pt. Scale)
Professional appearance of the conductors JUNE 2013 ..................................... 48 39 9 1 <1 3 4.37 DECEMBER 2012 ............................. 48 38 10 1 1 2 4.35 JUNE 2011 ....................................... 48 38 9 1 1 3 4.35 Your sense of personal security while on the train JUNE 2013 ..................................... 44 43 11 2 <1 1 4.30 DECEMBER 2012 ............................. 46 41 10 2 1 1 4.31 JUNE 2011 ....................................... 46 42 10 2 1 <1 4.31 Courtesy of conductors JUNE 2013 ..................................... 44 38 12 3 1 3 4.24 DECEMBER 2012 ............................. 43 39 12 3 1 2 4.22 JUNE 2011 ....................................... 41 39 14 3 1 3 4.17 Availability of printed materials JUNE 2013 ..................................... 41 35 13 3 <1 8 4.23 DECEMBER 2012 ............................. 41 37 14 2 1 6 4.22 JUNE 2011 ....................................... 36 36 18 4 2 6 4.05 Cleanliness of train exteriors JUNE 2013 ..................................... 35 42 18 3 1 2 4.09 DECEMBER 2012 ............................. 37 43 15 3 1 2 4.14 JUNE 2011 ....................................... 34 42 17 4 1 2 4.07 On‐time arrival at your destination JUNE 2013 ..................................... 34 41 17 5 2 2 4.01 DECEMBER 2012 ............................. 28 38 22 6 4 2 3.82 JUNE 2011 ....................................... 29 39 21 7 3 2 3.85 Cleanliness of train interiors JUNE 2013 ..................................... 28 40 24 7 2 1 3.86 DECEMBER 2012 ............................. 29 43 21 6 2 <1 3.91 JUNE 2011 ....................................... 29 41 21 7 2 <1 3.90 Adequacy and clarity of routine onboard announcements JUNE 2013 ..................................... 24 36 24 10 4 4 3.68 DECEMBER 2012 ............................. 25 32 25 11 5 3 3.64 JUNE 2011 ....................................... 24 34 23 12 5 4 3.63 Being informed of delays that exceed 10 minutes JUNE 2013 ..................................... 23 31 20 9 5 12 3.68 DECEMBER 2012 ............................. 23 27 21 11 6 13 3.57 JUNE 2011 ....................................... 21 30 18 11 7 14 3.57 Cleanliness of onboard restrooms JUNE 2013 ..................................... 11 17 21 12 6 33 3.22 DECEMBER 2012 ............................. 12 18 23 11 7 31 3.23 JUNE 2011 ....................................... 12 19 21 10 5 34 3.34 Everything considered, how would you rate your onboard experience on Caltrain? JUNE 2013 ..................................... 29 54 15 2 <1 <1 4.10 DECEMBER 2012 ............................. 30 51 16 2 <1 <1 4.09 JUNE 2011 ....................................... 28 54 15 2 1 <1 4.07 Mean score is based on number giving a rating, eliminating not applicable and blanks. The higher the mean the better the rating. Optimum positive mean score = 5.00. Lowest negative mean score possible = 1.00. * Number of passengers 18 years and older responding to the survey. Respondents may or may not have responded to the individual question.
(See Statistical Tables 7‐17)

Caltrain Customer Satisfaction Survey – June 2013 | Summary Report
24
ONBOARD RATINGS BY TIME PERIOD
Weekday peak riders rated every onboard attribute except for “Availability of printed material” and “Courtesy of conductors” lower than riders in other time period.
The largest disparity among rider groups was for the attribute, “Cleanliness of onboard restrooms,” with a difference of 0.44 between the rating given by Weekday Peak and Saturday riders. The “Onboard experience (overall) on Caltrain” increased significantly across weekday time periods compared to 2012. Although the Saturday score decreased slightly, the decrease is not statistically significant.
o Weekday Peak: 4.03 (2013) vs. 3.95 (2012) o Weekday Off‐peak: 4.20 (2013) vs. 4.12 (2012) o Saturday: 4.25 (2013) vs. 4.28 (2012)
‐ ‐ ‐ ‐ ‐ ‐ ‐ ‐ ‐ ‐ ‐ ‐ ‐ ‐ ‐ ‐ ‐ ‐ ‐ ‐ ‐ ‐ read across ‐ ‐ ‐ ‐ ‐ ‐ ‐ ‐ ‐ ‐ ‐ ‐ ‐ ‐ ‐ ‐ ‐ ‐ ‐ ‐ ‐ ‐
Overall Weekday Weekday Mean Score Peak Off‐Peak Saturday (Base = All Respondents) (5 point scale) 2,904* 1,924* 566* 411*
Professional appearance of the conductors .................................................. 4.37 4.37 4.38 4.36
Your sense of personal security while on the train ................................................. 4.30 4.29 4.31 4.30
Courtesy of conductors ............................... 4.24 4.24 4.27 4.23 Cleanliness of train exteriors ...................... 4.09 4.06 4.19 4.13
Availability of printed materials ................. 4.23 4.24 4.19 4.22
On‐time arrival at your destination ............ 4.01 3.95 4.11 4.20
Cleanliness of train interiors ....................... 3.86 3.78 4.02 4.03
Adequacy and clarity of routine onboard announcements ........................... 3.68 3.60 3.83 3.86
Being informed of delays that exceed 10 minutes .................................................. 3.68 3.60 3.85 3.87
Cleanliness of onboard restrooms .............. 3.22 3.13 3.33 3.57
Onboard experience (overall) on Caltrain .. 4.10 4.03 4.20 4.25
Mean score is based on number giving a rating, eliminating not applicable and blanks. The higher the mean the better the rating. Optimum positive mean score = 5.00. Lowest negative mean score possible = 1.00. * Number of passengers 18 years and older responding to the survey. Respondents may or may not have responded to the individual question.
Caltrain Customer Satisfaction Survey – June 2013 | Summary Report
25
(See Statistical Tables 7‐17)
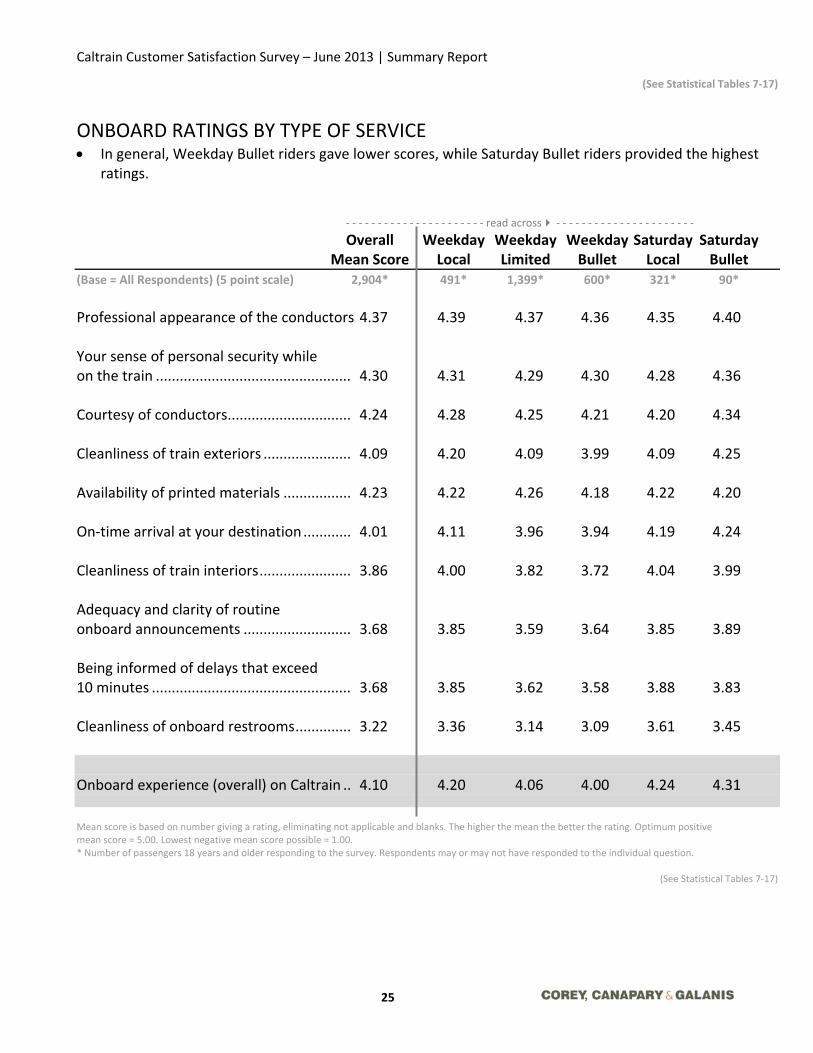
ONBOARD RATINGS BY TYPE OF SERVICE In general, Weekday Bullet riders gave lower scores, while Saturday Bullet riders provided the highest
ratings.
‐ ‐ ‐ ‐ ‐ ‐ ‐ ‐ ‐ ‐ ‐ ‐ ‐ ‐ ‐ ‐ ‐ ‐ ‐ ‐ ‐ ‐ read across ‐ ‐ ‐ ‐ ‐ ‐ ‐ ‐ ‐ ‐ ‐ ‐ ‐ ‐ ‐ ‐ ‐ ‐ ‐ ‐ ‐ ‐
Overall Weekday Weekday Weekday Saturday Saturday Mean Score Local Limited Bullet Local Bullet
(Base = All Respondents) (5 point scale) 2,904* 491* 1,399* 600* 321* 90*
Professional appearance of the conductors 4.37 4.39 4.37 4.36 4.35 4.40 Your sense of personal security while on the train ................................................. 4.30 4.31 4.29 4.30 4.28 4.36 Courtesy of conductors ............................... 4.24 4.28 4.25 4.21 4.20 4.34 Cleanliness of train exteriors ...................... 4.09 4.20 4.09 3.99 4.09 4.25 Availability of printed materials ................. 4.23 4.22 4.26 4.18 4.22 4.20 On‐time arrival at your destination ............ 4.01 4.11 3.96 3.94 4.19 4.24 Cleanliness of train interiors ....................... 3.86 4.00 3.82 3.72 4.04 3.99 Adequacy and clarity of routine onboard announcements ........................... 3.68 3.85 3.59 3.64 3.85 3.89 Being informed of delays that exceed 10 minutes .................................................. 3.68 3.85 3.62 3.58 3.88 3.83 Cleanliness of onboard restrooms .............. 3.22 3.36 3.14 3.09 3.61 3.45 Onboard experience (overall) on Caltrain .. 4.10 4.20 4.06 4.00 4.24 4.31 Mean score is based on number giving a rating, eliminating not applicable and blanks. The higher the mean the better the rating. Optimum positive mean score = 5.00. Lowest negative mean score possible = 1.00. * Number of passengers 18 years and older responding to the survey. Respondents may or may not have responded to the individual question.
(See Statistical Tables 7‐17)

Caltrain Customer Satisfaction Survey – June 2013 | Summary Report
26
ONBOARD RATINGS BY BIKE CAR Riders in regular cars rated the onboard experience generally the same or higher than riders in bicycle
cars.
The highest difference in ratings was “Cleanliness of train interiors,” with those in Bike cars rating this 0.14 lower.
‐ ‐ ‐‐ ‐ ‐ ‐ ‐ ‐ ‐‐ ‐‐‐ ‐ ‐ ‐ read across ‐ ‐ ‐ ‐ ‐ ‐ ‐ ‐ ‐‐ ‐ ‐ ‐ ‐
Overall Car Type Mean Score Regular Bike (Base = All Respondents) (5 point scale) 2,904* 1,849* 1,052*
Professional appearance of the conductors 4.37 4.40 4.33 Your sense of personal security while on the train ................................................. 4.30 4.29 4.31 Courtesy of conductors ............................... 4.24 4.28 4.18 Cleanliness of train exteriors ...................... 4.09 4.06 4.19 Availability of printed materials ................. 4.23 4.23 4.22 On‐time arrival at your destination ............ 4.01 4.12 4.04 Cleanliness of train interiors ....................... 3.86 3.91 3.77 Adequacy and clarity of routine onboard announcements ........................... 3.68 3.69 3.67 Being informed of delays that exceed 10 minutes .................................................. 3.68 3.67 3.69 Cleanliness of onboard restrooms .............. 3.22 3.28 3.15 Onboard experience (overall) on Caltrain .. 4.10 4.11 4.07 Mean score is based on number giving a rating, eliminating not applicable and blanks. The higher the mean the better the rating. Optimum positive mean score = 5.00. Lowest negative mean score possible = 1.00. * Number of passengers 18 years and older responding to the survey. Respondents may or may not have responded to the individual question.
(See Statistical Tables 7‐17)

Caltrain Customer Satisfaction Survey – June 2013 | Summary Report
27
ONBOARD RATINGS BY PERFORMANCE TREND
The greatest disparity is the rating for “On‐time arrival at your destination between those who felt Caltrain’s performance is declining over the past year and those who felt it is improving. Riders who felt that Caltrain is improving rated this attribute 4.14 and those riders who felt that Caltrain has declined rated this attribute 3.05 (1.09 difference).
‐ ‐ ‐ ‐ ‐ ‐ ‐ ‐ ‐ ‐ ‐ ‐ ‐ ‐ ‐ ‐ ‐ ‐ ‐ ‐ ‐ ‐ read across ‐ ‐ ‐ ‐ ‐ ‐ ‐ ‐ ‐ ‐ ‐ ‐ ‐ ‐ ‐ ‐ ‐ ‐ ‐ ‐ ‐ ‐
Overall Caltrain’s performance is: Mean Score Improving Declining Staying the same (Base = All Respondents) (5 point scale) 2,904* 999* 148* 1,432*
Professional appearance of the conductors .................................................. 4.37 4.47 4.03 4.32
Your sense of personal security while on the train ................................................. 4.30 4.39 3.90 4.25
Courtesy of conductors ............................... 4.24 4.33 3.73 4.20 Cleanliness of train exteriors ...................... 4.09 4.21 3.69 4.03
Availability of printed materials ................. 4.23 4.39 4.03 4.16
On‐time arrival at your destination ............ 4.01 4.14 3.05 3.98
Cleanliness of train interiors ....................... 3.86 3.98 3.26 3.77
Adequacy and clarity of routine onboard announcements ........................... 3.68 3.82 2.88 3.64
Being informed of delays that exceed 10 minutes .................................................. 3.68 3.83 2.89 3.61
Cleanliness of onboard restrooms .............. 3.22 3.43 2.53 3.09
Onboard experience (overall) on Caltrain .. 4.10 4.26 3.40 4.02
Mean score is based on number giving a rating, eliminating not applicable and blanks. The higher the mean the better the rating. Optimum positive mean score = 5.00. Lowest negative mean score possible = 1.00. * Number of passengers 18 years and older responding to the survey. Respondents may or may not have responded to the individual question.
(See Statistical Tables 7‐17)

Caltrain Customer Satisfaction Survey – June 2013 | Summary Report
28
OVERALL SATISFACTION WITH CALTRAIN Considering both your station and onboard experience, how would you rate your overall Caltrain experience?
The average (mean) score increased to 4.04 from 4.01 in 2012. 2013 2012 2011 Total Total Total Base: (All Respondents) 2,904* 1,856* 2,417* % % % Very Satisfied (5) ............................. 26 27 25 (4) .................................................... 55 50 54 (3) .................................................... 16 20 17 (2) .................................................... 2 2 3 Very Dissatisfied (1) ........................ 1 1 1 Not Applicable ................................ <1 <1
100 100 100 RECAP %: Satisfied (5 or 4) .............................. 81 81 79 Neutral (3) ................................ 16 20 17 Dissatisfied (1 or 2) ......................... 3 3 4 MEAN ......................................... 4.04 4.01 3.99 * Number of passengers 18 years and older responding to the survey. Respondents may or may not have responded to the individual question.
(See Statistical Table 18)

Caltrain Customer Satisfaction Survey – June 2013 | Summary Report
29
OVERALL SATISFACTION WITH CALTRAIN – BY SUB‐GROUPS ‐ ‐ ‐ ‐ ‐ ‐ ‐ ‐ ‐ ‐ ‐ ‐ ‐ ‐ ‐ ‐ ‐ ‐ ‐ ‐ read across ‐ ‐ ‐ ‐ ‐ ‐ ‐ ‐ ‐ ‐ ‐ ‐ ‐ ‐ ‐ ‐ ‐ ‐ ‐ Very BASE MEAN Satisfied Satisfied Dissatisfied Neutral/NA # (5 pt scale) (5 rating) (4 rating) (2 or 1 rating) (3 rating)
% % % %
TOTAL ......................................... (2,904) 4.04 26 55 3 16 BY RIDERSHIP SEGMENT Weekday Peak ....................... (1,924) 3.99 23 57 3 18 Weekday Off‐peak ................. (566) 4.14 33 51 2 14 Saturday ................................. (411) 4.18 35 50 2 11 BY TYPE OF SERVICE Weekday Local ....................... (491) 4.14 33 51 2 14 Weekday Limited ................... (1,399) 3.99 23 57 3 17 Weekday Bullet ...................... (600) 3.98 23 56 3 18 Saturday Local ........................ (321) 4.17 34 51 3 11 Saturday Bullet ....................... (90) 4.20 39 46 2 13 BY CAR TYPE Regular ................................... (1,849) 4.06 28 54 3 16 Bike ........................................ (1,052) 4.01 25 56 3 17 BY PERFORMANCE TREND Caltrain’s performance is: Improving ............................... (999) 4.19 33 55 1 11 Declining ................................ (148) 3.24 10 28 18 44 Staying the same .................... (1,432) 3.98 22 57 2 19
(See Statistical Table 18)

Caltrain Customer Satisfaction Survey – June 2013 | Summary Report
30
CALTRAIN PERFORMANCE TREND Has Caltrain performance improved or declined over the past year?
Overall, half of Caltrain’s riders (56%) feel that Caltrain’s performance has remained the same. One‐third (39%) feel that Caltrain’s performance has improved.
Weekday Weekday Ridership Segment Overall Peak Off‐Peak Saturday (Base = All Respondents) (5 point scale) 2,904* 1,924* 566* 411*
% % % % Improved ..................................................... 39 38 42 39 Declined ...................................................... 6 7 4 4 Stayed the same ......................................... 56 56 55 57
100 100 100 100 ‐ ‐ ‐ ‐ ‐ ‐ ‐ ‐ ‐ ‐ ‐ ‐ ‐ ‐ ‐ ‐ ‐ ‐ ‐ ‐ ‐ ‐ read across ‐ ‐ ‐ ‐ ‐ ‐ ‐ ‐ ‐ ‐ ‐ ‐ ‐ ‐ ‐ ‐ ‐ ‐ ‐ ‐ ‐ ‐
Overall Weekday Weekday Weekday Saturday Saturday Mean Score Local Limited Bullet Local Bullet
(Base = All Respondents) (5 point scale) 2,904* 491* 1,399* 600* 321* 90*
% % % % % % Improved ..................................................... 39 41 41 33 39 37 Declined ...................................................... 6 5 6 8 4 5 Stayed the same ......................................... 56 54 54 60 57 57
100 100 100 100 100 100
Car Type Bike Car Overall Regular Bike (Base = All Respondents) (5 point scale) 2,904* 1,849* 1,052*
Improved ..................................................... 39 38 40 Declined ...................................................... 6 6 5 Stayed the same ......................................... 56 56 55
100 100 100
* Number of passengers 18 years and older responding to the survey. Respondents may or may not have responded to the individual question.
(See Statistical Table 19)

Caltrain Customer Satisfaction Survey – June 2013 | Summary Report
31
RECOMMENDATION Would you recommend Caltrain service to your friends and family?
Most (92%) of riders would recommend Caltrain to their friends and family.
Weekday Weekday Ridership Segment Overall Peak Off‐Peak Saturday (Base = All Respondents) (5 point scale) 2,904* 1,924* 566* 411*
% % % % Definitely (5) ............................................... 61 60 63 65 Probably (4) ................................................. 31 32 29 31 Might or might not (3) ................................ 6 7 6 4 Probably not (2) .......................................... 2 2 2 1 Definitely not (1) ......................................... <1 <1 <1 1
100 100 100 100 RECAP %: Would recommend (4 or 5) ........................ 92 91 92 95 Neutral (3) ................................................... 6 7 6 4 Would not recommend (2 or 1) .................. 2 2 3 1 MEAN ...................................................... 4.51 4.49 4.52 4.58
Overall Weekday Weekday Weekday Saturday Saturday Mean Score Local Limited Bullet Local Bullet
(Base = All Respondents) (5 point scale) 2,904* 491* 1,399* 600* 321* 90*
Definitely (5) ............................................... 61 63 61 58 64 66 Probably (4) ................................................. 31 29 31 32 30 32 Might or might not (3) ................................ 6 6 7 8 5 1 Probably not (2) .......................................... 2 2 2 2 1 1 Definitely not (1) ......................................... <1 <1 <1 1 1 ‐
100 100 100 100 100 100 RECAP %: Would recommend (4 or 5) ........................ 92 92 92 90 94 98 Neutral (3) ................................................... 6 6 7 8 5 1 Would not recommend (2 or 1) .................. 2 2 2 2 1 1 MEAN ...................................................... 4.51 4.52 4.50 4.44 4.57 4.62
(See Statistical Table 20)

Caltrain Customer Satisfaction Survey – June 2013 | Summary Report
32
RECOMMENDATION (Continued)
Car Type Bike Car Overall Regular Bike (Base = All Respondents) (5 point scale) 2,904* 1,849* 1,052*
Definitely (5) ............................................... 61 60 62 Probably (4) ................................................. 31 32 30 Might or might not (3) ................................ 6 6 7 Probably not (2) .......................................... 2 2 1 Definitely not (1) ......................................... <1 1 <1
100 100 100 RECAP %: Would recommend (4 or 5) ........................ 92 92 92 Neutral (3) ................................................... 6 6 7 Would not recommend (2 or 1) .................. 2 2 1 MEAN ...................................................... 4.51 4.50 4.52 Overall Caltrain’s performance is: Performance Trend Mean Score Improving Declining Staying the same (Base = All Respondents) (5 point scale) 2,904* 999* 148* 1,432*
% % % % Definitely (5) ............................................... 61 77 17 53 Probably (4) ................................................. 31 20 45 38 Might or might not (3) ................................ 6 3 24 7 Probably not (2) .......................................... 2 1 12 1 Definitely not (1) ......................................... <1 ‐ 3 <1
100 100 100 100 RECAP %: Would recommend (4 or 5) ........................ 92 97 62 91 Neutral (3) ................................................... 6 3 24 7 Would not recommend (2 or 1) .................. 2 1 14 2 MEAN ...................................................... 4.51 4.73 3.62 4.42 * Number of passengers 18 years and older responding to the survey. Respondents may or may not have responded to the individual question.
(See Statistical Table 20)

Caltrain Customer Satisfaction Survey – June 2013 | Summary Report
33
IMPROVEMENT What areas should be the highest priority for improvement?
Nearly half (45%) of riders felt that improving frequency should be Caltrain’s highest priority for improvement.
Riders also felt Caltrain should communicate service delays better, improve on‐time performance, and reduce crowding.
‐ ‐ ‐ ‐ ‐ ‐ ‐ ‐ ‐ ‐ ‐ ‐ ‐ ‐ ‐ ‐ ‐ ‐ ‐ ‐ ‐ ‐ read % across ‐ ‐ ‐ ‐ ‐ ‐ ‐ ‐ ‐ ‐ ‐ ‐ ‐ ‐ ‐ ‐ ‐ ‐
Weekday Weekday Ridership Segment Overall Peak Off‐Peak Saturday (Base = All Respondents) (5 point scale) 2,904* 1,924* 566* 411* MULTIPLE RESPONSES
Frequency of service ................................... 45 46 47 39 Communicating service delays ................... 28 32 20 19 On‐time performance ................................. 23 25 22 17 Seating availability ...................................... 13 15 9 11 Parking availability ...................................... 8 9 7 7 Onboard customer service ......................... 6 5 9 9 Security ....................................................... 6 4 7 10 Better/More/Improved ticketing system/ machines^ ................................................ 4 4 4 5 More bike space/cars/tags/bike parking^ .. 3 4 3 2 Improved restrooms onboard^ .................. 2 2 2 4 Cleaner trains^ ............................................ 2 2 1 2 Faster trains/More bullet/express trains^ . 2 2 2 2 Reduce cost/Fare is too high^ .................... 2 1 2 3 Additional/expanded service (particular stations/days/times)^ .............................. 1 1 1 2 Improve mechanical fitness of trains/too bumpy a ride/reduce noise/reduce diesel fumes/Electrify/Reduce pollution from trains/have back‐up of trains/Get new trains/new cars^ ...................................... 1 2 2 <1 Additional station amenities (shade/seating restrooms/parking lot/repaving/ restriping/overnight parking at stations/ additional staff/cleaner stations/better lighting/signage)^ .................................... 1 1 1 1 Note: Only responses from 1% or greater of respondents are shown. See Statistical Table 21 for a full list. * Number of passengers 18 years and older responding to the survey. Respondents may or may not have responded to the individual question. ^Response was not listed on survey instrument, but was written as “Other” by respondents
(See Statistical Tables 21)

Caltrain Customer Satisfaction Survey – June 2013 | Summary Report
34
IMPROVEMENT (Continued) ‐ ‐ ‐ ‐ ‐ ‐ ‐ ‐ ‐ ‐ ‐ ‐ ‐ ‐ ‐ ‐ ‐ ‐ ‐ ‐ ‐ ‐ read % across ‐ ‐ ‐ ‐ ‐ ‐ ‐ ‐ ‐ ‐ ‐ ‐ ‐ ‐ ‐ ‐ ‐ ‐
Weekday Weekday Ridership Segment Overall Peak Off‐Peak Saturday (Base = All Respondents) (5 point scale) 2,904* 1,924* 566* 411*
Lessen the impact of delays/Reduce accidents/impact on train schedule/ better communication of impact^ ........... 1 1 1 1 Enforce on board rules (e.g. food, rowdy/ noisy passengers, seating, alcohol on trains/inebriated passengers/non‐bike passengers in bike car/littering/fare enforcement)^ ......................................... 1 1 1 <1 Real‐time departure/arrival info/Real‐time departure boards/Show which track^ ..... 1 1 1 1 Onboard amenities (quiet car, more cupholders/trash bins, better climate control, better/more seatback trays, increased leg room, info on board that says “where is this train going”)^ .................... 1 1 1 1 Add stops/Stop at weekend only stations during week/Add SF stops/Stop more at infrequent locations (Broadway, Tamien, Lawrence, etc.)^ ....................................... 1 1 1 ‐ Better coordination with other systems (VTA, SFMTA, BART)^ ............................... 1 <1 1 1 Lessen impact of Giants games and other special events (e.g. crowding, lack of fare enforcement, drunkenness, rowdiness, noise, security)^ ....................................... 1 1 ‐ 1 No Concerns ................................................ 9 7 12 13
Note: Only responses from 1% or greater of respondents are shown. See Statistical Table 21 for a full list. * Number of passengers 18 years and older responding to the survey. Respondents may or may not have responded to the individual question. ^Response was not listed on survey instrument, but was written as “Other” by respondents
(See Statistical Tables 21)

Caltrain Customer Satisfaction Survey – June 2013 | Summary Report
35
BOARDING STATION
At which station did you get on this train?
One‐quarter (24%) of all riders boarded at San Francisco.
Four stations ‐ San Francisco, Palo Alto, Mountain View, San Jose Diridon ‐ account for half (52%) of all riders.
‐ ‐ ‐ ‐ ‐ ‐ ‐ ‐ ‐ ‐ ‐ ‐ ‐ ‐ ‐ ‐ ‐ ‐ ‐ ‐ ‐ ‐ read % across ‐ ‐ ‐ ‐ ‐ ‐ ‐ ‐ ‐ ‐ ‐ ‐ ‐ ‐ ‐ ‐ ‐ ‐
Weekday Weekday Ridership Segment Overall Peak Off‐Peak Saturday (Base = All Respondents) (5 point scale) 2,904* 1,924* 566* 411*
San Francisco .............................................. 24 26 23 17 Palo Alto ...................................................... 10 10 12 8 Mountain View ........................................... 9 10 8 9 San Jose Diridon .......................................... 9 9 7 12 Sunnyvale .................................................... 7 7 5 9 Millbrae ....................................................... 6 4 8 10 Hillsdale ....................................................... 5 6 4 4 Redwood City .............................................. 5 4 6 7 San Mateo ................................................... 4 3 4 6 Menlo Park .................................................. 3 3 4 2 Lawrence ..................................................... 3 3 1 2 San Carlos.................................................... 2 3 2 1 California Ave .............................................. 2 2 2 2 Tamien ........................................................ 2 2 1 ‐ Santa Clara .................................................. 2 2 2 3 22nd St ......................................................... 2 2 1 2 San Antonio ................................................. 2 2 2 2 Burlingame .................................................. 1 1 1 2 Belmont ...................................................... 1 <1 3 1 South San Francisco .................................... 1 1 1 1 San Bruno .................................................... 1 1 1 1 Hayward Park .............................................. 1 <1 1 1 Blossom Hill ................................................. <1 <1 ‐ ‐ Morgan Hill ................................................. <1 <1 ‐ ‐ Broadway .................................................... <1 ‐ ‐ 1 Gilroy ........................................................... <1 <1 ‐ ‐ Bayshore ..................................................... <1 ‐ <1 <1 Capitol ......................................................... <1 <1 ‐ ‐ San Martin .................................................. <1 <1 ‐ ‐ * Number of passengers 18 years and older responding to the survey. Respondents may or may not have responded to the individual question.
(See Statistical Tables 22)
Caltrain Customer Satisfaction Survey – June 2013 | Summary Report
36
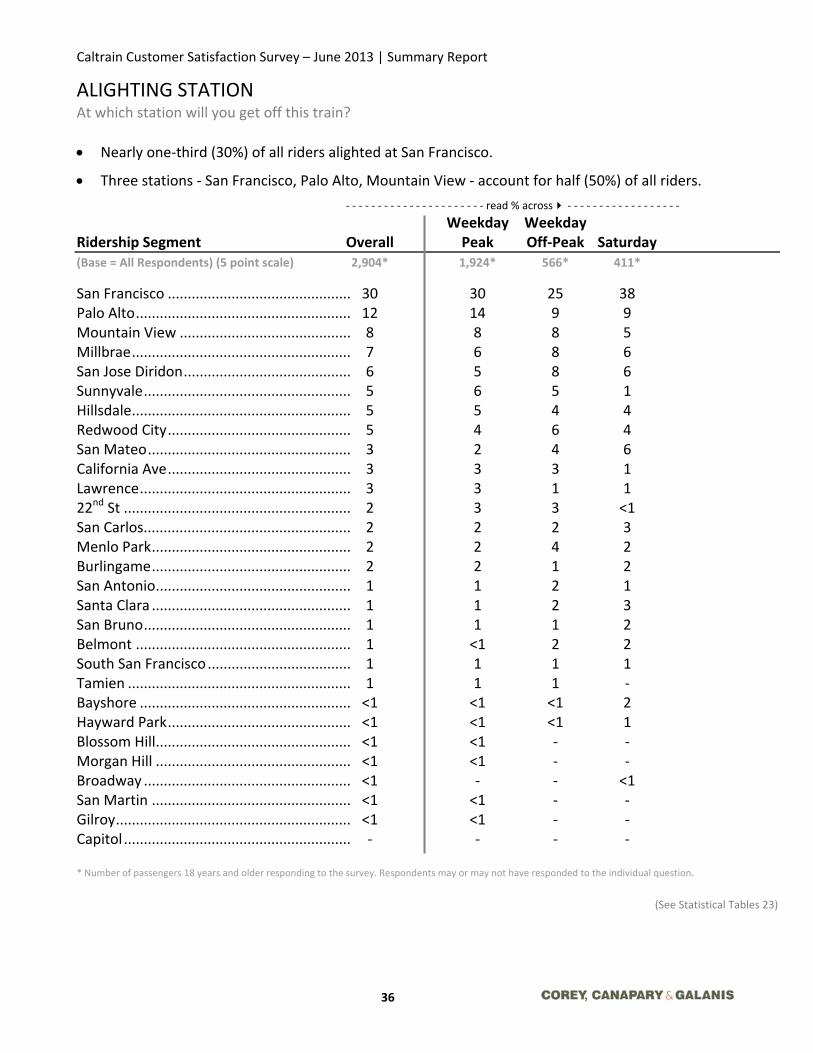
ALIGHTING STATION
At which station will you get off this train?
Nearly one‐third (30%) of all riders alighted at San Francisco.
Three stations ‐ San Francisco, Palo Alto, Mountain View ‐ account for half (50%) of all riders.
‐ ‐ ‐ ‐ ‐ ‐ ‐ ‐ ‐ ‐ ‐ ‐ ‐ ‐ ‐ ‐ ‐ ‐ ‐ ‐ ‐ ‐ read % across ‐ ‐ ‐ ‐ ‐ ‐ ‐ ‐ ‐ ‐ ‐ ‐ ‐ ‐ ‐ ‐ ‐ ‐
Weekday Weekday Ridership Segment Overall Peak Off‐Peak Saturday (Base = All Respondents) (5 point scale) 2,904* 1,924* 566* 411*
San Francisco .............................................. 30 30 25 38 Palo Alto ...................................................... 12 14 9 9 Mountain View ........................................... 8 8 8 5 Millbrae ....................................................... 7 6 8 6 San Jose Diridon .......................................... 6 5 8 6 Sunnyvale .................................................... 5 6 5 1 Hillsdale ....................................................... 5 5 4 4 Redwood City .............................................. 5 4 6 4 San Mateo ................................................... 3 2 4 6 California Ave .............................................. 3 3 3 1 Lawrence ..................................................... 3 3 1 1 22nd St ......................................................... 2 3 3 <1 San Carlos.................................................... 2 2 2 3 Menlo Park .................................................. 2 2 4 2 Burlingame .................................................. 2 2 1 2 San Antonio ................................................. 1 1 2 1 Santa Clara .................................................. 1 1 2 3 San Bruno .................................................... 1 1 1 2 Belmont ...................................................... 1 <1 2 2 South San Francisco .................................... 1 1 1 1 Tamien ........................................................ 1 1 1 ‐ Bayshore ..................................................... <1 <1 <1 2 Hayward Park .............................................. <1 <1 <1 1 Blossom Hill ................................................. <1 <1 ‐ ‐ Morgan Hill ................................................. <1 <1 ‐ ‐ Broadway .................................................... <1 ‐ ‐ <1 San Martin .................................................. <1 <1 ‐ ‐ Gilroy ........................................................... <1 <1 ‐ ‐ Capitol ......................................................... ‐ ‐ ‐ ‐ * Number of passengers 18 years and older responding to the survey. Respondents may or may not have responded to the individual question.
(See Statistical Tables 23)

Caltrain Customer Satisfaction Survey – June 2013 | Summary Report
37
APPENDICES

Caltrain Customer Satisfaction Survey – June 2013 | Summary Report
38
APPENDIX A QUESTIONNAIRES
Caltrain Customer Satisfaction Survey – June 2013 | Summary Report
39

Caltrain Customer Satisfaction Survey – June 2013 | Summary Report
40

Caltrain Customer Satisfaction Survey – June 2013 | Summary Report
41
Caltrain Customer Satisfaction Survey – June 2013 | Summary Report
42

Caltrain Customer Satisfaction Survey – June 2013 | Summary Report
43
APPENDIX B INTERVIEWER TRAINING INSTRUCTIONS

Caltrain Customer Satisfaction Survey – June 2013 | Summary Report
44
INTERVIEWER INSTRUCTIONS Caltrain On-Board Survey (June 2013)
PROJECT OVERVIEW: This project is a passenger survey being conducted to assess how well Caltrain is meeting the needs of its passengers. It is an onboard self-administered questionnaire to be distributed on Caltrain trains. The questionnaires will be handed out and collected on sampled Caltrain routes. The fieldwork will take place June 5-13, 2013. One or two surveyors will be utilized on each sampled route. .
GENERAL GUIDELINES Please be punctual. Arrive at the station 15 minutes prior to train departure time.
As representatives of Caltrain/Corey, Canapary & Galanis, you are asked to dress in casual business attire: long trousers and collared shirts for men, slacks/skirt/blouse/dress for women. Wear comfortable, closed toed shoes.
All surveyors must wear their ID badges and have a valid photo ID at all times while surveying.
Please act professionally at all times.
Each train will have 5 cars. The average number of passengers will vary significantly by run. We anticipate a high response rate based on experience with on‐board surveys. Please have sufficient surveys and pencils at the start of each shift.
If appropriate, please identify yourself to the train conductor and explain that you will be surveying one car on the train.
If asked what the purpose of the survey is, you may tell passengers that the study is designed to measure customer satisfaction and solicit rider suggestions. Caltrain is interested in their opinion.
It is important to adhere to the assigned shifts. If you cannot make an assigned shift, please notify CC&G as soon as possible. Starting shifts late, missed shifts, or covering shifts other than those assigned may be cause for dismissal.
All survey data collected is confidential and must be treated with care. Any sharing or use of data is cause for immediate dismissal.
SAFETY Working on a moving train can be challenging at times. Your safety and the safety of the passengers around you is your most important concern. Please hold on to a handrail or bar at all times when you are standing or walking on the train. Allow passengers the time to find a seat or a safe place to stand before offering them a survey. Do not block passengers entering or exiting the train.
DISTRIBUTION OF QUESTIONNAIRES Distributing (and collecting) questionnaires from passengers is your primary task on this project. For each of your runs, you should strive to get the questionnaire into the hands of every (or nearly every) passenger on your assigned train car. Your approach as a surveyor will make a tremendous difference in whether or not riders agree to do the survey.

Caltrain Customer Satisfaction Survey – June 2013 | Summary Report
45
BEGINNING OF SHIFT You must have your Caltrain schedule(s), system authorization badge, name badge, photo ID, Interviewer Survey Schedule, apron, pencils, questionnaires, Completed Questionnaire Envelope(s), survey control sheets, rubber bands, Interviewer Instructions, clipboard, and time sheet. Your Interviewer Survey Schedule will include the location and time of trains you are responsible for surveying on each day.
SURVEY CONTROL SHEET (White Card) It is very important that you enter information accurately on your survey control sheet. A separate survey control sheet (small white card) will be used for each surveyor on each train run. A run is one trip on one train from the boarding point to the end of the line or the point at which you exit the train.
AT THE START OF EACH RUN YOU SHOULD ENTER: the current date and day route number of the train your last name the specific station where you are boarding the train to start the run. (“Trip
Start Location”) the time the run started (time you boarded the train)
PROCEDURE FOR DISTRIBUTING QUESTIONNAIRES You must write the train # on all questionnaires that are distributed. To do this, you should pre‐
number questionnaires prior to each train run. Use the riders per car estimate on your schedule to determine the amount of questionnaires that you should pre‐number. You may need to number additional questionnaires on some runs.
Nearly all Caltrain trains have a total of 5 cars. You will be distributing questionnaires on only one of these cars. The train car for you to survey will be pre‐assigned and listed on your Interviewer Survey Schedule. For example ‐ “Train car number: 2” – means that you will survey the second car on the train. Be sure to only survey this assigned car. See the “Car Selection” section on page 5 of these specifications for detailed instructions on how to determine the car number. Please note that there may be occasions when a train may have fewer cars than your
assigned train car number. IF the car number on your assignment sheet exceeds the length of the train, board the train and hand out questionnaires on the car which is in the same position your assigned car would be on a 5‐car train.

Caltrain Customer Satisfaction Survey – June 2013 | Summary Report
46
For example, car 4 out of 5 is one car from the end of the train. If your train was only 3 cars long, you would hand out questionnaires in car 2 (which is one car from the end of the train).
Note the actual car selected and # of cars on train on the Completed Questionnaires
envelope (next to the Car Number) whenever: o Your train has fewer than 5 cars; and/or o You must survey a different car than originally assigned (as explained above).
Attempt to distribute surveys to all passengers on this car who appear to be 13 or older. All riders traveling in a group should be given a questionnaire. Do not distribute questionnaires to:
o Passengers who appear to be under 13 years of age o Employees of Caltrain o Passengers who tell you that they have already participated in this survey on a
previous trip (within the last week or so). But do include passengers that may have participated in other previous surveys.
o Sleeping passengers
As you hand out surveys give a short introduction about the survey. Be easygoing and friendly. Do not ask riders if they want to fill out the survey; rather, use a positive approach. Phrases we have found to work well include: “We need your opinions on this Caltrain survey.” If they hesitate you might add: “We want to know what you think.”
Instruct passengers to return completed surveys to you.
After surveys are distributed, walk through the train car every few minutes and watch for people who may have questions or are finished. Be polite: “I’ll take the survey if you are done”, or “I can take that for you”. Attempt to collect every survey you distribute.
Passengers who do not have the time or inclination to complete the questionnaire on board can mail the survey back, postage paid (note mail panel on survey instrument). Mention this option as a last resort. We have found that when a potential respondent takes the questionnaire home with him/her, they are less likely to complete and return the questionnaire.
If time permits, offer assistance to patrons who are blind or unable to fill out the survey (you will need to excuse yourself to hand out questionnaires to new riders boarding the train).
Keep a tally of all non‐responses (passengers under 13, refusals, already participated, etc.) on your survey control sheet. DEFINITIONS: LANGUAGE BARRIER: Spanish speaking passengers who refuse a questionnaire are tallied as “refusals” since we have a Spanish instrument. Only passengers who speak a language other than English or Spanish are tallied as language barrier.

Caltrain Customer Satisfaction Survey – June 2013 | Summary Report
47
LEFT TRAIN: This is a non‐response that occurs when the surveyor cannot offer a questionnaire because of the short distance of the rider’s trip. If the rider refuses because of time constraints, it is important to offer the “mail back option”. We anticipate very few “Left Train” dispositions on this project.
AT THE END OF EACH RUN On the Survey Control Sheet enter: Location/station where you exited the train The time that the run ended The total number of questionnaires DISTRIBUTED for both English and Spanish. The total number of questionnaires RETURNED (combine English and Spanish) All returned surveys and the completed survey control sheet should be rubber
banded together and placed in the Completed Questionnaire Envelope labeled for that specific run. You will have several Completed Questionnaire Envelopes at the end of your shift.
The bottom half of the Completed Questionnaires envelope should be filled in by you at the end of your run. Fill in all information and combine the information from individual tally sheets (if working in teams) here.

Caltrain Customer Satisfaction Survey – June 2013 | Summary Report
48
AT THE END OF THE SHIFT Make sure that all completed work from all the runs you have done that day are placed in your “Completed Questionnaire Envelope”. Fill out the information requested and return these envelopes to the CC&G office.
CONTACT INFORMATION
COREY, CANAPARY & GALANIS RESEARCH Project Manager ‐ Jon Canapary (Cell 415‐577‐2428) Lead Supervisor – Elizabeth Grant
CCG 800 Number is 1 (800) 877‐1201
CALTRAIN Christiane Kwok, Caltrain Marketing 650‐508‐7926
NOTES
Caltrain Customer Satisfaction Survey – June 2013 | Summary Report
49
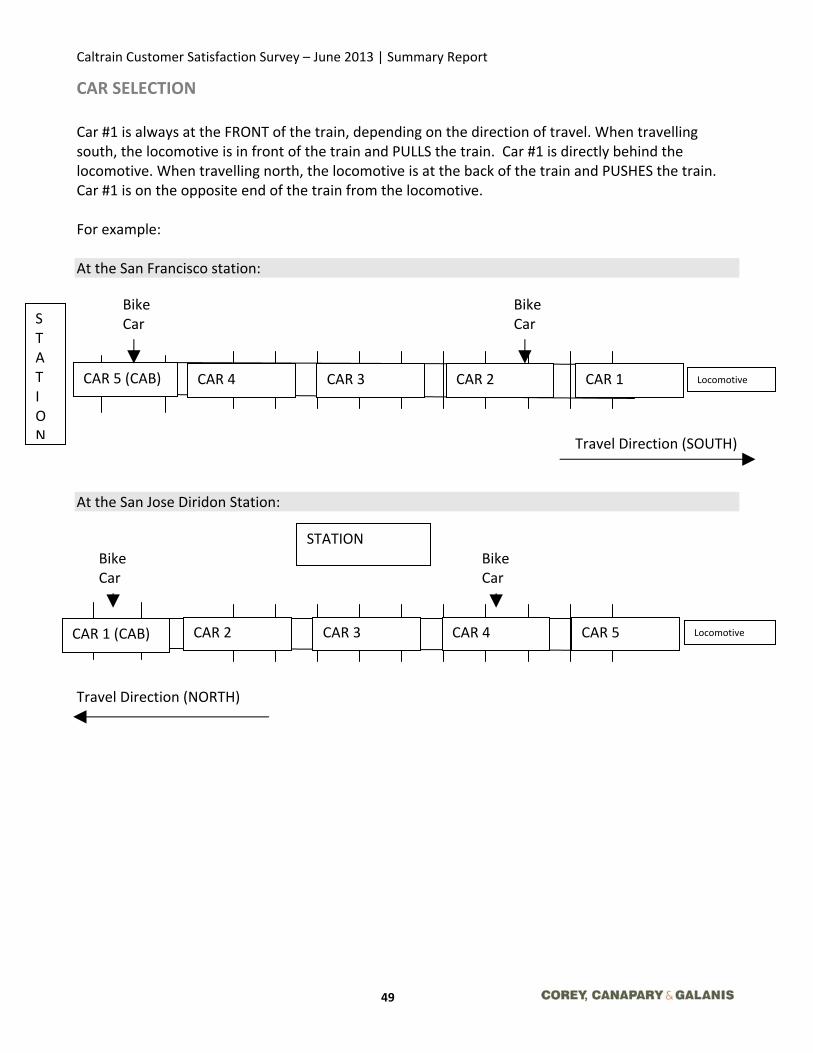
CAR SELECTION Car #1 is always at the FRONT of the train, depending on the direction of travel. When travelling south, the locomotive is in front of the train and PULLS the train. Car #1 is directly behind the locomotive. When travelling north, the locomotive is at the back of the train and PUSHES the train. Car #1 is on the opposite end of the train from the locomotive. For example: At the San Francisco station:
Travel Direction (SOUTH) At the San Jose Diridon Station: Travel Direction (NORTH)
CAR 3CAR 4 CAR 2 CAR 1
STATION
CAR 3CAR 2 CAR 4 CAR 5
Locomotive
Locomotive
CAR 5 (CAB)
Bike Car
CAR 1 (CAB)
S T A T I O N
Bike Car
Bike Car
Bike Car

Caltrain Customer Satisfaction Survey – June 2013 | Summary Report
50
APPENDIX C SCHEDULE

Caltrain Customer Satisfaction Survey – June 2013 | Summary Report
51
June 2013 Schedule
Train # Type Time Period Station Boarding Departure Time Station Exiting Time Exiting
Day Surveying
Date Surveying Direction
Packet ID# Car # Bike Car
101 LOCAL P SJ‐Diridon 4:30 AM SF‐4th/King 6:01 AM THUR 6‐Jun N 1 3
216 LIMITED P SF‐4th/King 7:19 AM SJ‐Diridon 8:28 AM THUR 6‐Jun S 2 2 B
233 LIMITED P SJ‐Diridon 8:40 AM SF‐4th/King 10:02 AM THUR 6‐Jun N 3 4 B
329 BULLET P SJ‐Diridon 8:03 AM SF‐4th/King 9:02 AM THUR 6‐Jun N 4 2
142 LOCAL O SF‐4th/King 11:07 AM SJ‐Diridon 12:38 PM THUR 6‐Jun S 5 1
151 LOCAL O SJ‐Diridon 1:10 PM SF‐4th/King 2:41 PM THUR 6‐Jun N 6 3
257 LIMITED O SJ‐Diridon 2:40 PM SF‐4th/King 4:02 PM THUR 6‐Jun N 7 3
268 LIMITED P SF‐4th/King 4:56 PM Gilroy 7:07 PM THUR 6‐Jun S 8 2 B
376 BULLET P SF‐4th/King 5:33 PM SJ‐Diridon 6:32 PM THUR 6‐Jun S 9 4
289 LIMITED P SJ‐Diridon 6:45 PM SF‐4th/King 8:00 PM THUR 6‐Jun N 10 5
192 LOCAL O SF‐4th/King 8:40 PM SJ‐Diridon 10:11 PM THUR 6‐Jun S 11 2 B
421 SAT LOCAL S SJ‐Diridon 7:00 AM SF‐4th/King 8:36 AM SAT 8‐Jun N 12 5
424 SAT LOCAL S SF‐4th/King 9:15 AM SJ‐Diridon 10:51 AM SAT 8‐Jun S 13 2 B
801 SAT BULLET S SJ‐Diridon 10:35 AM SF‐4th/King 11:39 AM SAT 8‐Jun N 14 1 B
432 SAT LOCAL S SF‐4th/King 1:15 PM SJ‐Diridon 2:51 PM SAT 8‐Jun S 15 1
433 SAT LOCAL S SJ‐Diridon 1:00 PM SF‐4th/King 2:36 PM SAT 8‐Jun N 16 1 B
438 SAT LOCAL S SF‐4th/King 4:15 PM SJ‐Diridon 5:51 PM SAT 8‐Jun S 17 4
441 SAT LOCAL S SJ‐Diridon 5:00 PM SF‐4th/King 6:36 PM SAT 8‐Jun N 18 5
804 SAT BULLET S SF‐4th/King 6:59 PM SJ‐Diridon 8:03 PM SAT 8‐Jun S 19 2 B
102 LOCAL P SF‐4th/King 4:55 AM SJ‐Diridon 6:26 AM TUE 11‐Jun S 20 4
313 BULLET P SJ‐Diridon 6:45 AM SF‐4th/King 7:42 AM TUE 11‐Jun N 21 4 B
324 BULLET P SF‐4th/King 8:14 AM SJ‐Diridon 9:13 AM TUE 11‐Jun S 22 5 B

Caltrain Customer Satisfaction Survey – June 2013 | Summary Report
52
Train # Type Time Period Station Boarding Departure Time Station Exiting Time Exiting
Day Surveying
Date Surveying Direction
Packet ID# Car # Bike Car
217 LIMITED P Gilroy 6:07 AM SF‐4th/King 8:19 AM TUE 11‐Jun N 23 3
332 BULLET P SF‐4th/King 8:57 AM SJ‐Diridon 9:58 AM TUE 11‐Jun S 24 5 B
207 LIMITED P SJ‐Diridon 5:57 AM SF‐4th/King 7:19 AM TUE 11‐Jun N 25 1 B
220 LIMITED P SF‐4th/King 7:44 AM SJ‐Diridon 9:05 AM TUE 11‐Jun S 26 4
254 LIMITED O SF‐4th/King 2:37 PM SJ‐Diridon 4:00 PM TUE 11‐Jun S 27 1
267 LIMITED P SJ‐Diridon 4:31 PM SF‐4th/King 5:39 PM TUE 11‐Jun N 28 1 B
282 LIMITED P SF‐4th/King 6:20 PM SJ‐Diridon 7:28 PM TUE 11‐Jun S 29 3
360 BULLET P SF‐4th/King 4:09 PM SJ‐Diridon 5:06 PM TUE 11‐Jun S 30 5 B
277 LIMITED P SJ‐Diridon 5:31 PM SF‐4th/King 6:39 PM TUE 11‐Jun N 31 1 B
288 LIMITED P SF‐4th/King 6:56 PM SJ‐Diridon 8:12 PM TUE 11‐Jun S 32 4
195 LOCAL O SJ‐Diridon 8:30 PM SF‐4th/King 10:01 PM TUE 11‐Jun N 33 2
206 LIMITED P SF‐4th/King 6:11 AM SJ‐Diridon 7:24 AM WED 12‐Jun S 34 3
225 LIMITED P SJ‐Diridon 7:50 AM SF‐4th/King 8:57 AM WED 12‐Jun N 35 2
230 LIMITED P SF‐4th/King 8:44 AM SJ‐Diridon 10:05 AM WED 12‐Jun S 36 3
143 LOCAL O SJ‐Diridon 11:10 AM SF‐4th/King 12:41 PM WED 12‐Jun N 37 3
150 LOCAL O SF‐4th/King 1:07 PM SJ‐Diridon 2:38 PM WED 12‐Jun S 38 4
262 LIMITED P SF‐4th/King 4:19 PM SJ‐Diridon 5:27 PM WED 12‐Jun S 39 1
381 BULLET P SJ‐Diridon 5:45 PM SF‐4th/King 6:44 PM WED 12‐Jun N 40 5
273 LIMITED P SJ‐Diridon 5:05 PM SF‐4th/King 6:29 PM WED 12‐Jun N 41 5
190 LOCAL O SF‐4th/King 7:30 PM SJ‐Diridon 9:01 PM WED 12‐Jun S 42 2 B
197 LOCAL O SJ‐Diridon 9:30 PM SF‐4th/King 11:01 PM WED 12‐Jun N 43 4 B

Caltrain Customer Satisfaction Survey – June 2013 | Summary Report
53
Train # Type Time Period Station Boarding Departure Time Station Exiting Time Exiting
Day Surveying
Date Surveying Direction
Packet ID# Car # Bike Car
385 BULLET P SJ‐Diridon 6:23 PM SF‐4th/King 7:24 PM THUR 13‐Jun N 44 3
206* LIMITED P SF‐4th/King 6:11 AM SJ‐Diridon 7:24 AM THUR 20‐Jun S 34 3
225* LIMITED P SJ‐Diridon 7:50 AM SF‐4th/King 8:57 AM THUR 20‐Jun N 35 2
Time period: Based on Departure Time. Weekday Peak = 6:00am‐9:00am OR 3:30pm – 6:30pm; Weekday Off‐Peak = all other times; Saturday = any Saturday train, P: Wkday Peak, O: Wkday Offpeak, S: Saturday, Direction: N: North, S: South The train car number is determined by counting from the direction the train is traveling. On Southbound trains car number one is the southernmost car; on Northbound trains car number one is the northernmost car. *Runs were redone, as a review of the returns from the initial runs on June 12 seemed abnormally low.

Caltrain Customer Satisfaction Survey – June 2013 | Summary Report
54
APPENDIX D TEST OF STATISTICAL SIGNIFICANCE

Caltrain Customer Satisfaction Survey – June 2013 | Summary Report
55
TEST OF STATISTICAL SIGNIFICANCE
95% Confidence Level 2013 2012
SCALE: 1=Poor, 5=Excellent Total
Response Don’t
Know/NA Sample Size Mean
Standard Deviation
Total Response
Don’t Know/NA
Sample Size Mean
Standard Deviation
Mean Diff. T‐Score
Statistically Significant?
ASKED QUESTIONS^
1. CLEANLINESS 2,904 47 2,883 4.03 0.84 1,856 27 1,829 4.05 0.85 ‐0.02 ‐0.79071 no
2. FUNCTIONING OF LIGHTS 2,904 280 2,881 4.27 0.76 1,856 41 1,815 4.22 0.79 0.05 2.14306 yes
3. POSTED INFORMATION 2,904 116 2,877 3.92 0.98 1,856 36 1,820 3.81 1.04 0.11 3.61072 yes
4. EASE OF USE/TICKET VENDING 2,904 227 2,890 3.73 1.13 1,856 33 1,823 3.77 1.12 ‐0.04 ‐1.18996 no
5. BEING INFORMED OF DELAYS 2,904 293 2875 3.48 1.24 1,856 49 1,807 3.17 1.30 0.31 8.08524 yes
6. OVERALL STATIONS 2,904 13 2,884 3.97 0.77 1,856 49 1,807 3.91 0.79 0.06 2.55617 yes
7. COURTESY OF CONDUCTORS 2,904 77 2,878 4.24 0.84 1,856 38 1,818 4.22 0.87 0.02 0.77761 no
8. PROF. APPEARANCE OF CONDUCTORS 2,904 87 2,884 4.37 0.72 1,856 42 1,814 4.35 0.77 0.02 0.88858 no
9. AVAILABILITY OF PRINTED MATERIALS 2,904 229 2,876 4.23 0.83 1,856 104 1,813 4.22 0.83 0.01 0.40177 no
10. CLEANLINESS/TRAIN EXTERIORS 2,904 51 2,881 4.09 0.85 1,856 39 1,817 4.14 0.84 ‐0.05 ‐1.97779 yes
11. CLEANLINESS/TRAIN INTERIORS 2,904 20 2,886 3.86 0.95 1,856 33 1,823 3.91 0.94 ‐0.05 ‐1.77063 no
12. CLEANLINESS/ONBOARD RESTROOMS 2,904 943 2,849 3.22 1.17 1,856 85 1,771 3.23 1.18 ‐0.01 ‐0.28097 no
13. ADEQUACY/CLARITY ONBOARD ANN 2,904 107 2,873 3.68 1.07 1,856 54 1,802 3.64 1.12 0.04 1.20901 no
14. BEING INFORMED OF DELAYS 2,904 355 2,881 3.68 1.13 1,856 60 1,796 3.57 1.20 0.11 3.11752 yes
15. ONTIME ARRIVAL AT DESTINATION 2,904 48 2,874 4.01 0.94 1,856 176 1,680 3.82 1.04 0.19 6.16034 yes
16. YOUR SENSE OF PERSONAL SECURITY 2,904 14 2,888 4.30 0.74 1,856 35 1,821 4.31 0.76 ‐0.01 ‐0.44420 no
17. OVERALL ONBOARD 2,904 7 2,881 4.10 0.72 1,856 39 1,817 4.09 0.75 0.01 0.45198 no

Caltrain Customer Satisfaction Survey – June 2013 | Summary Report
56
TEST OF STATISTICAL SIGNIFICANCE
95% Confidence Level 2013 2012
SCALE: 1=Poor, 5=Excellent Total
Response Don’t
Know/NA Sample Size Mean
Standard Deviation
Total Response
Don’t Know/NA
Sample Size Mean
Standard Deviation
Mean Diff. T‐Score
Statistically Significant?
18. BOTH STATION/ONBOARD 2,904 8 2,842 4.04 0.76 1,856 66 1,790 4.01 0.80 0.03 1.26685 no
WEIGHTED AVERAGES^^
TOTAL STATIONS AND PARKING 17,424 976 16,448 3.90 1.00 11,136 235 10,901 3.83 1.04 0.07 5.53368 yes
TOTAL ONBOARD EXPERIENCE 31,944 1,938 30,006 4.01 0.96 20,416 705 19,711 3.98 0.99 0.03 3.34497 yes
TOTAL STATIONS & ONBOARD 24,684 1,457 23,227 3.97 0.97 15,776 470 15,306 3.93 1.01 0.04 3.86413 yes
^Asked question ratings are based on the actual number of responses for each particular question. ^^Weighted averages are calculated as follows: "Total Stations and Parking" is calculated using the total responses for Question 1 through Question 6. "Total Onboard Experience" is calculated using the total responses for Question 7 through Question 17. "Total Stations & Onboard" is calculated by taking the average of "Total Stations and Parking" and "Total Onboard Experience." The total number of responses shown for “Total Stations & Onboard Experience” is thus an average of these two sub‐categories.