Embed Size (px)
Citation preview

CalPERS California Initiative 2016 Creating Opportunities in California’s Underserved Markets
B | CalPERS California Initiative 2016
Alameda
Alpine
Amador
Butte
Calaveras
Colusa
ContraCosta
Del Norte
El Dorado
Fresno
Glenn
Humboldt
Imperial
Inyo
Kern
Kings
Lake
Lassen
Los Angeles
Madera
Marin
Mariposa
Mendocino
Merced
Modoc
Mono
Monterey
Napa
Nevada
Orange
Placer
Plumas
Riverside
Sacramento
San Benito
San Bernardino
San Diego
San Joaquin
San Luis Obispo
San Mateo
San Francisco
Santa Barbara
Santa Clara
Santa Cruz
Shasta
Sierra
Siskiyou
Solano
Sonoma
StanislausSutter
Tehama
Trinity
Tulare
Tuolumne
Ventura
Yolo
Yuba
The CalPERS California Initiative
The California Initiative has committed over $1 billion to companies located in traditionally underserved markets, primarily, but not exclusively, located in California. The initiative has sought to discover and invest in opportunities that may have been bypassed or not reviewed by other sources of investment capital. The California Initiative’s primary objective is to generate attractive financial returns, meeting, or exceeding private equity benchmarks. As an ancillary benefit, the California Initiative was designed to focus investment in California’s underserved markets and invest in portfolio companies that:
• Have historically had limited access to institutional equity capital
• Employ workers who reside in economically disadvantaged areas
• Provide employment opportunities to women and minority entrepreneurs and managers

CalPERS California Initiative 2016 | 1
Table of Contents
Executive Summary . . . . . . . . . . . . . . . . . . . . . . . . . 3
Introduction . . . . . . . . . . . . . . . . . . . . . . . . . . . . 4
California Initiative Companies . . . . . . . . . . . . . . . . . . . . 5Employment and Employment Growth . . . . . . . . . . . . . 5Job Preservation and Growth
California Initiative Employment Growth versus U.S. and California Employment Growth . . . . . . . . . 8
Company Locations . . . . . . . . . . . . . . . . . . . . . 9Portfolio Diversification . . . . . . . . . . . . . . . . . . . 11Job Quality . . . . . . . . . . . . . . . . . . . . . . . . 12Suppliers . . . . . . . . . . . . . . . . . . . . . . . . . 14Patents . . . . . . . . . . . . . . . . . . . . . . . . . . 14California Focus . . . . . . . . . . . . . . . . . . . . . . 14
CalPERS California Initiative — Investing in Underserved Markets . . . . . . . . . . . . . . . . . . 15
Portfolio Companies That Have Historically Had Limited Access to Equity Capital . . . . . . . . . 15
Portfolio Companies That Employ Workers Living In Economically Disadvantaged Areas . . . . . . . . . . . . . 16
Portfolio Companies That Provide Employment Opportunities to Women and Minority Entrepreneurs and Managers . . . . . . . . . . . . . . . . 19
CalPERS California Initiative — Summary Findings . . . . . . . . . . . 21
Appendix . . . . . . . . . . . . . . . . . . . . . . . . . . . . 22California Initiative Summary Data . . . . . . . . . . . . . . . 22California Community Venture Fund . . . . . . . . . . . . . . . 23
Endnotes . . . . . . . . . . . . . . . . . . . . . . . . . . . . 25
CalPERS California Initiative 2016 | 3
Executive Summary
In 2001, CalPERS established the California Initiative to
invest private equity in “traditionally underserved markets,
primarily, but not exclusively in California.” 1
The California Initiative began with a capital commit-
ment of $475 million, known as Phase I. In 2006, CalPERS
made a second commitment totaling $560 million in an
investment vehicle known as the Golden State Investment
Fund (GSIF), externally managed by Hamilton Lane.
The objective of the California Initiative is to generate
attractive financial returns. The performance of the California
Initiative is reported regularly by CalPERS Private Equity and is
reported annually with the presentation of this Initiative.
Additional goals for the California Initiative included creating
jobs and promoting economic opportunity in California. This
report is intended to document those objectives. To determine
the extent of the ancillary benefits, CalPERS engaged Pacific
Community Ventures to measure the impact of the California
Initiative by examining portfolio companies that:• Traditionally have had limited access to
institutional equity capital• Employ workers living in economically
disadvantaged areas• Provide employment opportunities to women and
minority entrepreneurs and managers
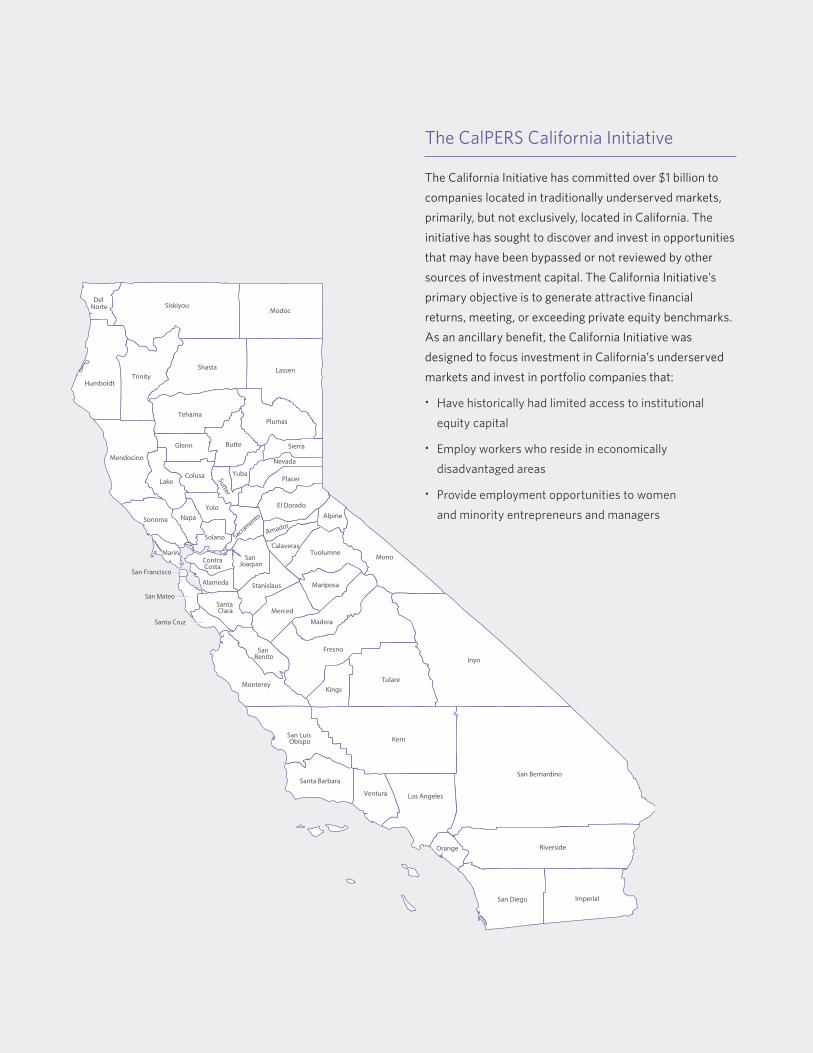
Since the inception of the California Initiative, CalPERS has
invested approximately $1 billion in 539 companies.
Quick Facts on the California Initiative since Inception
California Initiative Capital Allocations Year of Inception Manager of Funds Private Equity
Vehicles Capital CommittedCompanies
Receiving Investment
Phase I 2001 CalPERS 9 funds $375,000,000 122
Phase I: California Community Venture Fund2 2002 HarbourVest
Horizon 15 funds $100,000,000 177
Golden State Investment Fund 2006 Hamilton Lane
16 funds and 17 direct
co-investments$560,000,000 240
Totals $1,035,000,000 539
Summary Findings
• The California Initiative represents a significant capital
investment in California’s economy with 55 percent of
capital allocated to “California Companies”, defined as
those headquartered in California, or with a plurality of
employees or facilities in the state.• The California Initiative has created and sustained jobs
within California and the nation through continued
economic uncertainty, supporting 176,559 workers at all
companies since inception.• Companies receiving investment through the California
Initiative have provided quality jobs to employees, with
benefit levels for health and retirement outpacing
statewide and national levels.• The California Initiative has invested in areas of the state
that have historically not received institutional equity
capital, with 20 percent of all dollars deployed in
California allocated to companies located in these
underserved markets.• Economically disadvantaged communities benefit from
the California Initiative and its portfolio companies. The
California Initiative employs a significant number of
economically disadvantaged persons, with 44 percent of
GSIF portfolio company employees classified as low- to
moderate-income.• California Initiative portfolio companies have leadership
that includes women and minorities at levels that
outpace national and state and local levels.
4 | CalPERS California Initiative 2016
Introduction
In 2001, the CalPERS Investment Committee established,
and CalPERS staff implemented, the California Initiative. This
was done to invest private equity in “traditionally underserved
markets, primarily, but not exclusively in California.”
The California Initiative was initially launched with
a capital commitment of $475 million to nine private equity
funds and one fund-of-funds. This initial allocation is known as
Phase I. In 2006, CalPERS committed $560 million for a Phase
II to be managed by Hamilton Lane. This investment vehicle is
known as the Golden State Investment Fund (GSIF). GSIF seeks
to invest in both partnerships and direct co-investments
primarily in California. As of June 30, 2016, GSIF had invested
in 16 private equity funds and made 17 direct co-investments.
Since inception, CalPERS has invested approximately $1 billion
in the California Initiative supporting 539 private companies
across the state.
The objective of the California Initiative is to generate
attractive financial returns. As an ancillary benefit, the
California Initiative was designed to create jobs and promote
economic opportunity in California. To determine the extent
of the ancillary benefits, CalPERS measures the impact of the
California Initiative by examining portfolio companies that:• Traditionally have had limited access to institutional
equity capital• Employ workers living in economically
disadvantaged areas• Provide employment opportunities to women
and minority entrepreneurs and managers
CalPERS and Hamilton Lane engaged Pacific Community
Ventures (PCV), a provider of impact investing research and
consulting, to collect, analyze and report on the California
Initiative’s ancillary benefits.
This report focuses solely on data from 362 of the 539
companies that have received funding through Phase I (122)
and GSIF (240). The companies not included in this report
are the 177 that received funding through a $100 million
separate fund-of-funds account in Phase I. This is known as
the California Community Venture Fund (CCVF). A summary
of the community benefits derived from CCVF, prepared
separately by HarbourVest Horizon, is presented at the end
of this report, on page 23.
Of the 362 companies, 333 (92 percent) provided data
for this report. Since inception there have been 215 compa-
nies that have had exits and are fully realized investments.
Twelve of these 215 companies exited between July 1, 2015
and June 30, 2016.3
As of June 30, 2016, private equity funds that received
capital through the California Initiative had active invest-
ments in 123 companies (6 in Phase I and 117 in GSIF). Of the
123 active companies, 113 companies (92 percent) provided
data at June 30, 2016. This included 6 Phase I portfolio
companies (100 percent) and 107 GSIF portfolio companies
(91 percent).4
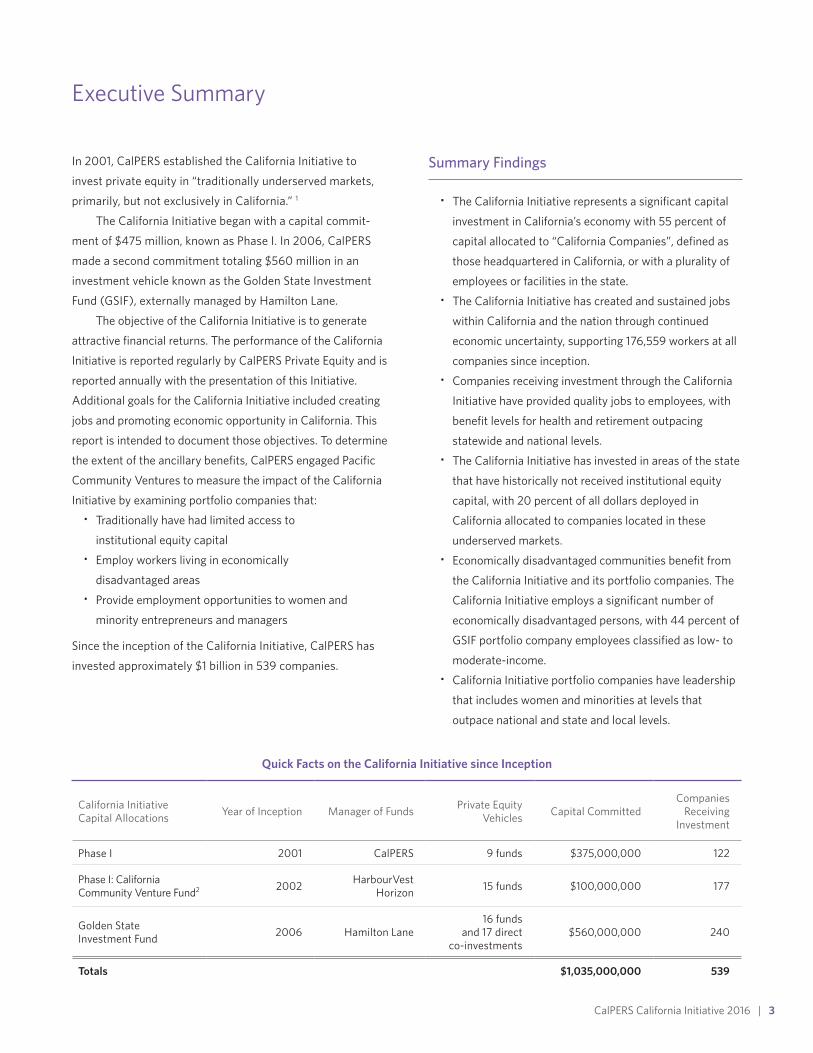
California Initiative Portfolio Investments1
Phase I GSIF Total California Initiative
Number of companies 122 240 362
Active companies (as of June 30, 2016) 6 (5%) 117 (49%) 123 (34%)
Fully realized (as of June 30, 2016) 116 (95%) 99 (41%) 215 (60%)
Active companies, contributed data 2016 6 (100%) 107 (91%) 113 (92%)
All companies ever reporting, including fully realized investments 104 (85%) 229 (95%) 333 (92%)
1This table does not include the 177 companies that received funding through the $100 million separate fund-of-funds account in Phase I allocated to the California Community Venture Fund.
CalPERS California Initiative 2016 | 5
California Initiative Companies
Employment and Employment Growth
The following sections detail employment growth since the
time of investment for companies in Phase I and GSIF of the
California Initiative, and from July 1, 2015 to June 30, 2016,
benchmarked against the U.S. and California private sectors.
Employment growth since investment
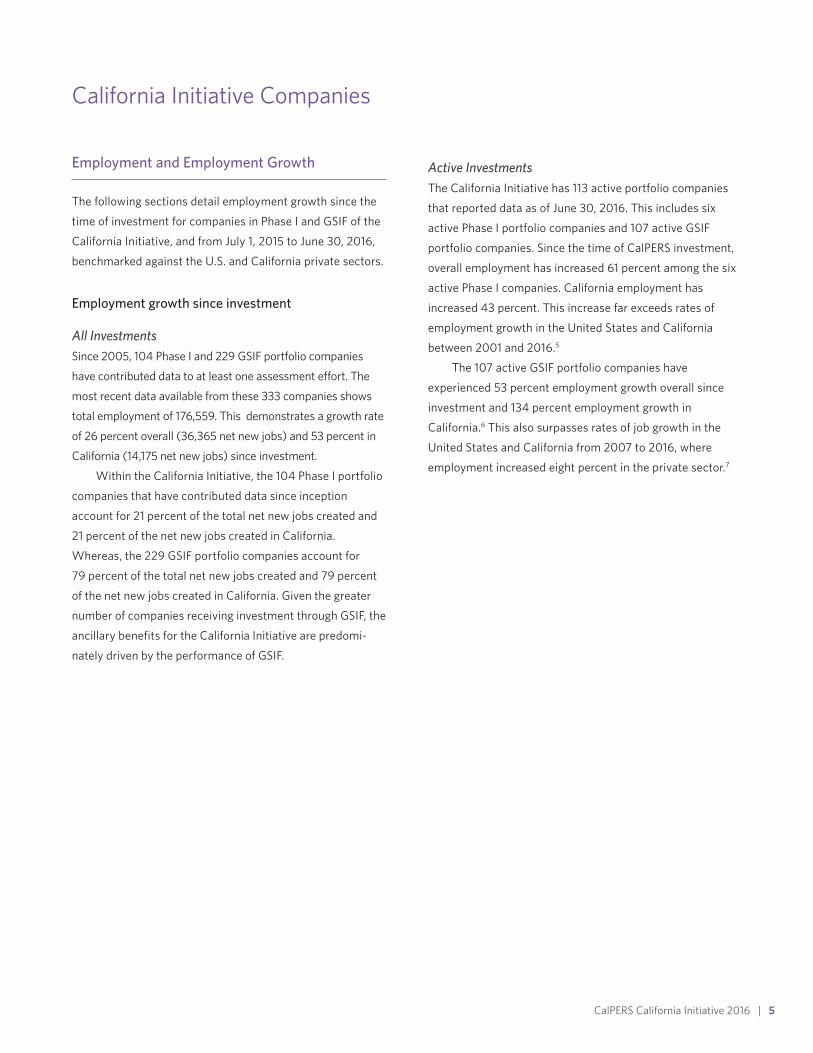
All InvestmentsSince 2005, 104 Phase I and 229 GSIF portfolio companies
have contributed data to at least one assessment effort. The
most recent data available from these 333 companies shows
total employment of 176,559. This demonstrates a growth rate
of 26 percent overall (36,365 net new jobs) and 53 percent in
California (14,175 net new jobs) since investment.
Within the California Initiative, the 104 Phase I portfolio
companies that have contributed data since inception
account for 21 percent of the total net new jobs created and
21 percent of the net new jobs created in California.
Whereas, the 229 GSIF portfolio companies account for
79 percent of the total net new jobs created and 79 percent
of the net new jobs created in California. Given the greater
number of companies receiving investment through GSIF, the
ancillary benefits for the California Initiative are predomi-
nately driven by the performance of GSIF.
Active InvestmentsThe California Initiative has 113 active portfolio companies
that reported data as of June 30, 2016. This includes six
active Phase I portfolio companies and 107 active GSIF
portfolio companies. Since the time of CalPERS investment,
overall employment has increased 61 percent among the six
active Phase I companies. California employment has
increased 43 percent. This increase far exceeds rates of
employment growth in the United States and California
between 2001 and 2016.5
The 107 active GSIF portfolio companies have
experienced 53 percent employment growth overall since
investment and 134 percent employment growth in
California.6 This also surpasses rates of job growth in the
United States and California from 2007 to 2016, where
employment increased eight percent in the private sector.7

6 | CalPERS California Initiative 2016
California Initiative Portfolio Companies, Employees
All Employees CA Employees
At InvestmentAt
June 30, 2016
Net Job Growth Since
Investment (new jobs/ % growth) At Investment
AtJune 30, 2016
Net Job Growth Since
Investment (new jobs/% growth)
Phase I – Active portfolio companies reporting as of June 30, 2016 (n=6)
6,303 10,174 3,871 / 61% 510 727 217 / 43%
Phase I – All companies reporting, including fully realized investments (n=104)8
59,984 67,487 7,539 / 13% 6,020 8,974 2,954 / 49%
GSIF – Active portfolio companies reporting as of June 30, 2016 (n=107)
36,143 55,207 19,064 / 53% 7,734 18,133 10,399 / 134%
GSIF – All companies reporting, including fully realized investments (n=229)9
80,246 109,072 28,826 / 36% 20,752 31,973 11,221 / 54%
Total CA Initiative – Active portfolio companies reporting as of June 30, 2016 (n=113)
42,446 65,381 22,935 / 54% 8,244 18,860 10,616 / 129%
Total CA Initiative – All companies ever reporting, including fully realized investments (n=333)10
140,194 176,559 36,365 / 26% 40,947 40,947 14,175 / 53%
As a point of reference: Between June 2007 and June 2016, U.S. employment increased five percent and CA employment increased eight percent. Between June 2001 and June 2015, U.S. employment increased ten percent and CA employment increased fifteen percent.11

CalPERS California Initiative 2016 | 7
0%
10%
20%
30%
40%
50%
60%
70%
80%
28,826
California Initiative Jobs Created Since Investment All Companies Including Fully Realized Investments
36,365Total Jobs Created
14,175Total CA Jobs Created
Phase I GSIF
0%
10%
20%
30%
40%
50%
13%
36%
54%
49%
5%8%
California Initiative Job Growth Since Investment All Companies Including Fully Realized Investments
Employee Growth CA Employee Growth U.S. and CA Employee Growth
Phase I GSIF U.S. (2007–2016) CA (2007–2016)
0%
20%
40%
60%
80%
100%
50%58%
8%
73%
California Initiative “California Companies”
California Initiative dollars invested in “CA Companies”
Number of Active “CA Companies” in California Initiative Portfolio
Phase I (active companies n=6) GSIF (active companies n=107)
0%
10%
20%
30%
40%
50% 46%
25% 26%30%
California Initiative Investments in Female and Minority Companies
Percentage of Dollars Invested in Companieswith at Least One Minority O�cer
Percentage of Dollars Invested in Companies with at Least One Female O�cer
Phase I GSIF
0%
10%
20%
30%
40%
50%
7%
13%
22% 21%
0%
6%
Percentage of Dollars Invested in Active California Initiative Companies Located in Areas that have Historically
had Limited Access to Institutional Equity Capital
Dollars invested in limited access areas in CA
Dollars invested in limited access areas in the U.S.
Phase I dollars invested in active companies
All private equity dollars invested
GSIF dollars invested in active companies
0%
10%
20%
30%
40%
50%
11%
46%
22%20%
32%
21%
Women Entrepreneurs
WomenO�cers
WomenManagers
U.S. and CA Women Business Owners
Phase I CAU.S.GSIF
0% 5% 10% 15% 20% 25% 30% 35% 40% 45% 50%
Real Estate
Materials
Information Technology
Industrials
Health Care
Financials
Energy
Consumer Staples
Consumer Discretionary
Portfolio Diversification by Industry
Phase I (active companies, n=6) GSIF (active companies, n=107)
0% 30%10% 20% 40% 50% 60%
1-10 employees
11-50 employees
51-100 employees
101-500 employees
501-1000 employees
1001-5000 employees
>5000 employees 17%
7%
7%
17%14%
50%25%
8%
17%36%
0%
0%
0%
2%
California Initiative Active Portfolio Companies by Employee Size
Phase I (active companies, n=6) GSIF (active companies, n=107)
0%
10%
20%
30%
40%
50%
14%
43%
16%18%20%
33%
Minority Entrepreneurs
MinorityO�cers
MinorityManagers
U.S. and CA Minority Business Owners
(n=229)(n=104)
Phase I GSIF U.S. CA(n=107)(n=6)
90%
100%
11,221
7,539
2,954
50%
31%
15%
18%
9%
8%
8%
17%
5%
17%
60%
17%6%
(n=107)(n=6)
(n=229)(n=104)
-6%
-10%
-5%
0%
5%
10%
3%
8%
2%
-10%
3%
California Initiative Annual Job Growth June 30, 2015 to June 30, 2016 — Active Reporting Companies
Employee Growth CA Employee GrowthU.S. and
CA Employee Growth
Phase I GSIF U.S. (2014–2016) CA (2014–2016)
0%
10%
20%
30%
40%
50%
60%
70%
80%
28,826
California Initiative Jobs Created Since Investment All Companies Including Fully Realized Investments
36,365Total Jobs Created
14,175Total CA Jobs Created
Phase I GSIF
0%
10%
20%
30%
40%
50%
13%
36%
54%
49%
5%8%
California Initiative Job Growth Since Investment All Companies Including Fully Realized Investments
Employee Growth CA Employee Growth U.S. and CA Employee Growth
Phase I GSIF U.S. (2007–2016) CA (2007–2016)
0%
20%
40%
60%
80%
100%
50%58%
8%
73%
California Initiative “California Companies”
California Initiative dollars invested in “CA Companies”
Number of Active “CA Companies” in California Initiative Portfolio
Phase I (active companies n=6) GSIF (active companies n=107)
0%
10%
20%
30%
40%
50% 46%
25% 26%30%
California Initiative Investments in Female and Minority Companies
Percentage of Dollars Invested in Companieswith at Least One Minority O�cer
Percentage of Dollars Invested in Companies with at Least One Female O�cer
Phase I GSIF
0%
10%
20%
30%
40%
50%
7%
13%
22% 21%
0%
6%
Percentage of Dollars Invested in Active California Initiative Companies Located in Areas that have Historically
had Limited Access to Institutional Equity Capital
Dollars invested in limited access areas in CA
Dollars invested in limited access areas in the U.S.
Phase I dollars invested in active companies
All private equity dollars invested
GSIF dollars invested in active companies
0%
10%
20%
30%
40%
50%
11%
46%
22%20%
32%
21%
Women Entrepreneurs
WomenO�cers
WomenManagers
U.S. and CA Women Business Owners
Phase I CAU.S.GSIF
0% 5% 10% 15% 20% 25% 30% 35% 40% 45% 50%
Real Estate
Materials
Information Technology
Industrials
Health Care
Financials
Energy
Consumer Staples
Consumer Discretionary
Portfolio Diversification by Industry
Phase I (active companies, n=6) GSIF (active companies, n=107)
0% 30%10% 20% 40% 50% 60%
1-10 employees
11-50 employees
51-100 employees
101-500 employees
501-1000 employees
1001-5000 employees
>5000 employees 17%
7%
7%
17%14%
50%25%
8%
17%36%
0%
0%
0%
2%
California Initiative Active Portfolio Companies by Employee Size
Phase I (active companies, n=6) GSIF (active companies, n=107)
0%
10%
20%
30%
40%
50%
14%
43%
16%18%20%
33%
Minority Entrepreneurs
MinorityO�cers
MinorityManagers
U.S. and CA Minority Business Owners
(n=229)(n=104)
Phase I GSIF U.S. CA(n=107)(n=6)
90%
100%
11,221
7,539
2,954
50%
31%
15%
18%
9%
8%
8%
17%
5%
17%
60%
17%6%
(n=107)(n=6)
(n=229)(n=104)
-6%
-10%
-5%
0%
5%
10%
3%
8%
2%
-10%
3%
California Initiative Annual Job Growth June 30, 2015 to June 30, 2016 — Active Reporting Companies
Employee Growth CA Employee GrowthU.S. and
CA Employee Growth
Phase I GSIF U.S. (2014–2016) CA (2014–2016)
Annual employment growthDriven by GSIF, California Initiative companies reporting
data to PCV in both 2015 and 2016 (n=105) created jobs at
a higher rate than the U.S. and California economies as a
whole. For the remaining Phase I companies (n=6), total
employment decreased 6 percent and California employ-
ment decreased 10 percent. However, GSIF companies that
reported data in both 2015 and 2016 (n=99) increased total
employment by 3 percent and California employment by
8 percent. By comparison, employment in the United States
and California increased 2 percent and 3 percent respec-
tively in the 12 months to June 30, 2016.12
0%
10%
20%
30%
40%
50%
60%
70%
80%
28,826
California Initiative Jobs Created Since Investment All Companies Including Fully Realized Investments
36,365Total Jobs Created
14,175Total CA Jobs Created
Phase I GSIF
0%
10%
20%
30%
40%
50%
13%
36%
54%
49%
5%8%
California Initiative Job Growth Since Investment All Companies Including Fully Realized Investments
Employee Growth CA Employee Growth U.S. and CA Employee Growth
Phase I GSIF U.S. (2007–2016) CA (2007–2016)
0%
20%
40%
60%
80%
100%
50%58%
8%
73%
California Initiative “California Companies”
California Initiative dollars invested in “CA Companies”
Number of Active “CA Companies” in California Initiative Portfolio
Phase I (active companies n=6) GSIF (active companies n=107)
0%
10%
20%
30%
40%
50% 46%
25% 26%30%
California Initiative Investments in Female and Minority Companies
Percentage of Dollars Invested in Companieswith at Least One Minority O�cer
Percentage of Dollars Invested in Companies with at Least One Female O�cer
Phase I GSIF
0%
10%
20%
30%
40%
50%
7%
13%
22% 21%
0%
6%
Percentage of Dollars Invested in Active California Initiative Companies Located in Areas that have Historically
had Limited Access to Institutional Equity Capital
Dollars invested in limited access areas in CA
Dollars invested in limited access areas in the U.S.
Phase I dollars invested in active companies
All private equity dollars invested
GSIF dollars invested in active companies
0%
10%
20%
30%
40%
50%
11%
46%
22%20%
32%
21%
Women Entrepreneurs
WomenO�cers
WomenManagers
U.S. and CA Women Business Owners
Phase I CAU.S.GSIF
0% 5% 10% 15% 20% 25% 30% 35% 40% 45% 50%
Real Estate
Materials
Information Technology
Industrials
Health Care
Financials
Energy
Consumer Staples
Consumer Discretionary
Portfolio Diversification by Industry
Phase I (active companies, n=6) GSIF (active companies, n=107)
0% 30%10% 20% 40% 50% 60%
1-10 employees
11-50 employees
51-100 employees
101-500 employees
501-1000 employees
1001-5000 employees
>5000 employees 17%
7%
7%
17%14%
50%25%
8%
17%36%
0%
0%
0%
2%
California Initiative Active Portfolio Companies by Employee Size
Phase I (active companies, n=6) GSIF (active companies, n=107)
0%
10%
20%
30%
40%
50%
14%
43%
16%18%20%
33%
Minority Entrepreneurs
MinorityO�cers
MinorityManagers
U.S. and CA Minority Business Owners
(n=229)(n=104)
Phase I GSIF U.S. CA(n=107)(n=6)
90%
100%
11,221
7,539
2,954
50%
31%
15%
18%
9%
8%
8%
17%
5%
17%
60%
17%6%
(n=107)(n=6)
(n=229)(n=104)
-6%
-10%
-5%
0%
5%
10%
3%
8%
2%
-10%
3%
California Initiative Annual Job Growth June 30, 2015 to June 30, 2016 — Active Reporting Companies
Employee Growth CA Employee GrowthU.S. and
CA Employee Growth
Phase I GSIF U.S. (2014–2016) CA (2014–2016)

8 | CalPERS California Initiative 2016
Job Preservation and Growth – California Initiative Employment Growth versus U.S. and California Employment Growth
Overall, California Initiative employment growth exceeded
employment growth in the United States and California
with most California Initiative companies preserving and
creating jobs despite a sluggish, recovering economy.
Eighty-six California Initiative portfolio companies partici-
pated in four consecutive years of data collection from
2013 to 2016.13 In 2013, these 86 companies had a total of
43,101 employees, including 8,892 in California. In 2016,
they had 51,564 employees, including 14,182 in California,
representing 20 percent job growth overall and 59 percent
job growth in California.
43,101
47,225
44,08445,094
45,960
50,613
51,564
California Initiative: Impact on Job Growth, All Employees86 Reporting Companies
2013 2014 2015 2016
Actual number of workers employed by CA Initiative companies
Estimated number of employees had job growth equaled U.S. trend
5,604 Jobs
42,000
47,000
52,000
California Initiative: Impact on Job Growth, CA Employees86 Reporting Companies
Actual number of workers employed by CA Initiative companies
Estimated number of employees had job growth equaled CA trend
10,842
13,236
14,182
9,433 9,712
4,470 Jobs
2013 2014 2015 2016
8,892
9,1958,000
10,000
12,000
14,000
The following charts show:• Actual job growth for these 86 companies from 2013 to
2016, from 43,101 to 51,564 employees nationwide, and
from 8,892 to 14,182 employees in California.• Hypothetical employee numbers at these 86 compa-
nies, had job growth been equivalent to the annual
workforce trends in the overall United States and
California private sectors.• The number of jobs that would have been lost or would
not have existed, 5,604 nationwide and 4,470 in
California, had these companies hypothetically experi-
enced the annual job growth rates of the overall U.S.
and California private sectors.

CalPERS California Initiative 2016 | 9
Company Locations
The 113 active California Initiative portfolio companies that
contributed data in 2016 operate 1,605 total locations, including
both headquarters (107) and facilities (1,492); 57 percent
of these companies are headquartered in California, as are
22 percent of facility locations (excluding headquarters).
California Initiative Active Portfolio Companies, Operating Locations
Headquarters Facilities Total
Total California Initiative 113 1,492 1,605
Total California Initiative in California 64 (57%) 335 (22%) 399 (25%)
Phase I 6 182 188
Phase I in California 2 (33%) 16 (9%) 18 (10%)
GSIF 107 1310 1,417
GSIF in California 62 (58%) 319 (24%) 381 (27%)

10 | CalPERS California Initiative 2016
California Initiative Portfolio Company Locations

CalPERS California Initiative 2016 | 11
0%
10%
20%
30%
40%
50%
60%
70%
80%
28,826
California Initiative Jobs Created Since Investment All Companies Including Fully Realized Investments
36,365Total Jobs Created
14,175Total CA Jobs Created
Phase I GSIF
0%
10%
20%
30%
40%
50%
13%
36%
54%
49%
5%8%
California Initiative Job Growth Since Investment All Companies Including Fully Realized Investments
Employee Growth CA Employee Growth U.S. and CA Employee Growth
Phase I GSIF U.S. (2007–2016) CA (2007–2016)
0%
20%
40%
60%
80%
100%
50%58%
8%
73%
California Initiative “California Companies”
California Initiative dollars invested in “CA Companies”
Number of Active “CA Companies” in California Initiative Portfolio
Phase I (active companies n=6) GSIF (active companies n=107)
0%
10%
20%
30%
40%
50% 46%
25% 26%30%
California Initiative Investments in Female and Minority Companies
Percentage of Dollars Invested in Companieswith at Least One Minority O�cer
Percentage of Dollars Invested in Companies with at Least One Female O�cer
Phase I GSIF
0%
10%
20%
30%
40%
50%
7%
13%
22% 21%
0%
6%
Percentage of Dollars Invested in Active California Initiative Companies Located in Areas that have Historically
had Limited Access to Institutional Equity Capital
Dollars invested in limited access areas in CA
Dollars invested in limited access areas in the U.S.
Phase I dollars invested in active companies
All private equity dollars invested
GSIF dollars invested in active companies
0%
10%
20%
30%
40%
50%
11%
46%
22%20%
32%
21%
Women Entrepreneurs
WomenO�cers
WomenManagers
U.S. and CA Women Business Owners
Phase I CAU.S.GSIF
0% 5% 10% 15% 20% 25% 30% 35% 40% 45% 50%
Real Estate
Materials
Information Technology
Industrials
Health Care
Financials
Energy
Consumer Staples
Consumer Discretionary
Portfolio Diversification by Industry
Phase I (active companies, n=6) GSIF (active companies, n=107)
0% 30%10% 20% 40% 50% 60%
1-10 employees
11-50 employees
51-100 employees
101-500 employees
501-1000 employees
1001-5000 employees
>5000 employees 17%
7%
7%
17%14%
50%25%
8%
17%36%
0%
0%
0%
2%
California Initiative Active Portfolio Companies by Employee Size
Phase I (active companies, n=6) GSIF (active companies, n=107)
0%
10%
20%
30%
40%
50%
14%
43%
16%18%20%
33%
Minority Entrepreneurs
MinorityO�cers
MinorityManagers
U.S. and CA Minority Business Owners
(n=229)(n=104)
Phase I GSIF U.S. CA(n=107)(n=6)
90%
100%
11,221
7,539
2,954
50%
31%
15%
18%
9%
8%
8%
17%
5%
17%
60%
17%6%
(n=107)(n=6)
(n=229)(n=104)
-6%
-10%
-5%
0%
5%
10%
3%
8%
2%
-10%
3%
California Initiative Annual Job Growth June 30, 2015 to June 30, 2016 — Active Reporting Companies
Employee Growth CA Employee GrowthU.S. and
CA Employee Growth
Phase I GSIF U.S. (2014–2016) CA (2014–2016)
0%
10%
20%
30%
40%
50%
60%
70%
80%
28,826
California Initiative Jobs Created Since Investment All Companies Including Fully Realized Investments
36,365Total Jobs Created
14,175Total CA Jobs Created
Phase I GSIF
0%
10%
20%
30%
40%
50%
13%
36%
54%
49%
5%8%
California Initiative Job Growth Since Investment All Companies Including Fully Realized Investments
Employee Growth CA Employee Growth U.S. and CA Employee Growth
Phase I GSIF U.S. (2007–2016) CA (2007–2016)
0%
20%
40%
60%
80%
100%
50%58%
8%
73%
California Initiative “California Companies”
California Initiative dollars invested in “CA Companies”
Number of Active “CA Companies” in California Initiative Portfolio
Phase I (active companies n=6) GSIF (active companies n=107)
0%
10%
20%
30%
40%
50% 46%
25% 26%30%
California Initiative Investments in Female and Minority Companies
Percentage of Dollars Invested in Companieswith at Least One Minority O�cer
Percentage of Dollars Invested in Companies with at Least One Female O�cer
Phase I GSIF
0%
10%
20%
30%
40%
50%
7%
13%
22% 21%
0%
6%
Percentage of Dollars Invested in Active California Initiative Companies Located in Areas that have Historically
had Limited Access to Institutional Equity Capital
Dollars invested in limited access areas in CA
Dollars invested in limited access areas in the U.S.
Phase I dollars invested in active companies
All private equity dollars invested
GSIF dollars invested in active companies
0%
10%
20%
30%
40%
50%
11%
46%
22%20%
32%
21%
Women Entrepreneurs
WomenO�cers
WomenManagers
U.S. and CA Women Business Owners
Phase I CAU.S.GSIF
0% 5% 10% 15% 20% 25% 30% 35% 40% 45% 50%
Real Estate
Materials
Information Technology
Industrials
Health Care
Financials
Energy
Consumer Staples
Consumer Discretionary
Portfolio Diversification by Industry
Phase I (active companies, n=6) GSIF (active companies, n=107)
0% 30%10% 20% 40% 50% 60%
1-10 employees
11-50 employees
51-100 employees
101-500 employees
501-1000 employees
1001-5000 employees
>5000 employees 17%
7%
7%
17%14%
50%25%
8%
17%36%
0%
0%
0%
2%
California Initiative Active Portfolio Companies by Employee Size
Phase I (active companies, n=6) GSIF (active companies, n=107)
0%
10%
20%
30%
40%
50%
14%
43%
16%18%20%
33%
Minority Entrepreneurs
MinorityO�cers
MinorityManagers
U.S. and CA Minority Business Owners
(n=229)(n=104)
Phase I GSIF U.S. CA(n=107)(n=6)
90%
100%
11,221
7,539
2,954
50%
31%
15%
18%
9%
8%
8%
17%
5%
17%
60%
17%6%
(n=107)(n=6)
(n=229)(n=104)
-6%
-10%
-5%
0%
5%
10%
3%
8%
2%
-10%
3%
California Initiative Annual Job Growth June 30, 2015 to June 30, 2016 — Active Reporting Companies
Employee Growth CA Employee GrowthU.S. and
CA Employee Growth
Phase I GSIF U.S. (2014–2016) CA (2014–2016)
Portfolio Diversification
California Initiative portfolio companies operate across
a variety of industries.¹⁴
Portfolio companies range in size from fewer than 10
to more than 15,000 employees. The majority of
portfolio companies (54 percent) employ between
11 and 150 workers.

12 | CalPERS California Initiative 2016
Job Quality
At both Phase I and GSIF portfolio companies reporting data
as of June 30, 2016, the “quality” of jobs, defined as the
provision of medical coverage, retirement plans, and paid
sick and vacation leave, compares favorably with job quality
at companies in California and the United States.
Job quality at Phase I portfolio companiesA higher percentage of Phase I companies offer employees
benefits than comparable companies in the United States
and California. All Phase I companies provide medical
insurance to at least some of their employees compared
with 57 percent of U.S. companies15 and 58 percent of
California companies.16 Ninety-three percent of Phase I
companies offer medical insurance to between 76 percent
and 100 percent of their employees, as compared to
68 percent of U.S.17 and 76 percent of California employees
that are eligible for employer-based medical insurance.18
Phase I companies compare favorably to U.S companies
as a whole in the provision of retirement benefits, sick leave,
and paid vacation. Phase I companies report job quality data
by the percentage range of employees eligible to receive a
particular benefit, as demonstrated in the table below.
Phase I Portfolio Companies, Employee Benefits
Benefits provided
to zero employees
Benefits provided to 1-25% of employees
Benefits provided to 26-50% of employees
Benefits provided to
51-75% of employees
Benefits provided to
76%-100% of employees
Total percentage of
companies offering
benefits to at least some employees
Medical Insurance 0% 0% 0% 0% 100% 100%
Retirement Plan 0% 0% 0% 0% 100% 100%
Paid Sick Leave 0% 0% 0% 0% 100% 100%
Paid Vacation 0% 0% 0% 0% 100% 100%
Company Stock 83% 0% 0% 0% 17% 17%

CalPERS California Initiative 2016 | 13
Job quality at GSIF portfolio companiesGSIF portfolio companies report the absolute number of
employees eligible for and enrolled in each benefit. The GSIF
approach allows for more precise measurement of benefits
and better comparisons to state and national data. This
provides a clearer picture of job quality for portfolio company
employees. To accurately represent job quality for lower
income workers, many of whom are employed in hourly wage
jobs, GSIF portfolio companies report data for salaried and
non-salaried employees separately. Benefit eligibility rates of
these portfolio companies compare favorably to the rates in
both the United States and California.
Job quality changes since investmentAs part of measuring job quality at GSIF portfolio companies,
changes to employee benefit packages are tracked. Of the
229 GSIF portfolio companies that have ever reported data,
including fully realized investments, 130 (57 percent) have
made changes to their benefits packages since the time of
investment. A majority of companies have increased benefits
packages offered to employees with 81 (62 percent) of the
130 companies reporting improvements to employee benefits
packages. Only 15 companies (12 percent) have reported
decreased benefits. Another 34 (26 percent) of the 130
companies indicated changes in benefit providers or benefits
package with an indeterminate impact on employee benefits
since investment.
GSIF Portfolio Companies, Employee Benefits
GSIF Salaried GSIF Non-salaried
U.S. — All Employees19
CA — All Employees20
Medical coverage
Establishments offering 93% 63% 57% 58%
Employees eligible for 83% 84% 68% 76%
Employees enrolled in 72% 68% 54% 64%
Retirement benefits
Establishments offering 79% 56% 47% n/a
Employees eligible for 82% 80% 66% n/a
Employees enrolled in 57% 31% 49% n/a
Other benefits
Employees eligible for disability benefits 80% 76% 40% n/a
Employees eligible for paid vacation time 82% 80% 76% n/a
Employees eligible for paid sick leave 68% 77% 64% n/a
14 | CalPERS California Initiative 2016
Suppliers
As of June 30, 2016, California Initiative Phase I and GSIF
companies had active supplier relationships with more than
69,000 vendors.21 In addition to the boost to the economy
provided directly by California Initiative portfolio companies,
11,965 other California businesses (17 percent of all Phase I
and GSIF suppliers) have indirectly benefited from this
capital investment.
Patents
The number of patents granted is an indicator of innovation,
which often precedes job growth at a company. GSIF
portfolio companies report the number of patents granted to
them annually. Twelve portfolio companies were granted 45
new patents between July 1, 2015, and June 30, 2016.
California Focus
To gain a more complete understanding of the impact
California Initiative investments have in California, GSIF
portfolio companies provide additional data on the
approximate annual revenues they generate in California, in
the rest of the United States, and outside the United States.
This includes any plans to increase business activities in
California in the next year.
Twenty-one percent of active GSIF companies reported
plans for expansion in California in the coming year. Of the
companies that have expansion plans, 32 percent reported
plans to open new operating locations in California.
32 percent reported plans to increase employment in
California. 50 percent reported operating plans that are
expected to result in increased sales in California.
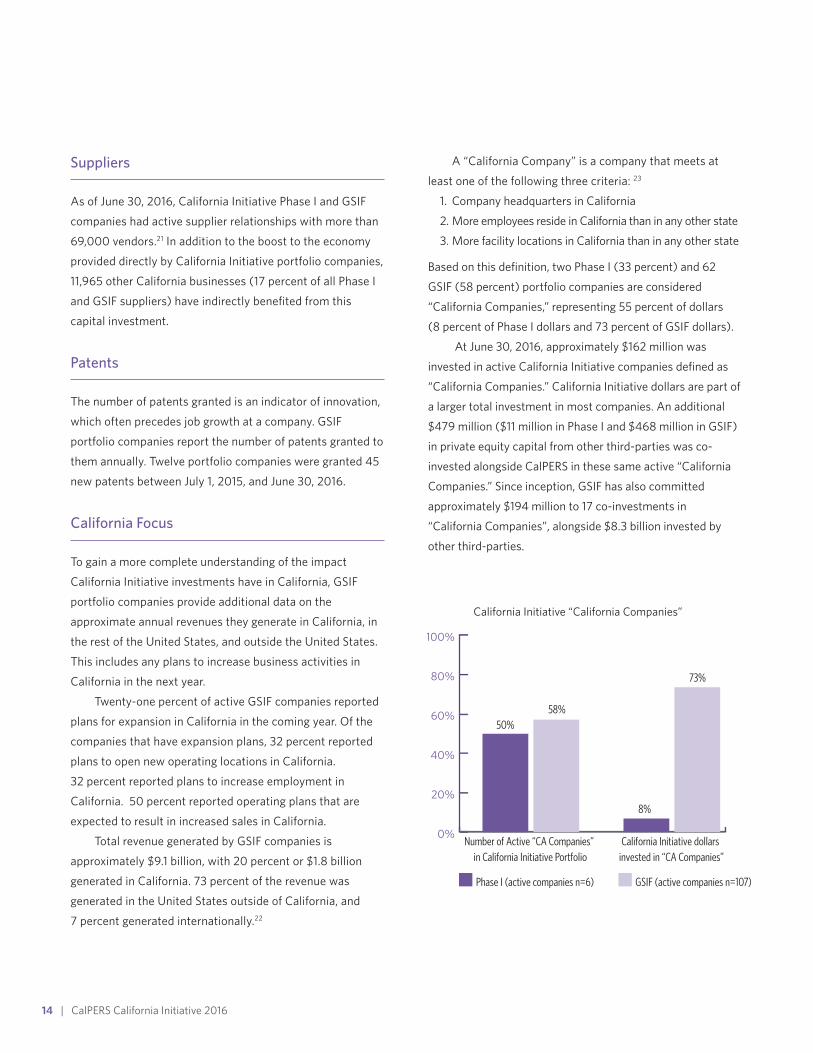
Total revenue generated by GSIF companies is
approximately $9.1 billion, with 20 percent or $1.8 billion
generated in California. 73 percent of the revenue was
generated in the United States outside of California, and
7 percent generated internationally.22
A “California Company” is a company that meets at
least one of the following three criteria: 23
1. Company headquarters in California
2. More employees reside in California than in any other state
3. More facility locations in California than in any other state
Based on this definition, two Phase I (33 percent) and 62
GSIF (58 percent) portfolio companies are considered
“California Companies,” representing 55 percent of dollars
(8 percent of Phase I dollars and 73 percent of GSIF dollars).
At June 30, 2016, approximately $162 million was
invested in active California Initiative companies defined as
“California Companies.” California Initiative dollars are part of
a larger total investment in most companies. An additional
$479 million ($11 million in Phase I and $468 million in GSIF)
in private equity capital from other third-parties was co-
invested alongside CalPERS in these same active “California
Companies.” Since inception, GSIF has also committed
approximately $194 million to 17 co-investments in
“California Companies”, alongside $8.3 billion invested by
other third-parties.
0%
10%
20%
30%
40%
50%
60%
70%
80%
28,826
California Initiative Jobs Created Since Investment All Companies Including Fully Realized Investments
36,365Total Jobs Created
14,175Total CA Jobs Created
Phase I GSIF
0%
10%
20%
30%
40%
50%
13%
36%
54%
49%
5%8%
California Initiative Job Growth Since Investment All Companies Including Fully Realized Investments
Employee Growth CA Employee Growth U.S. and CA Employee Growth
Phase I GSIF U.S. (2007–2016) CA (2007–2016)
0%
20%
40%
60%
80%
100%
50%58%
8%
73%
California Initiative “California Companies”
California Initiative dollars invested in “CA Companies”
Number of Active “CA Companies” in California Initiative Portfolio
Phase I (active companies n=6) GSIF (active companies n=107)
0%
10%
20%
30%
40%
50% 46%
25% 26%30%
California Initiative Investments in Female and Minority Companies
Percentage of Dollars Invested in Companieswith at Least One Minority O�cer
Percentage of Dollars Invested in Companies with at Least One Female O�cer
Phase I GSIF
0%
10%
20%
30%
40%
50%
7%
13%
22% 21%
0%
6%
Percentage of Dollars Invested in Active California Initiative Companies Located in Areas that have Historically
had Limited Access to Institutional Equity Capital
Dollars invested in limited access areas in CA
Dollars invested in limited access areas in the U.S.
Phase I dollars invested in active companies
All private equity dollars invested
GSIF dollars invested in active companies
0%
10%
20%
30%
40%
50%
11%
46%
22%20%
32%
21%
Women Entrepreneurs
WomenO�cers
WomenManagers
U.S. and CA Women Business Owners
Phase I CAU.S.GSIF
0% 5% 10% 15% 20% 25% 30% 35% 40% 45% 50%
Real Estate
Materials
Information Technology
Industrials
Health Care
Financials
Energy
Consumer Staples
Consumer Discretionary
Portfolio Diversification by Industry
Phase I (active companies, n=6) GSIF (active companies, n=107)
0% 30%10% 20% 40% 50% 60%
1-10 employees
11-50 employees
51-100 employees
101-500 employees
501-1000 employees
1001-5000 employees
>5000 employees 17%
7%
7%
17%14%
50%25%
8%
17%36%
0%
0%
0%
2%
California Initiative Active Portfolio Companies by Employee Size
Phase I (active companies, n=6) GSIF (active companies, n=107)
0%
10%
20%
30%
40%
50%
14%
43%
16%18%20%
33%
Minority Entrepreneurs
MinorityO�cers
MinorityManagers
U.S. and CA Minority Business Owners
(n=229)(n=104)
Phase I GSIF U.S. CA(n=107)(n=6)
90%
100%
11,221
7,539
2,954
50%
31%
15%
18%
9%
8%
8%
17%
5%
17%
60%
17%6%
(n=107)(n=6)
(n=229)(n=104)
-6%
-10%
-5%
0%
5%
10%
3%
8%
2%
-10%
3%
California Initiative Annual Job Growth June 30, 2015 to June 30, 2016 — Active Reporting Companies
Employee Growth CA Employee GrowthU.S. and
CA Employee Growth
Phase I GSIF U.S. (2014–2016) CA (2014–2016)

CalPERS California Initiative 2016 | 15
CalPERS California Initiative – Investing in Underserved MarketsPortfolio Companies That Have Historically Had Limited Access to Equity Capital
To define areas that have historically had limited access
to institutional equity capital, PCV analyzed data from
Thomson Reuters that tracked private equity transactions
from 2002 through 2011. This data shows that approximately
73 percent of private equity investment dollars were
concentrated in 1,000 postal codes worldwide.24 Most of
these 1,000 postal codes (634 or 2 percent of all U.S. ZIP
codes) are in the United States. More than 85 percent of all
private equity in the United States and nearly 95 percent of all
private equity in California has been invested to these 634
ZIP codes. For the purposes of this analysis, any company
outside of these 634 United States ZIP codes is considered to
be in an area that has historically had limited access to
institutional equity capital.
Across the U.S., just 13 percent of all private equity
investment dollars are deployed in areas that have
historically had limited access to institutional equity capital.
By contrast, 17 percent of all California Initiative investment
dollars deployed in the United States, including 22 percent
of GSIF investment dollars, have been invested in areas that
have historically had limited access to institutional equity
capital. This indicates that the initiative’s efforts to direct
capital to underserved markets has worked.
For private equity investment in California, 6 percent
of investment dollars are deployed in areas that have
historically had limited access to institutional equity capital.
Twenty percent of all California Initiative dollars deployed in
California are invested in areas of the state that have
historically had limited access to institutional equity capital.
0%
10%
20%
30%
40%
50%
60%
70%
80%
28,826
California Initiative Jobs Created Since Investment All Companies Including Fully Realized Investments
36,365Total Jobs Created
14,175Total CA Jobs Created
Phase I GSIF
0%
10%
20%
30%
40%
50%
13%
36%
54%
49%
5%8%
California Initiative Job Growth Since Investment All Companies Including Fully Realized Investments
Employee Growth CA Employee Growth U.S. and CA Employee Growth
Phase I GSIF U.S. (2007–2016) CA (2007–2016)
0%
20%
40%
60%
80%
100%
50%58%
8%
73%
California Initiative “California Companies”
California Initiative dollars invested in “CA Companies”
Number of Active “CA Companies” in California Initiative Portfolio
Phase I (active companies n=6) GSIF (active companies n=107)
0%
10%
20%
30%
40%
50% 46%
25% 26%30%
California Initiative Investments in Female and Minority Companies
Percentage of Dollars Invested in Companieswith at Least One Minority O�cer
Percentage of Dollars Invested in Companies with at Least One Female O�cer
Phase I GSIF
0%
10%
20%
30%
40%
50%
7%
13%
22% 21%
0%
6%
Percentage of Dollars Invested in Active California Initiative Companies Located in Areas that have Historically
had Limited Access to Institutional Equity Capital
Dollars invested in limited access areas in CA
Dollars invested in limited access areas in the U.S.
Phase I dollars invested in active companies
All private equity dollars invested
GSIF dollars invested in active companies
0%
10%
20%
30%
40%
50%
11%
46%
22%20%
32%
21%
Women Entrepreneurs
WomenO�cers
WomenManagers
U.S. and CA Women Business Owners
Phase I CAU.S.GSIF
0% 5% 10% 15% 20% 25% 30% 35% 40% 45% 50%
Real Estate
Materials
Information Technology
Industrials
Health Care
Financials
Energy
Consumer Staples
Consumer Discretionary
Portfolio Diversification by Industry
Phase I (active companies, n=6) GSIF (active companies, n=107)
0% 30%10% 20% 40% 50% 60%
1-10 employees
11-50 employees
51-100 employees
101-500 employees
501-1000 employees
1001-5000 employees
>5000 employees 17%
7%
7%
17%14%
50%25%
8%
17%36%
0%
0%
0%
2%
California Initiative Active Portfolio Companies by Employee Size
Phase I (active companies, n=6) GSIF (active companies, n=107)
0%
10%
20%
30%
40%
50%
14%
43%
16%18%20%
33%
Minority Entrepreneurs
MinorityO�cers
MinorityManagers
U.S. and CA Minority Business Owners
(n=229)(n=104)
Phase I GSIF U.S. CA(n=107)(n=6)
90%
100%
11,221
7,539
2,954
50%
31%
15%
18%
9%
8%
8%
17%
5%
17%
60%
17%6%
(n=107)(n=6)
(n=229)(n=104)
-6%
-10%
-5%
0%
5%
10%
3%
8%
2%
-10%
3%
California Initiative Annual Job Growth June 30, 2015 to June 30, 2016 — Active Reporting Companies
Employee Growth CA Employee GrowthU.S. and
CA Employee Growth
Phase I GSIF U.S. (2014–2016) CA (2014–2016)

16 | CalPERS California Initiative 2016
Portfolio Companies That Employ Workers Living In Economically Disadvantaged Areas
California Initiative portfolio companies benefit low- to
moderate-income (LMI) workers in a number of ways. First,
these companies provide quality jobs to residents of LMI
areas, generating wealth in places that need it most. Second,
companies that are headquartered or operate facilities in
LMI areas bring economic activity to distressed neighbor-
hoods, indirectly supporting the creation of more jobs.
To assess the extent to which California Initiative
companies support employment for residents of LMI areas,
locations where companies operate as well as where
company employees live have been examined.25
Phase I portfolio companies report the ZIP codes of
operating locations in California. GSIF portfolio companies
report the ZIP codes of all operating locations, not just those
in California. In the Phase I portfolio, 45 percent of company
headquarters and operating facilities are located in predomi-
nantly LMI areas.26 GSIF portfolio companies have a total of
1,417 operating locations, including both facilities and
headquarters; approximately 44 percent are in predomi-
nantly LMI areas.
Seventy-five percent of Phase I and 52 percent of GSIF
portfolio company employees in California live in predomi-
nantly low-income areas.²⁷
Employees Living, and Companies Located, in Low- and Moderate-Income Geographies
Located in a ZIP Code that is Predomi-nantly Comprised of LMI Census Tracts
Phase I
Headquarters (n=6) 0 (0%)
California Headquarters 0 (0%)
California Facilities 9 (64%)
California Employees 581 (75%)
GSIF
Headquarters (n=107) 34 (33%)
California Headquarters 24 (43%)
Facilities 592 (45%)
California Facilities 155 (49%)
Employees 13,126 (44%)
California Employees 4,789 (52%)

CalPERS California Initiative 2016 | 17
Not all low-income workers live in low-income areas
and not all individuals living in low-income areas earn a
low-income wage. In order to precisely measure the
economic status of employees at GSIF portfolio companies,
wage and ZIP code information was collected from every
employee.28 A worker’s ZIP code of residence and wage
combine to form a more complete picture of an individual’s
economic status. To assess the number of LMI workers at
GSIF portfolio companies, a system has been created to
classify individual workers:• Middle/Upper Income Workers: GSIF portfolio company
employees who earn a middle-income or upper-income
wage are considered middle/upper income employees.
Similarly, employees who earn less than a middle-in-
come wage, but live in middle-income or upper-income
communities are also considered middle/upper-income
workers.29 These workers likely are part of households
with other sources of income. Based on the associated
ZIP code and wage data collected for each employee, as
of June 30, 2016, 56 percent of all GSIF portfolio
company employees are classified middle/upper income.• Low- to Moderate-Income Workers: Forty-four percent
of GSIF portfolio company employees are low- to
moderate-income workers for whom the California
Initiative is providing economic opportunities. These
employees both earn an LMI wage and live in an LMI
area.30 For more in-depth analysis, LMI employees were
further divided into three categories: low-income, low-
to moderate-income, and moderate-income.
Economic Status of GSIF Portfolio Employees
56%Middle/Upper- Income
8%Low-Income
12%Moderate-Income
24%Low-to
Moderate-Income
56% Middle/Upper-Income 44% Low and Moderate Income

18 | CalPERS California Initiative 2016
Residence
Wage
(Wage up to 80% of MFI)
(Wage less than 50% of MFI)
(ZIP Code where MFI is less than 50% of AMI)
(ZIP Code where MFI is up to
80% of AMI)
44%Low-To-Moderate
Income
11%Low-To-ModerateIncome: Residence
12%Moderate Income
8%Low Income
13%Low-To-Moderate
Income: Wage
Low-Income• Employee wage is less than 50 percent of
the Median Family Income (MFI) in the metropolitan
statistical area of residence; and
• Employee residence ZIP Code overlaps with a census
tract where the median income is less than 50 percent
of the Area Median Income (AMI)
Low- To Moderate-Income: Wage• Employee wage is less than 50 percent of the MFI in
the metropolitan statistical area of residence; and
• Employee residence ZIP Code overlaps with a census
tract where the median income is between 50 percent
and 80 percent of the AMI
Low- To Moderate-Income: Residence• Employee wage is between 50 and 80 percent of the MFI
in the metropolitan statistical area of residence; and
• Employee residence ZIP Code overlaps with a census
tract where the median income is less than 50 percent
of the AMI
Moderate-Income• Employee wage is between 50 percent and 80 percent
of the MFI in the metropolitan statistical area of
residence; and
• Employee residence ZIP Code overlaps with a census
tract where the median income is between 50 percent
and 80 percent of the AMI
Economic Status of Low- to Moderate-Income GSIF Portfolio Company Employees
CalPERS California Initiative 2016 | 19
Portfolio Companies That Provide Employment Opportunities to Women and Minority Entrepreneurs and Managers
The third ancillary benefit assessed for the California Initiative
is the extent to which portfolio companies provide employ-
ment opportunities to women and minority entrepreneurs and
managers. As the nation’s largest public pension fund, within
the nation’s most ethnically and culturally diverse state,
CalPERS recognizes diversity is a competitive advantage.
CalPERS broadly interprets diversity to mean
differences such as age, ethnicity, culture, or gender that
result in diversity of thinking. By tracking the number of
women and minority entrepreneurs, CalPERS is better able
to understand to what degree diversity is represented
amongst the leadership and management of California
Initiative portfolio companies.
When private equity dollars are invested in a company,
ownership often shifts from individuals to a fund, or group of
funds. Prior to investment, company owners are commonly
C-level officers. Accordingly, to better understand the
proportion of women and minority entrepreneurs at portfolio
companies, PCV uses officers (e.g., Chief Executive Officer,
Chief Financial Officer, and Chief Operating Officer) and key
managers as a proxy.
The 113 active California Initiative portfolio companies
employ a total of 636 officers (an average of five officers per
company), 16 percent of whom are minorities and another
22 percent of whom are women. Thirty-six percent of
California Initiative investment dollars are invested in 41
companies with at least one woman officer, suggesting that
women have substantial input into the management and
growth of these companies. Similarly, 55 percent of California
Initiative investment dollars are committed to 46 companies
that have at least one minority officer.
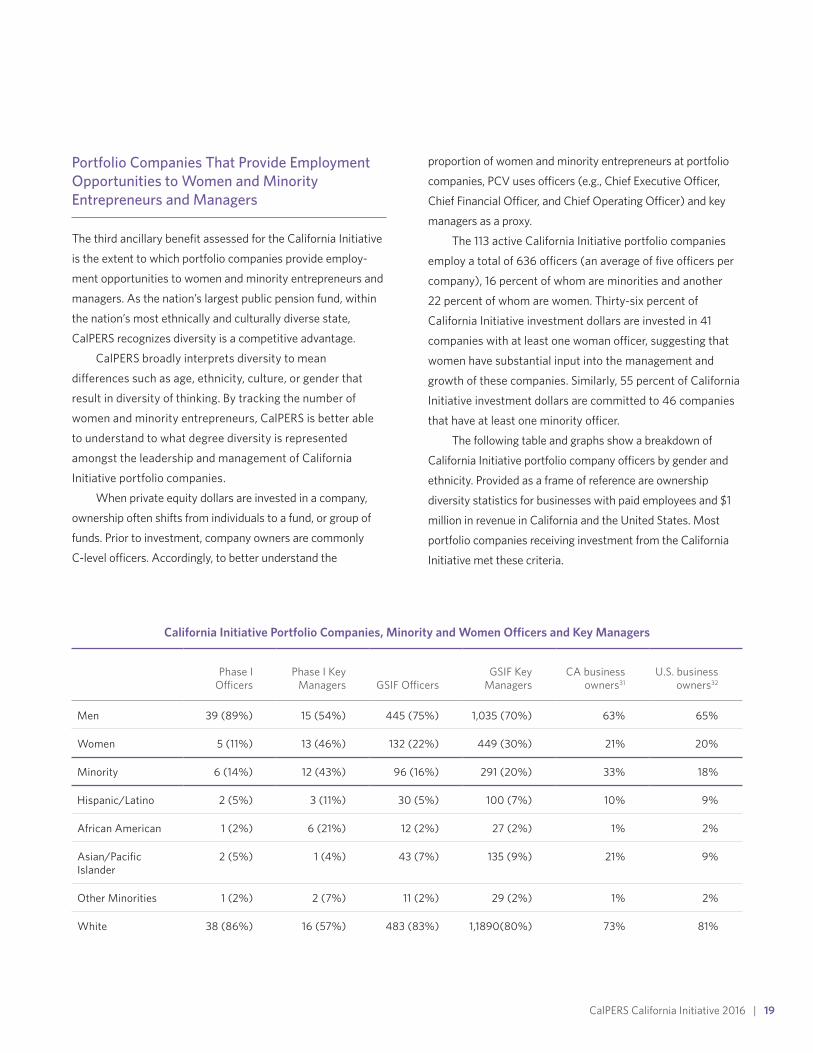
The following table and graphs show a breakdown of
California Initiative portfolio company officers by gender and
ethnicity. Provided as a frame of reference are ownership
diversity statistics for businesses with paid employees and $1
million in revenue in California and the United States. Most
portfolio companies receiving investment from the California
Initiative met these criteria.
California Initiative Portfolio Companies, Minority and Women Officers and Key Managers
Phase I Officers
Phase I Key Managers GSIF Officers
GSIF Key Managers
CA business owners31
U.S. business owners32
Men 39 (89%) 15 (54%) 445 (75%) 1,035 (70%) 63% 65%
Women 5 (11%) 13 (46%) 132 (22%) 449 (30%) 21% 20%
Minority 6 (14%) 12 (43%) 96 (16%) 291 (20%) 33% 18%
Hispanic/Latino 2 (5%) 3 (11%) 30 (5%) 100 (7%) 10% 9%
African American 1 (2%) 6 (21%) 12 (2%) 27 (2%) 1% 2%
Asian/Pacific Islander
2 (5%) 1 (4%) 43 (7%) 135 (9%) 21% 9%
Other Minorities 1 (2%) 2 (7%) 11 (2%) 29 (2%) 1% 2%
White 38 (86%) 16 (57%) 483 (83%) 1,1890(80%) 73% 81%

20 | CalPERS California Initiative 2016
0%
10%
20%
30%
40%
50%
60%
70%
80%
28,826
California Initiative Jobs Created Since Investment All Companies Including Fully Realized Investments
36,365Total Jobs Created
14,175Total CA Jobs Created
Phase I GSIF
0%
10%
20%
30%
40%
50%
13%
36%
54%
49%
5%8%
California Initiative Job Growth Since Investment All Companies Including Fully Realized Investments
Employee Growth CA Employee Growth U.S. and CA Employee Growth
Phase I GSIF U.S. (2007–2016) CA (2007–2016)
0%
20%
40%
60%
80%
100%
50%58%
8%
73%
California Initiative “California Companies”
California Initiative dollars invested in “CA Companies”
Number of Active “CA Companies” in California Initiative Portfolio
Phase I (active companies n=6) GSIF (active companies n=107)
0%
10%
20%
30%
40%
50% 46%
25% 26%30%
California Initiative Investments in Female and Minority Companies
Percentage of Dollars Invested in Companieswith at Least One Minority O�cer
Percentage of Dollars Invested in Companies with at Least One Female O�cer
Phase I GSIF
0%
10%
20%
30%
40%
50%
7%
13%
22% 21%
0%
6%
Percentage of Dollars Invested in Active California Initiative Companies Located in Areas that have Historically
had Limited Access to Institutional Equity Capital
Dollars invested in limited access areas in CA
Dollars invested in limited access areas in the U.S.
Phase I dollars invested in active companies
All private equity dollars invested
GSIF dollars invested in active companies
0%
10%
20%
30%
40%
50%
11%
46%
22%20%
32%
21%
Women Entrepreneurs
WomenO�cers
WomenManagers
U.S. and CA Women Business Owners
Phase I CAU.S.GSIF
0% 5% 10% 15% 20% 25% 30% 35% 40% 45% 50%
Real Estate
Materials
Information Technology
Industrials
Health Care
Financials
Energy
Consumer Staples
Consumer Discretionary
Portfolio Diversification by Industry
Phase I (active companies, n=6) GSIF (active companies, n=107)
0% 30%10% 20% 40% 50% 60%
1-10 employees
11-50 employees
51-100 employees
101-500 employees
501-1000 employees
1001-5000 employees
>5000 employees 17%
7%
7%
17%14%
50%25%
8%
17%36%
0%
0%
0%
2%
California Initiative Active Portfolio Companies by Employee Size
Phase I (active companies, n=6) GSIF (active companies, n=107)
0%
10%
20%
30%
40%
50%
14%
43%
16%18%20%
33%
Minority Entrepreneurs
MinorityO�cers
MinorityManagers
U.S. and CA Minority Business Owners
(n=229)(n=104)
Phase I GSIF U.S. CA(n=107)(n=6)
90%
100%
11,221
7,539
2,954
50%
31%
15%
18%
9%
8%
8%
17%
5%
17%
60%
17%6%
(n=107)(n=6)
(n=229)(n=104)
-6%
-10%
-5%
0%
5%
10%
3%
8%
2%
-10%
3%
California Initiative Annual Job Growth June 30, 2015 to June 30, 2016 — Active Reporting Companies
Employee Growth CA Employee GrowthU.S. and
CA Employee Growth
Phase I GSIF U.S. (2014–2016) CA (2014–2016)
0%
10%
20%
30%
40%
50%
60%
70%
80%
28,826
California Initiative Jobs Created Since Investment All Companies Including Fully Realized Investments
36,365Total Jobs Created
14,175Total CA Jobs Created
Phase I GSIF
0%
10%
20%
30%
40%
50%
13%
36%
54%
49%
5%8%
California Initiative Job Growth Since Investment All Companies Including Fully Realized Investments
Employee Growth CA Employee Growth U.S. and CA Employee Growth
Phase I GSIF U.S. (2007–2016) CA (2007–2016)
0%
20%
40%
60%
80%
100%
50%58%
8%
73%
California Initiative “California Companies”
California Initiative dollars invested in “CA Companies”
Number of Active “CA Companies” in California Initiative Portfolio
Phase I (active companies n=6) GSIF (active companies n=107)
0%
10%
20%
30%
40%
50% 46%
25% 26%30%
California Initiative Investments in Female and Minority Companies
Percentage of Dollars Invested in Companieswith at Least One Minority O�cer
Percentage of Dollars Invested in Companies with at Least One Female O�cer
Phase I GSIF
0%
10%
20%
30%
40%
50%
7%
13%
22% 21%
0%
6%
Percentage of Dollars Invested in Active California Initiative Companies Located in Areas that have Historically
had Limited Access to Institutional Equity Capital
Dollars invested in limited access areas in CA
Dollars invested in limited access areas in the U.S.
Phase I dollars invested in active companies
All private equity dollars invested
GSIF dollars invested in active companies
0%
10%
20%
30%
40%
50%
11%
46%
22%20%
32%
21%
Women Entrepreneurs
WomenO�cers
WomenManagers
U.S. and CA Women Business Owners
Phase I CAU.S.GSIF
0% 5% 10% 15% 20% 25% 30% 35% 40% 45% 50%
Real Estate
Materials
Information Technology
Industrials
Health Care
Financials
Energy
Consumer Staples
Consumer Discretionary
Portfolio Diversification by Industry
Phase I (active companies, n=6) GSIF (active companies, n=107)
0% 30%10% 20% 40% 50% 60%
1-10 employees
11-50 employees
51-100 employees
101-500 employees
501-1000 employees
1001-5000 employees
>5000 employees 17%
7%
7%
17%14%
50%25%
8%
17%36%
0%
0%
0%
2%
California Initiative Active Portfolio Companies by Employee Size
Phase I (active companies, n=6) GSIF (active companies, n=107)
0%
10%
20%
30%
40%
50%
14%
43%
16%18%20%
33%
Minority Entrepreneurs
MinorityO�cers
MinorityManagers
U.S. and CA Minority Business Owners
(n=229)(n=104)
Phase I GSIF U.S. CA(n=107)(n=6)
90%
100%
11,221
7,539
2,954
50%
31%
15%
18%
9%
8%
8%
17%
5%
17%
60%
17%6%
(n=107)(n=6)
(n=229)(n=104)
-6%
-10%
-5%
0%
5%
10%
3%
8%
2%
-10%
3%
California Initiative Annual Job Growth June 30, 2015 to June 30, 2016 — Active Reporting Companies
Employee Growth CA Employee GrowthU.S. and
CA Employee Growth
Phase I GSIF U.S. (2014–2016) CA (2014–2016)

CalPERS California Initiative 2016 | 21
CalPERS California Initiative – Summary Findings
• The California Initiative represents a significant capital
investment in California’s economy with 55 percent of
capital allocated to “California Companies”, defined as
those headquartered in California, or with a plurality of
employees or facilities in the state.• The California Initiative has created and sustained jobs
within California and the nation through continued
economic uncertainty, supporting 176,559 workers at all
companies since inception.• Companies receiving investment through the California
Initiative have provided quality jobs to employees, with
benefit levels for health and retirement outpacing
statewide and national levels.
• The California Initiative has invested in areas of the state
that have historically not received institutional equity
capital, with 20 percent of all dollars deployed in
California allocated to companies located in these
underserved markets.• Economically disadvantaged communities benefit from
the California Initiative and its portfolio companies. The
California Initiative employs a significant number of
economically disadvantaged persons, with 44 percent of
GSIF employees classified as low- to moderate-income.• California Initiative portfolio companies have leadership
that includes women and minorities at levels that
outpace national and state and local levels.
22 | CalPERS California Initiative 2016
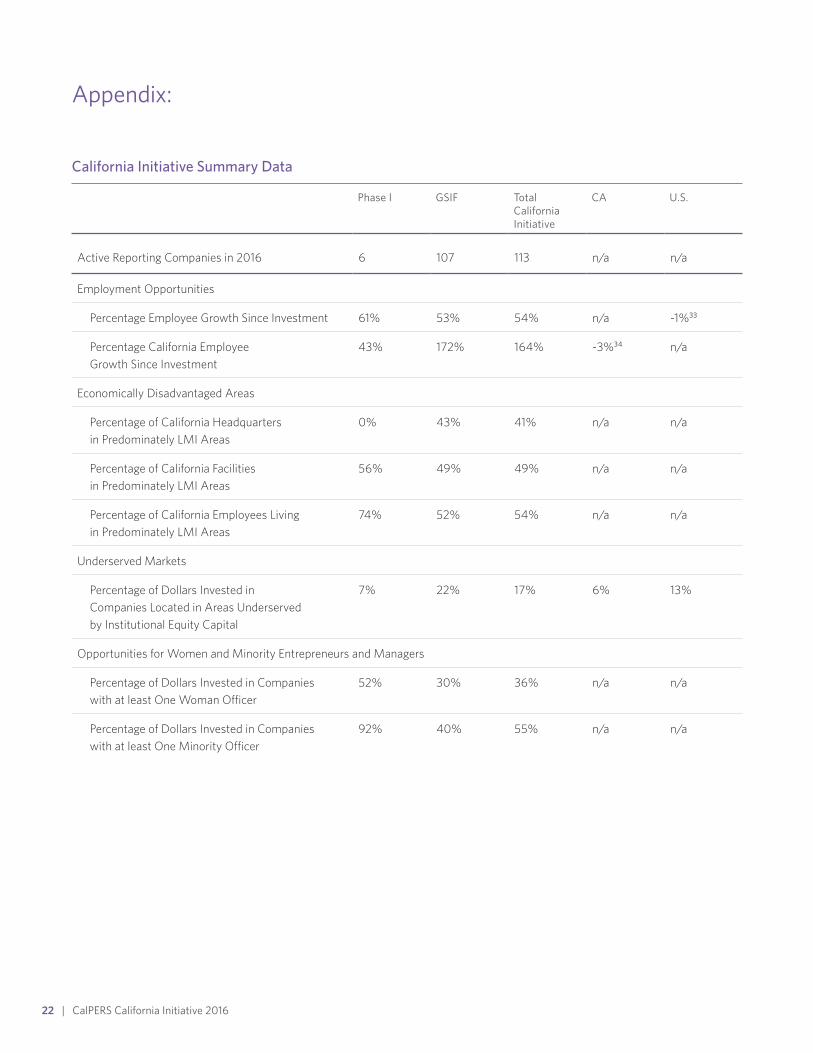
Appendix:
Phase I GSIF Total California Initiative
CA U.S.
Active Reporting Companies in 2016 6 107 113 n/a n/a
Employment Opportunities
Percentage Employee Growth Since Investment 61% 53% 54% n/a -1%33
Percentage California Employee Growth Since Investment
43% 172% 164% -3%34 n/a
Economically Disadvantaged Areas
Percentage of California Headquarters in Predominately LMI Areas
0% 43% 41% n/a n/a
Percentage of California Facilities in Predominately LMI Areas
56% 49% 49% n/a n/a
Percentage of California Employees Living in Predominately LMI Areas
74% 52% 54% n/a n/a
Underserved Markets
Percentage of Dollars Invested in Companies Located in Areas Underserved by Institutional Equity Capital
7% 22% 17% 6% 13%
Opportunities for Women and Minority Entrepreneurs and Managers
Percentage of Dollars Invested in Companies with at least One Woman Officer
52% 30% 36% n/a n/a
Percentage of Dollars Invested in Companies with at least One Minority Officer
92% 40% 55% n/a n/a
California Initiative Summary Data
CalPERS California Initiative 2016 | 23
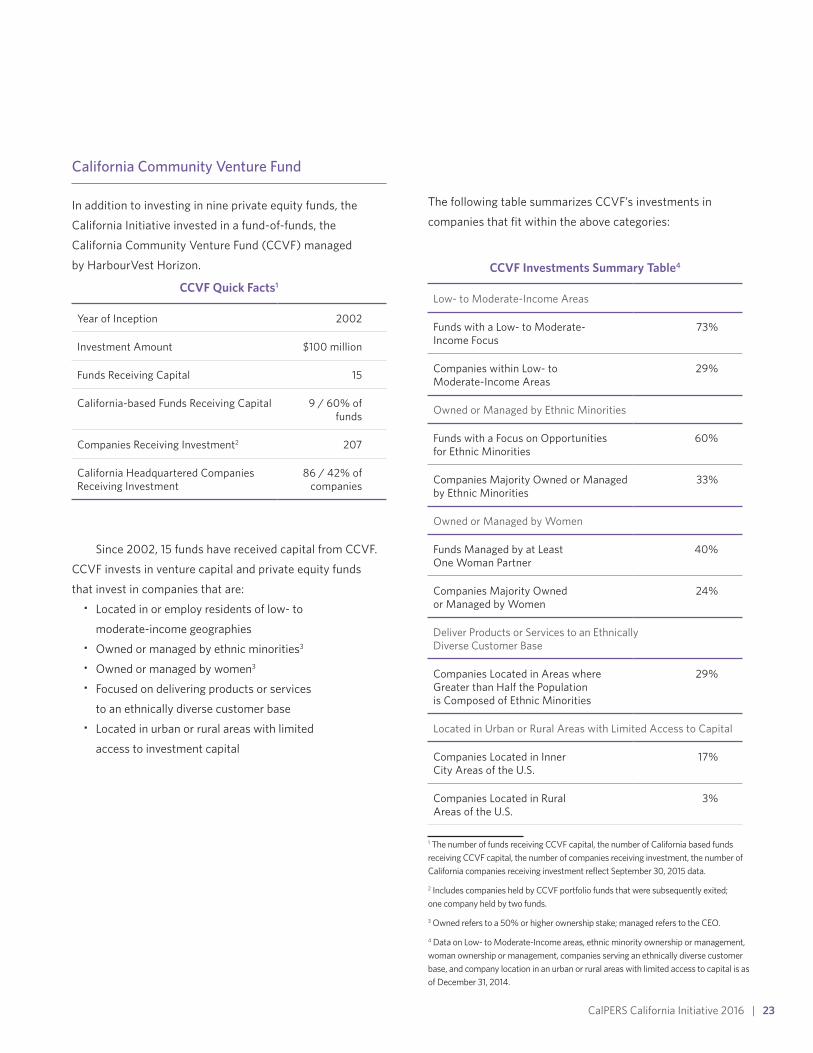
CCVF Quick Facts1
Year of Inception 2002
Investment Amount $100 million
Funds Receiving Capital 15
California-based Funds Receiving Capital 9 / 60% of funds
Companies Receiving Investment2 207
California Headquartered Companies Receiving Investment
86 / 42% of companies
California Community Venture Fund
In addition to investing in nine private equity funds, the
California Initiative invested in a fund-of-funds, the
California Community Venture Fund (CCVF) managed
by HarbourVest Horizon.
Since 2002, 15 funds have received capital from CCVF.
CCVF invests in venture capital and private equity funds
that invest in companies that are:• Located in or employ residents of low- to
moderate-income geographies• Owned or managed by ethnic minorities3
• Owned or managed by women3
• Focused on delivering products or services
to an ethnically diverse customer base• Located in urban or rural areas with limited
access to investment capital
The following table summarizes CCVF’s investments in
companies that fit within the above categories:
CCVF Investments Summary Table4
Low- to Moderate-Income Areas
Funds with a Low- to Moderate- Income Focus
73%
Companies within Low- to Moderate-Income Areas
29%
Owned or Managed by Ethnic Minorities
Funds with a Focus on Opportunities for Ethnic Minorities
60%
Companies Majority Owned or Managed by Ethnic Minorities
33%
Owned or Managed by Women
Funds Managed by at Least One Woman Partner
40%
Companies Majority Owned or Managed by Women
24%
Deliver Products or Services to an Ethnically Diverse Customer Base
Companies Located in Areas where Greater than Half the Population is Composed of Ethnic Minorities
29%
Located in Urban or Rural Areas with Limited Access to Capital
Companies Located in Inner City Areas of the U.S.
17%
Companies Located in Rural Areas of the U.S.
3%
1
1 The number of funds receiving CCVF capital, the number of California based funds receiving CCVF capital, the number of companies receiving investment, the number of California companies receiving investment reflect September 30, 2015 data.
2 Includes companies held by CCVF portfolio funds that were subsequently exited; one company held by two funds.
3 Owned refers to a 50% or higher ownership stake; managed refers to the CEO.
4 Data on Low- to Moderate-Income areas, ethnic minority ownership or management, woman ownership or management, companies serving an ethnically diverse customer base, and company location in an urban or rural areas with limited access to capital is as of December 31, 2014.
24 | CalPERS California Initiative 2016
Providing capital to areas of California and the United States that have historically had limited access to institutional equity capital
Of the 15 funds that have received investment from CCVF,
eleven focus on low- to moderate-income areas or individu-
als. One of the funds is helping to capitalize financial
institutions that provide banking services to low-income
and/or ethnic minority consumers and nine of the 15 funds
focus on ethnic minority opportunities. Many of the funds
also focus on one or more of the other components of
CCVF’s definition of an underserved company.
Of the companies in CCVF funds’ portfolios, 17 percent
were located in areas of the United States classified by the
Initiative for a Competitive Inner City (ICIC) as Inner City,
where venture capital has not traditionally been invested.5
Three percent of companies are located in rural areas of the
United States as defined by the U.S. Department of Agriculture.
Employing workers living in economically disadvantaged areas
Of the companies in CCVF funds’ portfolios, 29 percent of
the companies were located in a low- to moderate-income
areas. Twenty-one percent were located in census tracts
where 20 percent or more of the population lives in house-
holds with income below the federal poverty level, and
37 percent of the companies are located in census tracts
where the median income is at or below 80 percent of
median income for the surrounding area.
Supporting women and minority entrepreneurs and managers
Nine of the 15 funds receiving investment through CCVF
focus on ethnic minority opportunities. Eleven of the funds
have at least one ethnic minority partner; ten of the funds
have two or more ethnic minority partners. Six of the funds
have at least one woman partner.
Of the companies in CCVF funds’ portfolios, 33 percent
were majority owned or managed by minorities and
28 percent were located in census tracts where more than
half the population is an ethnic minority. Further, nearly
34 percent of the companies had some minority ownership
and 31 percent had some women ownership.
Specific gender and ethnic information on the chief
executive officer at CCVF funds’ portfolio companies is
available for the companies that CCVF funds had invested in.
In 29 percent of these companies, the CEO is diverse,
including 33% where the CEO is African American, 14%
where the CEO is Hispanic, and 37% where the CEO is
Asian. Sixteen percent of companies had women as CEOs.
CCVF portfolio companies employed a total of 155,093
employees; 34 percent of these employees were ethnic
minorities and 52 percent were women.
5 Inner Cities are defined as core urban areas that currently have higher unemployment and poverty rates and lower median income levels than surrounding Metropolitan Statistical Areas (MSA). Inner Cities have a 20% poverty rate or higher, or meet two of the following three criteria: poverty rate 1.5x or more than that of the MSA; median household income of ½ or less that of the MSA; unemployment rate of 1.5x times or more than that of the MSA.
CalPERS California Initiative 2016 | 25
1. CalPERS press release; February 19, 2008. “CalPERS California Initiative Program Deploys Private Equity Capital to Overlooked Markets.”
2. The California Community Venture Fund was formerly known as the Banc of America California Community Venture Fund.
3. The 26 total exits consist of five companies that received investment from Phase I partners and 21 companies that received investment from GSIF partners.
4. Percentage of reporting Phase I portfolio companies is unusually low since the portfolio investments of one fund were sold and purchased by a “New Fund” which has very limited
5. Bureau of Labor Statistics. www.bls.gov/ces/. Total private sector employees, seasonally adjusted. Employment in the United States private sector increased ten percent between 2001 and 2016. In California, employment in the private sector increased fifteen percent over the same period.
6. The first GSIF investments were made in 2007.
7. Bureau of Labor Statistics. www.bls.gov/ces/. Total private sector employees, seasonally adjusted.
8. For fully-realized investments, the data used for this analysis is the most recent data available, typically as of June 30 prior to exit. The data for this analysis does not include all fully realized investments as some companies entered and exited without ever submitting survey data.
9. Ibid.
10. Ibid.
11. Bureau of Labor Statistics. www.bls.gov/ces/. Total private sector employees, seasonally adjusted.
12. Ibid.
13. Ninety-one companies participated in four consecutive years of data collection from 2013-2016, including 6 Phase I and 80 GSIF companies. By focusing only on these companies in our counterfactual comparison, we are able to directly compare the California Initiative’s history of job creation and preservation to companies that have not been recipients of
CalPERS capital over the same period. The smaller sample size can be attributed to considerable activity in the California Initiative portfolio, with companies entering and exiting on an annual basis. The 86 companies are relatively representative of the entire portfolio, with job growth characteristics that are similar to those of the entire portfolio–suggesting that survivorship bias is unlikely to have inflated the data. In the table below, we compare annual job growth at the 86 companies to all companies within the portfolio that reported data in consecutive years.
2013- 2014
2014- 2015
2015- 2016
86 Company Sample
Annual Employee Growth
10% 7% 2%
Annual California Employee Growth
22% 22% 7%
CA Initiative Portfolio
CA Initiative Portfolio Company Count
n = 134 n = 122 n = 103
Annual Employee Growth
4% 4% 2%
Annual California Employee Growth
11% 12% 7%
14. Industry data is available for 115 of the 117 active GSIF companies, regardless of whether they reported data or not.
15. 2016 Employer Health Benefits Survey, http://kff.org/health-costs/report/2016-employer-health-benefits-survey/
16. Bureau of Labor Statistics National Compensation Survey, March 2016; Private Industry (excludes agriculture establishments, private households, and the self-employed). http://www.bls.gov/ncs/ebs/benefits/2016/
17. Bureau of Labor Statistics National Compensation Survey, March 2016. http://www.bls.gov/ncs/ebs/benefits/2016/
18. California Health Care Foundation California Employer Health Benefits Survey Data Files, 2014. http://www.chcf.org/publications/2015/04/employer-health-benefits
Endnotes

26 | CalPERS California Initiative 2016
19. Bureau of Labor Statistics National Compensation Survey, March 2016. http://www.bls.gov/ncs/ebs/benefits/2016/This data is for all private industry employees excluding agricultural establishments, private households and self-employed. It does not separate out salaried vs. non-salaried employees.
20. California Health Care Foundation California Employer Health Benefits Survey Data Files, 2016. http://www.chcf.org/publications/2016/04/employer-health-benefits
21. An “active supplier relationship” is defined as one where the company has made a purchase in the past year.
22. The majority (74 percent) of companies reported on this metric. While 28 (26 percent) companies did not report approximate revenue data, thirteen of these companies provided the percentage breakdown of revenue generated in California, the United States outside California, and outside the United States.
23. The GSIF definition for a “California Company” differs from the definition used for Phase I portfolio companies. As Phase I portfolio companies do not report data on employees and facilities located outside of California there is not sufficient data to determine if more facilities or employees are located in California than in any other state. The criteria for a Phase I portfolio company to be considered a “California Company” relies on comparing data captured on California employees and California facilities against the total number of employees and facilities at the company. The Phase I definition for a “California Company” requires that a company meet at least one of the following:
1. Company headquarters located in California
2. At least 33 percent of facilities located in California
3. At least 33 percent of employees located in California
24. Thomson Reuters, thomsonreuters.com/products_ services/financial/
25. Portfolio companies provide the ZIP code for each headquarters location and facility, as well as for each employee. (For Phase I, portfolio companies reported ZIP codes for
California employees and facilities only). While employee and facility locations are defined by ZIP codes, LMI areas are identified by census tracts. ZIP codes can consist of parts of many census tracts and census tracts can contain parts of several ZIP codes. To evaluate the extent to which California Initiative companies are supporting employment for residents of economically underserved areas, PCV made two distinctions:
• ZIP codes that overlap with LMI census tracts. These workers and facilities may or may not be located in a lower-income census tract, but they are likely located near, and in a position to contribute to, the LMI area (68 percent of U.S. ZIP codes fall into this category).
• ZIP codes that are predominantly (50 percent or more) comprised of LMI census tracts. These workers and facilities are likely located in LMI areas (46 percent of U.S. ZIP codes fall into this category).
A census tract is designated LMI if at least one of the following conditions holds true:
• For census tracts within metropolitan areas, the median income of the tract is at or below 80 percent of the metropolitan statistical area median. For census tracts outside of metropolitan areas, the median income of the tract is at or below 80 percent of the statewide, non-metropolitan area median income.
• At least 20 percent of the population lives in poverty.
• The unemployment rate is at least 1.5 times the national average.
26. Phase I companies report a total of 182 facilities and head-quarters but only California ZIP codes are reported by Phase I companies, of which there are 16. All data referring to the LMI status of Phase I facilities examines only these 16 locations.
27. Phase I portfolio companies only report the ZIP codes of California employees, and thus the analysis of LMI workers is limited to California employees. Phase I companies report a total of 584 California employees but provided valid ZIP codes for 278 employees, a difference of 306 or 52 percent.

CalPERS California Initiative 2016 | 27
28. To maintain employee confidentiality, PCV collected no identifying information for employees.
29. These workers earn more than 80 percent of the median family income (MFI) for the metropolitan statistical area (MSA) they live in. Similarly, employees who earn 80 percent or less of the MFI for the MSA, but live in a ZIP code area that consists entirely of middle- and upper-income census tracts also are considered middle/upper-income employees.
30. These workers earn less than 80 percent of the MFI for the MSA of residence AND live in a ZIP code that overlaps a census tract where the median income is less than 80 percent of the area median income.
31. 2007 Survey of Business Owners, http://www.census.gov/econ/sbo/index.html. Includes businesses with $1 million in revenue and paid employees that are at least 51 percent owned by the specified gender or race. The shares of businesses owned by men and women do not add to 100% since it does not include businesses equally owned 50/50 by men and women. The U.S. Census allows respondents to identify by ethnicity and multiple racial categories, thus minority categories are not additive and cannot be combined for an accurate estimate of total minority owned businesses. The most recent data from the 2012 survey was used for this analysis.
32. Ibid.
33. Bureau of Labor Statistics. www.bls.gov/ces/. Job growth from 2007-2016. Total private employees, seasonally adjusted.
34. Ibid.
CalPERS California Initiative 2016 | 29
CalPERS Profile
The California Public Employees’ Retirement System (CalPERS) is the nation’s largest public pension fund
with assets of approximately $296 billion as of April 2016.
Headquartered in Sacramento, CalPERS provides retirement and health benefit services to more than
1.8 million members and more than 3,000 school and public employers. The System also operates 8 Regional
Offices located in Fresno, Glendale, Orange, Sacramento, San Diego, San Bernardino, San Jose, and Walnut
Creek. Led by a 13-member Board of Administration, consisting of member-elected, appointed, and ex officio
members, CalPERS membership consists of approximately 1.2 million active and inactive members and more
than 600,000 retirees, beneficiaries, and survivors from State, school and public agencies.
Established by legislation in 1931, the System became operational in 1932 for the purpose of providing
a secure retirement to State employees who dedicate their careers to public service. In 1939, new legislation
allowed public agency and classified school employees to join the System for retirement benefits. CalPERS
began administering health benefits for State employees in 1962, and 5 years later, public agencies joined the
Health Program on a contract basis.
A defined benefit retirement plan, CalPERS provides benefits based on a member’s years of service, age,
and highest compensation. In addition, benefits are provided for disability and death.
Today CalPERS offers additional programs, including a deferred compensation retirement savings plan,
member education services, and an employer trust for post-retirement benefits. Learn more at our website
at www.calpers.ca.gov.
California Public Employees’ Retirement System400 Q Street | Sacramento, CA 95811
www.calpers.ca.gov
For more information, please contact: Pacific Community Ventures | www.pacificcommunityventures.orgHamilton Lane | www.hamiltonlane.comGolden State Investment Fund | www.gsif.com
June 2017