Embed Size (px)
Citation preview

CalPERS for California 2015Supporting Economic Opportunity in California
B | CalPERS for California Annual Report 2015
Alameda
Alpine
Amador
Butte
Calaveras
Colusa
ContraCosta
Del Norte
El Dorado
Fresno
Glenn
Humboldt
Imperial
Inyo
Kern
Kings
Lake
Lassen
Los Angeles
Madera
Marin
Mariposa
Mendocino
Merced
Modoc
Mono
Monterey
Napa
Nevada
Orange
Placer
Plumas
Riverside
Sacramento
San Benito
San Bernardino
San Diego
San Joaquin
San Luis Obispo
San Mateo
San Francisco
Santa Barbara
Santa Clara
Santa Cruz
Shasta
Sierra
Siskiyou
Solano
Sonoma
Stanislaus
Sutter
Tehama
Trinity
Tulare
Tuolumne
Ventura
Yolo
Yuba
CalPERS for California
The California Public Employees’ Retirement System (CalPERS) is one the largest investors in the world, with more than $300 billion in assets as of June 30, 2015.
Approximately $27.8 billion (9.2 percent) of these funds are invested in California-based companies and projects.
CalPERS for California highlights some of the broad ancillary benefits of all CalPERS investments in California.
CalPERS for California Annual Report 2015 | 1
Table of Contents
Executive Summary . . . . . . . . . . . . . . . . . . . . . . . . . 3
Introduction . . . . . . . . . . . . . . . . . . . . . . . . . . . . 5
Public Markets . . . . . . . . . . . . . . . . . . . . . . . . . . . 7Public Equities . . . . . . . . . . . . . . . . . . . . . . . 7Fixed Income . . . . . . . . . . . . . . . . . . . . . . . 9
Private Markets . . . . . . . . . . . . . . . . . . . . . . . . . 11Private Equity . . . . . . . . . . . . . . . . . . . . . . . 13Real Estate . . . . . . . . . . . . . . . . . . . . . . . . 17Infrastructure . . . . . . . . . . . . . . . . . . . . . . . 20The Economic Impact of CalPERS
Private Markets Investments in California . . . . . . . . . . . . 22
Conclusion . . . . . . . . . . . . . . . . . . . . . . . . . . . 23
Location of CalPERS Investments in California . . . . . . . . . . . . 24
Endnotes . . . . . . . . . . . . . . . . . . . . . . . . . . . . 28

2 | CalPERS for California Annual Report 2015
CalPERS for California Annual Report 2015 | 3
Executive Summary
The California Public Employees’ Retirement System
(CalPERS), the nation’s largest public pension fund, plays an
important role in California’s economy, providing retirement
and health benefits to over 1.8 million public employees,
retirees, and their families, and nearly 3,000 employers.
As of June 30, 2015, CalPERS investment portfolio
totaled $301.9 billion, an increase of one percent from the
previous year.¹ Within the CalPERS investment portfolio,
9.2 percent, or $27.8 billion, is invested in California,
supporting local jobs across the state. The market value of
CalPERS California portfolio increased 8.2 percent in the
12 months since June 30, 2014.
CalPERS investments in California are a direct result of
the strength and diversity of California’s economy and the
quality of its companies, properties, and other opportunities.
These investments must be consistent with the fiduciary
responsibility of the CalPERS Board of Administration and its
duty to protect the financial security of CalPERS members,
through the activities of the CalPERS Investment Office.
The ancillary benefits of CalPERS investments in
California include the support of local jobs, infrastructure for
communities and commerce, and business expansion and
related economic activity. CalPERS private markets invest-
ments in California have resulted in $29.1 billion in total
economic activity across the state, benefiting not only
businesses and projects receiving capital from CalPERS,
but also suppliers, workers and, through tax revenues,
the public sector broadly.
CalPERS for California documents the scale and
breadth of CalPERS investments in California and the
resulting ancillary benefits, in alignment with CalPERS
commitment to transparency and accountability.
As of June 30, 2015, CalPERS invested:• $14.0 billion in 615 California-headquartered public
companies, which employ 1,107,000 people in California.• $3.3 billion of fixed income capital in California,
$850 million of which is invested in 63 California-
headquartered corporate bond issuers employing
207,000 people in California.2
• $3.2 billion in 1,066 California-headquartered private
companies, which employ 191,000 people in California.• $7.2 billion in 233 California-based real estate projects,
which support 170,000 jobs in California.• $119.4 million in eight California-based infrastructure
projects, which support 1,500 jobs in California.
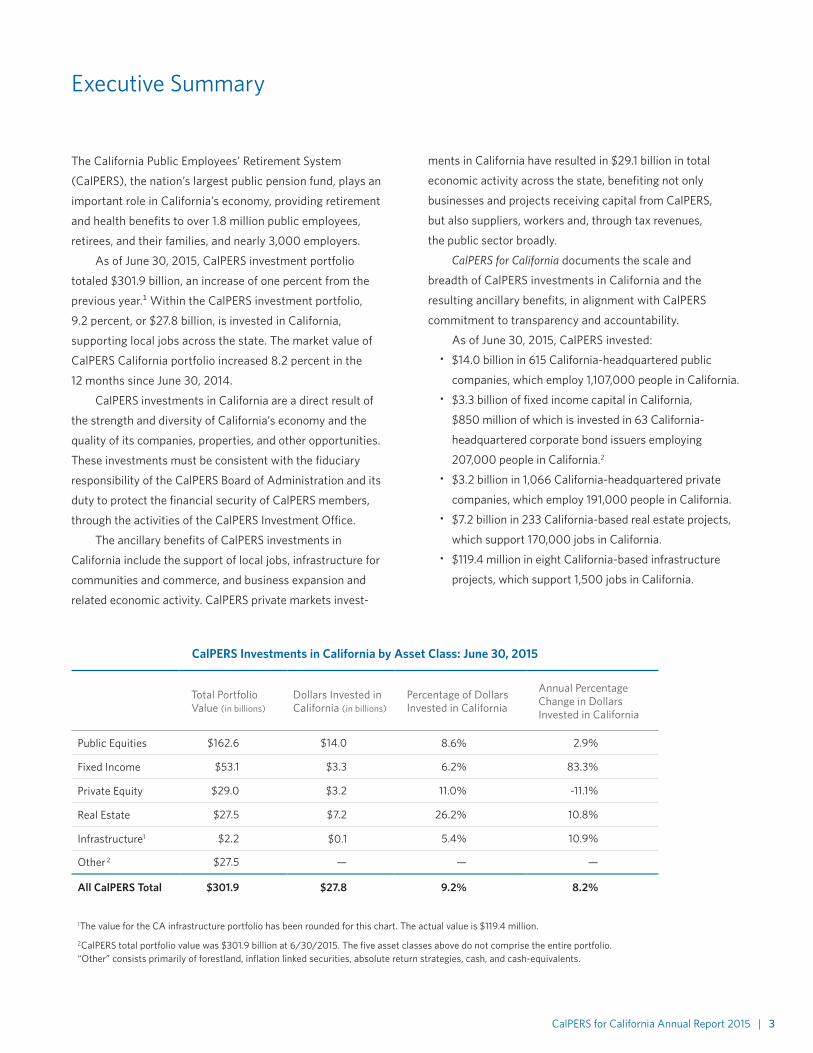
CalPERS Investments in California by Asset Class: June 30, 2015
Total Portfolio Value (in billions)
Dollars Invested in California (in billions)
Percentage of Dollars Invested in California
Annual Percentage Change in Dollars Invested in California
Public Equities $162.6 $14.0 8.6% 2.9%
Fixed Income $53.1 $3.3 6.2% 83.3%
Private Equity $29.0 $3.2 11.0% -11.1%
Real Estate $27.5 $7.2 26.2% 10.8%
Infrastructure1 $2.2 $0.1 5.4% 10.9%
Other 2 $27.5 — — —
All CalPERS Total $301.9 $27.8 9.2% 8.2%
1The value for the CA infrastructure portfolio has been rounded for this chart. The actual value is $119.4 million.
2CalPERS total portfolio value was $301.9 billion at 6/30/2015. The five asset classes above do not comprise the entire portfolio. “Other” consists primarily of forestland, inflation linked securities, absolute return strategies, cash, and cash-equivalents.

4 | CalPERS for California Annual Report 2015
All CalPERS investments in California support local
communities, businesses, and workers. However, the role
that CalPERS capital plays in sustaining the activities of a
public company differs substantially from a private company
or project. Specifically, CalPERS is one of thousands of
capital providers to public companies, with an indirect
connection to the activities of these businesses.
As such, total jobs figures for CalPERS public
markets and private markets are presented separately
below, recognizing the different relationship between the
capital CalPERS provides and employment outcomes.
Jobs by Asset Class: June 30, 20151
Public Equities 1,107,000
Fixed Income 207,000 Note: Jobs already captured within Public Equities2
Public Markets Total3 1,107,000
Private Equity 191,000
Real Estate 170,000
Infrastructure 1,500
Private Markets Total 362,500
1For methodologies calculating the number of jobs supported in California please refer to individual asset class sections within the report.
2 The fixed income employment figure is based on publicly available data for this asset class, which was available for 19 companies that received direct corporate bond investment from CalPERS. These 19 companies are also present in CalPERS public equity portfolio. Job estimates cannot be combined as this would constitute double counting.
3It is important to note that the jobs at public companies are created and sustained by all sources of capital utilized by these companies, not just by CalPERS investment. Total jobs supported are calculated for CalPERS public markets investments to illustrate the presence and prominence of these public companies in California’s economy and of their relative importance as investments in California by CalPERS.
CalPERS for California Annual Report 2015 | 5
Introduction
As of June 30, 2015, CalPERS invested $27.8 billion in
companies, properties, and projects located in California
across five key asset classes including public equities, fixed
income, private equities, real estate, and infrastructure.
The primary objective of CalPERS investments in
California is to achieve appropriate risk-adjusted return on
investment. Investment in California by CalPERS and its
third-party investment managers is a consequence of the
strength and diversity of California’s economy and the quality
of its companies, properties, and other investment opportu-
nities.3 Specifically:• At $2.3 trillion,4 California represents 13 percent of
U.S. Gross Domestic Product (GDP) and ranks as the
world’s seventh largest economy.5
• California is home to 53 Fortune 500 companies and
32 of the largest 500 corporations in the world.6
• California has received $470.4 billion of $4.5 trillion in
private equity investments made from 2005-2014 in
the U.S.7
• California exported $174 billion of goods in 2014, repre-
senting 10.7 percent of U.S. total exported goods.8
CalPERS invests like other large institutions, diversifying
its portfolio among categories of investments, called “asset
classes”, to reduce its exposure to any one market risk and
maximize its return on investment.
Asset classes in this report include:• Public markets:
– Public equities: Investments in public companies
domestically and internationally, for example through
the New York Stock Exchange. – Fixed income: Investments in loans provided to
governments, companies, and other borrowers.• Private markets:
– Private equities: Investments in private companies
that are not publicly traded. – Real estate: Investments in commercial, residential,
and industrial property. – Infrastructure: Investments in real assets including
bridges, toll roads, utilities, and airports.
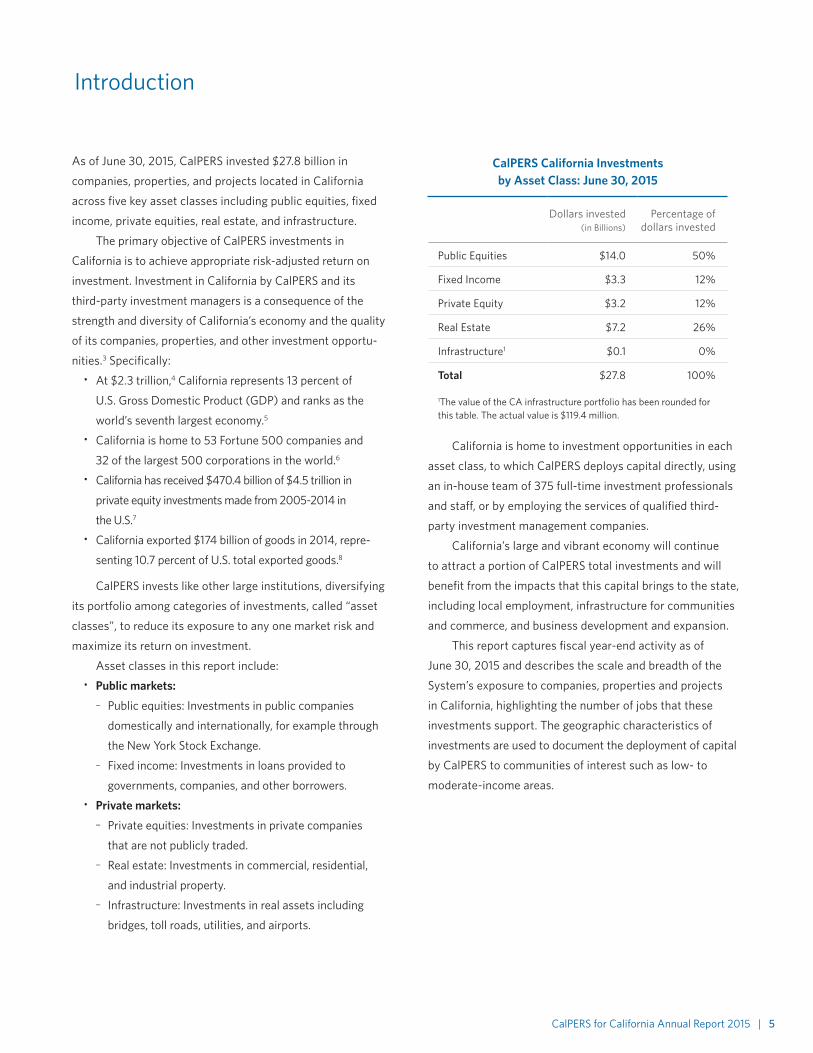
CalPERS California Investments by Asset Class: June 30, 2015
Dollars invested (in Billions)
Percentage of dollars invested
Public Equities $14.0 50%
Fixed Income $3.3 12%
Private Equity $3.2 12%
Real Estate $7.2 26%
Infrastructure1 $0.1 0%
Total $27.8 100%
1The value of the CA infrastructure portfolio has been rounded for this table. The actual value is $119.4 million.
California is home to investment opportunities in each
asset class, to which CalPERS deploys capital directly, using
an in-house team of 375 full-time investment professionals
and staff, or by employing the services of qualified third-
party investment management companies.
California’s large and vibrant economy will continue
to attract a portion of CalPERS total investments and will
benefit from the impacts that this capital brings to the state,
including local employment, infrastructure for communities
and commerce, and business development and expansion.
This report captures fiscal year-end activity as of
June 30, 2015 and describes the scale and breadth of the
System’s exposure to companies, properties and projects
in California, highlighting the number of jobs that these
investments support. The geographic characteristics of
investments are used to document the deployment of capital
by CalPERS to communities of interest such as low- to
moderate-income areas.
6 | CalPERS for California Annual Report 2015
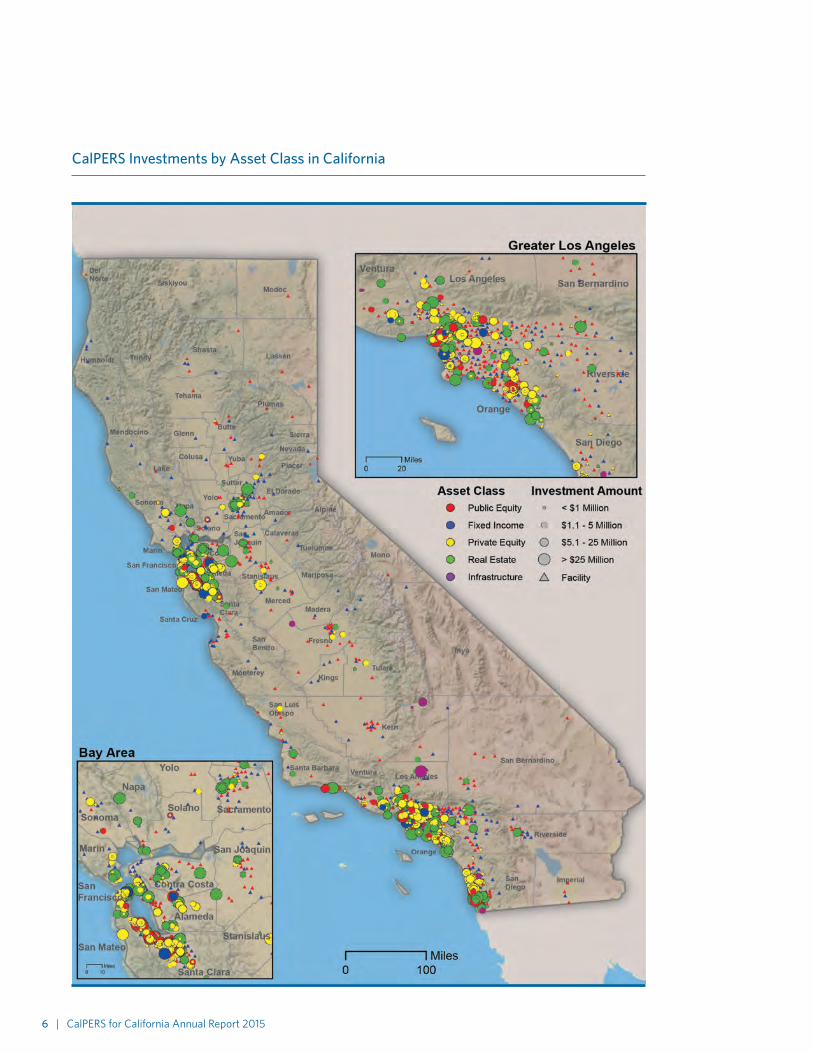
CalPERS Investments by Asset Class in California
CalPERS for California Annual Report 2015 | 7
Public Markets
CalPERS invests the largest amount of its assets in total, and
in California, in the public markets through public equity
and fixed income investments.
The analysis below includes estimates of the number of
workers employed in California by the companies in which
CalPERS invests. These jobs are not created or sustained
only by CalPERS investments. CalPERS owns approximately
0.3 percent of the largest California-headquartered
companies in its portfolio. Nonetheless, CalPERS provides
an important source of capital for use in all the activities
of the public companies and fixed income opportunities
in which it invests.
This research focuses on California-headquartered
companies that have received investment from CalPERS
because the impacts these firms have on the California
economy are more significant than those headquartered
elsewhere. Companies headquartered in California have
19 percent of their facilities located in-state compared to
companies with headquarters outside of California, which
have three percent of their facilities based locally.
Public Equities
Public Equities
Total Market Value $162.6 billion
Value in CA $14.0 billion
Percentage in CA 8.6%
CalPERS invests in public companies primarily as a long-
term investor, without betting on market fluctuations. The
largest allocation of public equities is passively managed by
an in-house team of investment professionals. CalPERS also
maintains a modest allocation of public equity investments
with external active equity managers where there is
potential to add value. CalPERS and its external investment
managers also engage with companies directly to better
align the interests of long-term shareowners and companies
in pursuit of sustainable risk-adjusted returns.
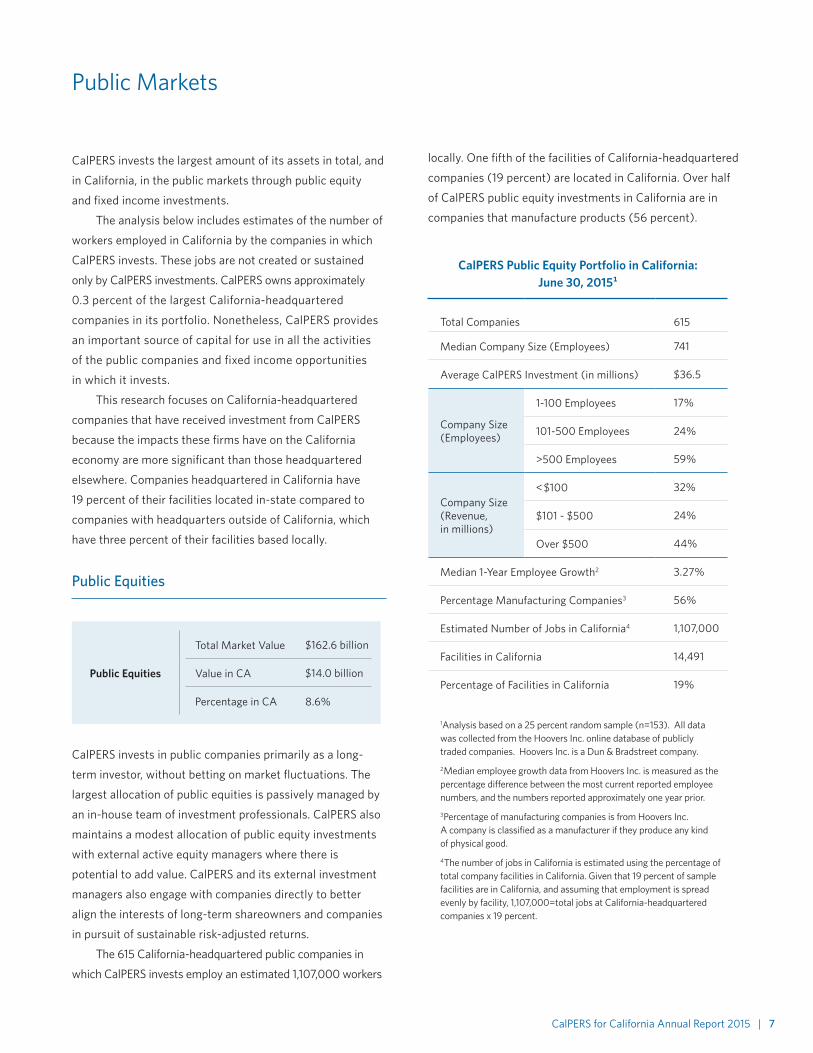
The 615 California-headquartered public companies in
which CalPERS invests employ an estimated 1,107,000 workers
locally. One fifth of the facilities of California-headquartered
companies (19 percent) are located in California. Over half
of CalPERS public equity investments in California are in
companies that manufacture products (56 percent).
CalPERS Public Equity Portfolio in California: June 30, 2015¹
Total Companies 615
Median Company Size (Employees) 741
Average CalPERS Investment (in millions) $36.5
Company Size (Employees)
1-100 Employees 17%
101-500 Employees 24%
>500 Employees 59%
Company Size (Revenue, in millions)
<$100 32%
$101 - $500 24%
Over $500 44%
Median 1-Year Employee Growth2 3.27%
Percentage Manufacturing Companies3 56%
Estimated Number of Jobs in California4 1,107,000
Facilities in California 14,491
Percentage of Facilities in California 19%
1Analysis based on a 25 percent random sample (n=153). All data was collected from the Hoovers Inc. online database of publicly traded companies. Hoovers Inc. is a Dun & Bradstreet company.
2Median employee growth data from Hoovers Inc. is measured as the percentage difference between the most current reported employee numbers, and the numbers reported approximately one year prior.
3Percentage of manufacturing companies is from Hoovers Inc. A company is classified as a manufacturer if they produce any kind of physical good.
4The number of jobs in California is estimated using the percentage of total company facilities in California. Given that 19 percent of sample facilities are in California, and assuming that employment is spread evenly by facility, 1,107,000=total jobs at California-headquartered companies x 19 percent.

8 | CalPERS for California Annual Report 2015
CalPERS +$100 Million Public Equity Investments in California
Company Name
CalPERS Investment
(in millions)1
Total Market Capitalization (in millions)2
CalPERS % of Market Value
Company Facilities in California3
Apple Inc. $2,150.6 $715,600 0.30% 18%
Wells Fargo & Co. $977.3 $289,368 0.34% 17%
Google Inc. $885.1 $726,996 0.12% 18%
Chevron Corp. $550.0 $181,531 0.30% 24%
Walt Disney Co. $541.0 $182,624 0.30% 27%
Facebook Inc. $514.1 $241,343 0.21% 34%
Gilead Sciences Inc. $498.8 $172,459 0.29% 22%
Intel Corp. $455.5 $144,563 0.32% 18%
Cisco Systems Inc. $445.0 $139,854 0.32% 11%
Oracle Corp. $435.1 $175,023 0.25% 13%
Visa Inc. $388.7 $148,737 0.26% 19%
Amgen Inc. $335.5 $116,537 0.29% 21%
Qualcomm Inc. $287.4 $98,830 0.29% 34%
Hewlett-Packard Co. $203.6 $54,228 0.38% 11%
McKesson Corp. $194.7 $52,156 0.37% 6%
eBay Inc. $184.6 $73,372 0.25% 15%
DIRECTV $148.7 $46,764 0.32% 19%
Adobe Systems Inc. $126.5 $40,365 0.31% 15%
Charles Schwab Corp. $118.7 $42,937 0.28% 22%
CBRE Group Inc. $112.9 $12,325 0.92% 14%
Yahoo! Inc. $100.3 $36,927 0.27% 30%
Total $9,654.29 $3,692,539 0.26% 17%4
1CalPERS investment is Market Value at 6/30/2015
2Total Market Capitalization at 6/30/2015.
3The percentage of facilities in California is determined using Hoovers, Inc. data and includes all company facilities with a California address.
4Total company facilities in CA is calculated by dividing the total number of CA based facilities for the CalPERS +$100 million public equity investments by their total number of facilities.
CalPERS has investments of more than $100 million in 21 separate companies headquartered in California. These companies
account for 69 percent of CalPERS public equity investments in California and 24 percent of the California workers employed
by public companies in CalPERS portfolio.

CalPERS for California Annual Report 2015 | 9
CalPERS invests in approximately 9,600 companies
globally that have headquarters outside of California. California
operations comprise approximately three percent of the total
number of facilities for these companies.⁹ While companies
headquartered elsewhere likely employ millions of Californians,
a precise jobs estimate was unable to be determined with
available data.
Global Equity Companies notHeadquartered in California1
Total Companies 9,622
Approximate Number of Facilities 1,937,200
Percentage of Facilities in CA 3%
1Analysis based on a 3 percent random sample (n=278) of companies not headquartered in California in the CalPERS Global Equity portfolio.
Fixed Income 10
Fixed Income
Total Market Value $53.1 billion
Value in CA $3.3 billion
Percentage in CA 6.2%
CalPERS has fixed income investments in California, managed
in-house and externally, in five areas:• Corporate bonds: Corporate bonds are debt securities issued
by private and public corporations. Companies issue
corporate bonds to raise money for a variety of purposes,
such as building new plants or purchasing equipment.11
• Credit enhancements: Credit enhancements for state or
municipal entities effectively substitute the credit rating and
liquidity of the credit enhancement provider for that of the
borrower. Credit enhancement thereby lowers the cost of
capital for the borrower and provides CalPERS with an
incremental earnings stream for this service.
• Structured securities: Structured securities are investments
in a diverse group of loans and provide risk and return charac-
teristics contingent on a range of underlying indices, interest
rates or cash flows.• Short-term investments: Short-term investments consist of
U.S. Treasury and government sponsored securities, money
market funds, commercial paper, certificates of deposit,
repurchase agreements, asset backed securities, notes and
bonds issued by U.S. corporations, and other allowable
instruments that meet short-term maturity or average life,
diversification, and credit quality restrictions.• Whole loans: Whole loans include remaining California
mortgages through the CalPERS Member Home
Loan Program.
CalPERS Fixed Income Investment Classes in California: June 30, 2015
Dollars invested (in millions)
Percentage of dollars invested
Corporate Bonds $850 26%
Credit Enhancements1 $102 3%
Structured Securities $2,203 67.5%
Short-term Investments $15 0.5%
Whole Loans $97 3%
Total $3,267 100%
1Credit Enhancement dollars are “committed” and not invested.
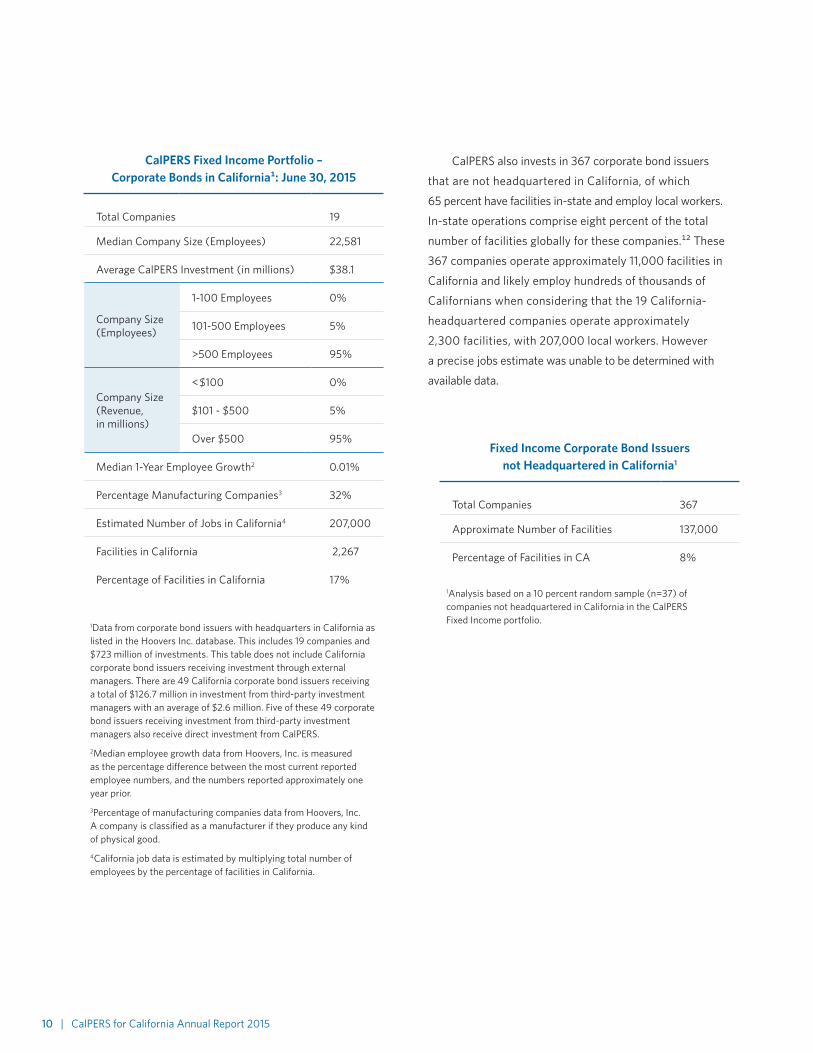
CalPERS Fixed Income portfolio includes corporate bond
investments in 63 companies headquartered in California
managed by CalPERS and external third-party investment
managers. CalPERS invests $723 million directly in 19 of
these companies, without the assistance of external third-
party investment managers. The 19 companies in which
CalPERS invests directly are larger than companies invested
in by other asset classes, with a median size of approximately
22,600 employees. These companies employ approximately
207,000 workers in California and operate 2,300 local facilities.
10 | CalPERS for California Annual Report 2015
CalPERS Fixed Income Portfolio – Corporate Bonds in California¹: June 30, 2015
Total Companies 19
Median Company Size (Employees) 22,581
Average CalPERS Investment (in millions) $38.1
Company Size (Employees)
1-100 Employees 0%
101-500 Employees 5%
>500 Employees 95%
Company Size (Revenue, in millions)
<$100 0%
$101 - $500 5%
Over $500 95%
Median 1-Year Employee Growth2 0.01%
Percentage Manufacturing Companies3 32%
Estimated Number of Jobs in California4 207,000
Facilities in California 2,267
Percentage of Facilities in California 17%
1Data from corporate bond issuers with headquarters in California as listed in the Hoovers Inc. database. This includes 19 companies and $723 million of investments. This table does not include California corporate bond issuers receiving investment through external managers. There are 49 California corporate bond issuers receiving a total of $126.7 million in investment from third-party investment managers with an average of $2.6 million. Five of these 49 corporate bond issuers receiving investment from third-party investment managers also receive direct investment from CalPERS.
2Median employee growth data from Hoovers, Inc. is measured as the percentage difference between the most current reported employee numbers, and the numbers reported approximately one year prior.
3Percentage of manufacturing companies data from Hoovers, Inc. A company is classified as a manufacturer if they produce any kind of physical good.
4California job data is estimated by multiplying total number of employees by the percentage of facilities in California.
CalPERS also invests in 367 corporate bond issuers
that are not headquartered in California, of which
65 percent have facilities in-state and employ local workers.
In-state operations comprise eight percent of the total
number of facilities globally for these companies.¹² These
367 companies operate approximately 11,000 facilities in
California and likely employ hundreds of thousands of
Californians when considering that the 19 California-
headquartered companies operate approximately
2,300 facilities, with 207,000 local workers. However
a precise jobs estimate was unable to be determined with
available data.
Fixed Income Corporate Bond Issuers not Headquartered in California1
Total Companies 367
Approximate Number of Facilities 137,000
Percentage of Facilities in CA 8%
1Analysis based on a 10 percent random sample (n=37) of companies not headquartered in California in the CalPERS Fixed Income portfolio.
CalPERS for California Annual Report 2015 | 11
Private Markets
CalPERS invests approximately 20 percent of its total assets
in private markets inside and outside of California, including
in private equity, real estate, and infrastructure. Within
California, the proportion of CalPERS assets in private
market strategies is much greater, at 39 percent. Private
market strategies encompass investments in companies,
properties, and projects that cannot be accessed publicly.
The job creation and other ancillary benefits of private
companies, properties, and projects that receive invest-
ments directly from CalPERS, or through contracted
third-party investment managers, can be more directly
attributed to the System than investments in public markets.
CalPERS is typically a larger investor among a more
targeted group of institutions in any given deal, fund or
partnership. Moreover, in the case of private equity, the
investment managers supported by CalPERS (called
“General Partners”) often join the boards of directors of the
companies in which they invest and provide strategic advice,
improved operating guidance, and access to broad networks
that directly enhance the probability of business success.
At times, the investment managers that CalPERS enlists
to support its efforts in private markets have also raised
additional capital as a result of CalPERS anchor partnership
commitment in their funds. While not all of these “co-invest-
ments” in private California-based companies, properties,
and projects can be attributed to CalPERS, the opportunity
to partner with CalPERS and its investment managers has
proven to be attractive to other providers of capital.
The private markets section of CalPERS for California
highlights four areas in which capital may be especially
socially beneficial.¹³ This includes:• Low- to Moderate-Income (LMI) Areas14
• High Unemployment Areas15
• High Minority Areas16
• Rural Areas 17
Access to capital is an important factor in business and
productivity growth, job and wealth creation, innovation,
and sustainable community and economic development.
The benefits of access to capital accrue to the direct
recipients of investments, and to the areas in which they
are located.
The proportion of CalPERS investments in LMI, High
Unemployment, High Minority, and Rural Areas reflects the
demand for capital in the asset classes in which CalPERS
invests. For example, CalPERS invests in companies and
properties in central business districts and other economic
hubs that offer attractive investment opportunities. These
areas tend to be more ethnically and economically diverse,
but CalPERS investment is not a result of these characteris-
tics. As with all the System’s investments, the decision of
CalPERS and its third-party investment managers to
support a California-based company, property or project is
made solely on the basis of the financial merits of the
particular investment opportunity.

12 | CalPERS for California Annual Report 2015
Locating Investments in California
The analysis in this section uses the demographic and income characteristics of ZIP codes. If the ZIP code in which an investment is located is determined to be an LMI, High Unemployment, High Minority, or Rural Area, then the investment and the dollars associated with the investment are considered to be in the defined community.
In the case of High Unemployment, Rural, and
High Minority Areas, the calculations are relatively
straightforward. The data used to determine the
appropriate status of relevant populations is
available by ZIP code and uses 2010 U.S. Census
and 2010 California Employment Development
Department data.
Calculating the LMI status of a ZIP code is more
complex. The following method is applied using U.S.
Census Bureau 2006-2010 American Community
Survey data for every tract in the United States:
1. The population in a census tract is assumed to be evenly distributed across the entire census tract. This includes the LMI population.
2. The number of census tracts and percentage of each census tract located in every ZIP code is determined using geographic information systems (GIS) data.
3. The percentage of the total population and LMI population from each census tract is attributed to the ZIP code in which it is located.
4. A total population number, and LMI population number, is calculated for every ZIP code by combining partial census tracts.
5. The ZIP code is considered to be LMI if the percentage of LMI population in a ZIP code is greater than 50 percent of the total.
In the United States, 38 percent of all ZIP
codes are classified as LMI using this analysis.
In California, 49 percent of all ZIP codes are
classified as LMI, including 85 percent in the
“urban core” comprising the Central Business
Districts of San Francisco, Oakland, Los
Angeles, and San Diego.18
CalPERS for California Annual Report 2015 | 13
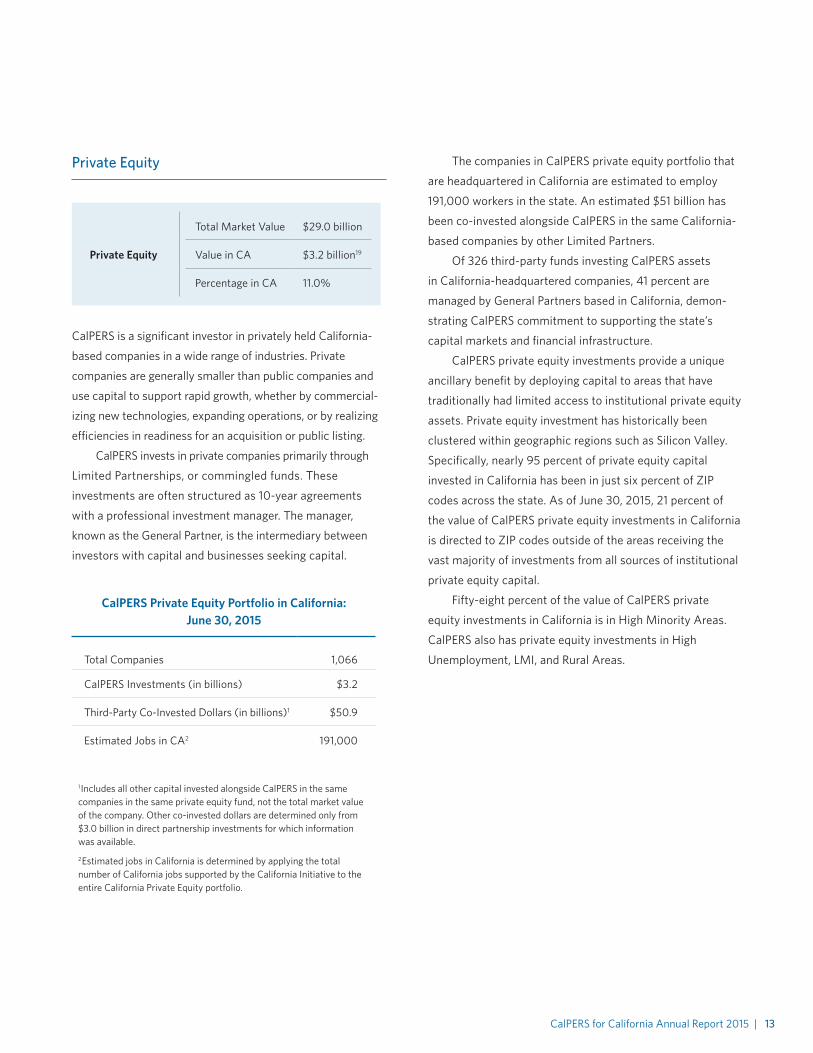
Private Equity
Private Equity
Total Market Value $29.0 billion
Value in CA $3.2 billion19
Percentage in CA 11.0%
CalPERS is a significant investor in privately held California-
based companies in a wide range of industries. Private
companies are generally smaller than public companies and
use capital to support rapid growth, whether by commercial-
izing new technologies, expanding operations, or by realizing
efficiencies in readiness for an acquisition or public listing.
CalPERS invests in private companies primarily through
Limited Partnerships, or commingled funds. These
investments are often structured as 10-year agreements
with a professional investment manager. The manager,
known as the General Partner, is the intermediary between
investors with capital and businesses seeking capital.
CalPERS Private Equity Portfolio in California: June 30, 2015
Total Companies 1,066
CalPERS Investments (in billions) $3.2
Third-Party Co-Invested Dollars (in billions)1 $50.9
Estimated Jobs in CA2 191,000
1Includes all other capital invested alongside CalPERS in the same companies in the same private equity fund, not the total market value of the company. Other co-invested dollars are determined only from $3.0 billion in direct partnership investments for which information was available.
2Estimated jobs in California is determined by applying the total number of California jobs supported by the California Initiative to the entire California Private Equity portfolio.
The companies in CalPERS private equity portfolio that
are headquartered in California are estimated to employ
191,000 workers in the state. An estimated $51 billion has
been co-invested alongside CalPERS in the same California-
based companies by other Limited Partners.
Of 326 third-party funds investing CalPERS assets
in California-headquartered companies, 41 percent are
managed by General Partners based in California, demon-
strating CalPERS commitment to supporting the state’s
capital markets and financial infrastructure.
CalPERS private equity investments provide a unique
ancillary benefit by deploying capital to areas that have
traditionally had limited access to institutional private equity
assets. Private equity investment has historically been
clustered within geographic regions such as Silicon Valley.
Specifically, nearly 95 percent of private equity capital
invested in California has been in just six percent of ZIP
codes across the state. As of June 30, 2015, 21 percent of
the value of CalPERS private equity investments in California
is directed to ZIP codes outside of the areas receiving the
vast majority of investments from all sources of institutional
private equity capital.
Fifty-eight percent of the value of CalPERS private
equity investments in California is in High Minority Areas.
CalPERS also has private equity investments in High
Unemployment, LMI, and Rural Areas.

14 | CalPERS for California Annual Report 2015
CalPERS invests in a wide range of companies, with
investments in more than 11 different industries. The following
chart shows the diversity of CalPERS California private equity
portfolio with the distribution of sectors, including the heaviest
concentrations in information technology, health care and
consumer discretionary companies.
Private Equity Ancillary Benefits in California1
Percentage of investments
Percentage of dollars
High Unemployment Areas 12% 15%
Rural Areas 4% 8%
High Minority Areas 54% 58%
LMI Areas 20% 22%Limited Capital Access Areas2 11% 21%
1Private equity ancillary benefits in California were determined using private equity California investment amounts and ZIP code data from direct partnerships and does not include data from other externally managed investments.
2According to data from Thomson Reuters analyzing all private equity transactions between 2002 and 2011, nearly 95 percent of all private equity in California has been committed to 6 percent of California ZIP codes. ZIP codes not included in this 6 percent are considered Limited Capital Access Areas.
29.8%Information Technology
16.3%Health Care
2.2%Materials
1.0%Telecommunication Services
0.5%Utilities
4.2%Other
7.4%Energy
5.2%Financials
9.5%Industrials
6.8%Consumer Staples
2.2%Real Estate
14.9%Consumer Discretionary
California Private Equity Investments by Industry
Note: “Other” includes miscellaneous, unclassified investments, and commingled funds.

CalPERS for California Annual Report 2015 | 15
The CalPERS California Initiative (Initiative) is a private
equity investment strategy providing capital to companies
primarily in California with the goal of generating financial
returns that meet or exceed industry benchmarks. As an
ancillary objective, the Initiative invests in traditionally
underserved areas where capital has not typically been
focused, supporting local job creation and opportunities
for women and minority entrepreneurs. The Initiative was
established in 2001 and has invested $1 billion since
inception, with $263 million currently invested in
134 active companies reporting data in 2015.
The eleventh annual examination of the ancillary
benefits of the Initiative is available in a separate
report on CalPERS website at www.calpers.ca.gov/
californiainitiative2015.
Highlights at June 30, 2015 include:• 29,403 total jobs created at 134 companies, for net
employment growth of 48 percent since the time
of investment. • Investment in areas that have not historically received
institutional equity capital, with 35 percent of capital
invested in companies located in underserved markets. • Employment opportunities for economically disadvantaged
workers, with 49 percent of all reporting company
employees classified as low- to moderate-income.
Ancillary benefits for the Initiative are summarized
in the following table:
Since Inception California Initiative Results: Job Support and Job Creation
Ancillary Benefits1
Overall California Initiative
The California Initiative
within California
Percentage within
California
Total Jobs/ Employees Supported
164,753 39,252 24%
Total Jobs Created Since Investment2
35,756 13,514 38%
Percentage Job Growth Since Investment 3
28% 53% n/a
1Ancillary benefits are derived from data from all companies ever receiving investment under the California Initiative and includes both active and fully realized investments that have reported data. These ancillary benefits capture the entirety of the Initiative’s Job Support and Job Creation ancillary benefits since inception.
2Total Jobs Created Since Investment represents net jobs created for the entire California Initiative portfolio and aggregates job losses and gains at both active and exited portfolio companies.
3From 2001-2015, U.S. private sector employment increased 8 percent and California private sector employment increased 10 percent.
Case Study: CalPERS California Initiative
16 | CalPERS for California Annual Report 2015
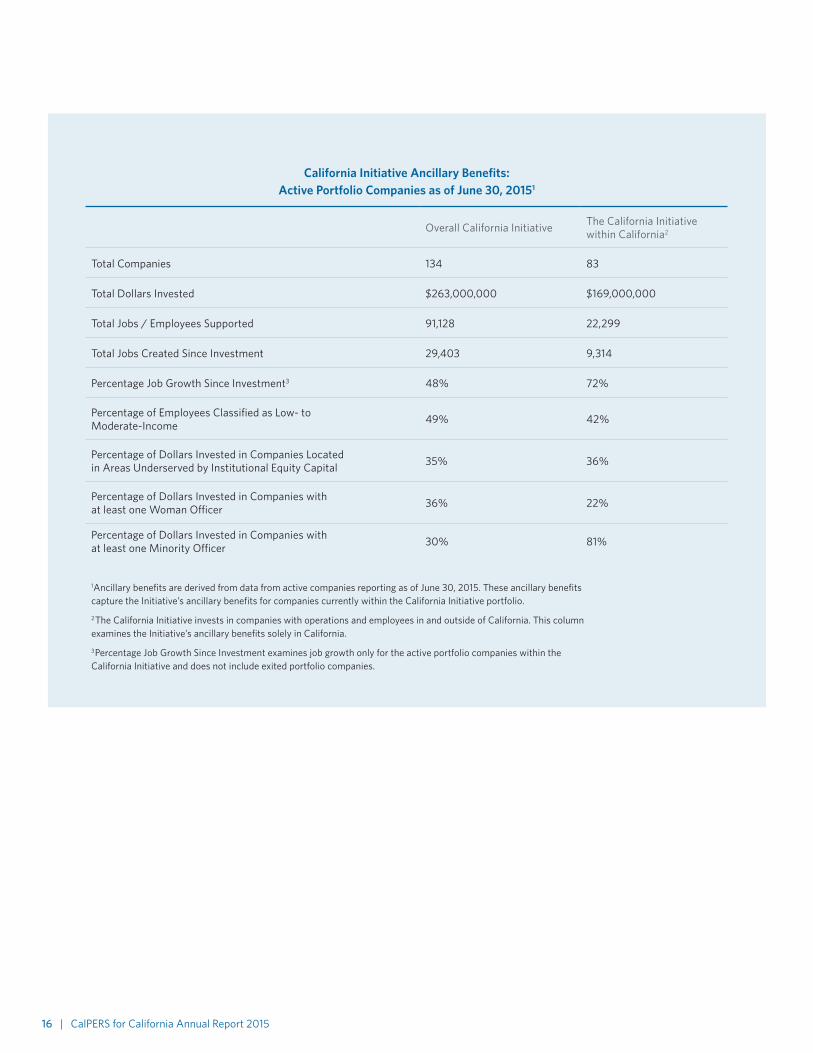
California Initiative Ancillary Benefits: Active Portfolio Companies as of June 30, 20151
Overall California Initiative The California Initiative within California2
Total Companies 134 83
Total Dollars Invested $263,000,000 $169,000,000
Total Jobs / Employees Supported 91,128 22,299
Total Jobs Created Since Investment 29,403 9,314
Percentage Job Growth Since Investment3 48% 72%
Percentage of Employees Classified as Low- to Moderate-Income 49% 42%
Percentage of Dollars Invested in Companies Located in Areas Underserved by Institutional Equity Capital 35% 36%
Percentage of Dollars Invested in Companies with at least one Woman Officer 36% 22%
Percentage of Dollars Invested in Companies with at least one Minority Officer 30% 81%
1Ancillary benefits are derived from data from active companies reporting as of June 30, 2015. These ancillary benefits capture the Initiative’s ancillary benefits for companies currently within the California Initiative portfolio.
2The California Initiative invests in companies with operations and employees in and outside of California. This column examines the Initiative’s ancillary benefits solely in California.
3Percentage Job Growth Since Investment examines job growth only for the active portfolio companies within the California Initiative and does not include exited portfolio companies.
CalPERS for California Annual Report 2015 | 17
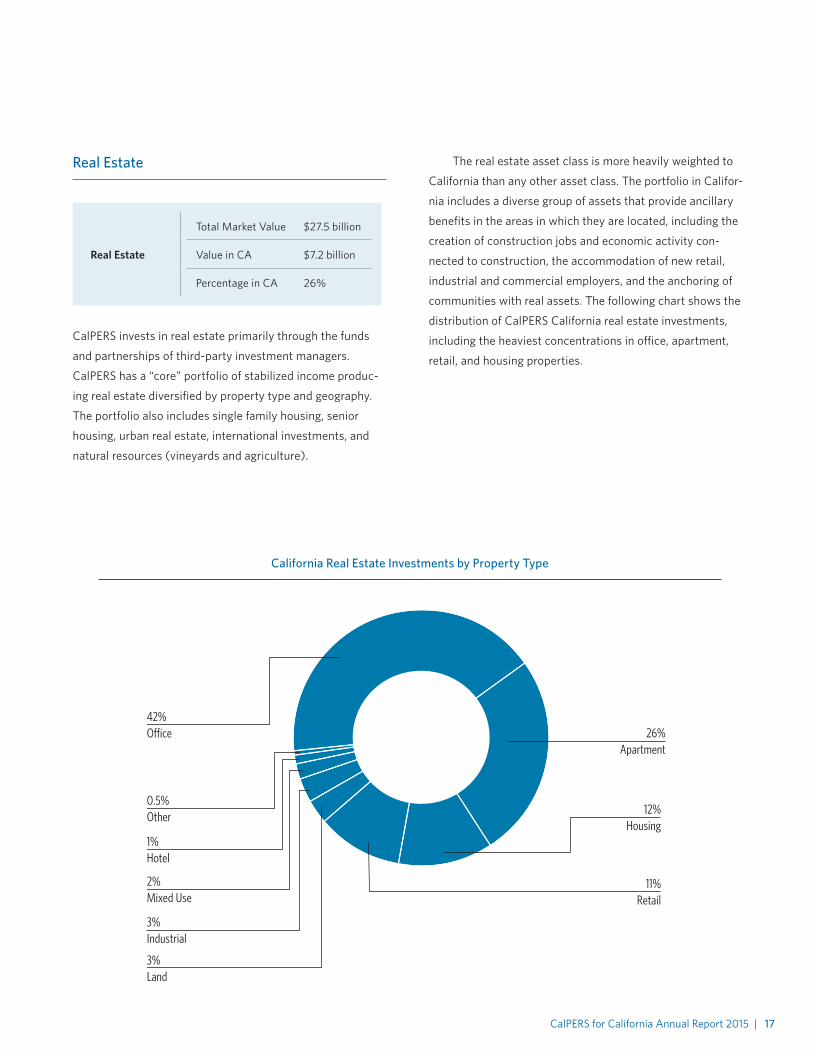
Real Estate
Real Estate
Total Market Value $27.5 billion
Value in CA $7.2 billion
Percentage in CA 26%
CalPERS invests in real estate primarily through the funds
and partnerships of third-party investment managers.
CalPERS has a “core” portfolio of stabilized income produc-
ing real estate diversified by property type and geography.
The portfolio also includes single family housing, senior
housing, urban real estate, international investments, and
natural resources (vineyards and agriculture).
The real estate asset class is more heavily weighted to
California than any other asset class. The portfolio in Califor-
nia includes a diverse group of assets that provide ancillary
benefits in the areas in which they are located, including the
creation of construction jobs and economic activity con-
nected to construction, the accommodation of new retail,
industrial and commercial employers, and the anchoring of
communities with real assets. The following chart shows the
distribution of CalPERS California real estate investments,
including the heaviest concentrations in office, apartment,
retail, and housing properties.
California Real Estate Investments by Property Type
42%O�ce
12%Housing
11%Retail
3%Land
3%Industrial
2%Mixed Use
1%Hotel
0.5%Other
26%Apartment
18 | CalPERS for California Annual Report 2015
An estimated $2.4 billion in capital from other institu-
tions is co-invested alongside CalPERS in California real
estate. CalPERS real estate investments support an
estimated 170,000 jobs statewide.20
CalPERS California real estate projects in the develop-
ment and construction phase support a total of 23,000 jobs.
The construction of CalPERS California real estate projects
not only supports workers within the construction industry,
but also indirectly supports workers throughout the state.21
Additionally, CalPERS California real estate investment
portfolio includes income-generating properties with high
occupancy levels such as neighborhood retail centers and
office buildings. These properties provide critical infrastruc-
ture and operating space to retail and professional service
providers supporting a total of 143,000 jobs. CalPERS
properties with high occupancy levels also support workers
within property management and other related industries.22
CalPERS Real Estate Portfolio in California: June 30, 2015
CalPERS CA Portfolio Value (in billions) $7.2
Other Co-Invested Dollars (in billions)1 $2.4
Number of Investments 233
Estimated Jobs in California2 170,000
1Value includes all other capital invested alongside CalPERS in the same real estate investments in the same third-party funds, partnerships and real estate investment trusts.
2See endnotes for estimated jobs in California methodology.
Forty-nine percent of CalPERS California real estate
investments dollars are located in LMI areas. Real estate
investments are often in Central Business Districts and
concentrated urban areas, where property investments of
all types are more readily available. These urban districts
typically include a larger proportion of LMI, High
Unemployment, and High Minority Areas.
Real Estate Ancillary Benefits in California1
Percentage of investments
Percentage of invested
dollars
High Unemployment Areas 35% 24%
Rural Areas 12% 7%
High Minority Areas 74% 66%
LMI Areas 49% 43%
1Ancillary benefits are based on the 229 California real estate investments for which valid ZIP code data was available.

CalPERS for California Annual Report 2015 | 19
Case Study: Oakland Logistics Center
The Oakland Logistics Center is a 375,000 square-foot
industrial building located in Oakland, California near the
San Leandro Bay. Built in 2014, it is a state-of-the-art
warehouse logistics facility supporting the distribution of
goods throughout California. In March 2015, real estate
investment manager Bentall Kennedy acquired the property
on behalf of CalPERS for $54.8 million. The building is fully
leased with two anchor tenants who have signed long-term
10-year leases, providing CalPERS with a stable and secure
income stream.
The Oakland Logistics Center is a long-term investment
for CalPERS that will serve the Oakland and California
economies for years to come. The building has received a
LEED Silver certification and its cross-dock design enables a
more efficient circulation of trucks and flow of goods in and
out of the facility. It is conveniently located near Oakland
International Airport, the Port of Oakland, FedEx and UPS
distribution facilities, and Interstate 880. The close proxim-
ity to transportation infrastructure significantly lowers the
cost of transporting goods for tenants. Together these
factors make the Oakland Logistics Center an attractive
distribution facility for current and future tenants.
Despite high market demand and low vacancy rates,
construction of important industrial facilities like the
Oakland Logistics Center has been limited due to the lack of
available land in Oakland. At the time of its construction, the
Oakland Logistics Center was the largest, state-of-the-art
industrial building developed in Oakland in the last 20 years.
Built on land formerly used as an airport parking lot, the
Oakland Logistics Center represents the conversion of an
existing, underutilized property to a higher and more
productive use.
With its cross-dock design, long-term lease commit-
ments, and the strong demand for distribution facilities in
the Bay Area, the Oakland Logistics Center demonstrates
CalPERS’ commitment to investing in high-quality California
real estate projects that support the growth and develop-
ment of California’s economy while providing stable,
attractive returns to CalPERS beneficiaries.
20 | CalPERS for California Annual Report 2015
Infrastructure
Infrastructure
Total Market Value $2.2 billion
Value in CA $119.4 million
Percentage in CA 5.4%
CalPERS searches for infrastructure opportunities in
sectors including transportation, energy, power, and water,
investing both directly, and in partnership with third-party
investment managers. CalPERS considers infrastructure
investments to have the potential to benefit local economic
development and provide essential community services
within the state.
CalPERS has $119.4 million invested through
commingled funds in infrastructure assets in California.
More than 90 percent ($107.5 million) of these invest-
ments are in projects providing reliable water supplies
to drought-prone areas.
Other institutions co-invested an estimated
$20.7 million alongside CalPERS in California infrastructure
projects. CalPERS infrastructure investments support
1,500 jobs statewide.23
CalPERS Infrastructure Portfolio in California: June 30, 2015
CalPERS CA Portfolio Value (in millions) $119.4
Other Co-Invested Dollars (in millions)1 $20.7
Number of Investments 6
Estimated Jobs in California 2 1,500
1Value includes all other capital invested alongside CalPERS in the same infrastructure projects.
2See endnotes for estimated jobs in California methodology.
CalPERS for California Annual Report 2015 | 21
Case Study: CalPeak Power and Midway Peaking
The California Peaker Portfolio, comprised of CalPeak Power
and Midway Peaking, is a portfolio of five natural gas-fired
peaking power plants located throughout the state of
California. Peaking power plants are facilities that only
operate during periods of high demand for electricity,
rapidly starting up to contribute power during these peak
times. The four 50 megawatt plants within the CalPeak
portfolio are located in close proximity to major population
centers, with two located near San Diego, one near San
Francisco, and one outside of Fresno. The Midway facility
is a 120 megawatt plant also located outside of Fresno.
While the Midway plant operates under a contract with
Pacific Gas & Electric through 2024, the CalPeak plants
sell electricity generation capacity to a number of utilities
under shorter, year-long contracts. All of the facilities are
overseen by a central control center located near San Diego.
In total, the portfolio employs 16 individuals in California.
CalPERS has invested $5.2 million in the CalPeak and
Midway facilities through its infrastructure investments with
global asset manager The Carlyle Group. CalPeak and
Midway represent attractive long-term investments given
the increasing role peaking power plants will play in meeting
California’s energy needs as the state progresses towards its
renewable energy goals. Since acquiring CalPeak Power and
Midway Peaking, hours of plant operation at the facilities
have increased, indicating growing need for peaking plant
energy generation to meet demand and ensure reliable
electricity delivery.
CalPERS investment in the CalPeak and Midway
facilities demonstrates its commitment to investing in
California infrastructure to produce stable, attractive
returns while also addressing California’s long-term
infrastructure needs.
22 | CalPERS for California Annual Report 2015
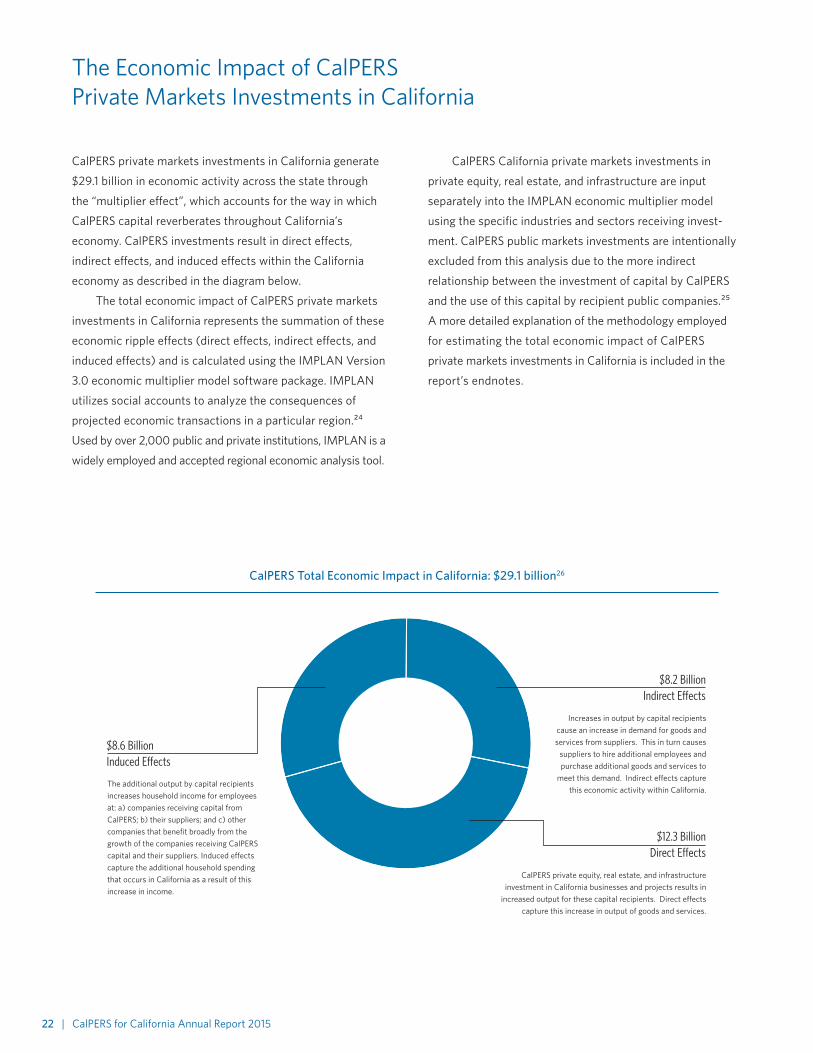
The Economic Impact of CalPERS Private Markets Investments in California
CalPERS private markets investments in California generate
$29.1 billion in economic activity across the state through
the “multiplier effect”, which accounts for the way in which
CalPERS capital reverberates throughout California’s
economy. CalPERS investments result in direct effects,
indirect effects, and induced effects within the California
economy as described in the diagram below.
The total economic impact of CalPERS private markets
investments in California represents the summation of these
economic ripple effects (direct effects, indirect effects, and
induced effects) and is calculated using the IMPLAN Version
3.0 economic multiplier model software package. IMPLAN
utilizes social accounts to analyze the consequences of
projected economic transactions in a particular region.²⁴
Used by over 2,000 public and private institutions, IMPLAN is a
widely employed and accepted regional economic analysis tool.
CalPERS California private markets investments in
private equity, real estate, and infrastructure are input
separately into the IMPLAN economic multiplier model
using the specific industries and sectors receiving invest-
ment. CalPERS public markets investments are intentionally
excluded from this analysis due to the more indirect
relationship between the investment of capital by CalPERS
and the use of this capital by recipient public companies.²⁵
A more detailed explanation of the methodology employed
for estimating the total economic impact of CalPERS
private markets investments in California is included in the
report’s endnotes.
$12.3 BillionDirect E�ects
$8.2 BillionIndirect E�ects
$8.6 BillionInduced E�ects
CalPERS Total Economic Impact in California: $29.1 billion26
The additional output by capital recipients increases household income for employees at: a) companies receiving capital from CalPERS; b) their suppliers; and c) other companies that benefit broadly from the growth of the companies receiving CalPERS capital and their suppliers. Induced effects capture the additional household spending that occurs in California as a result of this increase in income.
Increases in output by capital recipients cause an increase in demand for goods and services from suppliers. This in turn causes
suppliers to hire additional employees and purchase additional goods and services to
meet this demand. Indirect effects capture this economic activity within California.
CalPERS private equity, real estate, and infrastructure investment in California businesses and projects results in
increased output for these capital recipients. Direct effects capture this increase in output of goods and services.

CalPERS for California Annual Report 2015 | 23
Conclusion
CalPERS is the nation’s largest pension system and, like all
institutional investors, plays an important role in sustaining
and growing all of the companies, properties, and projects
in which it invests, not least in California.
CalPERS invests $27.8 billion (9.2 percent) of its
$302 billion in assets in California, including in the state’s
underserved communities. CalPERS private markets
investments in California generate $29.1 billion in economic
activity and provide significant ancillary benefits resulting from
the magnitude and breadth of CalPERS presence in the state.
CalPERS will continue to pursue California-based
investment opportunities grounded in the historic strength
of the state economy, seeking attractive risk-adjusted
financial returns. CalPERS for California demonstrates
CalPERS ongoing commitment to rigorously track and
report on these efforts.
24 | CalPERS for California Annual Report 2015
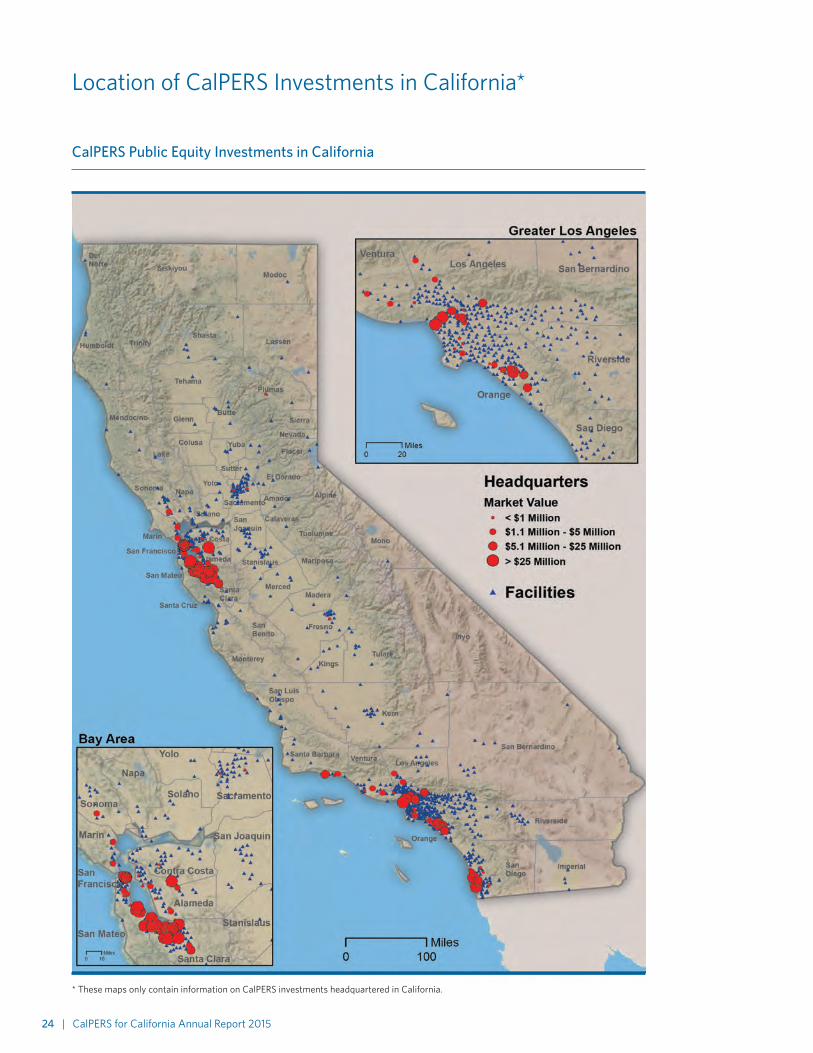
CalPERS Public Equity Investments in California
Location of CalPERS Investments in California*
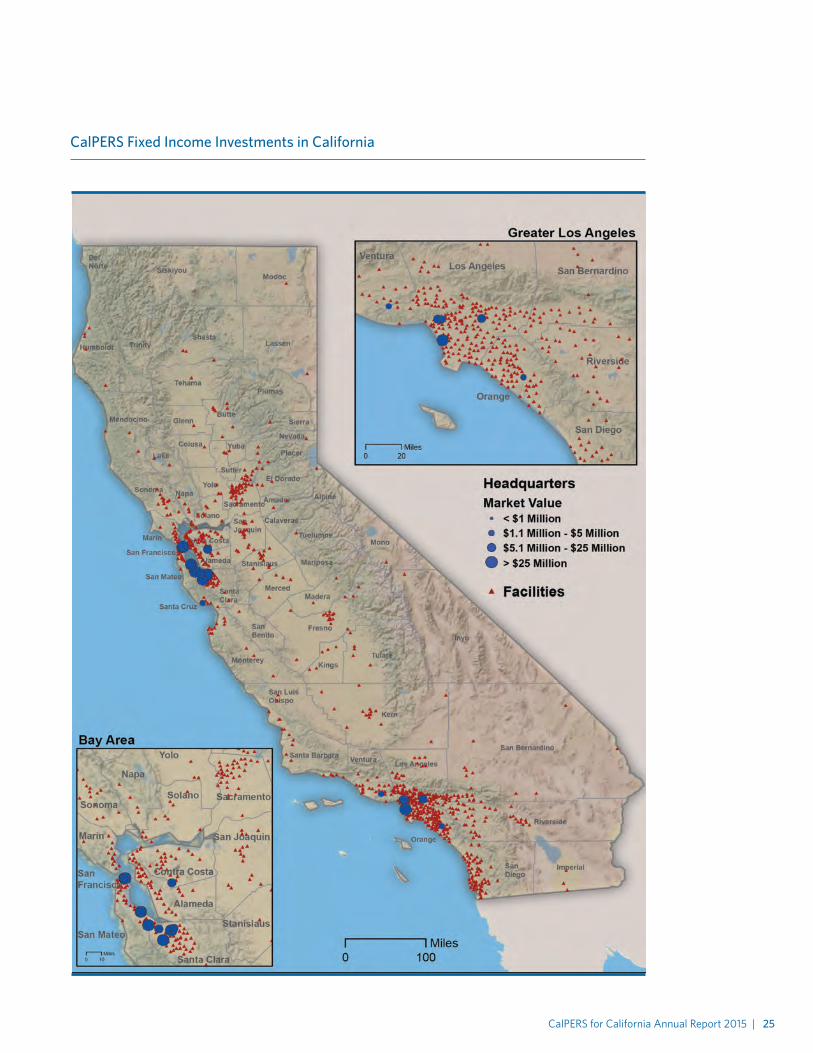
* These maps only contain information on CalPERS investments headquartered in California.
CalPERS for California Annual Report 2015 | 25
CalPERS Fixed Income Investments in California

26 | CalPERS for California Annual Report 2015
CalPERS Private Equity Investments in California

CalPERS for California Annual Report 2015 | 27
CalPERS Real Estate and Infrastructure Investments in California

28 | CalPERS for California Annual Report 2015
Endnotes
1 CalPERS Total Fund Monthly Update: Month Ending June 30, 2015, available at https://www.calpers.ca.gov/ docs/board-agendas/201508/invest/item06b-01.pdf
2 CalPERS has made corporate bond investments in 63 California-headquartered companies. Of the 63 companies, 19 have received direct investments from CalPERS and 49 have received investment indirectly through CalPERS external managers, with five companies receiving investments both directly and indirectly. The jobs estimate for fixed income is based only on the 19 companies receiving direct investments from CalPERS. The average size of these invest-ments is $38.1 million. The average size of external manager corporate bond investments in California companies is $2.6 million.
3 The capital that CalPERS invests in California is usually not explicitly directed to the state, but is the consequence of a typical institutional investment process weighing the financial merits of particular companies, properties and projects, regardless of location. The size and dynamism of California’s economy are the primary drivers of CalPERS significant exposure to local communities and the related benefits that this brings, like job creation.
The research methods in this report are fully documented in footnotes. The difficulty of directly attributing ancillary benefits to CalPERS is especially notable and explains why public market and private market investments are discussed separately in CalPERS for California.
The data in this report offers a snapshot of CalPERS invest-ments and has been analyzed by Pacific Community Ventures (PCV), a third-party research organization.
4 U.S. Bureau of Economic Analysis, Regional Economic Accounts, available at www.bea.gov/regional/index.htm
5 2015-2016 Economic Forecast and Industry Outlook, The Kyser Center for Economic Research at http://laedc.org/wp-content/uploads/2015/02/LAEDC-February-2015- Forecast-Report.pdf
6 Hoovers Inc. online database of publicly traded companies. Hoovers Inc. is a Dun & Bradstreet company.
7 Private Equity Growth Council, http://www.privateequityatwork.com/state-by-state/
8 U.S. Census Bureau, available at www.census.gov/ foreign-trade/statistics/state/data/ca.html
9 The analysis is based on a 3% sample of all non-California headquartered companies (n=278). Assumptions about the entire portfolio should therefore be considered illustrative, but not conclusive. The employment assumption for California-headquartered public companies (that employees are spread evenly at all facilities) likely underestimates the actual number of California employees, since more employees are typically located in facilities at, or closer to, a company’s headquarters. The same analysis would likely significantly overestimate the number of California employees of companies headquartered elsewhere – a problem compounded by the smaller sample size and larger number of companies.
10 The fixed income asset class includes five distinct invest-ment programs. Only publicly available data was used to conduct analysis for this asset class, which was available only for companies that issued corporate bonds. According to the state of domicile, 63 corporate bond issuers (and $850 million in investments) are considered California companies.
11 CalPERS has made corporate bond investments in 63 California-headquartered companies. Of the 63 companies, 19 have received direct investments from CalPERS and 49 have received investment indirectly through CalPERS external managers, with five companies receiving investments both directly and indirectly. The jobs estimate for fixed income is based only on the 19 companies receiving direct invest-ments from CalPERS. The average size of these investments is $38.1 million. The average size of external manager corporate bond investments in California companies is $2.6 million.
The 19 companies that received direct corporate bond investment from CalPERS are also part of CalPERS Public Equity portfolio. Job estimates cannot be combined as this would constitute double counting of 19 large companies.
12 The analysis is based on a 10 percent sample of all non-California headquartered companies (n=37). Assumptions about the entire portfolio should therefore be considered illustrative, but not conclusive. The employment assumption for California-headquartered public companies (that employ-ees are spread evenly at all facilities) likely underestimates the actual number of California employees, since more employees are typically located in facilities at, or closer to, a company’s headquarters. The same analysis would likely significantly overestimate the number of California employees of compa-nies headquartered elsewhere – a problem compounded by the smaller sample size and larger number of companies.
CalPERS for California Annual Report 2015 | 29
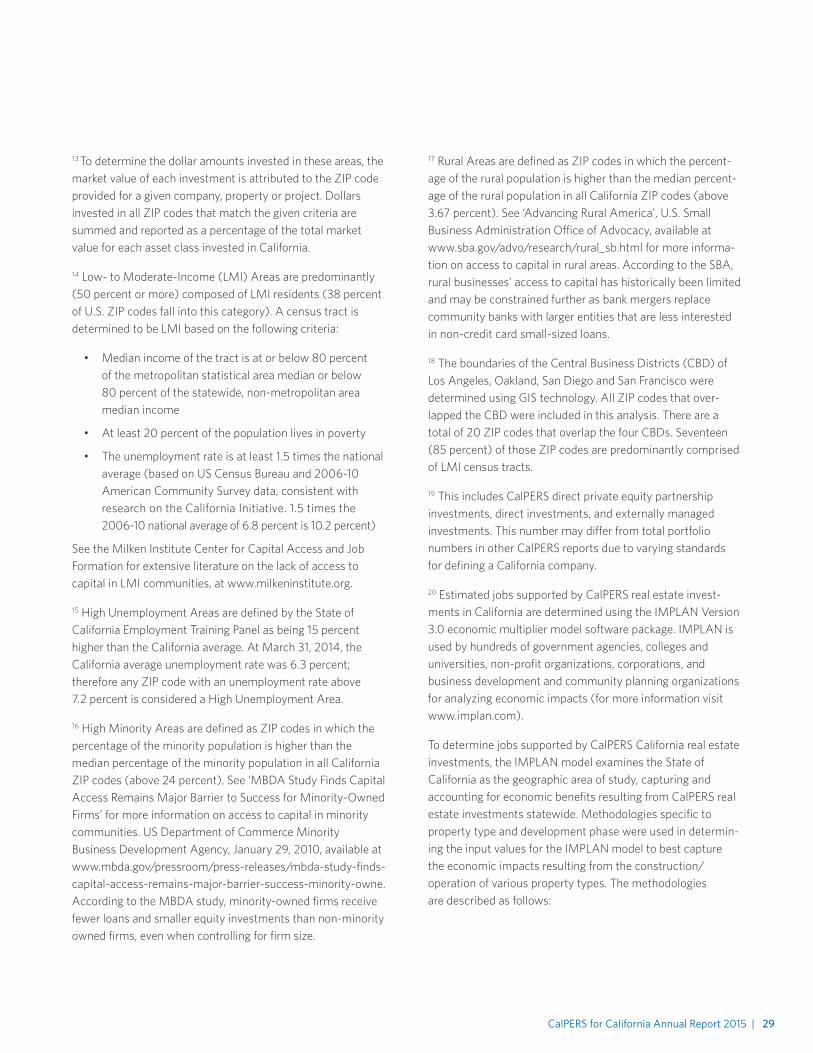
13 To determine the dollar amounts invested in these areas, the market value of each investment is attributed to the ZIP code provided for a given company, property or project. Dollars invested in all ZIP codes that match the given criteria are summed and reported as a percentage of the total market value for each asset class invested in California.
14 Low- to Moderate-Income (LMI) Areas are predominantly (50 percent or more) composed of LMI residents (38 percent of U.S. ZIP codes fall into this category). A census tract is determined to be LMI based on the following criteria:
• Median income of the tract is at or below 80 percent of the metropolitan statistical area median or below 80 percent of the statewide, non-metropolitan area median income
• At least 20 percent of the population lives in poverty
• The unemployment rate is at least 1.5 times the national average (based on US Census Bureau and 2006-10 American Community Survey data, consistent with research on the California Initiative. 1.5 times the 2006-10 national average of 6.8 percent is 10.2 percent)
See the Milken Institute Center for Capital Access and Job Formation for extensive literature on the lack of access to capital in LMI communities, at www.milkeninstitute.org.
15 High Unemployment Areas are defined by the State of California Employment Training Panel as being 15 percent higher than the California average. At March 31, 2014, the California average unemployment rate was 6.3 percent; therefore any ZIP code with an unemployment rate above 7.2 percent is considered a High Unemployment Area.
16 High Minority Areas are defined as ZIP codes in which the percentage of the minority population is higher than the median percentage of the minority population in all California ZIP codes (above 24 percent). See ‘MBDA Study Finds Capital Access Remains Major Barrier to Success for Minority-Owned Firms’ for more information on access to capital in minority communities. US Department of Commerce Minority Business Development Agency, January 29, 2010, available at www.mbda.gov/pressroom/press-releases/mbda-study-finds-capital-access-remains-major-barrier-success-minority-owne. According to the MBDA study, minority-owned firms receive fewer loans and smaller equity investments than non-minority owned firms, even when controlling for firm size.
17 Rural Areas are defined as ZIP codes in which the percent-age of the rural population is higher than the median percent-age of the rural population in all California ZIP codes (above 3.67 percent). See ‘Advancing Rural America’, U.S. Small Business Administration Office of Advocacy, available at www.sba.gov/advo/research/rural_sb.html for more informa-tion on access to capital in rural areas. According to the SBA, rural businesses’ access to capital has historically been limited and may be constrained further as bank mergers replace community banks with larger entities that are less interested in non-credit card small-sized loans.
18 The boundaries of the Central Business Districts (CBD) of Los Angeles, Oakland, San Diego and San Francisco were determined using GIS technology. All ZIP codes that over-lapped the CBD were included in this analysis. There are a total of 20 ZIP codes that overlap the four CBDs. Seventeen (85 percent) of those ZIP codes are predominantly comprised of LMI census tracts.
19 This includes CalPERS direct private equity partnership investments, direct investments, and externally managed investments. This number may differ from total portfolio numbers in other CalPERS reports due to varying standards for defining a California company.
20 Estimated jobs supported by CalPERS real estate invest-ments in California are determined using the IMPLAN Version 3.0 economic multiplier model software package. IMPLAN is used by hundreds of government agencies, colleges and universities, non-profit organizations, corporations, and business development and community planning organizations for analyzing economic impacts (for more information visit www.implan.com).
To determine jobs supported by CalPERS California real estate investments, the IMPLAN model examines the State of California as the geographic area of study, capturing and accounting for economic benefits resulting from CalPERS real estate investments statewide. Methodologies specific to property type and development phase were used in determin-ing the input values for the IMPLAN model to best capture the economic impacts resulting from the construction/operation of various property types. The methodologies are described as follows:
30 | CalPERS for California Annual Report 2015
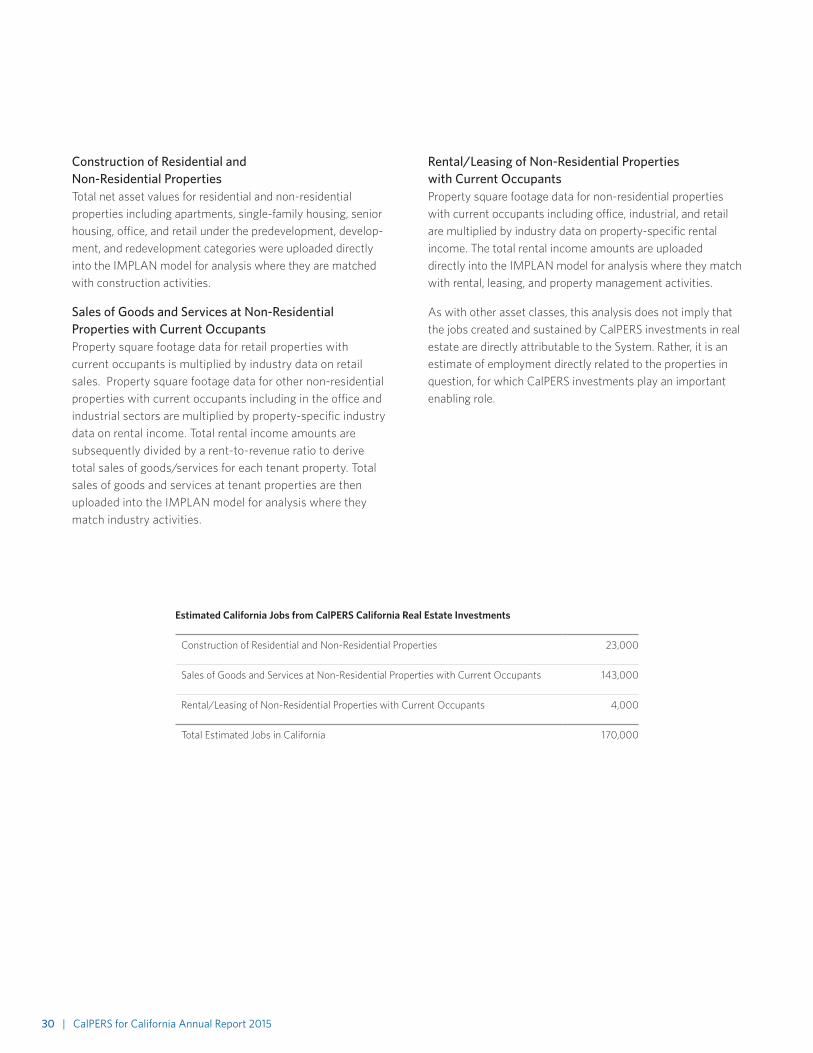
Construction of Residential and Non-Residential PropertiesTotal net asset values for residential and non-residential properties including apartments, single-family housing, senior housing, office, and retail under the predevelopment, develop-ment, and redevelopment categories were uploaded directly into the IMPLAN model for analysis where they are matched with construction activities.
Sales of Goods and Services at Non-Residential Properties with Current OccupantsProperty square footage data for retail properties with current occupants is multiplied by industry data on retail sales. Property square footage data for other non-residential properties with current occupants including in the office and industrial sectors are multiplied by property-specific industry data on rental income. Total rental income amounts are subsequently divided by a rent-to-revenue ratio to derive total sales of goods/services for each tenant property. Total sales of goods and services at tenant properties are then uploaded into the IMPLAN model for analysis where they match industry activities.
Rental/Leasing of Non-Residential Properties with Current OccupantsProperty square footage data for non-residential properties with current occupants including office, industrial, and retail are multiplied by industry data on property-specific rental income. The total rental income amounts are uploaded directly into the IMPLAN model for analysis where they match with rental, leasing, and property management activities.
As with other asset classes, this analysis does not imply that the jobs created and sustained by CalPERS investments in real estate are directly attributable to the System. Rather, it is an estimate of employment directly related to the properties in question, for which CalPERS investments play an important enabling role.
Estimated California Jobs from CalPERS California Real Estate Investments
Construction of Residential and Non-Residential Properties 23,000
Sales of Goods and Services at Non-Residential Properties with Current Occupants 143,000
Rental/Leasing of Non-Residential Properties with Current Occupants 4,000
Total Estimated Jobs in California 170,000
CalPERS for California Annual Report 2015 | 31
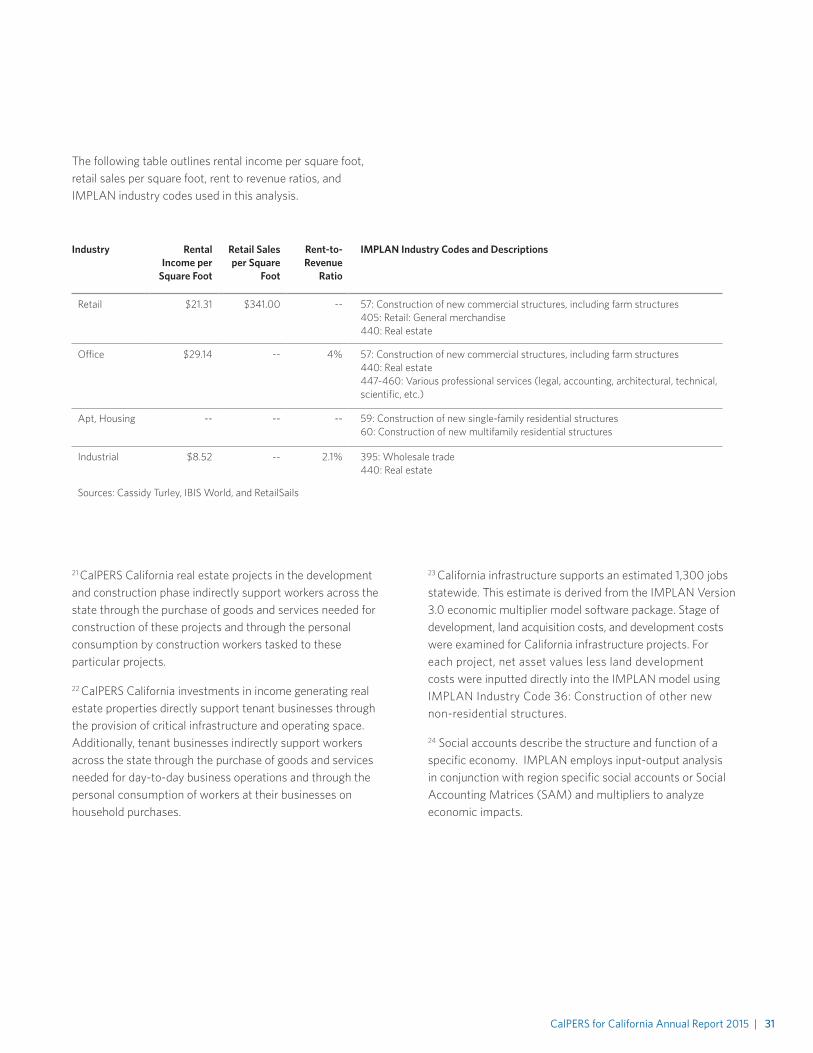
The following table outlines rental income per square foot, retail sales per square foot, rent to revenue ratios, and IMPLAN industry codes used in this analysis.
Industry Rental Income per
Square Foot
Retail Sales per Square
Foot
Rent-to-Revenue
Ratio
IMPLAN Industry Codes and Descriptions
Retail $21.31 $341.00 -- 57: Construction of new commercial structures, including farm structures 405: Retail: General merchandise 440: Real estate
Office $29.14 -- 4% 57: Construction of new commercial structures, including farm structures 440: Real estate 447-460: Various professional services (legal, accounting, architectural, technical, scientific, etc.)
Apt, Housing -- -- -- 59: Construction of new single-family residential structures 60: Construction of new multifamily residential structures
Industrial $8.52 -- 2.1% 395: Wholesale trade 440: Real estate
Sources: Cassidy Turley, IBIS World, and RetailSails
21 CalPERS California real estate projects in the development and construction phase indirectly support workers across the state through the purchase of goods and services needed for construction of these projects and through the personal consumption by construction workers tasked to these particular projects.
22 CalPERS California investments in income generating real estate properties directly support tenant businesses through the provision of critical infrastructure and operating space. Additionally, tenant businesses indirectly support workers across the state through the purchase of goods and services needed for day-to-day business operations and through the personal consumption of workers at their businesses on household purchases.
23 California infrastructure supports an estimated 1,300 jobs statewide. This estimate is derived from the IMPLAN Version 3.0 economic multiplier model software package. Stage of development, land acquisition costs, and development costs were examined for California infrastructure projects. For each project, net asset values less land development costs were inputted directly into the IMPLAN model using IMPLAN Industry Code 36: Construction of other new non-residential structures.
24 Social accounts describe the structure and function of a specific economy. IMPLAN employs input-output analysis in conjunction with region specific social accounts or Social Accounting Matrices (SAM) and multipliers to analyze economic impacts.

32 | CalPERS for California Annual Report 2015
25 IMPLAN cannot be applied to CalPERS public markets investments in California, for the following reasons:
1. Attribution: CalPERS cannot directly tie its provision of capital to the operations and economic activity occurring at California headquartered public companies given it is one of many investors in these businesses.
2. Overestimation: Applying the IMPLAN economic multiplier model to CalPERS public markets investments in California would overstate CalPERS total economic impact.
3. Area of Study Limitations: IMPLAN is an input-output economic multiplier model that requires a set geographic area of study. As California headquartered public compa-nies have a significant number of facilities and operations in and outside of California it is difficult to specify what proportion of CalPERS investment in these companies is injected directly into California’s economy, limiting the accuracy of the resulting total economic impact figure.
26 To determine the total economic impact of CalPERS California private markets investments in private equity, real estate, and infrastructure, the IMPLAN model examines the State of California as the geographic area of study, captur-ing and accounting for economic benefits resulting from CalPERS investments statewide. Methodologies specific to each asset class were used in determining the input values for the IMPLAN model to best capture the economic impacts resulting from the CalPERS investments. The methodologies are described below:
Private Equity Investments CalPERS private equity investment amounts in California private companies are uploaded directly into the IMPLAN model alongside an industry spending pattern that matches each company’s industry or sector. Only CalPERS direct partnership investments and investments through third party investment managers were included in this analysis. Sector/industry data was available for $2.9 billion of CalPERS California private equity investments. The $2.9 billion CalPERS invests in California private companies is distributed across 54 industries based upon each company’s industry and the amount of capital that company has received. For the $283 million of investments where sector/industry data was not available, our analysis assumes they reflect the same industry/sector distribution as the wider portfolio. Accord-ingly, the remaining $283 million has been distributed pro rata amongst the portfolio’s 54 sectors.
Real Estate Investments CalPERS investment amounts in California real estate projects are uploaded into the IMPLAN model to capture the economic impacts resulting from the construction/operation of various property types. The same methodology that is used to calculate jobs supported by CalPERS California real estate investments is used to calculate the total economic impact resulting from CalPERS California real estate investments. This methodology is described in greater detail above in endnote 20.
Infrastructure Investments CalPERS investment amounts in California infrastructure projects are uploaded into the IMPLAN model to capture the economic impacts resulting from the construction/operation of various projects. The same methodology that is used to calculate jobs supported by CalPERS California infrastructure investments is used to calculate the total economic impact resulting from CalPERS California infrastructure investments. This methodology is described in greater detail above in endnote 23.
CalPERS for California Annual Report 2015 | 33
CalPERS Profile
The California Public Employees’ Retirement System (CalPERS) is the nation’s largest public pension fund
with assets of approximately $296 billion as of April 2016.
Headquartered in Sacramento, CalPERS provides retirement and health benefit services to more
than 1.8 million members and more than 3,000 school and public employers. The System also operates
8 Regional Offices located in Fresno, Glendale, Orange, Sacramento, San Diego, San Bernardino, San Jose,
and Walnut Creek. Led by a 13-member Board of Administration, consisting of member-elected, appointed, and
ex officio members, CalPERS membership consists of approximately 1.2 million active and inactive members
and more than 600,000 retirees, beneficiaries, and survivors from State, school and public agencies.
Established by legislation in 1931, the System became operational in 1932 for the purpose of providing
a secure retirement to State employees who dedicate their careers to public service. In 1939, new legislation
allowed public agency and classified school employees to join the System for retirement benefits. CalPERS
began administering health benefits for State employees in 1962, and 5 years later, public agencies joined
the Health Program on a contract basis.
A defined benefit retirement plan, CalPERS provides benefits based on a member’s years of service,
age, and highest compensation. In addition, benefits are provided for disability and death.
Today CalPERS offers additional programs, including a deferred compensation retirement savings plan,
member education services, and an employer trust for post-retirement benefits. Learn more at our website
at www.calpers.ca.gov.

California Public Employees’ Retirement System400 Q Street | Sacramento, CA 95811
www.calpers.ca.gov
For more information, please contact: Pacific Community Ventures | www.pacificcommunityventures.org
May 2016