Embed Size (px)
Citation preview

Call My Cell:Wireless Substitution in the United States
September 2008
1 Blumberg SJ, Luke JV. Wireless substitution: Early release of estimates from the National Health Interview Survey (NHIS), July–December 2007. National Center for Health Statistics. Available from: http://www.cdc.gov/nchs/nhis.htm. May 13, 2008.
2 Nielsen Mobile Wireless Substitution Model, Q2 20083 Nielsen Wireless Substitution Report, Q2 2008
2Copyright © 2008 The Nielsen Company. All rights reserved.
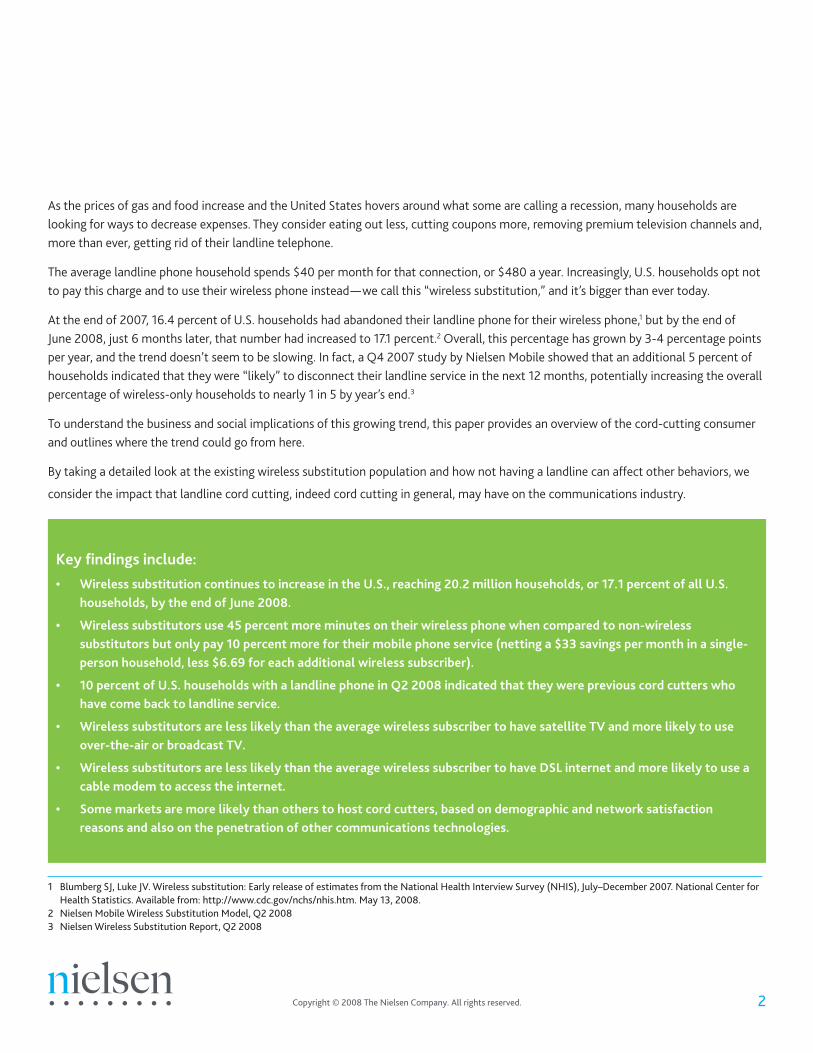
As the prices of gas and food increase and the United States hovers around what some are calling a recession, many households are looking for ways to decrease expenses. They consider eating out less, cutting coupons more, removing premium television channels and, more than ever, getting rid of their landline telephone.
The average landline phone household spends $40 per month for that connection, or $480 a year. Increasingly, U.S. households opt not to pay this charge and to use their wireless phone instead—we call this “wireless substitution,” and it’s bigger than ever today.
At the end of 2007, 16.4 percent of U.S. households had abandoned their landline phone for their wireless phone,1 but by the end of June 2008, just 6 months later, that number had increased to 17.1 percent.2 Overall, this percentage has grown by 3-4 percentage points per year, and the trend doesn’t seem to be slowing. In fact, a Q4 2007 study by Nielsen Mobile showed that an additional 5 percent of households indicated that they were “likely” to disconnect their landline service in the next 12 months, potentially increasing the overall percentage of wireless-only households to nearly 1 in 5 by year’s end.3
To understand the business and social implications of this growing trend, this paper provides an overview of the cord-cutting consumer and outlines where the trend could go from here.
By taking a detailed look at the existing wireless substitution population and how not having a landline can affect other behaviors, we
consider the impact that landline cord cutting, indeed cord cutting in general, may have on the communications industry.
Key findings include:
• WirelesssubstitutioncontinuestoincreaseintheU.S.,reaching20.2millionhouseholds,or17.1percentofallU.S.households,bytheendofJune2008.
• Wirelesssubstitutorsuse45percentmoreminutesontheirwirelessphonewhencomparedtonon-wirelesssubstitutorsbutonlypay10percentmorefortheirmobilephoneservice(nettinga$33savingspermonthinasingle-personhousehold,less$6.69foreachadditionalwirelesssubscriber).
• 10percentofU.S.householdswithalandlinephoneinQ22008indicatedthattheywerepreviouscordcutterswhohavecomebacktolandlineservice.
• WirelesssubstitutorsarelesslikelythantheaveragewirelesssubscribertohavesatelliteTVandmorelikelytouseover-the-airorbroadcastTV.
• WirelesssubstitutorsarelesslikelythantheaveragewirelesssubscribertohaveDSLinternetandmorelikelytouseacablemodemtoaccesstheinternet.
• Somemarketsaremorelikelythanotherstohostcordcutters,basedondemographicandnetworksatisfactionreasonsandalsoonthepenetrationofothercommunicationstechnologies.

4Copyright © 2008 The Nielsen Company. All rights reserved.
Call My Cell: Wireless Substitution in the United States
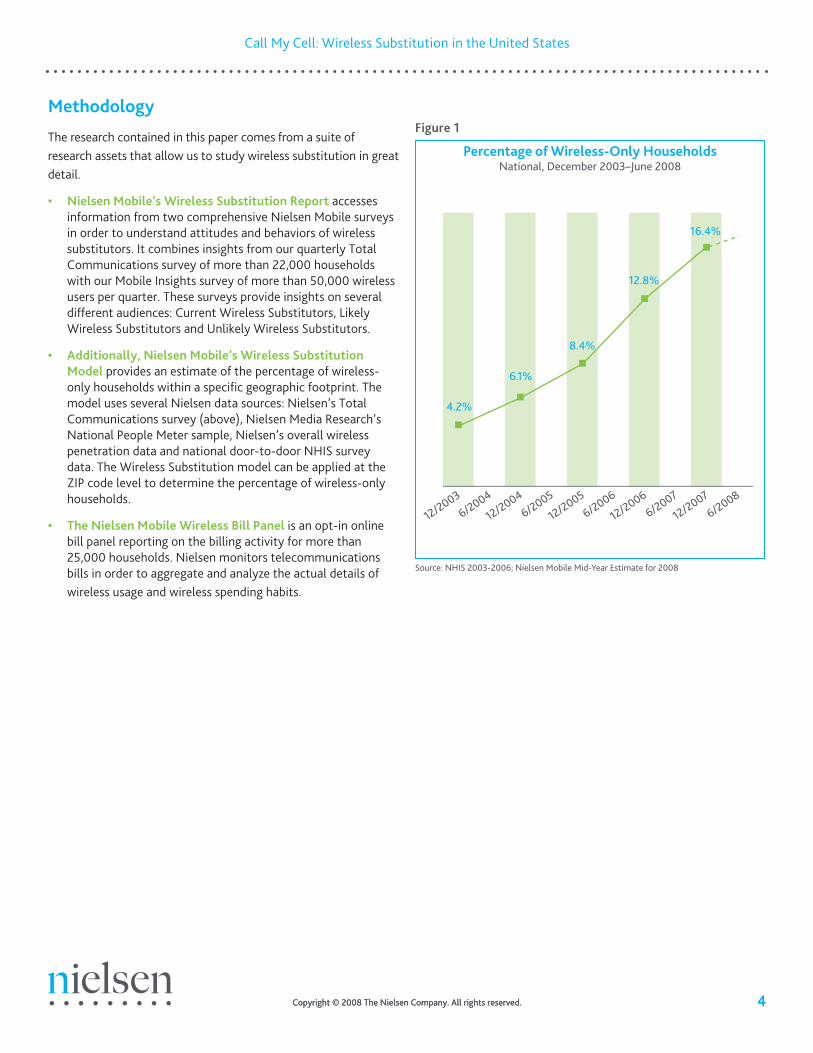
Methodology
The research contained in this paper comes from a suite of research assets that allow us to study wireless substitution in great detail.
• NielsenMobile’sWirelessSubstitutionReport accesses information from two comprehensive Nielsen Mobile surveys in order to understand attitudes and behaviors of wireless substitutors. It combines insights from our quarterly Total Communications survey of more than 22,000 households with our Mobile Insights survey of more than 50,000 wireless users per quarter. These surveys provide insights on several different audiences: Current Wireless Substitutors, Likely Wireless Substitutors and Unlikely Wireless Substitutors.
• Additionally,NielsenMobile’sWirelessSubstitutionModelprovides an estimate of the percentage of wireless-only households within a specific geographic footprint. The model uses several Nielsen data sources: Nielsen’s Total Communications survey (above), Nielsen Media Research’s National People Meter sample, Nielsen’s overall wireless penetration data and national door-to-door NHIS survey data. The Wireless Substitution model can be applied at the ZIP code level to determine the percentage of wireless-only households.
• TheNielsenMobileWirelessBillPanelis an opt-in online bill panel reporting on the billing activity for more than 25,000 households. Nielsen monitors telecommunications bills in order to aggregate and analyze the actual details of wireless usage and wireless spending habits.
4Copyright © 2008 The Nielsen Company. All rights reserved.
6/2008
12/20076/2007
12/20066/2006
12/20056/2005
12/20046/2004
12/2003
16.4%
12.8%
8.4%
6.1%
4.2%
Figure1
Source: NHIS 2003-2006; Nielsen Mobile Mid-Year Estimate for 2008
PercentageofWireless-OnlyHouseholdsNational, December 2003–June 2008
5 Copyright © 2008 The Nielsen Company. All rights reserved.
Call My Cell: Wireless Substitution in the United States
5 Copyright © 2008 The Nielsen Company. All rights reserved.
Whodoesn’thavealandline?
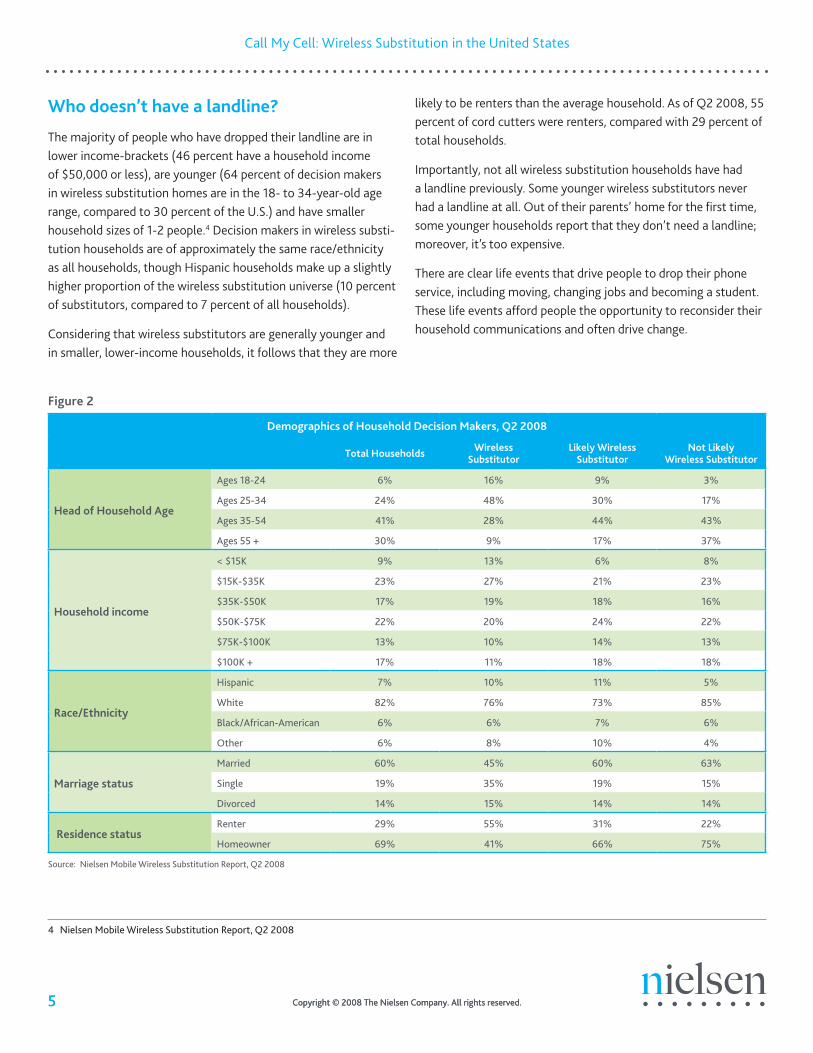
The majority of people who have dropped their landline are in lower income-brackets (46 percent have a household income of $50,000 or less), are younger (64 percent of decision makers in wireless substitution homes are in the 18- to 34-year-old age range, compared to 30 percent of the U.S.) and have smaller household sizes of 1-2 people.4 Decision makers in wireless substi-tution households are of approximately the same race/ethnicity as all households, though Hispanic households make up a slightly higher proportion of the wireless substitution universe (10 percent of substitutors, compared to 7 percent of all households).
Considering that wireless substitutors are generally younger and in smaller, lower-income households, it follows that they are more
likely to be renters than the average household. As of Q2 2008, 55 percent of cord cutters were renters, compared with 29 percent of total households.
Importantly, not all wireless substitution households have had a landline previously. Some younger wireless substitutors never had a landline at all. Out of their parents’ home for the first time, some younger households report that they don’t need a landline; moreover, it’s too expensive.
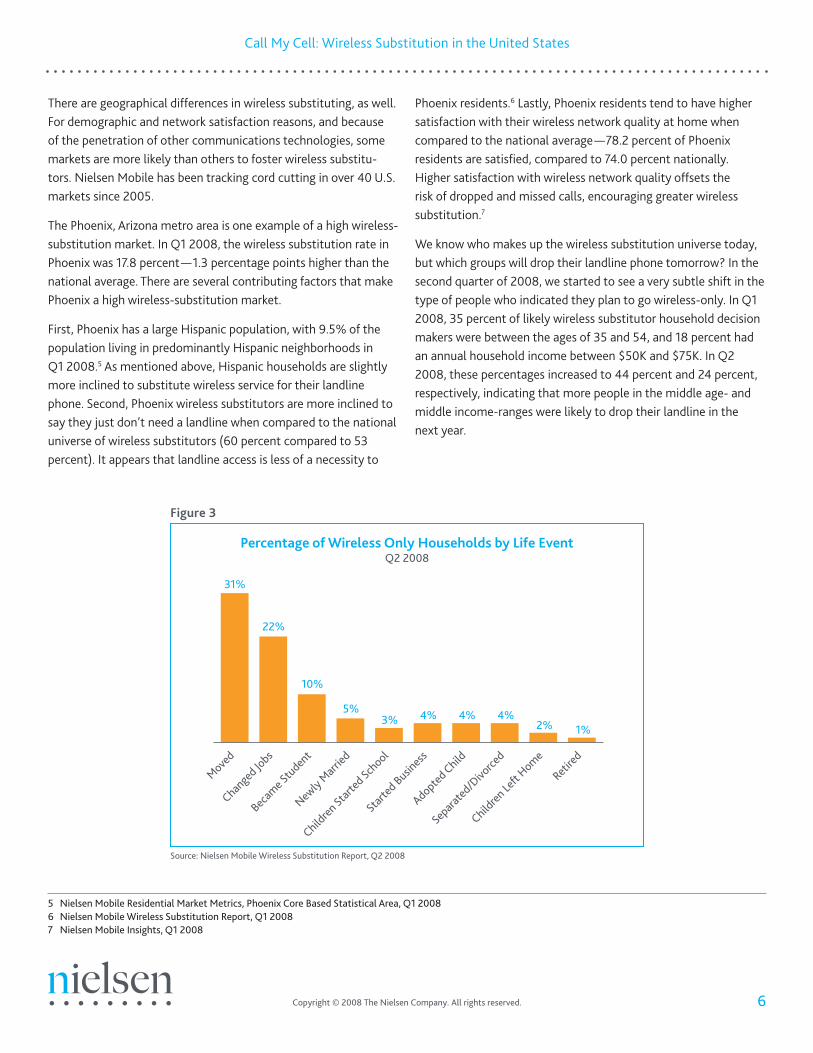
There are clear life events that drive people to drop their phone service, including moving, changing jobs and becoming a student. These life events afford people the opportunity to reconsider their household communications and often drive change.
4 Nielsen Mobile Wireless Substitution Report, Q2 2008
Source: Nielsen Mobile Wireless Substitution Report, Q2 2008
Figure2
DemographicsofHouseholdDecisionMakers,Q22008
TotalHouseholds Wireless Substitutor
LikelyWireless Substitutor
NotLikely WirelessSubstitutor
HeadofHouseholdAge
Ages 18-24 6% 16% 9% 3%
Ages 25-34 24% 48% 30% 17%
Ages 35-54 41% 28% 44% 43%
Ages 55 + 30% 9% 17% 37%
Householdincome
< $15K 9% 13% 6% 8%
$15K-$35K 23% 27% 21% 23%
$35K-$50K 17% 19% 18% 16%
$50K-$75K 22% 20% 24% 22%
$75K-$100K 13% 10% 14% 13%
$100K + 17% 11% 18% 18%
Race/Ethnicity
Hispanic 7% 10% 11% 5%
White 82% 76% 73% 85%
Black/African-American 6% 6% 7% 6%
Other 6% 8% 10% 4%
Marriagestatus
Married 60% 45% 60% 63%
Single 19% 35% 19% 15%
Divorced 14% 15% 14% 14%
ResidencestatusRenter 29% 55% 31% 22%
Homeowner 69% 41% 66% 75%
6Copyright © 2008 The Nielsen Company. All rights reserved.
Call My Cell: Wireless Substitution in the United States
There are geographical differences in wireless substituting, as well. For demographic and network satisfaction reasons, and because of the penetration of other communications technologies, some markets are more likely than others to foster wireless substitu-tors. Nielsen Mobile has been tracking cord cutting in over 40 U.S. markets since 2005.
The Phoenix, Arizona metro area is one example of a high wireless-substitution market. In Q1 2008, the wireless substitution rate in Phoenix was 17.8 percent—1.3 percentage points higher than the national average. There are several contributing factors that make Phoenix a high wireless-substitution market.
First, Phoenix has a large Hispanic population, with 9.5% of the population living in predominantly Hispanic neighborhoods in Q1 2008.5 As mentioned above, Hispanic households are slightly more inclined to substitute wireless service for their landline phone. Second, Phoenix wireless substitutors are more inclined to say they just don’t need a landline when compared to the national universe of wireless substitutors (60 percent compared to 53 percent). It appears that landline access is less of a necessity to
Phoenix residents.6 Lastly, Phoenix residents tend to have higher satisfaction with their wireless network quality at home when compared to the national average—78.2 percent of Phoenix residents are satisfied, compared to 74.0 percent nationally. Higher satisfaction with wireless network quality offsets the risk of dropped and missed calls, encouraging greater wireless substitution.7
We know who makes up the wireless substitution universe today, but which groups will drop their landline phone tomorrow? In the second quarter of 2008, we started to see a very subtle shift in the type of people who indicated they plan to go wireless-only. In Q1 2008, 35 percent of likely wireless substitutor household decision makers were between the ages of 35 and 54, and 18 percent had an annual household income between $50K and $75K. In Q2 2008, these percentages increased to 44 percent and 24 percent, respectively, indicating that more people in the middle age- and middle income-ranges were likely to drop their landline in the next year.
Retired
Children
Left
Home
Separa
ted/D
ivorce
d
Adopted Child
Started
Busines
s
Children
Started
School
Newly M
arried
Becam
e Stu
dent
Changed
Jobs
Moved
31%
22%
10%
5%3% 4% 4% 4%
2% 1%
Figure3
Source: Nielsen Mobile Wireless Substitution Report, Q2 2008
PercentageofWirelessOnlyHouseholdsbyLifeEventQ2 2008
5 Nielsen Mobile Residential Market Metrics, Phoenix Core Based Statistical Area, Q1 20086 Nielsen Mobile Wireless Substitution Report, Q1 20087 Nielsen Mobile Insights, Q1 2008

7 Copyright © 2008 The Nielsen Company. All rights reserved.
Call My Cell: Wireless Substitution in the United States
Andwhycutthecord?
For the expanding penetration and diversity in the wireless substi-tution universe, there remains fundamentally just one main reason households cut the cord: to save money. And it’s working.
Nielsen reports that, additional wireless expenditures considered, the average wireless substituting household saves $33 per month when moving to wireless only.
Although we started this paper by saying that the average landline service costs a U.S. household $40 per month, the savings are not as straightforward. Nielsen’s research shows that wireless substi-tutors tend to use a greater number of wireless minutes than their landline-enabled counterparts and spend more per month, overall, on their wireless services.
Minutes of use is a key metric for wireless plans and is the best way to compare usage between cord cutters and non-cord cutters. In the first quarter of this year, wireless substitutors used an average of 1,074 total minutes each month, compared to an average of 742 for non-wireless substitutors8—an additional 332 minutes, or 45 percent more minutes per month.
To look at the difference in expenditures between wireless substitutors and their landline peers, we compare billing data for the two groups from Nielsen Mobile’s wireless bill panel. In Q1 2008, wireless substitutors (postpaid, personal-liable only) spent an average of only $6.69 more per month when compared to someone with a landline phone ($75.55 for wireless substitutors, compared to $68.86 for non-substitutors). While substitutors saved an average of $40 per month by not having a landline phone, they paid an extra $6.69 a month on their wireless bill, on average, netting a savings of $33 per month per household.
RoamingMobile-to-MobileOff PeakAnytime
Non WirelessSubstitutors
WirelessSubstitutors
Total Minutes
1074
336
220357
369 291
221
Total Minutes
742
Figure4
Source: Nielsen Mobile Customer Value Metrics, Q1 2008
AverageMinutesUsedperLineQ1 2008, National, Postpaid, Personal Liable
8 Nielsen Mobile Customer Value Metrics, Q1 2008
Non-WirelessSubstitutors
WirelessSubstitutors
$75.55 $68.86
Figure5
Source: Nielsen Mobile Customer Value Metrics, Q1 2008
AverageMonthlyBilledRevenueperAccountQ1 2008, National, Postpaid, Personal Liable

8Copyright © 2008 The Nielsen Company. All rights reserved.
Call My Cell: Wireless Substitution in the United States
Comingbacktolandline
Even with these savings, a few of these cord cutters return to wireline. Our research shows that 10 percent of U.S. households with landline phone service in Q2 2008 were previously wireless substi-tutors9 at some point in time. When we look at the landline tenure of these former wireless substitutors, approximately 1 percent of wireless substitutors may return in any given quarter.
Among wireless substitutors who go back to landline services, we’ll call them cord menders, 47 percent go back to a traditional landline operator, while others experiment with newer alterna-tives. 46 percent of these cord menders adopt cable phone systems, and 8 percent choose a VoIP provider.10 Cord menders indicate that they come back because they need the landline for another service, it’s convenient to bundle with other services, it’s too expensive to make all calls on their cell phone or the mobile coverage in their home was not satisfactory.
ButIneedalandline!
Among both cord menders and landline users who haven’t gone wireless only, it’s clear that additional services that require, or are perceived to require, a landline are an important driver for maintaining a landline connection. For instance, today DSL internet can be delivered without a landline through what’s known as “dry-loop” DSL, although some consumers believe they need to retain a landline for their DSL service. Many fax machines still require a landline, and satellite TV customers also need a landline connection if they want to use the pay-per-view feature. Also, many home alarm systems need to be hooked up to a landline in order to contact the monitoring company.
In addition to services, mobile coverage is sometimes perceived to be insufficient for would-be or former wireless substitutors. Dropped calls and poor audio quality are sure to drive down
overall network satisfaction. As mentioned above, one of the leading indicators of a market’s susceptibility to wireless substitu-tion is this overall network satisfaction.11 The better the coverage, the more likely a subscriber is to be a cord cutter and vice versa.
Lastly, some reluctance to wireless substitution comes from the perception that it does not save as much money expected. While the average increase in a cord cutter’s mobile bill is $6.69 per person, that benefit can switch in the landline’s favor as additional wireless lines are added to the household’s rate plan. That is to say, for smaller households who manage their minutes wisely, the cost savings should be realized as intended, but for households with multiple subscribers, who may all increase their usage and billed wireless expenditures, the cost savings might in fact be less than imagined. For most households, though, the financial benefits of wireless substitution should outweigh the costs.
ReasonsforReturningtoLandlineService—Q22008
I need my landline telephone service for another product or service (e.g., alarm system, fax, internet, TiVo)
17%
It was expensive to use my cell phone for all my calls 12%
Because it's cheaper to bundle internet and TV with landline phone service 11%
The safety and reliability of having a landline phone (e.g., for 911 service) 10%
Poor cell phone network quality at home (no signal, too many blocked/ dropped calls)
10%
Because its convenient to bundle landline phone service with other services (internet, TV)
9%
Other people in my household want/need a landline phone 9%
Other 7%
I need a landline phone for work 5%
I prefer making calls on a landline phone 5%
For international calling 3%
The ability to have multiple landline phones in the house 3%
Figure6
Source: Nielsen Mobile Wireless Substitution Report, Q2 2008
9 Nielsen Mobile Wireless Substitution Report, Q2 200810 Ibid.11 Nielsen Mobile Wireless Substitution Model
9 Copyright © 2008 The Nielsen Company. All rights reserved.
Call My Cell: Wireless Substitution in the United States
Thoseotherimportantconnections
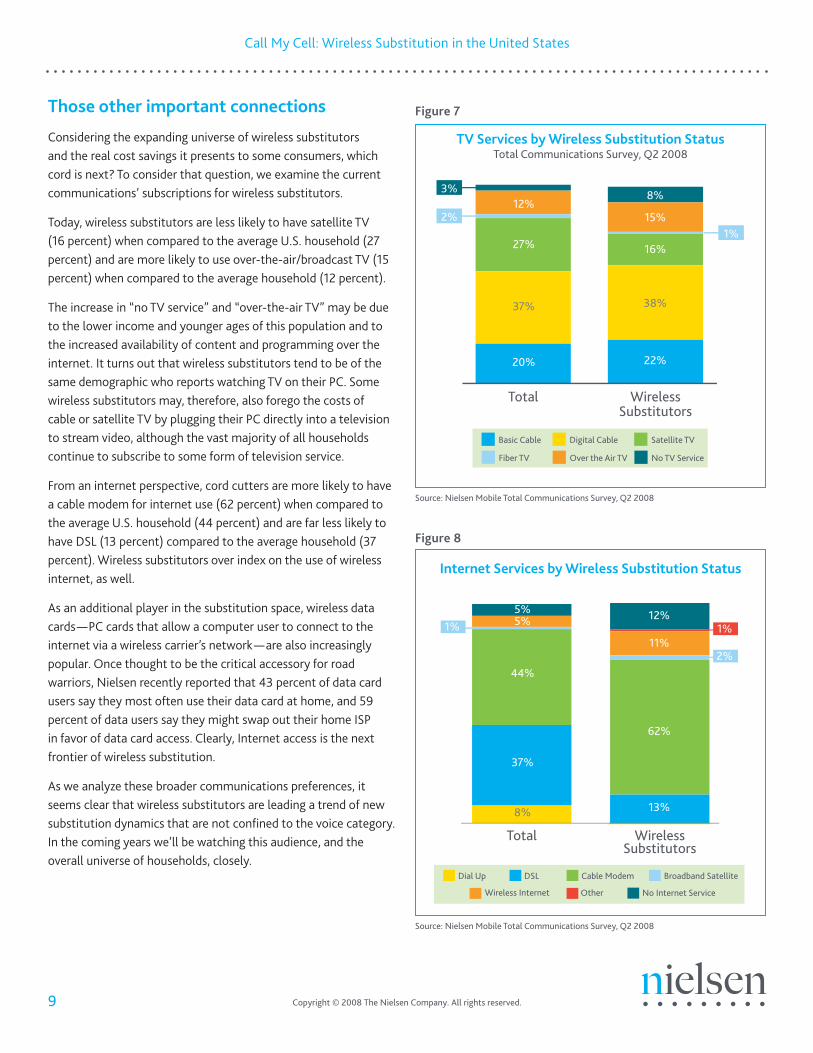
Considering the expanding universe of wireless substitutors and the real cost savings it presents to some consumers, which cord is next? To consider that question, we examine the current communications’ subscriptions for wireless substitutors.
Today, wireless substitutors are less likely to have satellite TV (16 percent) when compared to the average U.S. household (27 percent) and are more likely to use over-the-air/broadcast TV (15 percent) when compared to the average household (12 percent).
The increase in “no TV service” and “over-the-air TV” may be due to the lower income and younger ages of this population and to the increased availability of content and programming over the internet. It turns out that wireless substitutors tend to be of the same demographic who reports watching TV on their PC. Some wireless substitutors may, therefore, also forego the costs of cable or satellite TV by plugging their PC directly into a television to stream video, although the vast majority of all households continue to subscribe to some form of television service.
From an internet perspective, cord cutters are more likely to have a cable modem for internet use (62 percent) when compared to the average U.S. household (44 percent) and are far less likely to have DSL (13 percent) compared to the average household (37 percent). Wireless substitutors over index on the use of wireless internet, as well.
As an additional player in the substitution space, wireless data cards—PC cards that allow a computer user to connect to the internet via a wireless carrier’s network—are also increasingly popular. Once thought to be the critical accessory for road warriors, Nielsen recently reported that 43 percent of data card users say they most often use their data card at home, and 59 percent of data users say they might swap out their home ISP in favor of data card access. Clearly, Internet access is the next frontier of wireless substitution.
As we analyze these broader communications preferences, it seems clear that wireless substitutors are leading a trend of new substitution dynamics that are not confined to the voice category. In the coming years we’ll be watching this audience, and the overall universe of households, closely.
Source: Nielsen Mobile Total Communications Survey, Q2 2008
2%
3%
1%
No TV ServiceOver the Air TVFiber TV
Satellite TVDigital CableBasic Cable
WirelessSubstitutors
Total
20%
37%
27%
12%
22%
38%
16%
15%
8%
Figure7
TVServicesbyWirelessSubstitutionStatusTotal Communications Survey, Q2 2008
Source: Nielsen Mobile Total Communications Survey, Q2 2008
1%
2%
1%
No Internet ServiceOtherWireless Internet
Broadband SatelliteCable ModemDSLDial Up
WirelessSubstitutors
Total
37%
44%
5%5%
13%
62%
11%
12%
8%
Figure8
InternetServicesbyWirelessSubstitutionStatus

10Copyright © 2008 The Nielsen Company. All rights reserved.
Call My Cell: Wireless Substitution in the United States
Conclusion
Voice wireless substitution continues at an impressive clip. The overall universe of wireless substitutors is growing steadily, and the demographics of this audience are expanding beyond the young and lower-income groups. The economics of wireless substitution suggest that it is a financially efficient maneuver for many families, and we expect this trend to continue steadily, with at least one in five households cutting the cord by year’s end.
What does the trend mean for communications companies? There is a new segment of the population who is choosing a different home communications and entertainment framework. Traditional landline companies can try to combat this trend on cost, but the tide is against them. The best opportunities will go to the
companies who can adapt to a new paradigm in home connectiv-ity. The battle for simply the phone line or the living room or the PC connection is over. Today’s prize is a much broader customer relationship to be won only by seamless connectivity, competitive pricing and a more holistic understanding of the communications consumer.

11 Copyright © 2008 The Nielsen Company. All rights reserved.
Call My Cell: Wireless Substitution in the United States
AboutNielsenMobile
Nielsen Mobile, a service of The Nielsen Company, is the world’s largest independent provider of syndicated consumer research to the telecom and mobile media markets. Nielsen Mobile focuses exclusively on tracking the behavior, attitudes and experiences of mobile consumers; their reports also provide up to seven years of data on Internet, video, gaming, audio and advertising trends for mobile phone users. Nielsen’s technology-driven research provides unique and holistic insight into how mobile customers use their devices and what they think about brands, devices and services.
AboutTheNielsenCompany
The Nielsen Company is a leading global information and media company providing essential integrated marketing and media measurement information and analytics and industry expertise to clients across the world. Nielsen maintains leading market positions in marketing and consumer information; television, online, mobile and other media intelligence; and trade shows and business publications (Billboard, The Hollywood Reporter, Adweek). Nielsen is a privately held company and is active in more than 100 countries, with headquarters in New York, USA. For more information, please visit, www.nielsen.com.
ContactUs
For more information on Nielsen’s research on wireless substitu-tion, please contact:
Tanya Masiello Director, Client Services Nielsen Mobile +1 (703) 348-7090 [email protected]