Embed Size (px)
Citation preview

University of Stellenbosch Department of Industrial Engineering
Call Centre Design, Operation and Optimisation – A Structured and Scientific Based
Approach
Johan Joubert du Preez
Student Number 13421492
Thesis presented in partial fulfilment of the requirements for the degree of Master of Science of Industrial Engineering at Stellenbosch University.
Study leader: C.S.L. Schutte
March 2008

i
Declaration
By submitting this thesis electronically, I declare that the entirety of the work contained therein is my own, original work, that I am the owner of the copyright thereof (unless to extent explicitly otherwise stated) and that I have not previously in its entirety or in part submitted it for obtaining any qualification. Date: ……………………… Copyright © 2008 Stellenbosch University.

ii
Synopsis Call centres form an increasingly important part of the modern day business environment and perform
an important role in the strategic and operational aspects of organisations. Call centres have emerged
and developed to provide efficient and cost effective communication channels between organisations
and their customers. Call centres are often the largest or only channel used to access customers or
for customers to access organisations.
Early call centres were seen as cost centres and operated in a similar manner, often resulting in poor
and unsatisfactory performance. Modern call centres are being approached in a different way. They
are aligned with the strategic objectives of the organisation and are seen as performance centres and
revenue drivers. Modern call centres are dynamic and complex organisations, both technologically
and operationally. Performance objectives are often conflicting and controlling parameters have to be
finely balanced in a volatile environment. It is therefore imperative to utilise call centres effectively and
efficiently. This can only be achieved by a structured and scientific operations research based
approach.
The research was initiated by the requirement of a call centre design and implementation as part of a
larger business process reengineering project. The thesis provides an overview of the call centre
environment and operational aspects. A structured call centre design model is reviewed and two
aspects namely workforce management and performance management are found to form the core of
the design and operations activities. The call centre design model is then integrated with the
proposed workforce management and performance management models. These models are
developed using scientific operations research approach. The structured modelling approach is then
used to guide the design, operation, and optimisation of the call centre of the case study.
The structured and scientific operations research based approach proved to be of great significance
when confronted with the dynamic and complex call centre environment. Through using the structured
approach the design, operation, and optimisation activities could be conducted successfully and
performance objectives were reached.

iii
Opsomming Oproepsentrums vorm toenemend deel van die moderne besigheids omgewing en verrig ’n belangrike
rol in die strategiese en operasionele aspekte van organisasies. Oproepsentrums het na vore getree
en ontwikkel om doeltreffende en koste effektiewe kommunikasie kanale tussen organisasies en
klante te voorsien. Oproepsentrums is in die meeste gevalle die grootste of enigste kanaal wat
gebruik word om verbruikers te bereik of vir klante om die organisasie te bereik.
Aanvanklik was oproepsentrums gesien as kostesentrums en is ook bedryf in ’n soortgelyke wyse, wat
gewoonlik gelei het tot swak en onbevredigende prestasie. Moderne oproepsentrums word benader
op ‘n verskillende wyse. Hulle is in lyn met die strategiese doelwitte van die organisasie en word
beskou as prestasie sentrums en inkomste drywers. Moderne oproepsentrums is dinamiese en
komplekse entiteite, beide tegnologies en operasioneel. Prestasie doelwitte is gewoonlik teenstrydig
en die kontrolerende parameters moet fyn gebalanseer word in ’n onbestendige omgewing. Daarom
is dit van uiterste belang om oproepsentrums effektief en doeltreffend te benut. Dit kan slegs gedoen
word deur ’n gestruktureerde en wetenskaplike operasionele navorsings gebaseerde benadering te
volg.
Hierdie navorsing is geϊnisieer deur die vereiste om ’n oproepsentrum te ontwerp en te implementeer
as deel van ’n groter sakeprosesregeniërings projek. Hierdie tesis gee ’n agtergrond van die
oproepsentrum omgewing en operasionele aspekte. ’n Gestruktureerde oproepsentrum ontwerp
model is behandel en twee aspekte, naamlik werksmag bestuur en prestasie bestuur is geïdentifiseer
as die aspekte wat die kern vorm van die ontwerp en operasionele aktiwiteite. Die oproepsentrum
ontwerp model word dan geïntegreer met die werksmag en prestasie bestuur modelle. Hierdie
modelle is ontwerp deur ’n wetenskaplike operasionele navorsings benadering te gebruik. Die
gestruktureerde modellering benadering word dan gebruik om die ontwerp, bedryf, en optimering van
die oproepsentrum in die gevallestudie te lei.
Die gestruktureerde en wetenskaplike operasionele navorsings gebaseerde benadering was van groot
belang wanneer gekonfronteer word deur die dinamiese en komplekse oproepsentrum omgewing.
Deur die gestruktureerde benadering te volg kon die ontwerp, bedryf, en optimering suksesvol
behartig word en die prestasie doelwitte bereik word.

iv
Acknowledgements The author would like to thank all the people who contributed time, information, and assistance during
the completion of this thesis. Special thanks should go to the following people:
• Corne Schutte, for his guidance and support throughout the project
• Members of the Indutech team who contributed to this project (Bernard Katz, Louis Louw,
Marize Mostert, Vivien Marsden, Dirk Kotze, and Mark Gething) for their support, input, and
creating pleasant working environment.
• Family, friends, and colleagues for support, patience, and encouragement.
• Almarie Engelbrecht, for her patience, understanding, and support.
I would like to thank God for granting the abilities and all the accomplishments I am able to achieve.
Table of Contents v
Table of Contents
Declaration i
Synopsis ii
Opsomming iii
Acknowledgements iv
LIST OF FIGURES xi
LIST OF TABLES xiii
Glossary xiv
Chapter 1 Introduction 1 1.1 Motivation for the Research 1 1.2 Background Study 1 1.3 Research Problem 3 1.4 Research Goal and Objectives 3 1.5 Research Methodology 4 1.6 Research Layout 5
Chapter 2 Call Centre Overview 8 2.1 Introduction 8 2.2 Background to Call Centres 8 2.3 Call Centre Management Objective 10 2.4 Call Centre Definition 10 2.5 Contact Centre Definition 11 2.6 The Operation of a Call Centre 12 2.7 Modelling the Centre as a Queuing System 14 2.8 Call Flow Organisation 16
2.8.1 Single Agent Queuing 16 2.8.2 Pooling Structures 17 2.8.3 Overflow Routing 17 2.8.4 Skills-Based Routing 18 2.8.5 Contact Blending 19
2.9 Data Generation and Reporting 20 2.9.1 Information Hierarchy 20 2.9.2 Types of Call Centre Data 21
2.9.2.1 Operational Data 21 2.9.2.2 Marketing Data 22
Table of Contents vi
2.9.2.3 Human Resources Data 22 2.9.2.4 Psychological Data 22 2.9.2.5 Additional Data Sources 22
2.10 Data Analysis and Performance Measurements 23 2.10.1 Service or Call Centre Measures 23
2.10.1.1 Contact Volume 23 2.10.1.2 Contact Handle Time 23 2.10.1.3 Speed of Answer 24 2.10.1.4 Service Level 24 2.10.1.5 One Call Resolution Rate 24 2.10.1.6 Abandonment Rate 24 2.10.1.7 Cost Metrics 24 2.10.1.8 Customer Satisfaction 24
2.10.2 Agent and Group Measures 25 2.10.2.1 Contact Volume 25 2.10.2.2 Contact Handle Time 25 2.10.2.3 Adherence 25 2.10.2.4 Quality Monitoring 26 2.10.2.5 Utilisation 26 2.10.2.6 Turnover Rate 27 2.10.2.7 Cost Metrics 27
2.11 Operational Regimes 27 2.11.1 Efficiency Driven (ED) Regime 28 2.11.2 Quality Driven (QD) Regime 28 2.11.3 Quality and Efficiency Driven (QED) Regime 28
2.12 Conclusion 29
Chapter 3 Call Centre Design Aspects 30 3.1 Introduction 30 3.2 Dawson’s Six Stage Model of Call Centres 30 3.3 The Genesys Contact Centre Capability Maturity Model 32 3.4 A Methodology Approach 34 3.5 The Benefits of Using a Methodology Approach 35 3.6 The Contact Centre Model by Prosci 35
3.6.1 Strategy 38 3.6.1.1 The Mission Statement 38 3.6.1.2 Customer Information and Relationship 38 3.6.1.3 Competitive Position 39 3.6.1.4 Customer Contact Strategy 39 3.6.1.5 Set Contact Centre Measures and Goals 40 3.6.1.6 Sourcing Options 41 3.6.1.7 Multi-site Considerations 42 3.6.1.8 Budget 43 3.6.1.9 Document Business Requirements 44
3.6.2 Processes 44 3.6.2.1 Identify Contact Types and Volumes 45 3.6.2.2 Define Contact Routing 46 3.6.2.3 Define Customer Contact Processes 47 3.6.2.4 Create a Workforce Management Process 48 3.6.2.5 Translate Contact Volumes into Staffing Needs 48 3.6.2.6 Develop Productivity and Performance Reports 48 3.6.2.7 Define Quality Monitoring 49 3.6.2.8 Develop Contact Centre Policies 50 3.6.2.9 Implement Continuous Process Improvement 50 3.6.2.10 Define Internal and External Communications 51
Table of Contents vii
3.6.2.11 Develop Operations, Administrations and Maintenance Plans 51 3.6.2.12 Plan for the Unexpected 51
3.6.3 Technology 51 3.6.4 Human Resources 52
3.6.4.1 Organisational Design 52 3.6.4.2 Recruitment and Hiring 53 3.6.4.3 Training 54 3.6.4.4 Ongoing Performance Management 55
3.6.5 Facilities 56 3.6.5.1 Site Selection 56 3.6.5.2 Facility Design 56
3.7 Conclusion 56
Chapter 4 Capacity Planning and Workforce Management 58 4.1 Introduction 58 4.2 Background to Capacity Planning and Workforce Management 58
4.2.1 Workload Forecast 62 4.2.2 Service Objectives 66 4.2.3 Staffing Needs 67 4.2.4 Agent Schedules and Rosters 68 4.2.5 Monitoring, Managing, and Operating 68 4.2.6 Automated Workforce Management 69
4.3 Conclusion 69
Chapter 5 Performance Management 70 5.1 Introduction 70 5.2 Background 70 5.3 Measurement and Strategic Alignment 71 5.4 Performance Management 73 5.5 Performance Management and Data 74 5.6 Balanced Scorecard 74
5.6.1 Objectives 75 5.6.1.1 Financial Perspective 75 5.6.1.2 Customer Perspective 76 5.6.1.3 Internal Perspective 76 5.6.1.4 Learning and Growth Perspective 76
5.6.2 Measures, Targets, and Initiatives 77 5.6.3 The Cascading Process 78
5.7 Conclusion 78
Chapter 6 Model Description and Development 79 6.1 Introduction 79 6.2 Modelling Approach 80 6.3 Model Development 80
6.3.1 Workforce Management 82 6.3.2 Performance Management 83 6.3.3 Modelling, Analysis, and Optimisation 84
6.4 Conclusion 85
Table of Contents viii
Chapter 7 Case Study Description and Design 86 7.1 Introduction 86 7.2 Case Study Background 86
7.2.1 Innovation Implementation Methodology 87 7.2.1.1 Four Layered Approach 88 7.2.1.2 Innovation Concepts 90
7.2.2 Case Study Project Objectives 90 7.2.3 The Old Process 90 7.2.4 The New Process 91 7.2.5 Case Study Call Centre 92
7.3 Case Study Call Centre Design 92 7.3.1 Call Centre Strategy 92
7.3.1.1 Call Centre Mission 92 7.3.1.2 Call Centre Customers 92 7.3.1.3 Call Centre Competition 93 7.3.1.4 Call Centre Contact Strategy 93 7.3.1.5 Measures and Goals 94 7.3.1.6 Sourcing Options 94 7.3.1.7 Multi-Site Considerations 95 7.3.1.8 Budget 95 7.3.1.9 Document Business Requirements 95
7.3.2 Processes 95 7.3.2.1 Contact Types and Volumes 95 7.3.2.2 Contact Routing 95 7.3.2.3 Contact Processes 95 7.3.2.4 Workforce Management 96 7.3.2.5 Staffing Needs 97 7.3.2.6 Productivity and Performance 97 7.3.2.7 Quality Monitoring 97 7.3.2.8 Contact Centre Policies 97 7.3.2.9 Continuous Improvement 97 7.3.2.10 Communications Plan 97 7.3.2.11 Operations Administration & Maintenance (OA&M) Plans 97 7.3.2.12 Plan for the Unexpected 98
7.3.3 Technology 98 7.3.4 Human Resources 99
7.3.4.1 Organisational Design 99 7.3.4.2 Recruitment and Hiring 100 7.3.4.3 Training 100 7.3.4.4 Performance Management 100
7.3.5 Facilities 101 7.4 Conclusion 101
Chapter 8 Forecasting 102 8.1 Introduction 102 8.2 Forecasting Background 102 8.3 Forecasting Objective 103 8.4 Forecasting Method 104 8.5 Time Series Method 105 8.6 Other Forecasting Methods 106 8.7 Forecasting Model in the Case Study 106
8.7.1 Forecasting Model Description 106 8.7.2 Forecasting Data Analysis and Results 108
Table of Contents ix
8.7.2.1 Number of Calls per Month Distribution 108 8.7.2.2 Number of Calls per Week Distribution 109 8.7.2.3 Number of Calls per Day Distribution 112 8.7.2.4 Intraday Number of Calls Distribution 115 8.7.2.5 Forecasting Model Accuracy 116
8.8 Conclusion 118
Chapter 9 Staffing Model 119 9.1 Introduction 119 9.2 Staffing Background 119 9.3 Modelling Options 120 9.4 Analytical Models 121 9.5 Erlang Models - Erlang C 122
9.5.1 The Erlang C Calculation 123 9.5.2 Variations and Extensions of the Erlang Model 124
9.6 Simulation Method 124 9.7 Discrete Event Simulation in a Call Centre 125 9.8 Staffing Model Case Study 126
9.8.1 Staffing Model Description 126 9.8.2 Staffing Model Assumptions and Simplifications 128 9.8.3 Staffing Model Data Analysis 128
9.8.3.1 Call Arrivals 128 9.8.3.2 Service Duration 129 9.8.3.3 Other Aspects 130
9.8.4 Staffing Model Results 131 9.9 Conclusion 133
Chapter 10 Scheduling and Rostering 135 10.1 Introduction 135 10.2 Scheduling and Rostering Background 135 10.3 The Scheduling Problem 136
10.3.1 Constraints and Other Parameters 137 10.4 Scheduling Model Case Study 137
10.4.1 Scheduling Model Data 137 10.4.2 Scheduling Model Constraints 137 10.4.3 Scheduling Model Description 138 10.4.4 Mathematical Formulation 138 10.4.5 The Solution Process 141 10.4.6 Scheduling Model Results 142
10.5 Conclusion 143
Chapter 11 Performance Measurement, Analysis and Optimisation 145 11.1 Introduction 145 11.2 Performance Management Case Study 145
11.2.1 Performance Management Approach 146 11.2.2 Performance Management Implementation 147 11.2.3 Real Time Performance Reporting and Analysis 147 11.2.4 Historical Performance Reporting and Analysis 148 11.2.5 Other Analysis Results 152

Table of Contents x
11.3 Conclusion 153
Chapter 12 Conclusions and Recommendations 154 12.1 Introduction 154 12.2 Overview of the Study 154 12.3 Results and Conclusions 155 12.4 Recommendations and Future Research 156
References 158
Appendix A Winter’s Method I
Appendix B Erlang Calculations IV
Appendix C Performance Management Scorecard Example IX
Appendix D Performance Measurement and Analysis Example XI

List of figures xi
LIST OF FIGURES FIGURE 1.1 RESEARCH METHODOLOGY INCLUDING SCOPE ............................................................................. 4 FIGURE 1.2 RESEARCH METHODOLOGY AND CHAPTER LAYOUT..................................................................... 5 FIGURE 2.1 THESIS NAVIGATION – CHAPTER 2................................................................................................ 8 FIGURE 2.2 THE ROLE OF THE CALL CENTRE................................................................................................... 9 FIGURE 2.3 THE CALL CENTRE MANAGEMENT BALANCING ACT.................................................................. 10 FIGURE 2.4 THE FUNCTIONING OF A BASIC CALL CENTRE ............................................................................ 12 FIGURE 2.5 OPERATIONAL SCHEME OF A BASIC CALL CENTRE ..................................................................... 15 FIGURE 2.6 SINGLE AGENT QUEUING ............................................................................................................ 17 FIGURE 2.7 EXAMPLES OF DIFFERENT POOLING STRUCTURES....................................................................... 17 FIGURE 2.8 OVERFLOW ROUTING .................................................................................................................. 18 FIGURE 2.9 EXAMPLE OF SKILLS-BASED ROUTING........................................................................................ 18 FIGURE 2.10 INFORMATION HIERARCHY........................................................................................................ 21 FIGURE 2.11 DETERMINING PERFORMANCE GOALS....................................................................................... 29 FIGURE 3.1 THESIS NAVIGATION – CHAPTER 3.............................................................................................. 30 FIGURE 3.2 THE CONTACT CENTRE MODEL.................................................................................................. 36 FIGURE 3.3 THE CALL CENTRE PLANNING ROADMAP ................................................................................... 37 FIGURE 3.4 THE FOUR VIEWPOINTS OF A STRATEGIC PLAN........................................................................... 40 FIGURE 3.5 MEASUREMENT SELECTION GUIDELINES .................................................................................... 41 FIGURE 3.6 FACTORS THAT CONTRIBUTE TO ONGOING PERFORMANCE MANAGEMENT ................................ 55 FIGURE 4.1 THESIS NAVIGATION – CHAPTER 4.............................................................................................. 58 FIGURE 4.2 THE FORCE MANAGEMENT SYSTEM............................................................................................ 60 FIGURE 4.3 THE BASIC CALL CENTRE WORKFORCE PLANNING CYCLE......................................................... 60 FIGURE 4.4 THE WORKFORCE MANAGEMENT PROCESS AND INFORMATION REQUIREMENTS........................ 61 FIGURE 4.5 TYPICAL CALL VOLUME PROFILES IN DIFFERENT TIME SCALES................................................. 62 FIGURE 5.1 THESIS NAVIGATION - CHAPTER 5............................................................................................... 70 FIGURE 5.2 STRATEGY AND PERFORMANCE MANAGEMENT RELATIONSHIP .................................................. 72 FIGURE 5.3 THE BALANCED SCORECARD ...................................................................................................... 75 FIGURE 5.4 THE CASCADING PROCESS .......................................................................................................... 78 FIGURE 6.1 THESIS NAVIGATION - CHAPTER 6............................................................................................... 79 FIGURE 6.2 REVISED PLANNING ROADMAP ................................................................................................... 81 FIGURE 6.3 CONCEPTUAL WORKFORCE MANAGEMENT MODEL.................................................................... 83 FIGURE 6.4 A GRAPHIC MODEL OF THE MODEL BUILDING PROCESS............................................................. 84 FIGURE 6.5 OPTIMISATION PROCESS.............................................................................................................. 85 FIGURE 7.1 THESIS NAVIGATION – CHAPTER 6.............................................................................................. 86 FIGURE 7.2 THE INNOVATION IMPLEMENTATION METHODOLOGY ................................................................ 87 FIGURE 7.3 NEW PROCESS VALUE CHAIN...................................................................................................... 91 FIGURE 7.4 CALL CENTRE CONTACT STRATEGY CONCEPTUAL DIAGRAM .................................................... 93 FIGURE 7.5 THE WORKFORCE MANAGEMENT APPROACH ............................................................................. 96 FIGURE 7.6 CALL CENTRE ORGANISATIONAL DESIGN................................................................................... 99 FIGURE 8.1 THESIS NAVIGATION - CHAPTER 8............................................................................................. 102 FIGURE 8.2 THE WORKLOAD FORECASTING APPROACH.............................................................................. 105 FIGURE 8.3 FORECASTING PROCEDURE ....................................................................................................... 107 FIGURE 8.4 NUMBER OF CALLS PER MONTH................................................................................................ 109 FIGURE 8.5 NUMBER OF CALLS PER WEEK .................................................................................................. 110 FIGURE 8.6 WEEK IN MONTH VARIATION OF 4 WEEK MONTHS .................................................................. 111 FIGURE 8.7 WEEK IN MONTH VARIATION OF 5 WEEK MONTHS .................................................................. 112 FIGURE 8.8 NUMBER OF CALLS PER DAY..................................................................................................... 113 FIGURE 8.9 DAY IN WEEK CALL VARIATION ............................................................................................... 114 FIGURE 8.10 AVERAGE DAY IN WEEK CALL PATTERN ................................................................................ 114 FIGURE 8.11 INTRA DAY AVERAGE CALLS PER DAY ................................................................................... 115 FIGURE 8.12 INTRA DAY CALL NUMBERS PROFILE ..................................................................................... 116 FIGURE 8.13 DAILY FORECASTED VERSUS ACTUAL NUMBER OF CALLS ..................................................... 116 FIGURE 8.14 DAILY FORECASTING ERROR................................................................................................... 117 FIGURE 9.1 THESIS NAVIGATION - CHAPTER 9............................................................................................. 119 FIGURE 9.2 WAYS TO STUDY A SYSTEM ...................................................................................................... 120 FIGURE 9.3 CALL CENTRE SIMULATION MODEL ASPECTS........................................................................... 125 FIGURE 9.4 CONCEPTUAL SIMULATION MODEL........................................................................................... 127

List of figures xii
FIGURE 9.5 CALL DURATION DISTRIBUTION ANALYSIS RESULT ................................................................. 130 FIGURE 9.6 IMPROVED CALL DURATION ANALYSIS .................................................................................... 132 FIGURE 9.7 REDUCED UNPRODUCTIVE CALLS ANALYSIS............................................................................ 133 FIGURE 10.1 THESIS NAVIGATION - CHAPTER 10......................................................................................... 135 FIGURE 10.2 POSSIBLE SHIFTS FOR SCHEDULE MODEL ............................................................................... 139 FIGURE 10.3 POSSIBLE LUNCH BREAKS PER SHIFT....................................................................................... 140 FIGURE 10.4 EXAMPLE OF MINIMISING AGENT PER PERIOD ........................................................................ 142 FIGURE 10.5 EXAMPLE OF MINIMISING SHIFTS PER PERIOD ........................................................................ 143 FIGURE 10.6 EXAMPLE OF A SCHEDULE GROUPED FOR TEAMS ................................................................... 143 FIGURE 11.1 THESIS NAVIGATION - CHAPTER 11......................................................................................... 145 FIGURE 11.2 CALL CENTRE PERFORMANCE MANAGEMENT METHODOLOGY .............................................. 146 FIGURE 11.3 EXAMPLE OF REAL TIME DASHBOARD.................................................................................... 148 FIGURE 11.4 DAILY SERVICE LEVEL MEASURES FOR JUNE 2007................................................................. 149 FIGURE 11.5 MONTHLY SERVICE LEVEL MEASURES ................................................................................... 150 FIGURE 12.1 THESIS NAVIGATION - CHAPTER 12......................................................................................... 154

List of tables xiii
LIST OF TABLES TABLE 9.1 ERLANG C EXAMPLE .................................................................................................................. 123 TABLE 9.2 INTRADAY STAFFING REQUIREMENTS EXAMPLE........................................................................ 131 TABLE 11.1 INTRADAY MEASUREMENT EXAMPLE – SYSTEM PROBLEM...................................................... 151 TABLE 11.2 INTRADAY MEASUREMENT EXAMPLE – AGENT SHRINKAGE.................................................... 152
Glossary xiv
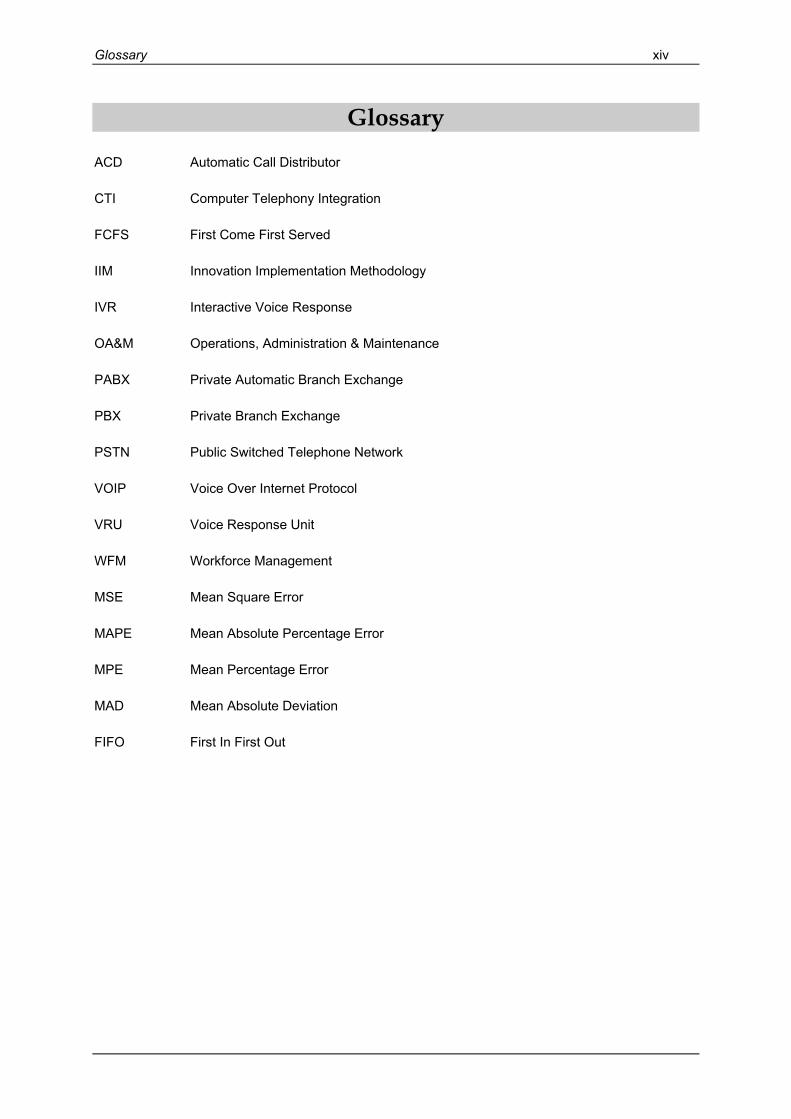
Glossary
ACD Automatic Call Distributor
CTI Computer Telephony Integration
FCFS First Come First Served
IIM Innovation Implementation Methodology
IVR Interactive Voice Response
OA&M Operations, Administration & Maintenance
PABX Private Automatic Branch Exchange
PBX Private Branch Exchange
PSTN Public Switched Telephone Network
VOIP Voice Over Internet Protocol
VRU Voice Response Unit
WFM Workforce Management
MSE Mean Square Error
MAPE Mean Absolute Percentage Error
MPE Mean Percentage Error
MAD Mean Absolute Deviation
FIFO First In First Out
Chapter 1 - Introduction 1
Chapter 1 Introduction
1.1 Motivation for the Research The motivation for this research study came from the author's involvement in a project performed by a
consulting firm at an organization in the financial services industry. The aim of the project was to
establish a considerable improvement in the operation of a department of the organisation through
reengineering and business process management activities. It was deemed necessary to use a call
centre in a very important part of the value chain of the company's business processes. It was
therefore extremely important that the call centre had to be operational and performing as planned as
quickly as possible in order for the entire project to be successful.
The design, implementation and optimization process that followed prompted the necessity for further
research into the necessary tools and techniques that could be used in order to design implement and
operate a successful call centre. As relatively new concepts were implemented in this endeavour, a
number of the suggested solutions had to be designed from first principle with little or no historical
data to validate these designs. A structured approach was therefore required in order to make a
success of the project.
1.2 Background Study For various organizations it has become increasingly difficult to gain competitive advantage from
products alone. The provision of complimentary services is used by many organizations and
customers as a means to differentiate them from the competition (Bartnett, 2006). Call centres form a
more important part of a wider array of businesses than ever before (Mehrotra, Profozich & Bapat,
1997), and more companies are starting to realize the benefits of integrating call centre activities with
mainstream business activities in order to gain competitive advantage.
The call centre industry has shown incredible growth around the world in recent years and according
to various sources will continue to do so for some time into the future, as organisations seek new ways
of interacting with customers (Dawson, 2004). This growth, coupled with the frantic advances in
technologies assisting the call centre market, has resulted in the operation and improving of call centre
activities being a very complex exercise.
Call centres form an integral part of various industries today. They play an essential role in the
business world and are often the primary source of contact with customers. Yet companies have only
recently started to consider their call centres as a strategic asset that can be leveraged as a revenue
generator. Early call centres were seen as cost centres that were mainly built to take advantage of the
telephony technology of the time and had little or no financial justification of costs (Dawson, 2004).

Chapter 1 - Introduction 2
Today, call centres have become increasingly important in communicating with customers and have
therefore become more customer-focused and are gearing up to solve problems and generate
revenue. With more channels becoming available to interact with customers, came more up- and
cross-selling opportunities, which resulted in the call centre transforming into a profit centre. (Up- and
cross-selling refers to the ability to provide a variety of services across the different dimensions of an
organisation. Up selling refers to the practices of suggesting products or services, generally of a
better quality, to customers interested in a purchase. Cross selling refers to the practice of suggesting
extra items to a customer). It is therefore important that the call centre be seen as a strategic asset
and should be aligned with mainstream business activities and objectives.
As companies have started to make this transformation, they are faced with various obstacles such as
identifying areas for change, reducing service costs, providing a differentiated service, increasing
sales, supporting a multi-channel customer experience and leveraging technological advances. These
challenges, coupled with increasing customer expectations, have created a renewed focus on
transforming the call centre. Unfortunately it seems that a great number of companies fail when it
comes to making the best use of their call centres (Gans, Koole & Mandelbaum, 2003).
It is therefore important to improve the way that call centres operate, and following that, to improve the
relationship between company and customers. However, because of the dynamic nature of the call
centre industry and the complex relationships between the different role playing variables, this is rarely
a simple task. It is therefore important to possess the right skills and tools to react to any changes or
disturbances as quickly and efficiently as possible. It is the aim of this study to investigate, develop
and implement these skills and tools in order to develop and maintain a high performance call centre
that can be viewed as a true strategic asset.
There seems to be a constant battle between managing the relationships between the people,
processes and technologies that can be found in the call centre environment. It is very important to be
able to keep these factors aligned and working properly in order to gain maximum business value and
service levels. At the same time one has to consider and manage the relationship between efficient
performance at the lowest possible cost, but still delivering the best customer service.
Companies that do not take the appropriate steps to design new call centres effectively - or to
manage, configure and leverage existing call centre systems properly, quickly find that their planning
mistakes translate into lower service levels, lost revenue, increased costs and frustrated and
dissatisfied customers. It is therefore important for the appropriate parties to understand the call
centre dynamics, to know how calls, routes, agents and other factors are driving service levels,
abandonment rates and agent utilization. To rely on guesswork, trial-and-error, intuition or "black box"
software is simply too dangerous for companies that want to implement and operate high performance
call centres (Mehrotra, Profozich & Bapat, 1997).

Chapter 1 - Introduction 3
1.3 Research Problem The call centre environment is an extremely complex and dynamic environment. At the same time a
call centre needs to perform against certain criteria with a very low margin for error, in order to satisfy
business and customer demands. Various solutions have been developed and implemented, and yet it
seems as though some organisations still struggle to keep up with the ever changing demands placed
on the call centre.
This research is therefore aimed at investigating the dynamics and complexities of the call centre
environment and to study and propose scientific and operations management based tools and
methodologies that can be used to design, operate and improve call centre operations in order to align
the call centre with business objectives.
Operations research and management is an area of study that is concerned with the development,
implementation, improvement, and evaluation of integrated systems comprising of various aspects
involved in business operations. It draws upon the principles and methods of engineering analysis
and synthesis, as well as mathematical, physical, and social sciences together with the principles and
methods of engineering analysis and design to specify, predict, and evaluate the results to be
obtained from such systems.
1.4 Research Goal and Objectives The goal of the research will therefore be to develop a modelling approach that can be used in the
design, operation and implementation of a call centre, and to use this modelling approach in the call
centre requirement that initiated the research.
In order to achieve this it will be necessary to investigate the different methodologies, tools, and
techniques available in the call centre and operations management fields.
The objectives are:
• Conduct a literature study on the call centre environment covering all the relevant aspects.
• Propose a model that can be used as an effective tool in planning, implementing, operating
and optimizing a call centre.
• Test the tools and knowledge gained though the research and practical experience in a call
centre.
• Document the research conducted and the results obtained in the case study.
The following hypothesis will be tested: The design, implementation, operation and optimisation
of a call centre can be performed by using a structured, scientific operations management based approach, by using models and mathematical tools and techniques, in a continuous analysis and improvement environment.
Chapter 1 - Introduction 4
1.5 Research Methodology A study will be conducted of each of the applicable research areas and the results will then be
combined in such a way that a realistic model can be constructed that can be used to aid in the
design, optimization and management of a call centre. The model therefore will have to be tested
within a real call centre environment in order to determine the validity of such a tool in a real world
scenario.
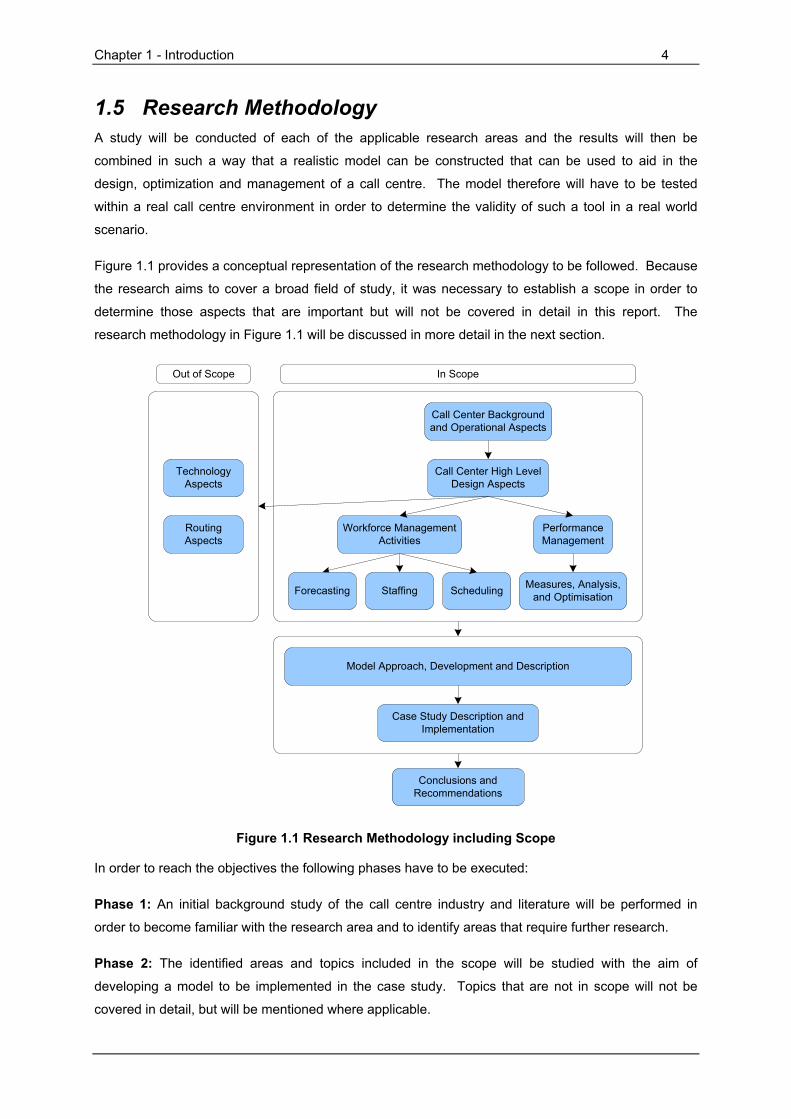
Figure 1.1 provides a conceptual representation of the research methodology to be followed. Because
the research aims to cover a broad field of study, it was necessary to establish a scope in order to
determine those aspects that are important but will not be covered in detail in this report. The
research methodology in Figure 1.1 will be discussed in more detail in the next section.
Staffing Scheduling Measures, Analysis, and Optimisation
Call Center High Level Design Aspects
Call Center Background and Operational Aspects
Performance Management
Workforce Management Activities
Forecasting
Case Study Description and Implementation
Conclusions and Recommendations
Model Approach, Development and Description
Technology Aspects
Routing Aspects
Out of Scope In Scope
Figure 1.1 Research Methodology including Scope
In order to reach the objectives the following phases have to be executed:
Phase 1: An initial background study of the call centre industry and literature will be performed in
order to become familiar with the research area and to identify areas that require further research.
Phase 2: The identified areas and topics included in the scope will be studied with the aim of
developing a model to be implemented in the case study. Topics that are not in scope will not be
covered in detail, but will be mentioned where applicable.
Chapter 1 - Introduction 5
Phase 3: An implementation approach and model will be developed to design, operate, and optimise
a call centre. Because of the nature of the intended case study this model will be developed and
updated continuously as the research progresses.
Phase 4: The model will be implemented and validated in a call centre and the results will be
evaluated.
Phase 5: The research and results will be documented in a research report.
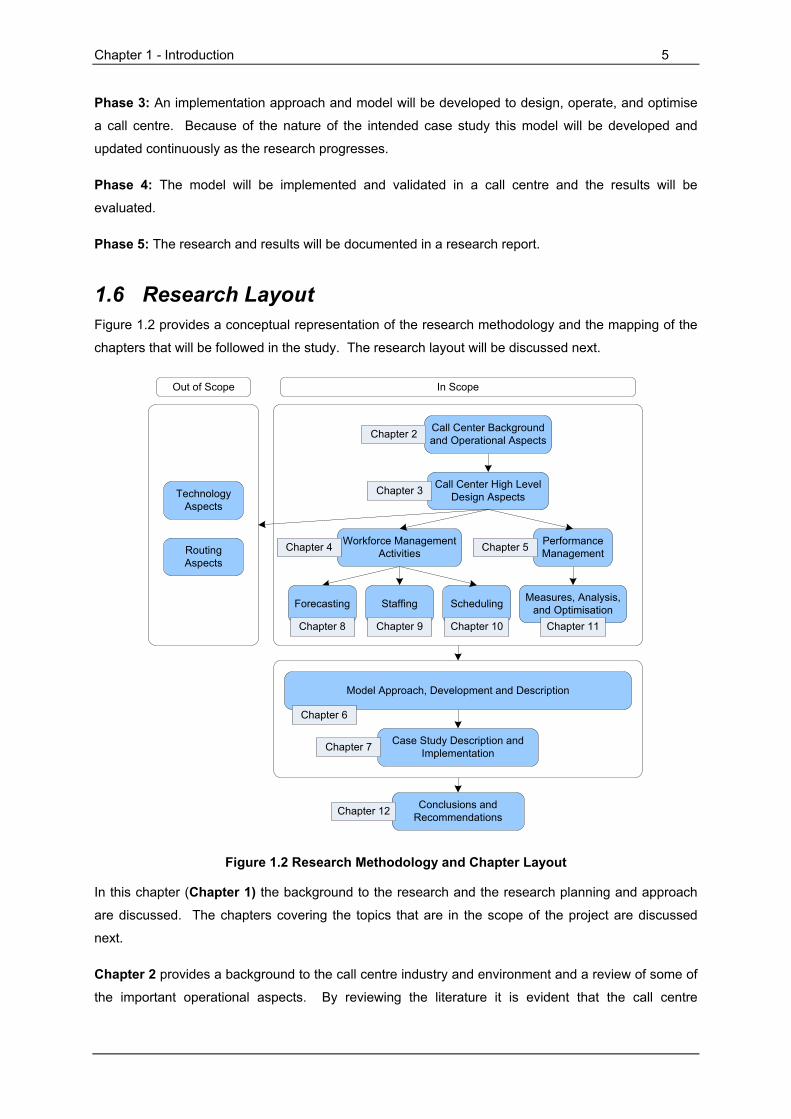
1.6 Research Layout Figure 1.2 provides a conceptual representation of the research methodology and the mapping of the
chapters that will be followed in the study. The research layout will be discussed next.
Staffing Scheduling Measures, Analysis, and Optimisation
Call Center High Level Design Aspects
Call Center Background and Operational Aspects
Performance Management
Workforce Management Activities
Forecasting
Case Study Description and Implementation
Conclusions and Recommendations
Model Approach, Development and Description
Technology Aspects
Routing Aspects
Out of Scope In Scope
Chapter 3
Chapter 2
Chapter 8
Chapter 5
Chapter 9
Chapter 12
Chapter 4
Chapter 6
Chapter 10 Chapter 11
Chapter 7
Figure 1.2 Research Methodology and Chapter Layout
In this chapter (Chapter 1) the background to the research and the research planning and approach
are discussed. The chapters covering the topics that are in the scope of the project are discussed
next.
Chapter 2 provides a background to the call centre industry and environment and a review of some of
the important operational aspects. By reviewing the literature it is evident that the call centre
Chapter 1 - Introduction 6
environment is complex and dynamic. A structured approach could therefore be essential in the
design and operation of a call centre. This prompts research into possible design aspects and
models.
Chapter 3 provides a discussion of the high level design aspects that are applicable in a call centre.
A design and planning model is covered as well as a brief description of a call centre life cycle model
and a call centre maturity model. These models provide insight into the design aspects of call centres
and also identify how these aspects relate to each other. The workforce management process and
performance measures and management are identified as playing an important role in the success of
the call centre design and operations. These topics will be researched and implemented as part of the
model development and implementation.
In Chapter 4 the capacity planning and workforce management activities in the call centre are
discussed. The forecasting, staffing, and scheduling activities are identified as the core activities that
should be examined further. The forecasting, staffing, and scheduling activities will be researched and
developed as part of the model development and implementation.
In Chapter 5 performance management aspects are discussed and the balanced scorecard approach
is identified and discussed.
In Chapter 6 a revised model is developed and proposed based on the research conducted and the
findings it produced. This model is to be used in the call centre of the case study. The model will be a
high level approach with the specific details being discussed in the following chapters.
Chapter 7 is a discussion of the implementation of the modelling approach in the case study call
centre. A background and description of the case study is provided as well as a discussion of the
initial implementation of the modelling approach. The detailed discussions of the workforce
management and performance management implementation are provided in the following chapters.
Chapter 8 contains the discussion of the forecasting model that was developed as part of the
workforce management process as well as the implementation in the call centre.
Chapter 9 contains the discussion of the staffing model that was developed as part of the workforce
management process as well as the implementation in the call centre.
Chapter 10 contains the discussion of the scheduling and rostering model that was developed as part
of the workforce management process as well as the implementation in the call centre.
Chapter 11 contains the discussion of the performance management model that was developed for
the call centre in the case study as well as the implementation of it. The typical measurements and
analysis of operations is also provided.
In Chapter 12 the results, conclusions, and recommendations of the research is discussed as well as
recommendations for further research.

Chapter 1 - Introduction 7
The topics that have been identified but not included in the scope of this research are the technology
aspects and the routing aspects. These are both important considerations in the design, operation,
and optimisation activities of call centres. These aspects will however not be discussed in detail as
separate topics, but will be discussed where it is applicable in the context of the topics that have been
defined in the scope of the research.
Chapter 2 - Call Centre Overview 8
Chapter 2 Call Centre Overview
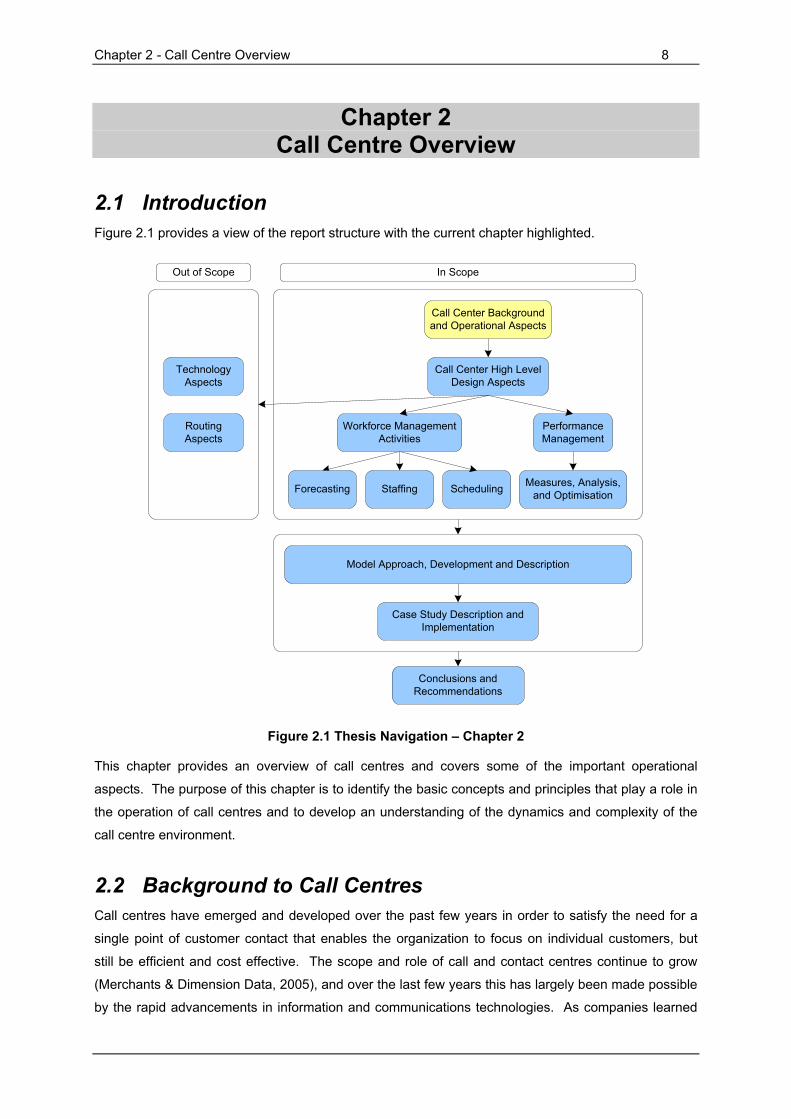
2.1 Introduction Figure 2.1 provides a view of the report structure with the current chapter highlighted.
Staffing Scheduling Measures, Analysis, and Optimisation
Call Center High Level Design Aspects
Call Center Background and Operational Aspects
Performance Management
Workforce Management Activities
Forecasting
Case Study Description and Implementation
Conclusions and Recommendations
Model Approach, Development and Description
Technology Aspects
Routing Aspects
Out of Scope In Scope
Figure 2.1 Thesis Navigation – Chapter 2
This chapter provides an overview of call centres and covers some of the important operational
aspects. The purpose of this chapter is to identify the basic concepts and principles that play a role in
the operation of call centres and to develop an understanding of the dynamics and complexity of the
call centre environment.
2.2 Background to Call Centres Call centres have emerged and developed over the past few years in order to satisfy the need for a
single point of customer contact that enables the organization to focus on individual customers, but
still be efficient and cost effective. The scope and role of call and contact centres continue to grow
(Merchants & Dimension Data, 2005), and over the last few years this has largely been made possible
by the rapid advancements in information and communications technologies. As companies learned
Chapter 2 - Call Centre Overview 9
that service is the key to attracting and maintaining customers, the perception of the call centre has
changed (Dawson, 2004).
Managing customer access and relationships is a key driver of bottom-line profits. Today’s customers
put great value on timely access to information. In fact, the vision of the customer “access centre” of
the future is to make information accessible to customers at any time, from anywhere, in any form, and
for free. This ease of customer access is fast emerging as the critical element of a global business
strategy. Customers will deal preferentially with those companies deemed most accessible (Anton,
Bapat & Hall, 1999)
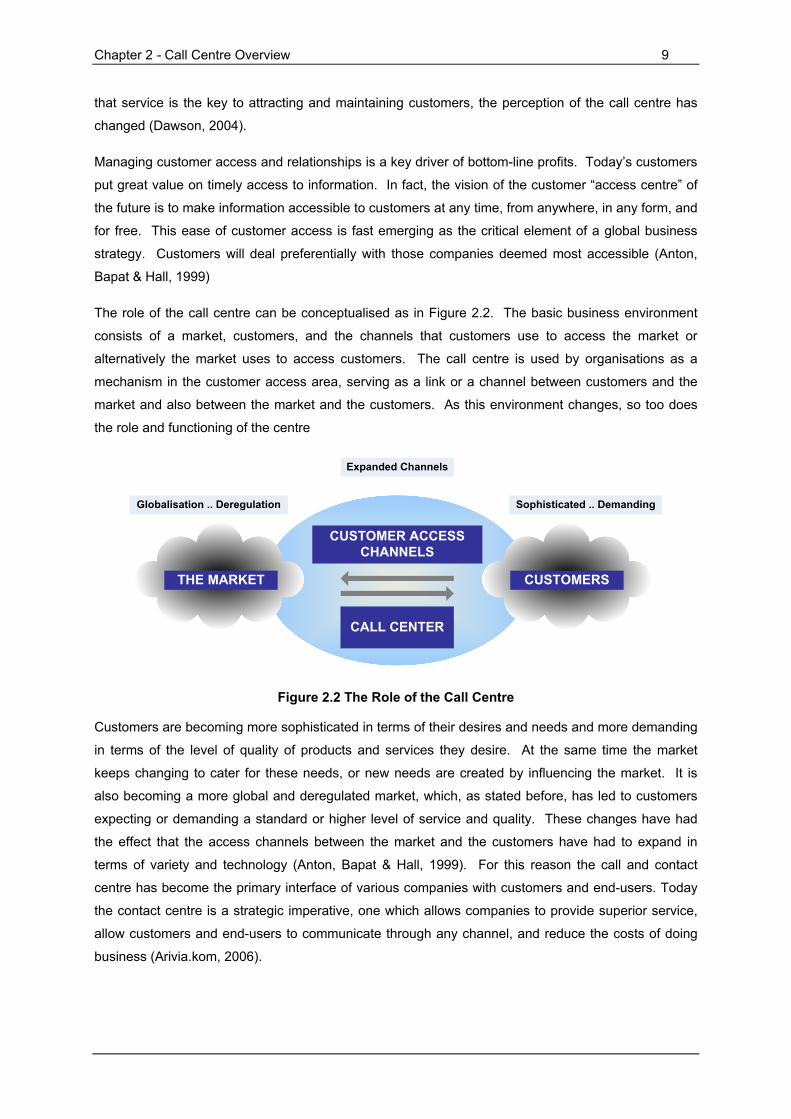
The role of the call centre can be conceptualised as in Figure 2.2. The basic business environment
consists of a market, customers, and the channels that customers use to access the market or
alternatively the market uses to access customers. The call centre is used by organisations as a
mechanism in the customer access area, serving as a link or a channel between customers and the
market and also between the market and the customers. As this environment changes, so too does
the role and functioning of the centre
CUSTOMER ACCESS CHANNELS
CALL CENTER
Expanded Channels
Globalisation .. Deregulation Sophisticated .. Demanding
THE MARKET CUSTOMERS
Figure 2.2 The Role of the Call Centre
Customers are becoming more sophisticated in terms of their desires and needs and more demanding
in terms of the level of quality of products and services they desire. At the same time the market
keeps changing to cater for these needs, or new needs are created by influencing the market. It is
also becoming a more global and deregulated market, which, as stated before, has led to customers
expecting or demanding a standard or higher level of service and quality. These changes have had
the effect that the access channels between the market and the customers have had to expand in
terms of variety and technology (Anton, Bapat & Hall, 1999). For this reason the call and contact
centre has become the primary interface of various companies with customers and end-users. Today
the contact centre is a strategic imperative, one which allows companies to provide superior service,
allow customers and end-users to communicate through any channel, and reduce the costs of doing
business (Arivia.kom, 2006).
Chapter 2 - Call Centre Overview 10
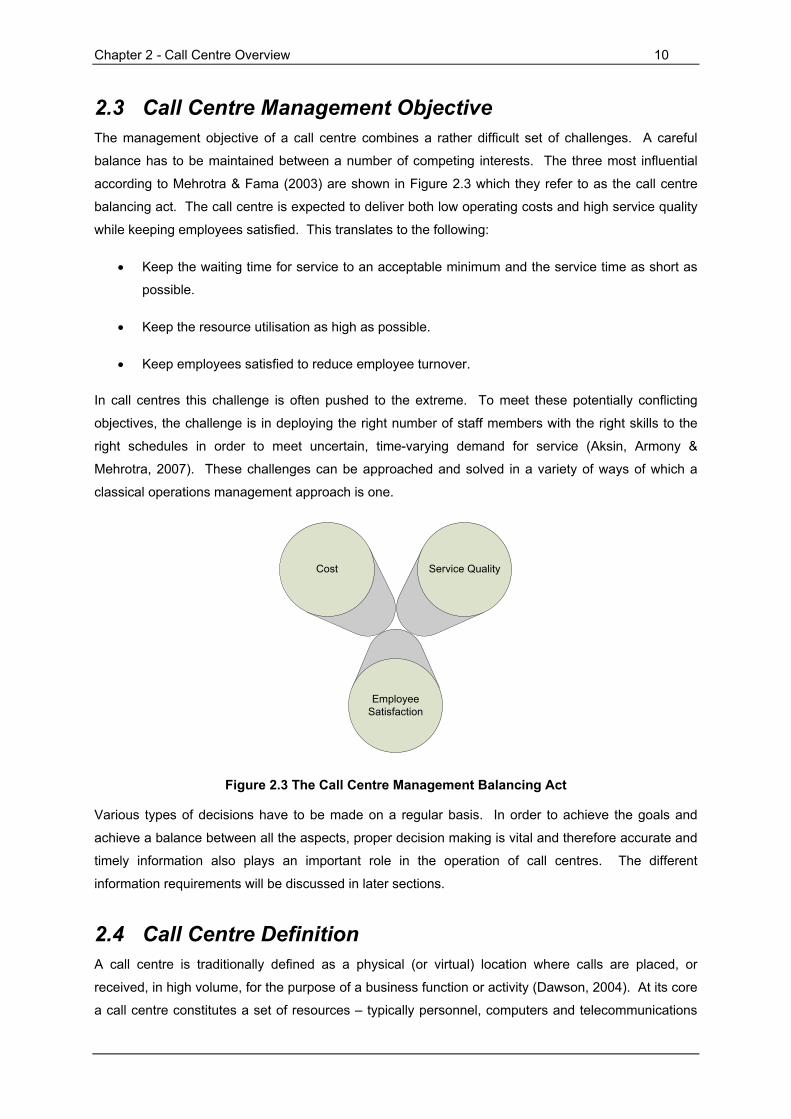
2.3 Call Centre Management Objective The management objective of a call centre combines a rather difficult set of challenges. A careful
balance has to be maintained between a number of competing interests. The three most influential
according to Mehrotra & Fama (2003) are shown in Figure 2.3 which they refer to as the call centre
balancing act. The call centre is expected to deliver both low operating costs and high service quality
while keeping employees satisfied. This translates to the following:
• Keep the waiting time for service to an acceptable minimum and the service time as short as
possible.
• Keep the resource utilisation as high as possible.
• Keep employees satisfied to reduce employee turnover.
In call centres this challenge is often pushed to the extreme. To meet these potentially conflicting
objectives, the challenge is in deploying the right number of staff members with the right skills to the
right schedules in order to meet uncertain, time-varying demand for service (Aksin, Armony &
Mehrotra, 2007). These challenges can be approached and solved in a variety of ways of which a
classical operations management approach is one.
Employee Satisfaction
Service QualityCost
Figure 2.3 The Call Centre Management Balancing Act
Various types of decisions have to be made on a regular basis. In order to achieve the goals and
achieve a balance between all the aspects, proper decision making is vital and therefore accurate and
timely information also plays an important role in the operation of call centres. The different
information requirements will be discussed in later sections.
2.4 Call Centre Definition A call centre is traditionally defined as a physical (or virtual) location where calls are placed, or
received, in high volume, for the purpose of a business function or activity (Dawson, 2004). At its core
a call centre constitutes a set of resources – typically personnel, computers and telecommunications
Chapter 2 - Call Centre Overview 11
equipment – which enable the delivery of services via the telephone (Gans, Koole & Mandelbaum,
2003). They are generally set up as large rooms, with workstations that include a computer, a
telephone set (headset) hooked into a large switch and one or more supervisor stations (Dawson,
2004). The personnel that man the workstations are usually referred to as agents or customer service
representatives (CSR).
The business functions that call centres perform are highly varied and some of these include customer
service, help desk, emergency response services, sales, marketing, telemarketing, technical support
and order taking. They also vary in size and geographic dispersion, from small sites to large national
or international centres. The centre may stand by itself, or be linked with other centres. The latest
telecommunications and information technology allow a call centre to be viewed as a virtual
embodiment of several geographically dispersed operations. Most centres are linked to a corporate
data network, including mainframes, microcomputers and LAN's (Dawson, 2004).
The type and organisation of work may also vary widely across different centres. A centre may handle
only one type of call or to the other extreme, handle a large variety of calls, each requiring different
knowledge and skills. In some situations factors such as language and culture of customers have to
be taken into account as well. When the skill level required to handle calls is low, the agents may be
cross-trained to handle every type of call. In situations where highly skilled work is required, different
agents or groups of agents may be trained to handle only a subset of the types of calls that the centre
serves, and the calls are routed to the appropriate agents through a “skills-based routing” system.
The organisational structure may also vary from a flat structure (where all agents are exposed to calls)
to a multi-layered structure (where each layer represents a level of expertise) and customers may be
transferred through several layers before being served to satisfaction. Different situations therefore
require different approaches to call handling and play an important role in the servicing of customers.
2.5 Contact Centre Definition Traditionally a central characteristic of a call centre was whether it handles inbound (calls initiated by
outside callers in to the centre) or outbound (calls that are initiated from within the centre to outside
callers) traffic. Although this might still be true in some cases, most modern call centres are capable
of handling both types of traffic and different types of communication media/channels. In fact, a
current trend is the extension of the call centre into a contact centre.
The contact centre can be defined as a call centre that is complemented by other communication (or
contact) channels or stated otherwise, it is a centre that has the ability to handle a wide range of
(customer contact) media. The most common examples of these include email, fax, web pages
(customer info, queries or orders placed on the website), chat (communication in real time over the
internet using text) and call backs (customers signal via a website or some other medium that they
wish to be called back by the centre). Any type of electronically mediated work can therefore be
included in the contact centre.
Chapter 2 - Call Centre Overview 12
The trend towards the contact centre has largely been stimulated by the growing importance of the
internet, the development of new Information and Communication Technologies, customer demand for
channel variety and the potential for efficiency gains. Especially the integration of telephony and data-
processing infrastructure has allowed call centres to expand their range and provide additional
services.
Most organisations and literature still refer to their centres as call centres, even though it might have
more capabilities than servicing just basic phone calls. Other more accurate names that are used to
describe the evolved call centre are (as mentioned before) contact centres and customer access
centres.
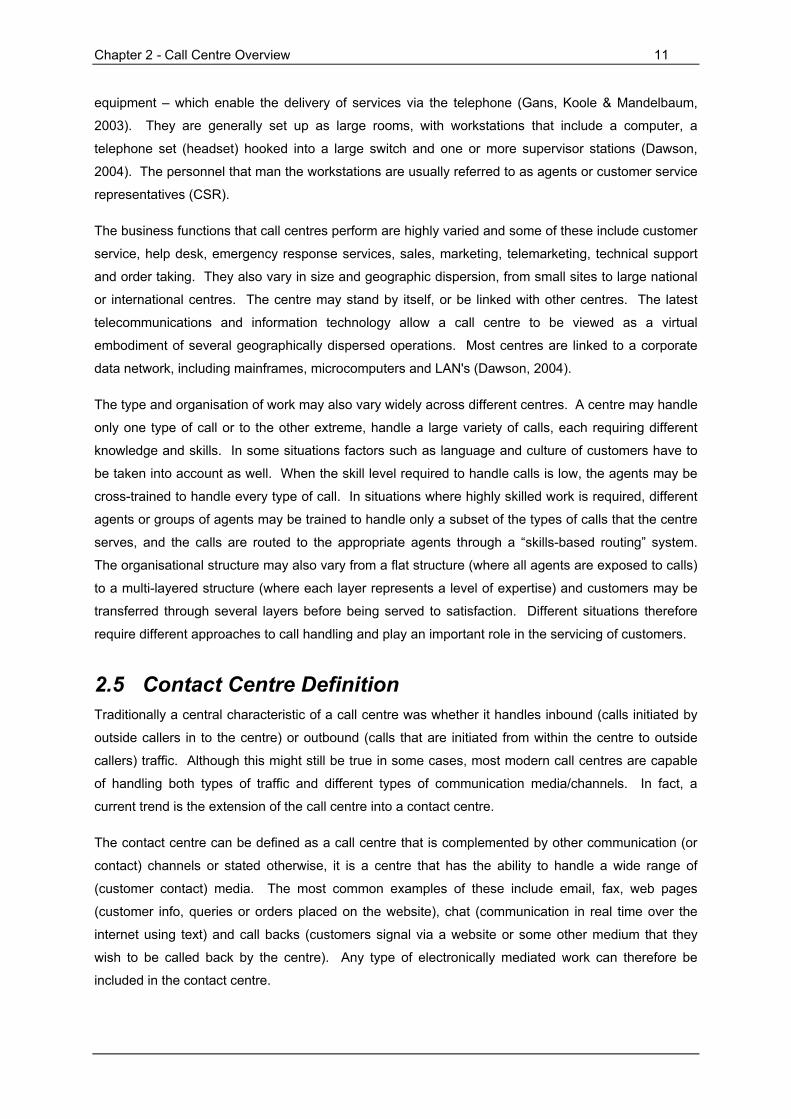
2.6 The Operation of a Call Centre The operation of a basic call centre is shown schematically in Figure 2.4 and explained in the following
paragraphs.
Figure 2.4 The Functioning of a Basic Call Centre
A Customer calls the number of the call centre (this could be an ordinary number or a toll-free number)
via a private switched telephone network (PSTN). The PSTN can usually provide the number from
which the call originates (automatic number identification or ANI) and the number being dialled (dialled
number identification service or DNIS). The PSTN uses the ANI and DNIS to connect callers to the
centre. The organization or call centre usually has its own privately owned switch called a private
automatic branch exchange (PABX or PBX for short) and the callers DNIS locates the PABX on the
PSTN’s network. The organization’s private automatic branch exchange (PABX) is connected to the
PSTN through a number of telephone lines, often called trunk lines. If there are one or more trunk
lines free, then the call will be connected to the PABX. Otherwise, the caller will receive a busy signal.
Once the call is connected it may be served in a number of phases.
At first, calls may be connected through the PABX to an Interactive Voice Response (IVR) that queries
customers on their needs. The customer can then select from a list of options which service is
required. In this case it can sometimes be that the customer can complete service without needing to

Chapter 2 - Call Centre Overview 13
speak to an agent. Customers may also communicate a need or desire to speak with an agent, and in
this case calls are handed from the IVR to an automatic call distributor (ACD). An ACD is a
specialized switch, one that is designed to route calls, connected via the PABX, to individual agents
within the call centre. Modern ACD’s are highly sophisticated, and they can be programmed to route
calls based on many criteria.
The capabilities of agents may also be used in the routing of calls. For example, when agents begin
working, they log into the centre’s ACD. Their log-in ID’s are then used to retrieve records that
describe whether they are qualified to handle certain types of calls, as well as whether or not they are
proficient in the language specified by the customer. Given the call’s status, as well as that of the
agents that are currently idle and available to take a call, the incoming call may be routed to the “best”
available agent. If no suitable agent is free to take the call, the ACD may keep the call “on hold” and
the customer waits until such an agent is available. While the decision of whether and to which agent
to route the call may be programmed in advance, the rules that are needed to solve this “skills-based
routing” problem can turn out to be very complex. Customers that are put on hold are typically
exposed to music, commercials, or other information. A welcome, evolving trend is to provide delayed
customers with predictions of their anticipated wait. Delayed customers may judge that the service
they seek is not “worth” the wait, become impatient, and hang up before they are served. In this case,
they are said to abandon the queue. Customers that do not abandon are eventually connected to an
agent.
Once connected with a customer, agents can speak on the telephone while, at the same time, they
work via a PC or terminal with a corporate information system. Computer telephony integration (CTI)
“middleware” can be used to more closely integrate the telephone and information systems. For
instance, CTI is the means by which a call’s ANI is used to identify a caller and route a call: It takes
the ANI and uses it to query a customer database in the company’s information systems; if there
exists a customer in the database with the same ANI, then routing information from that customer’s
record is returned. Similarly, CTI can be used to automatically display a caller’s customer record on
an agent’s workstation screen. By eliminating the need for the agent to ask the caller for an account
number and to enter the number into the information system, this so called “screen pop” saves the
agent time and reduces the call’s duration. If applied uniformly, it can also reduce variability among
service times, thus improving the standardization of call-handling procedures.
In more sophisticated settings, CTI is used to integrate a special information system, called a
customer relationship management (CRM) system, into the call centre’s operations. CRM systems
track customers’ records and allow them to be used in operating decisions. For example, a CRM
system may record customer history and preferences, and allow agents (or IVR’s) to automatically
deliver more customized service. A CRM system may also enable a screen pop to include the history
of the customer’s previous calls and, if relevant, figures of past transactions the customer has
generated. It may even suggest cross-selling or up-selling opportunities, or it may be used to route
the incoming call to an agent with special cross-selling skills.

Chapter 2 - Call Centre Overview 14
Once a call begins service, it can follow a number of paths. In the simplest case, the agent handles
the caller’s request, and the caller hangs up. Even here, the service need not end; instead, the agent
may spend some time on wrap-up activities, such as an updating of the customer’s history file or the
processing of an order that the customer has requested. It may also be the case that the agent
cannot completely serve the customer and the call must be transferred to another agent. Sometimes
there are several such hand-offs. Finally, the service need not end with the call. Callers who are
blocked or abandon the queue may try to call again, in which case they become retrials. Callers who
speak with agents but are unable to resolve their problems may also call again, in which case they
become returns. Satisfactory service can also lead to returns (Gans, Koole & Mandelbaum, 2003).
This description is of a typical call centre. The hardware and software used in modern call centres
may differ from this explanation in some aspects but the basic configuration and workflow is applicable
to most call centres. As mentioned earlier, the evolution of the call centre to the contact centre
includes more communication channels such as e-mail, web-chat, Voice over IP (VOIP), Web call
back, fax, mobile phone call back – all the real and hypothetic customer interaction that are available
or possible. These channels each use different technologies to connect to the call centre, but the
routing of these mediums inside the centre to the agents can be approached in the same way as
normal calls. Mixing different types of contacts can however increase the level of complexity of the
call centre operations.
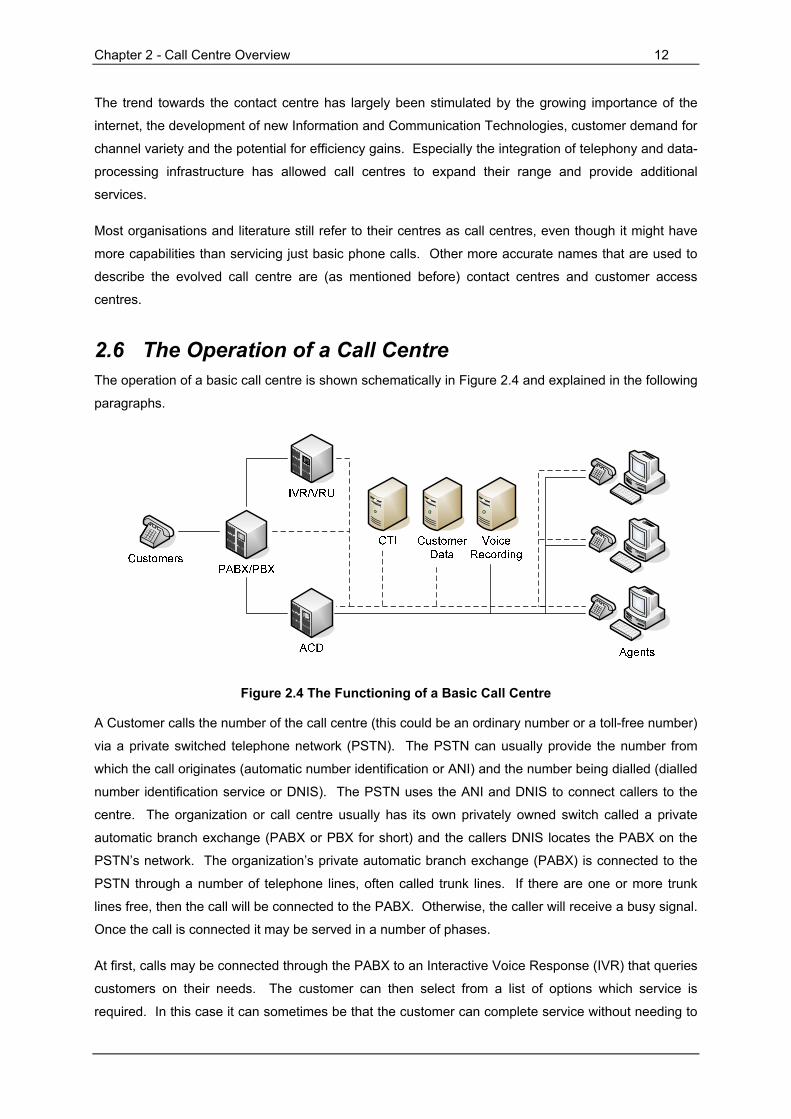
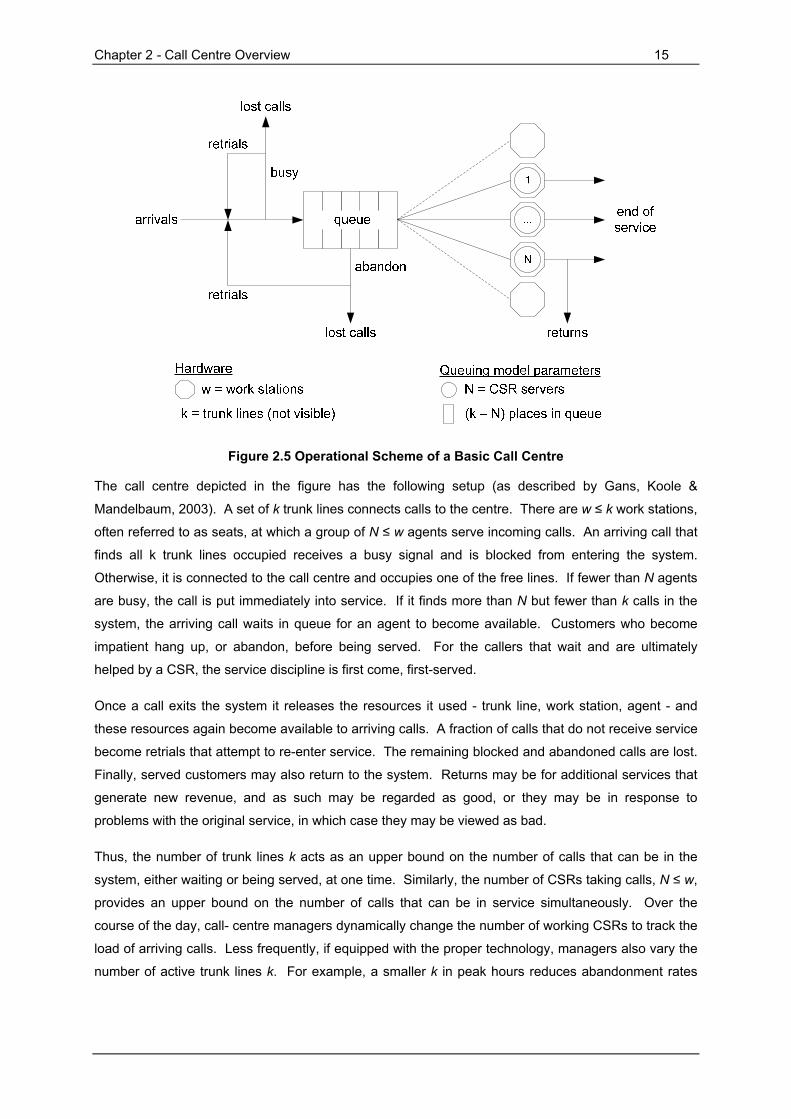
2.7 Modelling the Centre as a Queuing System Figure 2.5 depicts a simplified operational scheme of a basic call centre. From the figure the
relationship between call centres and queuing systems can clearly be seen (Gans, Koole &
Mandelbaum, 2003).
Chapter 2 - Call Centre Overview 15
Figure 2.5 Operational Scheme of a Basic Call Centre
The call centre depicted in the figure has the following setup (as described by Gans, Koole &
Mandelbaum, 2003). A set of k trunk lines connects calls to the centre. There are w ≤ k work stations,
often referred to as seats, at which a group of N ≤ w agents serve incoming calls. An arriving call that
finds all k trunk lines occupied receives a busy signal and is blocked from entering the system.
Otherwise, it is connected to the call centre and occupies one of the free lines. If fewer than N agents
are busy, the call is put immediately into service. If it finds more than N but fewer than k calls in the
system, the arriving call waits in queue for an agent to become available. Customers who become
impatient hang up, or abandon, before being served. For the callers that wait and are ultimately
helped by a CSR, the service discipline is first come, first-served.
Once a call exits the system it releases the resources it used - trunk line, work station, agent - and
these resources again become available to arriving calls. A fraction of calls that do not receive service
become retrials that attempt to re-enter service. The remaining blocked and abandoned calls are lost.
Finally, served customers may also return to the system. Returns may be for additional services that
generate new revenue, and as such may be regarded as good, or they may be in response to
problems with the original service, in which case they may be viewed as bad.
Thus, the number of trunk lines k acts as an upper bound on the number of calls that can be in the
system, either waiting or being served, at one time. Similarly, the number of CSRs taking calls, N ≤ w,
provides an upper bound on the number of calls that can be in service simultaneously. Over the
course of the day, call- centre managers dynamically change the number of working CSRs to track the
load of arriving calls. Less frequently, if equipped with the proper technology, managers also vary the
number of active trunk lines k. For example, a smaller k in peak hours reduces abandonment rates

Chapter 2 - Call Centre Overview 16
and waiting (as well as the associated costs); this advantage can be traded off against the increase in
busy signals.
For any fixed N, one can construct an associated queuing model in which callers are customers, the N
CSRs are servers, and the queue consists of callers that await service by CSRs. When N changes,
(k−N), the number of spaces in queue, changes as well. The model primitives for this system would
include statistics for the arrival, abandonment, and service processes. Fundamental model outputs
would include the long-run fraction of customers abandoning, the steady-state distribution of delay in
queue, and the long-run fraction of time that servers are busy.
These types of queuing models are used extensively in the management of call centres. The simplest
and most widely used model is that of an M/M/N queue, also known as the Erlang C model. For many
applications, however, the model is an oversimplification and various assumptions have to be made.
The Erlang C and other models will be discussed in later chapters.
In practice, the service process illustrated above is often much more complicated. The incorporation
of an IVR, with which customers interact prior to joining the agents’ queue, creates two stations in
tandem: an IVR followed by CSRs. The inclusion of a centralized information system adds a resource
whose capacity is shared by the set of active CSRs, as well as by others who may not even be in the
call centre. The concept becomes far more complex if one considers multiple teams of specialized or
cross-trained agents that are geographically dispersed over several interconnected call centres, and
who are faced with time-varying loads of calls and other media (email, callbacks, etc.) from multiple
types of customers.
2.8 Call Flow Organisation All call centres have an organisational structure and understanding the structure and potential
alternatives can be of great importance in determining the most effective structure that suites the
current and planned operation (Klenke, 2006 a).
There are several approaches for organising the staffing and workflow in the centre. The most
common approaches will be discussed in the following sections.
2.8.1 Single Agent Queuing Historically the easiest and most common option is to assign or link each agent to different queues.
Each queue contains a different type of call or work item and agents are assigned to queues if they
possess the necessary skills or according to the volume of work available in the queues. The principle
is shown in Figure 2.6.
Chapter 2 - Call Centre Overview 17
3 5421
Queues
Agents
Figure 2.6 Single Agent Queuing
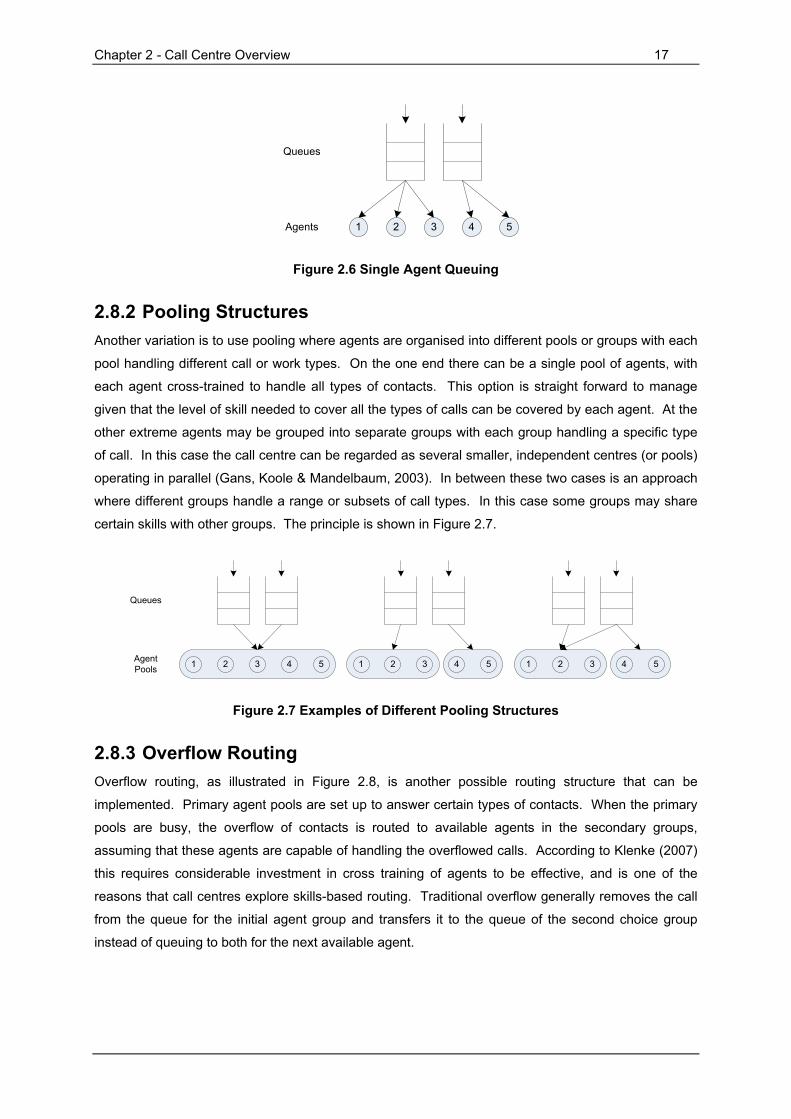
2.8.2 Pooling Structures Another variation is to use pooling where agents are organised into different pools or groups with each
pool handling different call or work types. On the one end there can be a single pool of agents, with
each agent cross-trained to handle all types of contacts. This option is straight forward to manage
given that the level of skill needed to cover all the types of calls can be covered by each agent. At the
other extreme agents may be grouped into separate groups with each group handling a specific type
of call. In this case the call centre can be regarded as several smaller, independent centres (or pools)
operating in parallel (Gans, Koole & Mandelbaum, 2003). In between these two cases is an approach
where different groups handle a range or subsets of call types. In this case some groups may share
certain skills with other groups. The principle is shown in Figure 2.7.
3 54213 5421 3 5421
Queues
Agent Pools
Figure 2.7 Examples of Different Pooling Structures
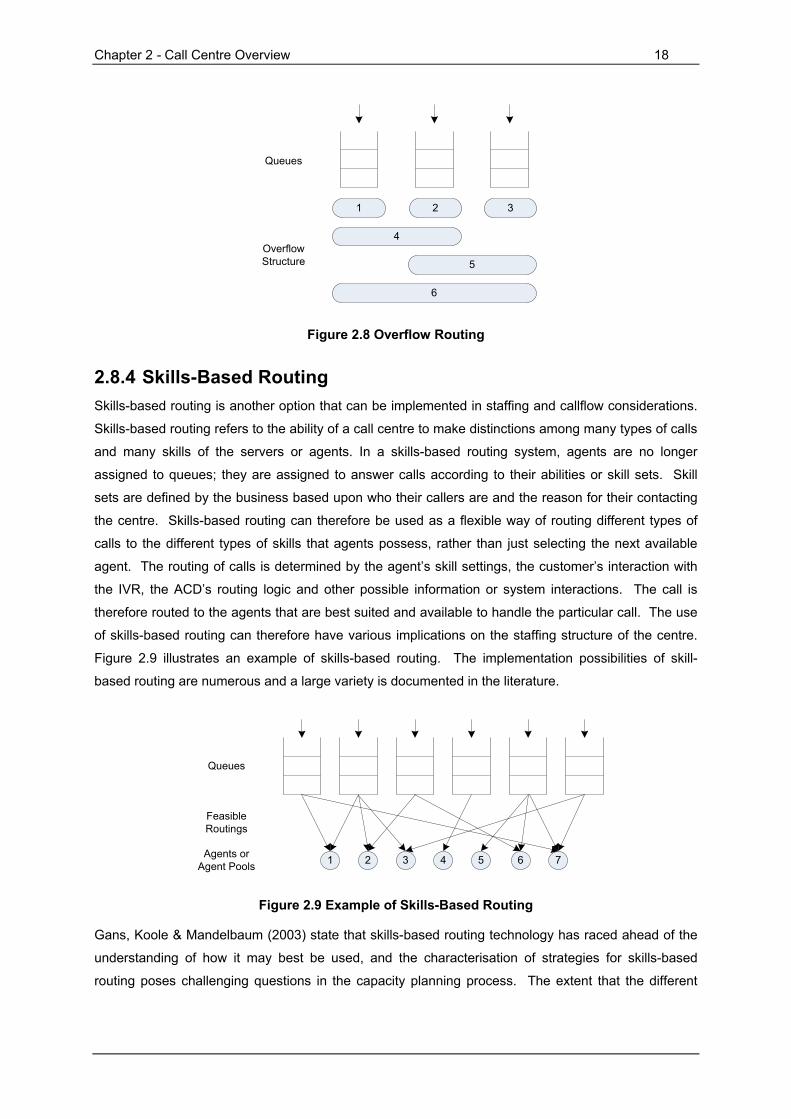
2.8.3 Overflow Routing Overflow routing, as illustrated in Figure 2.8, is another possible routing structure that can be
implemented. Primary agent pools are set up to answer certain types of contacts. When the primary
pools are busy, the overflow of contacts is routed to available agents in the secondary groups,
assuming that these agents are capable of handling the overflowed calls. According to Klenke (2007)
this requires considerable investment in cross training of agents to be effective, and is one of the
reasons that call centres explore skills-based routing. Traditional overflow generally removes the call
from the queue for the initial agent group and transfers it to the queue of the second choice group
instead of queuing to both for the next available agent.
Chapter 2 - Call Centre Overview 18
2 31
4
5
6
Queues
Overflow Structure
Figure 2.8 Overflow Routing
2.8.4 Skills-Based Routing Skills-based routing is another option that can be implemented in staffing and callflow considerations.
Skills-based routing refers to the ability of a call centre to make distinctions among many types of calls
and many skills of the servers or agents. In a skills-based routing system, agents are no longer
assigned to queues; they are assigned to answer calls according to their abilities or skill sets. Skill
sets are defined by the business based upon who their callers are and the reason for their contacting
the centre. Skills-based routing can therefore be used as a flexible way of routing different types of
calls to the different types of skills that agents possess, rather than just selecting the next available
agent. The routing of calls is determined by the agent’s skill settings, the customer’s interaction with
the IVR, the ACD’s routing logic and other possible information or system interactions. The call is
therefore routed to the agents that are best suited and available to handle the particular call. The use
of skills-based routing can therefore have various implications on the staffing structure of the centre.
Figure 2.9 illustrates an example of skills-based routing. The implementation possibilities of skill-
based routing are numerous and a large variety is documented in the literature.
Queues
3 5421 6 7
Feasible Routings
Agents or Agent Pools
Figure 2.9 Example of Skills-Based Routing
Gans, Koole & Mandelbaum (2003) state that skills-based routing technology has raced ahead of the
understanding of how it may best be used, and the characterisation of strategies for skills-based
routing poses challenging questions in the capacity planning process. The extent that the different
Chapter 2 - Call Centre Overview 19
callflow organisation methods is applied in the centre can play an important role, but it also adds to the
complexity of the planning and management of the operation.
2.8.5 Contact Blending Call blending is a term that is traditionally used to describe the integration of inbound and outbound
calling functions. With call blending agents are able to receive inbound calls and make outbound calls
on one system. It is therefore possible to shift agents between doing outbound or inbound calls
depending on the volume of the work, or agents are able to do both types with priorities assigned
according to the demand.
More recently with the evolution to the contact centre the term multimedia is used more often to
describe the capabilities of contact centres to integrate different types of media. Blending multiple
types of contacts or media is however not as straightforward as only phone calls. Gans, Koole &
Mandelbaum (2003) state that multimedia may be thought of as an extended example of skill-based
routing. The various types of work (calls, email, etc.) parallel various call types and each agent’s skills
define the types of media the agent is capable of handling.
One aspect to keep in mind is that the differences among media are greater than the differences
among calls. The most important difference is the time scales at which the various media must be
responded to. For instance, telephone calls should be responded to within seconds or minutes and
should not be interrupted. Response to email and faxes can however be delayed for hours or days
and may be interrupted. These differences naturally lead to the consideration of priority schemes in
which telephone calls receive high priority and other media lower priorities (Gans, Koole &
Mandelbaum, 2003). Limitations in the structuring of shifts and schedules often prompt the solution to
staffing problems to include periods of over capacity. Agents that might be idle during these periods
can be productive by handling low-priority work.
The blending of media can have various advantages but it also adds a great amount of complexity in
the planning and operation of a contact centre. It is possible to increase agent productivity in periods
of inactivity and the complete reliance on workforce management tools can also be reduced to a
certain degree (Whit, 2001). Great care has to be taken when considering and implementing any of
the staffing and workflow organisation methods. As with any powerful tool it is only valuable if it is
properly understood and utilised.
The benefits that can come from implementing any of the structures mentioned will be specific to the
context of each operation. If contacts can be queued for all potentially capable agents rather than only
one group at a time, some efficiency could be gained and calls could be answered faster (Klenke,
2007). If agents can be activated to take every type of call they are skilled for, better utilisation of
agents could result (Klenke, 2007). The primary focus on what type of structure to implement should
be aimed at differentiating callers from each other and treating them in the most appropriate way (this
is what is referred to as customer segmentation). Implementing the call flow structures mentioned
Chapter 2 - Call Centre Overview 20
above may bring with it a level of design and management complexity that must be clearly understood
before any implementation decisions can be made.
2.9 Data Generation and Reporting Call centres generate large amounts of data through their operations. Systems such as the ACD use
data to determine the flow of calls, and each time an action is taken data is recorded. Examples
include the call’s identification number, the actions taken during the call, the time elapsed between
actions, etc. From these records the history of each call that enters the system can be constructed.
Typical data for a call would be the time the call was placed, what actions were taken in the IVR, the
time the call waited in the queue, which agent served the call, the duration of the call, etc. If the centre
uses CTI, additional data from other information systems can also be included.
Call centres have not typically stored or analysed records of individual calls (Gans, Koole &
Mandelbaum, 2003). This may have been largely due to the high cost of maintaining large databases
and the software developed for the analysis of the data only used simple models with limited summary
statistics. Gans, Koole & Mandelbaum (2003) also state that another reason might be due to a lack of
understanding of how and why more detailed analysis should be carried out. Therefore most call
centres often summarise call data from systems such as the ACD as averages that are calculated
over short time intervals, usually 15, 30 or 60 minutes in length. This information is typically used for
the measurement of system performance and planning purposes. Some of the typical measures will
be discussed in later sections.
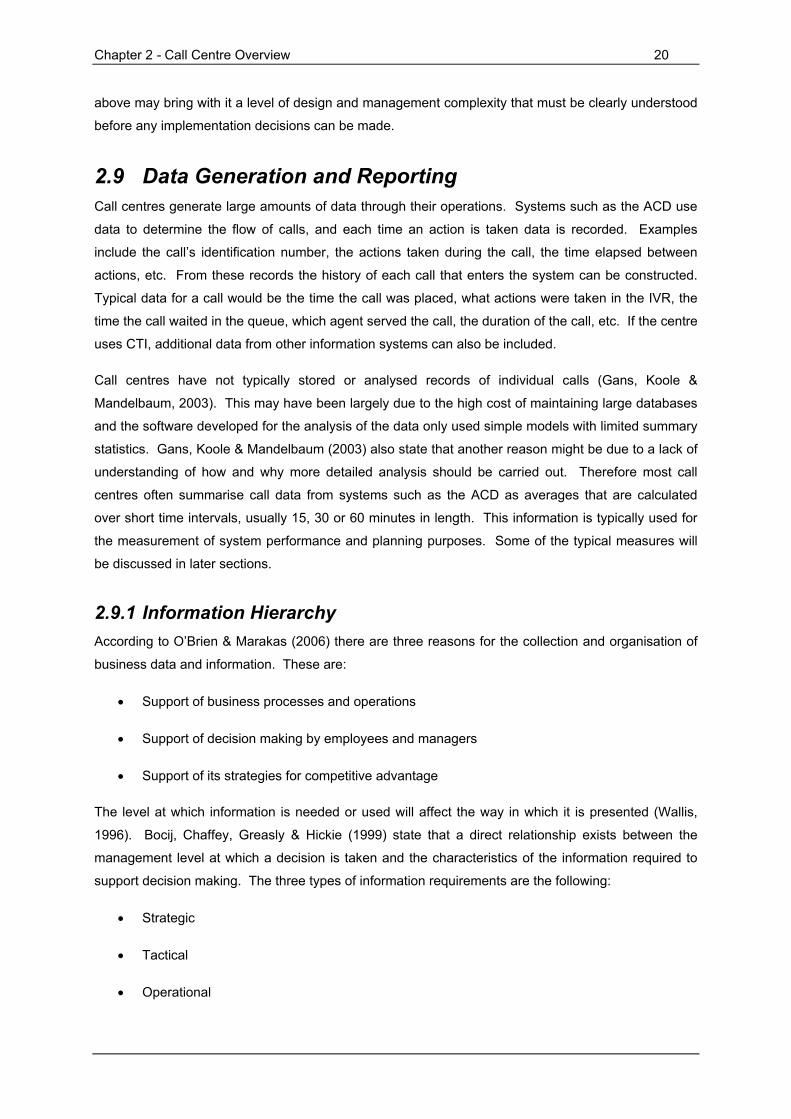
2.9.1 Information Hierarchy According to O’Brien & Marakas (2006) there are three reasons for the collection and organisation of
business data and information. These are:
• Support of business processes and operations
• Support of decision making by employees and managers
• Support of its strategies for competitive advantage
The level at which information is needed or used will affect the way in which it is presented (Wallis,
1996). Bocij, Chaffey, Greasly & Hickie (1999) state that a direct relationship exists between the
management level at which a decision is taken and the characteristics of the information required to
support decision making. The three types of information requirements are the following:
• Strategic
• Tactical
• Operational
Chapter 2 - Call Centre Overview 21
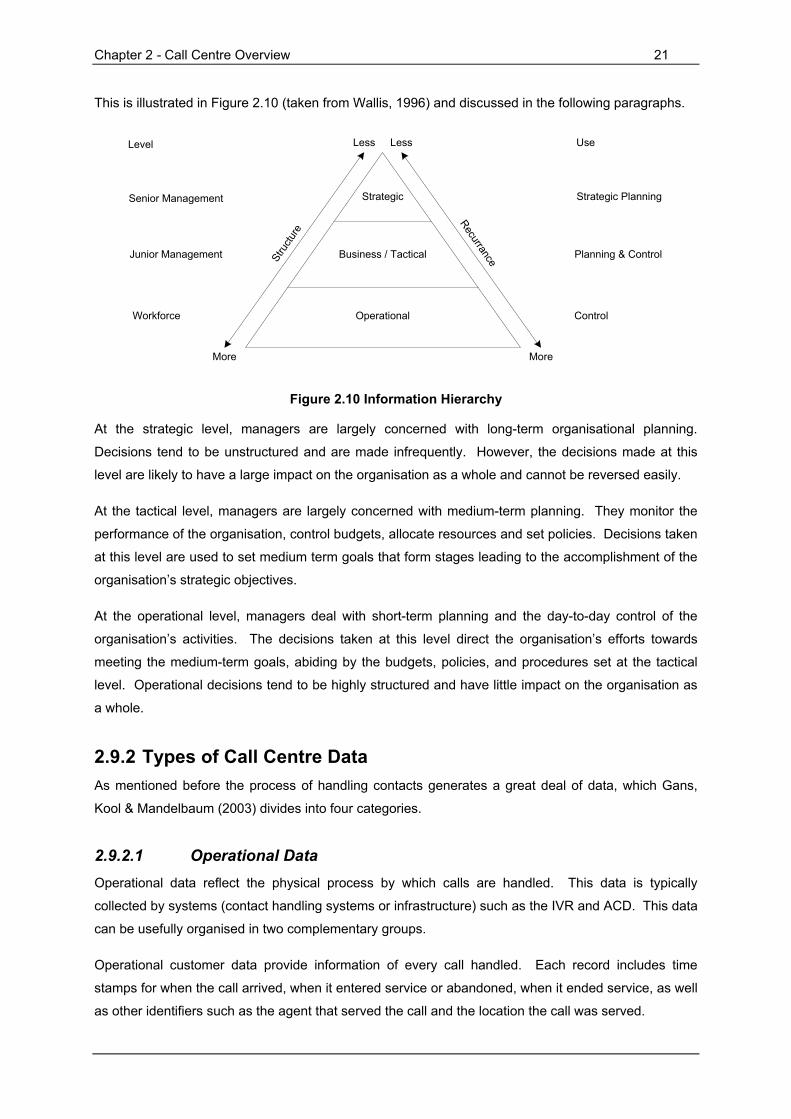
This is illustrated in Figure 2.10 (taken from Wallis, 1996) and discussed in the following paragraphs.
Strategic
Business / Tactical
Operational
Less Less
More More
Stru
cture
Recurrance
Level
Workforce
Junior Management
Senior Management Strategic Planning
Planning & Control
Control
Use
Figure 2.10 Information Hierarchy
At the strategic level, managers are largely concerned with long-term organisational planning.
Decisions tend to be unstructured and are made infrequently. However, the decisions made at this
level are likely to have a large impact on the organisation as a whole and cannot be reversed easily.
At the tactical level, managers are largely concerned with medium-term planning. They monitor the
performance of the organisation, control budgets, allocate resources and set policies. Decisions taken
at this level are used to set medium term goals that form stages leading to the accomplishment of the
organisation’s strategic objectives.
At the operational level, managers deal with short-term planning and the day-to-day control of the
organisation’s activities. The decisions taken at this level direct the organisation’s efforts towards
meeting the medium-term goals, abiding by the budgets, policies, and procedures set at the tactical
level. Operational decisions tend to be highly structured and have little impact on the organisation as
a whole.
2.9.2 Types of Call Centre Data As mentioned before the process of handling contacts generates a great deal of data, which Gans,
Kool & Mandelbaum (2003) divides into four categories.
2.9.2.1 Operational Data Operational data reflect the physical process by which calls are handled. This data is typically
collected by systems (contact handling systems or infrastructure) such as the IVR and ACD. This data
can be usefully organised in two complementary groups.
Operational customer data provide information of every call handled. Each record includes time
stamps for when the call arrived, when it entered service or abandoned, when it ended service, as well
as other identifiers such as the agent that served the call and the location the call was served.

Chapter 2 - Call Centre Overview 22
Operational agent data provide a history of the time each agent spent in various system states. Some
of these include logged-in, available to take calls, handling a call, performing wrap-up work and the
assorted unavailable states such as breaks, training, etc.
This data is typically used for planning purposes through aggregated reports. These reports usually
aggregate information over 15, 30 or 60 minute periods at the lowest level and daily, weekly and
yearly periods at higher levels.
The operational data is usually used in a real time and historical basis. Real time data ad reports
provide information on the operations and activities in the call centre as it is happening. Historical
data and reports are used to measure and analyse the call centre operations in an ongoing basis.
Operational data can also be divided into service related or call centre related data and agent related
data. Service or call centre related data provide information on the performance and service delivery
of the call centre as a whole. Agent related data provide information on the performance of individual
agents or groups.
2.9.2.2 Marketing Data Marketing or Business data is gathered by a company’s information systems (typically customer
profiles and business histories). The operational and marketing data can be integrated via CTI
software which connects the telephony switch with the company’s information systems. This
integration has mainly been used to facilitate the service process by providing agents with customer
information through “screen pops”. Other possibilities such as linking specific information about calls
are also possible although it is not used widely in practice (Gans, Koole & Mandelbaum, 2003).
2.9.2.3 Human Resources Data Human resources data record the history and profile of agents. Typical data include information on
employees’ tenure at the company, training they received, and types of skills they posses to handle
different types of calls. This data would generally reside within the records of a company’s human
resources department or otherwise managed internally by the centre.
2.9.2.4 Psychological Data Psychological data are collected from surveys of customers, agents, or managers. It records
subjective perceptions of the service and working environment. This data can provide valuable
insights, but should be handled with care.
2.9.2.5 Additional Data Sources Some companies record individual calls for legal needs, quality purposes or training reasons. These
recordings are potentially useful, but there is currently no reliable and fully automatic way to process it
for analysis purposes. Advances in speech recognition and natural language processing should
change this state of affairs in the near future however (Gans, Koole & Mandelbaum, 2003). Another
Chapter 2 - Call Centre Overview 23
source of data is subjective surveys, in which call centre managers report statistics that summarise
their operations. Reports such as these can be useful for rough benchmarking but should be handled
with care as they are biased by nature.
Most existing performance models are based on operational data (especially ACD data). The ultimate
goal however is to integrate data from al the sources mentioned before in order to understand and
quantify the role of the centre’s operational or service quality as a driver for business success (Koole &
Mandelbaum, 2002).
2.10 Data Analysis and Performance Measurements The measurement and analysis of call centre performance plays an important role in managing the
operations of a centre. The specific design of different call centres and the systems in use might
differ, but most centres use statistics on the following main categories: contact volume, service level,
service times, agent measures, quality measurements, and customer measurements. Some of the
most widely used measures will be defined in the following sections. They provide a guide as to what
factors are considered important in managing the performance of a contact centre. The measures will
be divided into service or call centre related measures and agent or group related measures. Some of
the measures do overlap in will be discussed where applicable.
2.10.1 Service or Call Centre Measures
2.10.1.1 Contact Volume The contact volume is defined as the number of contacts at a given step in the process in the contact
centre. The contact volume is critical because many of the other measures are based on it and it
plays an important role in the work force management process. It is usually expressed per contact
type and aggregated in time intervals as determined by the time frame of the specific analysis.
2.10.1.2 Contact Handle Time The handle time is the time that agents spend on handling a contact. This usually includes the time
spent handling the specific contact and the time spent performing work after the contact has ended. In
the case of a phone call it should include the time spent on the telephone and the after call work time
or wrap up time. An important factor to consider is to account for different contact types. For instance
some types of calls will typically have different call durations than other. This measure is usually
expressed as an average over a specific interval.
Average Talk Time
The average talk time (ATT) measures the actual time spent on the phone with customers. This
metric is measured by averaging the total time the agent spends on the phone and is timed from when
a call arrives at an agent station to the time it is released by an agent. It is also referred to as the call
duration.

Chapter 2 - Call Centre Overview 24
After Call Work Time
The after call work time is the time required by an agent to complete final administrative tasks such as
entering data or completing work processes triggered by the call. Alternate terms include keystroke
time and wrap up time.
2.10.1.3 Speed of Answer The speed of answer refers to the time taken to respond to customer contacts or stated otherwise the
time customers wait before being served by an agent. It is usually referred to as the average speed of
answer (ASA), the waiting time or the response time. It is usually expressed as an average over a
time interval.
2.10.1.4 Service Level The service level is a metric that describe the speed of answer performance and is the most common
measure of most contact centres. It is usually expressed as a percentage of calls answered in a given
amount of time, for instance 80% of calls answered within 20 seconds. It is also referred to as the
Telephone Service Factor (TSF).
2.10.1.5 One Call Resolution Rate One call resolution rate is the percentage of time that customer inquiries are completed on the first
contact. It therefore means that the customer’s request is handled completely during the first contact
and by the first agent to answer the call. It is also referred to as first call resolution or one-touch
service. One call resolution conveys how many customers are having their requests handled
effectively on the first call. A low rate can imply that customers are experiencing poor service,
whereas a high rate often correlates to high customer satisfaction (Prosci, 2004 a)
2.10.1.6 Abandonment Rate The abandonment rate is total number of calls abandoned (i.e. calls in which the caller chooses to
disconnect before reaching an agent) divided by the total number of calls received.
2.10.1.7 Cost Metrics Cost metrics provide information about the expenses associated with each customer contact. Various
cost metrics can be used in a contact centre environment. The typical measures include cost per
contact and cost per time interval. These costs can be measured in various ways and are usually
dependant on the requirements and objectives of the centre and the organisation.
2.10.1.8 Customer Satisfaction Measuring and analysing customer satisfaction has become an essential component in providing
excellent customer service. With the growing popularity of customer relationship management, many
Chapter 2 - Call Centre Overview 25
companies are placing more emphasis on customer satisfaction and managing customer
relationships.
Customer satisfaction can be measured by using surveys. This can either be done by using an
internal measurement department or an independent company. Another way of measuring call centre
performance from the customer perspective is to use post-call IVR surveys to gain customer feedback.
Customers are invited to take part in a short survey at the end of the call, where they can respond to
pre-recorded questions by pressing the numbers on their telephone keypad or by speaking their
comments.
Measuring customer satisfaction is beneficial because it aids in developing strategies for improving
service, becoming aware of customer expectations, and identifying reasons for customer
dissatisfaction.
These measures are standard guides and used in most contact centres. Care should be taken
however not to employ measures blindly and just for the sake of measuring. All measurements should
be part of a performance evaluation or optimisation process and have a specific purpose and therefore
drive some activity. No call centre is alike and measures can sometimes be changed to accommodate
a specific scenario or new measures can be created where necessary.
2.10.2 Agent and Group Measures
2.10.2.1 Contact Volume This measure was discussed in the previous section. It can also be applied to agent and group level,
although this is done less frequently.
2.10.2.2 Contact Handle Time This measure was discussed in the previous section. It some applications it can be useful to measure
the handle time on an agent level.
2.10.2.3 Adherence Schedule adherence is a measure of whether agents are following or adhering to their schedule. This
implies reporting to work, logging in, and taking breaks and lunches as planned. Therefore the more
closely agents follow the planned schedules, the better the adherence.
Factors influencing schedule adherence can include:
• An agent calling in sick
• An agent being late for a shift or late from a break or taking longer breaks than prescribed
• An agent going on break late due to a long call
Chapter 2 - Call Centre Overview 26
• Training
Schedule adherence is a critical factor in the call centre because the work force management process
is usually designed in short-time intervals based on the contact volume profile throughout the day.
Adherence is calculated by comparing the agent’s actual logged in profile throughout the day with the
schedule that was planned.
2.10.2.4 Quality Monitoring Quality monitoring measures the quality of service provided to customers by monitoring the agent
work items. This process allows the call centre to monitor service quality, identify performance
problems, and develop corrective action programs. Quality monitoring can be implemented and
monitored by a quality assurance (QA) team, using call recording where the recorded calls are
listened to and the performance of the agents assessed, with coaching or training to help drive up
performance. A good quality program according to Prosci (2004 a) has the following attributes:
• Tied to business objectives and customer expectations
• Balances quality with productivity measurements to provide the best service for the lowest
cost.
• Tracks and trends problem areas for corrective action
• Provides input into future training
• Measures the cost of rework
• Is constantly updated to reflect new call centre initiatives and programs
2.10.2.5 Utilisation Agents are generally in one of a number of states during a given interval that they are logged on. The
classifications of these states might differ from centre to centre, but usually include the following:
• Idle – available to perform work or take a contact
• Active – handling a contact
• Wrap up – performing after contact work and usually not available to take a contact
• Unavailable – not handling a contact and not available to take a contact. Usually includes
break time (lunch, tea, restroom, etc.) or other reasons such as meetings, etc.
The utilisation is a measure of how much time agents spend working as a ratio of the total time
available to work. A few variations or interpretations on this measurement exist. Traditionally
utilisation is the handle time (talk time plus after call work time) divided by the total time logged in.
Chapter 2 - Call Centre Overview 27
The utilisation is also referred to as the occupancy; although in some contexts occupancy has a
slightly different definition.
Utilisation = (contact time + after contact time)/(total logged in time)
There are a few variations on this measure. One measure of utilisation excludes the time agents are
unavailable to take calls. This unavailable time usually includes breaks such as lunch, tea, and
restroom breaks.
Utilisation = (contact time + after contact time)/(total logged in time – unavailable time)
This measure might be a more accurate representation of the utilisation because it represents to
amount of work agents perform while at their stations.
2.10.2.6 Turnover Rate The turnover rate measures the percentage of agents that terminate their employment in a given time
period. Turnover can include resignations, terminations, retirements, transfers, and promotions. The
agent turnover rate is also referred to as the attrition rate, retention rate, or agent churn. The turnover
is usually expressed as a percentage per month or per year.
2.10.2.7 Cost Metrics This measure was discussed in the previous section. Cost metrics can also be applied on agent level.
2.11 Operational Regimes The essence of operations management in a call centre is the matching of service requests or
demand with the appropriate level of resources that are appropriately skilled. The fundamental
tradeoff is between service quality or effectiveness and operational efficiency. The performance
analysis of call centres supports this notion by calculating the service level and resource occupancy or
utilisation as functions of the traffic load and available resources.
A significant amount of literature on call centre operation and performance discuss different
approaches to the capacity planning problem. The M/M/N system is covered quite extensively as well
as other forms of related systems. One aspect that is mentioned in quite a few sources is that of
operating regimes. Operating regimes describe the modes of operation of the system (or centre) with
the focus on the probability that a customer arriving to the system will have to wait before getting
served. The operating regimes have been used mainly in conjunction with the Erlang C model and
square-root staffing model, but will be discussed here in general as it can be applicable in most call
centre systems. The three modes of operation (as discussed in Whit (2001) and various other
sources such as Gans, Koole & Mandelbaum (2003) and Garnet, Mandelbaum & Reiman (2002)) will
be explained in the following paragraphs.

Chapter 2 - Call Centre Overview 28
2.11.1 Efficiency Driven (ED) Regime In the efficiency driven regime server utilisation is emphasized over service quality. Therefore it aims
to utilise servers to the maximum, disregarding whether customers have to wait. The ED regime is
also known as the cost driven regime.
• The system is under capacitated (server capacity falls short of nominal requirements by a
fixed percentage)
• Almost all customers wait for service (P(wait > 0) ≅ 1)
• Servers are close to 100% utilised
2.11.2 Quality Driven (QD) Regime In the quality driven regime service quality is emphasized over server utilisation. Therefore it aims to
serve all customers immediately, disregarding whether servers are under utilised. The QD regime is
also known as the service driven regime.
• The system is over capacitated (The server capacity exceeds nominal requirements by a fixed
percentage)
• Customers almost never wait for service (P(wait > 0) ≅ 0)
• Servers have a low utilisation
2.11.3 Quality and Efficiency Driven (QED) Regime In between the two extremes is the QED regime. Service quality and server utilisation (efficiency) are
carefully balanced. Therefore server utilisation approaches high levels (theoretically 100%) and a
fraction of customers are served immediately, while some have to wait. The QED regime is also
known as the rationalised regime.
• The system capacity is carefully balanced
• Customers may have to wait a fraction of the time (P(wait > 0) ≅ α ∈ (0,1))
• Server utilisation increases to 100%
Economies of scale are the enabler that allows the QED regime to circumvent the traditional tradeoff
between service level and resource efficiency (Gans, Koole & Mandelbaum, 2003). Based on an
analysis by Garnet, Mandelbaum & Reiman (2002) it was concluded that the QED regime is
appropriate in most settings and is considered to be the natural operating regime for most centres. By
choosing the service level parameters appropriately it is possible to achieve a rational balance
between efficiency and service quality, unless one of these two concerns dominates the other.
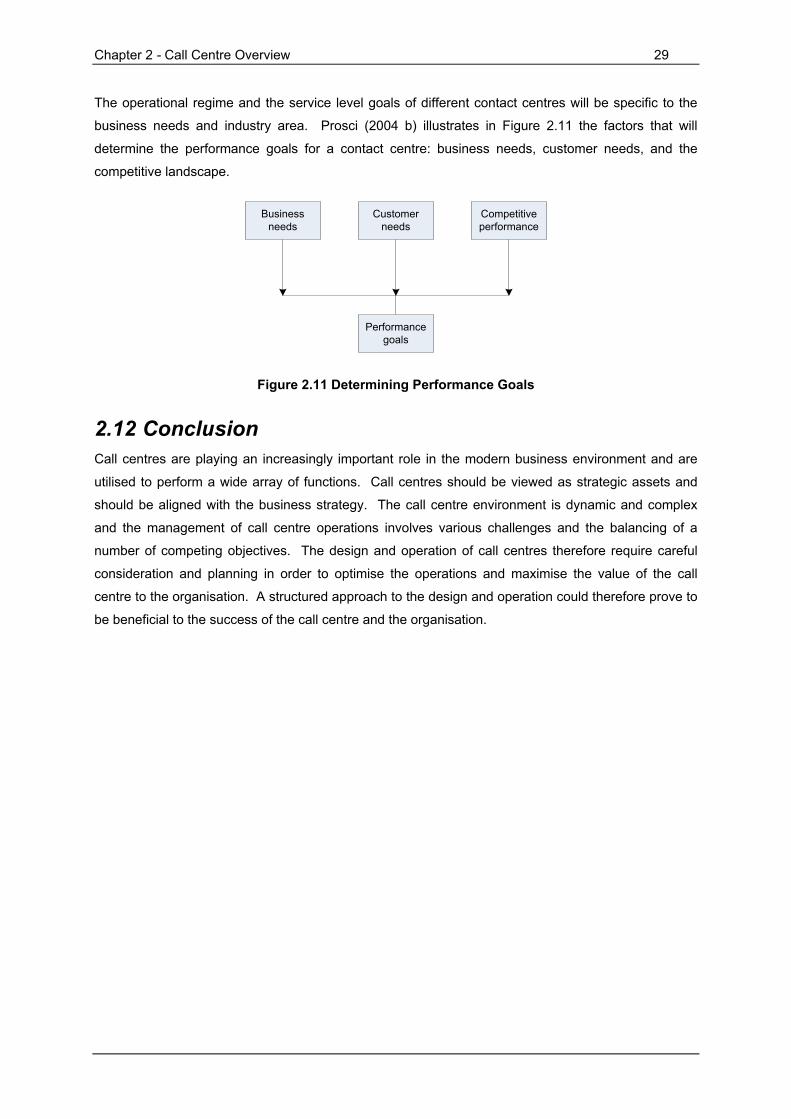
Chapter 2 - Call Centre Overview 29
The operational regime and the service level goals of different contact centres will be specific to the
business needs and industry area. Prosci (2004 b) illustrates in Figure 2.11 the factors that will
determine the performance goals for a contact centre: business needs, customer needs, and the
competitive landscape.
Business needs
Customer needs
Competitive performance
Performance goals
Figure 2.11 Determining Performance Goals
2.12 Conclusion Call centres are playing an increasingly important role in the modern business environment and are
utilised to perform a wide array of functions. Call centres should be viewed as strategic assets and
should be aligned with the business strategy. The call centre environment is dynamic and complex
and the management of call centre operations involves various challenges and the balancing of a
number of competing objectives. The design and operation of call centres therefore require careful
consideration and planning in order to optimise the operations and maximise the value of the call
centre to the organisation. A structured approach to the design and operation could therefore prove to
be beneficial to the success of the call centre and the organisation.
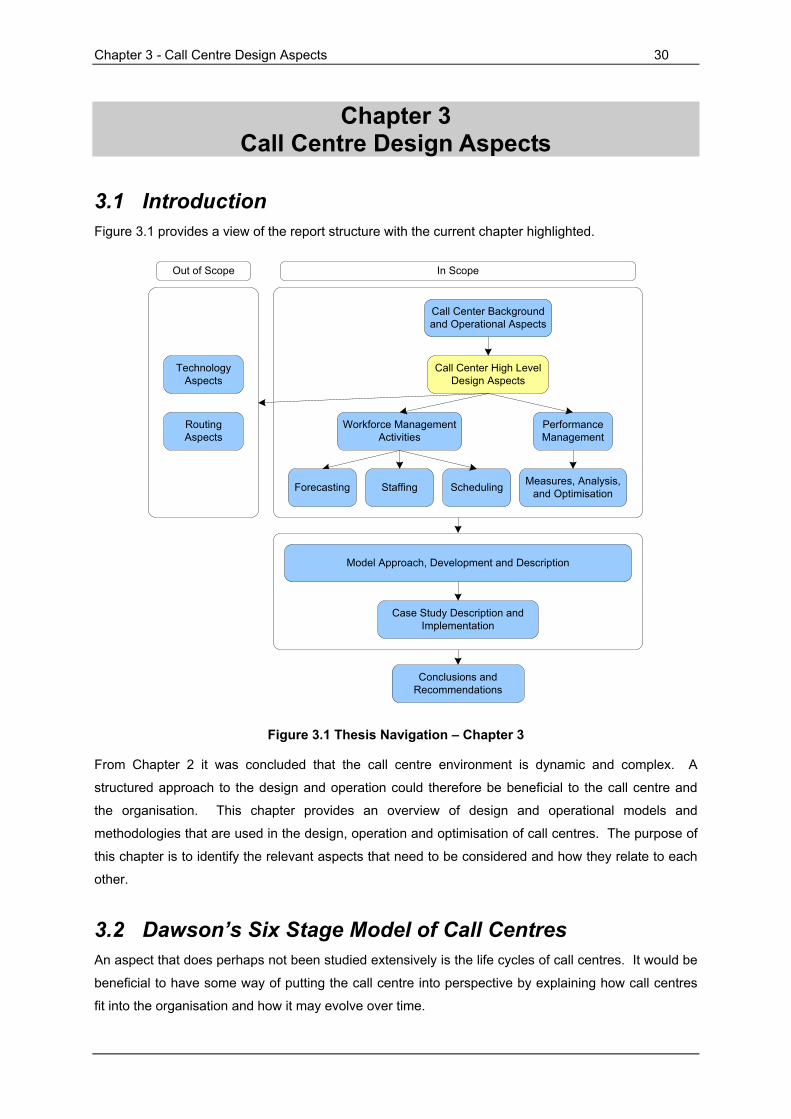
Chapter 3 - Call Centre Design Aspects 30
Chapter 3 Call Centre Design Aspects
3.1 Introduction Figure 3.1 provides a view of the report structure with the current chapter highlighted.
Staffing Scheduling Measures, Analysis, and Optimisation
Call Center High Level Design Aspects
Call Center Background and Operational Aspects
Performance Management
Workforce Management Activities
Forecasting
Case Study Description and Implementation
Conclusions and Recommendations
Model Approach, Development and Description
Technology Aspects
Routing Aspects
Out of Scope In Scope
Figure 3.1 Thesis Navigation – Chapter 3
From Chapter 2 it was concluded that the call centre environment is dynamic and complex. A
structured approach to the design and operation could therefore be beneficial to the call centre and
the organisation. This chapter provides an overview of design and operational models and
methodologies that are used in the design, operation and optimisation of call centres. The purpose of
this chapter is to identify the relevant aspects that need to be considered and how they relate to each
other.
3.2 Dawson’s Six Stage Model of Call Centres An aspect that does perhaps not been studied extensively is the life cycles of call centres. It would be
beneficial to have some way of putting the call centre into perspective by explaining how call centres
fit into the organisation and how it may evolve over time.
Chapter 3 - Call Centre Design Aspects 31
Dawson (2004) developed a simple model for how call centres evolve over time. It describes the
struggles that a call centre has to go through to deliver better service at a consistently high level of
efficiency and lower cost. Dawson’s Six-Stage Model of Call Centres has less to do with what
technologies are used and more to do with the way the centre interacts with the rest of the company.
It is however important to note that these are broad descriptions rather than definitive categories and
although most modern centres will not strictly adhere to these stages, the model could provide a few
helpful insights.
Stage 1: Start up. This is also known as the informal or departmental call centre mode.
Organisationally this can be found in either small, growing companies that have not yet created a
structure for service delivery, or in larger ones that allow diffuse, fractured approaches to appear ad
hoc.
It is a potentially hazardous stage because the company is operating with little or no strategic view of
the value of customers or the consequences of good or bad service. Usually there will not be any kind
of measurement, coordination or proper support form higher levels of the company.
Stage 2: Triage. At some point there is a realisation that the company has to respond in some way to
the customer base. The first response is often inadequate and reactive in nature, often guided by a
single metric. This is the first step in creating the call centre as an infrastructure built to handle
customer enquiries. Often, the problems that drove the process initially can be alleviated but not
necessarily solved.
Stage 3: The Organised Centre. The people in charge become more experienced, gaining a better
grasp of the tools at their disposal, and the advantages and disadvantages of each one. The agents
also become more experienced and it is at this stage that training, monitoring, and incentives become
factors in agent management.
The management focus is still on cost control but interesting technologies are making its appearance
as managers try to simultaneously cut costs and improve service. Reporting and analysis are given
more attention, but mainly at the level of the call and the agent – not the customer.
Stage 4: Continuous Improvement. This is the point at which the tension between the external
needs of the company and the internal needs of the centre are their most apparent. From outside
comes the imperative to cut costs, but also the need for more real, useful information about
customers. Often outside departments have the need for organised, coordinated information relating
call centre activity to what the rest of the company is doing in other departments.
It is also at this stage that centres become rigorous about things like monitoring and training programs,
workforce management, and also start experimenting with different approaches and technologies.
Stage 5: Strategic Asset. The forces at work in the previous stage have matured and as a result the
call centre is seen as a strategic asset rather than a cost centre. At this point there develops a need
Chapter 3 - Call Centre Design Aspects 32
for a set of metrics that can be used to define the relationship between the company and the
customer.
Stage 6: Mass Customisation of Service. This is the point at which the importance of the physical
call centre is reduced and is replaced by the company-customer relationship as the ongoing focal
point. The call centre and the company become a tightly integrated whole.
For instance in a centre this highly evolved, each agent should have all the information needed to
handle the customer at the point of interaction. The caller and agent should be matched as precisely
as possible, with the agent empowered to do whatever necessary to meet the customer’s needs,
within the context of knowing what business rules to apply, and what the value of the customer is.
Dawson (2004) states that stage 6 is a) not here yet in any meaningful way, b) a theoretical end point
at which the boundaries between call centre and company are indistinguishable, and c) a largely
unattainable goal based on the technology and business contingencies of the day.
These stages and the order they are mentioned in does not always apply – there are even a couple of
alternative paths that could be taken. Dawson (2004) lists three of these paths.
Back pedalling to the phone: This is a stage where a company sets itself up to handle customer
interactions through non-telephony modes and belatedly realises that customers do not want to use
this channel and demand being serviced by phone.
Multi channel choices: Various call centres find themselves reaching this decision point very early in
their lifecycle. It concerns the decisions that have to be made about how to handle or integrate other
contact channels (such as emails) in the centre. It is an immensely important consideration and one
that is often sidestepped or decided by accident because of the complexities involved.
Outsourcing: Because of the complexity of the planning and operations, some companies decide to
outsource their call centre operations. This approach also has advantages and disadvantages and
should be considered very carefully.
3.3 The Genesys Contact Centre Capability Maturity Model Genesys Telecommunications Technology (2006) developed what it calls the Genesys Contact Centre
Capability Maturity Model that is used to determine the level of maturity of a contact centre with the
aim of eventually becoming a profit centre. At the core of this model is the concept that a contact
centre’s maturity level is an evolutionary process, with each phase adding to the foundation and
providing for continuous improvement (Bailer, 2006). The model is briefly explained in the following
sections.
Establishment phase
This is the earliest stage for most contact centres, where the priority is setting up basic operations.
Operations at this stage usually rely on simple processes and systems such as simple ACD routing as
Chapter 3 - Call Centre Design Aspects 33
adjuncts to PBX systems. They also use several non-integrated applications for managing customer
contact and problem tracking.
At this stage multiple communication channels are not integrated. Cross-selling or up-selling
functionality likely has not been integrated into the overall contact centre strategy. Self-service, if
available, is very basic. Customer satisfaction, if measured, is usually based on satisfaction
concerning product factors, with very little attention to the service experience itself. This is the stage
of peak customer frustration, with the highest loss of customer and market share.
During this phase companies should aim to develop goals to unify service operations across product
divisions, and unify service communication channels. Companies must also measure current
operations and deploy some basic contact centre technologies like CTI and self-service.
Consolidating phase
During this period, management begins focussing on efficiency and performance goals. New
technologies can lead to customer service improvements and cost reductions. Companies reaching
this phase have realised that service quality is itself a competitive differentiator and that excellent
service does not mean offering the same service to everyone.
Information systems and operational integration begin in this phase. As the integration progresses,
information are often managed by a Customer Relationship Management (CRM) system that collates
all customer relevant data and manages most customer processes from a single unified set of
processes.
Companies either have or plan to implement systems that route calls by customer segment and agent
skill. It also marks the beginning of integrating product, customer, and business operations. This
phase include automated scheduling, ad-hoc outbound campaigns, multi channel operations, and
tracking trends and measuring efficiency, productivity, and customer satisfaction. A speech
recognition system is recommended for smoother integration with other contact centre applications.
Most companies are either in the establishment phase or the consolidating phase.
Performing phase
At this stage the focus shifts from reducing costs to improving quality. Customer segmentation and
routing are used to drive better business results, and revenue generation becomes a key objective.
This stage includes the use and integration of all customer communication channels
Companies at this stage have uniform, integrated systems and processes that manage and track
customer activities across all communication channels. Customers and issues are now segmented
across channels and agents are further segmented by their level of skill in working in each channel of
communication.
Chapter 3 - Call Centre Design Aspects 34
The ability in this stage to integrate self service and agent assisted service across multiple contact
channels, creates higher levels of self service use by customers, and therefore offers very efficient
operations to those companies making the investment at this stage of their development.
Optimising phase
At this point the contact centre begins to find a true balance between cost, quality, and revenue and is
able to adjust dynamically to both business and customer needs. Few companies today have
achieved this stage.
Companies operating at this stage see customer service as a strategic differentiator to the success of
the enterprise, and the contact centre as the nexus of this success. Customer service operations are
now unified across divisions and globally, and are managed in real-time by people who are experts in
service management technologies and practices.
Real-time interactions drive many marketing, service and collections campaigns, where contacted
customers can respond and are routed to the people specifically trained to meet their needs. Agents
leverage personal dashboards with metrics on their specific performance. In this dynamic contact
centre, operations run at peak efficiency, since multiple centres are now virtually networked and
routing decisions take place in real-time across a large group of services and agents.
3.4 A Methodology Approach Properly designing, implementing and operating a contact centre may be one of the most important
tasks an organization may face. Without the proper models, methodologies and tools an organization
may face many pitfalls in this effort. As with most designs or projects it is of great importance to plan
properly and in a structured way in order to avoid mistakes and prepare for possible unforeseen
circumstances. In order to get things right from the start, the use of a planning platform can serve as
an important tool to optimize the whole process of designing, implementing and operating a world
class call centre.
The first and most important step in designing or operating a contact centre is the high level modelling
of the centre. A high level contact centre model can be used as a tool to identify, describe and
combine the most important facets or components of designing and operating a call centre as well as
how these facets are interrelated (Prosci, 2004 b).
According to Prosci (2004 b) a high level contact centre model should generally serve as a tool for the
following situations:
• Starting a completely new call centre
• When a call centre exists and another one needs to be opened
• If the implementation management is being taken over from someone else
Chapter 3 - Call Centre Design Aspects 35
• Managing a portion of a new call centre implementation
• Reengineering an existing call centre
From the two models discussed previously, a methodology approach can therefore also be used as a
basis for moving a centre from one phase to another.
3.5 The Benefits of Using a Methodology Approach According to the Contact Centre Professionals (2006) a proper call centre design or methodology
approach that combines the key components into a logical methodology can lead to various benefits
such as:
• Reducing project time and increasing the speed to market (by relying on experience and
methodologies)
• Shortening the learning curve (during implementation and stabilizing phases)
• Cost reduction and avoidance (by using effective resource planning and scheduling tools)
• Maintaining high customer satisfaction level (throughout all phases of the installation process)
• Designing and implementing efficient and effective work processes (to support the call centre
goals and achieve the required service level)
• Reducing the number of failures (avoiding unexpected situations during the establishment and
initial operational steps)
• Creating a substructure (for standard operating procedures and work instructions as a basis
for quality control)
• Establishing a solid base (for ongoing effective call centre management supported by
professional tools)
• Improved functionality
• Reduced resource commitment
3.6 The Contact Centre Model by Prosci Various approaches and methodologies for the design of call centres exist and most identify similar
key aspects and approaches. The most comprehensive approach that could be found is the Contact
Centre Model developed by Prosci (2004 b). This model will be discussed in the following sections.
One of the main aims of studying this type of model is to identify the main role playing aspects in a call
centre and how they relate to or influence each other – not only in the design phase, but also in the
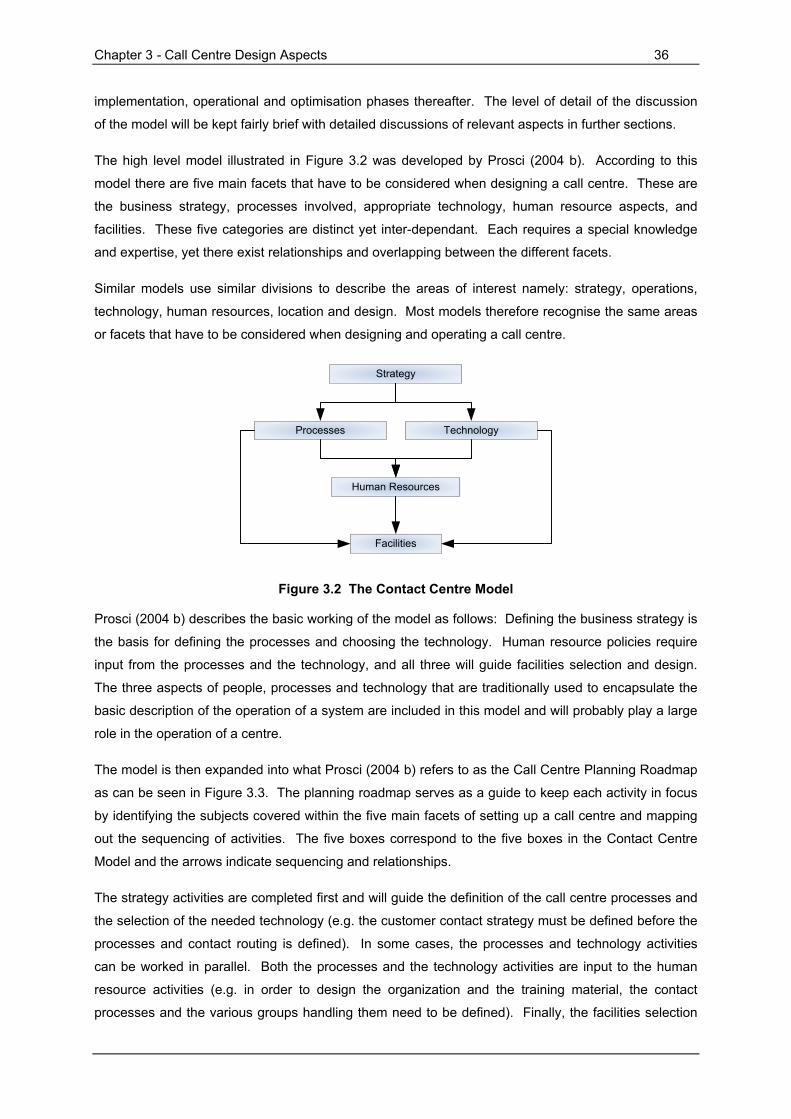
Chapter 3 - Call Centre Design Aspects 36
implementation, operational and optimisation phases thereafter. The level of detail of the discussion
of the model will be kept fairly brief with detailed discussions of relevant aspects in further sections.
The high level model illustrated in Figure 3.2 was developed by Prosci (2004 b). According to this
model there are five main facets that have to be considered when designing a call centre. These are
the business strategy, processes involved, appropriate technology, human resource aspects, and
facilities. These five categories are distinct yet inter-dependant. Each requires a special knowledge
and expertise, yet there exist relationships and overlapping between the different facets.
Similar models use similar divisions to describe the areas of interest namely: strategy, operations,
technology, human resources, location and design. Most models therefore recognise the same areas
or facets that have to be considered when designing and operating a call centre.
Strategy
Processes Technology
Human Resources
Facilities
Figure 3.2 The Contact Centre Model
Prosci (2004 b) describes the basic working of the model as follows: Defining the business strategy is
the basis for defining the processes and choosing the technology. Human resource policies require
input from the processes and the technology, and all three will guide facilities selection and design.
The three aspects of people, processes and technology that are traditionally used to encapsulate the
basic description of the operation of a system are included in this model and will probably play a large
role in the operation of a centre.
The model is then expanded into what Prosci (2004 b) refers to as the Call Centre Planning Roadmap
as can be seen in Figure 3.3. The planning roadmap serves as a guide to keep each activity in focus
by identifying the subjects covered within the five main facets of setting up a call centre and mapping
out the sequencing of activities. The five boxes correspond to the five boxes in the Contact Centre
Model and the arrows indicate sequencing and relationships.
The strategy activities are completed first and will guide the definition of the call centre processes and
the selection of the needed technology (e.g. the customer contact strategy must be defined before the
processes and contact routing is defined). In some cases, the processes and technology activities
can be worked in parallel. Both the processes and the technology activities are input to the human
resource activities (e.g. in order to design the organization and the training material, the contact
processes and the various groups handling them need to be defined). Finally, the facilities selection

Chapter 3 - Call Centre Design Aspects 37
and design require input from all three previous sections (e.g. to design the call centre, the staff
requirements must be known).
Each of the key components and the relevant sub-steps in the planning roadmap will be discussed in
the following sections.
Figure 3.3 The Call Centre Planning Roadmap

Chapter 3 - Call Centre Design Aspects 38
3.6.1 Strategy The business strategy is the critical starting point for planning a call centre. Before selecting the site,
or designing processes, systems or organizational structures, the role that the call centre will play in
the success of the organization should be defined (Prosci, 2004 b).
3.6.1.1 The Mission Statement The contact centre mission statement or vision is a brief description of the call centre and what it does.
Some of the important issues it should cover are:
• The main function or purpose
• How the centre fits into the overall business mission
• What are the defining characteristics
• How is the centre recognized by customers
• What are the priorities
• The market segment/industry
The mission statement identifies the end result of all activities and should function as a “sanity check”
to ensure that all subsequent work and planning support the vision of the centre and that the centre
supports the vision of the organization.
3.6.1.2 Customer Information and Relationship In order to meet the needs of customers it is important to understand who the actual and target
audiences are, their relationship with the organization and their needs and expectations. Gathering
demographic information such as age, sex, marital status, income range, etc. can serve as a guide to
make certain decisions. The next step would be to identify the relationship of customers with the
organization. These include aspects such as the following:
• Reason for calling/contact type
• Complexity/call length
• Up sell/cross sell opportunities
• Level of customer service required
Customer relationships can provide valuable information that will help define the functions and
characteristics of the centre.
Chapter 3 - Call Centre Design Aspects 39
3.6.1.3 Competitive Position When designing or operating a call centre it is important to be aware of any competition. Knowledge
of how they treat customers can give some insight into what customer expectations are. Through
benchmarking activities it is possible to compare different aspects of other centres and identify
opportunities or shortcomings.
3.6.1.4 Customer Contact Strategy A customer contact strategy defines the desired customer experience and how the contact centre fits
within the organization’s overall process of serving customers. The customer contact strategy
basically serves as a summary or high-level description of the call centre that serves as a guide
covering all the important aspects of the call centre. The four key viewpoints, according to Prosci
(2004 b), that should be considered in such a strategic plan are:
• The Customer
• The Customer Service Representative
• The Call Centre Manager
• The Organisation
Figure 3.4 is an example of typical aspects that should be covered in a strategic plan with respect to
the four viewpoints.
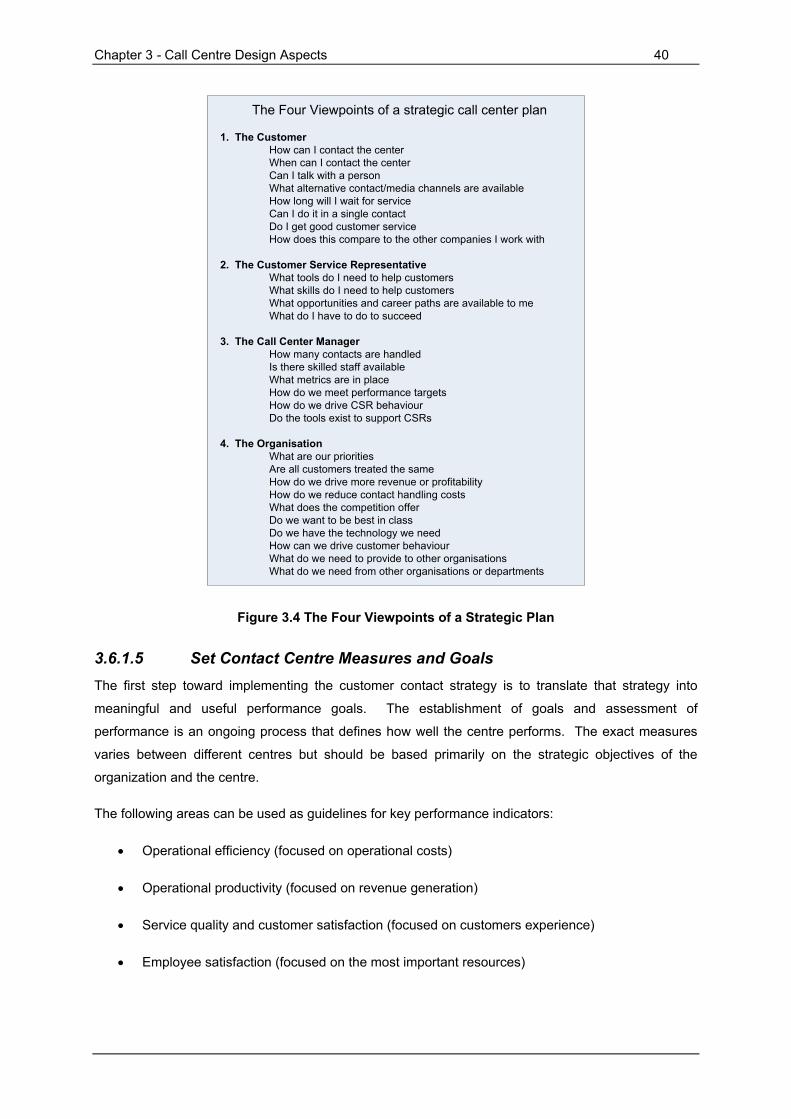
Chapter 3 - Call Centre Design Aspects 40
The Four Viewpoints of a strategic call center plan
1. The CustomerHow can I contact the centerWhen can I contact the centerCan I talk with a personWhat alternative contact/media channels are availableHow long will I wait for serviceCan I do it in a single contactDo I get good customer serviceHow does this compare to the other companies I work with
2. The Customer Service RepresentativeWhat tools do I need to help customersWhat skills do I need to help customersWhat opportunities and career paths are available to meWhat do I have to do to succeed
3. The Call Center ManagerHow many contacts are handledIs there skilled staff availableWhat metrics are in placeHow do we meet performance targetsHow do we drive CSR behaviourDo the tools exist to support CSRs
4. The OrganisationWhat are our prioritiesAre all customers treated the sameHow do we drive more revenue or profitabilityHow do we reduce contact handling costsWhat does the competition offerDo we want to be best in classDo we have the technology we needHow can we drive customer behaviourWhat do we need to provide to other organisationsWhat do we need from other organisations or departments
Figure 3.4 The Four Viewpoints of a Strategic Plan
3.6.1.5 Set Contact Centre Measures and Goals The first step toward implementing the customer contact strategy is to translate that strategy into
meaningful and useful performance goals. The establishment of goals and assessment of
performance is an ongoing process that defines how well the centre performs. The exact measures
varies between different centres but should be based primarily on the strategic objectives of the
organization and the centre.
The following areas can be used as guidelines for key performance indicators:
• Operational efficiency (focused on operational costs)
• Operational productivity (focused on revenue generation)
• Service quality and customer satisfaction (focused on customers experience)
• Employee satisfaction (focused on the most important resources)

Chapter 3 - Call Centre Design Aspects 41
Once the appropriate measures have been selected, the performance targets need to be set based on
customer and benchmarking data. These measures need to be revisited periodically and refined to
ensure they are realistic, up to date, and driving the correct behaviour. In Figure 3.5 and Prosci (2004
b) provides a guide as an example for linking different measures to different situations.
Figure 3.5 Measurement Selection Guidelines
3.6.1.6 Sourcing Options The provision of people and technology to operate the call centre can be referred to as sourcing
options or goals. There are several reasons to decide whether to use another organization to provide
or manage some elements of the call centre (outsourcing), or to do everything in-house (insourcing).
The most common examples of outsourcing within call centres are technology provision and
maintenance, CSR recruitment and training, building provision and maintenance, and call handling for
specific reasons such as unique call or skill type or overflow and peak call handling. There are various
degrees of outsourcing. Some organizations choose to outsource the call centre entirely.
Some of the reasons and benefits for outsourcing are:
• Establishing service quickly
• Access to specialized or expert skills or technology
• Avoiding significant investments when benefits are uncertain
• Free up internal resources for other things
Chapter 3 - Call Centre Design Aspects 42
• Meet a temporary requirement without capital investment
• Allow focus on core competencies when the call centre is not one of these
• Provide flexibility to meet fluctuating volumes
• Test a new program or concept
• Share risks
• Better control operating costs or reduce capital costs
For some organizations insourcing is a better option. Some of the characteristics of organizations that
are better suited and should consider outsourcing are:
• Call centre is a core competency or customer contact is integral to the company’s business
model and future success
• Prefer to maintain control of mission critical function
• Culture requires control of service and the customer experience
• Prefer to retain information control and security
• Data systems and processes are not “clean” and have not been documented such that they
could be turned over to a third party company
• Not able to provide access to internal legacy systems or database to a third party company
3.6.1.7 Multi-site Considerations A contact centre can be configured in various ways. A single contact centre can handle multiple types
of contacts, or multiple sites or contact centres can be used to handle contacts in a variety of different
configurations. Multi-site contact centres present increased complexities in planning and
implementation. There are three distinct business strategies for a multi-site approach.
Multi-Site Centres for Dedicated Call Types
Each of the contact centres handles different types of calls or media. Generally there are three
approaches:
• Segment certain functions at each centre
• Segment calls or contacts geographically
• Segment contacts by media type
Multi-Site Centres for Disaster Recovery and Overflow
Chapter 3 - Call Centre Design Aspects 43
Calls are primarily routed to a centre based on specific criteria. However, if it is outside of business
hours or there is an unusually high call volume, calls will be routed to a backup centre.
Multiple Sites as a Virtual Centre
There are several sites that handle the same kinds of contacts. The main advantage for this approach
is staffing efficiency: fewer CSRs will be needed to meet service goals. Within this virtual centre
configuration it is also possible to employ agents that work from remote locations such as their homes.
3.6.1.8 Budget A budget is a plan of expected income and expenditure. Budgets are generally split into capital and
operational costs. Budgetary planning is essential to provide scope for contact centre projects and to
aid in decision making and tradeoffs of different options. Prosci (2004 b) lists the characteristics of a
good budget as the following:
• Support strategic objectives
• Be realistic
• Be monitored regularly against expectations (and reviewed if necessary)
• Be supported by good reporting systems
An important and often neglected aspect is to consider possible seasonal fluctuations in contact centre
activities and the impact on costs and revenues. The following are typical aspects that have to be
included in a budget:
• General Information Technology
• Professional Services
• Contact centre specific technology, equipment support, maintenance
• Salaries and associated labour costs
o The total staffing costs can be as much as 70% of the average call centre operational
budget
o The cost of staff turnover has to be factored in as well
• Recruitment
• Training
• Marketing
• Sales
Chapter 3 - Call Centre Design Aspects 44
• Legal
• Insurance
• Facilities
• Administration
• Utilities
• Outsourced services
3.6.1.9 Document Business Requirements All the different aspects discussed should be combined to develop the overall business requirements.
Business requirements define the contact centre’s operational, process and technology goals from an
organizational perspective. They provide information regarding:
• Number and size of centres
• Duties performed by each centre
• Customer contact channels supported
• High-level processes for customer contact
• Organisation of the centres
• Performance objectives
3.6.2 Processes The business processes will be the core of the centre operation. For this reason some sources refer
to this aspect as the operations rather than the processes. The following aspects need to be defined:
• Why and how customers will contact the centre
• Estimate the number of each type of contact expected
• How CSRs will handle these interactions
• How the call centre will handle day-to-day business transactions and operations
• How will the staff and scheduling be managed

Chapter 3 - Call Centre Design Aspects 45
3.6.2.1 Identify Contact Types and Volumes In order to define the contact centre processes it is first necessary to identify why and how customers
will contact the centre and then to estimate the volume of each type of contact the centre is expected
to receive.
Identify Contact Centre Activities
The key contact types that will arrive in the centre need to be defined. Some of the most frequent
categories of activities handled in contact centres include order taking, sales, technical or product
support, information, billing and collections.
Contact Centre Channels
Customers want to be able to choose how they contact the organization. Over time more contacts
channels might need to be included and after the centre is first set up, the requirements for the future
should be considered and planned for.
Estimating Volumes by Media
When there is no existing centre, the estimates of volumes can be based on the following:
• Groups who are currently handling these contacts
• Computer simulation using a combination of the organization’s data and industry standards
• Projected customer growth and sales forecasts as indicated in the business plan
• Assumptions about contacts per customer and input from the future contact centre
management team
• Industry statistics form association websites and reports
When there is an existing centre the list above as well as the following can be used:
• Call volume and duration statistics from the previous source
• Input from existing call centre management team
• Assumptions about which contacts will be handled in the new centre
It is also helpful to keep in mind other factors that could affect the work volume. Some of these
include adding, eliminating or changing products or services, campaigns and promotions, seasonal
activity, etc.
The estimation of the contact volumes is an activity that forms part of the workforce management
process, but it is mentioned separately because it also has design and planning implications.

Chapter 3 - Call Centre Design Aspects 46
3.6.2.2 Define Contact Routing Contact routing is the process of getting customers with different needs to the appropriate CSR. The
routing of contacts therefore needs to be based on business and customer needs. Various
possibilities exist and therefore careful planning has to take place in order to perform optimally. Prosci
(2004 b) suggests that the following aspects be considered in creating a contact routing process.
Define Business and Customer Requirements
The goal is to get customers to the best CSR to handle their inquiry as efficiently as possible. The
following aspects need to be considered and how they impact routing decisions:
• Customer
Can the customer and the reason for the contact be identified before the CSR is reached.
• Contact types
What media must be supported.
What media should customers be encouraged to use.
What type of inquiries and transactions are expected.
• CSRs
What organizational structure is needed to handle customer contacts.
What CSR groups need to be defined to handle customer contacts.
What skills are required to handle the contact types.
What contact types should each group handle.
Which groups back each other up for overflow or escalation.
• Measures
What performance measures must be met.
If goals are not being met, what is the backup plan.
• Treatment in queue
How will customers be handled while they wait for a CSR.
Chapter 3 - Call Centre Design Aspects 47
Design Groups and Develop Routes
The organizational design will impact the routing design. Defining the skill groups required to handle
the different types of customer contact by media will define the end point of the routing path. In the
design of routes, three components must be considered:
• Customer identification
• Reason for the contact
• Customer treatment in queue
Testing Contact Routing
Once the routes have been developed, they should be tested thoroughly before going live in the
contact centre.
Implement and Monitor Success
Once the live contacts begin, it is important to generate and evaluate reports that will identify the
relevant aspects of the system.
Analyse and Modify
Identify the problem areas and unforeseen circumstances and update the routing process. As the
business changes it may require adjustments or new routing plans.
3.6.2.3 Define Customer Contact Processes Once the design of the routing on incoming contacts have been completed, it is necessary to define
and document how each type of contact will be handled to ensure that customers are serviced
effectively and efficiently. It will also assist in ensuring uniformity of customer service and can aid in
the training of new CSRs to quickly achieve levels of proficiency.
The processes must be documented in a clear, easy to follow style and be organized to allow quick
access. Each contact type that has been identified needs a process definition. The definition should
show:
• The events that trigger the contact
• Individuals involved
• Media involved
• Description of process
• Required knowledge
Chapter 3 - Call Centre Design Aspects 48
• Business rules
• Systems accessed and documentation requirements
3.6.2.4 Create a Workforce Management Process Workforce management is the process of scheduling the correct number of resources according to the
estimated workload and the service level goals of the contact centre.
The workforce management process typically consists of the following stages:
• Determining the workload forecast from historical data and trends
• Determining the staffing requirements from the workload forecast
• Determining the optimal schedule from the staffing requirements
• Assigning resources to the schedule and monitoring the performance of the centre
The workforce management process plays an extremely important role in the centre and a large part
of the operations is aimed at optimising this process.
3.6.2.5 Translate Contact Volumes into Staffing Needs The establishment of the specific staffing requirements is based on the estimation of the contact
volumes and an understanding of the variability of the contact arrivals and service duration in the call
centre.
Several aspects and assumptions have to be taken into consideration when determining staffing
levels. Some of these include growths plans, operating hours, service objectives, contact types, and
staff skill-sets. It is also necessary to determine the impact of a few variations of different staffing
configurations. The staffing requirements also need to be linked to the budget.
The translation of the contact volumes into staffing needs is an activity that forms part of the workforce
management process, but it is mentioned separately because it also has design and planning
implications.
3.6.2.6 Develop Productivity and Performance Reports Contact centres should have established goals that are based on business needs. Reports can
provide managers with information on performance and productivity in order to see how individuals
and groups are meeting goals.
Armed with the correct data, managers and supervisors can make informed decisions and operate the
centre more efficiently in the short and long term. There are five steps involved in gathering data and
using it correctly (Prosci, 2004 b). A thorough reporting process applies these steps to four areas (as

Chapter 3 - Call Centre Design Aspects 49
discussed earlier): operational efficiency, revenue production, service quality and customer
satisfaction and employee satisfaction.
1. Define goals and requirements: Clarify what is to be measured and why.
2. Generate reports: Reports provide key pieces of information to operate the centre.
Qualitative (customer surveys, quality scores) and quantitative (ACD, IVR reports) data could
be useful and easy to understand.
3. Communicate results: Performance and productivity reports should be shared with all staff,
management, supervisors, CSRs and other departments. It is important to keep the intended
audience in mind. Information supplied to different groups or departments should have a
different focus. Contact centre teams and individuals should understand how their work
impacts the goals of the contact centre, and the larger organisation.
4. Analyse data: The centre’s performance should be tracked over time. If targets are not being
met or exceeded it should be evaluated and the causes identified. Targets and goals should
also be reconsidered or adjusted given certain constraints.
5. Make improvements: Regular analysis could identify changes needed in certain areas such
as: system capabilities, staffing, training, marketing, business planning, and processes.
3.6.2.7 Define Quality Monitoring Quality monitoring is the process of observing a CSR’s interaction with a customer (via one of the
contact mediums) and providing feedback based upon predefined criteria on an evaluation form
(Prosci, 2004 b). This process indicates how individuals perform, and can also provide insight on
shortcomings in other areas such as training, technology and processes.
The size of the centre, business goals and other factors will generally influence the level of complexity
of the tools used for quality monitoring. The most common methods are Side by side (the observation
is done next to the CSR as the contact occurs), Remote (the observation is done from a remote
location as the contact occurs), and Automated (through the use of software calls that are recorded
and evaluated at a later stage).
According to Prosci (2004 b) an effective quality monitoring program has four components:
• quality contact criteria
• objective evaluation
• educated monitors
• scheduled evaluations
Chapter 3 - Call Centre Design Aspects 50
Providing feedback is essential to a successful quality monitoring program. The results must be
shared with the CSRs and the organization so actions plans can be developed and implemented to
improve the operation.
3.6.2.8 Develop Contact Centre Policies Except for identifying and defining the interactions between CSRs and customers, it is also necessary
to ensure the smooth functioning of the centre by addressing the policies that will be followed and the
administrative procedures that need to be in place. By documenting these policies will ensure more
consistent treatment of employees and provide clear expectations of them. In the long term this can
also improve the retention of employees, as the appropriate candidates will be attracted that are
prepared for the realities of the job. The following are some of the important aspects that should be
documented and communicated:
• Working hours
• Hiring and staffing policies
• Conditions of employment
• Pay and benefits structure
3.6.2.9 Implement Continuous Process Improvement All the aspects surrounding the operation of the centre will need constant evaluations and updates
based on what actually happens in the call centre versus what was planned for and what changes
have taken place in the organization or market. Organisations that strive for excellence are constantly
evaluating and modifying processes to improve service to customers and realize greater efficiencies.
The steps in the continuous process improvement are:
• Define the need
• Develop a new process or modify the old one
• Pilot and test the new or modified process to reduce risk to the organisation
• Measure the results
• Modify the pilot processes as required
• Update the baseline process and implement across the contact centre
• Repeat this process
The benefits of continuous process improvement include:
• Shorter contact handling times

Chapter 3 - Call Centre Design Aspects 51
• Less stress on CSRs
• Higher CSR retention
• Less demand on supervisor’s time to answer questions, leaving them free to do their real job
• Lower cost of providing customer service
• Higher customer satisfaction and retention
• Higher percentage of first contact resolution
3.6.2.10 Define Internal and External Communications Communication is often stressed as being an extremely important part of any project or operation. It
must be considered at various levels: internal, external and at what time it takes place.
3.6.2.11 Develop Operations, Administrations and Maintenance Plans Contact centre technology needs constant care and attention to assure ongoing service delivery. The
operations, administration and maintenance plan details the following:
• Who and when to contact for system support
• Who will perform each task and when
• Escalation and communication procedures for technical problem resolution
Service Level Agreements between the different parties involved will cover most of these aspects.
3.6.2.12 Plan for the Unexpected The contact centre must be prepared to handle customer contacts in the event of a business
disruption. Disruptions caused for various reasons can affect many areas of the organisation and can
directly affect the provision of quality service. It is essential to have a well documented and up-to-date
continuity plan so that everyone is aware of what to do when an event occurs.
3.6.3 Technology Technology plays a key role in the success of the modern call centre. The technology used in call
centres range from ordinary phones to highly complex hardware, software and databases that are
used in various situations. A proper knowledge of the available technologies is therefore essential in
the modern call centre. It should however be mentioned that technology should not be implemented
just for technology’s sake. Careful consideration should be taken when considering or reviewing a
technology for implementation.
Chapter 3 - Call Centre Design Aspects 52
According to the model of Prosci’s (2004), once the customer interactions and business processes
have been defined, it will be necessary to design and select the appropriate technologies (and
vendors), install the systems, and conduct the relevant training. Some key technology areas identified
by Prosci (2004) include:
• Voice: Telephone Switch, Voice Network, Contact Routing, Interactive Voice Response (IVR)
• Data: Workstations, Computer Applications and databases, Customer Relationship
Management (CRM) Tools, Computer Telephony Integration (CTI)
• Web: Website, E-mail, E-mail Management, Web Integration (text chat, web calls,
collaboration)
• Management: Reporting, Workforce Management, Quality Monitoring
The specific technology aspects in the model of Prosci (2004 b) will not be covered in further detail.
Other sources such as Bocklund & Bengtson (2002) also cover various call centre technology aspects.
The entry of new technologies to the market adds an array of options and complexities to consider and
manage. In the case of technology planning, implementation, and operation it is therefore important to
use the strategy (and especially the customer preferences) and the processes as a guide in selecting
the appropriate technologies. Dawson (2004) also states that it is essential to decide which mix of
technologies and operations is appropriate for each centre.
3.6.4 Human Resources The next step will be to define all the people elements for the centre. The wide range of human
resources activities falls in the following categories:
• Organisation: Organisational design, job descriptions
• Personnel acquisition: recruiting, hiring, and training
• Personnel management: defining career paths to encourage employee retention,
performance evaluation procedures
• Communications: internal and external
3.6.4.1 Organisational Design Organisational design can play an important role in the contact centre. It must be tied to the business
processes and driven by an accountability model that will ensure the proper performance of the
contact centre. The following are typical operational and support roles in a contact centre.
Operational Roles
Chapter 3 - Call Centre Design Aspects 53
Manager – The contact centre manager has overall responsibility for running the centre on a day-to-
day basis and for ensuring that the centre meets its strategic goals. Additionally, this person is the
liaison between the contact centre and the rest of the organization.
Team Leaders/Supervisors – Team leaders/supervisors are responsible for a small group of CSRs
within the call centre (the size of groups depend on the number and complexity of the contacts
handled, usually between 5 and 20 agents per supervisor). They offer CSRs ongoing mentoring,
coaching and other feedback for professional development.
CSRs – CSRs are the organization’s front line to the customers. They handle contacts through the
various channels that are available to customers.
Support Roles
Workforce Scheduler – The workforce scheduler coordinates work schedules and runs reports. Their
key responsibility is to optimize resource utilization while meeting performance goals.
Technology Coordinator – This person should be stationed in the contact centre and acts as a bridge
to the IT department for organization-wide infrastructure.
Process Designers – Process designers work with business analysts, call centre operational and
support staff to develop and modify contact handling approaches as business needs change.
Trainers – The trainers work closely with supervisors and support personnel to ensure that CSRs
receive the education needed to perform assigned duties. The trainers also update materials based
on process changes to ensure that CSRs learn new procedures and skills as needed.
Systems Support Staff – the systems support staff enables quick changes to the ACD and other
contact centre specific technology when necessary. For example, if a marketing promotion is coming
up, some of the routing options might have to be changed.
Business Analyst – The business analyst works closely with all roles in the call centre to analyse data
and create reports that reflect the call centre’s performance over time. The business analyst also
helps the call centre manager prepare the budget for the operation.
3.6.4.2 Recruitment and Hiring Effective recruitment and hiring can prove to play an important role in the success of a contact centre.
Recruitment can sometimes take up to six weeks to get candidates through the process and after
training agents it can take a long time to become proficient in their job. It is essential that the best and
most suited candidates be found and hired that will enjoy the job, do it well, and stay in the position
long enough for the organisation to recoup the expenses from recruitment and training, and to
minimise the turnover rate of agents.
Chapter 3 - Call Centre Design Aspects 54
3.6.4.3 Training Time and money spent on training staff is the wisest investment to make to ensure the success of the
contact centre (Prosci, 2004 b). Training should be designed in such a way that candidates can
demonstrate that they can effectively handle customer contacts to the standards that have been set.
Prosci (2004) states that thoroughly training CSRs can save the organization money in the long run
and contributes directly to employee morale and customer retention. An effective training program
has the following benefits:
• Provides higher customer satisfaction by preparing CSRs to resolve inquiries on the first
contact
• Allows CSRs to reach full proficiency quickly
• Lowers the cost of providing service through shorter contacts and fewer escalations
• Allows supervisors and managers to focus on monitoring, coaching and evaluating
performance
Training should cover the following subjects divided into hard skills and soft skills:
Hard skills are specific to the organization and the job itself:
• Product/service information
• Business processes
• Escalation procedures
• Systems
• Media type
Soft skills cover the manner in which customer contacts should be handled and CSRs should manage
their work.
• Customer handling skills
• Listening skills
• Etiquette and “netiquette”
• Contact control techniques
• Sales skills
• Corporate ‘message’
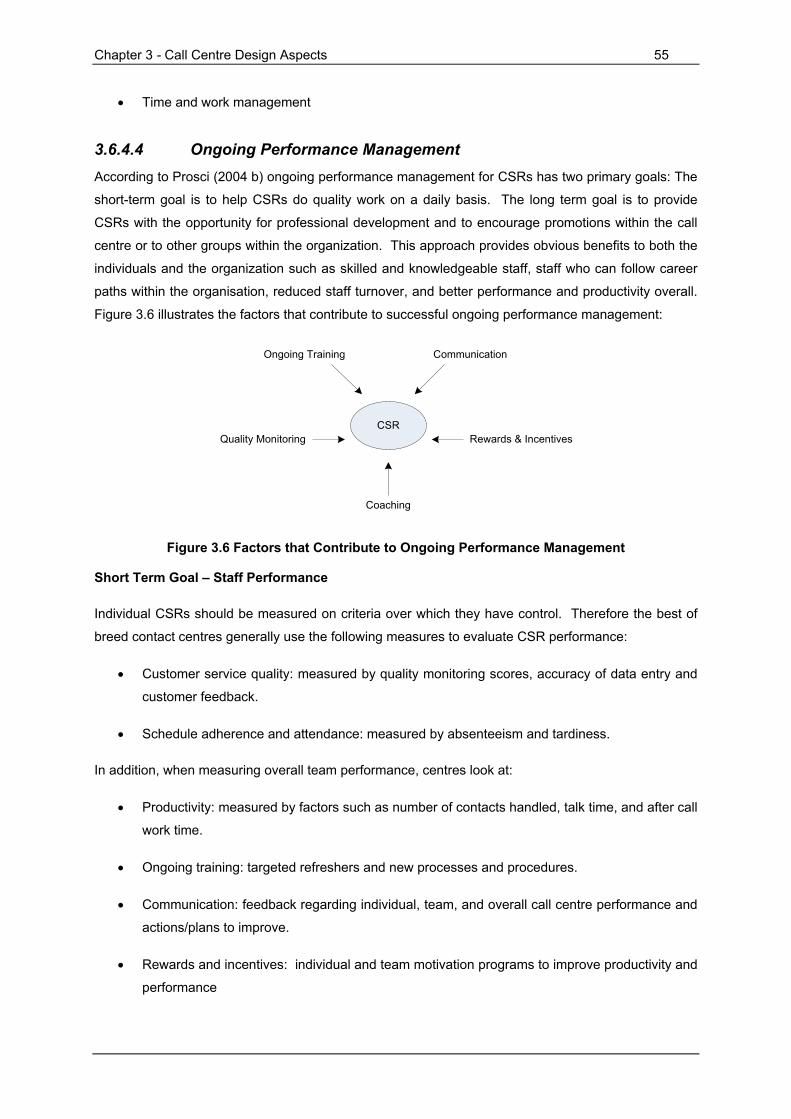
Chapter 3 - Call Centre Design Aspects 55
• Time and work management
3.6.4.4 Ongoing Performance Management According to Prosci (2004 b) ongoing performance management for CSRs has two primary goals: The
short-term goal is to help CSRs do quality work on a daily basis. The long term goal is to provide
CSRs with the opportunity for professional development and to encourage promotions within the call
centre or to other groups within the organization. This approach provides obvious benefits to both the
individuals and the organization such as skilled and knowledgeable staff, staff who can follow career
paths within the organisation, reduced staff turnover, and better performance and productivity overall.
Figure 3.6 illustrates the factors that contribute to successful ongoing performance management:
CSR
Ongoing Training Communication
Rewards & Incentives
Coaching
Quality Monitoring
Figure 3.6 Factors that Contribute to Ongoing Performance Management
Short Term Goal – Staff Performance
Individual CSRs should be measured on criteria over which they have control. Therefore the best of
breed contact centres generally use the following measures to evaluate CSR performance:
• Customer service quality: measured by quality monitoring scores, accuracy of data entry and
customer feedback.
• Schedule adherence and attendance: measured by absenteeism and tardiness.
In addition, when measuring overall team performance, centres look at:
• Productivity: measured by factors such as number of contacts handled, talk time, and after call
work time.
• Ongoing training: targeted refreshers and new processes and procedures.
• Communication: feedback regarding individual, team, and overall call centre performance and
actions/plans to improve.
• Rewards and incentives: individual and team motivation programs to improve productivity and
performance

Chapter 3 - Call Centre Design Aspects 56
• Coaching: input from supervisors or team leaders to improve performance, meet standards
and attain personal goals
• Quality monitoring: program of contact review, evaluation, feedback, and action
Long Term Goal – Professional Development
Contact centres frequently experience high staff turnover rates. One way to cushion the blow is to
encourage internal turnover by fostering an atmosphere in which CSRs master the skills and
knowledge of their position and are then rewarded with promotions or other opportunities for learning
and development.
3.6.5 Facilities The last key element of the call centre is the facilities. Setting up the facilities involves: selecting the
city, location, and size of the call centre, selecting contractors and vendors, designing the interior
space and furnishing it, and setting up and installing all the relevant technology and other items. Many
factors should be considered in facility and site selection.
3.6.5.1 Site Selection The decisions involving the location and size of the contact centre is of great importance because it
will affect the organization for years into the future. Site selection needs to take into account the
needs of the contact centre and also include planning for possible needs that will develop into the
future.
3.6.5.2 Facility Design The facility design of a contact centre can make a significant difference in the operational
effectiveness and mood of the centre. The general layout should be flexible - because requirements
change often – and open in order to enhance communication and collaboration between team
members. Clear lines of sight are also important for supervisors to have a clear view of the activities
in the centre.
3.7 Conclusion Through studying models such as that of Dawson (2004), Genesys (2006) and Prosci (2004), it is
possible to identify the important aspects of contact centre design and operation and also develop the
ability to asses the maturity or lifecycle stage of the centre. These aspects can be broken down into
detailed operations and the relationships between each activity can be identified in such a way that
decisions can be made in full awareness of how other aspects will be affected and ultimately how the
organisation will be affected.
Through the initial literature studied and documented in Chapter 2 and the models studied in Chapter
3 the workforce management and performance management aspects can be identified as forming the

Chapter 3 - Call Centre Design Aspects 57
core of the call centre planning and operation activities. These aspects would therefore have to be
studied and developed in the context of the structure of a design model such as that of Prosci (2004
b).

Chapter 4 - Capacity Planning and Workforce Management 58
Chapter 4 Capacity Planning and Workforce Management
4.1 Introduction Figure 4.1 provides a view of the report structure with the current chapter highlighted.
Staffing Scheduling Measures, Analysis, and Optimisation
Call Center High Level Design Aspects
Call Center Background and Operational Aspects
Performance Management
Workforce Management Activities
Forecasting
Case Study Description and Implementation
Conclusions and Recommendations
Model Approach, Development and Description
Technology Aspects
Routing Aspects
Out of Scope In Scope
Figure 4.1 Thesis Navigation – Chapter 4
From Chapter 3 it was concluded that the workforce management and performance management
aspects form the core of the call centre planning activities and operations. This chapter provides an
overview of the capacity planning and workforce management process. The basic process will be
discussed as well as the distinct parts that make out the workforce management process. The
specific details of the different parts will be covered in subsequent chapters.
4.2 Background to Capacity Planning and Workforce Management Workforce management is the art and science of having the right number of resources in place at the
right times to respond to customer contacts in order to meet desired service goals while minimising
costs (Dawson, 2004). Staffing costs in a contact centre environment can account for more than half
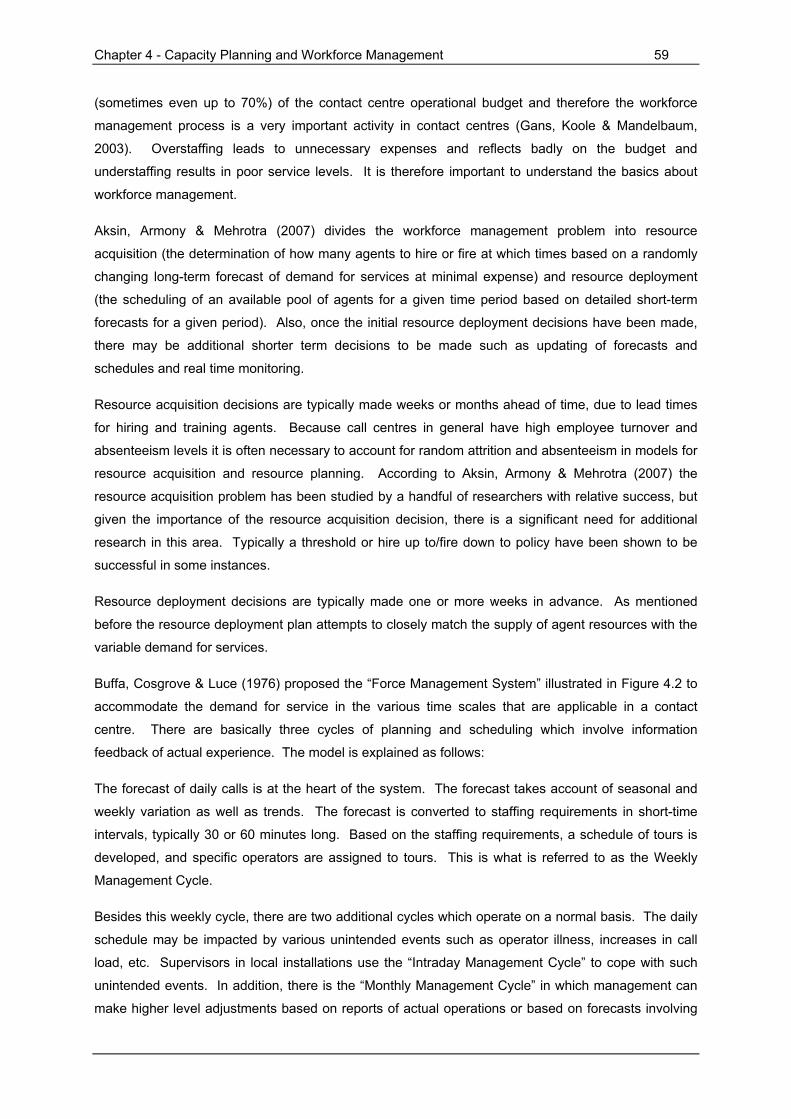
Chapter 4 - Capacity Planning and Workforce Management 59
(sometimes even up to 70%) of the contact centre operational budget and therefore the workforce
management process is a very important activity in contact centres (Gans, Koole & Mandelbaum,
2003). Overstaffing leads to unnecessary expenses and reflects badly on the budget and
understaffing results in poor service levels. It is therefore important to understand the basics about
workforce management.
Aksin, Armony & Mehrotra (2007) divides the workforce management problem into resource
acquisition (the determination of how many agents to hire or fire at which times based on a randomly
changing long-term forecast of demand for services at minimal expense) and resource deployment
(the scheduling of an available pool of agents for a given time period based on detailed short-term
forecasts for a given period). Also, once the initial resource deployment decisions have been made,
there may be additional shorter term decisions to be made such as updating of forecasts and
schedules and real time monitoring.
Resource acquisition decisions are typically made weeks or months ahead of time, due to lead times
for hiring and training agents. Because call centres in general have high employee turnover and
absenteeism levels it is often necessary to account for random attrition and absenteeism in models for
resource acquisition and resource planning. According to Aksin, Armony & Mehrotra (2007) the
resource acquisition problem has been studied by a handful of researchers with relative success, but
given the importance of the resource acquisition decision, there is a significant need for additional
research in this area. Typically a threshold or hire up to/fire down to policy have been shown to be
successful in some instances.
Resource deployment decisions are typically made one or more weeks in advance. As mentioned
before the resource deployment plan attempts to closely match the supply of agent resources with the
variable demand for services.
Buffa, Cosgrove & Luce (1976) proposed the “Force Management System” illustrated in Figure 4.2 to
accommodate the demand for service in the various time scales that are applicable in a contact
centre. There are basically three cycles of planning and scheduling which involve information
feedback of actual experience. The model is explained as follows:
The forecast of daily calls is at the heart of the system. The forecast takes account of seasonal and
weekly variation as well as trends. The forecast is converted to staffing requirements in short-time
intervals, typically 30 or 60 minutes long. Based on the staffing requirements, a schedule of tours is
developed, and specific operators are assigned to tours. This is what is referred to as the Weekly
Management Cycle.
Besides this weekly cycle, there are two additional cycles which operate on a normal basis. The daily
schedule may be impacted by various unintended events such as operator illness, increases in call
load, etc. Supervisors in local installations use the “Intraday Management Cycle” to cope with such
unintended events. In addition, there is the “Monthly Management Cycle” in which management can
make higher level adjustments based on reports of actual operations or based on forecasts involving

Chapter 4 - Capacity Planning and Workforce Management 60
particular trend and seasonal factors. Hiring and training of operators is planned in the future cycle
which projects up to 12 months forward.
Operate
Staffing requirements
Intraday Management
Cycle
Weekly Management
Cycle
Monthly Management
Cycle
Report
Optimum Schedules
Assign agents to schedules
Forecast daily calls
Figure 4.2 The Force Management System
The basic steps that are followed in the capacity planning process of a call centre (as presented by
Buffa, Cosgrove & Luce (1976) and most research and current practice on workforce management, for
example Fukunaga et al. (2002)) are listed below and illustrated in Figure 4.3.
• Forecast workload
• Define service objectives
• Determine staffing requirements
• Schedule shifts optimally
• Roster or assign agents to shifts
Workload Forecast
Agent Schedules
Agent Roster
Service Objectives
Staffing Needs
Figure 4.3 The Basic Call Centre Workforce Planning Cycle
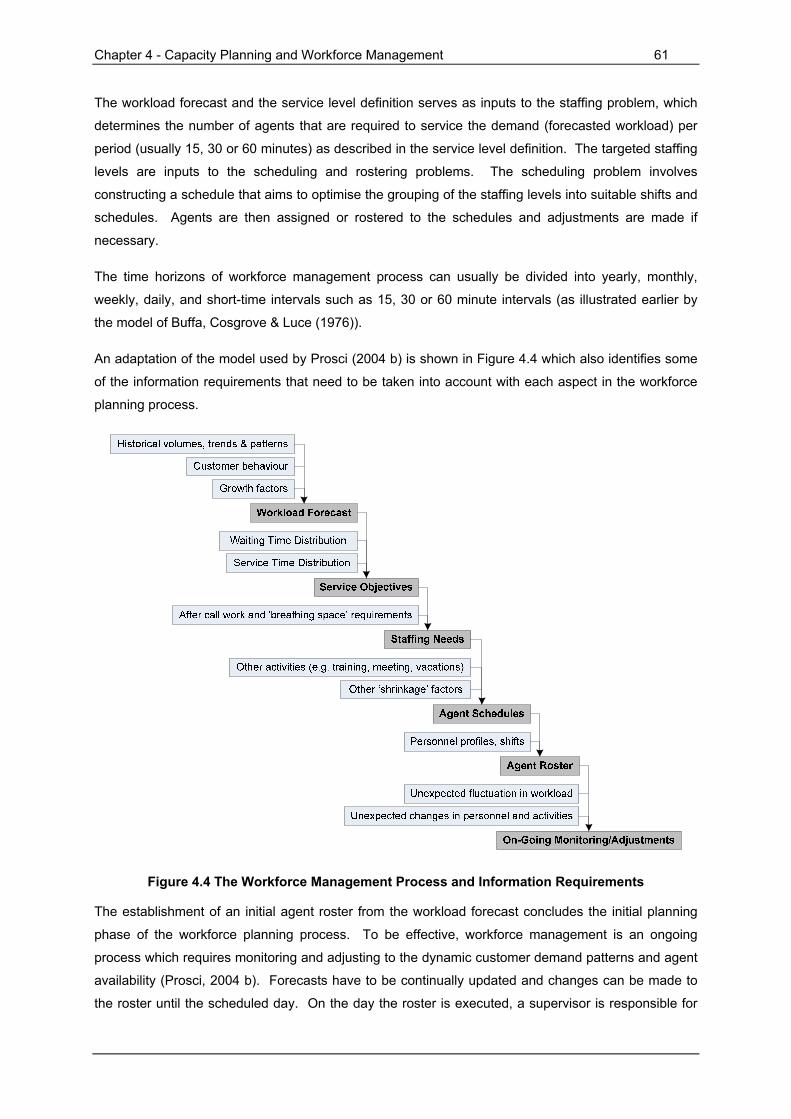
Chapter 4 - Capacity Planning and Workforce Management 61
The workload forecast and the service level definition serves as inputs to the staffing problem, which
determines the number of agents that are required to service the demand (forecasted workload) per
period (usually 15, 30 or 60 minutes) as described in the service level definition. The targeted staffing
levels are inputs to the scheduling and rostering problems. The scheduling problem involves
constructing a schedule that aims to optimise the grouping of the staffing levels into suitable shifts and
schedules. Agents are then assigned or rostered to the schedules and adjustments are made if
necessary.
The time horizons of workforce management process can usually be divided into yearly, monthly,
weekly, daily, and short-time intervals such as 15, 30 or 60 minute intervals (as illustrated earlier by
the model of Buffa, Cosgrove & Luce (1976)).
An adaptation of the model used by Prosci (2004 b) is shown in Figure 4.4 which also identifies some
of the information requirements that need to be taken into account with each aspect in the workforce
planning process.
Figure 4.4 The Workforce Management Process and Information Requirements
The establishment of an initial agent roster from the workload forecast concludes the initial planning
phase of the workforce planning process. To be effective, workforce management is an ongoing
process which requires monitoring and adjusting to the dynamic customer demand patterns and agent
availability (Prosci, 2004 b). Forecasts have to be continually updated and changes can be made to
the roster until the scheduled day. On the day the roster is executed, a supervisor is responsible for
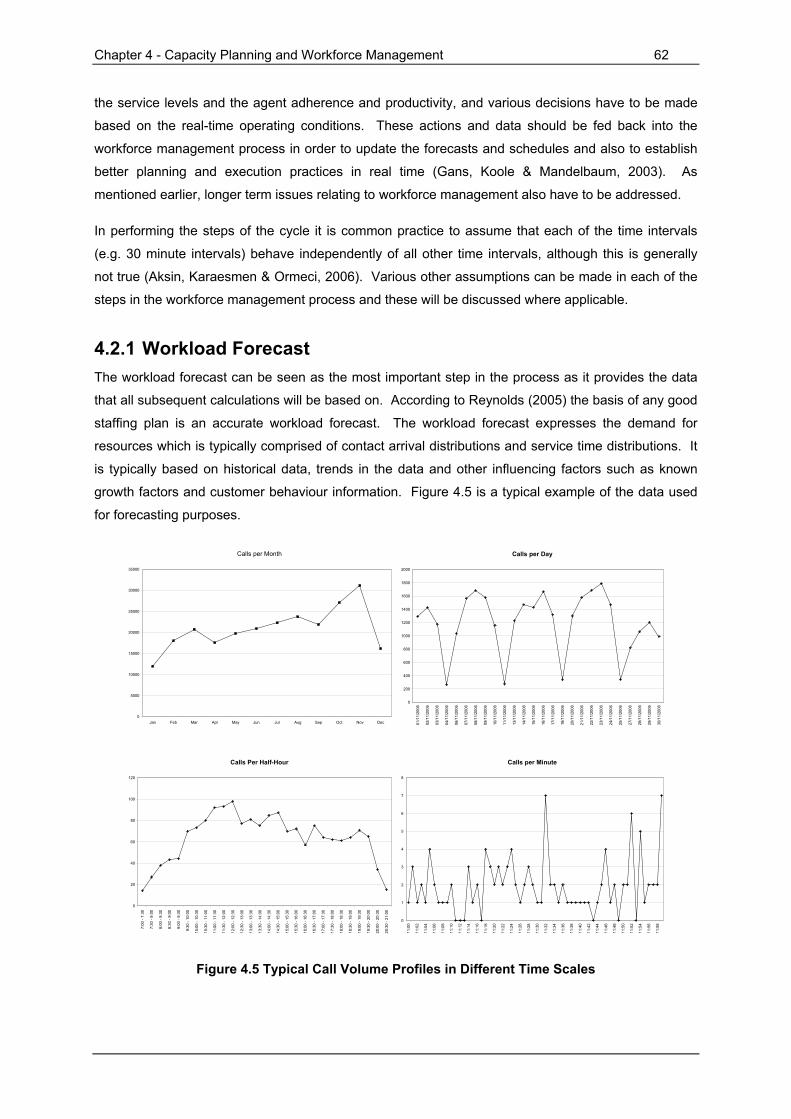
Chapter 4 - Capacity Planning and Workforce Management 62
the service levels and the agent adherence and productivity, and various decisions have to be made
based on the real-time operating conditions. These actions and data should be fed back into the
workforce management process in order to update the forecasts and schedules and also to establish
better planning and execution practices in real time (Gans, Koole & Mandelbaum, 2003). As
mentioned earlier, longer term issues relating to workforce management also have to be addressed.
In performing the steps of the cycle it is common practice to assume that each of the time intervals
(e.g. 30 minute intervals) behave independently of all other time intervals, although this is generally
not true (Aksin, Karaesmen & Ormeci, 2006). Various other assumptions can be made in each of the
steps in the workforce management process and these will be discussed where applicable.
4.2.1 Workload Forecast The workload forecast can be seen as the most important step in the process as it provides the data
that all subsequent calculations will be based on. According to Reynolds (2005) the basis of any good
staffing plan is an accurate workload forecast. The workload forecast expresses the demand for
resources which is typically comprised of contact arrival distributions and service time distributions. It
is typically based on historical data, trends in the data and other influencing factors such as known
growth factors and customer behaviour information. Figure 4.5 is a typical example of the data used
for forecasting purposes.
Calls per Month
0
5000
10000
15000
20000
25000
30000
35000
Jan Feb Mar Apr May Jun Jul Aug Sep Oct Nov Dec
Calls per Day
0
200
400
600
800
1000
1200
1400
1600
1800
2000
01/1
1/20
06
02/1
1/20
06
03/1
1/20
06
04/1
1/20
06
06/1
1/20
06
07/1
1/20
06
08/1
1/20
06
09/1
1/20
06
10/1
1/20
06
11/1
1/20
06
13/1
1/20
06
14/1
1/20
06
15/1
1/20
06
16/1
1/20
06
17/1
1/20
06
18/1
1/20
06
20/1
1/20
06
21/1
1/20
06
22/1
1/20
06
23/1
1/20
06
24/1
1/20
06
25/1
1/20
06
27/1
1/20
06
28/1
1/20
06
29/1
1/20
06
30/1
1/20
06
Calls Per Half-Hour
0
20
40
60
80
100
120
7:00
- 7:
30
7:30
- 8:
00
8:00
- 8:
30
8:30
- 9:
00
9:00
- 9:
30
9:30
- 10
:00
10:0
0 - 1
0:30
10:3
0 - 1
1:00
11:0
0 - 1
1:30
11:3
0 - 1
2:00
12:0
0 - 1
2:30
12:3
0 - 1
3:00
13:0
0 - 1
3:30
13:3
0 - 1
4:00
14:0
0 - 1
4:30
14:3
0 - 1
5:00
15:0
0 - 1
5:30
15:3
0 - 1
6:00
16:0
0 - 1
6:30
16:3
0 - 1
7:00
17:0
0 - 1
7:30
17:3
0 - 1
8:00
18:0
0 - 1
8:30
18:3
0 - 1
9:00
19:0
0 - 1
9:30
19:3
0 - 2
0:00
20:0
0 - 2
0:30
20:3
0 - 2
1:00
Calls per Minute
0
1
2
3
4
5
6
7
8
11:0
0
11:0
2
11:0
4
11:0
6
11:0
8
11:1
0
11:1
2
11:1
4
11:1
6
11:1
8
11:2
0
11:2
2
11:2
4
11:2
6
11:2
8
11:3
0
11:3
2
11:3
4
11:3
6
11:3
8
11:4
0
11:4
2
11:4
4
11:4
6
11:4
8
11:5
0
11:5
2
11:5
4
11:5
6
11:5
8
Figure 4.5 Typical Call Volume Profiles in Different Time Scales

Chapter 4 - Capacity Planning and Workforce Management 63
The most common application is to predict the yearly, monthly, weekly, and hourly, half-hourly or
fifteen minute interval workload. Other special or ad hoc situations also arise where forecasting can
play an important role in the analysis of contact centre operations. These include situations such as
planning for new call types, opening a new centre, a merger or acquisition, or a change in operating
hours. The implementation of a new technology might also affect the work volume or pattern and this
might result in a change in the workload. The forecasting process can be considered both an art and
a science. It is considered an art because the aim is to predict what will happen in the future and the
accuracy of the forecast will in some part be dependant on judgement and experience. It is also a
science because there is a mathematical process that takes various aspects into consideration in
order to predict future events. It is therefore important to have a basic understanding of the principles
and techniques of workload forecasting and how to apply them to accurately plan contact centre
resources (Reynolds, 2005).
The workload forecasts are defined by the queue, media or call type associated with the forecast, the
time between the creation of the forecast and the actual time period for which the forecast was created
(often referred to as the lead time) and the duration of the time periods for which the forecasts are
created, which can range from monthly (to support resource acquisition decisions) to short time 15-,
30-, or 60-minute periods (to support resource deployment decisions). The workload demand or
arrival rates are often forecast on a top-down basis as illustrated in Figure 4.5 with the monthly
forecast serving as the basis for the weekly, daily, and short-time interval forecasts. The following
steps are usually followed (Reynolds, 2005 and Gans, Koole & Mandelbaum, 2003):
Step 1: Analyse and Adjust Historical Information
The modelling and control of call centres must necessarily start with careful data analysis (Gans,
Koole & Mandelbaum, 2003). It is recommended to have at least one year’s data (preferably two
years) that can be divided into months, weeks, days and hours or half-hours (Reynolds, 2005) as
illustrated in Figure 4.5. Historically most analyses have used 60, 30 or 15 minute intervals as the
lowest aggregate breakdown. A few sources have however suggested that it might be useful to
investigate the value of analysing smaller intervals such as 1-minute aggregate or call-by-call data.
From Figure 4.5 it is however apparent (from 1 minute aggregate intervals) that the distribution of calls
in such short intervals is a stochastic process and for the purposes of forecasting it is not necessary to
use less than 15 minute intervals.
Abnormalities in the historical information need to be identified and corrected or normalised
accordingly. Examples include the effect of public holidays, power outages, system outages, etc. The
key is to determine the reason it occurred. If it is a once-off incident or a random event that cannot be
predicted, the numbers will have to be normalised. Otherwise if it is a repeatable or predicable event,
the numbers need to stay in the data. Reynolds (2005) suggests that a note should be made for the
reason of each aberration to make the process easier and to be able to anticipate similar events in the
future.
Chapter 4 - Capacity Planning and Workforce Management 64
Step 2: Predict Monthly Calls
The next step is to take the raw data and create a prediction of possible future values. There are
several approaches that can be used to produce a forecast. According to Reynolds (2005), the
recommended approach for call centre forecasting involves time series analysis. It is the approach
used in most call centres and serves as the basis for most of the automated workforce management
forecasting models. The basic assumption is that call volume is influenced by a variety of factors over
time and that each of the factors can be isolated and used to predict future call volumes. This
approach takes historical information and allows for the isolation of the effects of trend as well as
seasonality or monthly differences.
Cleveland & Minnucci (2004) points out that successful forecasting and scheduling in the modern
environment depends on far more than analysis of historical data. Given the many variables, some
organisations that were previously successful at workload planning are now struggling with it. In most
cases the problem is that past history may not be as reliable a predictor of future activity as it once
was. In a competitive environment organisations are forced to makes changes which often affect
factors such as call volume and service times. Various factors should therefore be considered when
producing forecasts.
The process of predicting monthly workload starts by aggregating the number of calls in each 60, 30
or 15 minute period into daily, weekly, and monthly totals. These totals are the historical basis of the
forecasts that are to be built on a combination of time series methods and managerial opinion
regarding future business events.
The first step in a time series approach would be to isolate the effect of trend (Reynolds, 2005). Trend
is the long-term component that represents the growth or decline in the time series over an extended
period of time. In the call centre environment the trend describes the rate of change in calls or
workload. Reynolds (2005) points out that it is important to determine this rate as an annual trend as
well as a month-to-month change.
Once the trend rate has been determined, the next factor to isolate is the effect of seasonality or
month-to-month variances (Reynolds, 2005). Seasonality is a pattern of change that repeats itself
within a certain time period, usually on a yearly basis. This step can often be fairly tricky as monthly or
seasonal factors can not always be determined accurately by just looking at the most recent twelve
months of data. Often it is necessary to first perform a de-trending analysis on the data in order to be
able to identify the seasonal pattern.
The trend rates, seasonal patterns, and other aspects that should be included are used to produce a
month-by-month forecast of the workload. The time series approach is the recommended approach to
forecasting future workload, and if done correctly could produce forecasts with a 95% or higher
accuracy (Reynolds, 2005).
Chapter 4 - Capacity Planning and Workforce Management 65
Step 3: Create Daily and Hourly or Half-Hourly Forecasts
Once the monthly forecasts have been calculated, the next step involves breaking down the monthly
forecasts into weekly and daily predictions, and then further down into hourly or half-hourly numbers.
To predict the daily workload it is necessary to calculate the day-of-month and/or day-of-week factors.
The first week of a month may, for example, constitute a certain percentage of the calls that are
handled in that month. Each day of the week may also account for a certain percentage of the calls
for the week. Similarly, each hour or half-hour may be allocated a percentage of a day’s total call
volume. Most call centres have a recognisable and repeatable pattern in the distribution of the call
volumes through the different time intervals (Reynolds, 2005).
According to Reynolds (2005) it is not always necessary to analyse two years of information to
determine these factors. Typically evaluating the last few weeks of daily call volume data can be
sufficient to identify daily patterns. It is important to select clear weeks of data – those without
holidays or other major events that could influence or skew the proportions. The total volume for each
day can then be compared to the weekly total and these percentages reflect the day-of-week patterns.
This process can be repeated for the time-of-day patterns. It is especially critical to know when the
peaks, valleys, and average times are during a typical day. Each day needs to be evaluated by how
each hour or half-hour of the day compares to the daily total and the result will be the intra-day call
patterns for each day.
The result is an analysis and breakdown of historical data and trends that are used to develop a
monthly, daily, and hourly or half-hourly forecast of the workload. In order to calculate the staffing
needs the forecast must also include a prediction of the handle times. Handle times should accurately
reflect the time of year, day of week, and time of day since it may vary for a number of reasons such
as business variations and customer behaviour.
Step 4: Adjust for Other Business Influences
Many factors influence the call centre workload and it is important to be aware of these and to have a
process in place that take all these factors into consideration in the forecasting process. These factors
will vary between different organisations and therefore it is essential to maintain communication
channels between different departments that may have an influence on the workload in order to fine-
tune the forecasting process. Once the forecast is in place, it can be used in calculating the staff
requirements to meet the service level goals.
Common call centre practice is to assume constant arrival rates over the short-time intervals (30 or 60
minutes). Assumptions such as these are often made using a combination of data analysis and
experience-based judgement. These assumptions are useful when made correctly because it can
greatly simplify the staffing process by enabling the use of standard, steady state models with a
piecewise constant arrival-rate function. This is usually reasonable if steady state is achieved
relatively quickly, in particular when the event rate is large when compared to the duration of the
Chapter 4 - Capacity Planning and Workforce Management 66
interval, and when predictable factors that drive the rates are relatively stable over the interval
(Ingolfsson, Cabral & Wu, 2007). In some instances however they may not be as accurate, especially
in modelling overload conditions, if the service duration is long compared to the time interval, and if the
transient effects between the different time intervals are of importance.
In theory records of the service times could also be used to generate detailed forecasts of the service
time per short-time interval. In practice however, many centres do not forecast parameters such as
service times in detail. Instead, grand averages are calculated and used (Ingolfsson, Cabral & Wu,
2007).
4.2.2 Service Objectives The service level goals describe how the centre aims to serve customer demand and forms an
important part of the strategy and performance measurements of the centre as mentioned in the
discussion of the Contact Centre Model of Prosci (2004 b) under the strategy section. The service
level will for the most part define the staffing needs of the centre and is one of the determining factors
in customer experience. It is usually expressed as some function of the customer waiting time
distribution and the service time distribution.
The waiting time distribution measures how long customers wait for service, and is usually expressed
as an average or more commonly as a percentage, for example: an average waiting time of 30
seconds or 80% of calls answered within 20 seconds. The exact values will depend on the strategic
objectives, the type of industry, and the type of contacts, for instance.
The service time distribution measures the time it takes to complete service, either for one contact or
the time it takes to complete or close a case (it often happens that more than one call is required to
complete a case). It is usually expressed as an average or a distribution and can also be classified
according to different types of calls or contacts, for example: average call duration of 2 minutes or
average call duration per case of 5 minutes with 1.5 calls on average per case. Again the targets or
values will depend on the specific industry or situation.
Two factors must however be considered when assessing the service level: the way in which the
calculation is done, and the interval over which the measurement is calculated.
The point in time that the system starts measuring is an important consideration and can vary greatly
between different systems. For example, the queue time can begin when a contact enters the system
and therefore includes the time spent ringing, in the IVR, and all other time up to when the customer is
connected to an agent. In another system the initial ringing and IVR time might be excluded and the
queue only starts when the recorded message ends and a selection has been made. Another option
is to only measure calls that are answered and exclude those that are abandoned. Various options
exist and the settings of the system and the definition of the measurement goes hand in hand.
Chapter 4 - Capacity Planning and Workforce Management 67
The other factor is the measurement interval. Centres that are committed to speed of answer goals
measure each hour or half-hour and determine what percentage of these intervals meet the goal
(Klenke, 2006 b). Many centres calculate the average across a whole day, and in this way if the peak
hours have poor performance and the other hours have great performance, it averages out the whole
day. Some centres average across a whole week resulting in a peak day’s bad service being buried in
the slower days’ performance. In this case therefore, the larger the measuring interval is, the less
meaningless the measurement becomes. Klenke (2006 b) states it as follows, “the longer the
averaging interval the more that dreadful service can be successfully hidden”. It is therefore essential
to especially strive for excellent service during busy intervals when most customers are impacted.
4.2.3 Staffing Needs The staffing problem seeks to find a minimal workforce level for short-time intervals in order to
maintain the service level during those intervals based on the workload forecast. Determining the
number of resources needed to accomplish a defined amount of workload at a defined service level
requires a model that replicates the situation at hand. There are several models available that can be
used in the call and contact centre environment. The model that has been used most often is the
Erlang model of which the Erlang C (refer to 9.5 for more information) model has historically been the
most widely used in incoming call centres. In recent years though, the use of simulation models have
become more popular because of the increased complexity in the dynamics of call centre staffing.
Using these models in multi channel environments have become problematic. Also a much bigger
emphasis is being placed on the tradeoffs between service and costs and therefore the margin for
error is becoming smaller.
Staffing models usually only account for purely “bodies in seats”. These numbers assume that all
agents are always available to handle the workload. In reality agents are not always available and this
has to be factored into the staffing and scheduling process. The unproductive time or unavailability of
staff is commonly referred to as shrinkage and can be defined as any time for which staff are being
paid but not available to handle calls. Common examples include absenteeism, breaks (such as
lunch, tea and restroom breaks), meetings, training, etc. Agents also spend time after a call has
ended on wrapping up the call and another important factor that has to be taken into account is that
agents often need some “breathing” time in between calls.
In determining the staff requirements, adjustments need to be made to factor in all the activities that
contribute to the staff shrinkage. In most centres, staff shrinkage can range from 20-35% (Reynolds,
2003). The effect of shrinkage can be accounted for in several ways. The most common and simple
method to account for the shrinkage factor is by dividing the initial staff requirement by the productive
staff percentage (or 1 minus the shrinkage percentage). If for example 24 agents are needed and the
shrinkage factor is 30%, then 24/0.7 yields an adjusted requirement of 34. Other methods include the
inclusion of the wrap up and breathing time in the handling time of the contact or other variations of
this kind.
Chapter 4 - Capacity Planning and Workforce Management 68
4.2.4 Agent Schedules and Rosters The scheduling problem aims to determine the optimal collection of shifts by determining the number
of agents required in each shift in order to minimise costs while achieving the service level objective
and other labour related requirements. The results of the staffing problem (typically on a short-time
interval basis) serve as input to the scheduling problem. It therefore aims to group the minimal
number of agents in shifts that will satisfy the service level according to the staffing requirements and
it also takes into account the aspects such as tea and lunch breaks.
Two elements of the scheduling process have to be distinguished, namely shifts and schedules. A
shift is a set of short-time intervals (typically 60, 30, or 15 minute intervals) during which an agent
works over the course of the day. A schedule is a set of daily shifts to which an agent is assigned
over the course of a week or a month. Shifts and schedules are often restricted to constraints
governed by union rules or other legal requirements and can, in some cases, be quite complex.
The rostering problem involves the assignment of agents to schedules. In the rostering process the
constraints due to staffing and shift scheduling have to be satisfied as well as additional constraints.
These include labour rights such as the number and sequence of day and night shifts, the number of
off-days per week, the number of weekends off, etc. The rostering problem usually takes the solution
of the scheduling problem as input, or the scheduling and rostering problem can be solved together.
The traditional approach to solving the scheduling problem is to formulate and solve a mathematical
program to identify the minimum cost schedule (Aksin, Armony & Mehrotra, 2007). Usually, similar
methodologies are developed to solve both shift scheduling and rostering problems together (Aksin,
Karaesmen & Ormeci, 2007). The scheduling and rostering problem have been studied extensively
both in the call centre context as well as other applicable contexts.
4.2.5 Monitoring, Managing, and Operating After completing all the basic steps of the workforce planning cycle namely forecasting the workload,
calculating the staffing requirements, determining the optimal schedules, and assigning agents to
schedules, the performance of the centre needs to be tracked, managed and optimised based on real-
time, day-to-day, and longer term operational aspects.
Tracking and analysing the performance of the call centre means tracking the elements that have
been defined as being important and influencing the performance and services of the call centre.
Especially those parameters that will have an immediate impact on the service level goals. Typically
aspects such as the following should be tracked at the appropriate intervals.
• Call volume
• Handle time
• Staffing levels

Chapter 4 - Capacity Planning and Workforce Management 69
Variations in any of the components or parameters can possibly have a significant impact on the
performance of the centre. The key is therefore to have a systematic process in place to track the
information to ensure that there is sufficient time to react and make adjustments (Reynolds, 2003).
Reynolds also identifies three steps namely tracking, communication, and reaction as the process to
follow in order to make timely and informed decisions. A more detailed discussion of this process will
be covered in a later section.
4.2.6 Automated Workforce Management Thus far, the entire workforce management process has been covered from forecasting the workload,
determining the staff requirements, creating schedules, and tracking performance. While all these
steps can be performed manually, there is a point at which automating the process becomes a serious
consideration and even a necessity. This can be done through the use of an automated workforce
management system. The growing complexity of the contact centre environment makes the problem
of workforce management ideally suited for a computerised tool.
The different steps of the workforce management process are implemented in a magnitude of tools
and the functionality of the different tools varies greatly. In practice many tools are only partly used
and specially build tools are often used for forecasting and scheduling (Koole, 2007). Most tools are
used for retrieving and processing data from the PABX, ACD, and other relevant systems and for
determining the staffing requirements. According to Koole the reason for this is that every call centre
is different. Although there are many common features, every centre has its own particularities which
often have the result that a standard solution does not fit. The choice is therefore between using the
standard solution and possibly losing some degree of optimality or developing tailor made solutions. It
is therefore essential to keep the desired functionality in mind as well as all the traditional criteria when
evaluating workforce management solutions.
However not all call centres need an automated system to accomplish workforce management tasks
(Reynolds, 2006). Reynolds also states that “need is a function of size and operating complexity”.
The benefits and cost justifications have to be carefully evaluated before a decision to implement a
workforce management tool can be made.
4.3 Conclusion In order to establish and operate an effective call centre, it is of great importance to have a solid
understanding of the principles behind forecasting, staffing, scheduling, service level, real-time
management and other influencing factors in the call centre environment. It is also extremely
important to have a well formulated approach to implementing the workforce planning cycle. After the
initial design the system has to be monitored carefully on a regular basis in order to detect trends and
problems and also to adjust the model parameters as the environment changes.
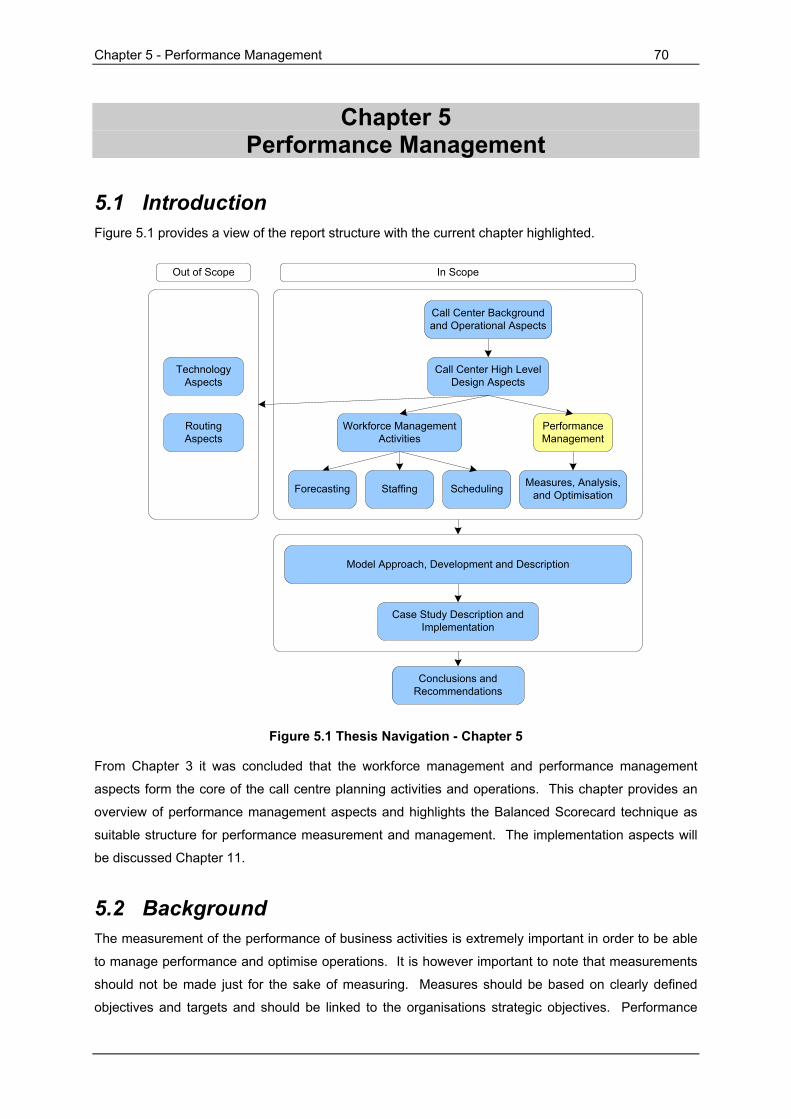
Chapter 5 - Performance Management 70
Chapter 5 Performance Management
5.1 Introduction Figure 5.1 provides a view of the report structure with the current chapter highlighted.
Staffing Scheduling Measures, Analysis, and Optimisation
Call Center High Level Design Aspects
Call Center Background and Operational Aspects
Performance Management
Workforce Management Activities
Forecasting
Case Study Description and Implementation
Conclusions and Recommendations
Model Approach, Development and Description
Technology Aspects
Routing Aspects
Out of Scope In Scope
Figure 5.1 Thesis Navigation - Chapter 5
From Chapter 3 it was concluded that the workforce management and performance management
aspects form the core of the call centre planning activities and operations. This chapter provides an
overview of performance management aspects and highlights the Balanced Scorecard technique as
suitable structure for performance measurement and management. The implementation aspects will
be discussed Chapter 11.
5.2 Background The measurement of the performance of business activities is extremely important in order to be able
to manage performance and optimise operations. It is however important to note that measurements
should not be made just for the sake of measuring. Measures should be based on clearly defined
objectives and targets and should be linked to the organisations strategic objectives. Performance
Chapter 5 - Performance Management 71
measurements can strongly affect the performance of the organisation and the behaviour of the
employees. A structured measurement system is therefore essential for continuous improvement and
innovation.
A well designed performance measurement and management system is also an essential part of call
centre operations. Call centres are complex and dynamic operations and in order to achieve the
performance goals an operational plan is required that includes a structured approach to measure,
analyse, and optimise the operations on all levels of management. A performance management
system should therefore be linked not only to the call centre strategy and goals, but also to that of the
organisation. Making this link will ensure that the call centre will be viewed as strategic revenue
driver.
Cleveland and Minnucci (2004) state that call centre analysts are often just “going through the
motions” during the workforce management and evaluation process. Effective analysis requires
advanced thinking and a combination of mathematical knowledge, modelling skills, database aptitude,
and business process knowledge (Mehrotra, 1997). It is important to understand what should be
measured, how to perform the measure, when to measure it, how to report the information, and how to
analyse information in order to optimise the operations. This will enable the management of the call
centre to gain insight into the dynamics of the various system and model parameters.
5.3 Measurement and Strategic Alignment For a company to be successful, the business operations, activities, and culture have to be driven by
the business strategy. This concept is illustrated in Figure 5.2 which is similar to the concept
discussed by Wade & Recardo (2001).
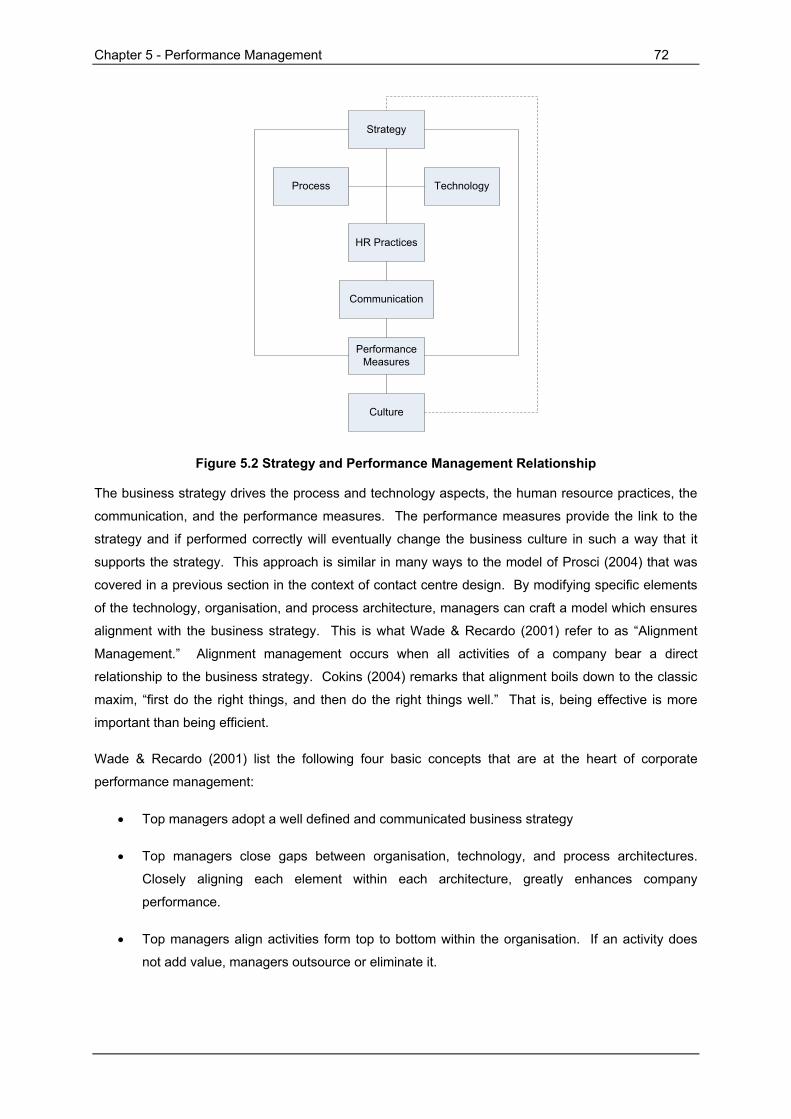
Chapter 5 - Performance Management 72
Strategy
Process Technology
HR Practices
Communication
Performance Measures
Culture
Figure 5.2 Strategy and Performance Management Relationship
The business strategy drives the process and technology aspects, the human resource practices, the
communication, and the performance measures. The performance measures provide the link to the
strategy and if performed correctly will eventually change the business culture in such a way that it
supports the strategy. This approach is similar in many ways to the model of Prosci (2004) that was
covered in a previous section in the context of contact centre design. By modifying specific elements
of the technology, organisation, and process architecture, managers can craft a model which ensures
alignment with the business strategy. This is what Wade & Recardo (2001) refer to as “Alignment
Management.” Alignment management occurs when all activities of a company bear a direct
relationship to the business strategy. Cokins (2004) remarks that alignment boils down to the classic
maxim, “first do the right things, and then do the right things well.” That is, being effective is more
important than being efficient.
Wade & Recardo (2001) list the following four basic concepts that are at the heart of corporate
performance management:
• Top managers adopt a well defined and communicated business strategy
• Top managers close gaps between organisation, technology, and process architectures.
Closely aligning each element within each architecture, greatly enhances company
performance.
• Top managers align activities form top to bottom within the organisation. If an activity does
not add value, managers outsource or eliminate it.
Chapter 5 - Performance Management 73
• Top managers adopt a specific set of key performance measures covering a diverse set of
performance categories (e.g. employee satisfaction, customer satisfaction, productivity,
growth and innovation, financial results)
Performance management therefore plays a critical role in the success of the organisation in terms of
achieving the objectives defined by the business strategy. Cokins (2004) defines performance
management as the process of managing the execution of an organisation’s strategy. Performance
management and performance measures are therefore at the heart of the optimisation process.
Another essential component of performance management is to measure the actual critical aspects of
a company in a way that supports this alignment. One way to achieve this is to use a scorecard
approach. The Balanced Scorecard is a system developed by Kaplan & Norton (1992) to link
performance measures on various levels to strategic objectives. Measurements are usually grouped
into financial, customer, internal, and learning and growth aspects in order to have a balanced
approach to the evaluation of performance.
Once all the key performance measures are defined, a business plan has to be developed that links
employees to the strategy and key performance measures (Wade & Recardo, 2001). This is what is
referred to as activity based business planning. It defines the activities or objectives to be performed,
goods and services that result from that activity, targets of performance, the sources of data and the
time frame. Each activity is assigned to an individual who is held accountable for its achievement. By
following this approach the performance measurement is aligned to strategic objectives and
accountability is established in order to reach targets.
5.4 Performance Management Performance management is the process of managing an organisation’s strategy through a fully
integrated system of business improvement methodologies supported by the various aspects of the
organisation. Performance management encompasses the methodologies, metrics, processes,
software tools, and systems that manage the performance of an organisation (Cokins, 2004). Through
a properly structured performance management system it is therefore possible to close the
communications gap between the business strategy and employee actions. Performance
management provides explicit linkage between strategic, operational, and financial objectives. It
communicates these linkages to managers and employee teams in a way they can comprehend,
thereby empowering employees to act rather than cautiously hesitate or wait for instructions from their
managers (Cokins, 2004). Performance management should foster a work environment in which
managers and employees are genuinely engaged and behave as if they were the business owners.
According to Cokins (2004) there is no single performance management methodology that will work in
every organisation. Many of the performance management methodologies have existed for decades,
while others have recently become popular. An emphasis is placed on finding an approach that
balances all the different role playing aspects of an organisation. The Balanced Scorecard approach

Chapter 5 - Performance Management 74
is one of the methodologies that have become popular and widely used because it takes various
aspects into consideration in a balanced view of performance. The balanced scorecard approach will
be discussed in a later section.
5.5 Performance Management and Data One of the key aspects of performance management is the collection and analysis of data. A
performance management system should be driven by fact based data. Data should be collected,
transformed and modelled into information and reported to users in an efficient manner. For this
purpose tools should be implemented that can manipulate data and present it to a wide array of users.
It is however extremely important to note that data management software (or any software for that
matter) should not replace the thinking needed for strategy and planning that is involved in
performance management.
Cokins (2004) claim that there is a substantial gap between the raw data generated from business
systems and the organisation’s strategy, and that this gap is more than a communications gap – it is
an intelligence gap as well. That is why business intelligence can play a vital role in the optimisation
of operations, if it is implemented correctly. According to the Dimension Data Global Contact Centre
Benchmarking Report 2007, less than half of contact centre management teams take the analysis of
contact centre data seriously and only one in six of the team leaders do so either. This is remarkable
considering the vast amount of data generated through call centre operations, and it points to the
potentially valuable insights that can be gained from the proper utilisation of call centre and
organisational data in the correct manner.
5.6 Balanced Scorecard It is vital to have a methodology that assists in the organisation of thoughts and determine what, when,
and how measurements should be made (Mehrotra, 1997). The framework used for a measurement
system should ensure that critical aspects of performance are measured and that those measures are
linked to the organisation’s strategy in order to drive the correct actions.
The balanced scorecard is a concept developed by Kaplan & Norton (1992). They propose that an
integrated set of measures be developed to track performance from financial, customer, internal, and
learning and growth perspectives. Cause and effect linkages should describe a path by which
improvements in the capabilities of intangible assets get transformed in tangible customer and
financial outcomes. It helps to highlight the cause-and-effect relationships among performance drivers
and identify the link to strategic outcomes (Chase, Jacobs & Aquilano, 2004). The balanced
scorecard approach has the following attributes:
• helps align key performance measures with strategy at all organisational levels
• provides management with a comprehensive picture of business operations

Chapter 5 - Performance Management 75
• facilitates communication and understanding of business goals and strategies at all levels of
an organisation
• provides strategic feedback and learning
The balanced scorecard addresses the financial, customer, internal business process, and learning
and growth aspects (as illustrated in Figure 5.3) of the organisation in balanced view that is linked to
the vision and strategy. Objectives are defined in each of the categories. Measures are then defined
for each objective, targets are defined, and initiative or plans are put in place to ensure that the
performance targets and objectives are met.
Vision and Strategy
Customer Perspective
Objectives Measures Targets Initiatives
Financial Perspective
Objectives Measures Targets Initiatives
Internal Perspective
Objectives Measures Targets Initiatives
Learning and Growth Perspective
Objectives Measures Targets Initiatives
Figure 5.3 The Balanced Scorecard
5.6.1 Objectives The aim of a performance management is the development of objectives in each of the four
perspectives of the Balanced Scorecard. The following sections will briefly cover the four
perspectives.
5.6.1.1 Financial Perspective Companies use a variety of metrics as the high level financial objective, but according to Niven (2005)
there are basically two ways for a business to make more money: sell more products or spend less.
Kaplan & Norton therefore assert that a company’s financial performance may be improved with two
basic levers – revenue growth and productivity. The revenue growth strategy focuses on developing
new sources of revenue and profitability, typically accomplished by selling entirely new products or
services or by deepening relationships with existing customers. The productivity strategy is similarly
achieved by two approaches. The first option is reducing the direct and indirect costs by spending
less on business inputs. A second approach involves improving productivity by utilising assets more
efficiently, thereby requiring less money to support a given level of production. An interesting aspect
is managing the tension between these seemingly contradictory forces. In many ways the objectives
in each of the remaining three perspectives will ensure that the financial objectives are met.
Chapter 5 - Performance Management 76
5.6.1.2 Customer Perspective The customer perspective is at the heart of the strategy and defines how growth will be achieved.
Choosing objectives for the customer perspective requires the organisation to determine who the
targeted customers are and how value will be added for those customers. A specific value proposition
then needs to be defined for the targeted customers that define the strategy to compete for new
customers or an increased share of existing customers. The value proposition is often described as a
unique mix of product, price, service, relationship, and image that is offered to targeted customers.
5.6.1.3 Internal Perspective The internal perspective defines the business processes and the specific activities that the
organisation must master to support the customer value proposition. It is important that strategy not
only specify the desired outcomes but also describe how these outcomes will be achieved. The
internal processes perspective will often have the greatest number of objectives. Kaplan & Norton
have identified four clusters of processes which are applicable to most organisations. These are
operations management processes, customer management processes, innovation processes, and
regulatory and social processes.
5.6.1.4 Learning and Growth Perspective The learning and growth perspective defines the intangible assets needed to enable activities and
customer relationships to be performed at high levels of performance. Learning and growth strategies
are important for the long term development of the organisation. It is vitally important to align human
resources, information technology, corporate climate, and research activities with the requirements
from the strategic business processes and customer differentiation strategy.
Niven (2005) divides this perspective into three distinct, yet interrelated, dimensions. The first is
human capital, encompassing the skills and capabilities necessary to execute strategy and compete
effectively in the marketplace. The second, informational capital, comprises the information
infrastructure and support systems necessary to support the strategy. Finally the organisational
capital represents the intangibles providing the ability to change and grow, including culture,
leadership, and alignment.
The balanced scorecard brings together in a single management report many of the seemingly
disparate elements of a company’s competitive agenda. The balanced scorecard approach forces
managers to focus on the handful of measures that are most critical and also to consider measures
together and realise how the different aspects can affect each other. Niven (2005) states that the
Balanced Scorecard has become the cornerstone of management practice, guiding reporting,
budgeting, performance appraisal, and incentive compensation.

Chapter 5 - Performance Management 77
5.6.2 Measures, Targets, and Initiatives The strategy map communicates the organisation’s objectives. The next step is to determine if in fact
those objectives are being reached. Performance measures are used to track and evaluate the
progress of each of the objectives in the strategy map. According to Niven (2005), measures form the
core of the Balanced Scorecard system, driving the desired action and behaviour, providing all
employees with guidance on how they may contribute to organisational success, and supplying
management with a tool to determine overall progress on the strategic objectives.
A starting point for measurement efforts could be to determine what information is necessary to
perform the operations. Niven (2005) claims this type of approach will most likely produce measures
that will match nicely to the objectives defined in the strategy map. Niven also states that if a measure
is found that does not have a corresponding objective, but is indeed critical to navigating the
organisation, that diagnostic should lead to a re-examination of the map and the possible inclusion of
new objective. On the other hand it could also point to the fact that the measure might not be as
critical as originally assumed and that other measures might be more useful.
Many organisations use performance measures in an attempt to introduce accountability for results.
When implemented carefully, performance measurement can fulfil this goal. Results of measurement
initiatives should be analysed and used to determine the root cause of problems or successes and not
only be used to determine penalties or disciplinary actions. Measure owners should not just be
penalised for poor performance, but the opportunity should be taken to learn from the results and
actions should be reviewed for the future. It is extremely important to avoid the situation where
personnel are avoiding responsibility and refusing to take responsibility because of fear of the
consequences of poor performance and the penalties that are associated with it. Instead performance
measures should foster an environment where those responsible can take the initiative and learn
throughout the process (sometimes by making mistakes) and even becoming proactive in solving
problems. The Balanced Scorecard emphasises the paradigm shift from a transition to using
measures to punish to using measures to learn (Niven, 2005).
The Balanced Scorecard is a powerful measurement device, translating a strategy into the concrete
indicators that will be used to gauge success, but without targets, the desired result of a measure does
not provide real value and insight. Only by considering performance in light of desired results is
meaningful information produced. By defining targets measures develop meaning and can be used
for decision making and all subsequent activities can be focussed on reaching or improving those
targets.
Initiatives represent the specific programs, activities, projects, or actions that are necessary to meet or
exceed the performance targets. It is important to continually review initiatives to ensure that it does
support the strategic objectives and is reflected in the measures.
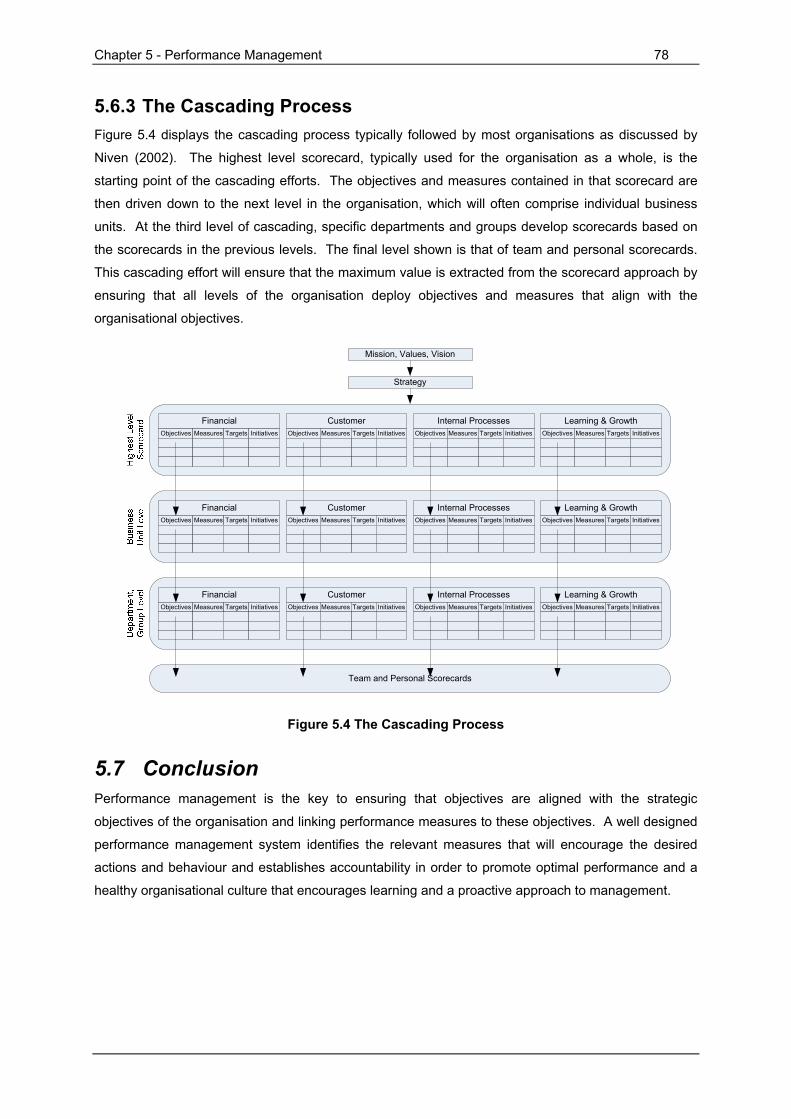
Chapter 5 - Performance Management 78
5.6.3 The Cascading Process Figure 5.4 displays the cascading process typically followed by most organisations as discussed by
Niven (2002). The highest level scorecard, typically used for the organisation as a whole, is the
starting point of the cascading efforts. The objectives and measures contained in that scorecard are
then driven down to the next level in the organisation, which will often comprise individual business
units. At the third level of cascading, specific departments and groups develop scorecards based on
the scorecards in the previous levels. The final level shown is that of team and personal scorecards.
This cascading effort will ensure that the maximum value is extracted from the scorecard approach by
ensuring that all levels of the organisation deploy objectives and measures that align with the
organisational objectives.
FinancialObjectives Measures Targets Initiatives
CustomerObjectives Measures Targets Initiatives
Internal ProcessesObjectives Measures Targets Initiatives
Learning & GrowthObjectives Measures Targets Initiatives
FinancialObjectives Measures Targets Initiatives
CustomerObjectives Measures Targets Initiatives
Internal ProcessesObjectives Measures Targets Initiatives
Learning & GrowthObjectives Measures Targets Initiatives
FinancialObjectives Measures Targets Initiatives
CustomerObjectives Measures Targets Initiatives
Internal ProcessesObjectives Measures Targets Initiatives
Learning & GrowthObjectives Measures Targets Initiatives
Team and Personal Scorecards
Mission, Values, Vision
Strategy
Figure 5.4 The Cascading Process
5.7 Conclusion Performance management is the key to ensuring that objectives are aligned with the strategic
objectives of the organisation and linking performance measures to these objectives. A well designed
performance management system identifies the relevant measures that will encourage the desired
actions and behaviour and establishes accountability in order to promote optimal performance and a
healthy organisational culture that encourages learning and a proactive approach to management.
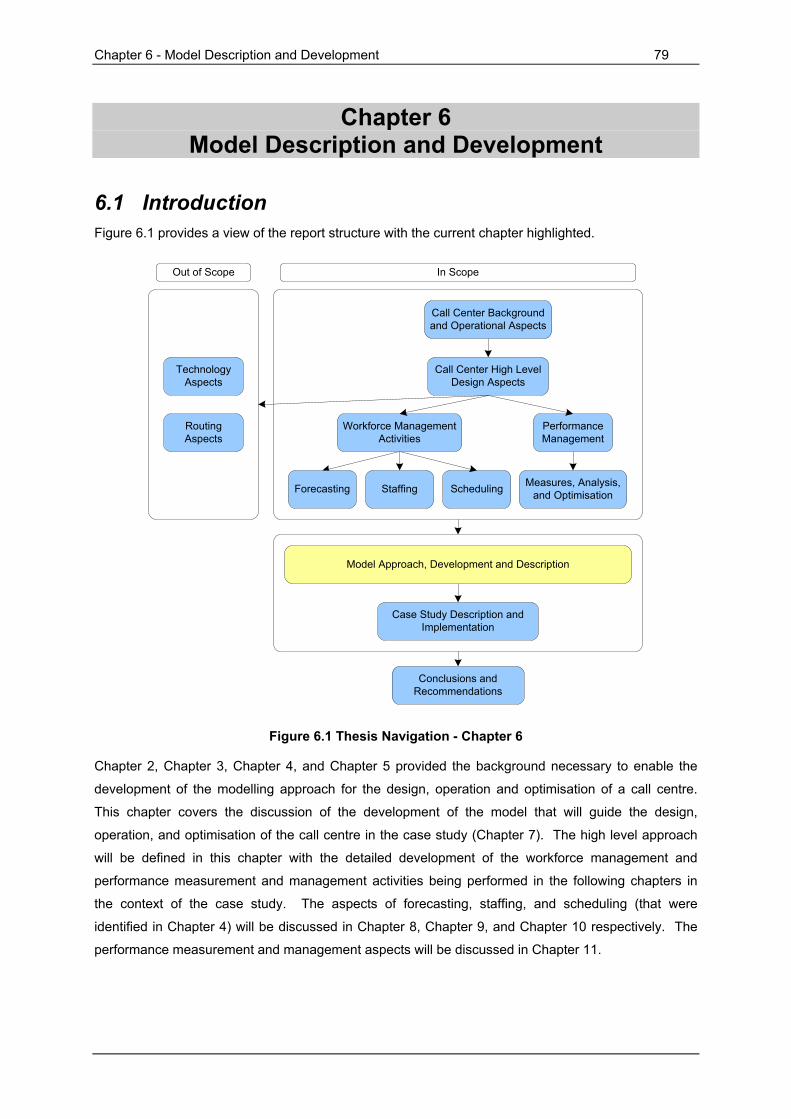
Chapter 6 - Model Description and Development 79
Chapter 6 Model Description and Development
6.1 Introduction Figure 6.1 provides a view of the report structure with the current chapter highlighted.
Staffing Scheduling Measures, Analysis, and Optimisation
Call Center High Level Design Aspects
Call Center Background and Operational Aspects
Performance Management
Workforce Management Activities
Forecasting
Case Study Description and Implementation
Conclusions and Recommendations
Model Approach, Development and Description
Technology Aspects
Routing Aspects
Out of Scope In Scope
Figure 6.1 Thesis Navigation - Chapter 6
Chapter 2, Chapter 3, Chapter 4, and Chapter 5 provided the background necessary to enable the
development of the modelling approach for the design, operation and optimisation of a call centre.
This chapter covers the discussion of the development of the model that will guide the design,
operation, and optimisation of the call centre in the case study (Chapter 7). The high level approach
will be defined in this chapter with the detailed development of the workforce management and
performance measurement and management activities being performed in the following chapters in
the context of the case study. The aspects of forecasting, staffing, and scheduling (that were
identified in Chapter 4) will be discussed in Chapter 8, Chapter 9, and Chapter 10 respectively. The
performance measurement and management aspects will be discussed in Chapter 11.

Chapter 6 - Model Description and Development 80
6.2 Modelling Approach The Contact Centre Model and Planning Roadmap of Prosci (2004) that was discussed in Chapter 3
will be used as the reference base in the development of the model to be used in the rest of this
report. The model of Prosci (2004) provides a high level perspective of the aspects that have to be
considered when designing and operating a call centre. It also provides a logical sequence of the
relevant aspects that have to be addressed for each of the high level aspects. When confronted with
the dynamic and complex environment of modern call centres and the often conflicting management
objectives, a structured approach should be an essential part of the design and operation process.
The model developed by Prosci (2004) will serve as the basis of the approach developed in this
chapter and report. The planning roadmap will be slightly revised to suite the purposes of this
research. The basic structure and sequence of activities will be used to guide the design, operation,
and optimisation activities. Through the research conducted in the previous chapters and particularly
the model of Prosci (2004), the workforce management and performance management processes
were found to form the core of the call centre operations. The model of Prosci (2004) however does
not provide an adequate workforce management and performance management description and
therefore these two aspects will be emphasised in the model used in this research. A workforce
management model that includes the forecasting, staffing, and scheduling aspects (mentioned in
Chapter 4) will be developed as well as a performance measurement and management model that
can be used to evaluate and manage the performance of the call centre and in particular the workforce
management process.
6.3 Model Development The revised Planning Roadmap of Prosci (2004) with the workforce management and performance
management aspects included is illustrated in Figure 6.2. The revised Roadmap differs from the
original in Figure 3.3 in that the aspects of workforce management and performance management are
emphasised and included separately in the model.
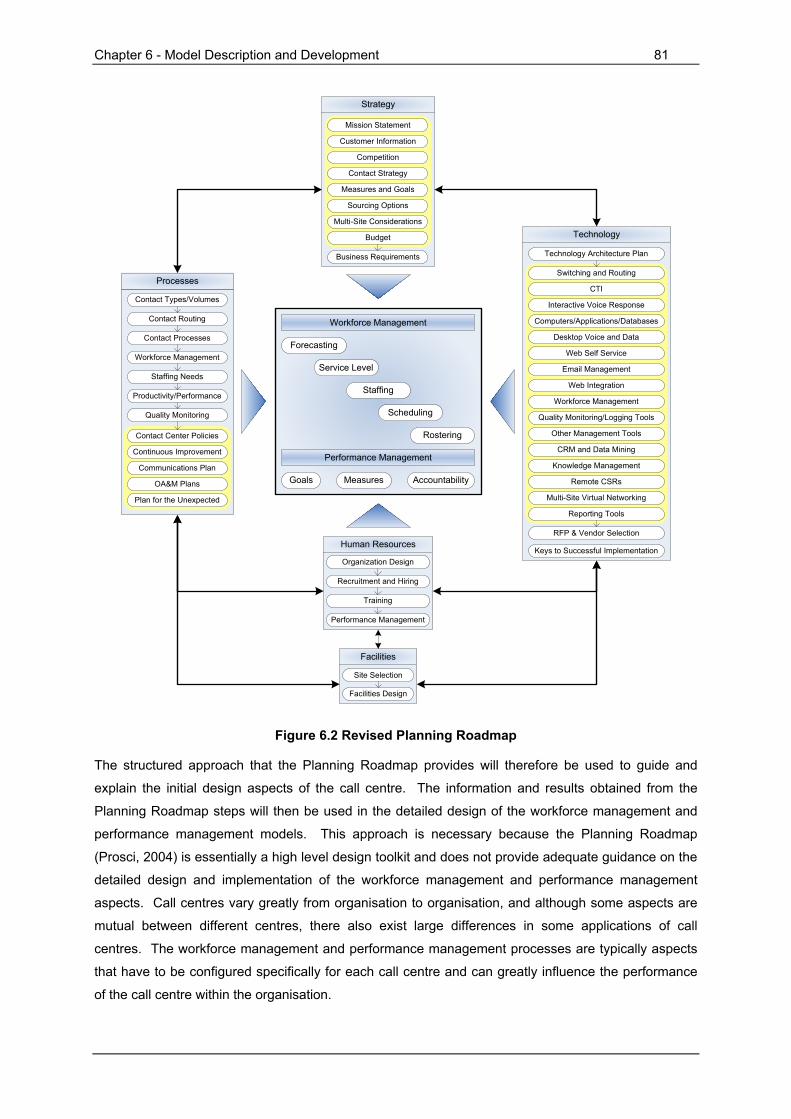
Chapter 6 - Model Description and Development 81
Organization Design
Performance Management
Training
Recruitment and Hiring
Site Selection
Facilities Design
Mission Statement
Contact Strategy
Competition
Customer Information
Measures and Goals
Budget
Multi-Site Considerations
Sourcing Options
Business Requirements
Contact Types/Volumes
Workforce Management
Contact Processes
Contact Routing
Contact Center Policies
Quality Monitoring
Productivity/Performance
Continuous Improvement
OA&M Plans
Communications Plan
Plan for the Unexpected
Switching and Routing
Technology Architecture Plan
CTI
Computers/Applications/Databases
Interactive Voice Response
Desktop Voice and Data
Email Management
Web Self Service
Web Integration
Quality Monitoring/Logging Tools
Workforce Management
Other Management Tools
Knowledge Management
CRM and Data Mining
Remote CSRs
Reporting Tools
Multi-Site Virtual Networking
RFP & Vendor Selection
Keys to Successful Implementation
Workforce Management
Forecasting
Service Level
Staffing
Scheduling
Rostering
Goals Measures Accountability
Strategy
Processes
Technology
Human Resources
Facilities
Performance Management
Staffing Needs
Figure 6.2 Revised Planning Roadmap
The structured approach that the Planning Roadmap provides will therefore be used to guide and
explain the initial design aspects of the call centre. The information and results obtained from the
Planning Roadmap steps will then be used in the detailed design of the workforce management and
performance management models. This approach is necessary because the Planning Roadmap
(Prosci, 2004) is essentially a high level design toolkit and does not provide adequate guidance on the
detailed design and implementation of the workforce management and performance management
aspects. Call centres vary greatly from organisation to organisation, and although some aspects are
mutual between different centres, there also exist large differences in some applications of call
centres. The workforce management and performance management processes are typically aspects
that have to be configured specifically for each call centre and can greatly influence the performance
of the call centre within the organisation.
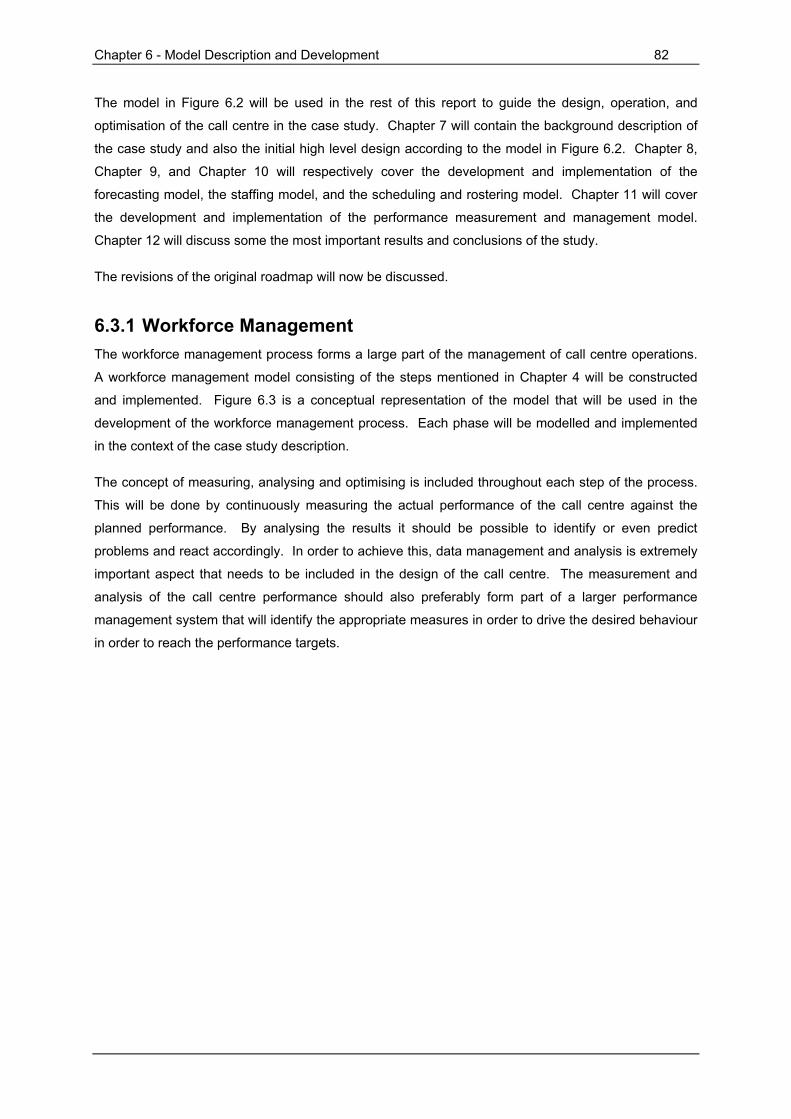
Chapter 6 - Model Description and Development 82
The model in Figure 6.2 will be used in the rest of this report to guide the design, operation, and
optimisation of the call centre in the case study. Chapter 7 will contain the background description of
the case study and also the initial high level design according to the model in Figure 6.2. Chapter 8,
Chapter 9, and Chapter 10 will respectively cover the development and implementation of the
forecasting model, the staffing model, and the scheduling and rostering model. Chapter 11 will cover
the development and implementation of the performance measurement and management model.
Chapter 12 will discuss some the most important results and conclusions of the study.
The revisions of the original roadmap will now be discussed.
6.3.1 Workforce Management The workforce management process forms a large part of the management of call centre operations.
A workforce management model consisting of the steps mentioned in Chapter 4 will be constructed
and implemented. Figure 6.3 is a conceptual representation of the model that will be used in the
development of the workforce management process. Each phase will be modelled and implemented
in the context of the case study description.
The concept of measuring, analysing and optimising is included throughout each step of the process.
This will be done by continuously measuring the actual performance of the call centre against the
planned performance. By analysing the results it should be possible to identify or even predict
problems and react accordingly. In order to achieve this, data management and analysis is extremely
important aspect that needs to be included in the design of the call centre. The measurement and
analysis of the call centre performance should also preferably form part of a larger performance
management system that will identify the appropriate measures in order to drive the desired behaviour
in order to reach the performance targets.
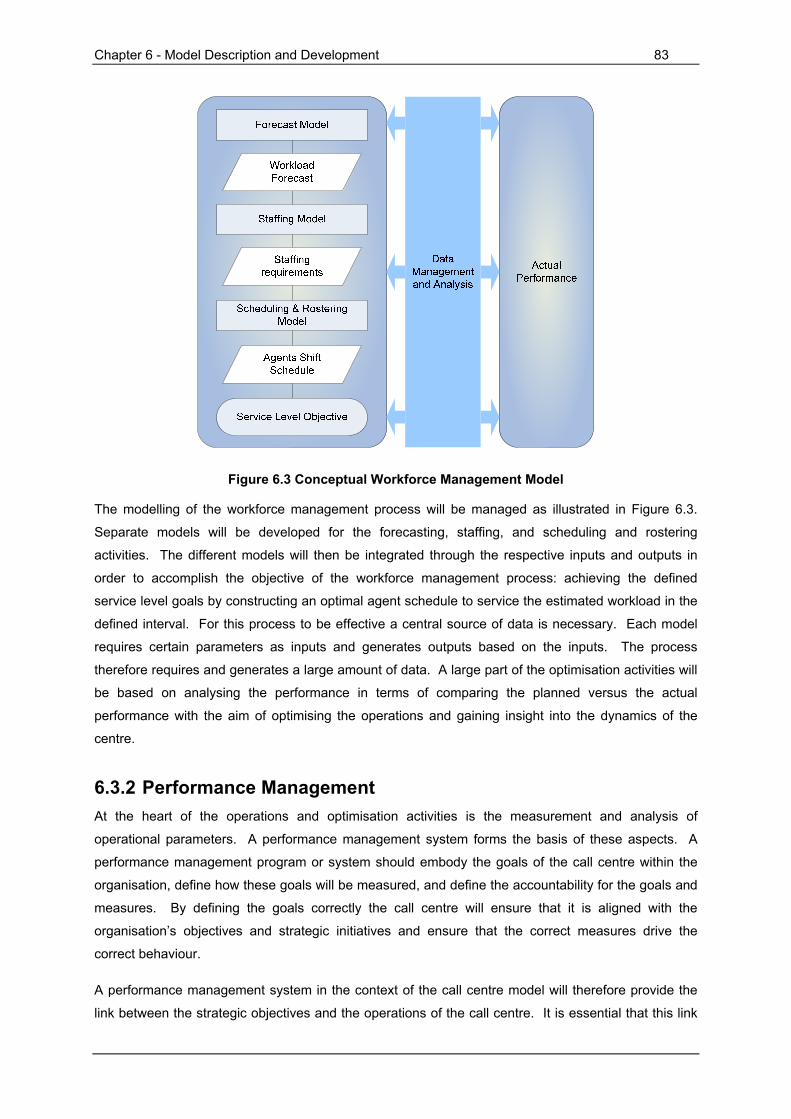
Chapter 6 - Model Description and Development 83
Figure 6.3 Conceptual Workforce Management Model
The modelling of the workforce management process will be managed as illustrated in Figure 6.3.
Separate models will be developed for the forecasting, staffing, and scheduling and rostering
activities. The different models will then be integrated through the respective inputs and outputs in
order to accomplish the objective of the workforce management process: achieving the defined
service level goals by constructing an optimal agent schedule to service the estimated workload in the
defined interval. For this process to be effective a central source of data is necessary. Each model
requires certain parameters as inputs and generates outputs based on the inputs. The process
therefore requires and generates a large amount of data. A large part of the optimisation activities will
be based on analysing the performance in terms of comparing the planned versus the actual
performance with the aim of optimising the operations and gaining insight into the dynamics of the
centre.
6.3.2 Performance Management At the heart of the operations and optimisation activities is the measurement and analysis of
operational parameters. A performance management system forms the basis of these aspects. A
performance management program or system should embody the goals of the call centre within the
organisation, define how these goals will be measured, and define the accountability for the goals and
measures. By defining the goals correctly the call centre will ensure that it is aligned with the
organisation’s objectives and strategic initiatives and ensure that the correct measures drive the
correct behaviour.
A performance management system in the context of the call centre model will therefore provide the
link between the strategic objectives and the operations of the call centre. It is essential that this link
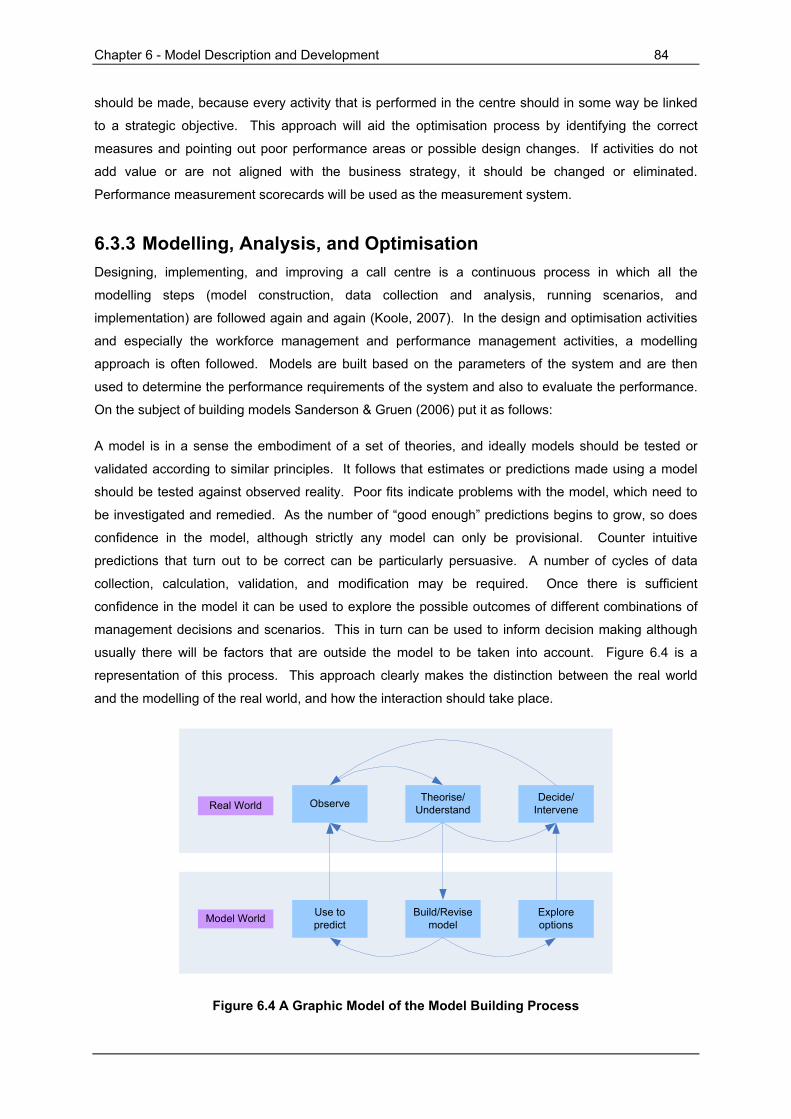
Chapter 6 - Model Description and Development 84
should be made, because every activity that is performed in the centre should in some way be linked
to a strategic objective. This approach will aid the optimisation process by identifying the correct
measures and pointing out poor performance areas or possible design changes. If activities do not
add value or are not aligned with the business strategy, it should be changed or eliminated.
Performance measurement scorecards will be used as the measurement system.
6.3.3 Modelling, Analysis, and Optimisation Designing, implementing, and improving a call centre is a continuous process in which all the
modelling steps (model construction, data collection and analysis, running scenarios, and
implementation) are followed again and again (Koole, 2007). In the design and optimisation activities
and especially the workforce management and performance management activities, a modelling
approach is often followed. Models are built based on the parameters of the system and are then
used to determine the performance requirements of the system and also to evaluate the performance.
On the subject of building models Sanderson & Gruen (2006) put it as follows:
A model is in a sense the embodiment of a set of theories, and ideally models should be tested or
validated according to similar principles. It follows that estimates or predictions made using a model
should be tested against observed reality. Poor fits indicate problems with the model, which need to
be investigated and remedied. As the number of “good enough” predictions begins to grow, so does
confidence in the model, although strictly any model can only be provisional. Counter intuitive
predictions that turn out to be correct can be particularly persuasive. A number of cycles of data
collection, calculation, validation, and modification may be required. Once there is sufficient
confidence in the model it can be used to explore the possible outcomes of different combinations of
management decisions and scenarios. This in turn can be used to inform decision making although
usually there will be factors that are outside the model to be taken into account. Figure 6.4 is a
representation of this process. This approach clearly makes the distinction between the real world
and the modelling of the real world, and how the interaction should take place.
Observe Theorise/Understand
Decide/Intervene
Use to predict
Build/Revise model
Explore options
Real World
Model World
Figure 6.4 A Graphic Model of the Model Building Process

Chapter 6 - Model Description and Development 85
The optimisation of activities is therefore closely tied to the concept of measuring and learning. From
the model in Figure 6.4 it is evident that optimisation relies on information as a starting point and has a
strong emphasis on implementation. The optimising process includes measuring parameters,
analysing data, identifying the problem, developing solutions, and implementing the solutions. Figure
6.5 illustrates this process.
Analyse
Identify
Develop
Impl
emen
t
Figure 6.5 Optimisation Process
The approach in this study will aim to follow a similar approach as described in the previous sections.
In cases where a new call centre has to be implemented, a great deal of the initial design will depend
on assumptions and estimates. Applying the methodology of Sanderson & Gruen (2006) in the
context of the model of Figure 6.2 will therefore ensure that the optimisation process will be based on
a structured modelling approach in order to provide accurate models and information in order to make
the decision making process an informed and effective one.
The lifecycle and maturity models proposed by Dawson (2004) and Genesys (2006), although not
covered in much detail, can be used as a rough guide to evaluate the position of the call centre and
determine the extent to which the revised call centre design model has to be applied and what
decisions have to be made in future development directions.
6.4 Conclusion This chapter covered the development of the modelling approach that will be followed for the design,
operation, and implementation of the call centre in the case study. The Call Centre Planning
Roadmap developed by Prosci (2004) will be used as the reference base to guide the high level
design aspects. Workforce management and performance management models will then be
developed using the result obtained from the Planning Roadmap. These aspects will be discussed in
the following chapters.
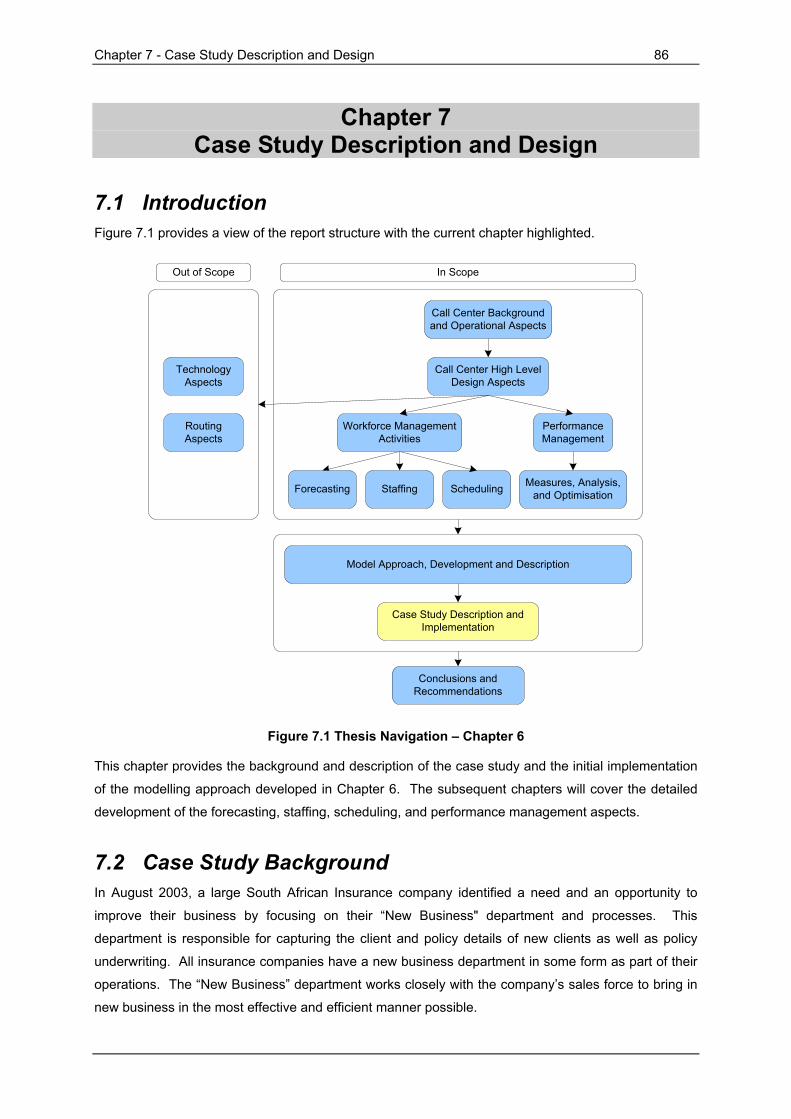
Chapter 7 - Case Study Description and Design 86
Chapter 7 Case Study Description and Design
7.1 Introduction Figure 7.1 provides a view of the report structure with the current chapter highlighted.
Staffing Scheduling Measures, Analysis, and Optimisation
Call Center High Level Design Aspects
Call Center Background and Operational Aspects
Performance Management
Workforce Management Activities
Forecasting
Case Study Description and Implementation
Conclusions and Recommendations
Model Approach, Development and Description
Technology Aspects
Routing Aspects
Out of Scope In Scope
Figure 7.1 Thesis Navigation – Chapter 6
This chapter provides the background and description of the case study and the initial implementation
of the modelling approach developed in Chapter 6. The subsequent chapters will cover the detailed
development of the forecasting, staffing, scheduling, and performance management aspects.
7.2 Case Study Background In August 2003, a large South African Insurance company identified a need and an opportunity to
improve their business by focusing on their “New Business" department and processes. This
department is responsible for capturing the client and policy details of new clients as well as policy
underwriting. All insurance companies have a new business department in some form as part of their
operations. The “New Business” department works closely with the company’s sales force to bring in
new business in the most effective and efficient manner possible.
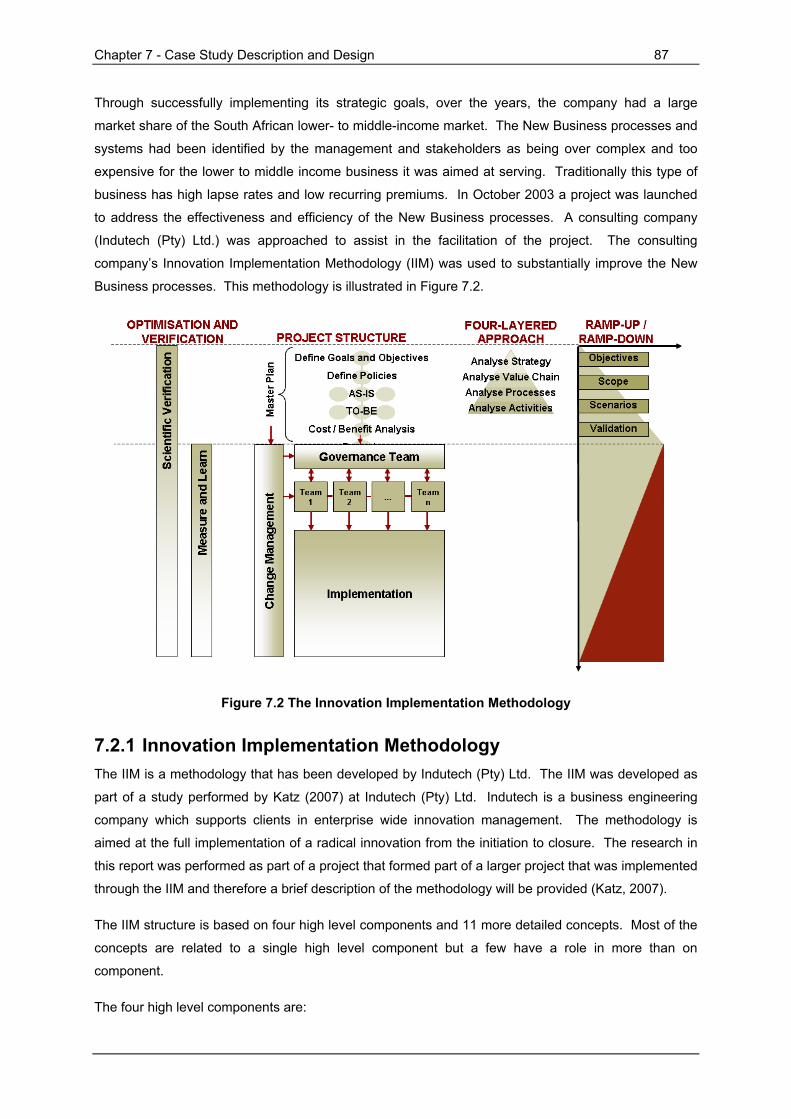
Chapter 7 - Case Study Description and Design 87
Through successfully implementing its strategic goals, over the years, the company had a large
market share of the South African lower- to middle-income market. The New Business processes and
systems had been identified by the management and stakeholders as being over complex and too
expensive for the lower to middle income business it was aimed at serving. Traditionally this type of
business has high lapse rates and low recurring premiums. In October 2003 a project was launched
to address the effectiveness and efficiency of the New Business processes. A consulting company
(Indutech (Pty) Ltd.) was approached to assist in the facilitation of the project. The consulting
company’s Innovation Implementation Methodology (IIM) was used to substantially improve the New
Business processes. This methodology is illustrated in Figure 7.2.
Figure 7.2 The Innovation Implementation Methodology
7.2.1 Innovation Implementation Methodology The IIM is a methodology that has been developed by Indutech (Pty) Ltd. The IIM was developed as
part of a study performed by Katz (2007) at Indutech (Pty) Ltd. Indutech is a business engineering
company which supports clients in enterprise wide innovation management. The methodology is
aimed at the full implementation of a radical innovation from the initiation to closure. The research in
this report was performed as part of a project that formed part of a larger project that was implemented
through the IIM and therefore a brief description of the methodology will be provided (Katz, 2007).
The IIM structure is based on four high level components and 11 more detailed concepts. Most of the
concepts are related to a single high level component but a few have a role in more than on
component.
The four high level components are:

Chapter 7 - Case Study Description and Design 88
• A four layered approach
• Ramp up and ramp down project life cycle
• Project structure
• Verification and optimisation principles
The four components are used in parallel throughout a radical innovation project, as opposed to being
used in series at different stages of a project. Each component provides a different view of the radical
innovation project and has different function in the project.
The 11 detailed components are:
• Governance principles and mandates
• Project integration
• Design objectives
• Mock-ups and prototypes
• Roadmaps
• Knowledge transfer
• Knowledge management
• Measure and learn
• Management commitment
• Risk management
• Change management
Each of the above concepts has a role to play in managing a radical innovation project and is part of
one or more of the high level components.
7.2.1.1 Four Layered Approach The four layered approach provides a view of the different levels of detail required to be addressed
during a radical innovation project. The four layered approach has the role of guiding the innovation
teams through the different levels of detail as the radical innovation project unfolds. These levels
include the strategy, value chain, processes, and activities. Ideally it should be able to make a clear
link between each of the different levels of detail.
Chapter 7 - Case Study Description and Design 89
The strategy layer aids in guiding the high level project objectives through the analysis and mapping of
the organisation’s strategy. The aim of analysing the value chain is to start to determine the scope of
the innovation project. At the value chain level the scope is determined by focusing on a section of the
value chain and then listing all products, processes, personnel, and systems that may be directly
affected by the radical innovation project. Within the process layer there are also different levels of
detail. Business process modelling can be used to map the current and future business processes.
The activity layer is the most detailed. At this layer detailed activities are modelled and/or simulated.
Ramp Up and Ramp Down
The ramp up and ramp down component provides a view of the extent of involvement of the various
role players and their roles and responsibilities throughout the radical innovation project.
The time axis represents the life of the radical innovation project and the responsibility axis represents
the amount of responsibility or relative involvement of the various role players. The two main
categories of role players are the innovation team and the operational team. The ramp up and ramp
down component guides these two teams through the radical innovation project and explains when
and to what extent they should be involved. This component also supports the very important
knowledge transfer between the innovation and operational teams.
The Project Structure
The project structure component provides a view of the different project teams involved in the
innovation and illustrates how these project teams interact in order to achieve the overall radical
innovation project objectives.
Even though radical innovation projects vary greatly in their requirements and objectives, several
generic teams can be defined. Each team plays a specific role in the radical innovation and the team
should therefore consist of individuals who are capable and willing to play their defined roles.
The generic radical innovation teams are:
• Innovation Team
• Project Board
• Management Team
• Governance Team
• Change Management Team or Transition Team
• One or several Detail Design Teams

Chapter 7 - Case Study Description and Design 90
Verification and Optimisation
The verification and optimisation component of the IIM provides a scientific and experimental view of
the radical innovation project. Due to the high levels of uncertainty in a radical innovation project, the
IIM uses a range of tools and techniques to reduce the uncertainty from the beginning of the project to
well into the execution. This is the verification segment of this component. Verification involves
identifying a question and then determining through a formal scientific or experimental approach the
answer to the question.
The optimisation component usually appears late in the radical innovation project, once the
implementation is well under way. The optimisation component is vital for ensuring that the new
operational environment performs as it was designed.
The concept of measure and learn is the central focus in this IIM component. Both the verification and
optimisation segments of this component rely on strong management information systems. These
systems are used to measure and feedback results so that insight can be obtained.
7.2.1.2 Innovation Concepts The 11 detailed innovation concepts support and link to one or several of the four high level
components. For the purposes of explanation in this report it is not deemed necessary to provide
further explanation of the 11 concepts.
7.2.2 Case Study Project Objectives The main objective of the project that provided this case study was to reduce the complexity and cost
of the New Business process thus making the process simpler and more user-friendly for the
insurance sales staff (also referred to as intermediaries) and clients. The objectives were:
• Reduce the overall cost of the New Business process
• Reduce the time to issue a policy
• Reduce the administrative burden on the intermediaries and clients
• Improve the accessibility of life insurance for the lower end of the market.
A high level description of the old and new processes is provided in the next sections.
7.2.3 The Old Process The old process was based on a traditional paper driven insurance model where the intermediary and
the client filled in a paper application form. The intermediary would visit the client to understand the
client’s financial needs. Next, the intermediary would go to the regional office to draw several quotes
based on the client’s information. The intermediary would then return to the client, and once the client
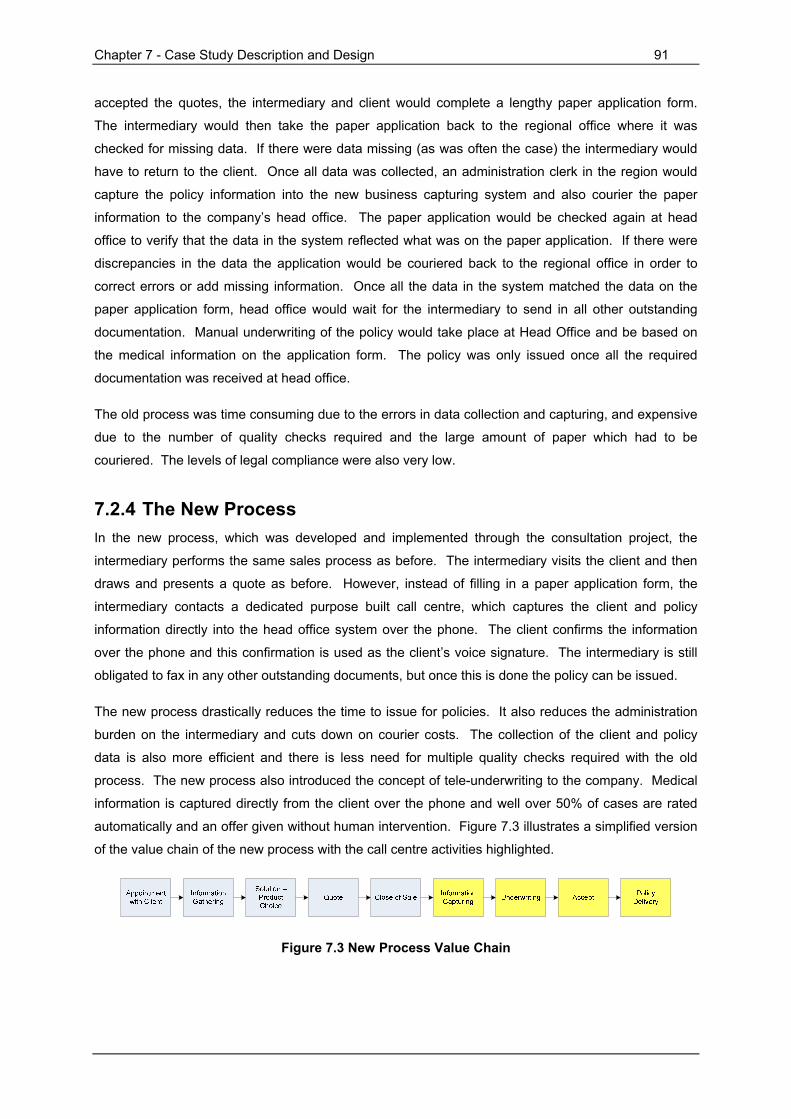
Chapter 7 - Case Study Description and Design 91
accepted the quotes, the intermediary and client would complete a lengthy paper application form.
The intermediary would then take the paper application back to the regional office where it was
checked for missing data. If there were data missing (as was often the case) the intermediary would
have to return to the client. Once all data was collected, an administration clerk in the region would
capture the policy information into the new business capturing system and also courier the paper
information to the company’s head office. The paper application would be checked again at head
office to verify that the data in the system reflected what was on the paper application. If there were
discrepancies in the data the application would be couriered back to the regional office in order to
correct errors or add missing information. Once all the data in the system matched the data on the
paper application form, head office would wait for the intermediary to send in all other outstanding
documentation. Manual underwriting of the policy would take place at Head Office and be based on
the medical information on the application form. The policy was only issued once all the required
documentation was received at head office.
The old process was time consuming due to the errors in data collection and capturing, and expensive
due to the number of quality checks required and the large amount of paper which had to be
couriered. The levels of legal compliance were also very low.
7.2.4 The New Process In the new process, which was developed and implemented through the consultation project, the
intermediary performs the same sales process as before. The intermediary visits the client and then
draws and presents a quote as before. However, instead of filling in a paper application form, the
intermediary contacts a dedicated purpose built call centre, which captures the client and policy
information directly into the head office system over the phone. The client confirms the information
over the phone and this confirmation is used as the client’s voice signature. The intermediary is still
obligated to fax in any other outstanding documents, but once this is done the policy can be issued.
The new process drastically reduces the time to issue for policies. It also reduces the administration
burden on the intermediary and cuts down on courier costs. The collection of the client and policy
data is also more efficient and there is less need for multiple quality checks required with the old
process. The new process also introduced the concept of tele-underwriting to the company. Medical
information is captured directly from the client over the phone and well over 50% of cases are rated
automatically and an offer given without human intervention. Figure 7.3 illustrates a simplified version
of the value chain of the new process with the call centre activities highlighted.
Figure 7.3 New Process Value Chain
Chapter 7 - Case Study Description and Design 92
7.2.5 Case Study Call Centre The new process definition required that a call centre be implemented in the New Business process.
This call centre was quite unique because of the function it had to perform and the fact that it was
placed in a critical part of the value chain of the New Business Process (see Figure 7.3). The proper
operation of the centre was therefore critical to the success of the project and future business
operations of the organisation. The following activities had to be performed:
• Detailed design of processes and call centre
• Development of performance measures
• Measurement of performance and performance optimisation activities
A structured approach was necessary in order to implement the call centre during the consultation
project as part of the business operations. Because the normal operation of the company’s activities
could not be interrupted by a sudden change from the old to the new process and the fact that all the
employees involved (agents, intermediaries, etc.) had to be trained (all in different regions over the
country), it was decided to phase in the new process. This was also done to minimise possible
implementation risks and to allow for the validation and optimising of the intended process.
7.3 Case Study Call Centre Design The following sections contain a few of the important aspects concerning the case study design and
operational aspects. The model developed in Chapter 6 (and illustrated in Figure 6.2) will be used to
guide the process and the discussion will follow the structure and sequence of the model. Brief
descriptions of the various components will be provided and more detailed discussions will be
provided where applicable.
7.3.1 Call Centre Strategy The following sections contain the call centre strategy aspects.
7.3.1.1 Call Centre Mission The call centre forms part of the New Business department of the organisation. The main function of
the call centre is to capture and process client information. The call centre performs this function in
order to increase the value of the organisation by aiding the revenue production and reducing the
costs of the New Business department. This can only be realised by effective and efficient operations.
7.3.1.2 Call Centre Customers The customers or users of the call centre are the intermediaries and the customers of the
organisation. The company’s target market is the South African lower- to middle-income market.
Previous intermediary and customer information as well as sales information was available from the
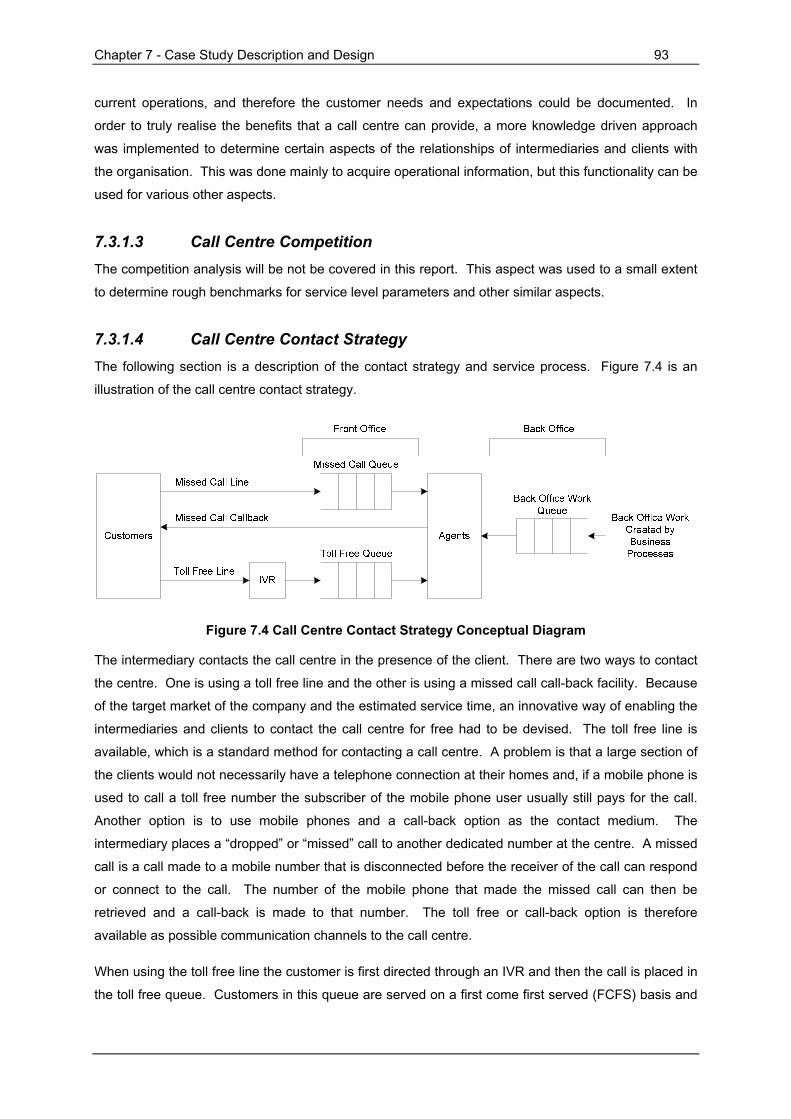
Chapter 7 - Case Study Description and Design 93
current operations, and therefore the customer needs and expectations could be documented. In
order to truly realise the benefits that a call centre can provide, a more knowledge driven approach
was implemented to determine certain aspects of the relationships of intermediaries and clients with
the organisation. This was done mainly to acquire operational information, but this functionality can be
used for various other aspects.
7.3.1.3 Call Centre Competition The competition analysis will be not be covered in this report. This aspect was used to a small extent
to determine rough benchmarks for service level parameters and other similar aspects.
7.3.1.4 Call Centre Contact Strategy The following section is a description of the contact strategy and service process. Figure 7.4 is an
illustration of the call centre contact strategy.
Figure 7.4 Call Centre Contact Strategy Conceptual Diagram
The intermediary contacts the call centre in the presence of the client. There are two ways to contact
the centre. One is using a toll free line and the other is using a missed call call-back facility. Because
of the target market of the company and the estimated service time, an innovative way of enabling the
intermediaries and clients to contact the call centre for free had to be devised. The toll free line is
available, which is a standard method for contacting a call centre. A problem is that a large section of
the clients would not necessarily have a telephone connection at their homes and, if a mobile phone is
used to call a toll free number the subscriber of the mobile phone user usually still pays for the call.
Another option is to use mobile phones and a call-back option as the contact medium. The
intermediary places a “dropped” or “missed” call to another dedicated number at the centre. A missed
call is a call made to a mobile number that is disconnected before the receiver of the call can respond
or connect to the call. The number of the mobile phone that made the missed call can then be
retrieved and a call-back is made to that number. The toll free or call-back option is therefore
available as possible communication channels to the call centre.
When using the toll free line the customer is first directed through an IVR and then the call is placed in
the toll free queue. Customers in this queue are served on a first come first served (FCFS) basis and
Chapter 7 - Case Study Description and Design 94
the places in the queue are therefore distinguished by the time of arrival. Customers using the missed
call line are placed in a separate queue and served on a FCFS basis based on the time of arrival. The
two queues are not directly integrated. (This was done because of technology based reasons and will
not be discussed in this study).
Because of the complexities of some of the products sold by the company and the procedures that
have to be followed, it would not always be practically possible to complete a case in one call, and a
second, third or more calls would have to be made in some cases.
The call centre is also responsible for performing back office or administration work regarding policies
that does not require customer involvement and the use of telephones.
The call centre operating time is from 07:00 to 21:00 on weekdays (Monday to Friday) and from 07:00
to 13:00 on Saturdays. The call centre is closed on Sundays and public holidays. The business cycle
is divided into months, with each month having either four or five business weeks, with the last week
(or closing week as it is referred to) being the week that contains the last Saturday of the month.
7.3.1.5 Measures and Goals The initial call centre measures and goals were largely based on the objectives and goals of the
project and the design objectives of the initial call centre design. Once the call centre became fully
operational the measures and goals were reviewed and formalised through a performance
management system. Both real time and historical monitoring was implemented.
Some of the most important measures included the following:
• Service level
• Call duration
• Agent utilisation
• Calls per policy
7.3.1.6 Sourcing Options The call centre would be operated by the organisation. This was done because the call centre
performed critical activities in the organisation’s value chain and also processed and produced a large
amount of data that should preferably be handled by the organisation. The organisation also
possessed of the necessary personnel, skills, and infrastructure to operate the call centre in-house.
Some of the technology aspects were partially outsourced, but this is a common practice in call
centres.
Chapter 7 - Case Study Description and Design 95
7.3.1.7 Multi-Site Considerations Initially the call centre was designed and operated as two centres in locations determined by the
business volumes. Because of the planning and management complexities the two centres were
eventually merged in one single location. This eased the management and operations of the call
centre considerably.
7.3.1.8 Budget The budget is an essential part of the design and management of a call centre. However, the financial
and budget aspects of the call centre will not be discussed in this report.
7.3.1.9 Document Business Requirements The business aspects discussed thus far and those that will be discussed in the following chapters
were documented as part of the design, operation, and optimisation processes. The details of this
documentation process will not be discussed in further detail in this report.
7.3.2 Processes The following sections contain the call centre processes aspects.
7.3.2.1 Contact Types and Volumes The types of calls and work items that the call centre will process have already been described in a
previous section. Because this project involved the implementation of a new call centre, no previous
contact data existed. The initial analysis was therefore based on the available business data sources
and information that could be extracted from staff active in the current process. As the implementation
progressed the data generated by the call centre was analysed on a continuous basis.
The Initial contact volume estimates were based on the historical sales figures and were analysed with
the input of key personnel to produce call volume estimates.
7.3.2.2 Contact Routing In the initial design of the call centre all agents would have the same skills and be able to handle all
calls and work items. A basic routing structure was therefore required and designed based on the
technology and system architecture.
7.3.2.3 Contact Processes The contact processes were largely based on the information required from the intermediary and
clients. Scripts were developed to lead the agent and customer through the information capture and
policy enrolment stages.
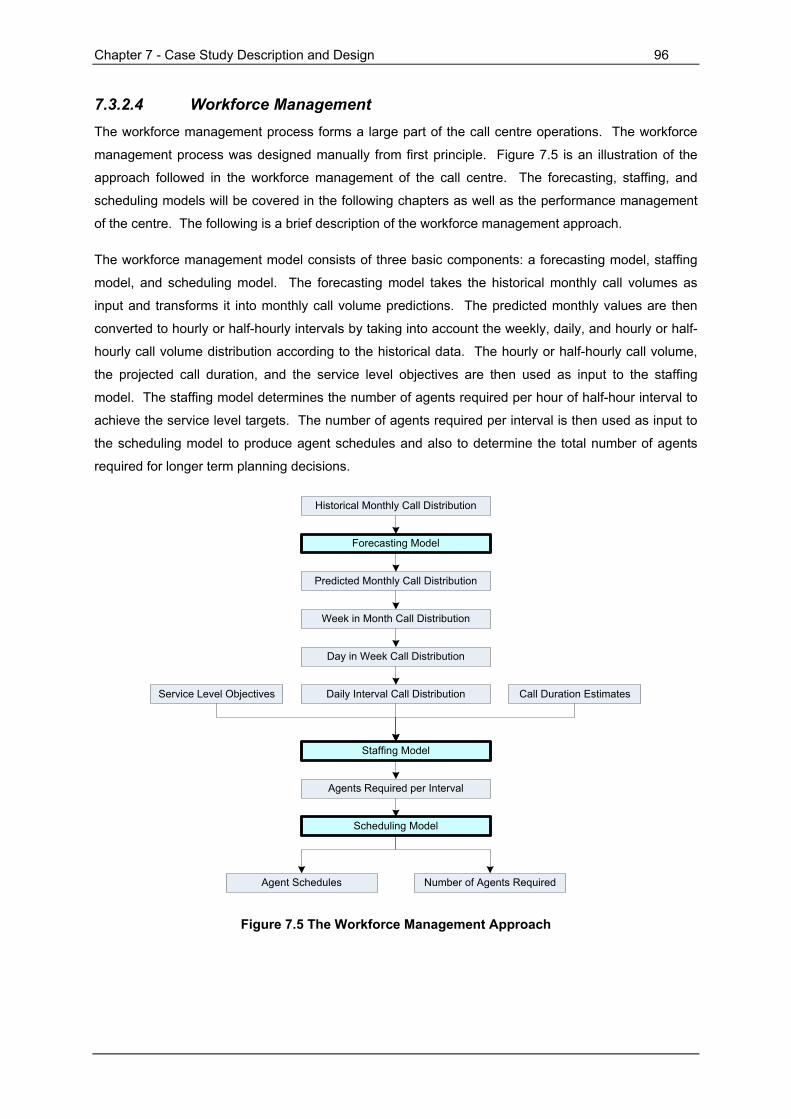
Chapter 7 - Case Study Description and Design 96
7.3.2.4 Workforce Management The workforce management process forms a large part of the call centre operations. The workforce
management process was designed manually from first principle. Figure 7.5 is an illustration of the
approach followed in the workforce management of the call centre. The forecasting, staffing, and
scheduling models will be covered in the following chapters as well as the performance management
of the centre. The following is a brief description of the workforce management approach.
The workforce management model consists of three basic components: a forecasting model, staffing
model, and scheduling model. The forecasting model takes the historical monthly call volumes as
input and transforms it into monthly call volume predictions. The predicted monthly values are then
converted to hourly or half-hourly intervals by taking into account the weekly, daily, and hourly or half-
hourly call volume distribution according to the historical data. The hourly or half-hourly call volume,
the projected call duration, and the service level objectives are then used as input to the staffing
model. The staffing model determines the number of agents required per hour of half-hour interval to
achieve the service level targets. The number of agents required per interval is then used as input to
the scheduling model to produce agent schedules and also to determine the total number of agents
required for longer term planning decisions.
Historical Monthly Call Distribution
Forecasting Model
Predicted Monthly Call Distribution
Week in Month Call Distribution
Day in Week Call Distribution
Daily Interval Call DistributionService Level Objectives Call Duration Estimates
Staffing Model
Agents Required per Interval
Scheduling Model
Agent Schedules Number of Agents Required
Figure 7.5 The Workforce Management Approach

Chapter 7 - Case Study Description and Design 97
7.3.2.5 Staffing Needs The staffing needs are determined through the workforce management process. Various scenarios
were developed in order to determine the effects of the staffing levels, call duration, and service level.
Some of these results are discussed in the following chapters.
7.3.2.6 Productivity and Performance The performance of the call centre was monitored and analysed on regular intervals according to the
goals and performance targets. Real time monitoring of the call queues and agents were used in the
daily operation of the call centre. Daily, weekly, and monthly performance reports were also
generated and communicated to the applicable teams and individuals. The results of these
performance reports were analysed on a continuous basis in order to solve problems and to determine
trends in order to gain insight into the call centre dynamics and optimise the operations.
7.3.2.7 Quality Monitoring A quality monitoring process was designed and implemented as part of the call centre measurements
and eventually the performance management system. The quality monitoring system was often
reviewed and updated as part of the optimisation process. The details of the quality monitoring
process will not be discussed in this research.
7.3.2.8 Contact Centre Policies The development of the call centre policies will not be discussed as part of this research.
7.3.2.9 Continuous Improvement The initial optimisation activities performed during the call centre implementation was eventually
incorporated into the operations and management of the call centre, largely through the performance
management system. It is extremely important that an environment of continuous improvement be
maintained in the call centre.
7.3.2.10 Communications Plan The call centre is reliant on various other departments for reaching its performance goals.
Communications plans were established to enable proper and efficient communication between the
different individuals, groups, and departments. Communication is noted be a problematic area in most
projects and this case was no different. However, when poor communication was the result of a
problem or poor performance, it could usually be tracked and corrected to prevent similar incidents in
the future.
7.3.2.11 Operations Administration & Maintenance (OA&M) Plans The Operations administration and maintenance plans will not be discussed as part of this research.
One aspect however that should be mentioned is the occurrence of system failures. System failures
Chapter 7 - Case Study Description and Design 98
occurred on occasion and in some cases severely influenced the performance of the call centre. The
systems were therefore monitored regularly by the IT department and call centre support staff in order
to minimise the occurrence of these failures and to minimise the effect it has on the call centre
performance.
7.3.2.12 Plan for the Unexpected Business continuity or disaster recovery plans were designed for various scenarios including system
failures, power failures, call volume spikes, etc. These plans will not be discussed as part of this
research.
7.3.3 Technology The technology aspects will not be discussed in detail as it is not at the core of this research. A brief
review of the technology aspects that were addressed in the call centre will be provided.
The technology strategy and architecture development requires the selection and development of the
required technology elements and media. The following are the most important technology aspects
that were addressed.
The organisation has its own dedicated IT department that is capable of conducting and overseeing
the technology aspects. Some systems and applications were already in use in other departments of
the organisation while the other required systems and applications were either purchased or
developed by the organisation.
The following main systems and applications were utilised in the call centre:
• Automatic Call Distributor (ACD) for the toll free line and Interactive Voice Response (IVR)
• Work distribution system to administrate missed calls and policy capturing.
• Call recording software
• Quality monitoring and logging system
• Policy information database
• Management information system (MIS)
• Real time reporting systems and tools
• Telephone sets and workstations
Some of these systems had already been in use in other departments in the organisation and could
therefore be implemented in the call centre with relative ease. These systems were however not
integrated.

Chapter 7 - Case Study Description and Design 99
7.3.4 Human Resources The following sections contain the call centre human resources aspects.
7.3.4.1 Organisational Design The call centre organisational design closely resembles the suggested design depicted in Figure 7.6.
The organisational design and hierarchy proved to be an essential part of the design and operations,
because a level of accountability and traceability was found to be necessary in order to reach and
exceed targets and to continually improve the call centre operations. The roles will be discussed in
the following sections.
Senior Manager
Process Support Manager
Call Centre Manager
Workforce ControllerWorkforce Planner
Team Leader
Quality Assurance Manager Helpdesk
Agent
Quality Assurance Agent
Business Analyst
Figure 7.6 Call Centre Organisational Design
The Senior Manager is responsible for all aspects regarding the call centre and acts as the link to the
organisation and other departments.
The Call Centre Manager is responsible for the basic operations of the call centre in terms of meeting
the performance objectives by effectively and efficiently running the call centre.
The Workforce Planner coordinates the workforce management program and produces the agent
schedules. The key responsibility is to optimise resource utilisation while meeting performance goals.

Chapter 7 - Case Study Description and Design 100
The Workforce Controller is a position that is given to the individual (usually a Team Leader) that is
responsible for the call centre workforce operation during a given interval. This person has to ensure
that enough seats are filled and that agents are answering calls. This position is swapped between
Team Leaders on an interval basis.
The Team Leaders are responsible for a group of approximately ten agents. They provide assistance,
coaching, and guidance to the Agents
The Call Centre Agents handle the calls and capture the policy information supplied by the
intermediaries and clients.
The Process Support Manager is responsible for the support roles and technical and process aspects
of the call centre.
The Quality Assurance Manager is responsible for the quality assurance aspects of the call centre and
manages the Quality Assurance Agents.
The Quality Assurance Agents are responsible for the checking the quality of the Call Centre Agents
information capturing and service delivery.
The Business Analyst works closely with the Process Support Manager and all other roles in the call
centre. The business analysts analyses the operations data and processes in order to identify and
develop improvements. The business analyst also assists in producing performance reports.
The Helpdesk is small centre within the call centre that handles queries related to various aspects
surrounding the call centre activities. It was developed and formalised out of necessity.
7.3.4.2 Recruitment and Hiring The recruitment and hiring aspects will not be discussed as part of this research. The recruitment and
hiring process is however an important aspect because it is one of the most important mechanisms
that can reduce the agent turnover in the call centre by identifying and hiring the correct agents.
7.3.4.3 Training The training aspects will not be discussed in detail for the purposes of this research. A training
program was developed and implemented as part of the call centre operations. Training plays an
important role in the call centre and was occasionally identified as a means to improve the
performance of agents exhibiting poor performance.
7.3.4.4 Performance Management Performance management played an important role in the call centre. Initially an informal
performance management approach was used during the implementation and optimisation phases of
the project. Once the call centre became fully operational, a formal performance management system
Chapter 7 - Case Study Description and Design 101
was developed and tested in a trial run on the Agent level. Improvements in individual and also team
and call centre performance was clearly visible. The development of the performance management
system as well as other measurement aspects will be discussed in Chapter 11.
7.3.5 Facilities The facilities aspects will not be discussed for the purposes of this research.
7.4 Conclusion The modelling approach followed in this chapter was based on the Revised Planning Roadmap
suggested and developed in this study. The initial design aspects and information gathering was
based on the steps in the Planning Roadmap developed by Prosci (2004). The Planning Roadmap
provides a high level structure to guide the design and operations of the call centre. The revised
Planning Roadmap included the workforce management and performance management aspects that
was added and emphasised in this study.
The modelling approach proved to be extremely helpful in the design, operation, and optimisation of
the call centre by providing a structured approach that highlights the interrelationships between the
different aspects involved in the design and operation of a call centre. The structured approach is
helpful in problem identification and solution. By following the structured approach it is also fairly
straightforward to introduce changes in the call centre because all the aspects that should be taken
into consideration and will be influenced can be easily identified.
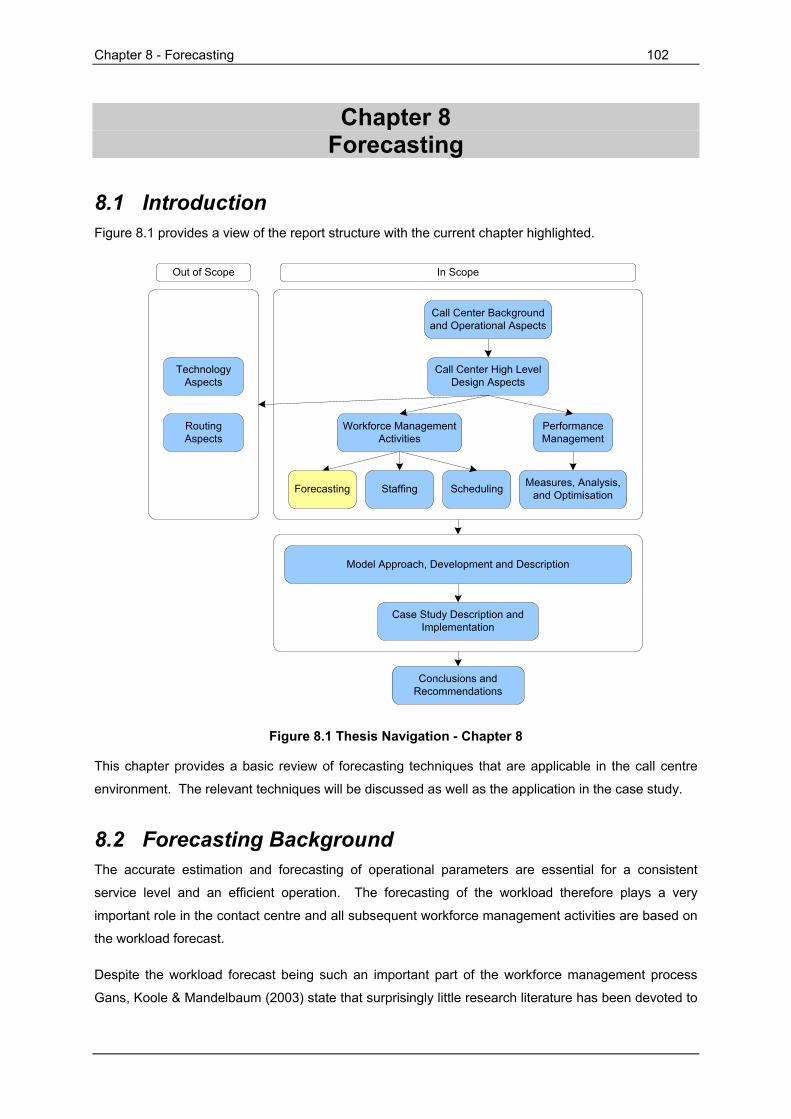
Chapter 8 - Forecasting 102
Chapter 8 Forecasting
8.1 Introduction Figure 8.1 provides a view of the report structure with the current chapter highlighted.
Staffing Scheduling Measures, Analysis, and Optimisation
Call Center High Level Design Aspects
Call Center Background and Operational Aspects
Performance Management
Workforce Management Activities
Forecasting
Case Study Description and Implementation
Conclusions and Recommendations
Model Approach, Development and Description
Technology Aspects
Routing Aspects
Out of Scope In Scope
Figure 8.1 Thesis Navigation - Chapter 8
This chapter provides a basic review of forecasting techniques that are applicable in the call centre
environment. The relevant techniques will be discussed as well as the application in the case study.
8.2 Forecasting Background The accurate estimation and forecasting of operational parameters are essential for a consistent
service level and an efficient operation. The forecasting of the workload therefore plays a very
important role in the contact centre and all subsequent workforce management activities are based on
the workload forecast.
Despite the workload forecast being such an important part of the workforce management process
Gans, Koole & Mandelbaum (2003) state that surprisingly little research literature has been devoted to
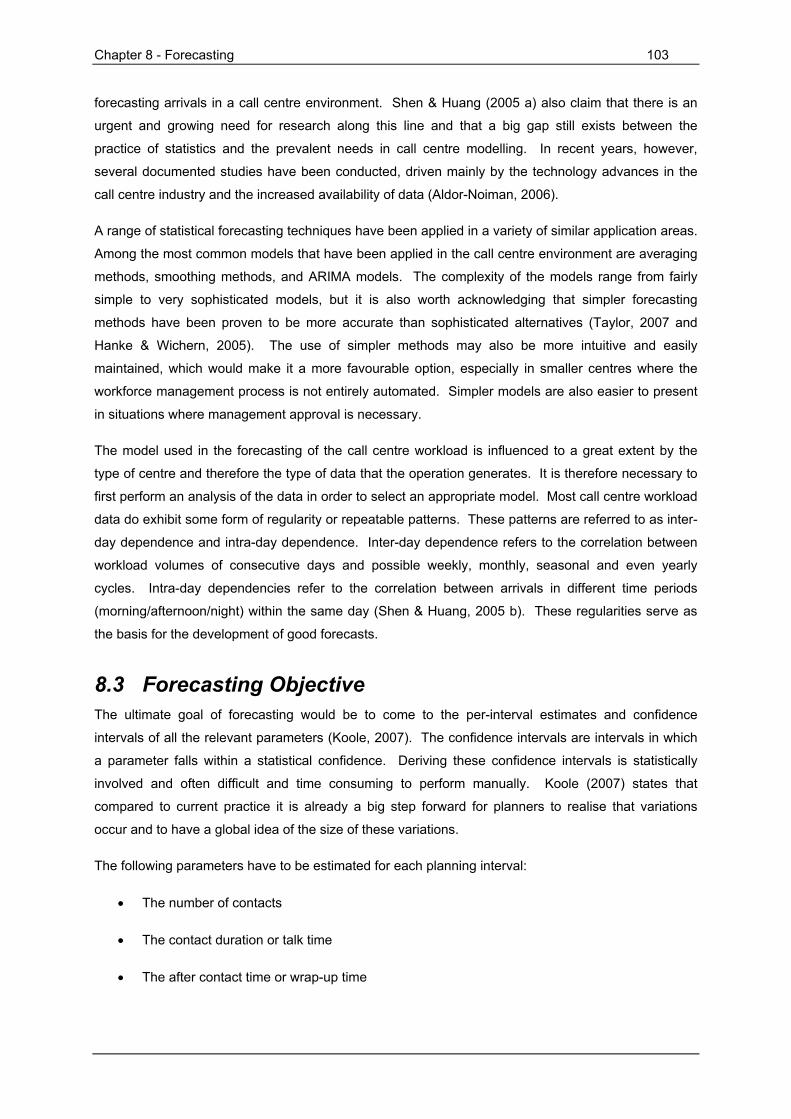
Chapter 8 - Forecasting 103
forecasting arrivals in a call centre environment. Shen & Huang (2005 a) also claim that there is an
urgent and growing need for research along this line and that a big gap still exists between the
practice of statistics and the prevalent needs in call centre modelling. In recent years, however,
several documented studies have been conducted, driven mainly by the technology advances in the
call centre industry and the increased availability of data (Aldor-Noiman, 2006).
A range of statistical forecasting techniques have been applied in a variety of similar application areas.
Among the most common models that have been applied in the call centre environment are averaging
methods, smoothing methods, and ARIMA models. The complexity of the models range from fairly
simple to very sophisticated models, but it is also worth acknowledging that simpler forecasting
methods have been proven to be more accurate than sophisticated alternatives (Taylor, 2007 and
Hanke & Wichern, 2005). The use of simpler methods may also be more intuitive and easily
maintained, which would make it a more favourable option, especially in smaller centres where the
workforce management process is not entirely automated. Simpler models are also easier to present
in situations where management approval is necessary.
The model used in the forecasting of the call centre workload is influenced to a great extent by the
type of centre and therefore the type of data that the operation generates. It is therefore necessary to
first perform an analysis of the data in order to select an appropriate model. Most call centre workload
data do exhibit some form of regularity or repeatable patterns. These patterns are referred to as inter-
day dependence and intra-day dependence. Inter-day dependence refers to the correlation between
workload volumes of consecutive days and possible weekly, monthly, seasonal and even yearly
cycles. Intra-day dependencies refer to the correlation between arrivals in different time periods
(morning/afternoon/night) within the same day (Shen & Huang, 2005 b). These regularities serve as
the basis for the development of good forecasts.
8.3 Forecasting Objective The ultimate goal of forecasting would be to come to the per-interval estimates and confidence
intervals of all the relevant parameters (Koole, 2007). The confidence intervals are intervals in which
a parameter falls within a statistical confidence. Deriving these confidence intervals is statistically
involved and often difficult and time consuming to perform manually. Koole (2007) states that
compared to current practice it is already a big step forward for planners to realise that variations
occur and to have a global idea of the size of these variations.
The following parameters have to be estimated for each planning interval:
• The number of contacts
• The contact duration or talk time
• The after contact time or wrap-up time

Chapter 8 - Forecasting 104
Generally, according to Koole (2007), the number of contacts on an inter-day and intra-day basis has
the highest variation. The talk time and wrap-up time vary as well, but much less than the number of
contacts.
Next to the standard statistics, it might also be useful to estimate the following parameters:
• The pre-contact time (i.e. the time spent in the IVR etc.)
• The number of abandonments
• The patience of callers (i.e. the time they are willing to wait before they abandon)
• The retrial probability (i.e. the probability that after an abandonment the caller will call again)
and the time until they retry.
Beside the standard traffic or workload parameters there are other parameters that should also be of
interest. An important number is the percentage of agents that are absent because of illness or other
reasons and also the typical leave patterns throughout the year. It could also be helpful to measure
variations in the different parameters per agent. Although this is more useful for evaluation and
training purposes, it can be useful in the planning process.
8.4 Forecasting Method The forecasting of the workload is mainly concentrated on predicting the number of contacts in a
specified interval. The process of forecasting involves the study and manipulation of historical data in
order to recognise patterns that can be extrapolated to produce the forecasted workload. This
requires the use of a skillful mix of quantitative forecasting techniques and good judgement according
to Hanke & Wichern (2005). Analysis, judgement, common sense, and business experience must all
be brought together in the process through which forecasting techniques generate their results.
The contact volume often follows a recognisable pattern. These patterns typically depend on the year,
the month of the year, the week of the year, the day of the week, and the time of the day. Typical call
volume data will also contain elements of trend and seasonality. Quantitative forecasting techniques
should therefore be suitable for analysis and forecasting of the workload, typically on a per interval
basis.
The method most often used in forecasting the workload volume is generally known as the top-down
approach (Gans, Koole & Mandelbaum, 2003) as illustrated in Figure 8.2.

Chapter 8 - Forecasting 105
Monthly data
Weekly data
Daily data
Short-time interval data
Forecasting model Monthly data
Weekly data
Daily data
Short-time interval data
Weekly pattern
Daily pattern
Hourly pattern
Historical data Forecasted data
Figure 8.2 The Workload Forecasting Approach
The top-down approach involves summing over all the short-time intervals (typically half-hours) in
each month to give monthly totals. These totals are then used as a basis for forecasting future
monthly totals. The forecasting is done using the appropriate time series method as determined by
the analysis of the data and also by using judgement and experience. The forecasted monthly total is
then decomposed into forecasts for each week within the month, based on the analysis of the
historical data of the proportion of the weekly totals that occur in each month. In a similar way, the
weekly totals are broken down into daily totals, and the daily totals are also decomposed into forecasts
for each short-time interval of the day. Shen & Huang (2005) follow a similar yet more mathematically
involved technique. Taylor (2007) maintains that although the top-down approach lacks in
sophistication and statistical eloquence it does have the appeal of transparency. This is an important
issue because decisions regarding recruitment and scheduling should be based on a clear
understanding of the system parameters and dynamics. And, as mentioned earlier, it has also been
found in empirical research that the forecast accuracy of simple methods is at least as good as that of
complex or statistically sophisticated techniques (Hanke & Wichern, 2005).
8.5 Time Series Method According to Reynolds (2005) there are several approaches to produce the workload forecast, but a
time series analysis is the recommended approach for call centre workload forecasting and serves as
the basis for most automated workforce management forecasting models. The basic assumption is
that the workload is influenced by a variety of factors over time and that each of these factors can be
isolated and used to predict future values.
A time series consists of data that are collected, recorded, or observed over successive increments of
time. This approach usually allows for the identification and isolation of patterns such as trend and
seasonal effects. The trend is the long-term component that represents the growth or decline in the
time series over an extended period of time. The seasonal component is a pattern of change that
repeats itself over a period, typically on a yearly cycle.
Time series can be viewed as a combination of components that are all independent and present at
the same time. It can be seen as though the components are all super-positioned on each other. In

Chapter 8 - Forecasting 106
the forecasting of this type of data the concept of decomposition is used. Decomposition refers to the
separation of the time series into the different components in order to study each component
separately. The final forecast consists of the combination of the forecasts for the separate
components.
Most workforce management systems use a method called exponential smoothing to produce
forecasts, because it can include trend and seasonal components (Klungle, 1997). A suitable
technique according to Klungle (1997) that does include trend and seasonality is Winter’s method (see
Appendix A). This approach is suitable if the time series is relatively stable. It can therefore be used
for longer term forecasting such as monthly and yearly figures. Hanke & Wichern (2005) and Winston
(2004) also propose Winter’s model as a suitable model to analyse data with both trend and
seasonality. Another type of model that is often used in call centres is ARIMA (auto regressive
integrated moving average) models. ARIMA models are however fairly computationally intensive and
will therefore not be considered for this analysis. Winter’s model will be covered and applied to the
data of the case study.
8.6 Other Forecasting Methods The forecasting methodology used in most call centres is based on historical time series analysis. In
certain call centres the contact volume can also be estimated based on other sources of data, such as
the number of customers a company has, or on sales figures. The call volumes estimates can then be
typically computed by multiplying the number of customers by the estimated number of calls a
customer generates. This method can be generalised for multiple channels and can also be used in
the same way to estimate the expected response to advertisement campaigns.
8.7 Forecasting Model in the Case Study The following sections describe the forecasting model that was implemented in the case study and
provide some of the results.
8.7.1 Forecasting Model Description The forecasting model used for the study is similar to the top down approach explained earlier. The
model is illustrated in Figure 8.3. The forecasting method is described below.
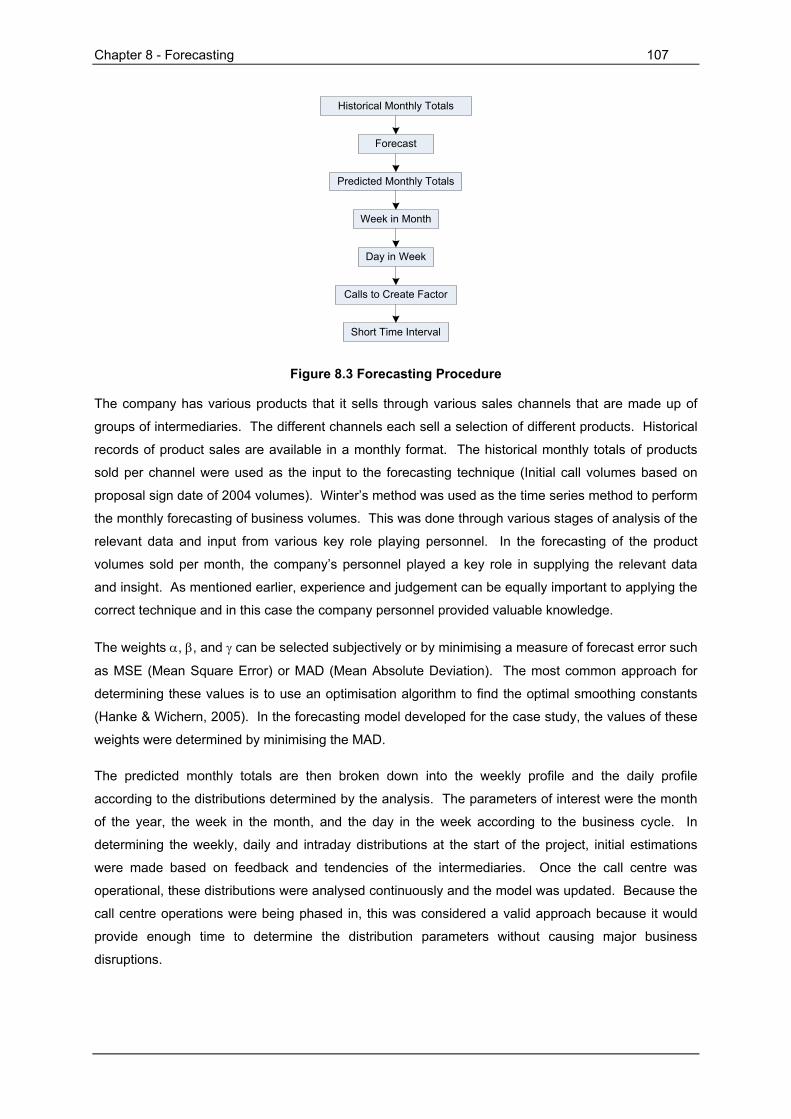
Chapter 8 - Forecasting 107
Historical Monthly Totals
Forecast
Predicted Monthly Totals
Week in Month
Day in Week
Short Time Interval
Calls to Create Factor
Figure 8.3 Forecasting Procedure
The company has various products that it sells through various sales channels that are made up of
groups of intermediaries. The different channels each sell a selection of different products. Historical
records of product sales are available in a monthly format. The historical monthly totals of products
sold per channel were used as the input to the forecasting technique (Initial call volumes based on
proposal sign date of 2004 volumes). Winter’s method was used as the time series method to perform
the monthly forecasting of business volumes. This was done through various stages of analysis of the
relevant data and input from various key role playing personnel. In the forecasting of the product
volumes sold per month, the company’s personnel played a key role in supplying the relevant data
and insight. As mentioned earlier, experience and judgement can be equally important to applying the
correct technique and in this case the company personnel provided valuable knowledge.
The weights α, β, and γ can be selected subjectively or by minimising a measure of forecast error such
as MSE (Mean Square Error) or MAD (Mean Absolute Deviation). The most common approach for
determining these values is to use an optimisation algorithm to find the optimal smoothing constants
(Hanke & Wichern, 2005). In the forecasting model developed for the case study, the values of these
weights were determined by minimising the MAD.
The predicted monthly totals are then broken down into the weekly profile and the daily profile
according to the distributions determined by the analysis. The parameters of interest were the month
of the year, the week in the month, and the day in the week according to the business cycle. In
determining the weekly, daily and intraday distributions at the start of the project, initial estimations
were made based on feedback and tendencies of the intermediaries. Once the call centre was
operational, these distributions were analysed continuously and the model was updated. Because the
call centre operations were being phased in, this was considered a valid approach because it would
provide enough time to determine the distribution parameters without causing major business
disruptions.
Chapter 8 - Forecasting 108
The forecasts up to this point provided the expected number of policies sold in the relevant interval. In
order to relate this value to the number of call arrivals, a ratio of call arrivals to captured policies was
used. This ratio was also estimated initially based on analysis and personnel feedback and was
measured and analysed continuously once the call centre was operational. These results serve as the
input to the staffing model.
At a later stage experimentation was done on using the historical call volumes to produce the monthly
forecasts. This will not be covered formally in this report. Reynolds (2005) claims that at least one,
but preferably two year’s data are required when forecasting call volumes. Because of the initial
project driven roll-out of the call centre, the initial data would not necessarily be accurate enough (in
terms of extracting trends and seasonality effects) to use as a formal forecasting method.
8.7.2 Forecasting Data Analysis and Results The data used in the forecasting process was collected from various sources and systems. This
analysis was performed for the period of September 2005 to May 2007. This period is just after the
initial implementation and up until the centre was running at full load. Because the project required the
design of a new call centre, no prior call data existed. In a situation where there is no existing centre
or no previous contact data exist, Prosci (2004) recommends basing estimates on other sources (see
3.6.2.1). These included
• Groups who are currently handling the process
• Projected customer growth and sales forecasts
• Assumptions about contacts (types, handling time, etc.) and input form the intended
management team
For the initial analysis the product sales data was used in conjunction with input from personnel in
various departments. Once the centre became operational, the data that was generated was
analysed on a continuous basis in order to determine the relevant parameters and used to update the
model. The following are some of the results of the data analysed for the forecasting model.
8.7.2.1 Number of Calls per Month Distribution Figure 8.4 is a plot of the monthly call volume. Although the analysis does not contain enough data to
make definite conclusions, it is apparent that there is a correlation in the distribution of the monthly call
volumes between the different years. Trend and seasonality can be observed and Winter’s method is
therefore a valid forecasting technique. There are four troughs in the distribution at January, April,
September, and December. These months correspond to months with public holidays and school
holidays. The peak months are March, August, and November. The trend observed during 2006
contains the roll out phase of the project and will therefore not represent the normal trend of the call
pattern associated with the normal business cycle. The datasets that did contain two years of monthly
Chapter 8 - Forecasting 109
data (January, February, March, April, May, September, October, November, and December) were
analised and exhibited a clear correlation in the seasonal pattern.
0
5000
10000
15000
20000
25000
30000
35000
Jan Feb Mar Apr May Jun Jul Aug Sep Oct Nov Dec
Num
ber o
f Cal
ls
200720062005
Figure 8.4 Number of Calls per Month
8.7.2.2 Number of Calls per Week Distribution The weekly call volume distribution can be seen in Figure 8.5. Because of the normal business cycle
of the company the call volume would generally increase from the first to the last (closing) week. The
closing weeks are identified by the enlarged markers on the graph. Some months do not exhibit this
trend. Explanations could be found for most of the months that do not exhibit the typical weekly trend.
These months correspond to the months that contain public holidays. The role out of the project was
also not always synchronised with the business cycle and this could also have influenced the results.
Nevertheless, accurate results where still obtained by using the assumption of the business cycle
pattern in conjunction with ongoing observations and analysis.
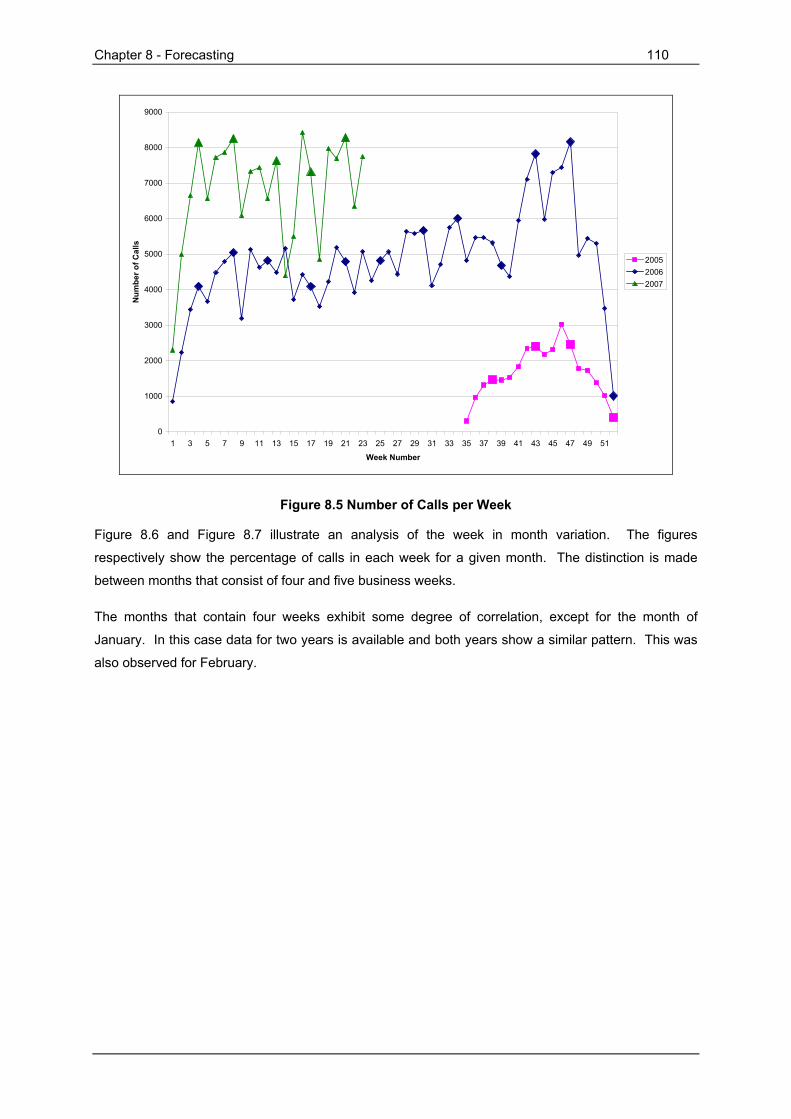
Chapter 8 - Forecasting 110
0
1000
2000
3000
4000
5000
6000
7000
8000
9000
1 3 5 7 9 11 13 15 17 19 21 23 25 27 29 31 33 35 37 39 41 43 45 47 49 51
Week Number
Num
ber o
f Cal
ls
200520062007
Figure 8.5 Number of Calls per Week
Figure 8.6 and Figure 8.7 illustrate an analysis of the week in month variation. The figures
respectively show the percentage of calls in each week for a given month. The distinction is made
between months that consist of four and five business weeks.
The months that contain four weeks exhibit some degree of correlation, except for the month of
January. In this case data for two years is available and both years show a similar pattern. This was
also observed for February.
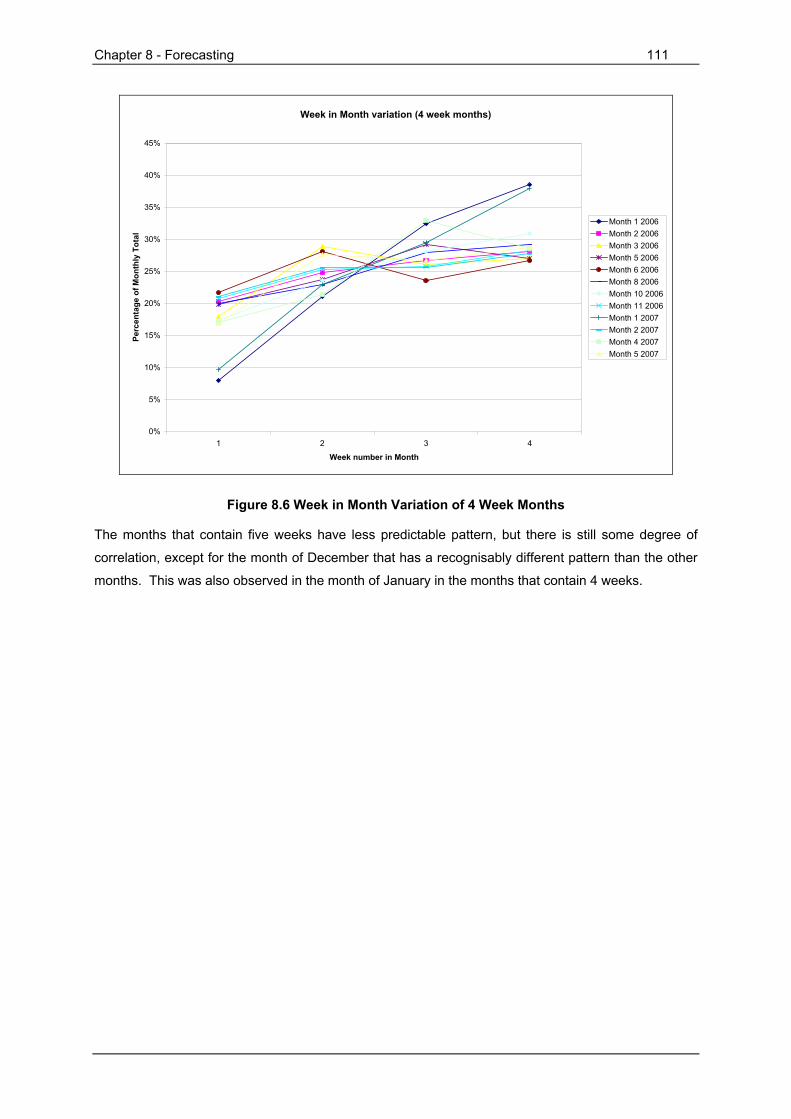
Chapter 8 - Forecasting 111
Week in Month variation (4 week months)
0%
5%
10%
15%
20%
25%
30%
35%
40%
45%
1 2 3 4
Week number in Month
Perc
enta
ge o
f Mon
thly
Tot
al
Month 1 2006Month 2 2006Month 3 2006Month 5 2006Month 6 2006Month 8 2006Month 10 2006Month 11 2006Month 1 2007Month 2 2007Month 4 2007Month 5 2007
Figure 8.6 Week in Month Variation of 4 Week Months
The months that contain five weeks have less predictable pattern, but there is still some degree of
correlation, except for the month of December that has a recognisably different pattern than the other
months. This was also observed in the month of January in the months that contain 4 weeks.
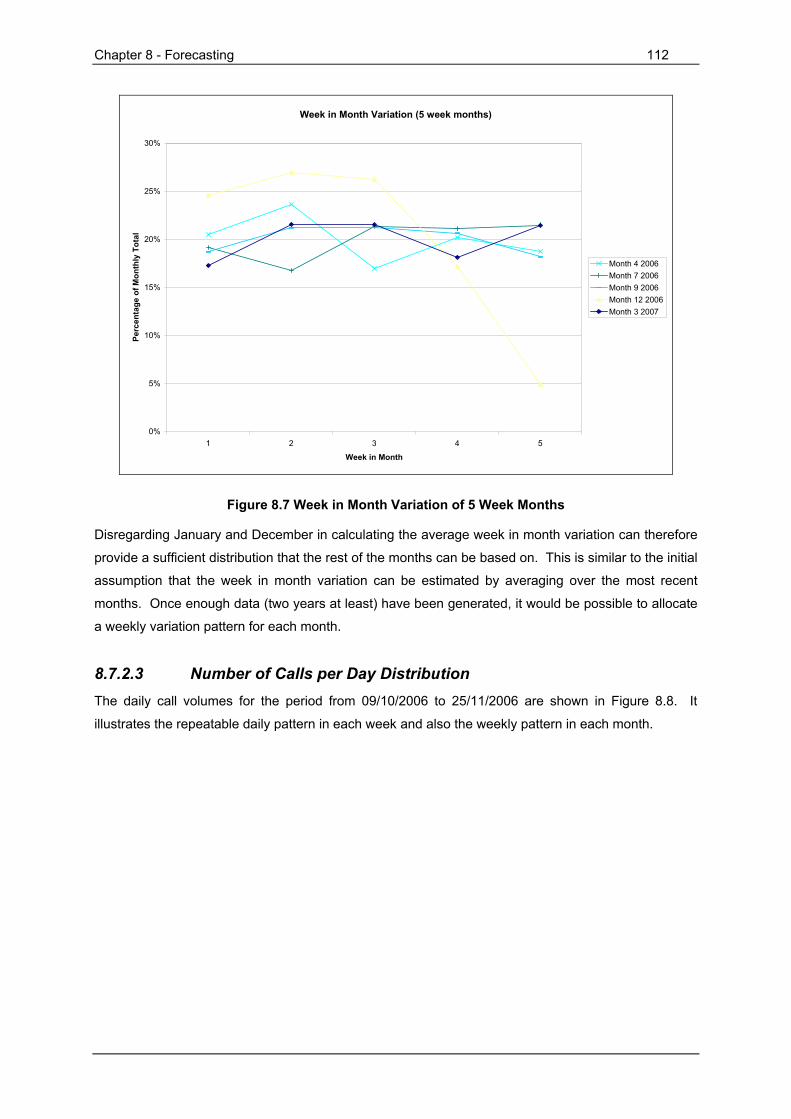
Chapter 8 - Forecasting 112
Week in Month Variation (5 week months)
0%
5%
10%
15%
20%
25%
30%
1 2 3 4 5
Week in Month
Perc
enta
ge o
f Mon
thly
Tot
al
Month 4 2006Month 7 2006Month 9 2006Month 12 2006Month 3 2007
Figure 8.7 Week in Month Variation of 5 Week Months
Disregarding January and December in calculating the average week in month variation can therefore
provide a sufficient distribution that the rest of the months can be based on. This is similar to the initial
assumption that the week in month variation can be estimated by averaging over the most recent
months. Once enough data (two years at least) have been generated, it would be possible to allocate
a weekly variation pattern for each month.
8.7.2.3 Number of Calls per Day Distribution The daily call volumes for the period from 09/10/2006 to 25/11/2006 are shown in Figure 8.8. It
illustrates the repeatable daily pattern in each week and also the weekly pattern in each month.

Chapter 8 - Forecasting 113
Daily call volumes (09/10/2006 - 25/11/2006)
0
200
400
600
800
1000
1200
1400
1600
1800
2000
09/1
0/20
0610
/10/
2006
11/1
0/20
0612
/10/
2006
13/1
0/20
0614
/10/
2006
16/1
0/20
0617
/10/
2006
18/1
0/20
0619
/10/
2006
20/1
0/20
0621
/10/
2006
23/1
0/20
0624
/10/
2006
25/1
0/20
0626
/10/
2006
27/1
0/20
0628
/10/
2006
30/1
0/20
0631
/10/
2006
01/1
1/20
0602
/11/
2006
03/1
1/20
0604
/11/
2006
06/1
1/20
0607
/11/
2006
08/1
1/20
0609
/11/
2006
10/1
1/20
0611
/11/
2006
13/1
1/20
0614
/11/
2006
15/1
1/20
0616
/11/
2006
17/1
1/20
0618
/11/
2006
20/1
1/20
0621
/11/
2006
22/1
1/20
0623
/11/
2006
24/1
1/20
0625
/11/
2006
Num
ber o
f Cal
ls
Figure 8.8 Number of Calls per Day
Figure 8.9 illustrates the daily variation in each of the weeks of the month according to the business
cycle and Figure 8.10 illustrates the total average daily call variation in each week for the specific
period. A correlation in the pattern of daily call volumes in each week can be observed that is
consistently similar to the form plotted in Figure 8.10.
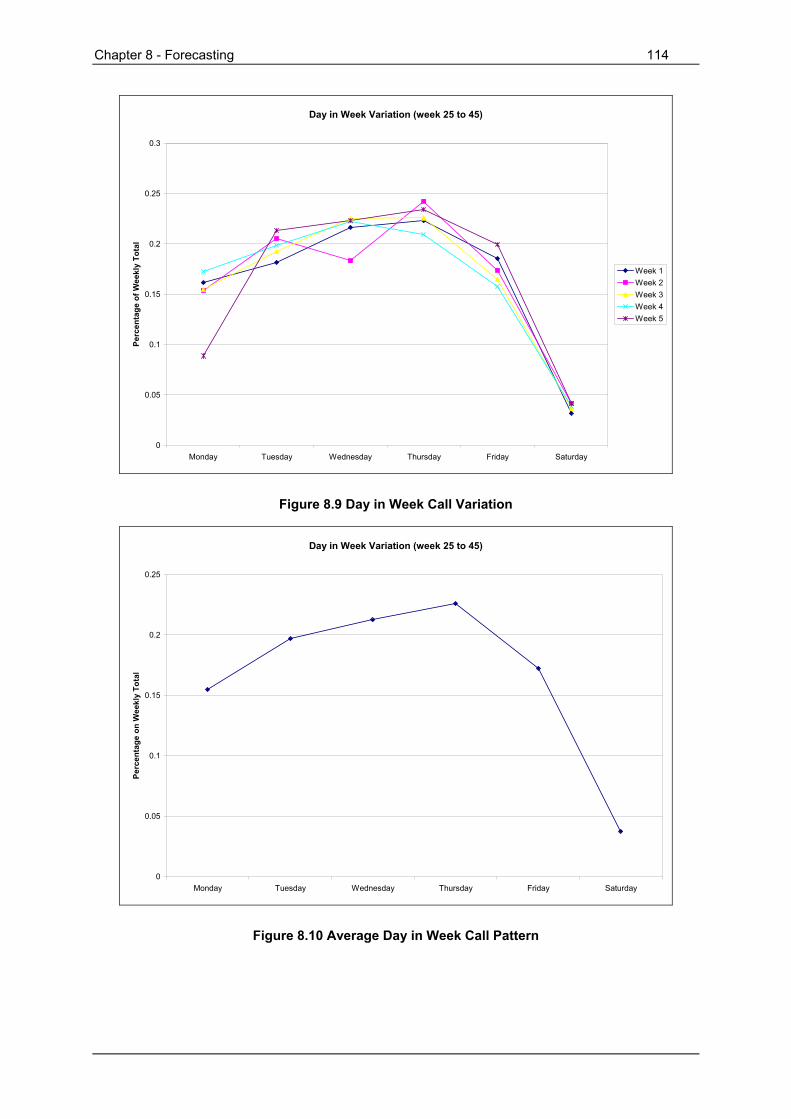
Chapter 8 - Forecasting 114
Day in Week Variation (week 25 to 45)
0
0.05
0.1
0.15
0.2
0.25
0.3
Monday Tuesday Wednesday Thursday Friday Saturday
Perc
enta
ge o
f Wee
kly
Tota
l
Week 1Week 2Week 3Week 4Week 5
Figure 8.9 Day in Week Call Variation
Day in Week Variation (week 25 to 45)
0
0.05
0.1
0.15
0.2
0.25
Monday Tuesday Wednesday Thursday Friday Saturday
Perc
enta
ge o
n W
eekl
y To
tal
Figure 8.10 Average Day in Week Call Pattern
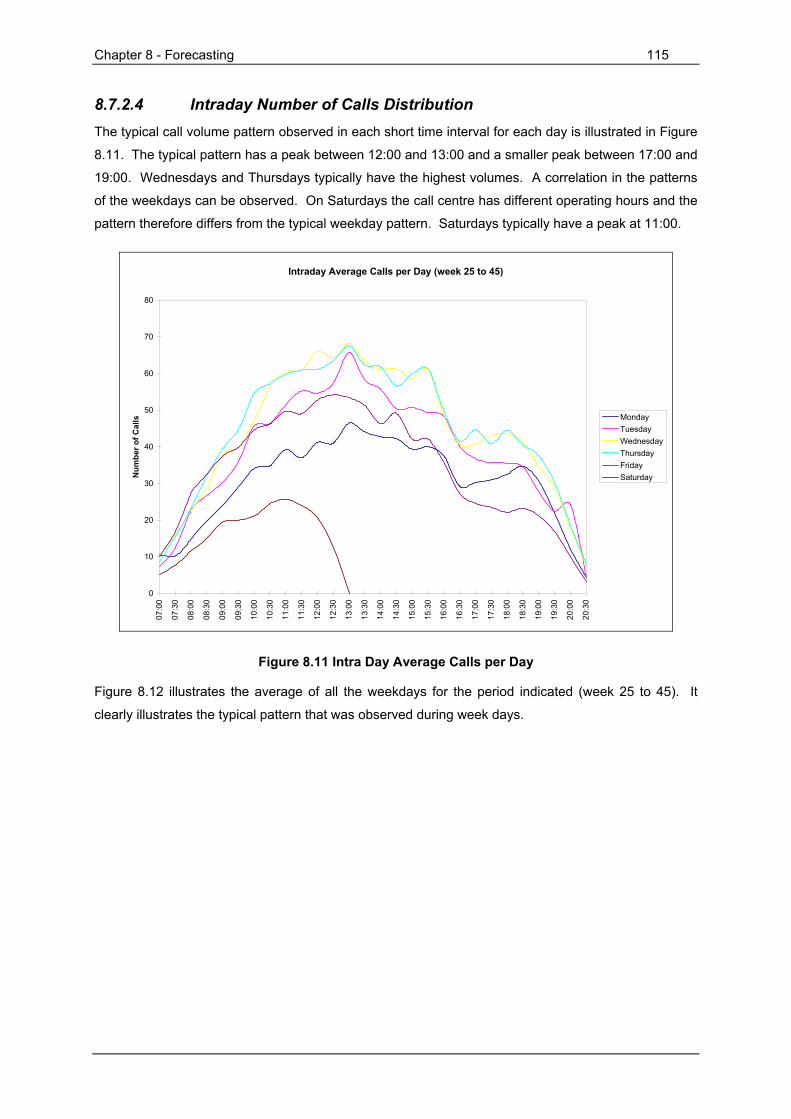
Chapter 8 - Forecasting 115
8.7.2.4 Intraday Number of Calls Distribution The typical call volume pattern observed in each short time interval for each day is illustrated in Figure
8.11. The typical pattern has a peak between 12:00 and 13:00 and a smaller peak between 17:00 and
19:00. Wednesdays and Thursdays typically have the highest volumes. A correlation in the patterns
of the weekdays can be observed. On Saturdays the call centre has different operating hours and the
pattern therefore differs from the typical weekday pattern. Saturdays typically have a peak at 11:00.
Intraday Average Calls per Day (week 25 to 45)
0
10
20
30
40
50
60
70
80
07:0
0
07:3
0
08:0
0
08:3
0
09:0
0
09:3
0
10:0
0
10:3
0
11:0
0
11:3
0
12:0
0
12:3
0
13:0
0
13:3
0
14:0
0
14:3
0
15:0
0
15:3
0
16:0
0
16:3
0
17:0
0
17:3
0
18:0
0
18:3
0
19:0
0
19:3
0
20:0
0
20:3
0
Num
ber o
f Cal
ls MondayTuesdayWednesdayThursdayFridaySaturday
Figure 8.11 Intra Day Average Calls per Day
Figure 8.12 illustrates the average of all the weekdays for the period indicated (week 25 to 45). It
clearly illustrates the typical pattern that was observed during week days.
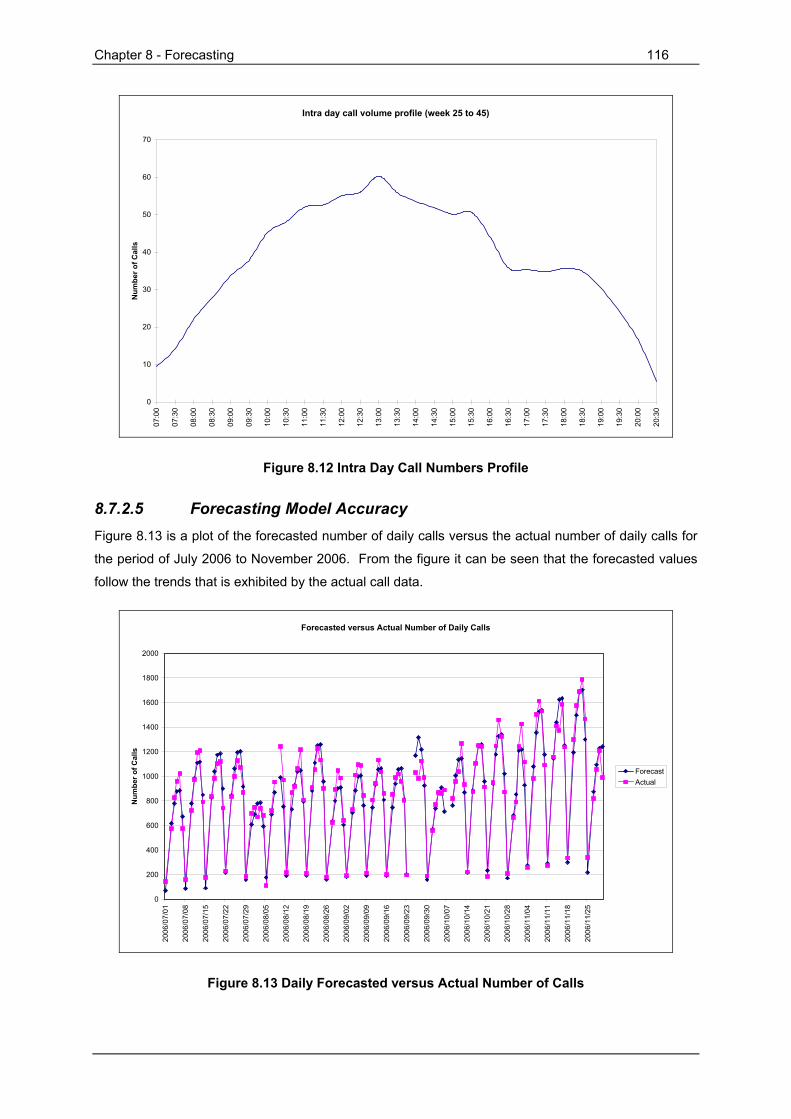
Chapter 8 - Forecasting 116
Intra day call volume profile (week 25 to 45)
0
10
20
30
40
50
60
70
07:0
0
07:3
0
08:0
0
08:3
0
09:0
0
09:3
0
10:0
0
10:3
0
11:0
0
11:3
0
12:0
0
12:3
0
13:0
0
13:3
0
14:0
0
14:3
0
15:0
0
15:3
0
16:0
0
16:3
0
17:0
0
17:3
0
18:0
0
18:3
0
19:0
0
19:3
0
20:0
0
20:3
0
Num
ber o
f Cal
ls
Figure 8.12 Intra Day Call Numbers Profile
8.7.2.5 Forecasting Model Accuracy Figure 8.13 is a plot of the forecasted number of daily calls versus the actual number of daily calls for
the period of July 2006 to November 2006. From the figure it can be seen that the forecasted values
follow the trends that is exhibited by the actual call data.
Forecasted versus Actual Number of Daily Calls
0
200
400
600
800
1000
1200
1400
1600
1800
2000
2006
/07/
01
2006
/07/
08
2006
/07/
15
2006
/07/
22
2006
/07/
29
2006
/08/
05
2006
/08/
12
2006
/08/
19
2006
/08/
26
2006
/09/
02
2006
/09/
09
2006
/09/
16
2006
/09/
23
2006
/09/
30
2006
/10/
07
2006
/10/
14
2006
/10/
21
2006
/10/
28
2006
/11/
04
2006
/11/
11
2006
/11/
18
2006
/11/
25
Num
ber o
f Cal
ls
ForecastActual
Figure 8.13 Daily Forecasted versus Actual Number of Calls
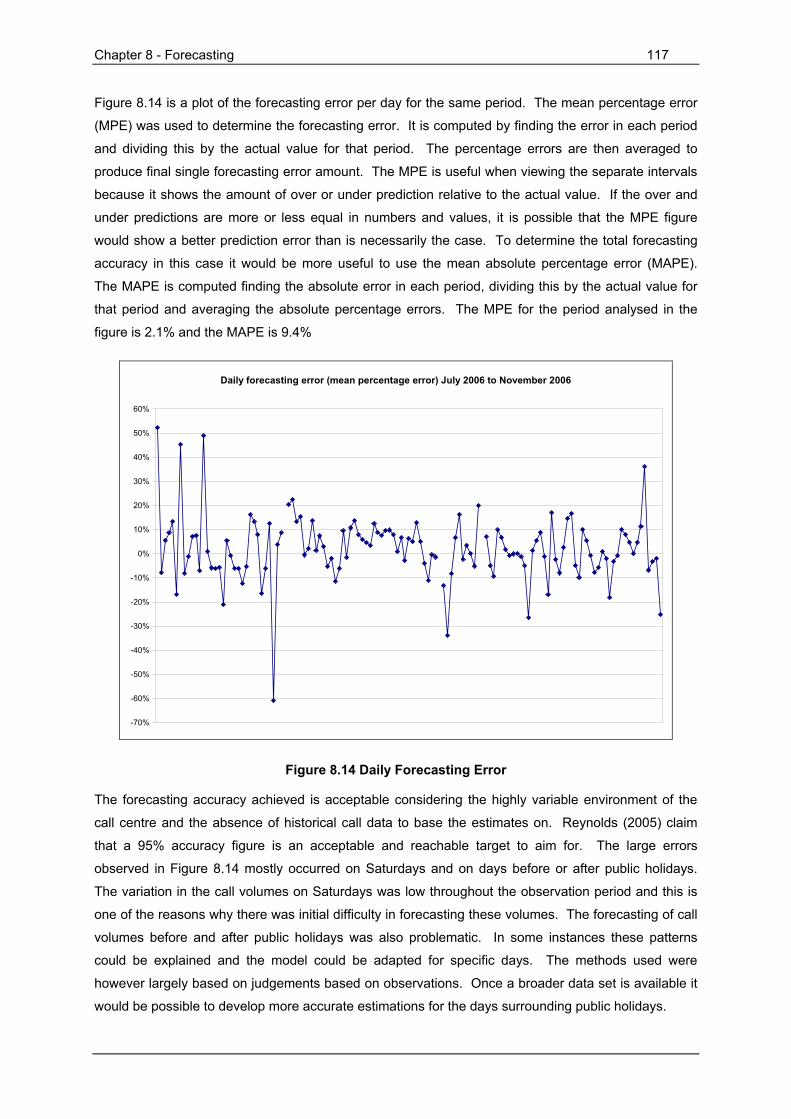
Chapter 8 - Forecasting 117
Figure 8.14 is a plot of the forecasting error per day for the same period. The mean percentage error
(MPE) was used to determine the forecasting error. It is computed by finding the error in each period
and dividing this by the actual value for that period. The percentage errors are then averaged to
produce final single forecasting error amount. The MPE is useful when viewing the separate intervals
because it shows the amount of over or under prediction relative to the actual value. If the over and
under predictions are more or less equal in numbers and values, it is possible that the MPE figure
would show a better prediction error than is necessarily the case. To determine the total forecasting
accuracy in this case it would be more useful to use the mean absolute percentage error (MAPE).
The MAPE is computed finding the absolute error in each period, dividing this by the actual value for
that period and averaging the absolute percentage errors. The MPE for the period analysed in the
figure is 2.1% and the MAPE is 9.4%
Daily forecasting error (mean percentage error) July 2006 to November 2006
-70%
-60%
-50%
-40%
-30%
-20%
-10%
0%
10%
20%
30%
40%
50%
60%
Figure 8.14 Daily Forecasting Error
The forecasting accuracy achieved is acceptable considering the highly variable environment of the
call centre and the absence of historical call data to base the estimates on. Reynolds (2005) claim
that a 95% accuracy figure is an acceptable and reachable target to aim for. The large errors
observed in Figure 8.14 mostly occurred on Saturdays and on days before or after public holidays.
The variation in the call volumes on Saturdays was low throughout the observation period and this is
one of the reasons why there was initial difficulty in forecasting these volumes. The forecasting of call
volumes before and after public holidays was also problematic. In some instances these patterns
could be explained and the model could be adapted for specific days. The methods used were
however largely based on judgements based on observations. Once a broader data set is available it
would be possible to develop more accurate estimations for the days surrounding public holidays.

Chapter 8 - Forecasting 118
8.8 Conclusion An acceptable forecasting accuracy was achieved by using the top down approach in conjunction with
Winter’s method. The initial estimates of parameters were made from analysis of current business
practices and historical production data. The input from key personnel was of great value in
developing the initial forecasting model. The continuous analysis of data generated by the call centre
was used to optimise the forecasting model throughout the implementation process. The analysis
showed clear trends and patterns that could by utilised in the planning of operations. Once enough
valid data can be collected and the forecasting methodology can be refined, an even more accurate
workload forecast should be possible. The structured analysis and optimisation approach proved to
be successful in an environment that was at times highly unpredictable.
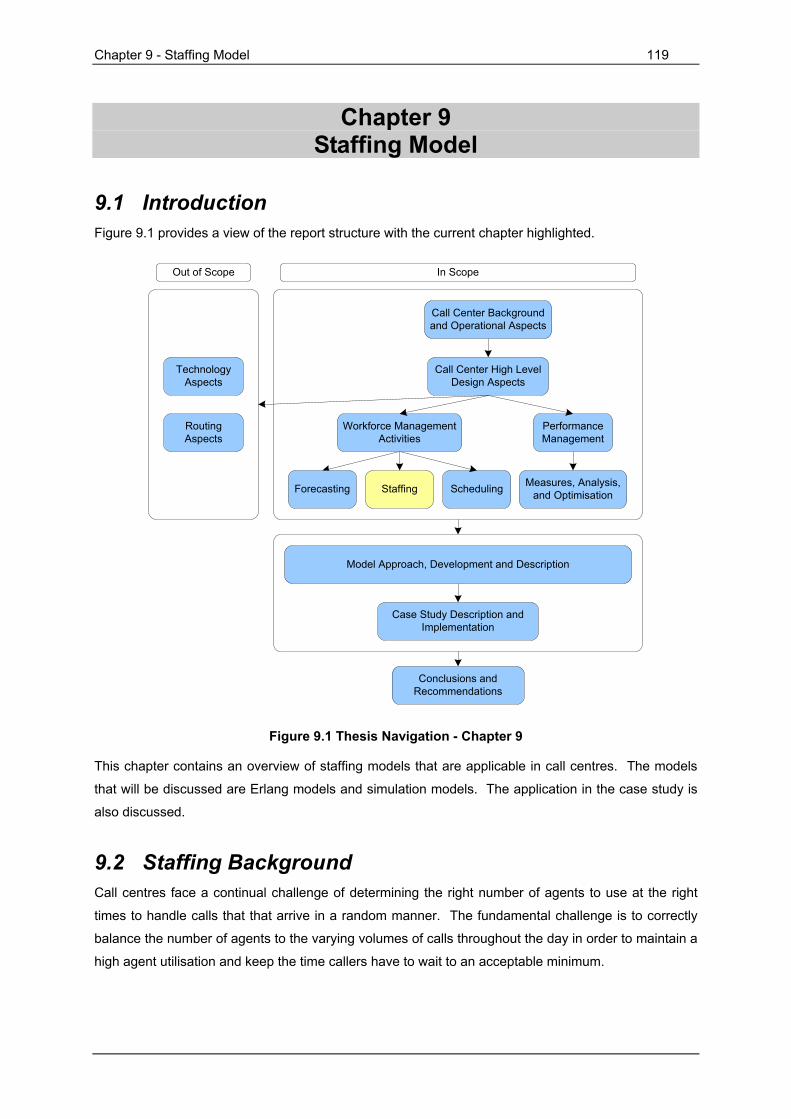
Chapter 9 - Staffing Model 119
Chapter 9 Staffing Model
9.1 Introduction Figure 9.1 provides a view of the report structure with the current chapter highlighted.
Staffing Scheduling Measures, Analysis, and Optimisation
Call Center High Level Design Aspects
Call Center Background and Operational Aspects
Performance Management
Workforce Management Activities
Forecasting
Case Study Description and Implementation
Conclusions and Recommendations
Model Approach, Development and Description
Technology Aspects
Routing Aspects
Out of Scope In Scope
Figure 9.1 Thesis Navigation - Chapter 9
This chapter contains an overview of staffing models that are applicable in call centres. The models
that will be discussed are Erlang models and simulation models. The application in the case study is
also discussed.
9.2 Staffing Background Call centres face a continual challenge of determining the right number of agents to use at the right
times to handle calls that that arrive in a random manner. The fundamental challenge is to correctly
balance the number of agents to the varying volumes of calls throughout the day in order to maintain a
high agent utilisation and keep the time callers have to wait to an acceptable minimum.
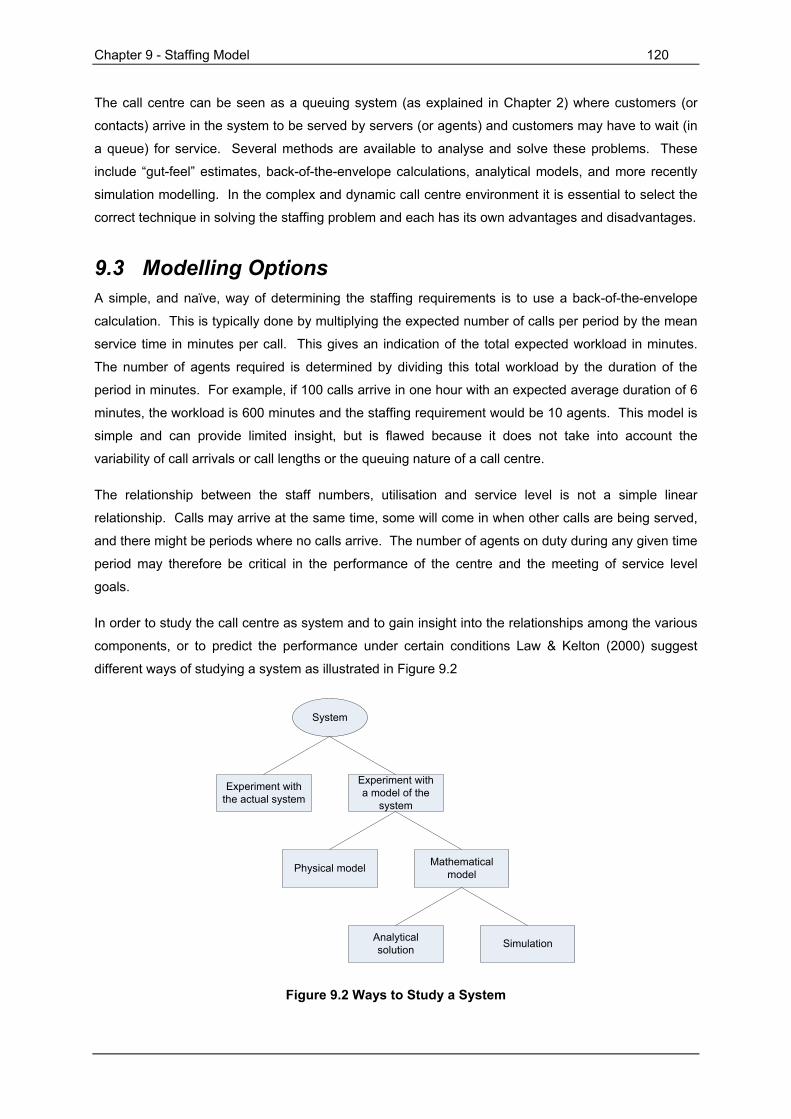
Chapter 9 - Staffing Model 120
The call centre can be seen as a queuing system (as explained in Chapter 2) where customers (or
contacts) arrive in the system to be served by servers (or agents) and customers may have to wait (in
a queue) for service. Several methods are available to analyse and solve these problems. These
include “gut-feel” estimates, back-of-the-envelope calculations, analytical models, and more recently
simulation modelling. In the complex and dynamic call centre environment it is essential to select the
correct technique in solving the staffing problem and each has its own advantages and disadvantages.
9.3 Modelling Options A simple, and naïve, way of determining the staffing requirements is to use a back-of-the-envelope
calculation. This is typically done by multiplying the expected number of calls per period by the mean
service time in minutes per call. This gives an indication of the total expected workload in minutes.
The number of agents required is determined by dividing this total workload by the duration of the
period in minutes. For example, if 100 calls arrive in one hour with an expected average duration of 6
minutes, the workload is 600 minutes and the staffing requirement would be 10 agents. This model is
simple and can provide limited insight, but is flawed because it does not take into account the
variability of call arrivals or call lengths or the queuing nature of a call centre.
The relationship between the staff numbers, utilisation and service level is not a simple linear
relationship. Calls may arrive at the same time, some will come in when other calls are being served,
and there might be periods where no calls arrive. The number of agents on duty during any given time
period may therefore be critical in the performance of the centre and the meeting of service level
goals.
In order to study the call centre as system and to gain insight into the relationships among the various
components, or to predict the performance under certain conditions Law & Kelton (2000) suggest
different ways of studying a system as illustrated in Figure 9.2
System
Experiment with the actual system
Experiment with a model of the
system
Mathematical modelPhysical model
SimulationAnalytical solution
Figure 9.2 Ways to Study a System

Chapter 9 - Staffing Model 121
From the figure and based on the typical distribution of the arrival of the workload, the typical
distribution, the service time, and the queuing nature of contact centres, Harris (2007) and Aksin,
Armony & Mehrotra (2007) also come to the conclusion that there are basically two mathematical
methods that can be used to solve the staffing problem and optimise call centre performance. These
are:
• Analytical models
• Simulation models
These are both mathematical models that can be viewed as an abstraction of a real system in which
mathematical expressions are used to describe the relationships between elements of the system for
analysis purposes (Hoover & Perry, 1989).
There is no clear cut answer of whether to use analytical or simulation models. If the problem can be
solved by applying analytic methods of mathematics, then it is called an analytic model. If the problem
can only be solved by numerical analysis methods, then it is called a simulation model. It is seldom
the case that there will be a clear choice between modelling a system with an analytic or simulation
model. The advantages and disadvantages of each method have to be considered before an
informed choice can be made. It some cases it can often be that insight is obtained by using both
types of models, with each model giving different perspectives of the system being modelled.
9.4 Analytical Models Analytical models are used to describe a real life situation in mathematical terms. The relationships
between the elements of the system are expressed through mathematical equations which are used to
determine the properties of the system. When constructing the equations of the analytical model,
simplifications and assumptions are often made about the system which may limit the application of
the model to more general cases. Analytical models are expressed in terms of the parameters of the
system, in order to make it possible to examine how changes in the parameters change the systems
properties.
Analytical models have the advantage that it is usually concise in the description of the problem,
usually has a closed form solution, and it is easy to evaluate the impact of changes in inputs on output
measures. On the other hand the assumptions regarding the system description may be unrealistic
and mathematical formulations may be overly complex. These models are often difficult to build or
understand without considerable mathematical skills. It can therefore lack credibility in the eyes of
decision makers who do not fully understand the basis of the model and the mathematics that support
it. There are however many well documented mathematical models that have been applied in a
variety of environments (Hoover & Perry, 1989).
Models such as these can take into account the variability of the arriving workload and service
duration. The most commonly used queuing models take call volumes, handling times, and the

Chapter 9 - Staffing Model 122
number of agents as inputs and determine the waiting time distribution or service grade and the
average waiting time. There are several models available and determining the staffing requirements
of call centres has traditionally been based on Erlang calculations. Many of today’s workforce
management tools still use Erlang models to represent system variability. There are a range of Erlang
formulae including Erlang B, Erlang C and Engset. Erlang models and variants are most often used to
determine how many agents are needed in a time interval to meet a specific service level. Models
such as the Erlang models are usually based on a number of simplifying assumptions. Many of these
assumptions may not be valid in the modern call centre environment. Yet, according to Anton, Bapat
& Hall, (1999), many companies still base complex staffing decisions on Erlang calculations. Because
of the assumptions involved in Erlang models it also results in limited analysis when taken into the
context of modern call centre requirements (Mehrotra, Profozich & Bapat, 1997) and can therefore be
restrictive and sometimes incapable of analysing more detailed business questions faced by call
centre analysts and managers (Anton, Bapat & Hall, 1999).
The inadequacies of the Erlang equations coupled with the fact that up to 70% of costs are associated
with staffing and human resources can potentially have enormous effects on the overall performance
of a call centre when used as a generic staffing tool. Even though the Erlang formulas do have certain
shortcomings and might not produce 100% accurate service level predictions, Reynolds (2003) claim
that it is still a very reliable and adequate analytical model to use in a simple queuing scenario. The
most widely used model, namely the Erlang C model will be discussed in the next section.
9.5 Erlang Models - Erlang C The Erlang C formula describes the behaviour of a queuing system that accepts traffic to a specified
number of servers or agents. If all the servers are busy when a request arrives, the request is
queued. The formula calculates the probability of traffic offered queuing, assuming that no calls are
blocked or abandons while in the system. It is usually used to determine the number of agents
needed to staff a call centre for a specified service level.
Erlang C is the most commonly used mathematical formula in call centres. It is mainly used as an
analysis tool to calculate service level, waiting times, and the number of agents required based on the
number of service requests or arrivals, the service duration, and the number of servers (agents).
Erlang C is widely used in workforce management software programs, as well as low-cost call centre
staffing calculators. In a survey of most workforce management systems and tools Klungle (1997)
found that most use the Erlang C model for staffing problems. The Erlang C model is based on the
M/M/N queuing model. Like most mathematical models it contains simplifications and therefore the
quality of results will depend on how closely the assumptions behind Erlang C match the situation.
The Erlang C model is subject to a few assumptions which are as follows:
• Service requests follow a Poisson arrival process
• Service times are exponentially distributed
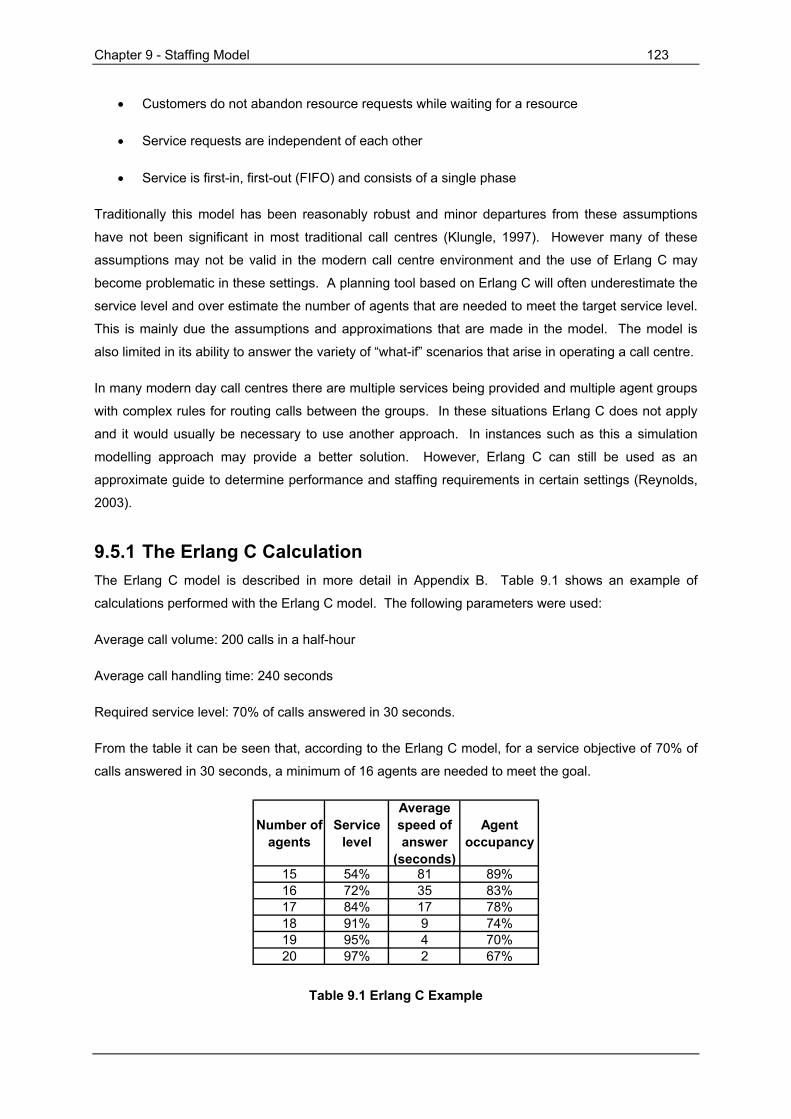
Chapter 9 - Staffing Model 123
• Customers do not abandon resource requests while waiting for a resource
• Service requests are independent of each other
• Service is first-in, first-out (FIFO) and consists of a single phase
Traditionally this model has been reasonably robust and minor departures from these assumptions
have not been significant in most traditional call centres (Klungle, 1997). However many of these
assumptions may not be valid in the modern call centre environment and the use of Erlang C may
become problematic in these settings. A planning tool based on Erlang C will often underestimate the
service level and over estimate the number of agents that are needed to meet the target service level.
This is mainly due the assumptions and approximations that are made in the model. The model is
also limited in its ability to answer the variety of “what-if” scenarios that arise in operating a call centre.
In many modern day call centres there are multiple services being provided and multiple agent groups
with complex rules for routing calls between the groups. In these situations Erlang C does not apply
and it would usually be necessary to use another approach. In instances such as this a simulation
modelling approach may provide a better solution. However, Erlang C can still be used as an
approximate guide to determine performance and staffing requirements in certain settings (Reynolds,
2003).
9.5.1 The Erlang C Calculation The Erlang C model is described in more detail in Appendix B. Table 9.1 shows an example of
calculations performed with the Erlang C model. The following parameters were used:
Average call volume: 200 calls in a half-hour
Average call handling time: 240 seconds
Required service level: 70% of calls answered in 30 seconds.
From the table it can be seen that, according to the Erlang C model, for a service objective of 70% of
calls answered in 30 seconds, a minimum of 16 agents are needed to meet the goal.
Number of agents
Service level
Average speed of answer
(seconds)
Agent occupancy
15 54% 81 89%16 72% 35 83%17 84% 17 78%18 91% 9 74%19 95% 4 70%20 97% 2 67%
Table 9.1 Erlang C Example
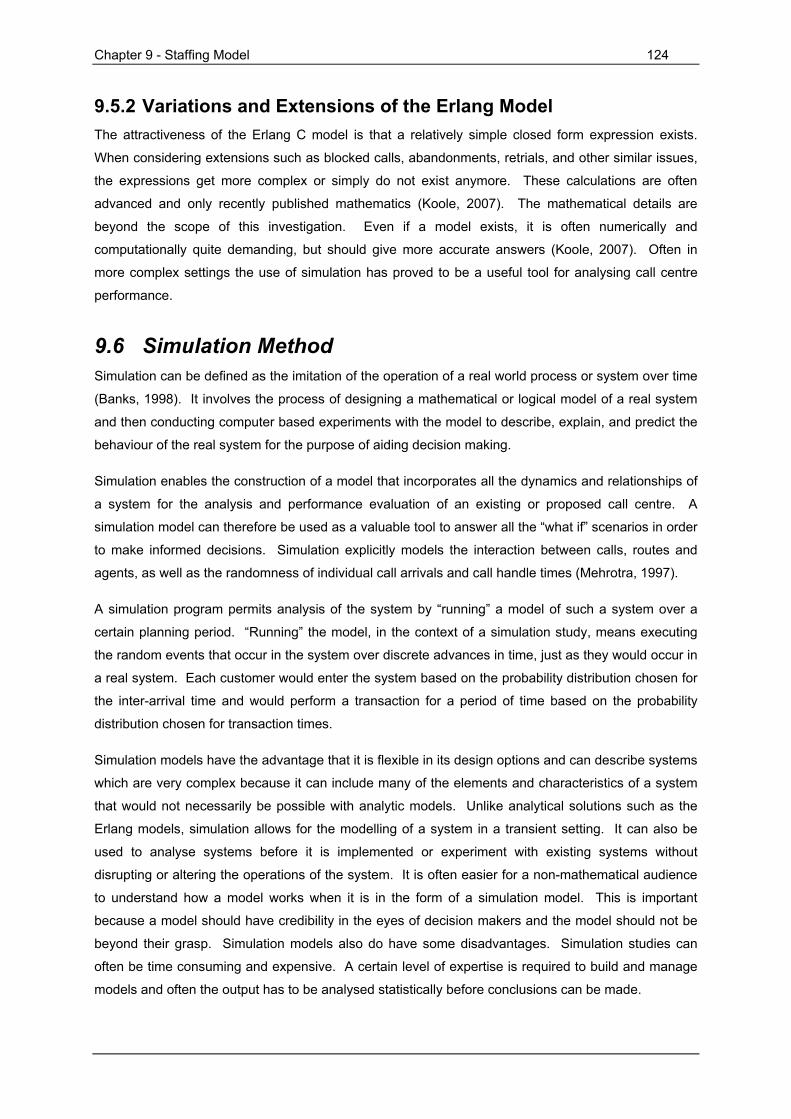
Chapter 9 - Staffing Model 124
9.5.2 Variations and Extensions of the Erlang Model The attractiveness of the Erlang C model is that a relatively simple closed form expression exists.
When considering extensions such as blocked calls, abandonments, retrials, and other similar issues,
the expressions get more complex or simply do not exist anymore. These calculations are often
advanced and only recently published mathematics (Koole, 2007). The mathematical details are
beyond the scope of this investigation. Even if a model exists, it is often numerically and
computationally quite demanding, but should give more accurate answers (Koole, 2007). Often in
more complex settings the use of simulation has proved to be a useful tool for analysing call centre
performance.
9.6 Simulation Method Simulation can be defined as the imitation of the operation of a real world process or system over time
(Banks, 1998). It involves the process of designing a mathematical or logical model of a real system
and then conducting computer based experiments with the model to describe, explain, and predict the
behaviour of the real system for the purpose of aiding decision making.
Simulation enables the construction of a model that incorporates all the dynamics and relationships of
a system for the analysis and performance evaluation of an existing or proposed call centre. A
simulation model can therefore be used as a valuable tool to answer all the “what if” scenarios in order
to make informed decisions. Simulation explicitly models the interaction between calls, routes and
agents, as well as the randomness of individual call arrivals and call handle times (Mehrotra, 1997).
A simulation program permits analysis of the system by “running” a model of such a system over a
certain planning period. “Running” the model, in the context of a simulation study, means executing
the random events that occur in the system over discrete advances in time, just as they would occur in
a real system. Each customer would enter the system based on the probability distribution chosen for
the inter-arrival time and would perform a transaction for a period of time based on the probability
distribution chosen for transaction times.
Simulation models have the advantage that it is flexible in its design options and can describe systems
which are very complex because it can include many of the elements and characteristics of a system
that would not necessarily be possible with analytic models. Unlike analytical solutions such as the
Erlang models, simulation allows for the modelling of a system in a transient setting. It can also be
used to analyse systems before it is implemented or experiment with existing systems without
disrupting or altering the operations of the system. It is often easier for a non-mathematical audience
to understand how a model works when it is in the form of a simulation model. This is important
because a model should have credibility in the eyes of decision makers and the model should not be
beyond their grasp. Simulation models also do have some disadvantages. Simulation studies can
often be time consuming and expensive. A certain level of expertise is required to build and manage
models and often the output has to be analysed statistically before conclusions can be made.
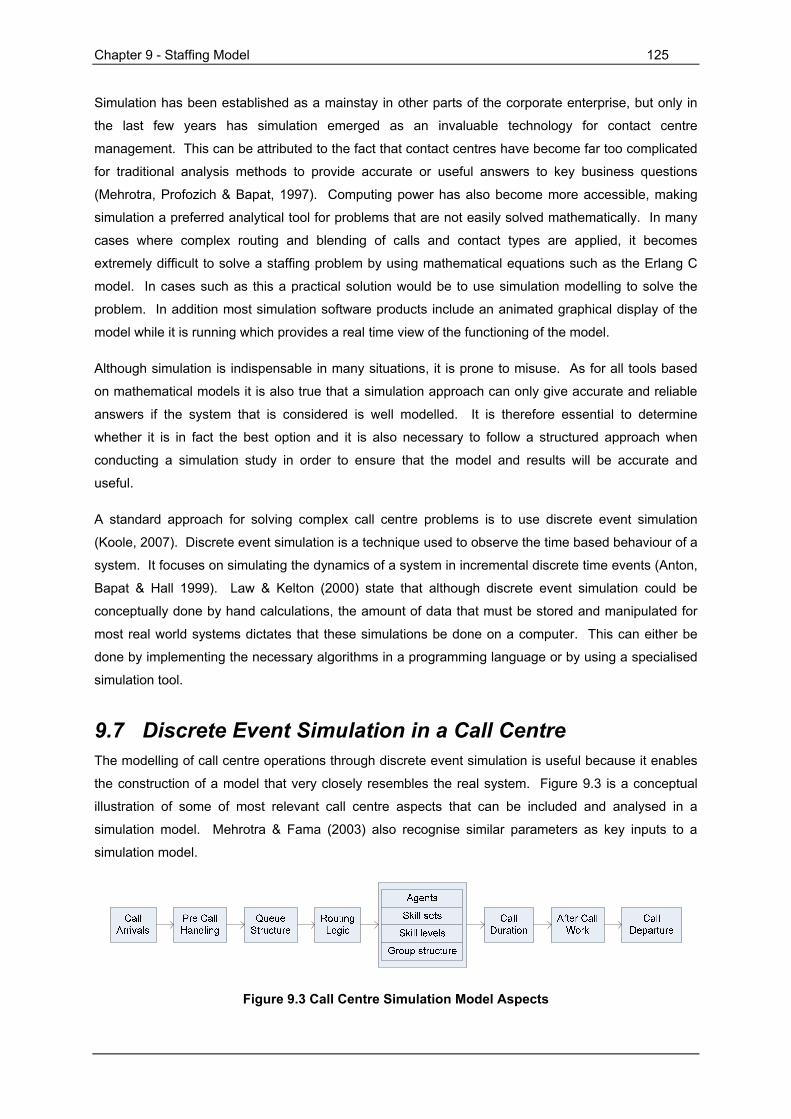
Chapter 9 - Staffing Model 125
Simulation has been established as a mainstay in other parts of the corporate enterprise, but only in
the last few years has simulation emerged as an invaluable technology for contact centre
management. This can be attributed to the fact that contact centres have become far too complicated
for traditional analysis methods to provide accurate or useful answers to key business questions
(Mehrotra, Profozich & Bapat, 1997). Computing power has also become more accessible, making
simulation a preferred analytical tool for problems that are not easily solved mathematically. In many
cases where complex routing and blending of calls and contact types are applied, it becomes
extremely difficult to solve a staffing problem by using mathematical equations such as the Erlang C
model. In cases such as this a practical solution would be to use simulation modelling to solve the
problem. In addition most simulation software products include an animated graphical display of the
model while it is running which provides a real time view of the functioning of the model.
Although simulation is indispensable in many situations, it is prone to misuse. As for all tools based
on mathematical models it is also true that a simulation approach can only give accurate and reliable
answers if the system that is considered is well modelled. It is therefore essential to determine
whether it is in fact the best option and it is also necessary to follow a structured approach when
conducting a simulation study in order to ensure that the model and results will be accurate and
useful.
A standard approach for solving complex call centre problems is to use discrete event simulation
(Koole, 2007). Discrete event simulation is a technique used to observe the time based behaviour of a
system. It focuses on simulating the dynamics of a system in incremental discrete time events (Anton,
Bapat & Hall 1999). Law & Kelton (2000) state that although discrete event simulation could be
conceptually done by hand calculations, the amount of data that must be stored and manipulated for
most real world systems dictates that these simulations be done on a computer. This can either be
done by implementing the necessary algorithms in a programming language or by using a specialised
simulation tool.
9.7 Discrete Event Simulation in a Call Centre The modelling of call centre operations through discrete event simulation is useful because it enables
the construction of a model that very closely resembles the real system. Figure 9.3 is a conceptual
illustration of some of most relevant call centre aspects that can be included and analysed in a
simulation model. Mehrotra & Fama (2003) also recognise similar parameters as key inputs to a
simulation model.
Figure 9.3 Call Centre Simulation Model Aspects
Chapter 9 - Staffing Model 126
The typical data associated with a call centre simulation model includes:
• Call volumes and types
• Call routing information
• Agent related data
• Service times
When the model is executed, calls arrive according to a particular distribution selected for the arrival
process. These calls are then routed to the appropriate queues and agents and receive service as
defined by the design of the call centre. Throughout the simulation run data is collected of the
parameters of interest. Various levels of detail and complexity can be included in the model as it is
required from the objective of the simulation study. The data collected by the model can then be
analysed to gain insight into the operations and to aid in the decision making process.
9.8 Staffing Model Case Study Because the project involved the design of a new call centre a simulation approach was chosen to
model the call centre operations in terms of the staffing problem. Simulation modelling is useful
because it can accurately model the call centre architecture in the required level of detail. This
provides a great advantage when designing and optimising a call centre because various scenarios
can be evaluated in an experimental environment.
The following sections describe the simulation model that was developed for the staffing problem. The
model was used to determine the required number of workstations and agents as well as the number
of agents required in each time interval of the day to maintain an acceptable service level.
The results obtained from the analysis would be used for:
• Designing the call centre infrastructure in terms of the number of stations required
• Determining the required number of agents to be recruited, trained, and deployed
• Coordinating all the relevant activities to ensure the workload can be handled and the proper
operation of the call centre
9.8.1 Staffing Model Description The simulation model developed for the case study can be conceptually illustrated as shown in Figure
9.4. The model will be described in the following sections.
Calls are created according to a particular statistical distribution. This distribution is determined
through the analysis of the inter arrival times of calls. The operating time of the centre is divided into
equal intervals (usually similar to that of the forecasting output) and the forecasted calls for that period
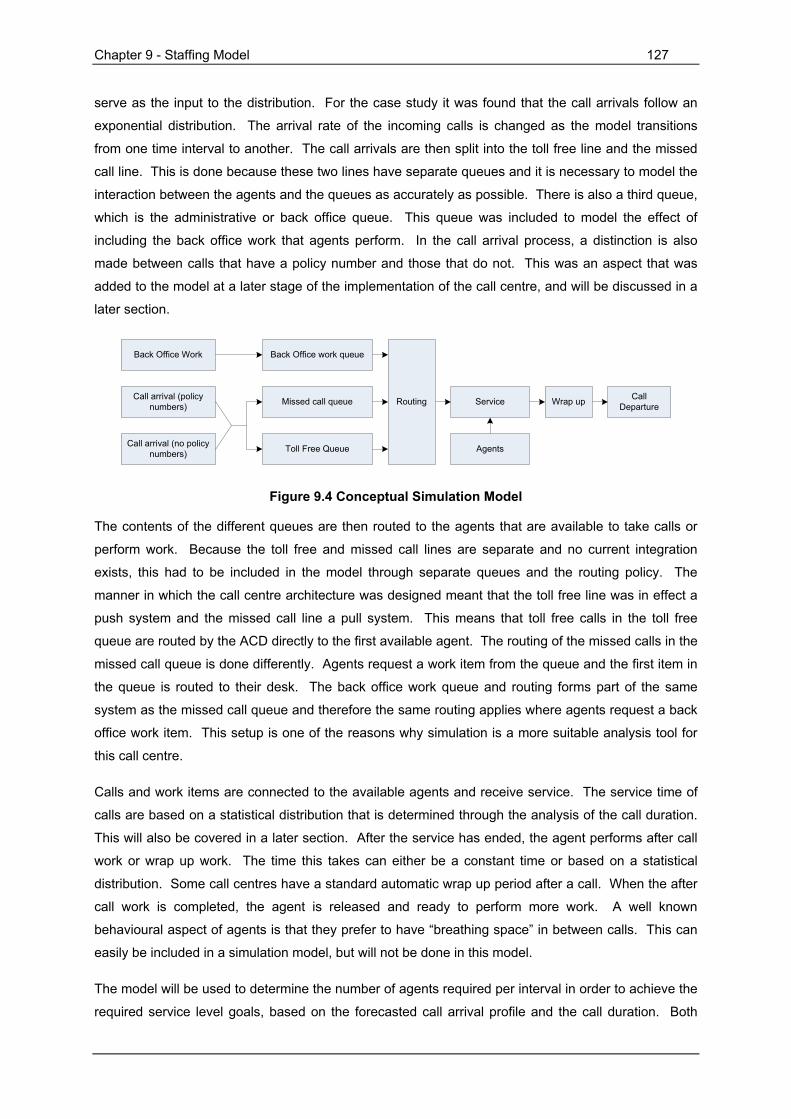
Chapter 9 - Staffing Model 127
serve as the input to the distribution. For the case study it was found that the call arrivals follow an
exponential distribution. The arrival rate of the incoming calls is changed as the model transitions
from one time interval to another. The call arrivals are then split into the toll free line and the missed
call line. This is done because these two lines have separate queues and it is necessary to model the
interaction between the agents and the queues as accurately as possible. There is also a third queue,
which is the administrative or back office queue. This queue was included to model the effect of
including the back office work that agents perform. In the call arrival process, a distinction is also
made between calls that have a policy number and those that do not. This was an aspect that was
added to the model at a later stage of the implementation of the call centre, and will be discussed in a
later section.
Call arrival (policy numbers) Missed call queue
Toll Free Queue
Back Office work queue
Service
Back Office Work
Call arrival (no policy numbers)
Wrap up Call Departure
Agents
Routing
Figure 9.4 Conceptual Simulation Model
The contents of the different queues are then routed to the agents that are available to take calls or
perform work. Because the toll free and missed call lines are separate and no current integration
exists, this had to be included in the model through separate queues and the routing policy. The
manner in which the call centre architecture was designed meant that the toll free line was in effect a
push system and the missed call line a pull system. This means that toll free calls in the toll free
queue are routed by the ACD directly to the first available agent. The routing of the missed calls in the
missed call queue is done differently. Agents request a work item from the queue and the first item in
the queue is routed to their desk. The back office work queue and routing forms part of the same
system as the missed call queue and therefore the same routing applies where agents request a back
office work item. This setup is one of the reasons why simulation is a more suitable analysis tool for
this call centre.
Calls and work items are connected to the available agents and receive service. The service time of
calls are based on a statistical distribution that is determined through the analysis of the call duration.
This will also be covered in a later section. After the service has ended, the agent performs after call
work or wrap up work. The time this takes can either be a constant time or based on a statistical
distribution. Some call centres have a standard automatic wrap up period after a call. When the after
call work is completed, the agent is released and ready to perform more work. A well known
behavioural aspect of agents is that they prefer to have “breathing space” in between calls. This can
easily be included in a simulation model, but will not be done in this model.
The model will be used to determine the number of agents required per interval in order to achieve the
required service level goals, based on the forecasted call arrival profile and the call duration. Both
Chapter 9 - Staffing Model 128
long term (resource acquisition) and short term (resource deployment) problems can be addressed
with the simulation model. Other analysis and scenarios can also be performed and will be mentioned
briefly in a later section.
Throughout the implementation process of the call centre the simulation model was designed and
changed as the need arouse and new needs were discovered. The modelling approach discussed in
Chapter 6 in the context of the optimisation process was used to refine the model in order to reflect an
accurate representation of the real call centre operations.
9.8.2 Staffing Model Assumptions and Simplifications The following aspects are some of the characteristics, assumptions and simplifications of the
simulation model.
• No lost calls due to busy signals on arrival at queue, or call abandonment while in queue
• No infrastructure or telephony failures or breakdowns are modelled
• The IVR is not modelled
• A distinction is made between different channels and where necessary the pre and post call
activities are included
• All agents are assumed to have the same skills and skill level
The following parameters are measured to draw conclusions and evaluate different scenarios:
• Service level per interval indicated by the percentage of calls answered within a certain time.
• Average waiting time before a call is answered per time block.
• Average number of calls completed on a day
• Occupancy rate or utilisation level for agents (75%-80% no peak and 90% peak times)
9.8.3 Staffing Model Data Analysis The following sections describe the analysis of the most important parameters of the staffing
simulation model.
9.8.3.1 Call Arrivals Service requests or call arrivals at a call centre are generally assumed to be randomly distributed and
independent of each other. In the call centre environment (as in many other environments) the call
arrival pattern can generally be expressed as a Poisson process. The use of a Poisson arrival
process is a very common assumption and is used in for example traffic engineering. Anton, Bapat &
Chapter 9 - Staffing Model 129
Hall (1999) also remark that the distributions used for most inter arrival times are typically exponential
distributions that use the mean as the key defining parameter.
The analysis of the inter arrival times of the call centre data showed that the inter arrival times follow
an exponential distribution. As stated earlier, this is commonly found in call centres. The initial
assumption that the call arrivals follow a Poisson process (exponentially distributed inter arrival times)
was therefore valid. The input to the staffing model is then taken as an exponential inter arrival time
distribution with a mean value equal to forecasted call volume value per time interval produced by the
forecasting model.
A whole day will be simulated as one replication in the simulation model. The arrival process therefore
has to incorporate the intra day arrival patterns. The thinning method proposed by (Law & Kelton,
2000) that is based on the method proposed by Lewis & Shedler (1979) was used to generate the
varying call arrival rate for each half hour interval. The method is briefly described in the next
paragraph.
A general and simple method proposed by Lewis & Shedler (1979), known as thinning, can be used to
generate daily call arrivals. Law & Kelton (2000) present a special case of the thinning algorithm that
works when λ* = max{λ(t)} is finite. A stationary Poisson process with constant rate λ* and arrival
times {ti*} is generated, and then the ti*’s are “thinned out” by throwing away (rejecting) each ti* as an
arrival with probability 1-λ(ti*)/λ*. Thus, ti* is more likely to be accepted as an arrival if λ(ti*) is high,
yielding the desired property that arrivals will occur more frequently in intervals for which λ(t) is high.
9.8.3.2 Service Duration The service or call duration in a call centre is generally assumed to follow an exponential distribution.
The service times analysed in the case study showed a fit to a lognormal distribution. Service times
that have a lognormal distribution have been occasionally recognised by researchers in the call centre
environment (Brown et al., 2005). In the case of a lognormal distribution the use of simulation instead
of a model such as Erlang C is an attractive option.
Figure 9.5 shows an example of on analysis performed on a complete data set (calls with policy
numbers and calls without policy numbers) for a month. A statistical analysis package was used to
analyse the data in Figure 9.5 and to determine the fitted distribution. In this case the fitted distribution
was found to be lognormal(6.14, 7.82) with a square error of 0.001196 and a chi-square test was also
performed with a corresponding p-value of less than 0.005. Other analysis showed similar results.
The input to the staffing model is therefore taken as a lognormal distribution with parameters
determined from the results of a specific analysis.

Chapter 9 - Staffing Model 130
Figure 9.5 Call Duration Distribution Analysis Result
As mentioned in an earlier section, two types of calls are included in the simulation analysis. These
include calls with policy numbers and calls without policy numbers. After the initial implementation of
the call centre some irregularities were noticed in the analysis of the call duration data. Because the
call centre is used to capture policies, each call is linked to a policy number. It was found that a large
number of calls are not linked to policy numbers. One of the reasons for this was found to be that
intermediaries occasionally contact the centre with queries. Currently this is incorrect practice
because there are other dedicated channels available were these types of enquiries can be handled.
Typically these calls have very short call durations, and therefore skew the distribution if included in
the call duration analysis. For the purposes of this analysis these calls were therefore modelled
separately in the simulation model. This was done in order to point out the fact that this is an aspect
that needs to be tracked and eliminated because it can increase costs considerably and it can
negatively affect the performance of the call centre. In the current strategic objective of the centre
handling of these queries by the call centre is not considered a value adding activity.
Another feature in the analysis of the calls with policy numbers is the presence of a large number of
short call durations. The same feature was also discovered in a similar study by Brown et al. (2005).
These short call durations were assumed to be mainly due to agents who prematurely disconnect from
the customer without completing service. In the study it is remarked that this is a behavioural feature
of service agents that have been recognised on several other occasions. An investigation revealed
that some of the short calls in the case study could be associated with this feature – both calls with
policy numbers and calls without policy numbers. These calls were also excluded from the data set
used to determine the call duration distribution but was still tracked on a regular basis because it is an
aspect that needs to be corrected.
9.8.3.3 Other Aspects Various other aspects were also studied and analysed in the context of the staffing model but will not
be discussed further. These include wrap up times and other typical aspects. The methodology
followed and the results obtained were typically the same as the analysis discussed in the previous
sections.
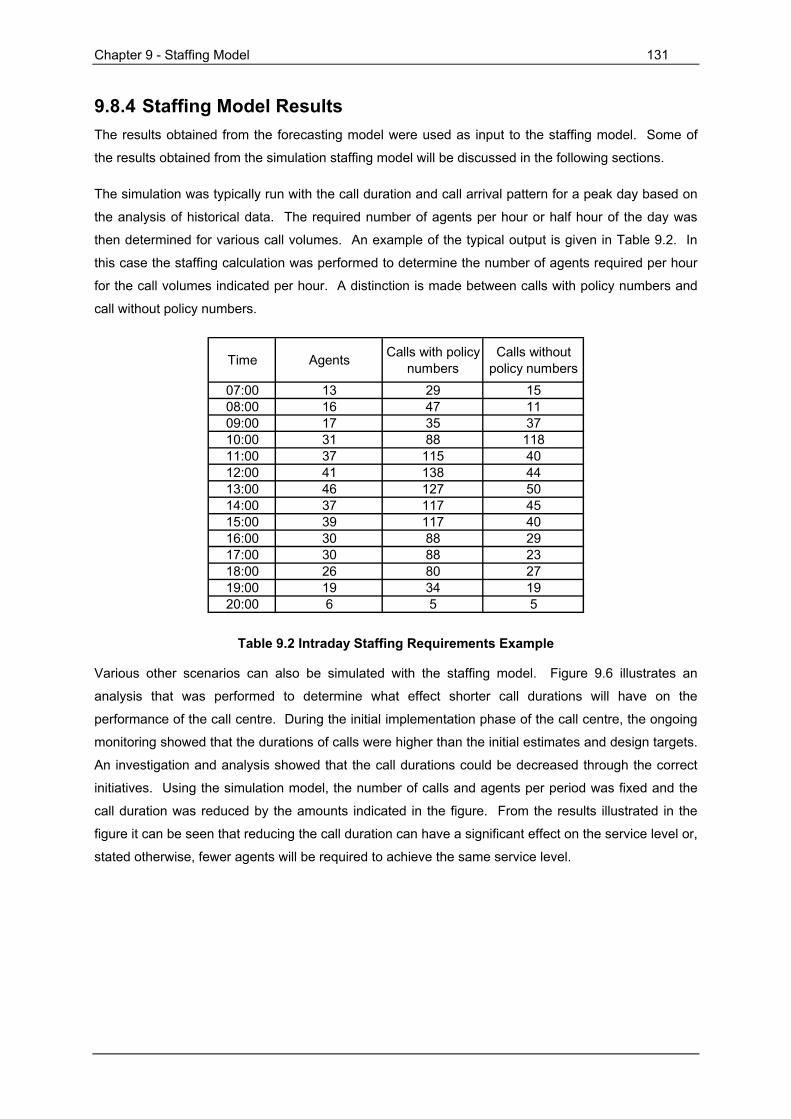
Chapter 9 - Staffing Model 131
9.8.4 Staffing Model Results The results obtained from the forecasting model were used as input to the staffing model. Some of
the results obtained from the simulation staffing model will be discussed in the following sections.
The simulation was typically run with the call duration and call arrival pattern for a peak day based on
the analysis of historical data. The required number of agents per hour or half hour of the day was
then determined for various call volumes. An example of the typical output is given in Table 9.2. In
this case the staffing calculation was performed to determine the number of agents required per hour
for the call volumes indicated per hour. A distinction is made between calls with policy numbers and
call without policy numbers.
Time Agents Calls with policy numbers
Calls without policy numbers
07:00 13 29 1508:00 16 47 1109:00 17 35 3710:00 31 88 11811:00 37 115 4012:00 41 138 4413:00 46 127 5014:00 37 117 4515:00 39 117 4016:00 30 88 2917:00 30 88 2318:00 26 80 2719:00 19 34 1920:00 6 5 5
Table 9.2 Intraday Staffing Requirements Example
Various other scenarios can also be simulated with the staffing model. Figure 9.6 illustrates an
analysis that was performed to determine what effect shorter call durations will have on the
performance of the call centre. During the initial implementation phase of the call centre, the ongoing
monitoring showed that the durations of calls were higher than the initial estimates and design targets.
An investigation and analysis showed that the call durations could be decreased through the correct
initiatives. Using the simulation model, the number of calls and agents per period was fixed and the
call duration was reduced by the amounts indicated in the figure. From the results illustrated in the
figure it can be seen that reducing the call duration can have a significant effect on the service level or,
stated otherwise, fewer agents will be required to achieve the same service level.

Chapter 9 - Staffing Model 132
Service Level with Reduced Call Durations
70.00
80.00
90.00
100.00
110.00
1 2 3 4 5 6 7 8 9 10
Minutes
Serv
ice
Leve
l
Reduce 5%Reduce 10%Reduce 15%No Reduction
Figure 9.6 Improved Call Duration Analysis
Figure 9.7 illustrates an analysis performed to determine the effect that the unproductive calls have on
the performance of the call centre. The unproductive calls include calls without policy numbers and
calls with policy numbers that have very short durations, therefore all the unfavourable calls that do
not produce results or add any value). The number of normal calls and the number of agents was
fixed and the unproductive calls were reduced by the numbers indicated. The figure illustrates that
improvements can be realised by eliminating the unproductive calls.
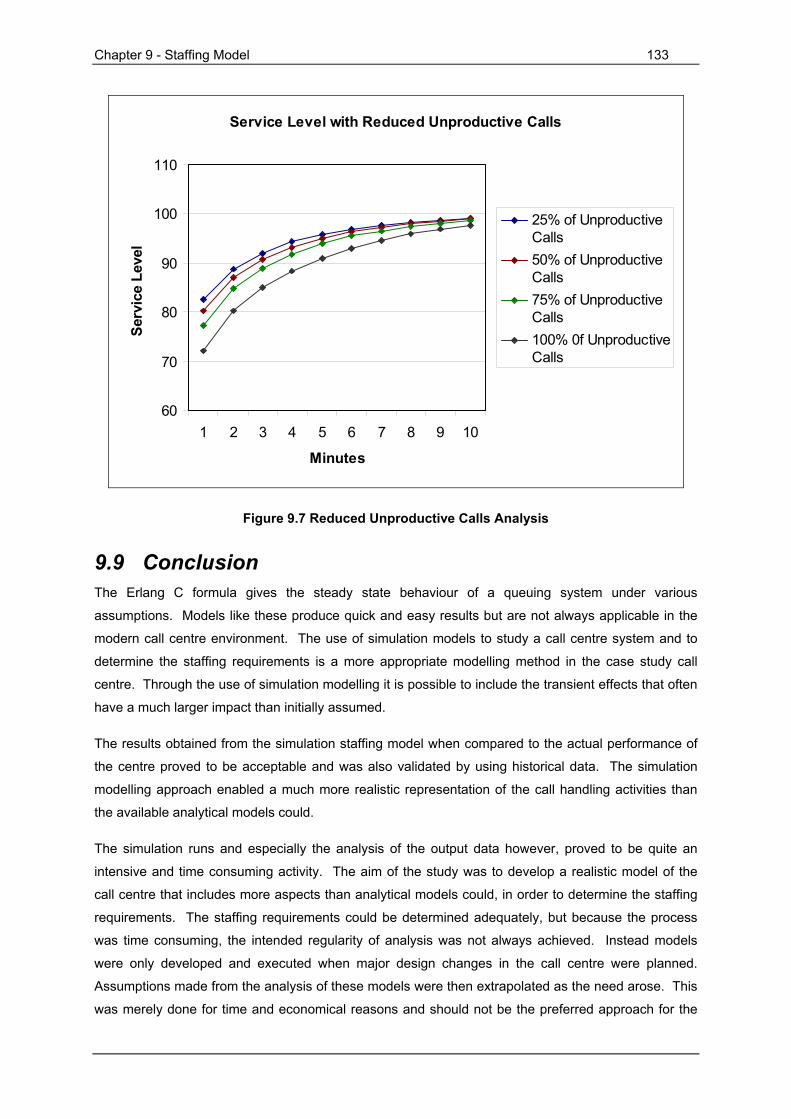
Chapter 9 - Staffing Model 133
Service Level with Reduced Unproductive Calls
60
70
80
90
100
110
1 2 3 4 5 6 7 8 9 10
Minutes
Serv
ice
Leve
l
25% of UnproductiveCalls50% of UnproductiveCalls75% of UnproductiveCalls100% 0f UnproductiveCalls
Figure 9.7 Reduced Unproductive Calls Analysis
9.9 Conclusion The Erlang C formula gives the steady state behaviour of a queuing system under various
assumptions. Models like these produce quick and easy results but are not always applicable in the
modern call centre environment. The use of simulation models to study a call centre system and to
determine the staffing requirements is a more appropriate modelling method in the case study call
centre. Through the use of simulation modelling it is possible to include the transient effects that often
have a much larger impact than initially assumed.
The results obtained from the simulation staffing model when compared to the actual performance of
the centre proved to be acceptable and was also validated by using historical data. The simulation
modelling approach enabled a much more realistic representation of the call handling activities than
the available analytical models could.
The simulation runs and especially the analysis of the output data however, proved to be quite an
intensive and time consuming activity. The aim of the study was to develop a realistic model of the
call centre that includes more aspects than analytical models could, in order to determine the staffing
requirements. The staffing requirements could be determined adequately, but because the process
was time consuming, the intended regularity of analysis was not always achieved. Instead models
were only developed and executed when major design changes in the call centre were planned.
Assumptions made from the analysis of these models were then extrapolated as the need arose. This
was merely done for time and economical reasons and should not be the preferred approach for the

Chapter 9 - Staffing Model 134
long term. By modifying the simulation model, it would be possible to achieve regular executions in
shorter time and with less effort. The application of an optimisation algorithm included with the
simulation program was experimented with, but the results were not consistent enough to make useful
deductions about the efficiency of the algorithm and the computing time was also quite long. The
algorithm might not be suited for this type of problem and therefore no definite conclusions could be
made.
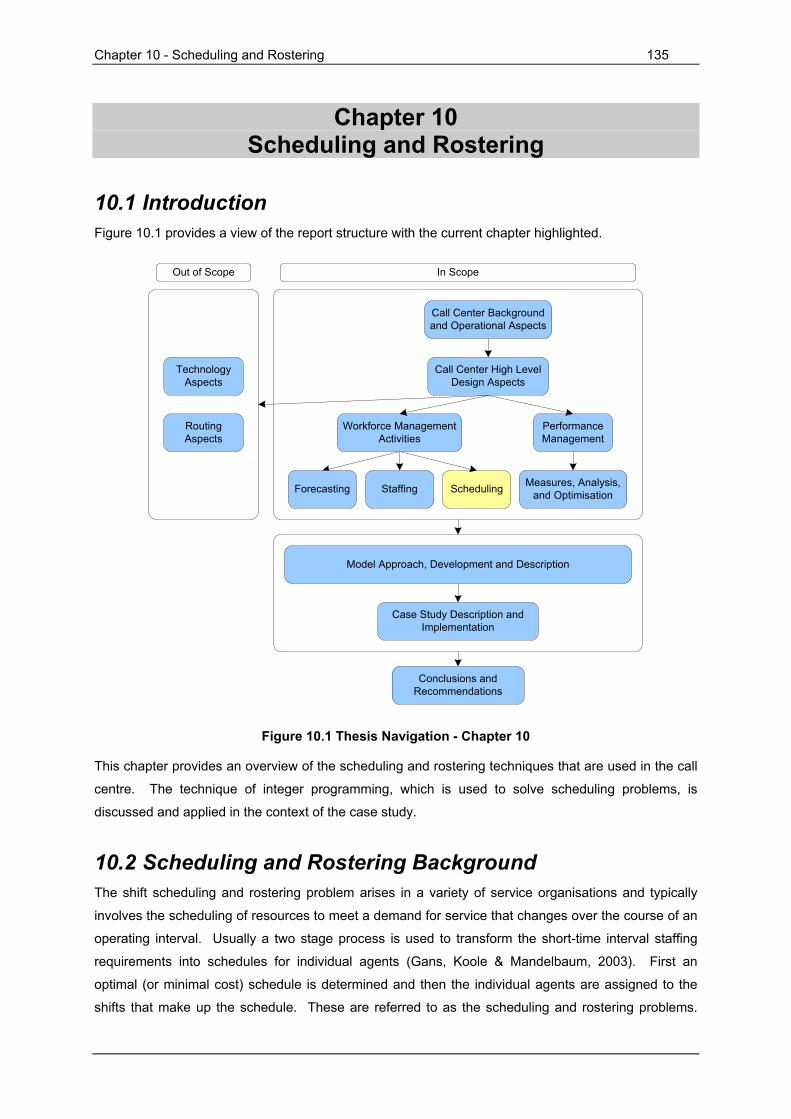
Chapter 10 - Scheduling and Rostering 135
Chapter 10 Scheduling and Rostering
10.1 Introduction Figure 10.1 provides a view of the report structure with the current chapter highlighted.
Staffing Scheduling Measures, Analysis, and Optimisation
Call Center High Level Design Aspects
Call Center Background and Operational Aspects
Performance Management
Workforce Management Activities
Forecasting
Case Study Description and Implementation
Conclusions and Recommendations
Model Approach, Development and Description
Technology Aspects
Routing Aspects
Out of Scope In Scope
Figure 10.1 Thesis Navigation - Chapter 10
This chapter provides an overview of the scheduling and rostering techniques that are used in the call
centre. The technique of integer programming, which is used to solve scheduling problems, is
discussed and applied in the context of the case study.
10.2 Scheduling and Rostering Background The shift scheduling and rostering problem arises in a variety of service organisations and typically
involves the scheduling of resources to meet a demand for service that changes over the course of an
operating interval. Usually a two stage process is used to transform the short-time interval staffing
requirements into schedules for individual agents (Gans, Koole & Mandelbaum, 2003). First an
optimal (or minimal cost) schedule is determined and then the individual agents are assigned to the
shifts that make up the schedule. These are referred to as the scheduling and rostering problems.
Chapter 10 - Scheduling and Rostering 136
The scheduling and rostering problem can also be solved together. This is a variation of the
scheduling problem and slightly more complex and will not be discussed in this study.
The scheduling problem is a very general problem and according to Aksin, Armony & Mehrotra (2007)
the scheduling and rostering problem have been studied extensively, in general contexts and in the
context of call centres. This is also confirmed by Gans, Koole & Mandelbaum (2003). The general
objective of the scheduling problem is to find the best schedule under a number of constraints. This
usually implicates finding the cheapest schedule, therefore the one requiring the lowest number of
servers or agents. Once the optimal schedule is determined, an assignment problem must be solved
to match agents and schedules. The rostering problem can be solved manually in call centres with
few workers, but larger operations often require some supporting tool. For the purpose of this study,
only the scheduling problem will be covered in the rest of this section and it will be assumed that the
rostering of agents can be performed manually.
The methods used to solve the scheduling problem are often based on mathematical programming
techniques such as linear programming and in this case more specifically integer programming.
Linear programming is a technique for solving optimisation problems. The aim is to maximise or
minimise a function of the decision variables. The function that is to be maximised or minimised is
called the objective function. The values of the decision variables must satisfy a set of constraints.
Each constraint must be a linear equation or linear inequality. A sign restriction is associated with
each variable. A linear programming problem in which some or all of the variables are required to be
nonnegative integers is called an integer programming problem.
10.3 The Scheduling Problem The determination of an optimal set of schedules can be described as the solution to an integer
program. The basic approach followed in solving the scheduling problem is similar to the formulation
discussed in Gans, Koole & Mandelbaum (2003). This is a standard approach to solving this type of
problem. In practice, the formulation of the scheduling problem may differ from the standard model.
According to Bhulai, Koole & Pot (2007) most models that deal with shift scheduling in a multi-period
and single-skill environment are based on the standard set-covering model presented by Dantzig
(1954). Set covering problems is a class of integer programming problems. In a set covering
problem, each member of a given set must be covered by an acceptable number of some set
(Winston, 2004). Another approach taken by Thompson (1995) is to avoid the set-covering
formulation all together and look for alternatives that may be easier to solve. Thompson presents an
integer programming model for developing optimal shift schedules while allowing extensive flexibility in
terms of alternative shift starting times, shift lengths, and break placement. Aykin (1996) and Brusco
& Jacobs (2000) also follow a similar approach by including constraints to define suitable break times.
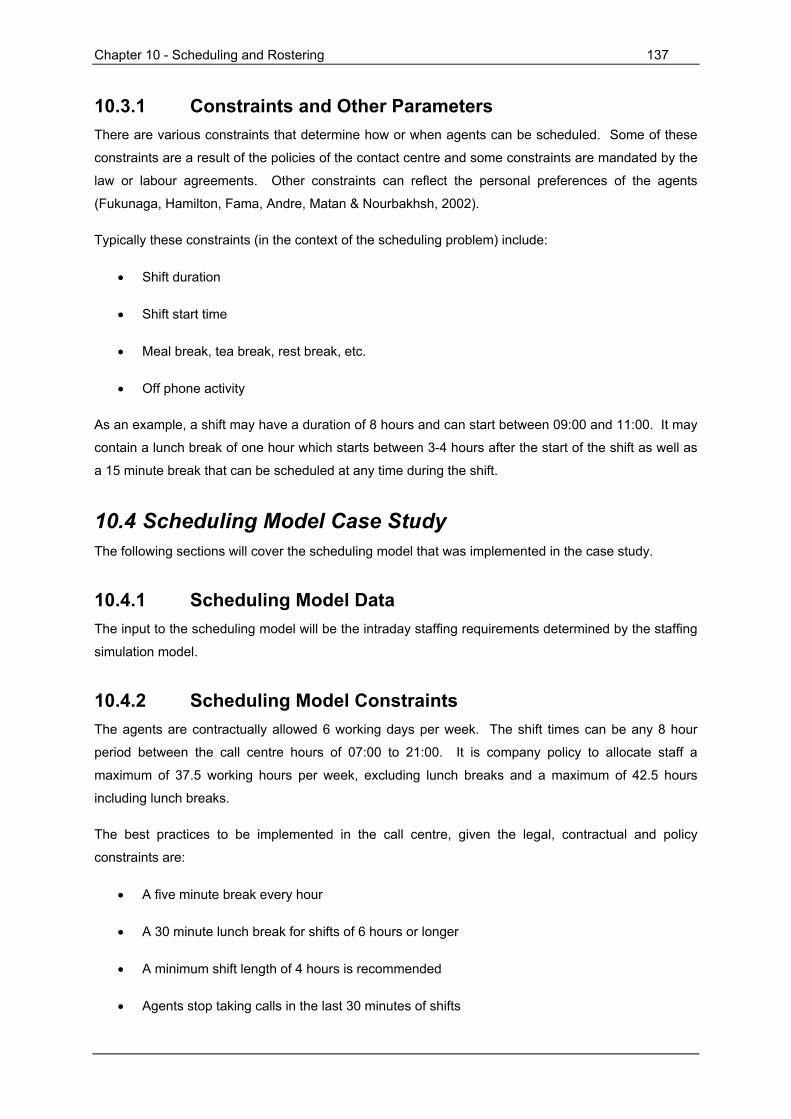
Chapter 10 - Scheduling and Rostering 137
10.3.1 Constraints and Other Parameters There are various constraints that determine how or when agents can be scheduled. Some of these
constraints are a result of the policies of the contact centre and some constraints are mandated by the
law or labour agreements. Other constraints can reflect the personal preferences of the agents
(Fukunaga, Hamilton, Fama, Andre, Matan & Nourbakhsh, 2002).
Typically these constraints (in the context of the scheduling problem) include:
• Shift duration
• Shift start time
• Meal break, tea break, rest break, etc.
• Off phone activity
As an example, a shift may have a duration of 8 hours and can start between 09:00 and 11:00. It may
contain a lunch break of one hour which starts between 3-4 hours after the start of the shift as well as
a 15 minute break that can be scheduled at any time during the shift.
10.4 Scheduling Model Case Study The following sections will cover the scheduling model that was implemented in the case study.
10.4.1 Scheduling Model Data The input to the scheduling model will be the intraday staffing requirements determined by the staffing
simulation model.
10.4.2 Scheduling Model Constraints The agents are contractually allowed 6 working days per week. The shift times can be any 8 hour
period between the call centre hours of 07:00 to 21:00. It is company policy to allocate staff a
maximum of 37.5 working hours per week, excluding lunch breaks and a maximum of 42.5 hours
including lunch breaks.
The best practices to be implemented in the call centre, given the legal, contractual and policy
constraints are:
• A five minute break every hour
• A 30 minute lunch break for shifts of 6 hours or longer
• A minimum shift length of 4 hours is recommended
• Agents stop taking calls in the last 30 minutes of shifts
Chapter 10 - Scheduling and Rostering 138
• Minimise the number of agents
• Minimise the number of shifts due to transportation complexities
Additional features that would ease the management and increase the acceptance of the solutions
supplied are:
• Keep teams on the same shift
• Do not schedule agents for the night shift and the Saturday shift
• Consider personal schedule preferences of each agent
These additional preferences will be managed manually were it is possible.
10.4.3 Scheduling Model Description The scheduling model proposed by Du Preez & Mostert (2006) will be used in this study. The model
divides the working day into short-time intervals with 30 minute lengths. These intervals should
correspond to the intervals used in the forecasting of the workload and the determining of the staffing
requirements. The 30 minute intervals also make provision for the inclusion of lunch breaks, which
are 30 minute breaks. Agents are allocated to shifts in such a way that the number of agents working
in a given interval equals or exceeds the number of agents required to work during that interval (as
determined by the staffing model).
Shifts of length 7.5 hours (excluding lunch breaks) are allocated. This is done so that five such shifts
satisfy the 37.5 required hours of work per week. The number of agents required to work on a
Saturday will work shorter shifts during the week to allow for the extra shift on the Saturday and
remain within the allocated weekly working hours.
The model will allocate lunch breaks similar to the method used in Aykin (1996) and Brusco & Jacobs
(2000), where a lunch break is allocated to every agent within a desired interval of a shift. This
interval is either in the middle of the shift or close to the normal lunch or dinner time and can be
adjusted as desired. Capacity is also set aside for hourly tea breaks, but will be controlled by
management staff according to the call arrivals on the day.
The model’s objective is to minimise the number of agents required to adhere to the above
constraints. A second run is done with the number of agents fixed and the number of shifts is
minimised.
10.4.4 Mathematical Formulation The method used in the case study will be that used by Du Preez & Mostert (2006).

Chapter 10 - Scheduling and Rostering 139
The call centre operating hours are from 07:00 to 21:00 and therefore there are 28 half hour intervals
in a day. Each day is divided into 30 minute intervals indicated by i = 1, 2, …, 28.
The number of agents starting their shift at time period i , is defined as ix . The first shift can start at
07:00 (time period 1) and shifts can start every period. The last shift can start at 17:00 (time period
21), to allow for a minimum shift length of 4 hours. The possible shifts are illustrated in Figure 10.2.
Time
07:0
007
:30
08:0
008
:30
09:0
009
:30
10:0
010
:30
11:0
011
:30
12:0
012
:30
13:0
013
:30
14:0
014
:30
15:0
015
:30
16:0
016
:30
17:0
017
:30
18:0
018
:30
19:0
019
:30
20:0
020
:30
Period 1 2 3 4 5 6 7 8 9 10 11 12 13 14 15 16 17 18 19 20 21 22 23 24 25 26 27 28
Figure 10.2 Possible Shifts for Schedule Model
The number of agents working in time period i , is defined as iw , where
1521 −−− ++++= iiiii xxxxw K (1)
where 281 ≤≤ i and 0=yx if y < 1 and y > 28
Thus the sum of all the agents who started their shifts at time periods 15−i to i is taken. This allows
for shift lengths of 7.5 hours (including the lunch break) as agents do not take calls in the last 30
minutes of their shifts.
Lunch breaks are allocated to shifts longer than 6 hours. Lunch breaks must be within a specified
interval of a shift. A lunch break at time period i that is allocated to a shift starting at time period j is

Chapter 10 - Scheduling and Rostering 140
defined as ijb for 281 ≤≤ i (28 operating periods) and 211 ≤≤ j (21 shift starting periods). The
possible lunch break intervals for the different shifts are illustrated in Figure 10.3.
Time
07:0
007
:30
08:0
008
:30
09:0
009
:30
10:0
010
:30
11:0
011
:30
12:0
012
:30
13:0
013
:30
14:0
014
:30
15:0
015
:30
16:0
016
:30
17:0
017
:30
18:0
018
:30
19:0
019
:30
20:0
020
:30
Period 1 2 3 4 5 6 7 8 9 10 11 12 13 14 15 16 17 18 19 20 21 22 23 24 25 26 27 28
Figure 10.3 Possible Lunch breaks per Shift
The total number of lunch breaks allocated at time period i is noted as iB , where
2812121 ≤≤+++= iforbbbB iiii K (2)
The number of lunch breaks allocated per shift must be equal to the number of agents working on that
shift, thus
2112821 ≤≤=+++ iforwbbb iiii K (3)
Tea breaks allocated at time period i , are defined as it for 281 ≤≤ i . The number allocated must
be greater than half (breaks are allowed hourly) the number of agents in a shift taking calls in the
concerned half hour, divided by the number of agents that can take an hourly break of desired length
in that half hour.
If ir is the number of agents required to work (taking calls) in time period i , then the total number of
agents required to be on shift is noted as iR , where

Chapter 10 - Scheduling and Rostering 141
211 ≤≤++= iforBtrR iiii (4)
The number of agents working in any time period must be greater than or equal to the number of
agents required to be on shift in that time period (as determined in the staffing problem), thus
281 ≤≤≥ iforRw ii (5)
The number of shifts is indicated by adding the number of shifts to which agents are appointed. For
this purpose, a binary variable is is created which must be 1 if a shift at time period i exists and 0
otherwise. is is defined as
mw
sw iii ≥≥ (6)
where m is a number greater than the total number of agents. The number of shifts S is then
2121 sssS +++= K (7)
The objective function is defined as the sum of all the agents required to work on a day. Thus the
function is the sum of all the ix ’s.
2121min xxxZ +++= K (8)
This number of agents required is minimised by minimising this function.
The second run of the model is performed to minimise the number of shifts, given the resulting number
of agents required. The number of agents Z is then fixed and the objective function changed to the
number of shifts S , where
212min sssS i +++= K (9)
10.4.5 The Solution Process The staffing requirements obtained from the staffing model for the day that has the maximum number
of calls of the week is used as the input to the scheduling model. The service level objectives are
contained in the staffing simulation model. The scheduling model is then used to determine the
possible shifts subject to the constraints listed in the formulation of the problem. A second run is then
performed to minimise the number of shifts required with a fixed number of agents. The same model
is used but the objective function is changed to the number of shifts and the number of agents fixed.
A compromise needs to be made between the number of shifts and the number of agents.

Chapter 10 - Scheduling and Rostering 142
10.4.6 Scheduling Model Results The model was implemented using the staffing requirements as input. The following figures are
examples of the typical results produced by the scheduling model. In the figures a row indicates a
shift, while a number in a cell indicates the number of agents in that shift, in the specific time slot.
Figure 10.4 illustrates a solution where the number of agent are minimised and grouped into shifts
according to the number of agents required in each period determined from the staffing model.
Time
07:0
0
07:3
0
08:0
0
08:3
0
09:0
0
09:3
0
10:0
0
10:3
0
11:0
0
11:3
0
12:0
0
12:3
0
13:0
0
13:3
0
14:0
0
14:3
0
15:0
0
15:3
0
16:0
0
16:3
0
17:0
0
17:3
0
18:0
0
18:3
0
19:0
0
19:3
0
20:0
0
20:3
0
Period 1 2 3 4 5 6 7 8 9 10 11 12 13 14 15 16 17 18 19 20 21 22 23 24 25 26 27 2827 27 27 27 27 27 18 18 18 27 27 27 27
0 0 0 0 0 0 0 0 0 0 0 0 0 0 0 08 8 8 8 8 8 8 1 8 7 8 8 8 8 8 8
18 18 18 18 18 18 16 18 18 2 18 18 18 18 18 180 0 0 0 0 0 0 0 0 0 0 0 0 0 0 0
0 0 0 0 0 0 0 0 0 0 0 0 0 0 0 00 0 0 0 0 0 0 0 0 0 0 0 0 0 0 0
5 5 5 5 5 5 5 5 5 0 5 5 5 5 5 51 1 1 1 1 1 1 1 0 1 1 1 1 1 1 1
1 1 1 1 1 1 1 1 1 1 0 1 1 1 1 11 1 1 1 1 1 1 1 0 1 1 1 1 1 1 1
24 24 24 24 24 24 2 24 24 24 22 24 24 24 24 2415 15 15 15 15 15 6 15 9 15 15 15 15 15 15 15
0 0 0 0 0 0 0 0 0 0 0 0 0 0 00 0 0 0 0 0 0 0 0 0 0 0 0 0
0 0 0 0 0 0 0 0 0 0 0 0 00 0 0 0 0 0 0 0 0 0 0 0
0 0 0 0 0 0 0 0 0 0 00 0 0 0 0 0 0 0 0 0
0 0 0 0 0 0 0 0 00 0 0 0 0 0 0 0
Required 27 27 35 53 53 53 44 49 50 51 61 84 84 73 73 73 67 51 55 46 41 45 47 42 41 40 39 15Scheduled 16 27 35 31 31 37 44 49 50 51 53 54 58 54 49 51 50 51 48 46 41 45 47 38 41 35 22 12
Figure 10.4 Example of Minimising Agent per Period
Figure 10.5 illustrates for the same problem, the schedule with the number of shifts minimised while
the number of scheduled agents determined in the previous figure kept constant.
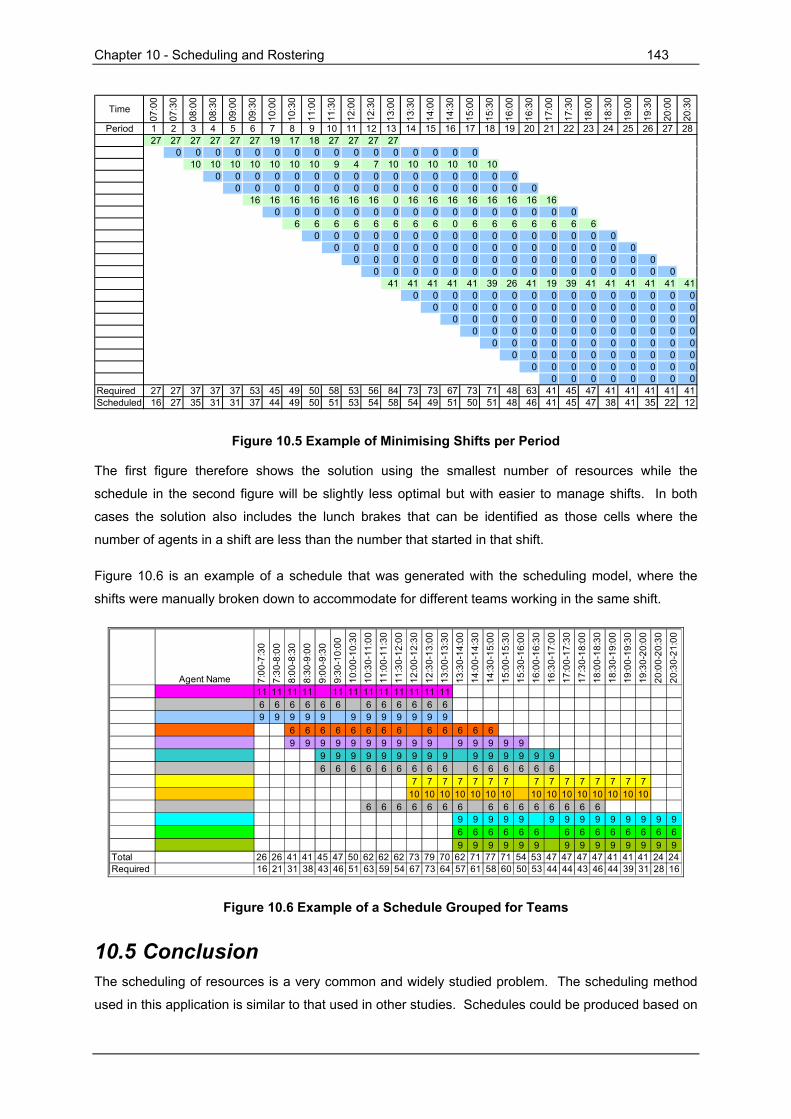
Chapter 10 - Scheduling and Rostering 143
Time
07:0
0
07:3
0
08:0
0
08:3
0
09:0
0
09:3
0
10:0
0
10:3
0
11:0
0
11:3
0
12:0
0
12:3
0
13:0
0
13:3
0
14:0
0
14:3
0
15:0
0
15:3
0
16:0
0
16:3
0
17:0
0
17:3
0
18:0
0
18:3
0
19:0
0
19:3
0
20:0
0
20:3
0
Period 1 2 3 4 5 6 7 8 9 10 11 12 13 14 15 16 17 18 19 20 21 22 23 24 25 26 27 2827 27 27 27 27 27 19 17 18 27 27 27 27
0 0 0 0 0 0 0 0 0 0 0 0 0 0 0 010 10 10 10 10 10 10 9 4 7 10 10 10 10 10 10
0 0 0 0 0 0 0 0 0 0 0 0 0 0 0 00 0 0 0 0 0 0 0 0 0 0 0 0 0 0 0
16 16 16 16 16 16 16 0 16 16 16 16 16 16 16 160 0 0 0 0 0 0 0 0 0 0 0 0 0 0 0
6 6 6 6 6 6 6 6 0 6 6 6 6 6 6 60 0 0 0 0 0 0 0 0 0 0 0 0 0 0 0
0 0 0 0 0 0 0 0 0 0 0 0 0 0 0 00 0 0 0 0 0 0 0 0 0 0 0 0 0 0 0
0 0 0 0 0 0 0 0 0 0 0 0 0 0 0 041 41 41 41 41 39 26 41 19 39 41 41 41 41 41 41
0 0 0 0 0 0 0 0 0 0 0 0 0 0 00 0 0 0 0 0 0 0 0 0 0 0 0 0
0 0 0 0 0 0 0 0 0 0 0 0 00 0 0 0 0 0 0 0 0 0 0 0
0 0 0 0 0 0 0 0 0 0 00 0 0 0 0 0 0 0 0 0
0 0 0 0 0 0 0 0 00 0 0 0 0 0 0 0
Required 27 27 37 37 37 53 45 49 50 58 53 56 84 73 73 67 73 71 48 63 41 45 47 41 41 41 41 41Scheduled 16 27 35 31 31 37 44 49 50 51 53 54 58 54 49 51 50 51 48 46 41 45 47 38 41 35 22 12
Figure 10.5 Example of Minimising Shifts per Period
The first figure therefore shows the solution using the smallest number of resources while the
schedule in the second figure will be slightly less optimal but with easier to manage shifts. In both
cases the solution also includes the lunch brakes that can be identified as those cells where the
number of agents in a shift are less than the number that started in that shift.
Figure 10.6 is an example of a schedule that was generated with the scheduling model, where the
shifts were manually broken down to accommodate for different teams working in the same shift.
Agent Name 7:00
-7:3
07:
30-8
:00
8:00
-8:3
08:
30-9
:00
9:00
-9:3
09:
30-1
0:00
10:0
0-10
:30
10:3
0-11
:00
11:0
0-11
:30
11:3
0-12
:00
12:0
0-12
:30
12:3
0-13
:00
13:0
0-13
:30
13:3
0-14
:00
14:0
0-14
:30
14:3
0-15
:00
15:0
0-15
:30
15:3
0-16
:00
16:0
0-16
:30
16:3
0-17
:00
17:0
0-17
:30
17:3
0-18
:00
18:0
0-18
:30
18:3
0-19
:00
19:0
0-19
:30
19:3
0-20
:00
20:0
0-20
:30
20:3
0-21
:00
11 11 11 11 11 11 11 11 11 11 11 116 6 6 6 6 6 6 6 6 6 6 69 9 9 9 9 9 9 9 9 9 9 9
6 6 6 6 6 6 6 6 6 6 6 6 69 9 9 9 9 9 9 9 9 9 9 9 9 9 9
9 9 9 9 9 9 9 9 9 9 9 9 9 9 96 6 6 6 6 6 6 6 6 6 6 6 6 6 6
7 7 7 7 7 7 7 7 7 7 7 7 7 7 710 10 10 10 10 10 10 10 10 10 10 10 10 10 10
6 6 6 6 6 6 6 6 6 6 6 6 6 6 69 9 9 9 9 9 9 9 9 9 9 9 9 96 6 6 6 6 6 6 6 6 6 6 6 6 69 9 9 9 9 9 9 9 9 9 9 9 9 9
Total 26 26 41 41 45 47 50 62 62 62 73 79 70 62 71 77 71 54 53 47 47 47 47 41 41 41 24 24Required 16 21 31 38 43 46 51 63 59 54 67 73 64 57 61 58 60 50 53 44 44 43 46 44 39 31 28 16
Figure 10.6 Example of a Schedule Grouped for Teams
10.5 Conclusion The scheduling of resources is a very common and widely studied problem. The scheduling method
used in this application is similar to that used in other studies. Schedules could be produced based on

Chapter 10 - Scheduling and Rostering 144
the staffing requirements generated by the staffing model. These schedules were implemented in the
case study call centre and the service level targets were reached in most cases. The manner in which
the schedules are generated will cause the call centre to be overstaffed during certain periods –
especially the morning shifts. In this case, this was an aspect that could not be avoided with the
current scheduling model. However, because there are back office work that has to be performed, the
periods that are overstaffed could be used to rotate agents to perform the back office work.
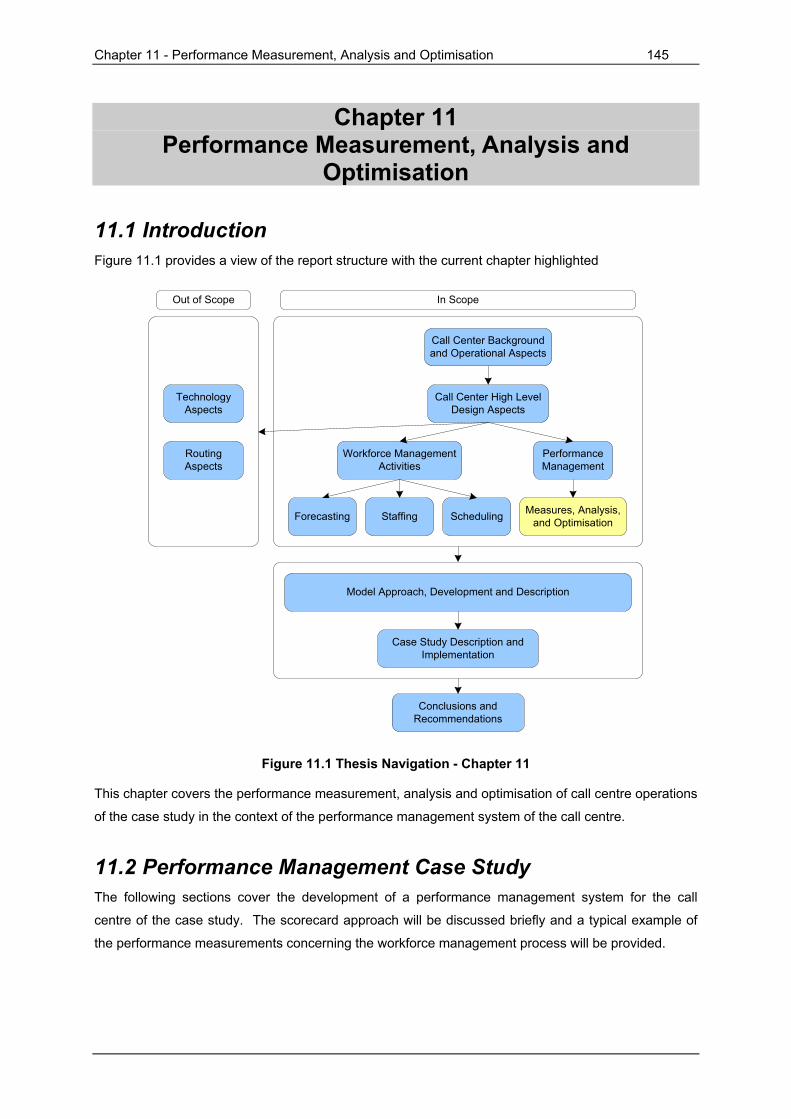
Chapter 11 - Performance Measurement, Analysis and Optimisation 145
Chapter 11 Performance Measurement, Analysis and
Optimisation
11.1 Introduction Figure 11.1 provides a view of the report structure with the current chapter highlighted
Staffing Scheduling Measures, Analysis, and Optimisation
Call Center High Level Design Aspects
Call Center Background and Operational Aspects
Performance Management
Workforce Management Activities
Forecasting
Case Study Description and Implementation
Conclusions and Recommendations
Model Approach, Development and Description
Technology Aspects
Routing Aspects
Out of Scope In Scope
Figure 11.1 Thesis Navigation - Chapter 11
This chapter covers the performance measurement, analysis and optimisation of call centre operations
of the case study in the context of the performance management system of the call centre.
11.2 Performance Management Case Study The following sections cover the development of a performance management system for the call
centre of the case study. The scorecard approach will be discussed briefly and a typical example of
the performance measurements concerning the workforce management process will be provided.

Chapter 11 - Performance Measurement, Analysis and Optimisation 146
11.2.1 Performance Management Approach A structured performance management approach was required for the call centre operations.
Performance management is the tool that links all the call centre activities (including the workforce
management activities) into one structured approach in achieving optimal performance and supporting
the organisational strategic objectives. This approach had to address the following aspects:
• Alignment of activities with organisational strategic objectives
• Performance measures to enable continuous improvement and learning
• Accountability for various performance aspects
• Organisation of data and reporting of performance measures
The balanced scorecard approach was used in the high level definition of the management objectives
and performance measures. This approach would aid in aligning the call centre activities with the
organisation’s goals and strategy. All subsequent activities and measures would therefore be based
on achieving the high level goals.
The approach to developing the performance management methodology is illustrated in Figure 11.2.
The Balanced Scorecard approach was followed because of the structured approach it provides to
align the call centre operations with the organisational objectives and to identify those measures that
will guide this process. An extremely important aspect was to establish an environment of
accountability for achieving the intended objectives. In order to achieve this, an accountability matrix
was combined with the Balanced Scorecard template that would clearly indicate the individuals and
groups responsible for each of the objectives. Responsibilities would therefore be passed down from
the call centre manager to the applicable groups or individuals. The objectives were then also
associated with performance measures and targets that would encourage the correct behaviour.
Financial
Customer
Internal
Learning and Growth
Roles
ObjectiveObjective
ObjectiveObjective
ObjectiveObjective
ObjectiveObjective
xxxx
x xxxx x
xx xx
xxx x x
MeasuresMeasures
MeasuresMeasures
MeasuresMeasures
MeasuresMeasures
Figure 11.2 Call Centre Performance Management Methodology
Chapter 11 - Performance Measurement, Analysis and Optimisation 147
A simplified version of the call centre scorecard that is similar to the template used in the case study is
included in Appendix C for illustration purposes. The scorecard is divided into four groups similar to
those of the balanced scorecard, namely Financial, Business Processes, Customer Service, and
Empowerment and Development (People). These categories were chosen to match the organisation’s
scorecard categories as closely as possible to the Balanced Scorecard aspects. The detail of the
scorecard will not be discussed in detail, and instead an example of some of the workforce
management measures will be provided to illustrate the performance management and measurement
aspects on an operational level.
11.2.2 Performance Management Implementation The performance management system was only implemented at a late stage of the implementation of
the call centre. This was done because during the design and implementation phase of the call
centre, the responsibilities were shared between the consulting company and the call centre
management and the process involved frequent alterations to the design and processes. This made
the implementation of a performance management system a potentially difficult exercise. Similar to
this situation Niven (2005) states that organisations who have successfully implemented a Balanced
Scorecard approach have typically reached a state of pervasiveness, a point in the implementation of
an idea where the new processes have become ingrained in the organisations operations. This is
exactly the point at which the scorecard approach was being implemented – the implementation
project was completed and the call centre was fully operational and integrated with the organisation.
Unfortunately no data could be gathered to indicate that the performance management system has
been successfully implemented. However, a trial performance-based compensation model was
implemented on the agent level of the call centre. The measures that the compensation was based on
were determined through the structure of the intended performance management scorecard. After
running the trial on a weekly basis for approximately one month, an improvement in the actions and
behaviour of the agents could be noticed and this also affected the service level in a positive way.
This observation alone can not be taken as proof that the performance management program will be
successful, but it does provide an indication that by choosing the correct measures to drive the desired
behaviour based on strategic objective, can result in real performance improvements.
11.2.3 Real Time Performance Reporting and Analysis The reporting and analysis of real time data is an important part of the call centre operations. Agents,
Team Leaders need to have certain information throughout the day in order to react to situations that
may arise and to keep track of the call performance of the call centre throughout the day. Figure 11.3
is an example of a dashboard providing real time data to the agents, team leaders, and call centre
management.

Chapter 11 - Performance Measurement, Analysis and Optimisation 148
Logged in
Taking Calls
Available
Unavailable
Number of ACE Agents
Missed Calls
Call Any
Call Now
Daily Missed Calls Total 344
0
0
0
Message to Agents
Average Call Waiting Minutes
Calls in Queue
56
36
12
8
Total
14 February 2008, 10:27
< 1 : 0 (218)
1 – 5 : 0 (6)
5 – 10 : 0 (0)
> 10 : 0 (0)
Figure 11.3 Example of Real Time Dashboard
Other systems also allow team leaders to view the status of individual agents. The typical data that is
necessary and available in real time are the following:
• Number of calls in the queue
• Waiting time of calls in queue
• Agent status (number of agents logged in, busy, idle, and unavailable)
• Number of calls received thus far
This data and information allows team leaders to monitor the number of calls arriving and the time
they spend in waiting for service. Agents can also be monitored which enables those parties involved
to make effective decisions based on the situation at hand.
11.2.4 Historical Performance Reporting and Analysis During the implementation phase a set of performance measures that was based on the principles of
the scorecard approach was determined based on the design objectives. A large part of these
measures were based on the workforce management activities as it forms the largest part of the call

Chapter 11 - Performance Measurement, Analysis and Optimisation 149
centre operations. Some of the results of the operations and optimisation activities will be discussed
in the following sections.
One of the main performance measures of the call centre is the service level, measured as the
percentage of calls that are answered within the target response time. The service level is one of the
main measures included in the performance management system because it gives an indication of
how well the workforce management process was performed. The initial service level target at the
start of the implementation was to answer 90% of calls within 5 minutes. As the implementation
progressed the capabilities of the centre expanded and this target was gradually changed to
answering 90% of calls within 1 minute. The daily service level measures for June 2007 are illustrated
in Figure 11.4. On most days the target was reached, except for a few days where the performance
was particularly poor. The performance management process also requires other workforce related
measures that are linked to the service level measurements. Through the analysis of these measures
most of the poor performance days could be linked to other measures, which in this case included
high agent shrinkage (including absenteeism) levels and computer system problems that cause the
call centre systems to function slowly or not at all. Through the structure of the scorecard approach
these poor performance incidents are easily identified and analysed. The performance management
system then also identifies individuals or groups accountable for initiating the required actions in order
to improve the performance and also learn through the experience in order to ensure that the root of
the problem is identified and future problems can be prevented.
Call Response Time June 2007 - Percentage of calls answered within 1 minute
0%
10%
20%
30%
40%
50%
60%
70%
80%
90%
100%
01/0
6/20
07
02/0
6/20
07
04/0
6/20
07
05/0
6/20
07
06/0
6/20
07
07/0
6/20
07
08/0
6/20
07
09/0
6/20
07
11/0
6/20
07
12/0
6/20
07
13/0
6/20
07
14/0
6/20
07
15/0
6/20
07
18/0
6/20
07
19/0
6/20
07
20/0
6/20
07
21/0
6/20
07
22/0
6/20
07
23/0
6/20
07
25/0
6/20
07
26/0
6/20
07
27/0
6/20
07
28/0
6/20
07
> 1 minute< 1 minute
Figure 11.4 Daily Service Level Measures for June 2007
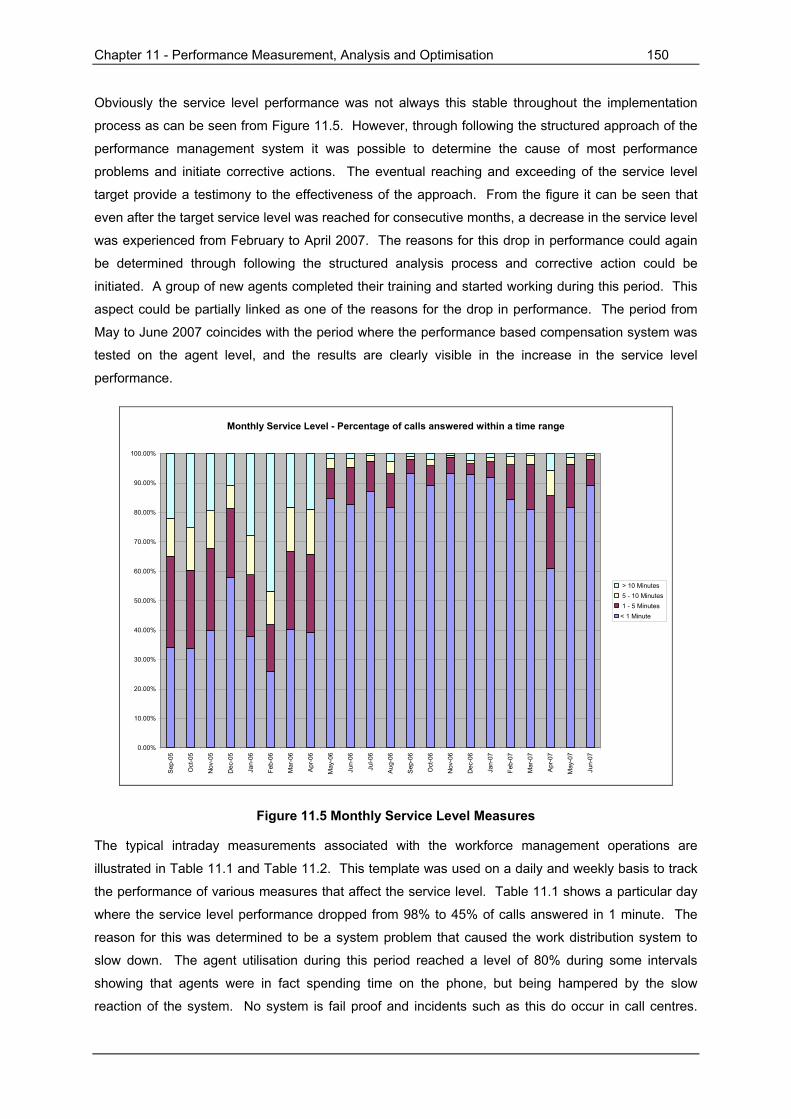
Chapter 11 - Performance Measurement, Analysis and Optimisation 150
Obviously the service level performance was not always this stable throughout the implementation
process as can be seen from Figure 11.5. However, through following the structured approach of the
performance management system it was possible to determine the cause of most performance
problems and initiate corrective actions. The eventual reaching and exceeding of the service level
target provide a testimony to the effectiveness of the approach. From the figure it can be seen that
even after the target service level was reached for consecutive months, a decrease in the service level
was experienced from February to April 2007. The reasons for this drop in performance could again
be determined through following the structured analysis process and corrective action could be
initiated. A group of new agents completed their training and started working during this period. This
aspect could be partially linked as one of the reasons for the drop in performance. The period from
May to June 2007 coincides with the period where the performance based compensation system was
tested on the agent level, and the results are clearly visible in the increase in the service level
performance.
Monthly Service Level - Percentage of calls answered within a time range
0.00%
10.00%
20.00%
30.00%
40.00%
50.00%
60.00%
70.00%
80.00%
90.00%
100.00%
Sep-
05
Oct
-05
Nov
-05
Dec
-05
Jan-
06
Feb-
06
Mar
-06
Apr
-06
May
-06
Jun-
06
Jul-0
6
Aug-
06
Sep-
06
Oct
-06
Nov
-06
Dec
-06
Jan-
07
Feb-
07
Mar
-07
Apr
-07
May
-07
Jun-
07 > 10 Minutes 5 - 10 Minutes 1 - 5 Minutes< 1 Minute
Figure 11.5 Monthly Service Level Measures
The typical intraday measurements associated with the workforce management operations are
illustrated in Table 11.1 and Table 11.2. This template was used on a daily and weekly basis to track
the performance of various measures that affect the service level. Table 11.1 shows a particular day
where the service level performance dropped from 98% to 45% of calls answered in 1 minute. The
reason for this was determined to be a system problem that caused the work distribution system to
slow down. The agent utilisation during this period reached a level of 80% during some intervals
showing that agents were in fact spending time on the phone, but being hampered by the slow
reaction of the system. No system is fail proof and incidents such as this do occur in call centres.
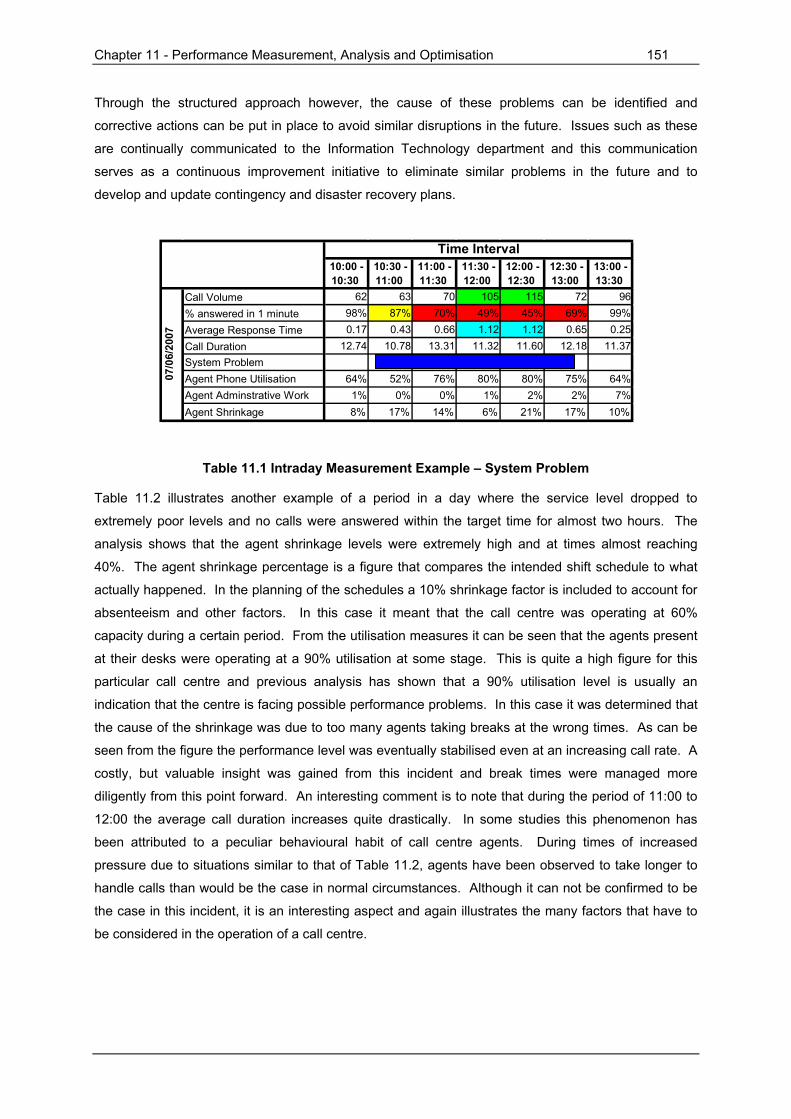
Chapter 11 - Performance Measurement, Analysis and Optimisation 151
Through the structured approach however, the cause of these problems can be identified and
corrective actions can be put in place to avoid similar disruptions in the future. Issues such as these
are continually communicated to the Information Technology department and this communication
serves as a continuous improvement initiative to eliminate similar problems in the future and to
develop and update contingency and disaster recovery plans.
10:00 - 10:30
10:30 - 11:00
11:00 - 11:30
11:30 - 12:00
12:00 - 12:30
12:30 - 13:00
13:00 - 13:30
Call Volume 62 63 70 105 115 72 96% answered in 1 minute 98% 87% 70% 49% 45% 69% 99%Average Response Time 0.17 0.43 0.66 1.12 1.12 0.65 0.25Call Duration 12.74 10.78 13.31 11.32 11.60 12.18 11.37System ProblemAgent Phone Utilisation 64% 52% 76% 80% 80% 75% 64%Agent Adminstrative Work 1% 0% 0% 1% 2% 2% 7%Agent Shrinkage 8% 17% 14% 6% 21% 17% 10%
07/0
6/20
07
Time Interval
Table 11.1 Intraday Measurement Example – System Problem
Table 11.2 illustrates another example of a period in a day where the service level dropped to
extremely poor levels and no calls were answered within the target time for almost two hours. The
analysis shows that the agent shrinkage levels were extremely high and at times almost reaching
40%. The agent shrinkage percentage is a figure that compares the intended shift schedule to what
actually happened. In the planning of the schedules a 10% shrinkage factor is included to account for
absenteeism and other factors. In this case it meant that the call centre was operating at 60%
capacity during a certain period. From the utilisation measures it can be seen that the agents present
at their desks were operating at a 90% utilisation at some stage. This is quite a high figure for this
particular call centre and previous analysis has shown that a 90% utilisation level is usually an
indication that the centre is facing possible performance problems. In this case it was determined that
the cause of the shrinkage was due to too many agents taking breaks at the wrong times. As can be
seen from the figure the performance level was eventually stabilised even at an increasing call rate. A
costly, but valuable insight was gained from this incident and break times were managed more
diligently from this point forward. An interesting comment is to note that during the period of 11:00 to
12:00 the average call duration increases quite drastically. In some studies this phenomenon has
been attributed to a peculiar behavioural habit of call centre agents. During times of increased
pressure due to situations similar to that of Table 11.2, agents have been observed to take longer to
handle calls than would be the case in normal circumstances. Although it can not be confirmed to be
the case in this incident, it is an interesting aspect and again illustrates the many factors that have to
be considered in the operation of a call centre.

Chapter 11 - Performance Measurement, Analysis and Optimisation 152
8:30 - 9:00
9:00 - 9:30
9:30 - 10:00
10:00 - 10:30
10:30 - 11:00
11:00 - 11:30
11:30 - 12:00
12:00 - 12:30
12:30 - 13:00
13:00 - 13:30
13:30 - 14:00
Call Volume 43 48 57 71 77 83 85 106 90 112 92% answered in 1 minute 100.0% 77.1% 54.4% 56.3% 0.0% 0.0% 0.0% 15.1% 54.4% 84.8% 94.6%Average Response Time 0.04 0.59 1.43 1.46 6.48 5.08 6.30 5.84 1.10 1.38 0.66Call Duration 10.50 10.55 10.04 11.70 14.14 13.89 11.76 13.16 12.23 12.35 10.85System ProblemAgent Phone Utilisation 41% 68% 83% 79% 89% 90% 86% 86% 83% 79% 69%Agent Adminstrative Work 3% 4% 3% 4% 1% 2% 3% 2% 3% 3% 11%Agent Shrinkage 7% 38% 39% 39% 25% 19% 9% 10% 10% 3% 3%
Time Interval
24/0
5/20
07
Table 11.2 Intraday Measurement Example – Agent Shrinkage
These are typical operational aspects that were analysed on a regular basis and various other
measures were also performed. In each case measures are determined through the structure of the
performance management scorecard and through regular tracking and analysis it is possible to
determine the root cause of performance incidents and implement corrective or preventative actions.
A performance based compensation system was also planned and tested in the call centre. As much
as it is important to manage the performance of the call centre, it is also essential to justly reward
employees when performance targets are achieved.
11.2.5 Other Analysis Results The core function of the call centre within the organisation is to capture policy information with the aim
of processing as many policies as possible to be issued as quickly as possible. The more complete
policies captured means more policies issued in less time and this relates to more revenue and
greater customer satisfaction. By measuring the number of policies or part of a policy captured on
agent level will therefore drive the correct actions and reduce the negative behaviour that can be
associated with measurements. This was one of the most important revelations that the performance
management approach provided.
Measuring call duration and calls handled per agent is usually a preferred call measure. In this case it
was found not be a performance enhancing measure, and should only be seen as a call centre
measure to determine the overall efficiency of the centre. By measuring the call duration on agent
level encourages undesirable behaviour. An improvement in the call duration on the call centre level
would however aid in the response time and would also mean less money spent on telephone fees
and could also result in less agents required.
It was found through analysis that cases that required more than one call to complete had a total call
duration that was longer than calls completed in one call. It would therefore be beneficial to
encourage agents and intermediaries to aim to complete most cases in one call.

Chapter 11 - Performance Measurement, Analysis and Optimisation 153
11.3 Conclusion Performance management plays an essential role in the management of call centre operations. It is
the mechanism that aligns the call centre objectives to the strategic objectives of the organisation. In
the case study call centre it was illustrated how the structured approach to evaluating the performance
of the workforce management process can lead to effective problem identification and resolution. One
of the most important aspects to a performance management system is that it should also provide an
environment that nurtures learning and insight where individuals or groups can take initiative in order
to move from being reactive to being proactive in the approach to the call centre activities.
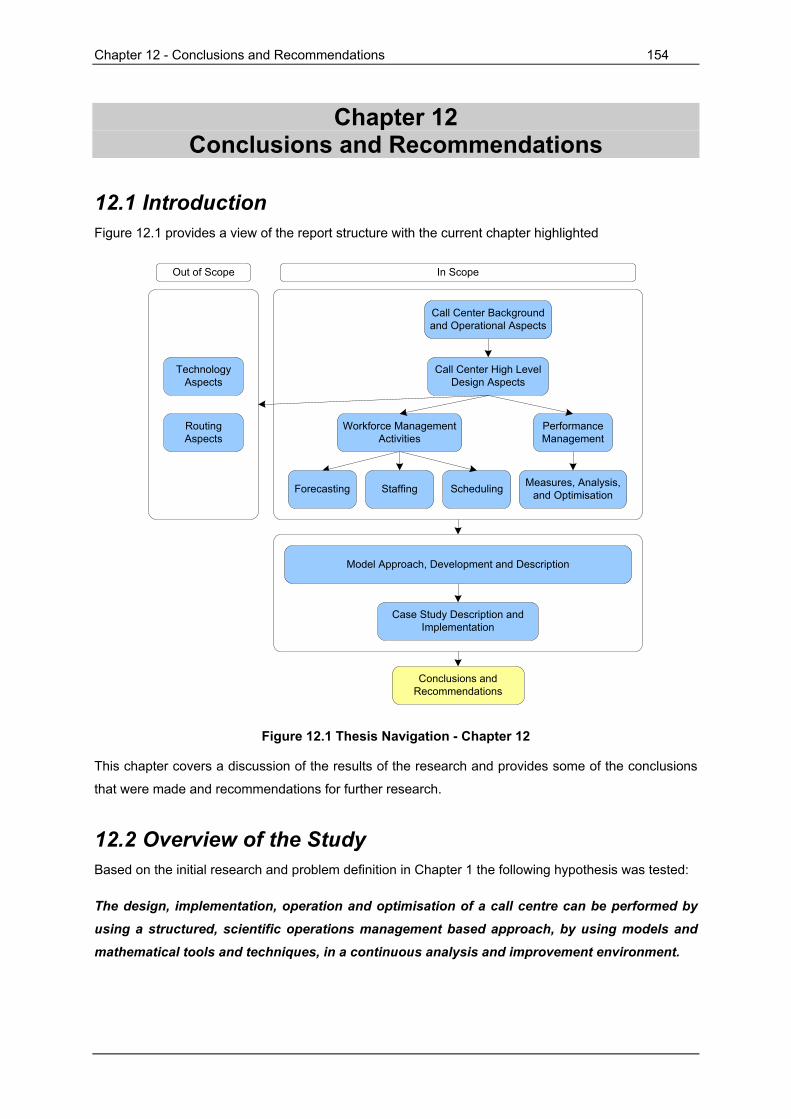
Chapter 12 - Conclusions and Recommendations 154
Chapter 12 Conclusions and Recommendations
12.1 Introduction Figure 12.1 provides a view of the report structure with the current chapter highlighted
Staffing Scheduling Measures, Analysis, and Optimisation
Call Center High Level Design Aspects
Call Center Background and Operational Aspects
Performance Management
Workforce Management Activities
Forecasting
Case Study Description and Implementation
Conclusions and Recommendations
Model Approach, Development and Description
Technology Aspects
Routing Aspects
Out of Scope In Scope
Figure 12.1 Thesis Navigation - Chapter 12
This chapter covers a discussion of the results of the research and provides some of the conclusions
that were made and recommendations for further research.
12.2 Overview of the Study Based on the initial research and problem definition in Chapter 1 the following hypothesis was tested:
The design, implementation, operation and optimisation of a call centre can be performed by
using a structured, scientific operations management based approach, by using models and
mathematical tools and techniques, in a continuous analysis and improvement environment.
Chapter 12 - Conclusions and Recommendations 155
The goal of the research was to conduct a thorough literature study of the call centre environment and
then to suggest and develop a structured modelling approach that can be implemented in the case
study call centre that initiated the research.
A modelling approach was developed based on the Contact Centre Model and the Planning Roadmap
developed by Prosci (2004). These models provide a description of the high level design and
operation aspects that need to be considered when designing and operating a call centre. Through
the literature study and the study of Prosci’s model the workforce management and performance
management aspects were identified as the core activities in the operation of a call centre. The
modelling approach that was developed therefore had a large emphasis on the development of the
workforce management and performance management aspects.
The model was tested in the call centre that initiated the research. The call centre was required as
part of a larger business process reengineering project. The proper functioning of the call centre was
essential to the overall success of the project and the future operations of the organisation. The
following section discusses the main results and conclusions.
12.3 Results and Conclusions From the initial research and the practical experience in the call centre it was concluded from an early
stage that the call centre environment is dynamic and complex. Performance objectives are
demanding and often conflicting and finely balancing all the relevant parameters was therefore an
essential requirement.
The revised modelling approach proved to be successful in terms of providing a structured approach
to the design, operation, and optimisation activities. It enabled the identification of the most relevant
aspects and how they relate to each other. Because the case study implementation required a new
call centre the structured approach was particularly useful in guiding the process. The alignment of
the call centre activities was also an essential aspects that guided the design and operation and
eventually ensured the successful implementation of the call centre.
The workforce management process was approached by developing the aspects of forecasting,
staffing, and scheduling as separate models and integrating these models through the inputs they
required and the outputs they produced. Separately and collectively the results produced by the
models in the implementation in the case study call centre was adequate and accurate when
compared to the predicted performance and can be deemed successful. The model was however not
fully automated and in some aspects highly reliant on manual analysis. This had the effect that the
workforce management process was more time consuming and labour intensive. This is however an
aspect that can be addressed.
The forecasting model achieved and estimated accuracy of approximately 90% (or an error of
approximately 10%) which is a good result considering the volatile environment of the initial role out
and the fact that there was no previous call data to base the analysis on. The accuracy could, and
Chapter 12 - Conclusions and Recommendations 156
should, increase after the fully operational call centre has gone through a full business cycle making
more analysis possible.
The staffing model was developed through a simulation approach instead of the traditional analytic
approach. By using simulation modelling it is possible to model the necessary detail and dynamics of
the call centre much closer than traditional analytical models. The variability of the various parameters
could be included based on actual historical data and trends. A generic simulation package was used
and provided good results. The process was however time consuming and the optimisation of the
results could possibly be performed more efficiently by applying a dedicated optimisation algorithm.
The scheduling model was successfully developed and implemented. The scheduling of resources is
a topic that has been studied extensively and the development of the model was based almost entirely
on existing models that had been proven successful.
The performance management aspects were perhaps the most critical aspect in terms of ensuring the
success the call centre and eventually the project. Initial performance measures were based mainly
on the design and project objectives. Once the call centre became fully operational the measures had
to be revised and formulated into a formal management process. A high emphasis was placed on
performance measurement and management and the analysis data and results. This is essential in
order to gain insight into the parameters that drive the call centre performance. At times the
performance was extremely poor, but through the structured analysis process, the cause of problems
could in most instances be identified and corrective and preventative actions could be implemented.
The results obtained from implementing the model was adequate considering the highly volatile
environment of the initial role out of the project. The call centre was implemented successfully and at
the time of the hand over to the organisation it was operating as designed and intended and
performance targets were reached on a regular basis. As with any operation, things will not always
run smoothly, but this case a structured approach was put in place that enables the continuous
improvement of the call centre operations.
12.4 Recommendations and Future Research Most of the shortcomings of the research was discussed in the previous section and will be briefly
presented here.
The workforce management model proposed in the study was developed separately as a forecasting
model, staffing model, and scheduling model that were linked through the respective inputs and
outputs. The workforce management model therefore also relied heavily on manual data analysis and
execution. Although the model was successful in the implementation, a more automated model would
be ideal. This can be achieved by developing software that implements the proposed workforce
management model.

Chapter 12 - Conclusions and Recommendations 157
The performance measurement and management approach was also not fully automated. A large
amount of the call centre data could be extracted from a management information system that was
implemented as part of the project. In some cases however, a fair amount of manual analysis had to
be performed. By developing a dedicated database application to that integrates the data generated
by the call centre operations as well as the organisational data would be highly beneficial and would
greatly ease the analysis and management efforts. This aspect was addressed in the project but have
only partially been realised in the form of the management information system. Real time information
and analysis is also an aspects that was addresses but still has some shortcomings.
A few aspects have also been identified for further research in the general call centre field. These will
be discussed next.
The forecasting of the call centre workload is an aspect that still requires more intensive research
according to most references that cover this topic. Various advancements have been made in recent
years and most studies have produced good results. The sophistication of the techniques that have
been used varies greatly. One aspect that should particularly be addressed is the real time
forecasting and updating of forecasts. Forecasts are typically made weeks or days in advance and
the staffing and scheduling based on these forecasts. Often this updating can be problematic. Being
able to produce forecasts in real time, based on the current call volume and historical data, could
prove to be a valuable tool in adopting a proactive rather that a reactive approach to managing the
daily operations.
The use of simulation to solve the staffing problem is a very fruitful avenue for further research.
Various studies have been conducted recently with good results. These were however mostly based
on less complex environments. The complexity of this problem will continue to increase as more
products, channels, and technologies are introduced. This greatly affects the complexity of the
organisational design, workflow schemes, skill sets required, and various other aspects. Being able to
solve this problem in a timely and efficient manner through the use of simulation could be of great
significance. The staffing and scheduling problems could also possibly be solved together through the
use of simulation.
Statistical research in the analysis of call centre activities is also an area that has vast amount of
potential for further research. Most current analysis activities are still mainly based on the traditional
aspects that were developed for call centres that only process calls. The introduction of new
technologies and contact channels has opened the opportunity for scientific analysis.
Finally, various references have stated that a multi disciplinary approach to research in the call centre
environment should be considered. Call centres are prime examples of dynamic and complex
environments that require an extremely fine balance between the people, process, and technology
aspects.

References 158
References
Aksin, O.Z., Armony, M. & Mehrotra, V. (2007). The Modern Call-Centre: A Multi-Disciplinary
Perspective on Operations Management Research. Production and Operations Management,
forthcoming. Retrieved 10 September, 2007 from the World Wide Web:
http://portal.ku.edu.tr/~zaksin/research_pageku.htm.
Aksin, O.Z., Karaesmen, F. & Ormeci, E.L. (2007). A Review of Workforce Cross-Training in Call
Centres from an Operations Management Perspective. Workforce Cross Training Handbook, ed. D.
Nembhard, CRC Press.
Aldor-Noiman, S. (2006). Forecasting Demand for a Telephone Call Centre: Analysis of Desired
versus Attainable Precision. Research Thesis. Technion – Israel Institute of Technology.
Anton, J., Bapat, V. & Hall, B. (1999). Call Centre Performance Enhancement using Simulation and
Modelling. Ichor business books, Purdue University Press, USA.
Arivia.kom. (2006). Virtual Contact Centre Solution. Retrieved 5 March, 2006 from the World Wide
Web: http://www.arivia.co.za/main/ser_sol/316565%20VCC.pdf.
Aykin, T. (1996). Optimal Shift Scheduling with Multiple Break Windows. Management Science, Vol.
42, Issue 4, pp. 591-602.
Bailer, C. (2006). Contact Centres: Model Maturity. CRM Magazine, Vol. 10, Issue 8, pp. 13-13.
Banks, J. (1998). The Handbook of Simulation: Principles, Methodology, Advances, Applications,
and Practice. John Wiley & Sons, New York.
Bartnett, G. (2006, June). The Contact Centre Industry: Where We’ve Been and Where We’re Going
Next. Customer Inter@ction Solutions. Retrieved January 10, 2007 from the World Wide Web:
http://www.allbusiness.com/marketing_advertising/3583203-1.html.
Bhulai, S., Koole, G. & Pot, A. (2007). Simple Methods for Shift Scheduling in Multi-Skill Call
Centres. To appear in Manufacturing & Service Operations Management. Retrieved 1 June, 2007
from the World Wide Web: http://www.math.vu.nl/obp/callcentres/.
Bocij, P., Chaffey, D., Greasly, A. & Hickie, S. (1999). Business Information Systems –
Technology, Development, and Management. Pearson Education Limited.
Bocklund, L. & Bengtson, D. (2002). Call Centre Technology Demystified. Call Centre Press ICMI,
Maryland.
Brown, L., Gans, N., Mandelbaum, A., Sakov, A., Zetlyn, S., Zhao, L. & Haipeng, S. (2005).
Statistical Analysis of a Telephone Call Centre: A Queuing Science Perspective. Journal of the
American Statistical Association, Vol. 100, No. 469, pp. 36-50.

References 159
Brusco, M.J. & Jacobs, L.W. (2000). Optimal Models for Meal-Break and Start-Time Flexibility in
Continuous Tour Scheduling. Management Science, Vol. 46, Issue 12, pp. 1630-1640.
Buffa, E. S., Cosgrove, M. J. & Luce, B. J. (1976). An integrated Work Shift Scheduling System.
Decision Sciences. American Institute for Decision Sciences. Volume 7 Issue 4. pp. 620-630.
Chase, R.B., Jacobs, F.R. & Aquilano, N.J. (2004). Operations Management for Competitive
Advantage. Tenth Edition. McGraw-Hill/Irwin.
Cleveland, B. & Minnucci, J. (2004). The Changing Face of Workforce Management. Incoming
Calls Management Institute (ICMI). Retrieved 6 September, 2007 from the World Wide Web:
http://www.connectionsmagazine.com/articles/4/053.html.
Cokins, G. (2004). Performance Management – Finding the Missing Pieces to Close the
Performance Gap. John Wiley & Sons, Inc., Hoboken, New Jersey.
Contact Centre Professionals. (2006). Retrieved 1 June, 2006 from the World Wide Web:
http://www.contactcentrepro.com/call_centre_design.htm.
Dantzig, G.B. (1954). A Comment on “Edie’s Traffic Delays at Toll Booths”. Operations Research 2
(1954), No. 3, pp. 339-341.
Dawson, K. (2004). The Call Centre Handbook. CMP Books, San Francisco, USA.
Du Preez, N. & Mostert, M. (2006). Workforce Scheduling in a Small Call Centre. Unpublished
article. Global Competitive Centre, Department of Industrial Engineering, Stellenbosch University.
Fukunaga, A., Hamilton, E, Fama, J., Andre, D., Matan, O., Nourbakhsh, I. (2002). Staff
Scheduling for Inbound Call Centres and Customer Contact Centres. AI Magazine Volume 32, Issue
4, pp. 30-40.
Gans, N., Koole, G. & Mandelbaum, A. (2003). Telephone Call Centres: Tutorial, Review, and
Research Prospects. Manufacturing & Service Operations Management, Vol. 5, No. 2.
Garnet, O., Mandelbaum, A., & Reiman, M. (2002). Designing a Call Centre with Impatient
Customers. Manufacturing & Service Operations Management. Vol. 4, No. 3, pp. 208-227.
Genesys Telecommunications Laboratories. (2006). Contact Centre Capability Maturity Model
.Retrieved 18 August, 2007 from the World Wide Web: http://www.genesyslab.com/.
Hanke, J.E. & Wichern, D.W. (2005). Business Forecasting. (Eighth Edition). Pearson Education
International, New Jersey.
Harris, S. (2007). A Primer on Call Centre Staffing Methods. Retrieved 8 June, 2007 from the World
Wide Web: http://www.inround.com/articles/primerstaffing.htm.

References 160
Hoover, S.V. & Perry, R.F. (1989). Simulation: A Problem Solving Approach. Addison-Wesley
publishing company.
Indutech Pty Ltd, Stellenbosch. Retrieved 5 June, 2007 from the World Wide Web:
http://www.indutech.co.za.
Ingolfsson, A., Cabral, E. & Wu, X. (2007). Combining Integer Programming and the
Randomization Methods to Schedule Employees. Technical report, School of Business, University of
Alberta, Edmonton, Alberta, Canada. (Submitted to Manufacturing & Service Operations
Management).
Kaplan, R.S. & Norton, D.P. (1992). The Balanced Scorecard – Measures that Drive Performance.
Harvard Business Review. Volume January-February. pp. 1-79.
Katz, B. (2007). The integration of Project Management Processes with a Methodology to Manage a
Radical Innovation Project. Master’s Thesis. Stellenbosch: University of Stellenbosch.
Klenke, M. & Trickey, P. (2002). Super balance. Operations & Fulfillment. Retrieved 1 August,
2007 from the World Wide Web: http://multichannelmerchant.com/opsandfulfillment_super_balance/.
Klenke, M.K. (2006 a). Blueprint for Call Centre Success: Building an Effective Organisational
Structure and Team Environment. Retrieved 1 November, 2007 from the World Wide Web:
http://www.thecallcentreschool.com/tools/articles_detail.aspx?iid=501&tid=6.
Klenke, M.K. (2006 b). Calculating a Service Level Goal. Retrieved 14 September, 2007 from the
World Wide Web: http://www.thecallcentreschool.com/tools/articles_detail.aspx?iid=513&tid=6.
Klenke, M.K. (2007). Is Skill-Based Routing Right for Your Call Centre? Retrieved 5 July, 2007 from
the World Wide Web: http://www.thecallcentreschool.com/aboutus/news_story.aspx?iid=520&tid=6.
Klungle, R. (1997). The Role of Simulation in Call Centre Management. Proceedings of the 1997
MSUG Conference.
Koole, G. (2007). Call Centre Mathematics – A Scientific Method for Understanding and Improving
Contact Centres. Retrieved 10 June 2007 from the World Wide Web:
http://www.math.vu.nl/~koole/ccmath/.
Koole, G. & Mandelbaum, A. (2002). Queueing Models of Call Centres: An Introduction. Abridged
Version. Annals of Operations Research 113: 41-49.
Law, A.M., Kelton, W.D. (2000). Simulation and Modelling Analysis. Third Edition. McGraw-Hill,
Inc., USA.
Lewis, P.A.W. & Shedler, G.S. (1979). Simulation of Nonhomogeneous Poisson Process by
Thinning. Naval Res. Logist. Quart., 26: 403-413.
References 161
Mehrotra, V. (1997). Ringing up big business. Operations Research Management Science Today.
Vol. 24, No. 4, pp. 18-24.
Mehrotra, V. & Fama, J. (2003). Call Centre Simulation Modelling: Methods, Challenges, and
Opportunities. Proceedings of the 2003 Winter Simulation Conference. Volume 1, Issue 7-10 Dec.
pp. 135-143.
Mehrotra, V., Profozich, D. & Bapat, V. (1997). Simulation: The Best Way to Design Your Call
Centre. Telemarketing and Call Centre Solutions. Retrieved January 15, 2007 from the World Wide
Web: http://findarticles.com/p/articles/mi_qa3700/is_199711/ai_n8778658.
Merchants & Dimension Data. (2005). Global Contact Centre Benchmarking Report. 2005
Summary. Retrieved 15 January, 2006 from the World Wide Web:
http://www.synovate.com/knowledge/publications/benchmarking/doc/Global%20Contact%20Centre%2
0Benchmarking%20report%20-%20Summary%20report.pdf.
Merchants & Dimension Data. (2007). Global Contact Centre Benchmarking Report 2007
Summary. Retrieved 5 November, 2007 from the World Wide Web: http://www.ccbenchmarking.com.
Niven, P.R. (2002). Balanced Scorecard Step by Step: Maximizing Performance and Maintaining
Results. John Wiley & Sons, Inc., New York.
Niven, P.R. (2005). Balanced Scorecard Diagnostics: Maintaining Maximum Performance. John
Wiley & Sons, Inc., Hoboken, New Jersey.
O’Brien, J.A. & Marakas, G.M. (2006). Management Information Systems. Seventh Edition.
McGraw-Hill/Irwin.
Prosci. (2004 a). Call Centre Measurement (Volume 1) – How to Measure and Improve Call Centre
Performance. Prosci Business Performance Series. Learning Centre Publications.
Prosci. (2004 b). Call Centre Planning and Design Toolkit – A Blueprint for Building a Successful
Contact Centre. Prosci Business Perfromance Series. Learning Centre Publications.
Reynolds, P. (2003, March). The Math of Call Centre Staffing. Retrieved 1 October, 2007 from the
World Wide Web: http://thecallcentreschool.com/tools/articles_detail.aspx?iid=477&tid=6.
Reynolds, P. (2005). Forecasting Fundamentals: The Art and Science of Predicting Call Centre
Workload. Retrieved 6 November, 2007 from the World Wide Web:
http://www.tmcnet.com/channels/workforce-optimization/workforce-optimization-articles/forecasting-
call-centre-workload.htm.
Reynolds, P. (2006). Automating Workforce Management: A Guide to Acquisition and
Implementation. Retrieved 20 January, 2007 from the World Wide Web:
http://www.thecallcentreschool.com/tools/articles_detail.aspx?iid=474&tid=6.
References 162
Sanderson, C. & Gruen, R. (2006). Analytical Models for Decision Making. Maidenhead, Open
University Press.
Shen, H. & Huang, J. Z. (2005 a). Analysis of Call Centre Arrival Data using Singular Value
Decomposition. Applied stochastic models in business and industry. Volume 21, Issue 3, pp. 251-
263.
Shen, H., Huang, J. Z. (2005 b). Forecasting Arrivals to a Telephone Call Centre. (05-05).
Technical Report. Retrieved 5 June, 2007 from the World Wide Web: https://stat-
or.unc.edu/research/tech_reports.
Tanner, M. (2004). The Erlang-C Formula. Mitan Ltd. Retrieved 1 August, 2007 from the World
Wide Web: http://www.mitan.co.uk/mainerlg_intr.htm.
Taylor, J.W. (2007). A Comparison of Univariate Time Series Methods for Forecasting Intraday
Arrivals at a Call Centre. Said Business School, University of Oxford. Fortcoming in focus issue of
Management Science on Call Centre Management.
Thompson, G. (1995). Improved Implicit Optimal Modeling of the Labor Shift Scheduling Problem.
Management Science. Vol. 41, No. 4, pp. 595-607.
Wade, D. & Recardo, R. (2001). Corporate Performance Management – How to Build a Better
Organisation through Measurement-Driven Strategic Alignment. Butterworth-Heinemann, Boston.
Wallis, J. What is Information? (1996). .University of Wolverhampton. Retrieved 1 February, 2008
from the World Wide Web:
http://www.scit.wlv.ac.uk/university/scit/modules/cp4414/lectures/week1/businfo1/index.htm.
Whit, W. (2003). How Multiserver Queues Scale with Growing Congestion-Dependant Demand.
Operations Research, Vol. 51, No. 4, pp. 531-542.
Winston, W. (2004). Operations Research: Applications and Algorithms. (Fourth Edition). Indiana
University.

Appendix A Page I
Appendix A Winter’s Method

Appendix A Page II
Winter’s Method – Exponential Smoothing Adjusted for Trend and Seasonal Variation
Winter’s method is used to forecast time series for which trend and seasonality are present. Hanke &
Wichern (2005) refer to this method as Winter’s multiplicative method which implies that it is a
multiplicative model.
The four equations used in Winter’s (multiplicative) smoothing are:
1. The exponentially smoothed series or level estimate:
))(1( 11 −−−
+−+= ttst
tt TL
SYL αα
2. The trend estimate:
11 )1()( −− −+−= tttt TLLT ββ
3. The seasonality estimate:
stt
tt S
LYS −−+= )1( γγ
4. Forecast p periods into the future:
pstttpt SpTLf +−+= )(,
Where
α = smoothing constant for the level
β = smoothing constant for trend estimate
γ = smoothing constant for seasonality estimate
s = length of seasonality (12 for monthly data)
Initialisation of Winter’s Method
To initialise the algorithm the initial values for the smoothed series tL , the trend tT , and the seasonal
indices tS must be set. The weights α, β, and γ also have to be determined.
Various approaches for this initialisation have been developed. One approach that is mentioned in
Hanke & Wichern (2005) is to set the first estimate of the smoothed series level equal to the first

Appendix A Page III
observation. The trend is then estimated to equal zero and the seasonal indices are each set to 1.
Another approach is discussed in Winston (2004) that requires two years of data and calculates
estimates for the parameters from the data.
The weights α, β, and γ can be selected subjectively or by minimising a measure of forecast error such
as MSE or MAD. The most common approach for determining these values is to use an optimisation
algorithm to find the optimal smoothing constants (Hanke & Wichern, 2005).

Appendix B Page IV
Appendix B Erlang Calculations

Appendix B Page V
The Erlang-C formula
The Erlang C formula (with workload in Erlangs as input)
∑ −
= −+
−=1
0 !!
!N
i
Ni
N
W
ANN
NA
iA
ANN
NA
P
Where
A is the total traffic offered in units of Erlangs
N is number of servers
WP is the probability that a customer has to wait for service
Erlang-C Calculations
This section is adapted from the explanation provided by Tanner (2004).
The Erlang-C calculations are described step by step below, using an example of 360 calls per half
hour, with an average call duration of 4 minutes, and 55 agents. The target answer time for service
level is 15 seconds.
Specify Call Arrival Rate
The first parameter needed is the average customer arrival rate. It doesn’t matter what time unit is
used to specify the arrival rate, as long as the same time unit is used for the average call duration.
sec/2.0sec/1800
/360
callshourhalfhourhalfcallsratearrivalaverage
=
=
=λ
Specify call duration
The second factor to be specified is the average call duration. This must be expressed in the same
time unit used for the call arrival rate.
ondsutes
durationcallaverageTs
sec240min4
==
=

Appendix B Page VI
Specify number of agents
The third factor is the number of agents available.
agentsagentsofnumberm
55==
Calculate traffic intensity
The term “traffic intensity” comes from the original application of Erlang-C, which was for telephone
networks, and the volume of calls was described as the “traffic”. The traffic intensity needs to be
calculated as a preliminary step.
u = traffic intensity = sTλ
( )( )48
sec/240sec/2.0== callcalls
Calculate agent occupancy
The agent occupancy, or utilisation, is now calculated by dividing the traffic intensity by the number of
agents. The agent occupancy will be between 0 and 1. If it is not less than 1 then the agents are
overloaded and the calculation is not valid.
%3.87873.05548
or
muoccupancyagent
=
=
==ρ
Calculate the Erlang-C formula
Now the main Erlang-C formula can be calculated. The value of ( )umEC , is needed to calculate the
answers.
( )( )
239.0!
1!
!,1
0
=
−+=
∑−
=
m
k
km
m
C
ku
mu
mu
umEρ
Calculate the probability that a Call Waits

Appendix B Page VII
( )umEC , is the probability that a call is not answered immediately, and has to wait. This is a
probability between 0 and 1.
( ) ( ) %9.23239.0,Pr orumEwaittohascall C ==
Calculate Average Speed of Answer
Having calculated ( )umEC , it is quite easy to calculate the average waiting time for a call, which is
often referred to as the Average Speed of Answer or ASA.
( )( )
( )sec2.8
873.0155240239.0
1,
=−××
=
−=
==
ρmTumE
ASAtimewaitingaverageT
sC
W
Calculate Service Level
To calculate the probability that a call will be answered in less than a target waiting time, the formula
below is used. The formula provides a probability between 0 and 1. With a target waiting time ( t ) of
15 seconds, the calculation is performed as follows.
( ) ( )
( )( )
%6.84846.0,1
Pr
oreumE
ttimeWaitingtW
sTt
um
C
=−=
≤=
−−
Calculate agents needed
If the service level is specified and the number of agents needed has to be calculated, then it can be
done by using a trial and error approach. The number of agents has to be found that will just achieve
the specified service level.
Performing the Calculation in a Spreadsheet
This section is adapted from the explanation provided by Tanner (2004).
The key to performing the Erlang-C calculations in a spreadsheet is to use the Poisson function, which
is provided in Excel. The details of the Poisson function and how it is used are explained below,
together with instructions for a spreadsheet implementation.

Appendix B Page VIII
The Poisson Function
The Poisson function is provided in Excel and is defined as
( ) ( ) ∑=
−−
==m
k
kumu
kuetrueumPoissonor
muefalseumPoisson
0 !,,
!,,
The Erlang-C Function Using the Poisson Function
The definition of the Erlang-C function is
( )( )∑
−
=
−+=
1
0 !1
!
!,m
k
km
m
c
ku
mu
mu
umEρ
Multiplying the numerator and denominator by ue− we get
( )( ) ∑
−
=
−−
−
−+=
1
0 !1
!
!,m
k
ku
mu
mu
c
kue
mue
mue
umEρ
The above formula for Erlang-C can be rewritten using the Poisson function as
( )( ) ( ) ( )trueumPoissonfalseumPoisson
falseumPoissonEc ,,11,,,,
−−+=
ρ
ASA or Waiting Time Calculation
Once the Erlang-C function has been cancelled, the formula for the ASA, or average wait, is
straightforward.
( )( )ρ−=1
,m
TumEASA sc
Service Level Calculations
The service level can also be calculated fairly straightforwardly, making use of the EXP function. The
formula for service level is given here
( ) ( )( )
sTt
um
c eumEttimewaiting−−
−=≤ ,1Pr
Appendix C Page IX
Appendix C Performance Management Scorecard
Example
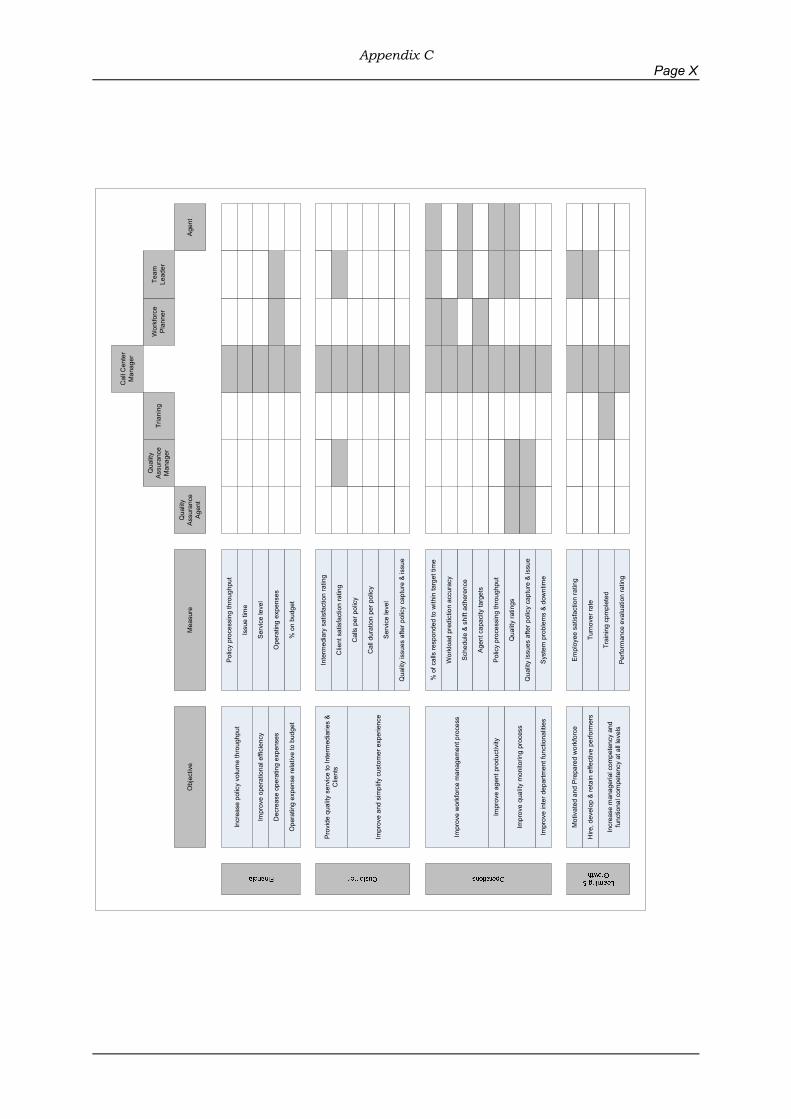
Appendix C Page X
Mot
ivat
ed a
nd P
repa
red
wor
kfor
ce
Incr
ease
man
ager
ial c
ompe
tenc
y an
d fu
nctio
nal c
ompe
tenc
y at
all
leve
ls
Dec
reas
e op
erat
ing
expe
nses
Impr
ove
oper
atio
nal e
ffici
ency
Incr
ease
pol
icy
volu
me
thro
ughp
ut
Prov
ide
qual
ity s
ervi
ce to
Inte
rmed
iarie
s &
Clie
nts
Impr
ove
and
sim
plify
cus
tom
er e
xper
ienc
e
Impr
ove
wor
kfor
ce m
anag
emen
t pro
cess
Impr
ove
qual
ity m
onito
ring
proc
ess
Impr
ove
inte
r dep
artm
ent f
unct
iona
litie
s
Hire
, dev
elop
& re
tain
effe
ctiv
e pe
rform
ers
Ope
ratin
g ex
pens
e re
lativ
e to
bud
get
Pol
icy
proc
essi
ng th
roug
hput
Obj
ectiv
eM
easu
re
% o
n bu
dget
Inte
rmed
iary
sat
isfa
ctio
n ra
ting
Clie
nt s
atis
fact
ion
ratin
g
Cal
l dur
atio
n pe
r pol
icy
Cal
ls p
er p
olic
y
Em
ploy
ee s
atis
fact
ion
ratin
g
Turn
over
rate
Trai
ning
cpm
plet
ed
Qua
lity
ratin
gs
Sche
dule
& s
hift
adhe
renc
e
% o
f cal
ls re
spon
ded
to w
ithin
targ
et ti
me
Ser
vice
leve
l
Ope
ratin
g ex
pens
es
Impr
ove
agen
t pro
duct
ivity
Pol
icy
proc
essi
ng th
roug
hput
Wor
kloa
d pr
edic
tion
accu
racy
Sys
tem
pro
blem
s &
dow
ntim
e
Ser
vice
leve
l
Qua
lity
issu
es a
fter p
olic
y ca
ptur
e &
issu
e
Age
nt c
apac
ity ta
rget
s
Issu
e tim
e
Qua
lity
issu
es a
fter p
olic
y ca
ptur
e &
issu
e
Perfo
rman
ce e
valu
atio
n ra
ting
Qua
lity
Assu
ranc
e Ag
ent
Qua
lity
Assu
ranc
e M
anag
erTr
iani
ng
Cal
l Cen
ter
Man
ager
Wor
kfor
ce
Plan
ner
Team
Le
ader
Age
nt

Appendix D Page XI
Appendix D Performance Measurement and Analysis
Example
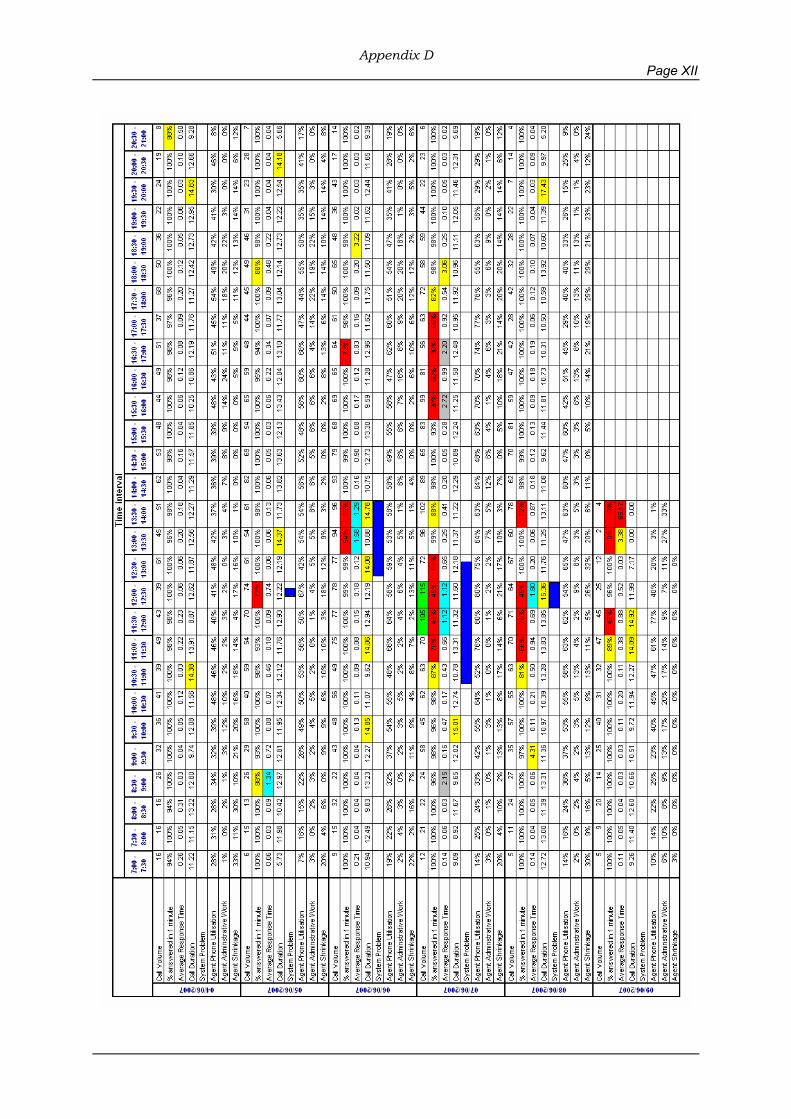
Appendix D Page XII


![SK9822 REV.01 EN [兼容模张] · 2016. 3. 18. · 3/ 12 SK9822 SK9822: The default is RGB chips with IC integration 6. General Information](https://img.pdfslide.us/doc/110x75/60c8dd7214333e138a661027/sk9822-rev01-en-fafff-2016-3-18.jpg)