Embed Size (px)
DESCRIPTION
California Water Issues. AGST 3000 Agriculture, Society and the Natural World “Whiskey’s for drinkin’ and water’s for fighting for….” Mark Twain. California’s Major Water Users:. Agriculture – irrigated farm land, a huge economic engine for the state. - PowerPoint PPT Presentation
Citation preview

California Water IssuesCalifornia Water Issues
AGST 3000AGST 3000Agriculture, Society and the Natural WorldAgriculture, Society and the Natural World
““Whiskey’s for drinkin’ and water’s for Whiskey’s for drinkin’ and water’s for fighting for….”fighting for….”Mark TwainMark Twain

California’s Major Water Users:
Agriculture – irrigated farm land, a huge economic engine for the state.
Environment – fish and other wild life have specific water requirements.
Families – human factor, showers, dishes, swimming pools and golf courses.
Manufacturing – processing, cooling produce jobs for the state which generate a tax base.

Water TerminologyWater Terminology
Acre-foot Acre-foot
An acre-foot equals the amount of water needed An acre-foot equals the amount of water needed to cover an acre of land to the depth of one foot to cover an acre of land to the depth of one foot (326,000 gallons) and is approximately the amount (326,000 gallons) and is approximately the amount of water used by an average family of four during of water used by an average family of four during one year.one year.
OverdraftOverdraft
The deficit between pumped water from a The deficit between pumped water from a groundwater basin and the long-term groundwater basin and the long-term recharge.recharge.

California’s Tug of WaterCalifornia’s Tug of Water
Geologic TugsGeologic Tugs
Geologic Tug #1:Geologic Tug #1: The North 75%– 25% South The North 75%– 25% South precipitation distribution circumstanceprecipitation distribution circumstance
Geologic Tug #2:Geologic Tug #2: The Coast Range and Sierra Nevada The Coast Range and Sierra Nevada Mountains rain shadow effectsMountains rain shadow effects
Geologic Tug #3:Geologic Tug #3: The Drought/Flood cycles – El Nino and The Drought/Flood cycles – El Nino and La NinaLa Nina
Geologic Tug #4:Geologic Tug #4: Calif. is the number 1 ground water Calif. is the number 1 ground water using state, but has little regulationusing state, but has little regulation

California’s Tug of WaterCalifornia’s Tug of Water
Water Use TugsWater Use Tugs
Water Use Tug #1Water Use Tug #1: : 80% of water demand occurs south 80% of water demand occurs south of Sacramento North versus Southof Sacramento North versus South
Water Use Tug #2Water Use Tug #2: : There is also an East versus West There is also an East versus West use conflict use conflict
Water Use Tug #3Water Use Tug #3: : Water demand is highest in the Water demand is highest in the summer when availability is lowestsummer when availability is lowest
Water Use Tug #4:Water Use Tug #4: Environmental water use conflicts Environmental water use conflicts with agriculture, urban need.with agriculture, urban need.
Water Use Tug #5:Water Use Tug #5: Agriculture versus Urban use: who Agriculture versus Urban use: who gets how much and when, etc.?gets how much and when, etc.?
Water Use Tug #6:Water Use Tug #6: What are the water rights for various What are the water rights for various interest groups in the future?interest groups in the future?

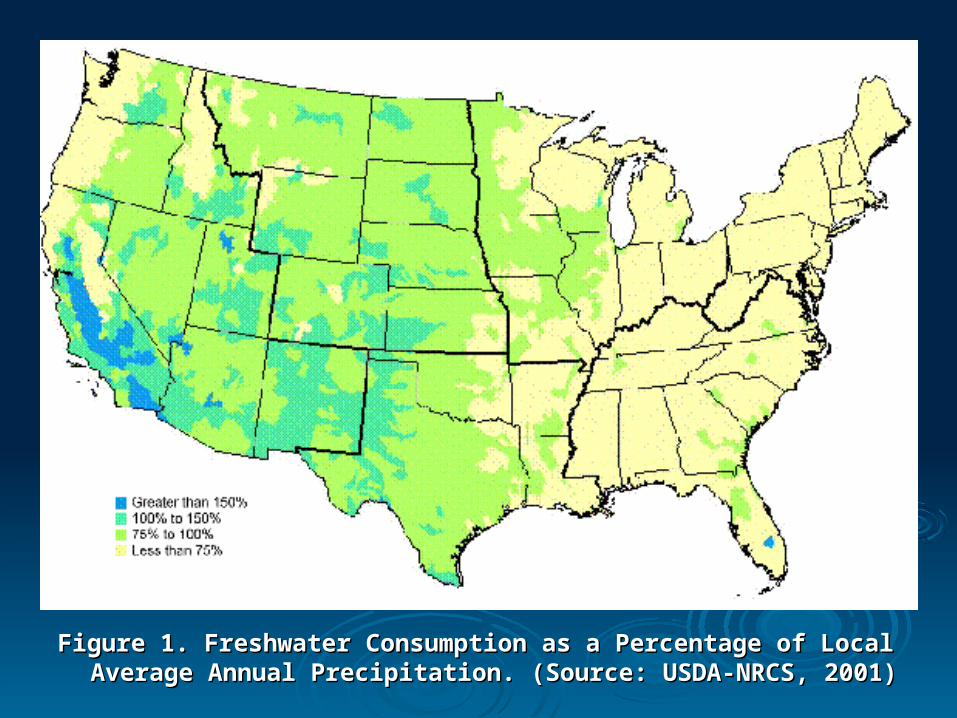
Figure 1. Freshwater Consumption as a Percentage of Local Figure 1. Freshwater Consumption as a Percentage of Local Average Annual Precipitation. (Source: USDA-NRCS, 2001) Average Annual Precipitation. (Source: USDA-NRCS, 2001)

California’s Water SupplyCalifornia’s Water SupplyCalifornia’s ground waterCalifornia’s ground water
California’s groundwater basins store about 850 million California’s groundwater basins store about 850 million acre-feet of water. (Less than 50% is unavailable for use acre-feet of water. (Less than 50% is unavailable for use due to depth of water table.)due to depth of water table.)
For long term sustainability, groundwater cannot be For long term sustainability, groundwater cannot be removed that will not be replenished.removed that will not be replenished.
15 million acre-feet of groundwater is pumped each year.15 million acre-feet of groundwater is pumped each year. 20% of the state’s water requirements are met with pumped 20% of the state’s water requirements are met with pumped
groundwater.groundwater.
CA is operating on a CA is operating on a 1.3 million acre-foot overdraft.1.3 million acre-foot overdraft.
CA groundwater is recharged by:CA groundwater is recharged by: 1) Nature – rain & snow (7 million acre-foot annually)1) Nature – rain & snow (7 million acre-foot annually) 2) After usage – agriculture & industry 2) After usage – agriculture & industry (6.65 million acre-feet /yr.)(6.65 million acre-feet /yr.) 3) Recharge programs – Los Angeles municipal water3) Recharge programs – Los Angeles municipal water

California’s surface waterCalifornia’s surface water
Comes from an average annual statewide Comes from an average annual statewide precipitation of almost 24 inches. precipitation of almost 24 inches. (Ranging from (Ranging from almost nothing in the deserts to more than 100 inches in the almost nothing in the deserts to more than 100 inches in the northern mountains)northern mountains)
Sixty percent of the precipitation is evaporated Sixty percent of the precipitation is evaporated or transpired by trees and vegetation. or transpired by trees and vegetation. The remaining forty percent equals about 71 million The remaining forty percent equals about 71 million
acre-feet of stream flow (in an average rainfall year).acre-feet of stream flow (in an average rainfall year).
Colorado River flows diverted to California Colorado River flows diverted to California supply 4.8 million acre-feet.supply 4.8 million acre-feet.

California’s surface water continued…California’s surface water continued…
Inflow streams from Oregon add an addition 1.4 Inflow streams from Oregon add an addition 1.4 million acre-feet.million acre-feet.
This means in an average year California has This means in an average year California has available slightly more than 78 million acre-feet available slightly more than 78 million acre-feet of water.of water.
However, not all of this water can be collected However, not all of this water can be collected for use for use (almost 29 million acre-feet occurs in the north coast (almost 29 million acre-feet occurs in the north coast region alone and much of it is unavailable for use).region alone and much of it is unavailable for use).

Agriculture’s Water Use:Agriculture’s Water Use:
80% of developed supply (reservoir storage, 80% of developed supply (reservoir storage, irrigation districts, state and federal water projects)irrigation districts, state and federal water projects)
28-35 million acre-feet depending on yearly rainfall28-35 million acre-feet depending on yearly rainfall
Irrigated acres Irrigated acres 20022002-8,709,353-8,709,353 19971997-8,886,693-8,886,693
Irrigated acreage is declining due to urban growth Irrigated acreage is declining due to urban growth and water cut backs by federal/state projects.and water cut backs by federal/state projects.
A large percentage of agriculture water percolates A large percentage of agriculture water percolates back into ground or streams back into ground or streams (around 5 million acre-feet (around 5 million acre-feet contributes to re-charge)contributes to re-charge)
Urban and Environmental Water UseUrban and Environmental Water Use
CA CA urbanurban use is about 7.8 million acre-feet. use is about 7.8 million acre-feet. One acre of houses uses approximately the same One acre of houses uses approximately the same
amount of water as an acre of agriculture crops amount of water as an acre of agriculture crops (what happens to this water?)(what happens to this water?)
26 million acre-feet is diverted to 26 million acre-feet is diverted to environmentalenvironmental uses during normal years less in drought years)uses during normal years less in drought years) 9.56 million acre-feet for the Delta9.56 million acre-feet for the Delta 17.8 for wild and scenic river flows17.8 for wild and scenic river flows This amount is expected to increaseThis amount is expected to increase

Regional Water UseRegional Water Use
Central ValleyCentral Valley 19 million acre-feet19 million acre-feet
Sacramento River Sacramento River 11.7 million acre-feet11.7 million acre-feet
South Coast South Coast 4.6 million acre-feet4.6 million acre-feet
Colorado River Colorado River 4 million acre-feet4 million acre-feet

Groundwater supply initially huge
Maybe as much as 750,000,000 acre feet accumulated over thousands of years
Efficient pumps developed around 1920
Irrigated acreage rapidly expanded several fold
Groundwater levels began to drop precipitously “subsidence” ground is actually sinking.

IRRIGATION
A. Definition: Supplying water to plants in an artificial manner. (39% of all freshwater in the US is used to irrigate crops)
1. Ancient practice – first irrigation used ditches to divert rivers and streams.
2. California agriculture relies on irrigation.
a. Mediterranean climateb. Crop diversificationc. Economics
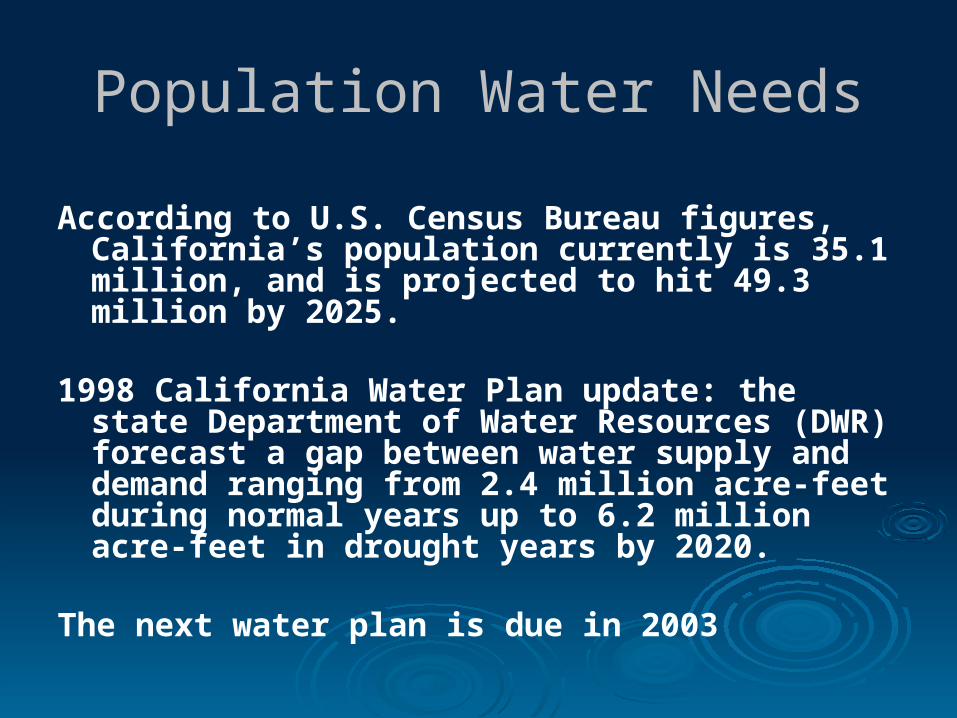
Population Water Needs
According to U.S. Census Bureau figures, California’s population currently is 35.1 million, and is projected to hit 49.3 million by 2025.
1998 California Water Plan update: the state Department of Water Resources (DWR) forecast a gap between water supply and demand ranging from 2.4 million acre-feet during normal years up to 6.2 million acre-feet in drought years by 2020.
The next water plan is due in 2003
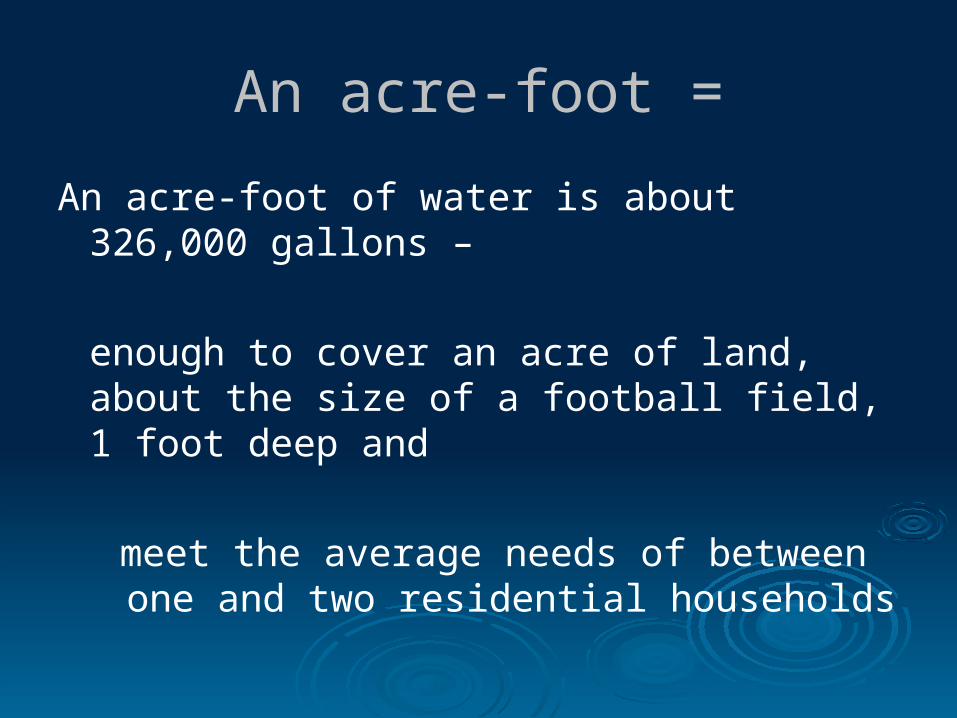
An acre-foot =
An acre-foot of water is about 326,000 gallons –
enough to cover an acre of land, about the size of a football field, 1 foot deep and
meet the average needs of between one and two residential households

Sources of Water
Rain and Snow replenishes the surface water and underground aquifers
Ground Water (aquifers)
Surface Water (rivers, lakes, reservoirs)

Sources of Surface Water
California, there are two major arteries serving as the sources of surface water for urban and agricultural areas:
The Sacramento-San Joaquin Delta (Bay-Delta) and
The Colorado River

The Delta
Delta serves as a major water source for approximately two-thirds of the state – over 22 million people
The region is fed by two major rivers: the Sacramento from the north and the San Joaquin from the south

The Delta
Mixture of fresh water from these two waterways and numerous tributaries combine with salty ocean water from San Francisco Bay to create the largest estuary on the West Coast of North America - The San Joaquin Delta.
Massive pumps at the southern end of this marsh pull approximately 5.5 million acre-feet annually of fresh water southward to Central Valley farmland via the Central Valley Project and ultimately, to the southern California region via the State Water Project.

Federal Central Valley Project
FDR and U.S. Reclamation Service looking for projects, took over CVP in 1935, began construction in 1937
Eventually completed in 1950’s
Final cost more than $500 million
Distributes more than 3,000,000 acre feet of water
Almost all used for agriculture
No connections to Southern California initially

The Colorado River Colorado River winds its way through the southwestern United
States before terminating in the Gulf of California in Mexico.
Provides water to seven states including California, with each state's water use determined by the Colorado River Compact of 1922.
California permitted to use 4.4 million acre-feet annually.
For over a decade, California has been using well beyond the 1922 allotment.
As water conditions have tightened in several of the other states, the secretary of the Interior has demanded that California reduce its use of the Colorado River - a major challenge to river water users.

Flood – Explainused in almonds, peaches, walnuts, rice, alfalfa
Basic Types of Irrigation

Flood in the West, Border in the East

Flood Irrigation continued…
Advantages:
• inexpensive• less labor• large amounts of water leach salts
•rodent control

Flood Irrigation continued…
Disadvantages:
land must be leveled or contoured uses large amounts of water water loss through evaporation may cause disease in some crops if applied
incorrectly run off water can cause problems (silt buildup
in rivers, may contain pesticides)

Furrow Irrigation
Used in row crops such as beans, tomatoes, corn, sugar beets other vegetable crops.
Similar advantages and disadvantages to flood irrigation.

Furrow Irrigation

Sprinkler Irrigation
Many types micro-sprinklers, solid set, aluminum pipe
a. Advantages: use less water, more precise amounts of water can be applied, less run off (tail water), may be used on slightly hilly land
b. Disadvantages: expensive (installation, labor, filters, maintenance), salt buildup


Better spray version of center pivot for water conservaton
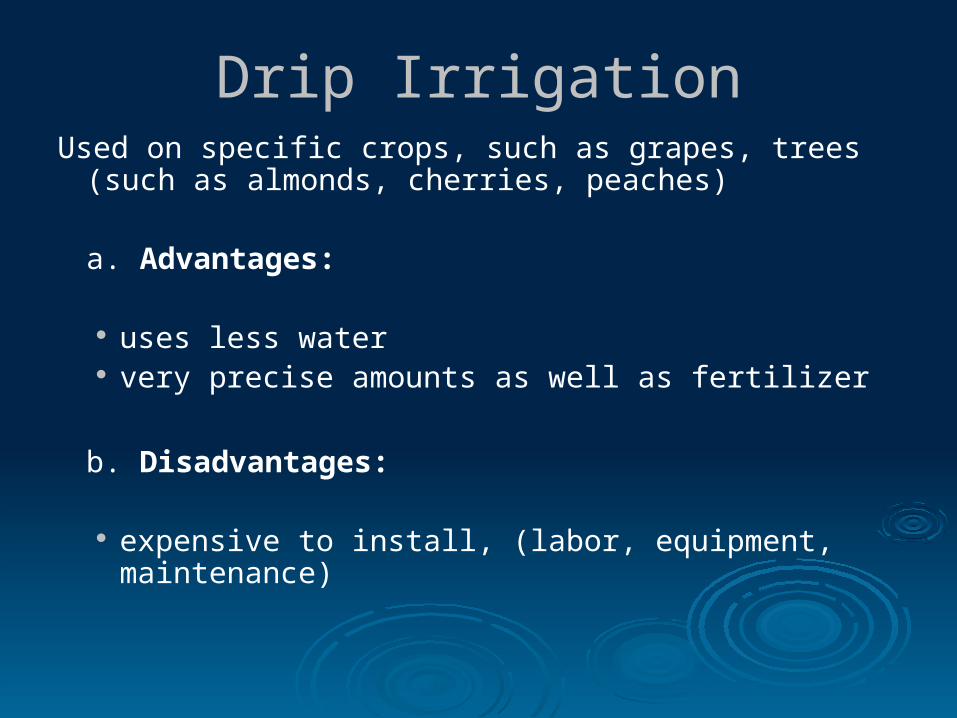
Drip IrrigationUsed on specific crops, such as grapes, trees (such as
almonds, cherries, peaches)
a. Advantages:
uses less water very precise amounts as well as fertilizer
b. Disadvantages:
expensive to install, (labor, equipment, maintenance)

Drip Irrigation

Subsurface Irrigation

Questions on Irrigation:
1. Where does irrigation water come from?
a. Wells – underground aquifersb. River – “Riparian rights” or water
rightsc. Irrigation Districts – provide water
from large water sources, lakes, reservoirs (dams)

What are concerns people have over the use of irrigation in agriculture?
a. Overdraft of underground water supplies (aquifers).
b. Water pollution – silt, herbicides, pesticides added to irrigation water runs off into lakes, rivers, etc.
c. Concerns over water waste – flood irrigation uses a lot of water
d. Production of crops in California that are not water efficient – alfalfa and cotton.

How has agriculture addressed the public’s concerns over water usage?
a. The #1 water user in California is ___________________________.
(set the record straight)
*California and Texas are the only 2 states that do not have regulations on groundwater pumping.


Water Problems
Erosion
Pollution
Waste

Erosion
Power of a droplet of water striking the soil surface
Moves tons of soil
Runs off to rivers and streams (siltation)
Tons of soil lost

PollutionWhat types of water pollution?
Underground water supplies…
Surface runoff (erosion and contamination from crop and animal activities)
Soil water (salts) Pre-ag existance Ag production induced

Water Pollution Mitigation
A couple of Answers
Total containment of runoff or drainage from intensive animal facilities…lagoons
soil polymers – adhere to water particles preventing their runoff
use of IPM and GMO’s (reduce the need for chemicals)

Water Waste
Caused by evaporation, infiltration, runoff
Flood irrigation is the largest waste of water
Drip and micro sprinkler use
Cost/economics – as the price of water increases, farmers can afford to use less and must become more efficient.

Economics Driven Politics
For specific types of Agriculture production…
Special Treatment, Government Subsidies and Corporate Welfare
Water Projects Non-point source pollution in the past Subsidies from government that
encourage production of high water use commodities (Cotton and Milk)