Embed Size (px)
Citation preview

The California Water Crisis, the California Water Management
System, and the Solution--NAWAPAPart I
By Patrick Ruckert
July 23, 2013
The Imperial Valley in 1918
The Imperial Valley Today

Contents
I. IntroductionWater Crisis? What Water Crisis? The Major Projects of the California Water Management SystemFive Decades of Collapse
II. The Way We Used to ThinkNAWAPAWater-flux Density
III. The West and California: A little history and what it is todayCalifornia Water Rationing TodayMeasuring Water
IV. Water Management Systems: Some BackgroundV. The California Water Management System
Tulare LakeThe Major Projects of the California Water Management System-- AgainThe DeltaDesalination
VI. Now, the Four Projects in Some Detail1) The Los Angeles Aqueduct2) The Central Valley Project3) The State Water Project4) The Colorado River System and Projects
The Colorado River AqueductThe All American Canal
VII. ConclusionFootnotesSourcesAppendix: Map of NAWAPA XXI Nuclear Desalination Plants
Other Reports by the Author
“John Quincy Adams: How the Giant of American Foreign Policy Built Our Constitutional Republic and Kicked the Russians Out of America,” The New Federalist, September 11, 1987. Availablefrom the author at [email protected].
“The Fight For The American Republic: James Fenimore Cooper and The Society of the Cincinnati,” Executive Intelligence Review, October 26, 2007.
http://www.larouchepub.com/other/2007/3442cooper_fight_cincinnati.html
“The Fight to Build the Grand Coulee Dam and the Economic Revolution that Transformed the Nation,” February 23, 2013. Available from the author at [email protected].
“The American System: Henry W. Corbett and Howard V. Morgan of Portland, Oregon,” February 19, 2013. Available from the author at [email protected].

Mission Dam, Built in 1816 The California Aqueduct
I. Introduction
This report is the first of a two-part series on the California Water Management System. Part I will cover some basics of water management systems generally, their development in California and a summary picture of the California system. Part II will cover the Los Angeles component of the system,with a focus on the building of the Los Angeles Aqueduct and the man who built it, William Mulholland. This year we are commemorating its completion 100 years ago.
California was, forty years ago, the most productive economy in the world. That economy was mainly built over an earlier forty year period, beginning in the 1930s. It was the government, both Federal andState, that did that. The last forty years of increasing deregulation, environmentalism and the insane idea that government is the problem, has produced the disaster the state and the nation are in today. This report is not the place to develop this point in any detail, though the overall content of the report does give the reader enough background to demonstrate the point made about the role of government. For more extended discussion the reader is referred to the many reports and videos available at larouchepac.com.
In this introductory section, though, the reader should be made aware of the following, which parallels the development of the California water management system. As the major projects, the Central Valleyand State Water projects, were being built, millions of people were moving to California because it wasthe land of opportunity and production. In the World War II years, Los Angeles became the second most industrialized city in the country. California became a major center for the auto, steel, rubber and aerospace industries. In those same years, in California, machine tool production increased by 1000%.The higher education system of the state was massively expanded to produce the trained and skilled workers that did the production. And anyone could go to college for just a few dollars a year.
Today that is all gone and California relies for its tax base on a shrinking productive work force at low-wage jobs. Why does the state have a perpetual budget crisis, despite cutting $102 billion from the state budget since 2002? One hint is the following: Between 2000 and 2009 the state lost 471,000 manufacturing jobs. (1)
This report, I hope, will provide you with some of the background every American should know if he or she is determined to be a real citizen of this republic and to take responsibility for its future.
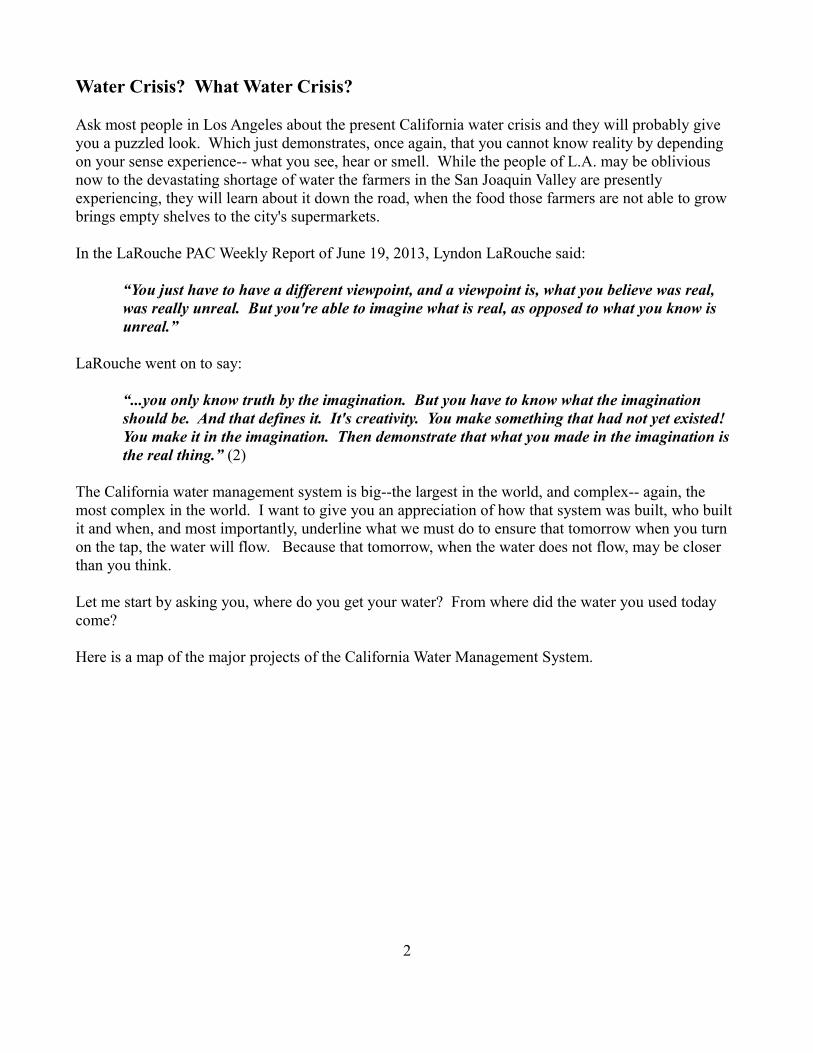
Water Crisis? What Water Crisis?
Ask most people in Los Angeles about the present California water crisis and they will probably give you a puzzled look. Which just demonstrates, once again, that you cannot know reality by depending on your sense experience-- what you see, hear or smell. While the people of L.A. may be oblivious now to the devastating shortage of water the farmers in the San Joaquin Valley are presently experiencing, they will learn about it down the road, when the food those farmers are not able to grow brings empty shelves to the city's supermarkets.
In the LaRouche PAC Weekly Report of June 19, 2013, Lyndon LaRouche said:
“You just have to have a different viewpoint, and a viewpoint is, what you believe was real, was really unreal. But you're able to imagine what is real, as opposed to what you know is unreal.”
LaRouche went on to say:
“...you only know truth by the imagination. But you have to know what the imagination should be. And that defines it. It's creativity. You make something that had not yet existed! You make it in the imagination. Then demonstrate that what you made in the imagination is the real thing.” (2)
The California water management system is big--the largest in the world, and complex-- again, the most complex in the world. I want to give you an appreciation of how that system was built, who built it and when, and most importantly, underline what we must do to ensure that tomorrow when you turn on the tap, the water will flow. Because that tomorrow, when the water does not flow, may be closer than you think.
Let me start by asking you, where do you get your water? From where did the water you used today come?
Here is a map of the major projects of the California Water Management System.
2
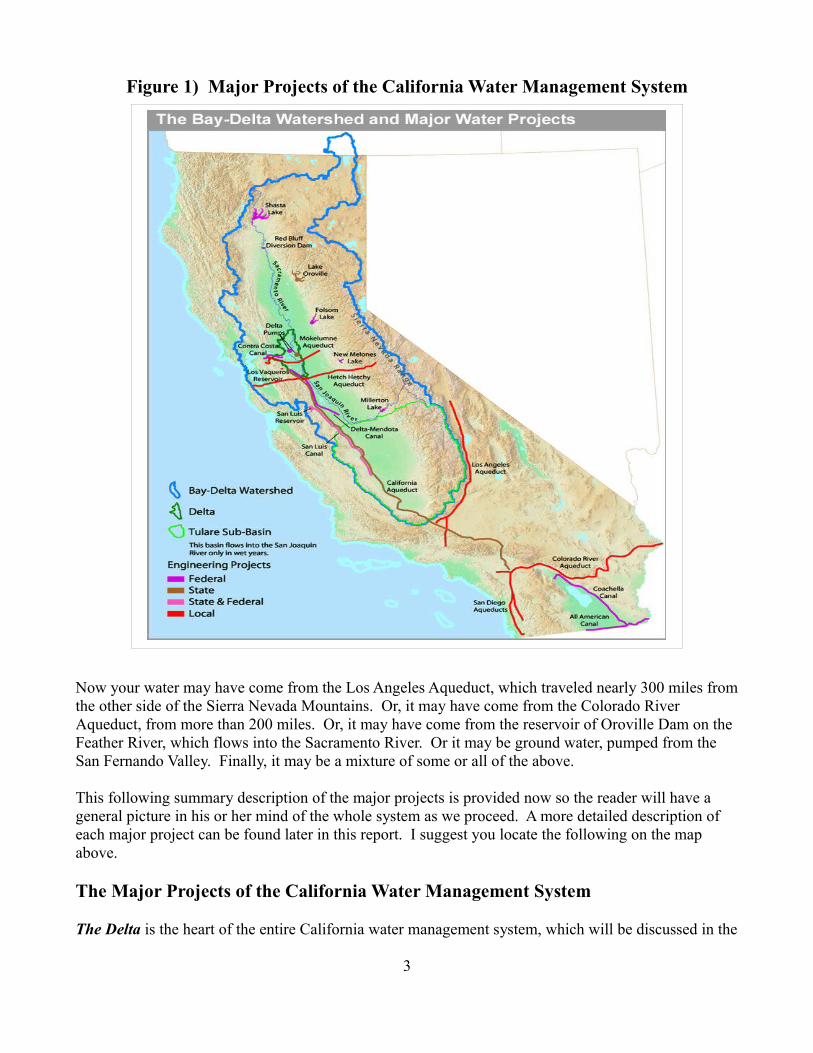
Figure 1) Major Projects of the California Water Management System
Now your water may have come from the Los Angeles Aqueduct, which traveled nearly 300 miles fromthe other side of the Sierra Nevada Mountains. Or, it may have come from the Colorado River Aqueduct, from more than 200 miles. Or, it may have come from the reservoir of Oroville Dam on the Feather River, which flows into the Sacramento River. Or it may be ground water, pumped from the San Fernando Valley. Finally, it may be a mixture of some or all of the above.
This following summary description of the major projects is provided now so the reader will have a general picture in his or her mind of the whole system as we proceed. A more detailed description of each major project can be found later in this report. I suggest you locate the following on the map above.
The Major Projects of the California Water Management System
The Delta is the heart of the entire California water management system, which will be discussed in the
3

context of the major projects of the system, below.
The Los Angeles Aqueduct was built by the City of Los Angeles and completed in 1913. A second aqueduct was completed in 1970. It begins on the east side of the Sierras in the Mono Lake Basin and Owens Valley, and brings water by gravity-- no pumping-- more than 250 miles to Los Angeles.
The Central Valley Project was built by the Federal Government between 1935 and 1970. It begins high up in the northern California Sierras at Shasta Dam. The water flows down the Sacramento River to the Delta, and then hundreds of miles south through the San Joaquin Valley.
The Colorado River Projects include The Colorado River Aqueduct and the All American Canal. A subsidiary feature of this sub-system is the San Diego Aqueduct. Elements of these projects were built by the Federal Government, the Metropolitan Water District of Southern California, the State of California and the city of San Diego.
The State Water Project was built by the state of California between 1961 and 1972. It begins on the Feather River in the Sierras at Oroville Dam, sends water down the Sacramento River to the Delta, thenthrough the San Joaquin Valley, and over the Tehachapis to Los Angeles and Riverside County.
Please note two other major projects in the Bay Area: The Tuolumne River/ Hetch Hetch Aqueduct and the Mokelumne Aqueduct. There are hundreds of other dams, canals, aqueducts, pumping stationsand power plants in the California water management system, some of which are included in this report.
Five Decades of Collapse
The civilizational breakdown crisis the world is now in is the result of an intention. Since the assassination of President John Kennedy, the United States has been led down a suicide path, intentionally, by the British Empire and its Wall Street accomplices, as they have turned the economy into a gambling casino, by sacrificing the real physical economy and looting the population.
For almost, five decades the United States has been collapsing-- year by year and decade after decade, we have been destroying the American System of production. We export our industries to low wage- slave labor “markets;” we have built virtually no infrastructure since the early 1970s-- that especially includes water projects; we have deregulated our financial system and turned the economy into a gambling casino. And when that casino exploded in 2008, we bailed it out with trillions of dollars.
The Dodd-Frank Financial Reform Act states in Article II, that the next melt-down will be bailed-in with depositors funds, like what was done to Cyprus a couple of months ago. (3)
The World Trade Organization and the North American Free Trade Agreement outsourced and cartelized global food production and distribution, destroying the sovereignty of nations and their food production and reserves. Then add in the crime against humanity of burning 40% of the U. S. corn crop in gas tanks. (4)
4

For example, look at the chart below, which shows the shift in the composition of the labor force over the past 60 years. Sixty years ago the manufacturing sector of the economy accounted for 29% of the GDP, whereas the financial sector only accounted for 11%. Today that has completely reversed. (5)
Figure 2) Manufacturing vs. FIRE
As Lyndon LaRouche put it in his Webcast of June 7, 2013:
Who's behind it? Well the people who're gamblers, the Wall Street gamblers! They all want their gambling proceeds. They don't think in terms of food, they don't think in terms of lives of people, they don't think in terms of health care! They think of their money! And their money, per se! They care nothing about the human being. And they're not prepared to do anything about it.” (6)
On June 4, 2013, LaRouche, in a discussion with associates contrasted the human outlook, the American System outlook, to the Empire's gamblers and genocidalists, who have turned this nation from its former status as a productive economy, committed to scientific progress and building the infrastructure future generations require, into a collapsing gambling casino, saying:
5
Manufacturing vs. FIRE (Finance, Insurance, RealEstate)
Percentage of GDP
Manufacturing Fire
Composition of the Work Force Employment by SectorPercentage of Total Workers
“Look at this land! Look at this great land, with its water systems, all these things! This greatrichness, which the people of the United States created! This great nation -- and you want to destroy this great nation, which expresses its greatness in terms of the productivity of its population? The productivity in terms of the basic economic development, in terms of technology, the idea that we're going to the Moon!
Now, the wealth of a nation lies in two things: The productivity – physical productivity, mind you! And the... the increase of that, including the energy flux-density. And the basis of growth is that notion of energy-flux density.
This nation was built, in phases, when the intention was to invention, to technology, to growth, to improvements in agriculture: all the things that the Greenies hate!” (7)
LaRouche, at the Schiller Institute conference in Germany, on April 13, 2013, really put it bluntly:
How do we do that? Well, it goes back to the American System. The American System is progress, progress, progress....” (8)
About 40 years ago, Lyndon LaRouche gave a speech at the University of Washington. His theme was the idea of progress, and how that idea was established with the Renaissance and had guided the last 400 years of history. He said that, now, that idea was under attack, and that attack posed a fundamental threat to the continued existence of human civilization.
So, when LaRouche at that Schiller Institute conference in Germany added the following, it was really an echo from the past, developed to a much more profound level:
Mankind must always progress.... Rise to a higher energy flux density. How do you do that? You make physical discoveries; you go from lower forms of energy flux density to higher forms of energy flux density. You find new applications.
Progress, evolve, or die!
Progress, evolve, or go extinct! That's the law; that's the law of nature. Mankind is the only creature which does it voluntarily and can do it voluntarily, and that is by making discoverieswith the mind, with the powers of mind to discover new principles, higher principles of development.
And therefore, this is a moral question. What's our economic system?.... The principle of progress, the principle of going to higher energy flux density, to higher standards of productivity.
How do we do that? Well, it goes back to the American System. The American System is progress, progress, progress....” (8)
I want to take you back to a time when we, as a nation, used to think that way.
6
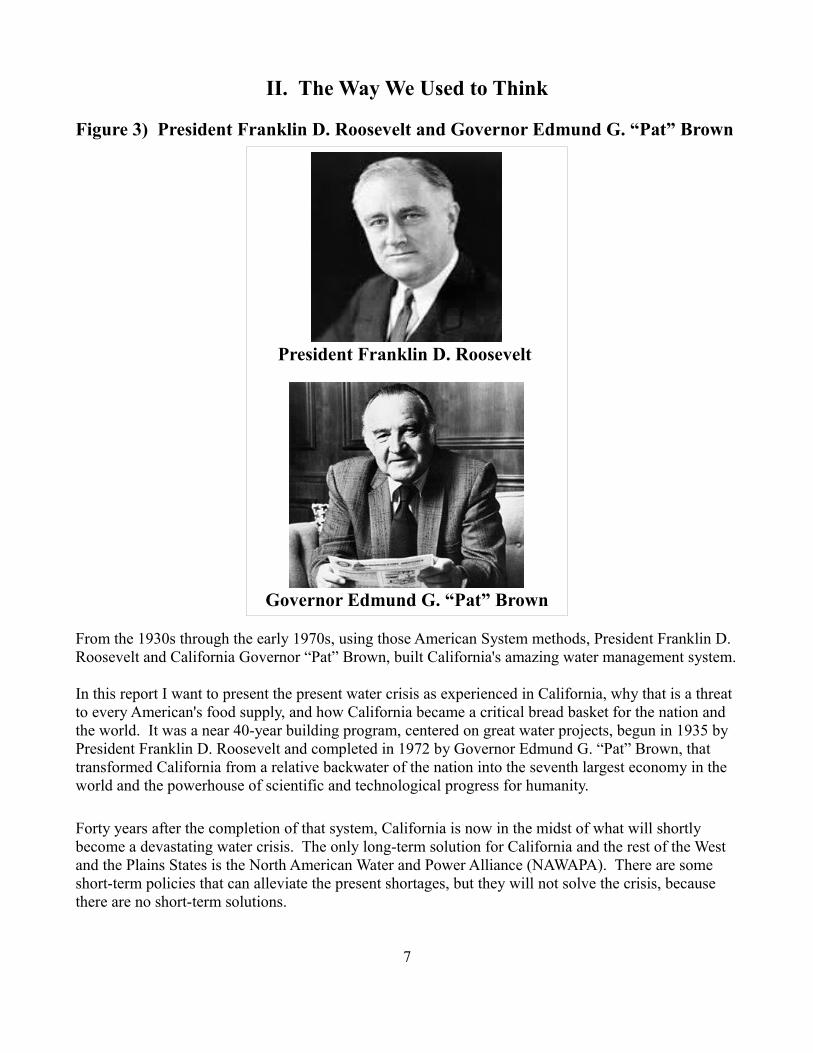
II. The Way We Used to Think
Figure 3) President Franklin D. Roosevelt and Governor Edmund G. “Pat” Brown
From the 1930s through the early 1970s, using those American System methods, President Franklin D. Roosevelt and California Governor “Pat” Brown, built California's amazing water management system.
In this report I want to present the present water crisis as experienced in California, why that is a threat to every American's food supply, and how California became a critical bread basket for the nation and the world. It was a near 40-year building program, centered on great water projects, begun in 1935 by President Franklin D. Roosevelt and completed in 1972 by Governor Edmund G. “Pat” Brown, that transformed California from a relative backwater of the nation into the seventh largest economy in the world and the powerhouse of scientific and technological progress for humanity.
Forty years after the completion of that system, California is now in the midst of what will shortly become a devastating water crisis. The only long-term solution for California and the rest of the West and the Plains States is the North American Water and Power Alliance (NAWAPA). There are some short-term policies that can alleviate the present shortages, but they will not solve the crisis, because there are no short-term solutions.
7
President Franklin D. Roosevelt
Governor Edmund G. “Pat” Brown
When discussing the California water management system one must think big. As you will see, not only is the system the biggest in the world, but many, many of the elements of the system in themselvesare the biggest, or longest, or most complex in the nation or the world.
NAWAPA
LaRouche has recently re-emphasized that the production of food in the United States, not just California, is collapsing, and without the North American Water and Power Alliance (NAWAPA) beingbuilt now, plus other measures like water desalination, and the crushing of the environmentalist disease,the people of the US will starve.
Yes, drought conditions are a factor of that, but, he stressed, the effect of drought did not have to produce a disaster. Had NAWAPA been built, beginning in the 1960s, when it was proposed, it would have been completed more than a decade ago, and the drought today would have had only a minor, if any, impact on food production.
So, the real solution-- that durable long-term solution-- is NAWAPA-- the policy of the Kennedy administration. NAWAPA was designed in the early 1960s in California. Those then building the StateWater Project, then, knew that once that project was completed, work must begin immediately on the next one required to bring the water that will be needed by the coming generations of Californian's.
Just a few words about NAWAPA, here. For an in-depth report, I recommend the LaRouche PAC Special Report on NAWAPA and the LaRouche PAC summary video.
These two items can be found here:
“NAWAPA XXI-- LaRouche PAC Special Report”http://larouchepac.com/files/20120403-nawapaxxi-forweb_0.pdf
NAWAPA XXI Animated Overview http://larouchepac.com/nawapaxxi/overview
NAWAPA is a continental water management system that extends from Alaska into Mexico, and from the Pacific to the Hudson's Bay. It is a system of dams, reservoirs, canals, tunnels, and power plants that will make available abundant water for agriculture and people, control floods and provide new waterways for shipping. It will re-industrialize the nation, putting, immediately, seven million people to work at productive occupations at high wages. It will restore the nation to being once again the leading production center for humanity. As a side benefit it will, once and for all, mean the disease of environmentalism has been eradicated.
Here is a map of the greatest project ever conceived by man.
8

Figure 4) The North American Water and Power Alliance
Ben Deniston, on the LaRouche PAC Weekly Report of July 10, 2013 emphasized that NAWAPA is a project that gives man greater control of the water cycle; of mankind acting to control the weather cycleand the climate systems. He said, “...water's everywhere. You have huge amounts of water over your heads at all times! The amount of water that's evaporated into the atmosphere..., as vapor, is on the order of about 3,000 cubic miles.” Deniston compared this to all the runoff water for the entire North American continent, which is about 5 cubic miles. (9)
So, the California water crisis is not due to there not being enough water; it's just not in the right place. This is due to not building NAWAPA ,on one hand, and not having the technological capability to access that which is floating in the air around us. How do we access that atmospheric water, which we cannot see, except when it forms clouds? The question we really want to pose is, how productive is the water? The productivity of water is whenwater participates in the process of the biosphere.
9

Since 77% of the planet's rain falls over the oceans, and the fish do not need it-- they have plenty of water-- how do we make the water more productive by shifting the weather patterns to make more of the rain fall over the land? This is a question beyond the transferring of water from the far northwest tothe lower 48 states by the infrastructure of NAWAPA.
By making the water more productive, we mean we want the water to participate in life, in photosynthesis. That is how it is productive. Freshwater that's brought into biological rich areas, participates in a cycle of life, evaporation, and rainfall multiple times. If you take an average, it's about2.7 times that water will cycle through life, participate in photosynthesis, become water vapor again, become clouds and fall again as rain.
A dramatic demonstration of this is seen in the National Geographic's “Water Currents,” of February 10, 2013, Jay Famiglietti of the University of California, Irvine, reports on his study that demonstrates that because of the irrigation of the Central Valley, “…evaporation in the Valley doubled, leading to a major export of water vapor downwind to the arid American Southwest. This increased summer rain inColorado, Utah, Arizona and New Mexico by 15%, and by triggering further upward motion in the monsoon circulation, thereby drawing in even more water vapor from the Gulfs of California and Mexico.... All that extra rainfall resulted in a 28% increase in runoff to the Colorado River....” (10)
I shall return to the productivity of water below.
Water-flux Density
Man is the only creature that uses fire to constantly increase the productivity of his economic activity, increasing the production of all that man needs to survive and progress. He does this through the continuous invention of more powerful forms of fire, starting with wood, moving to coal, then to oil and nuclear. It is through scientific discovery and the application of new physical principles that man has progressed, as measured by the increase of the energy-flux density of his work.
Man is also the only creature who increases the water-flux density of his use of water. He does this by moving water to where it is needed and by altering or creating a qualitative change in its flow. Man alters the flow of rivers, puts water on land that has none, and uses water to produce electricity. Man increases the productivity of water, just as he increases the productivity of fire.
III. The West and California: A little history and what it is today
The distinctive feature of the Western part of the United States is the Great Plains and the Great American Desert. Deserts are a common feature of all continents, as seen in the world map of the deserts.
10

Figure 5) Deserts of the World
Here is a map of the 20 inch rainfall line; west of the line, less than 20 inches of rain falls annually.
Figure 6) The 20 Inch Rainfall Line
West of the 20 inch rainfall line, which runs north to south west of the Mississippi River, not only are the Plains States dependent on the Ogalla Aquifer, but in the far Southwest is the Great American Desert, where rainfall may be less than five inches per year, and the total run-off from the region's rivers is only 34 million acre feet per year(MAFY). How little that is, compared to the needs of the region, is seen by the fact that California farmers alone use 30 MAFY. An acre foot is enough water to provide all the needs for two average size families for a year.
A completed NAWAPA would more than double the water supply of the Southwest States.
In Southern California there are three deserts: The Mohave, The Colorado and the Great Basin.
11
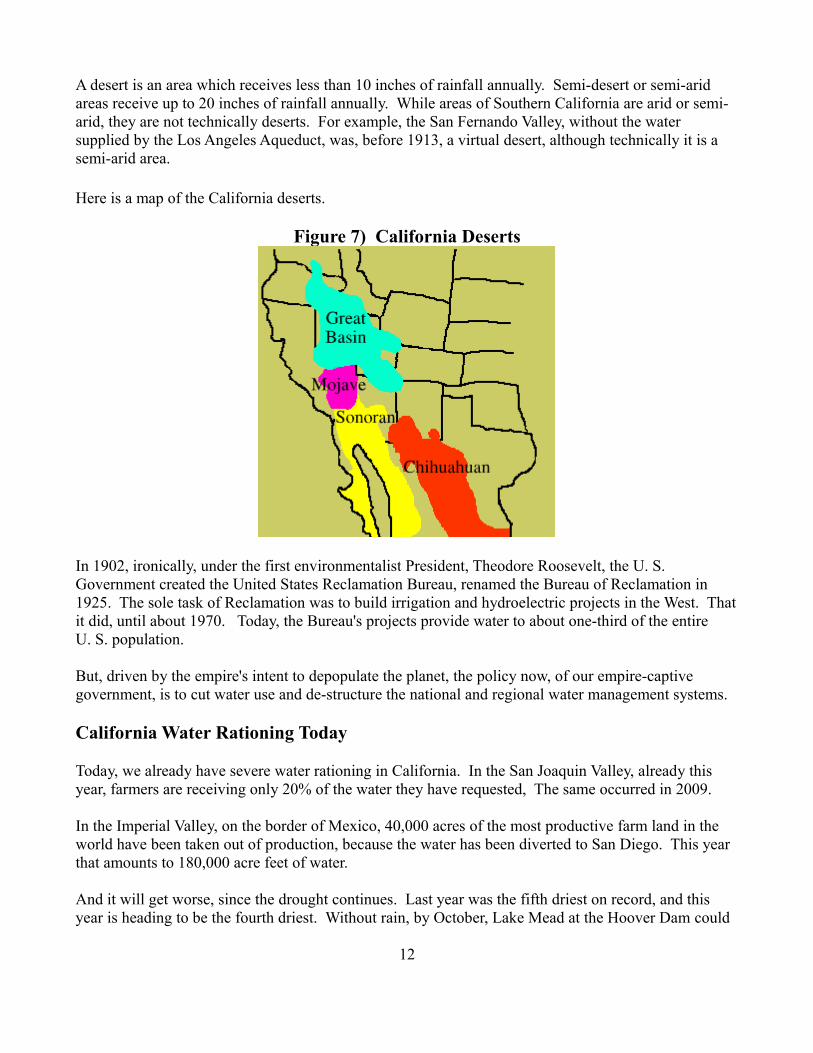
A desert is an area which receives less than 10 inches of rainfall annually. Semi-desert or semi-arid areas receive up to 20 inches of rainfall annually. While areas of Southern California are arid or semi-arid, they are not technically deserts. For example, the San Fernando Valley, without the water supplied by the Los Angeles Aqueduct, was, before 1913, a virtual desert, although technically it is a semi-arid area.
Here is a map of the California deserts.
Figure 7) California Deserts
In 1902, ironically, under the first environmentalist President, Theodore Roosevelt, the U. S. Government created the United States Reclamation Bureau, renamed the Bureau of Reclamation in 1925. The sole task of Reclamation was to build irrigation and hydroelectric projects in the West. Thatit did, until about 1970. Today, the Bureau's projects provide water to about one-third of the entireU. S. population.
But, driven by the empire's intent to depopulate the planet, the policy now, of our empire-captive government, is to cut water use and de-structure the national and regional water management systems.
California Water Rationing Today
Today, we already have severe water rationing in California. In the San Joaquin Valley, already this year, farmers are receiving only 20% of the water they have requested, The same occurred in 2009.
In the Imperial Valley, on the border of Mexico, 40,000 acres of the most productive farm land in the world have been taken out of production, because the water has been diverted to San Diego. This year that amounts to 180,000 acre feet of water.
And it will get worse, since the drought continues. Last year was the fifth driest on record, and this year is heading to be the fourth driest. Without rain, by October, Lake Mead at the Hoover Dam could
12
be at less than one-half its capacity.
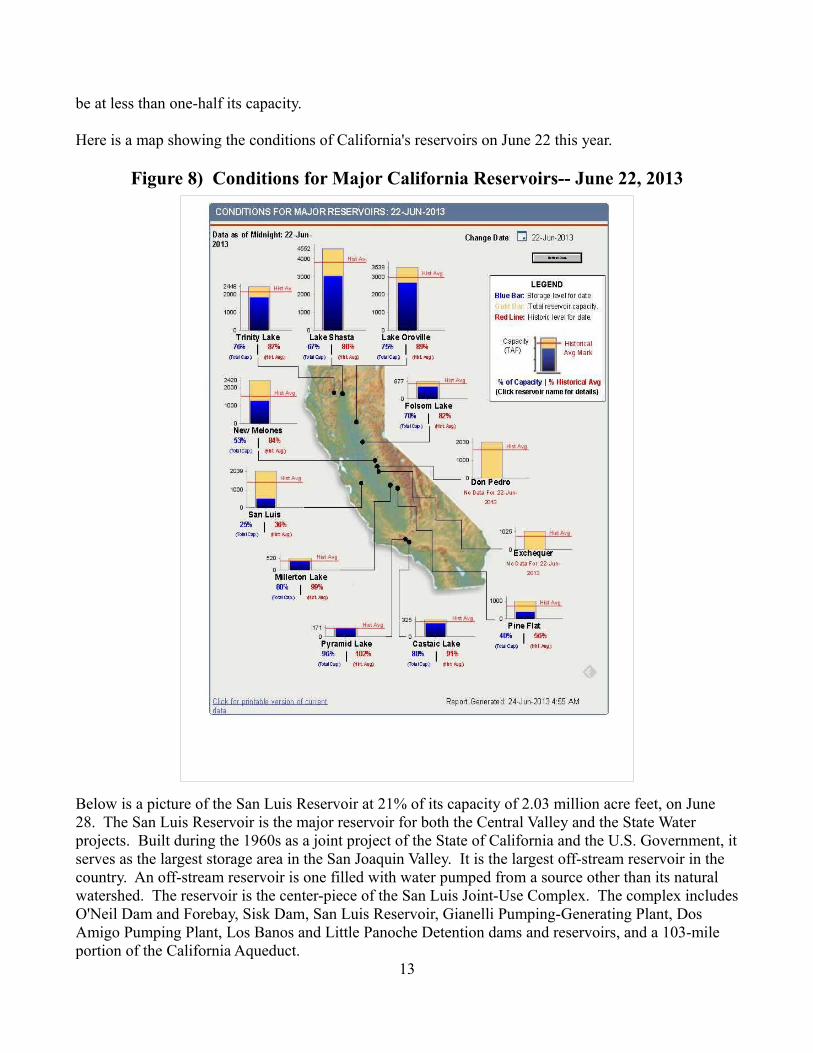
Here is a map showing the conditions of California's reservoirs on June 22 this year.
Figure 8) Conditions for Major California Reservoirs-- June 22, 2013
Below is a picture of the San Luis Reservoir at 21% of its capacity of 2.03 million acre feet, on June 28. The San Luis Reservoir is the major reservoir for both the Central Valley and the State Water projects. Built during the 1960s as a joint project of the State of California and the U.S. Government, itserves as the largest storage area in the San Joaquin Valley. It is the largest off-stream reservoir in the country. An off-stream reservoir is one filled with water pumped from a source other than its natural watershed. The reservoir is the center-piece of the San Luis Joint-Use Complex. The complex includesO'Neil Dam and Forebay, Sisk Dam, San Luis Reservoir, Gianelli Pumping-Generating Plant, Dos Amigo Pumping Plant, Los Banos and Little Panoche Detention dams and reservoirs, and a 103-mile portion of the California Aqueduct.
13

Figure 9) San Luis Reservoir at 21% Capacity-- June 28,2013
This is serious, since of California's 100 million acres of land, 43 million acres are used for agriculture, of which 9.6 million acres are irrigated. Because of the cutbacks to irrigators in the San Joaquin Valley,about 3.75 million acres of farmland are water short right now-- more than one-third of all irrigated land in the state.
Worse, since tree crops die if they don't get water in the summer, the long term damage would be the destruction of California's orchards. For example, the state's almond crop could be devastated for years, and it is big-- 780,000 acres of producing almond trees.
Figure 10) Dead Orchard- San Joaquin Valley, June 28, 2013
14

This impacts the entire nation, since California produces a huge portion of the nation's food. The Central Valley, which includes the San Joaquin Valley and the Sacramento Valley, is the largest semi-continuous expanse of irrigated farm land in the world, and provides one third of all produce grown in the United States. The Valley produces more than 200 different crops, some of which the Valley produces more than 50% of world production.
Twenty percent of U.S. milk production comes from California, and the state is losing dairy herds at a rapid pace due to the lack of water, the skyrocketing costs of production, the lack of a parity policy for agriculture due to the cartelized and global free trade policy, and the burning of corn for fuel.
Measuring Water
A word about measuring water.
For the purpose of water management systems, the standard measure for water at rest is in units of volume, either gallons or acre feet.
An acre foot is the amount of water one foot deep covering an acre of land area. An acre is a square area of about 208 feet per side. There are 325,851 gallons in an acre foot. One acre foot will supply two average families for one year. In discussing water management systems the acronym MAFY is used, meaning millions of acre feet per year.
IV. Water Management Systems: Some Background
Water management systems are the complex of rivers, reservoirs, canals, tunnels, pumping stations, levees, siphons, generators and pipes that store water and move it from one area to another. Such systems have existed as long as civilizations have existed. The system may be simply the diversion, with a ditch, of a stream to a field, or it can be like that created in the State of California, which is the largest and most complex water management system in the world-- at least for now, and until China completes the amazing system they are presently building, the South-to-North Water Diversion Project.
Two thousand years ago, the only contribution the Roman Empire made to the progress of civilization was the construction of vast water management systems, featuring aqueducts, like this one in Segovia, Spain, built about 100 AD.
Figure 11) Segovia Aqueduct, Plaza del Azoguejo, Segovia, Spain
15

Of the total average consumption of water in California about 70% percent is provided by the man- made water management system, and 30% percent comes from ground water pumped from the earth, called aquifers. With the increased use of ground water due to drought, water tables are falling, the land is sinking, wells must be dug deeper, and the quality of the water declines.
Here is a picture which really dramatizes the subsidence problem.
Figure 12) Land Subsidence in California
When the land subsides, roads crack, pipes break and railroad tracks are skewed.
During the last half of the 19th Century, as California's population rapidly grew, agriculture began replacing mining as the foundation of the economy. In the San Joaquin Valley dry-land wheat farming predominated through the 1880s. Then irrigation began slowly to expand, and much more rapidly beginning in the 1930s.
Here is a chart of the amount of irrigated land in the state from 1870 to the present, demonstrating the rapid increase of irrigated land in the state due to the Central Valley and the State Water projects.
16
Joe Poland, USGS scientist shows subsidence from 1925 and 1977,Mendota, CA.; From USGS "Ground water in the Central Valley,
California- A summary report." Photo by Dick Ireland, USGS, 1977
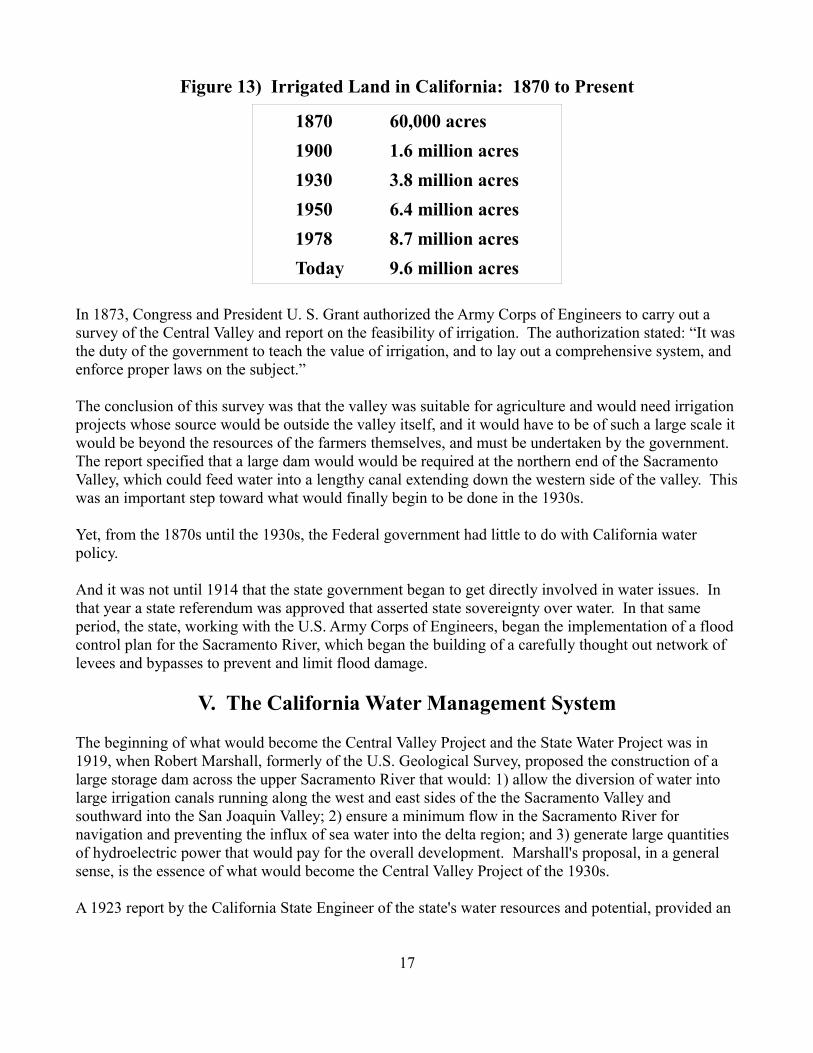
Figure 13) Irrigated Land in California: 1870 to Present
In 1873, Congress and President U. S. Grant authorized the Army Corps of Engineers to carry out a survey of the Central Valley and report on the feasibility of irrigation. The authorization stated: “It wasthe duty of the government to teach the value of irrigation, and to lay out a comprehensive system, and enforce proper laws on the subject.”
The conclusion of this survey was that the valley was suitable for agriculture and would need irrigation projects whose source would be outside the valley itself, and it would have to be of such a large scale itwould be beyond the resources of the farmers themselves, and must be undertaken by the government. The report specified that a large dam would would be required at the northern end of the Sacramento Valley, which could feed water into a lengthy canal extending down the western side of the valley. Thiswas an important step toward what would finally begin to be done in the 1930s.
Yet, from the 1870s until the 1930s, the Federal government had little to do with California water policy.
And it was not until 1914 that the state government began to get directly involved in water issues. In that year a state referendum was approved that asserted state sovereignty over water. In that same period, the state, working with the U.S. Army Corps of Engineers, began the implementation of a flood control plan for the Sacramento River, which began the building of a carefully thought out network of levees and bypasses to prevent and limit flood damage.
V. The California Water Management System
The beginning of what would become the Central Valley Project and the State Water Project was in 1919, when Robert Marshall, formerly of the U.S. Geological Survey, proposed the construction of a large storage dam across the upper Sacramento River that would: 1) allow the diversion of water into large irrigation canals running along the west and east sides of the the Sacramento Valley and southward into the San Joaquin Valley; 2) ensure a minimum flow in the Sacramento River for navigation and preventing the influx of sea water into the delta region; and 3) generate large quantities of hydroelectric power that would pay for the overall development. Marshall's proposal, in a general sense, is the essence of what would become the Central Valley Project of the 1930s.
A 1923 report by the California State Engineer of the state's water resources and potential, provided an
17
1870 60,000 acres
1900 1.6 million acres
1930 3.8 million acres
1950 6.4 million acres
1978 8.7 million acres
Today 9.6 million acres
extensive hdrographic study of precipitation and stream-flow patterns, and presented data regarding more than 1,000 possible reservoir sites in the state.
A follow up report by the State Engineer in 1927 became the basis for the first state water plan in 1929,and included many elements of the soon to be Central Valley Project, which the state committed itself to building in 1933. The state government then requested from the FDR administration federal fundingfor the Project, which was approved in 1935, and the project became a “Federal Reclamation Project,” under the Bureau of Reclamation. Construction began in 1938, and was largely completed by 1951, though some further additions were built into the early 1970s.
Also in 1929, construction of the Hoover Dam on the Colorado River began, under the supervision of the Bureau of Reclamation. The dam was completed in 1935. Parker Dam, 150 miles below the Hoover Dam, and its reservoir, lake Havasu, were completed in 1938, and are the source of water for the Coloraro River Aqueduct built by the Metropolitan Water District of Southern California (MWDSC). The MWDSC was created in 1924 as Los Angeles and other cities began eying the Colorado River to enhance their water supply.
Beginning in the 1930s, and continuing until 1972, the majority of today's components of the state-wide water management system of California were built. The one exception is the Los Angeles Aqueduct, built by the City of Los Angeles, and completed in 1913. FDR began the task, and from 1959 to 1967, California Governor Edmund G. “Pat” Brown completed it. Pat Brown, unlike his son Jerry, was an FDR Democrat, who believed in progress and creating for future generations the foundations of a productive, infrastructure-rich economy.
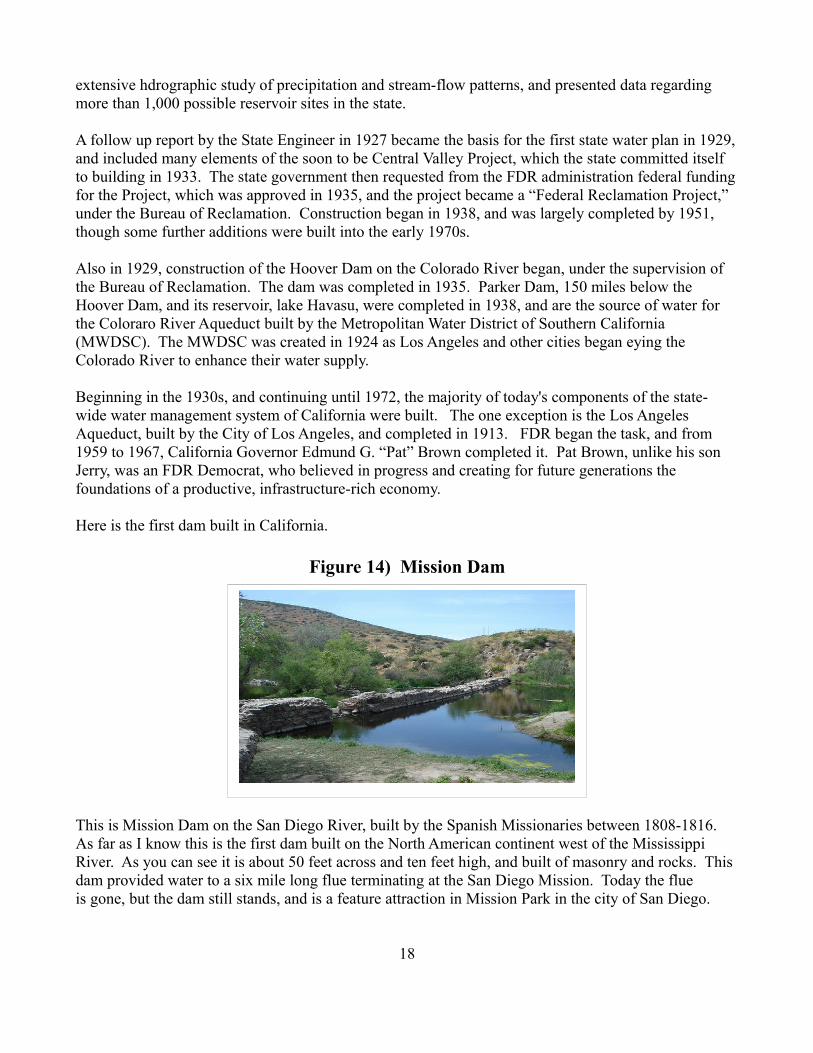
Here is the first dam built in California.
Figure 14) Mission Dam
This is Mission Dam on the San Diego River, built by the Spanish Missionaries between 1808-1816. As far as I know this is the first dam built on the North American continent west of the Mississippi River. As you can see it is about 50 feet across and ten feet high, and built of masonry and rocks. This dam provided water to a six mile long flue terminating at the San Diego Mission. Today the flue is gone, but the dam still stands, and is a feature attraction in Mission Park in the city of San Diego.
18

California has been called, “the most hydrologically altered landmass on the planet.” It is a system of massive hydrologic works, that moves enormous amounts of water great distances.
The California system includes 1,200 major dams, the two biggest irrigation projects in the world, the longest aqueduct in the world, and more than 1,000 reservoirs, including some of the largest in the country.
The system was essentially completed in 1973, and there has been only one major reservoir built since, that being Diamond Valley Reservoir near Hemet, completed in 1999. But there have been no dams or aqueducts built since 1973, despite the population having increased by more than 15 million people.
There are six main projects of dams, aqueducts and associated infrastructure that gather, transport, and distribute water in California. While they are separate projects, they are an interconnected whole-- a state-wide system.
Tulare Lake
As mentioned above, California has been called “the most hydrologically altered landmass on the planet.” An example of one of those hydrologicically altered landmasses is the Tulare Lake area, the center of which is Kern and Tulare counties. This is the location of the formerly largest freshwater lakewest of the Mississippi River-- Tulare Lake. Today, the lake bed is productive agricultural land. Until about 100 years ago, each year in the Spring, the snow melt from the Sierras that fed the Kern, Tule andKaweah Rivers, along with the tributaries of the Kings River, flowed into the area forming the lake. That uncontrolled flow of water ended with the construction of the Terminus and Success Dams on the Kaweah and Tule Rivers and the Pine Flat Dam on the Kings River. Today, nearly three million acres of the former lake bed are now irrigated farm land.
Here is Tulare lake in the 1800s.
Figure 15) Tulare Lake in the 1800s
And here is what it looks like today.
19

Figure 16) Tulare lake today
The Major Projects of the California Water Management System- Again
Please refer back to figure 1 to be able to follow this section.
The major projects are:
The Los Angeles Aqueduct The Central Valley Project The State Water Project The Colorado River Projects The Hetch Hetch system The Mokelumne Aqueduct
For Southern California, 90% of its water supply comes hundreds of miles from three of these projects: The Los Angeles Aqueduct, the Colorado River Aqueduct and the State Water Project.
This report will discuss four of the main projects: The Los Angeles Aqueduct, The Central Valley Project, The State Water Project, and The Colorado River Projects.
The Delta
But first, a few words on the Delta, the heart of the Central Valley and State Water projects. The Delta may be the heart of the system, but it is also the center of conflict over California's water present and future.
Here is a picture of a small part of the Delta.
20
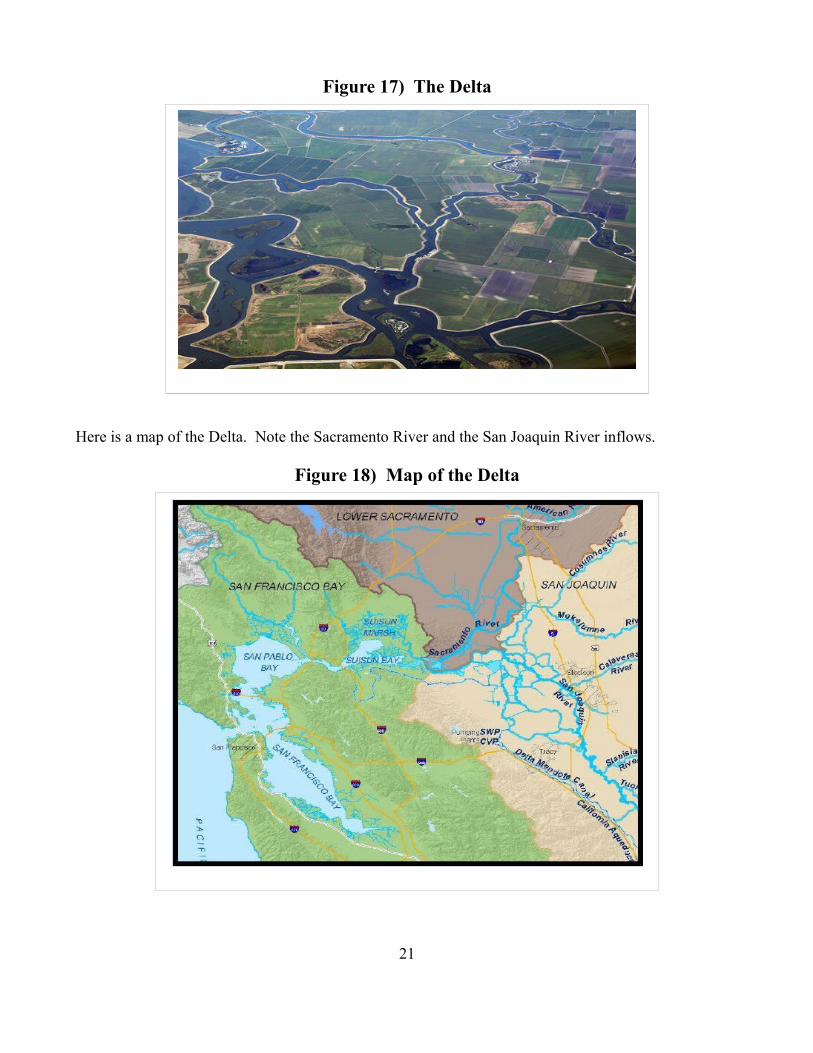
Figure 17) The Delta
Here is a map of the Delta. Note the Sacramento River and the San Joaquin River inflows.
Figure 18) Map of the Delta
21

And here, a schematic of the water flow in the Delta.
Figure 19) Schematic of Water Flow in the Delta
The Delta is an area encompassing 738,000 acres of rivers, levees, waterways, farms and islands in the northwest corner of San Francisco Bay. It is where the Sacramento River, the San Joaquin River and other rivers enter the estuary leading into the Bay. Competing and conflicting interests here include: Water for agriculture in the Sacramento River basin; water for the farmers of the Delta; water for agriculture in the San Joaquin Valley; fishermen, whose livelihoods depend on the Salmon that migrate up the rivers; the ports of Sacramento and Stockton which require free flowing rivers; and the urban populations both of the Bay Area and Southern California, whose water supply flows through The Delta.
The problem in the Delta is one of not enough water. If too much is pumped out, salt water flows into the Delta, threatening Delta farmers, fish and river traffic, and the quality of water pumped into the aqueducts.
The LaRouche PAC Oregon-California extension of NAWAPA will bring an additional flow of water into the upper Sacramento River basin, augmenting the water flow into the Delta. In addition, the extension will also add water to the Klamath River in Southwest Oregon, which is now in crisis condition, with 600 ranchers having been cut off from irrigation water this summer. This affects 180,000 acres of irrigated land and 70,000 cattle.
The Oregon-California extension of NAWAPA will tap into an enhanced Columbia River flow at the Deschutes River and send it south through Oregon to feed into the Klamath and Sacramento rivers.
A video of the Oregon-California Extension of NAWAPA can be found here:
http://larouchepac.com/node/22581
22
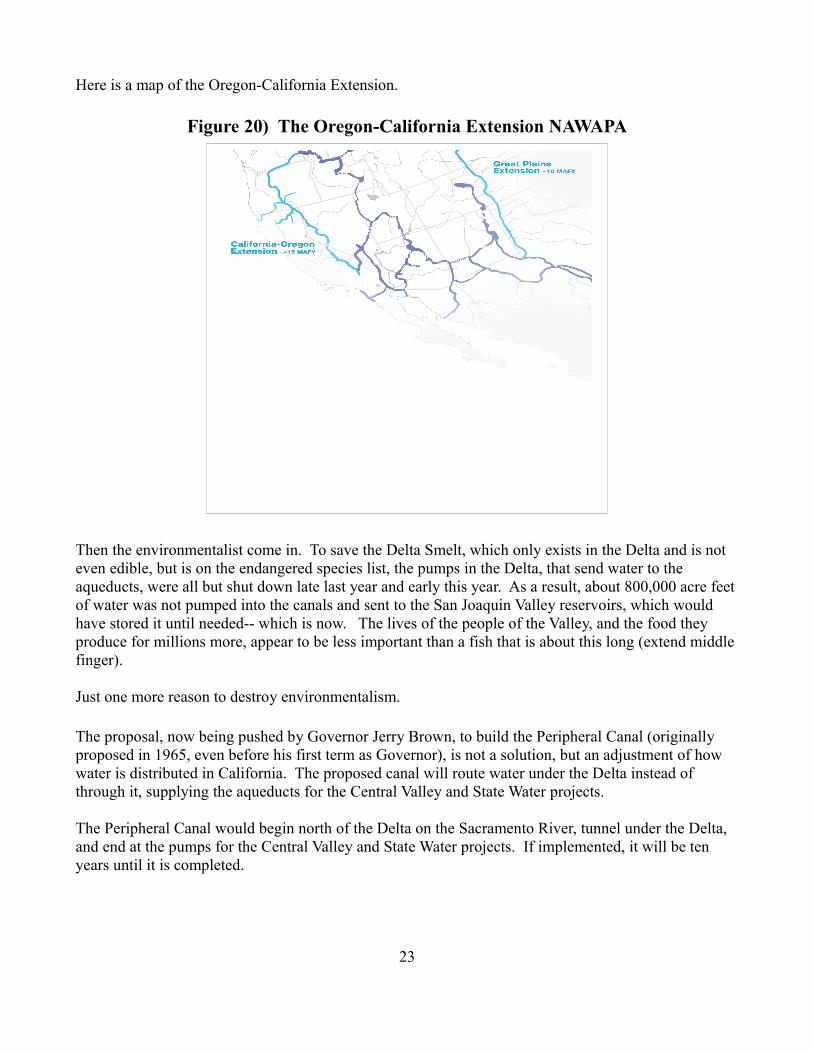
Here is a map of the Oregon-California Extension.
Figure 20) The Oregon-California Extension NAWAPA
Then the environmentalist come in. To save the Delta Smelt, which only exists in the Delta and is not even edible, but is on the endangered species list, the pumps in the Delta, that send water to the aqueducts, were all but shut down late last year and early this year. As a result, about 800,000 acre feetof water was not pumped into the canals and sent to the San Joaquin Valley reservoirs, which would have stored it until needed-- which is now. The lives of the people of the Valley, and the food they produce for millions more, appear to be less important than a fish that is about this long (extend middle finger).
Just one more reason to destroy environmentalism. The proposal, now being pushed by Governor Jerry Brown, to build the Peripheral Canal (originally proposed in 1965, even before his first term as Governor), is not a solution, but an adjustment of how water is distributed in California. The proposed canal will route water under the Delta instead of through it, supplying the aqueducts for the Central Valley and State Water projects.
The Peripheral Canal would begin north of the Delta on the Sacramento River, tunnel under the Delta, and end at the pumps for the Central Valley and State Water projects. If implemented, it will be ten years until it is completed.
23

Figure 21) The Proposed Peripheral Canal
There is no short-term solution to California's water crisis. Letting the smelt be chewed up by the pumps will alleviate the problem somewhat, but not solve the crisis. Only a total mobilization of the nation's physical economy to built NAWAPA, desalination plants, and some already proposed dams andreservoirs can ensure water supplies are adequate now and into the future. For example the proposed Temperance Flat Dam on the San Joaquin River will increase reservoir storage in the San Joaquin basinby nearly four times, thus capturing that much more Spring run-off that would otherwise head to San Francisco Bay.
24

Desalination
Just a few words on water desalination. There is only one large desalination plant at present being builtin California, in Carlsbad, by the San Diego Water District. It will produce about 56,000 AFY, about seven percent of the districts annual consumption. It will be five years before that plant delivers water. The water will cost San Diego about $2,000 per acre foot, about double the price it pays the Metropolitan Water District now.
Otherwise, no other significant desalination plant is being planned. And with the announcement of thepermanent shut down of the San Onofre nuclear power plant, the electricity production required for desalination does not exist in the state.
Today is not the future that President John F. Kennedy had foresaw. Just as his administration was planning NAWAPA, it was also looking at desalination a to building the electricity production desalination required. Kennedy foresaw the construction of 200 nuclear power plants in the nation by the year 2000. Only 104 were built and NAWAPA died in the jungles of Vietnam after that President was assassinated.
On August 18, 1962 President Kennedy, inaugurating the construction of the San Luis Dam in the San Joaquin Valley, said, “We must step up our program to convert cheap fresh water from salt water. There is no scientific breakthrough, including the trip to the Moon, that will mean more to the country which first is able to bring fresh water from salt water at a competitive rate.” (11)
So, what is the future? It will be what we make it. Or, as old as empires, we shall be subject to the divide and conquer insanity empires have always used to maintain control over its subjects-- A crisis isdeliberately created, then everyone begins to fight everyone else for a share of an inadequate and shrinking supply of water. Farmers in the Delta and southwest of Sacramento oppose the Peripheral Canal, while those in the San Joaquin Valley favor it. The people of Northern California oppose it, while those in Southern California favor it. If people allow themselves to be sucked into such a war of each against all, then the empire will destroy us. As Ben Franklin said, “Either we hang together or we will all hang separately.” You must fight for the durable solution that LaRouche PAC has proposed.
VI. Now, the Four Projects in Some Detail
In this section each project will be discussed, but do not expect in this report a mass of detail. There are hundreds of individual projects and facilities in just these four main projects of the system.
This map of just the Central Valley and State Water projects should give you an idea of its magnitude and complexity. Please note, this map does not include the hundreds of pumping plants, hydroelectric generating facilities or any of the thousands of miles of pipes, tunnels, and siphons.
25

Figure 22) Major Projects of the Central Valley and State Water Projects
1) The Los Angeles Aqueduct
The Los Angeles Aqueduct is the first of the major water projects built in California. It is the only one of the major water projects in the state not built by FDR or Pat Brown. Construction began in 1906 andit was completed in 1913. Led by William Mulholland, the head of the Los Angeles Department of Water and Power, the City of Los Angeles built, what was called at the time, “The Greatest EngineeringProject in the World.” The aqueduct carries water 233 miles from the Owens Valley and 338 miles from the Mono Lake Basin by gravity to the city of Los Angeles. In 1970 a second parallel aqueduct was completed, which added another 50 percent capacity to the system. The two aqueducts deliver an average of 430 million gallons a day to the city. That is about 400,000 acre feet of water per year.
26
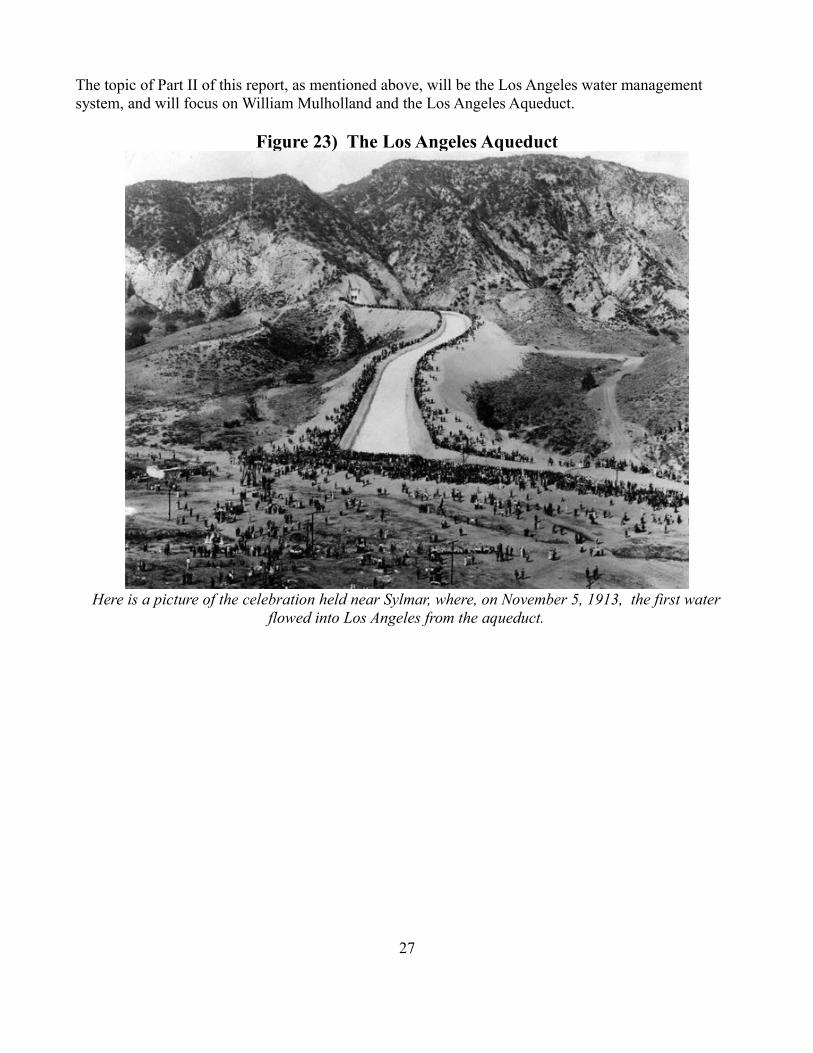
The topic of Part II of this report, as mentioned above, will be the Los Angeles water management system, and will focus on William Mulholland and the Los Angeles Aqueduct.
Figure 23) The Los Angeles Aqueduct
Here is a picture of the celebration held near Sylmar, where, on November 5, 1913, the first waterflowed into Los Angeles from the aqueduct.
27

Figure 24) Los Angeles Aqueduct November 5, 1913
2) The Central Valley Project
The state initiated the project in 1933, and the Federal Government, at the state's request, took it over, and the Bureau of Reclamation built it, beginning in 1935. At President Roosevelt's insistence, the project required that all hydroelectric power generated by the project would be owned by the government. That is, public, not private power, would ensure that the full benefits of the project would be to the population, not private financial interests.
For a more developed presentation of the public vs private power history, see my report “The Fight to Build the Grand Coulee Damand the Economic Revolution That Transformed the Nation.” (12)
The Central Valley Project provides water to 3.1 million people and irrigates over three million acres, delivering over 7 MAFY.
The project consists of more than 40 dams and reservoirs, 25 canals that cover more than 2,000 miles, and 28 hydroelectric plants. The main elements of the project were completed in 1951.
The Central Valley Project is actually divided into three sections: one on the Sacramento River, the second is the Delta, and the third is on the San Joaquin River.
28
(November 5, 1913)- Crowds watch as the water gates are opened and the Los Angeles Aqueduct water starts to flow down into the San Fernando Valley

Figure 25) Central Valley Project
Here is where the Central Valley Project begins, at the Shasta Dam, on the upper Sacramento River.
Figure 26) Shasta Dam and Reservoir
29

Shasta Lake and Trinity Lake are formed by a pair of dams in the mountains north of the Sacramento Valley. Shasta Dam and Lake are the largest structures in the system; the lake holds 4.5 million acre feet. The Shasta Dam power plant produces 680,000 kilowatts of electricity. Trinity Dam and Trinity Lake creates the state's third largest reservoir, holding more than 2.4 million acre feet.
Figure 27) Trinity Dam and Lake
Water from these reservoirs is released into the Sacramento River, which then flows to the Delta. Dams on the American River, a tributary of the Sacramento, and its tributaries, include the Folsom, the Nimbus and Sly Park.
Figure 28) American River Dams
Water from Shasta, and the other reservoirs in the Sacramento River system, flows to the Delta, the
30

second section of the Central Valley Project. The water travels through the Delta to the C.W. Bill JonesPumping Plant, which raises it into the Delta-Mendota Canal. The water then flows 117 miles southwards to the Mendota Pool on the San Joaquin River. Then it is pumped into the San Luis Reservoir. The Delta-Mendota Canal is unique in the sense that man has caused a river to run backwards, as the water from the north flowing San Joaquin is now flowing south in the aqueduct. At the San Luis Reservoir the Delta-Mendota Aqueduct joins with The California Aqueduct of the State Water Project, and heads to Southern California. (See figure 25)
A second canal from the Delta, the Contra Costa Canal, takes water 48 miles southwards to the Martinez Reservoir. This water supplies the cities around North San Francisco Bay.
Figure 29) The Contra Costa Canal-Contra Costa Water District
Here is a map of the rivers of California. Note the San Joaquin River and its major tributaries: The Fresno, Merced, Kern, Chowchilla, Stanislaus and Tuolumne.
31

Figure 30) California Rivers
A major component of the Central Valley project was the development of the San Joaquin River system, including the construction of Friant Dam on the San Joaquin River, northeast of Fresno, built between 1939 and 1944. Water from the Friant Dam is diverted into two canals, the Madera Canal (to the north) and the Friant-Kern Canal (to the south), which flows 154 miles south to Bakersfield, and irrigates the whole eastern side of the San Joaquin Valley. Both of these canals were completed in 1951.The Madera Canal travels north from the dam to the Chowchilla River. Together, these canals provide irrigation water to some 837,000 acres in the San Joaquin Valley. (See figure 25)
Figure 31) Friant Dam
32

An excellent two minute video of the Central Valley Project, produced in 1947, is available on YouTube under the following title: Central Valley Project by WaterEdFoundation.
Here is President John F. Kennedy and Governor Pat Brown inaugurating the construction of the San Luis Dam on August 18, 1962.
Figure 32) President John Kennedy and Governor “Pat” BrownBreaking Ground for the San Luis Reservoir,
3) The State Water Project
Figure 33) The California State Water Project
33

The California State Water Project is the largest state-built project in the nation. Construction of the project began in 1961 and was completed in 1972. It is the landmark accomplishment of Governor Edmund G. “Pat” Brown.
The system consists of 22 dams, 32 lakes and reservoirs, 17 pumping plants, five hydroelectric power plants, and 660 miles of major canals and pipelines, including the 444-mile-long California Aqueduct--the longest in the world. The Aqueduct carries water from north of Redding to the Delta, through the San Joaquin Valley, and is then pumped up 2,000 feet over the Tehachapi Mountains. It goes through Los Angeles and ends in Riverside. On the average, the State Water Project delivers 2.3 MAFY. It provides water for 23 million people and irrigates 755,000 acres of land.
It was especially the large land owners in Kings and Kern counties, in the San Joaquin Valley, that wanted this project. Then the 1956 flood of the Sacramento River that inundated more that 100,000 square miles of the Sacramento Basin and did more than $200 million in damage, propelled the project forward. Had the dams of the project been in place at the time, there would not have been anywhere near that much destruction. In recent decades it is the dams of the project which have prevented furtherbillions of dollars of flood damage.
Figure 35) 1956 Sacramento Flood
The project begins with dams and reservoirs on the upper tributaries of the Feather River, which flow into the Sacramento River. On the Feather River, the tallest dam in the United States, Oroville Dam, at 770 feet, creates the project's largest reservoir, Lake Oroville, holding 3.5 million acre feet.
34

Figure 36) Oroville Dam
Water travels from Lake Oroville to the Sacramento River, then to the Delta. At the Harvey O. Banks Pumping Plant in the Delta, water is lifted to the Bethany Reservoir. The water, now the California Aqueduct-- recently renamed the “Pat” Brown Aqueduct-- then flows south through the San Joaquin Valley, and joins the Delta-Mendota Aqueduct of the Central Valley Project at the San Luis Reservoir.
Here is what the Aqueduct looks like as it flows through the San Joaquin Valley.
Figure 37) The California Aqueduct
35

Figure 38) Another View of the California Aqueduct
From the San Luis Reservoir the water travels through the central San Joaquin Valley. A split-off near Kettleman City carries water into the Coastal Branch Aqueduct, which serves San Luis Obispo and Santa Barbara counties. The main canal then heads to the Tehachapis, where fourteen gigantic pumps lift the water over the mountains. This is the Edmundtson Pumping Plant, which is the highest single-lift pumping plant in the world, which raises the water 1,926 feet to enter the 8.5 miles of tunnels and siphons that cross the mountains.
South of the Tehachapis, the California Aqueduct splits-- the west branch storing water in Pyramid and Castaic lakes, near Castaic-- and the east branch storing water in the Silverwood Lake Reservoir behindCedar Springs Dam, in San Bernardino County. Then the Santa Ana Pipeline takes the water 28 miles to Lake Perris. The project also extends east into Riverside County via the East Branch Extension's Foothill Pipeline.
36
California Aqueduct: the longest man-made river in the world

Figure 39) Castaic Lake
Figure 40) East Branch of California Aqueduct
37

Figure 41) Silverwood Lake
For Southern California this system pours enough water into the Los Angeles area to be able to fill the Rose Bowl every hour and one-half.
The project's hydroelectric plants produce enough electricity to supply the power for all the pumping requirements for lifting the water the 3,000 feet that the system requires, including the 2,000 feet over the Tehachapis.
4) The Colorado River System and Projects
The Colorado River provides 4.4 MAFY to California. This system is the only one of the six major projects in California that also involves other states. Wyoming, Nevada, Utah, Colorado, New Mexico and Arizona, plus the nation of Mexico, share allocated portions of the river's water.
38
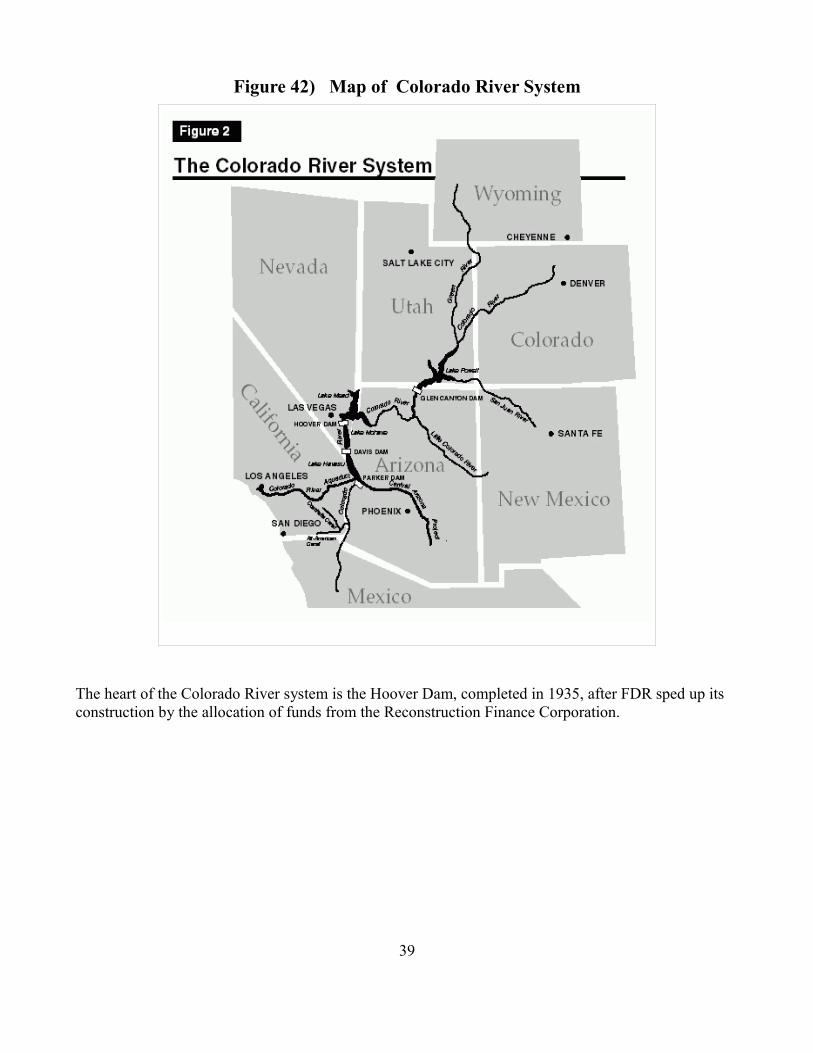
Figure 42) Map of Colorado River System
The heart of the Colorado River system is the Hoover Dam, completed in 1935, after FDR sped up its construction by the allocation of funds from the Reconstruction Finance Corporation.
39

Figure 43) Hoover Dam
There are two main Colorado River projects in California: the Colorado River Aqueduct and the All American Canal. Here is a schematic of the Colorado River Aqueduct and the All American Canal.
Figure 44) Schematic of Colorado River Projects
The Colorado River Aqueduct
40
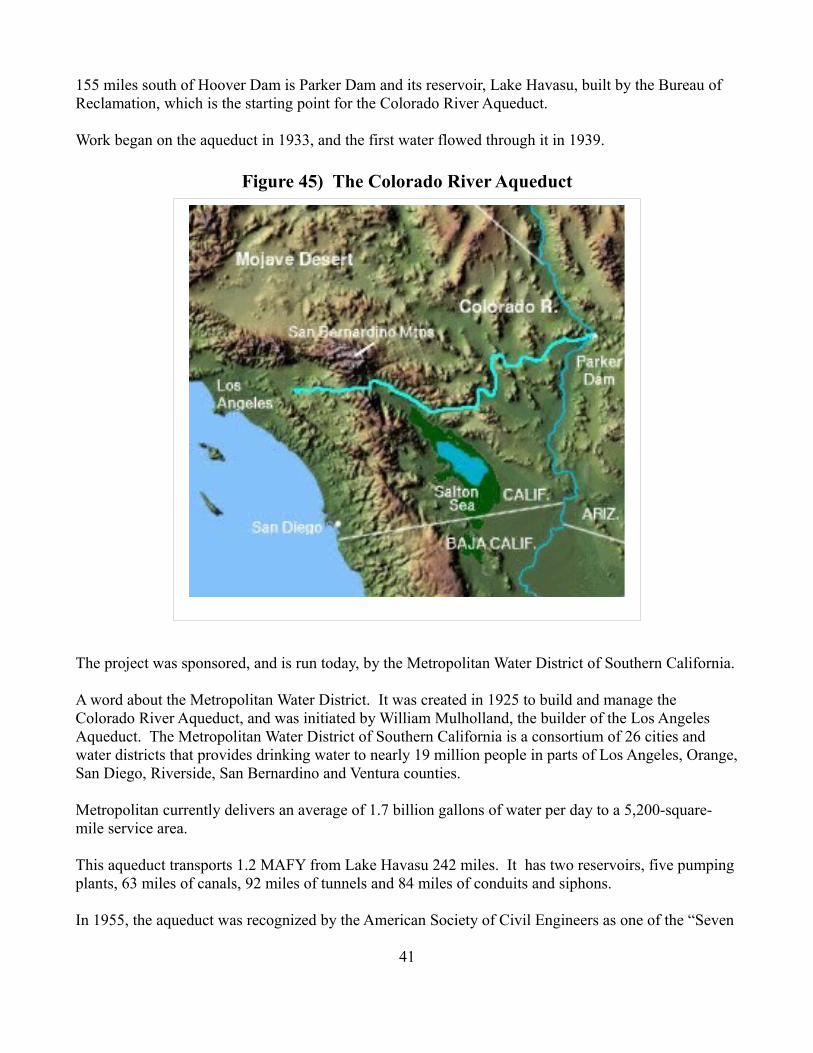
155 miles south of Hoover Dam is Parker Dam and its reservoir, Lake Havasu, built by the Bureau of Reclamation, which is the starting point for the Colorado River Aqueduct.
Work began on the aqueduct in 1933, and the first water flowed through it in 1939.
Figure 45) The Colorado River Aqueduct
The project was sponsored, and is run today, by the Metropolitan Water District of Southern California.
A word about the Metropolitan Water District. It was created in 1925 to build and manage the Colorado River Aqueduct, and was initiated by William Mulholland, the builder of the Los Angeles Aqueduct. The Metropolitan Water District of Southern California is a consortium of 26 cities and water districts that provides drinking water to nearly 19 million people in parts of Los Angeles, Orange,San Diego, Riverside, San Bernardino and Ventura counties.
Metropolitan currently delivers an average of 1.7 billion gallons of water per day to a 5,200-square-mile service area.
This aqueduct transports 1.2 MAFY from Lake Havasu 242 miles. It has two reservoirs, five pumping plants, 63 miles of canals, 92 miles of tunnels and 84 miles of conduits and siphons.
In 1955, the aqueduct was recognized by the American Society of Civil Engineers as one of the “Seven
41

Engineering Wonders of American Engineering.”
Here is how the aqueduct looks as it crosses the desert westward toward Los Angeles.
Figure 46) The Colorado River Aqueduct
Here is a five minute video of the construction of the Colorado River Aqueduct. This video describes the tremendous construction task the aqueduct required much better than can be done in this report. It also demonstrates how we, as a nation of builders, who lived in the future, used to think.
“Construction of the Colorado River Aqueduct to Southern California; Footage from the Metropolitan Water District of Southern California,” is posted on YouTube as Construction of the Colorado Aqueduct to Southern California by danieljbmitchell.
The All American Canal
The All American Canal is an 80-mile long aqueduct which conveys 3.1 MAFY of water from the Colorado River into the Imperial Valley and to nine cities. It is the valley's only water source. This water has turned a desert into one of the most productive agricultural areas of the world. It begins at the Imperial Dam on the Colorado River, and irrigates 630,000 acres.
Built by the Bureau of Reclamation and funded by FDR's Public Works Administration, construction began in the 1930s and was completed in 1942.
The runoff from the irrigated farm land makes up most of the flow of water that drains into the Salton Sea, without which the Salton would completely dry up.
42

Figure 47) The All American Canal
Until 23 miles of the canal was lined with cement between 2007 and 2009, approximately 68,000 AFYwas lost by seepage.
Before and after pictures of the Imperial Valley demonstrate the power of increasing the water-flux density of water.
43

Figure 48) The Imperial Valley in 1918 and Today
Finally, here is a map of the San Diego Aqueduct.
44

Figure 49) Map of San Diego Aqueduct
Water is diverted from the Colorado River Aqueduct at San Jacinto to the San Diego Aqueduct, which delivers water to San Diego County. San Diego purchases the water from the Metropolitan Water District of Southern California. Because no projects have been built for 40 years, and exacerbated by the drought, San Diego is desperate for water. The city imports 80% of its water, coming from the Colorado River Aqueduct, the All American Canal and the State Water Project, which alone provides 30% of the city's water, traveling more than 600 miles.
That is why the city, as I reported earlier, has purchased 180,000 acre feet of water from the Imperial Valley, idling 40,000 acres of farm land, and is building a major desalination plant.
45

VII. Conclusion
Do not get overwhelmed by all the details. Keep your mind on the process of how the whole system and all its individual projects is a system, and an expression of the American System at work. This is the system that those, then, whose minds, through the imagination, lived in the future, and created that which did not exist. They knew and lived the American System of production and progress.
When our government is in the hands of those committed to that American System we create what some would call miracles. Well, it is time to once again create some miracles. Let us once and for all, destroy the British Empire, restore that American System and build NAWAPA. Let us guarantee that future generations will have a glass of water.
Footnotes
1) See the presentation by Harley Schlanger at the Schiller Institute Conference, “A New Paradigm for Mankind-- The Second American Revolution,” San Francisco, CA, June 29, 2013.http://newparadigm.schillerinstitute.com/Also available on YouTube under the title: “Harley Schlanger,” or this link:http://www.youtube.com/watch?v=pIVniIoN0fQ#at=68
See also: “The American Society of Civil Engineers 2013 Report Card for America's Infrastructure.”Every four years the American Society of Civil Engineers releases a Report Card for America's Infrastructure that depicts the condition and performance that depicts the nation's infrastructure in the familiar form of a school report card by assigning letter grades to each type of infrastructure.The summary on state of the nation's dams reads:
Dams: Dams again earned a grade of D. The average age of the 84,000 dams in the country is 52years old. The nation’s dams are aging and the number of high-hazard dams is on the rise. Many of these dams were built as low-hazard dams protecting undeveloped agricultural land. However, with an increasing population and greater development below dams, the overall number of high-hazard dams continues to increase, to nearly 14,000 in 2012. The number of deficient dams is currently more than 4,000. The Association of State Dam Safety Officials estimates that it will require an investment of $21 billion to repair these aging, yet critical, high-hazard dams.
http://www.infrastructurereportcard.org/drinking-water/?utm_campaign=Comm-20130719-ASCE%20eNewsletter&utm_medium=email&utm_source=Eloqua
Or, http://www.infrastructurereportcard.org/a/#p/home
2) LaRouche PAC Weekly Report, June 19, 2013. http://larouchepac.com/node/27021
3) See the following report from LaRouche PAC, which includes a section on how the Dodd-Frank Financial Reform bill of 2010 includes in Article II the mechanism for doing to the American people
46

what was done to the people in Cyprus a few months ago-- depositors funds were seized to bail-out the bank, or as they call it now, a bail-in.LaRouchePAC White Paper Special Report: "Dodd-Frank Kills: How the U.S. Joined the International Bail-In Regime," May 29, 2013. http://larouchepac.com/files/20130528-bail-in_white-paper_0.pdf
4) The Renewable Fuels Standard (RFS) is contributing to at least 250,000 deaths a year, and afflictingmillions more with disease and disability. Since 2005, there have been millions of deaths directly caused by the ethanol mandate, internationally. See the following:
“The Ethanol Mandate Has Already Killed Millions,” LaRouche PAC, July 6, 2013. http://larouchepac.com/node/27243
"Could Biofuel Policies Increase Death and Disease in Developing Countries?" Journal of American Physicians and Surgeons, Vol. 16, No. 1, Spring 2011.
Timothy A. Wise, "The Cost to Developing Countries of U.S. Corn Ethanol Expansion," Tufts University Global Development and Environmental Institute, October 2012
5) LaRouche PAC Weekly Report of April 17, 2013.http://larouchepac.com/node/26253
6) LaRouche PAC Webcast, July 7 2013. http://larouchepac.com/node/27278)
7) Lyndon LaRouche private discussion with associates; unpublished; June 4, 2013.
8) “The Strategic View from the United States,” by Lyndon H. LaRouche, Jr. Speech to the Schiller Institute Conference: “Attaining Freedom Through Necessity: The Last Chance for Humanity,” Frankfurt am Main, Germany, April 13-14, 2013. The below link is the transcript of Mr. LaRouche's speech.
http://www.schillerinstitute.org/conf-iclc/2013/0413_frankfurt/lyn.html
9) LaRouche PAC Weekly Report, July 10, 2013.http://larouchepac.com/node/27296
10) “Making Rain in the American Southwest: How Irrigation Strengthens the Monsoon,” by Jay Famiglietti of University of California, Irvine, February 10, 2013.http://newswatch.nationalgeographic.com/author/jfamigli/
11) I encourage you to watch the LaRouche PAC video, “JFK Speeches Toward a Nationwide TVA-- 1962-1963,” December 6, 2011. These are six speeches by the President in 1962-63 inaugurating waterprojects in the West. It can be found here:http://larouchepac.com/reclaimjfk
47

12) “The Fight to Build the Grand Coulee Dam and the Economic Revolution that Transformed the Nation,” by Patrick Ruckert, February 23, 2013. Available from the author at [email protected]. [email protected]. Also available on You Tube under the title: “Grand Coulee Dam-- History of the Battle to Build It by Patrick Ruckert.”
Sources
I am listing here just some of the hundreds of books, websites, articles and studies that have been consulted in the preparation of this report. Since this report is not intended for neither publication or sale I have not footnoted. In addition, since much of the above material is available from multiple sources, attributing certain facts to specific authors or publications is impossible.
Books:
“William Mulholland and the Rise of Los Angeles,” by Katherine Mulholland, 2000.
“Cadillac Desert: The American West and Its Disappearing Water,” by Marc Reisner, 1986.
“The King of California: J.G. Boswell and the Making of a Secret American Empire,” by Mark Arax and Rick Wartzman, 2003.
“Beyond Chinatown,” by Steven P. Erie, 2006.
“The Geat Thirst-- Californians and Water: A History,” by Norris Hundley, Jr., 2001.
“The Life and Times of Pat Brown-- California Rising,” by Ethan Rarick, 2005.
“Imperial San Francisco-- Urban Power, Earthly Ruin,” by Gray Brechin, 1999.
“Rivers of Empire-- Water, Aridity, and the Growth of the American West,” by Donald Worster, 1985.
“The History of Large Federal Dams: Planning, Design and Construction,” published by the U.S. Army Corps of Engineers and the U.S. Department of the Interior's Bureau of Reclamation and National Park Service, 2005.
Websites:
Here are just a few of many.
Maven's Manor: http://www.mavensmanor.com/
Water and Power Associates: http://waterandpower.org/museum/Water_in_Early_Los_Angeles.html
California Department of Water Resources: http://www.water.ca.gov/swp/history.cfm
48California Water from the Sierra to the Sea: http://sierratosea.ucdavis.edu/ca.html
Aquafornia: http://aquafornia.com/
Articles:
There are too many to list, so here are just a few-- sort of drawn out of the hat. “How Farmers Irrigate in California;” by the Cooperative Extension University of California Division of Agriculture and Natural Resources; 2002.
“Vernadsky and the Biogeochemical Development of N. America's Desert,” by Dennis Small and Richard Freeman, Executive Intelligence Review, May 9, 2003.
“We Will Solve Problems Continuously: We Are Going To Open Up New Frontiers;” speech by Dr. Howard Chang to conference on the North American Water and Power Alliance Conference, December4, 2010. Published in Executive Intelligence Review, December 24, 2010.
“California's Water: An LAO Primer;” published by the California State Legislative Analyst's Office, 2008.
“The alternative to Schwarzenegger's fascism: How California Was Built,” by Robert Ingraham. Unpublished manuscript, 2005.
“Delta water plan would cost $25 billion,” by Bettina Boxall, The Los Angeles Times, May 30, 2013, page AA3.
Carlsbad Desalination Project, San Diego, California, United States of America,” http://www.water-technology.net/projects/carlsbaddesalination/
“Sacramenton River Delta Water System Plan Pits Farmer Against Farmer,” Huffington Post, June 17, 2013.
“In California, What Price Water,” by Felicity Barringer, The New York Times, February 28, 2013.
“China's Huge Water Project 'Going into High Gear,' Time to Break Ground on NAWAPA XXI,” LaRouchepac.com, June 21, 2012.
Appendix: Map of NAWAPA XXI-- Nuclear Desalination Plants
49

NAWAPA XXI: Nuclear Desalination Plants
50