Embed Size (px)
Citation preview
___________________________________________________________________________
2009/TFEP/WKSP/004
California Seismic Safety Commission’s Role in the Development of a Disaster Resistant California
Submitted by: United States
Workshop on the Framework of Long-Term Capacity Building for Disaster Risk Reduction
in APECTaipei, Chinese Taipei
30 November – 1 December 2009
California Seismic Safety Commission’s Role in the Ca o a Se s c Sa e y Co ss o s o e eDevelopment of a Disaster Resistant California
Fault Rupture
Richard McCarthy
Executive Director
Freeway or Local Bridge Collapse
Hazard
California Seismic Safety
Commission
Urban Search and Rescue (USAR)
Shaking-Induced Failures of Bridges
d O i
1755 Creekside Oaks Dr.
Suite 100
Sacramento, California
Steel moment
and Over crossings
OtherHazards
95833
Telephone Number:Steel moment
frame illustration
Hazards
Column Failures
(916) 263-5506
E-mail:
Earthquake-Induced Liquefaction
H dGas Main rupture
InducedLandsides HazardGas Main rupture
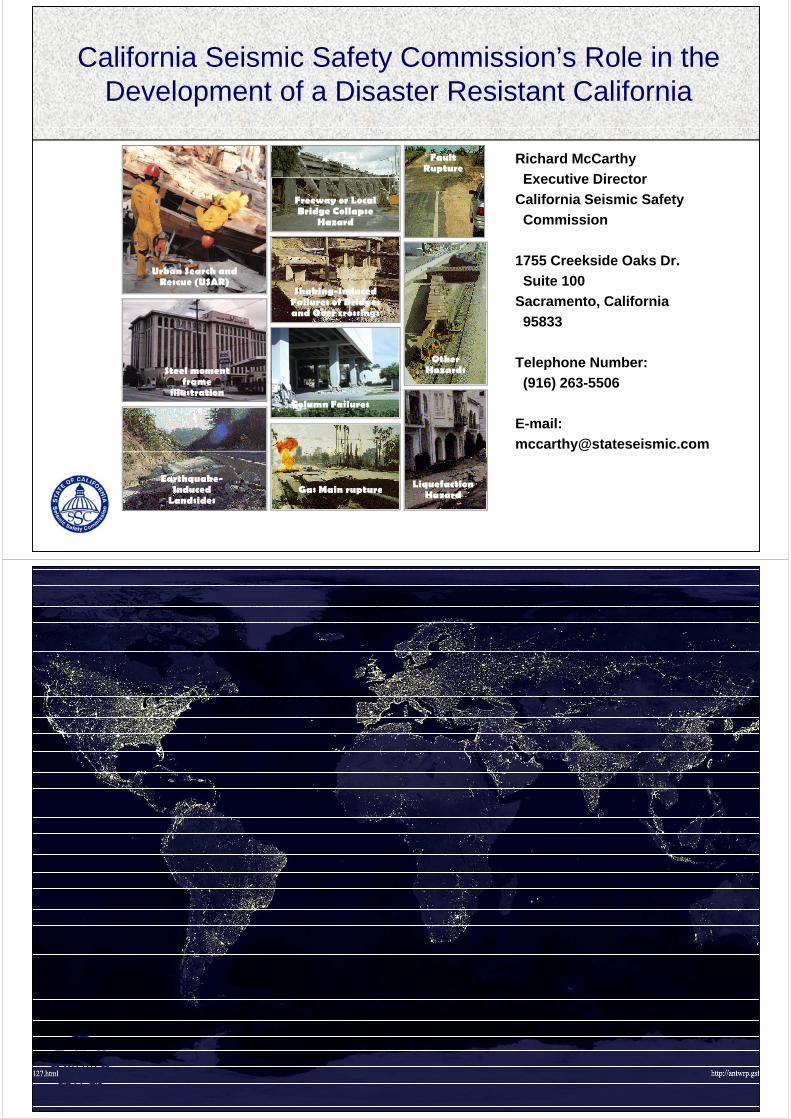
Index Map of Recent Earthquakes in CaliforniaIndex Map of Recent Earthquakes in California--Nevada and of the United StatesNevada and of the United StatesUSGSUSGS--UCBUCB--CaltechCaltech--UCSDUCSD--UNRUNR
Si ifi t D i E th kSi ifi t D i E th kSignificant Damaging EarthquakesSignificant Damaging Earthquakes
Source: California Geological Survey, 1986; Earthquake History Survey, 1986; Earthquake History of the U.S., U.S. Department of Commerce and Interior, 1982; records of California Office of Emergency Services; compiled and revised by California Seismic and revised by California Seismic Safety Commission, 2002.
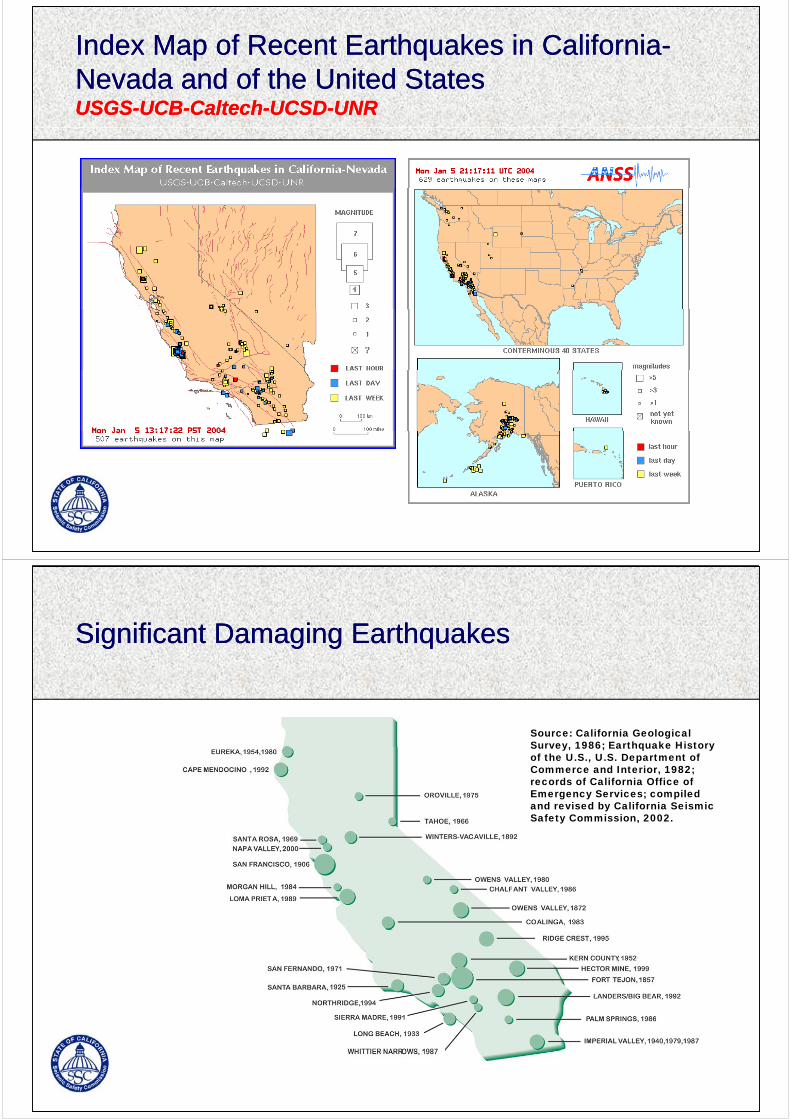
Comparison of U.S. Regional Seismic Risk by Comparison of U.S. Regional Seismic Risk by Co pa so o U S eg o a Se s c s byCo pa so o U S eg o a Se s c s byAnnualized Earthquake Losses (AEL)Annualized Earthquake Losses (AEL)
After HAZUS®99 Estimated Annualized Earthquake Losses for the United States, FEMA 366, Federal Emergency Agency (FEMA), February, 2001.
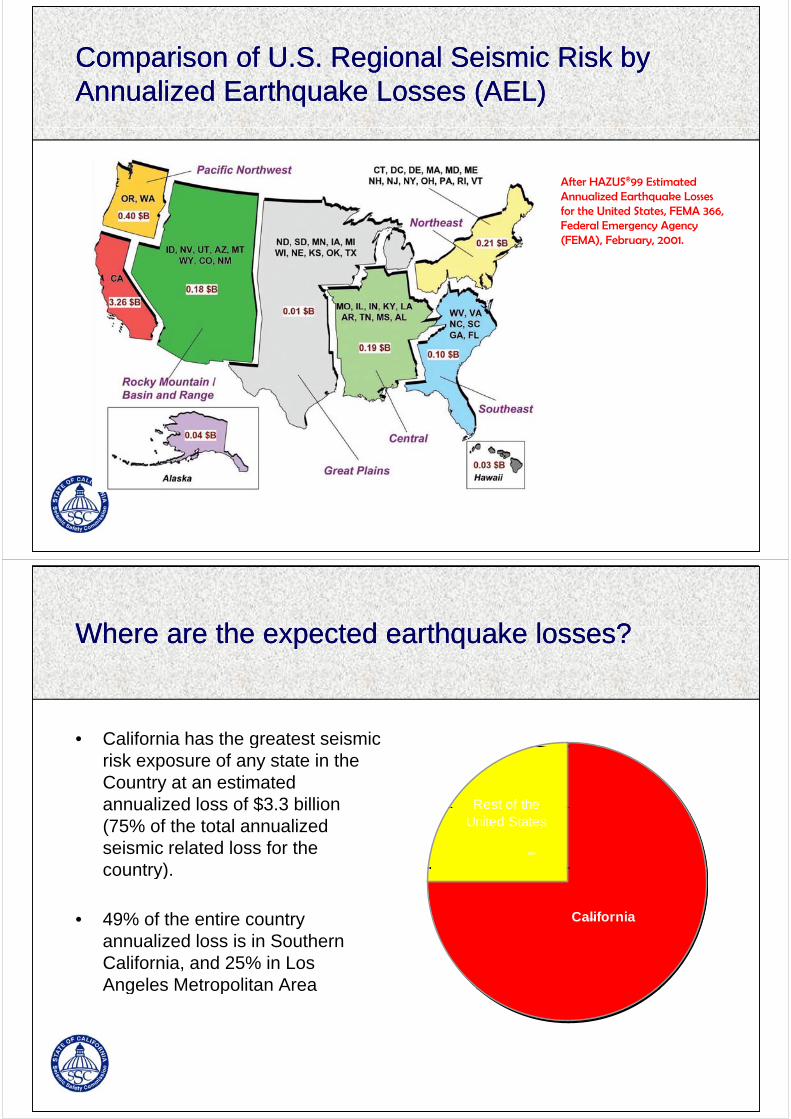
Wh th t d th k l ?Wh th t d th k l ?Where are the expected earthquake losses?Where are the expected earthquake losses?
• California has the greatest seismic grisk exposure of any state in the Country at an estimated annualized loss of $3 3 billion Rest of theannualized loss of $3.3 billion (75% of the total annualized seismic related loss for the country)
25%
Rest of the United States
country).
• 49% of the entire country 75%California
annualized loss is in Southern California, and 25% in Los Angeles Metropolitan AreaAngeles Metropolitan Area
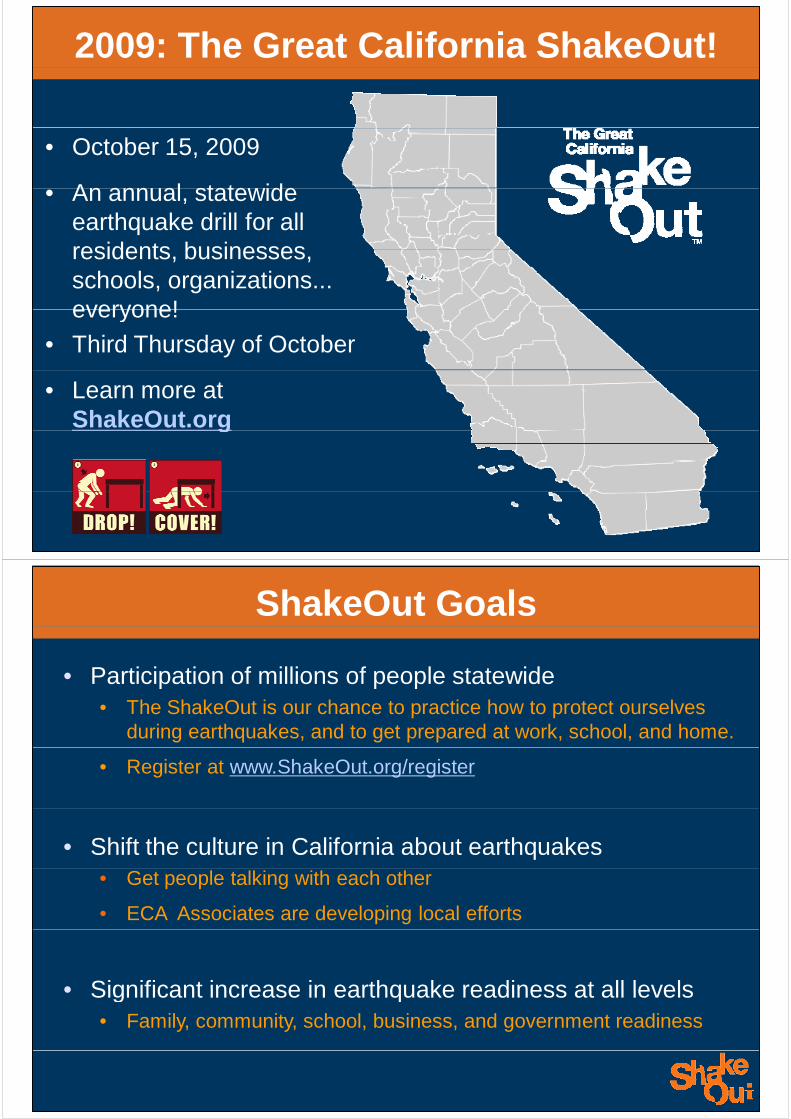
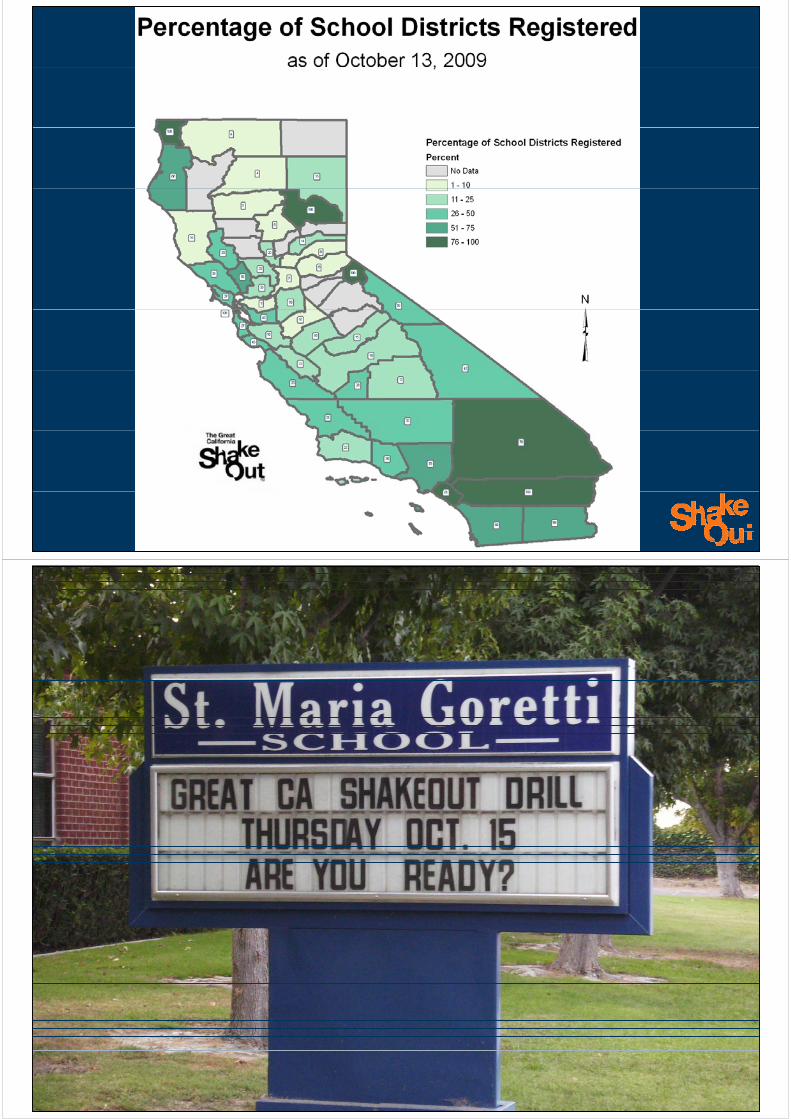
2009: The Great California ShakeOut!
• October 15, 2009
An ann al state ide• An annual, statewide earthquake drill for all residents businessesresidents, businesses, schools, organizations...everyone!everyone!
• Third Thursday of October
• Learn more at ShakeOut.orgg
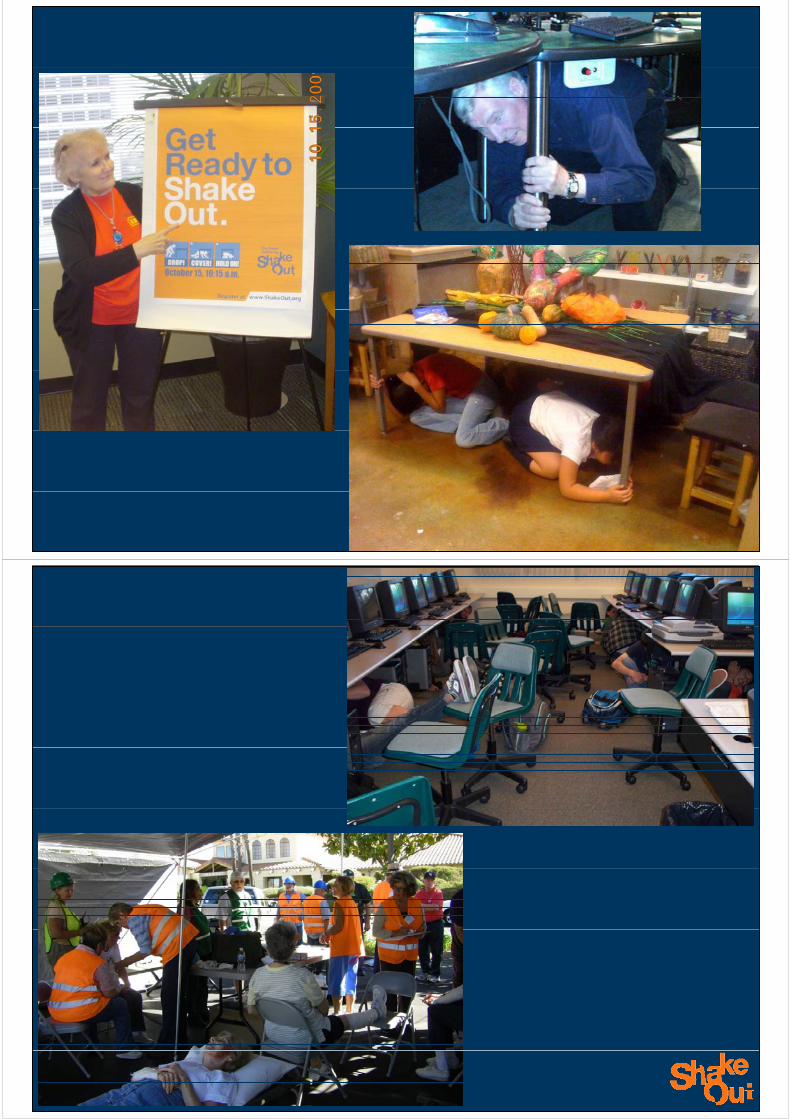
ShakeOut Goals
• Participation of millions of people statewidep p p• The ShakeOut is our chance to practice how to protect ourselves
during earthquakes, and to get prepared at work, school, and home.
• Register at www.ShakeOut.org/register
• Shift the culture in California about earthquakes• Get people talking with each other
• ECA Associates are developing local efforts
• Significant increase in earthquake readiness at all levels• Significant increase in earthquake readiness at all levels• Family, community, school, business, and government readiness
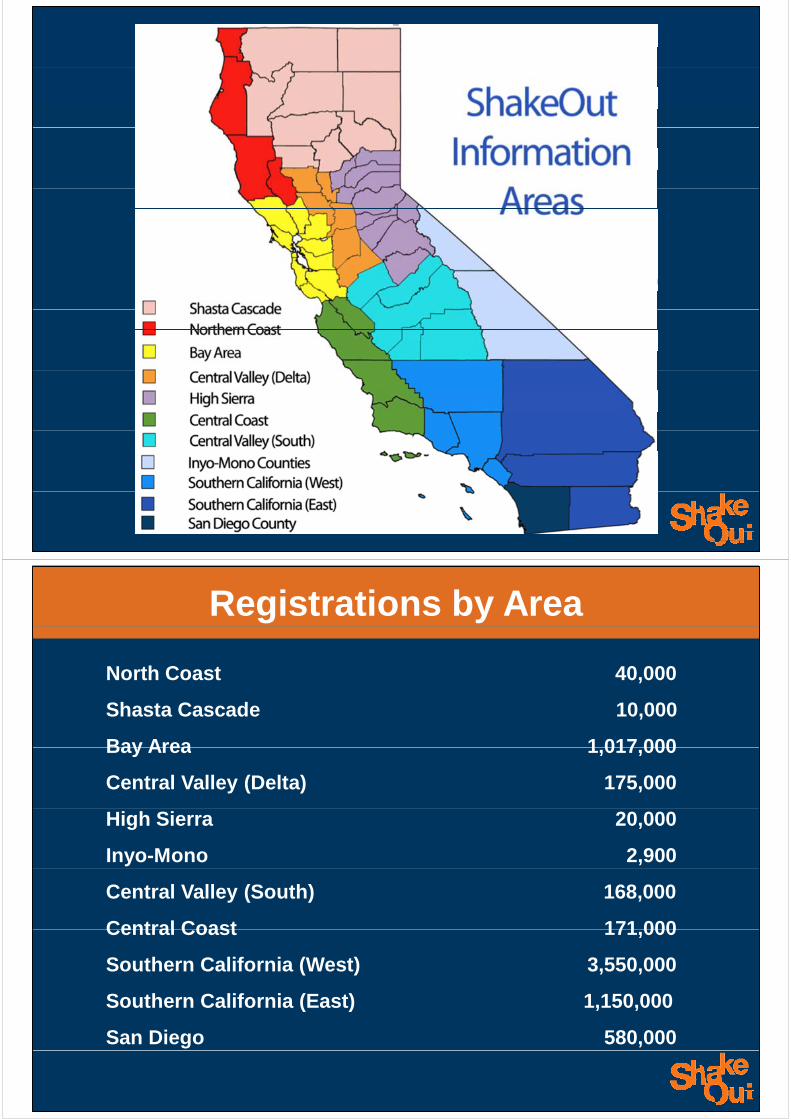
Registrations by Area
North Coast 40,000
Shasta Cascade 10,000
Bay Area 1 017 000Bay Area 1,017,000
Central Valley (Delta) 175,000
High Sierra 20,000
Inyo-Mono 2,900
Central Valley (South) 168,000
Central Coast 171 000Central Coast 171,000
Southern California (West) 3,550,000
Southern California (East) 1,150,000
San Diego 580,000
6
Registrations by Category
K 12 School participants 5 010 000K-12 School participants 5,010,000
Colleges/College Districts/University participants 998,000
Business participants 233,000
Other organizational participants 295,000
Local government agencies/offices/etc. participants 253,000Local government agencies/offices/etc. participants 253,000
State agencies/offices/etc. participants 31,000
Federal agencies/offices participants 63,000
I di id l/f il ti i t 16 000Individual/family participants 16,000
7
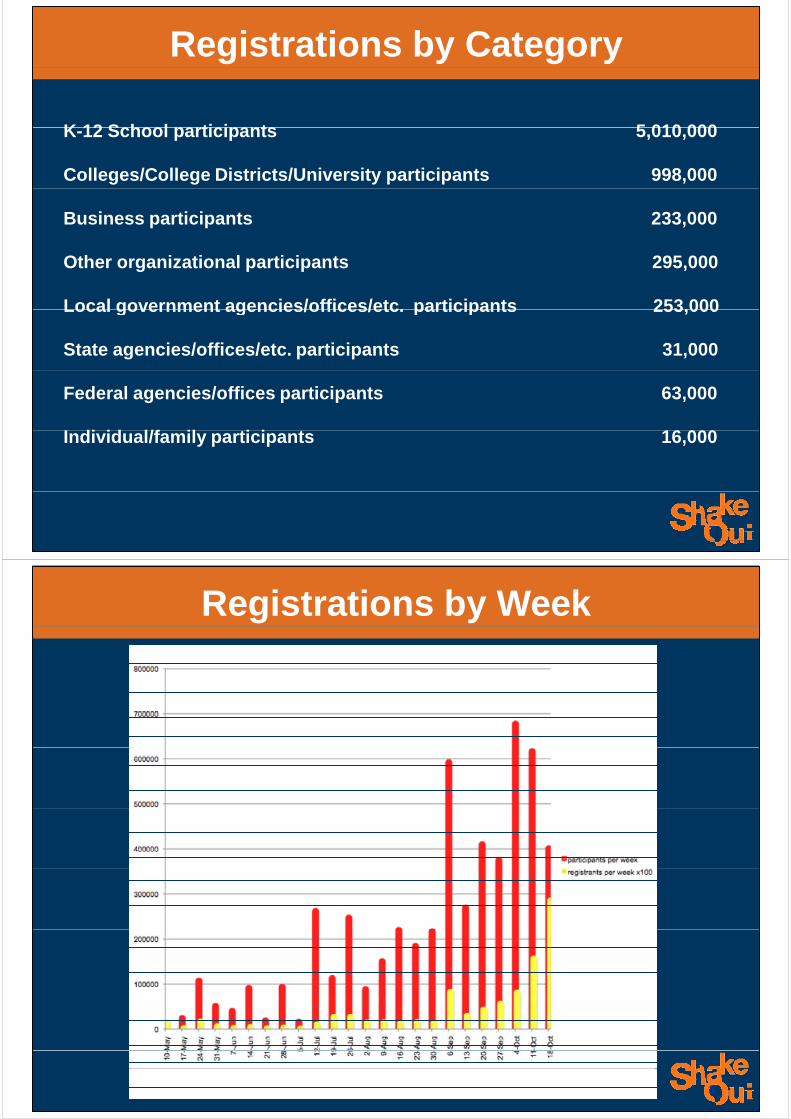
Registrations by Week
8
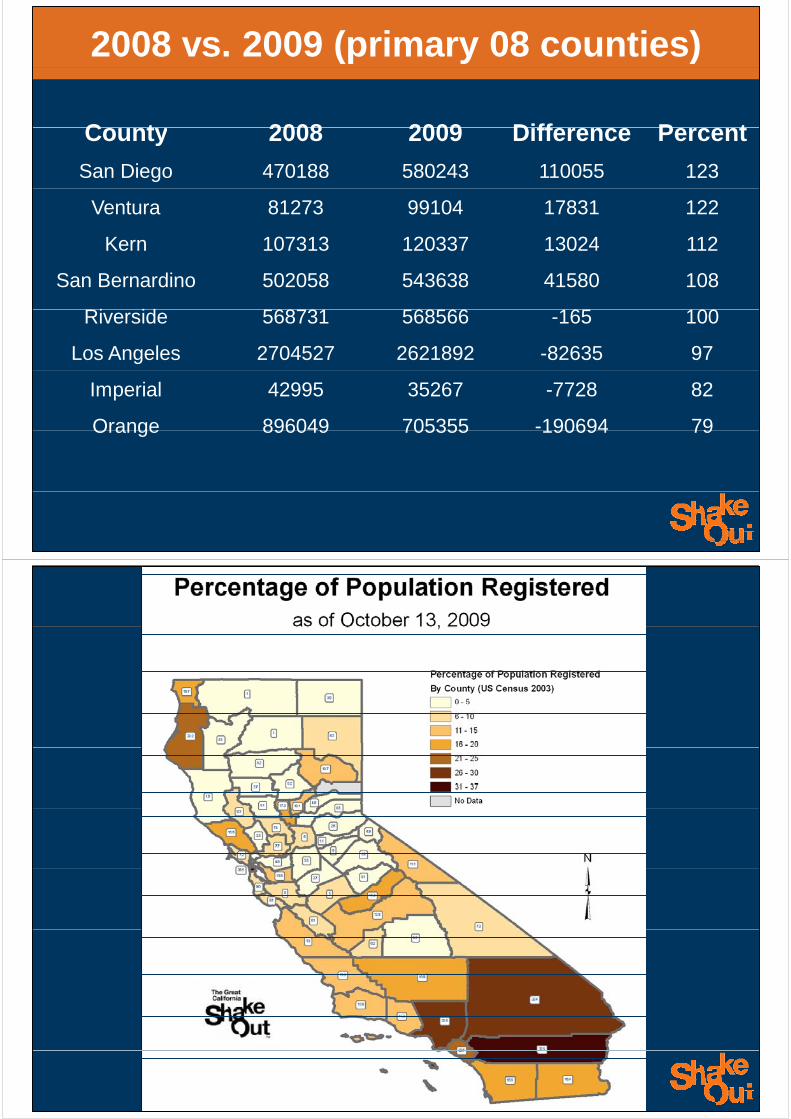
2008 vs. 2009 (primary 08 counties)
C t 2008 2009 Diff P tCounty 2008 2009 Difference Percent
San Diego 470188 580243 110055 123
Ventura 81273 99104 17831 122
Kern 107313 120337 13024 112Kern 107313 120337 13024 112
San Bernardino 502058 543638 41580 108
Ri id 568731 568566 165 100Riverside 568731 568566 -165 100
Los Angeles 2704527 2621892 -82635 97
Imperial 42995 35267 -7728 82
Orange 896049 705355 -190694 79Orange 896049 705355 190694 79
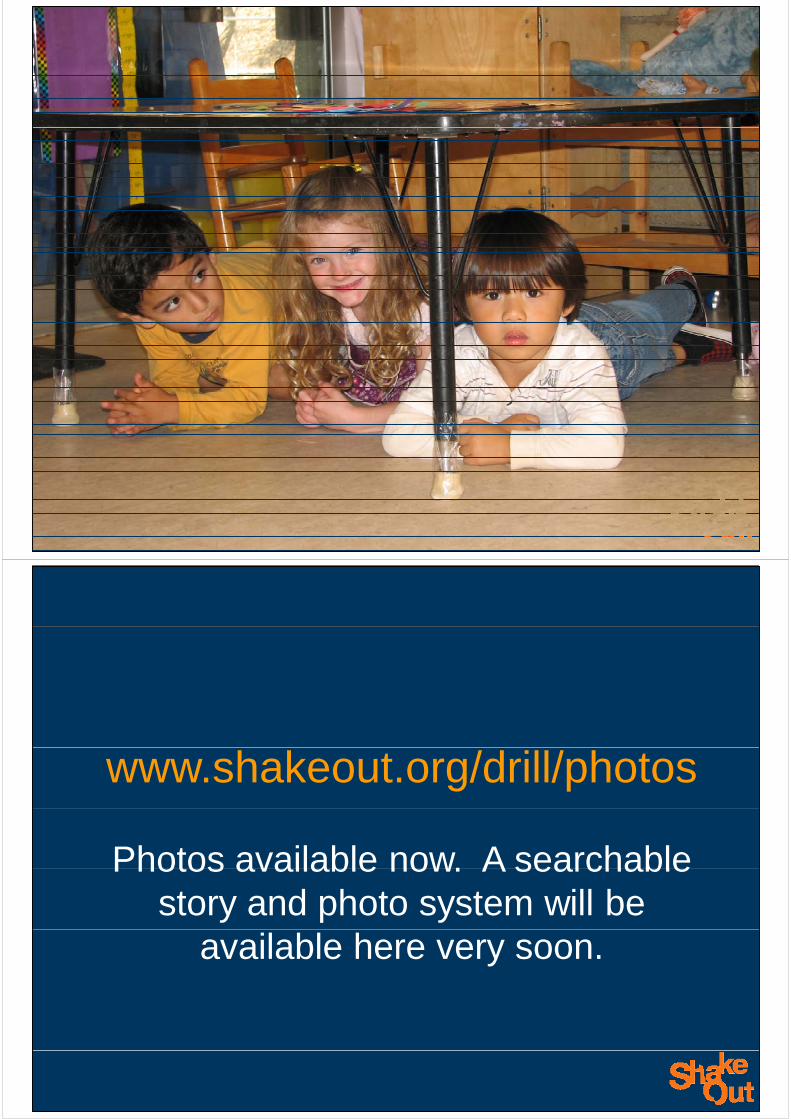
www.shakeout.org/drill/photos
Photos available now. A searchablePhotos available now. A searchable story and photo system will be
available here very soon.
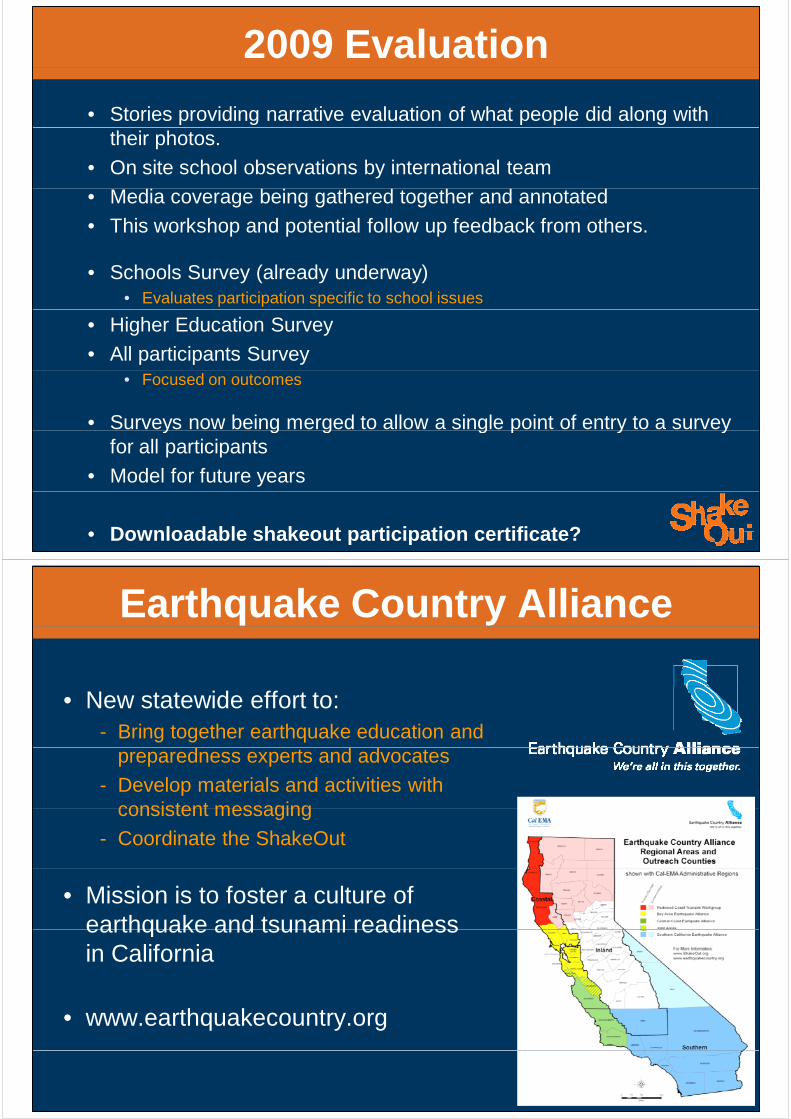
2009 Evaluation
• Stories providing narrative evaluation of what people did along with their photos.
• On site school observations by international team
• Media coverage being gathered together and annotated
• This workshop and potential follow up feedback from others.
• Schools Survey (already underway)• Evaluates participation specific to school issues
• Higher Education Survey
• All participants Survey• Focused on outcomes
• Surveys now being merged to allow a single point of entry to a survey y g g g p y yfor all participants
• Model for future years
• Downloadable shakeout participation certificate?
Earthquake Country Alliance
• New statewide effort to:- Bring together earthquake education and
preparedness experts and advocates
- Develop materials and activities with consistent messagingconsistent messaging
- Coordinate the ShakeOut
• Mission is to foster a culture of earthquake and tsunami readinessearthquake and tsunami readiness in California
• www.earthquakecountry.org
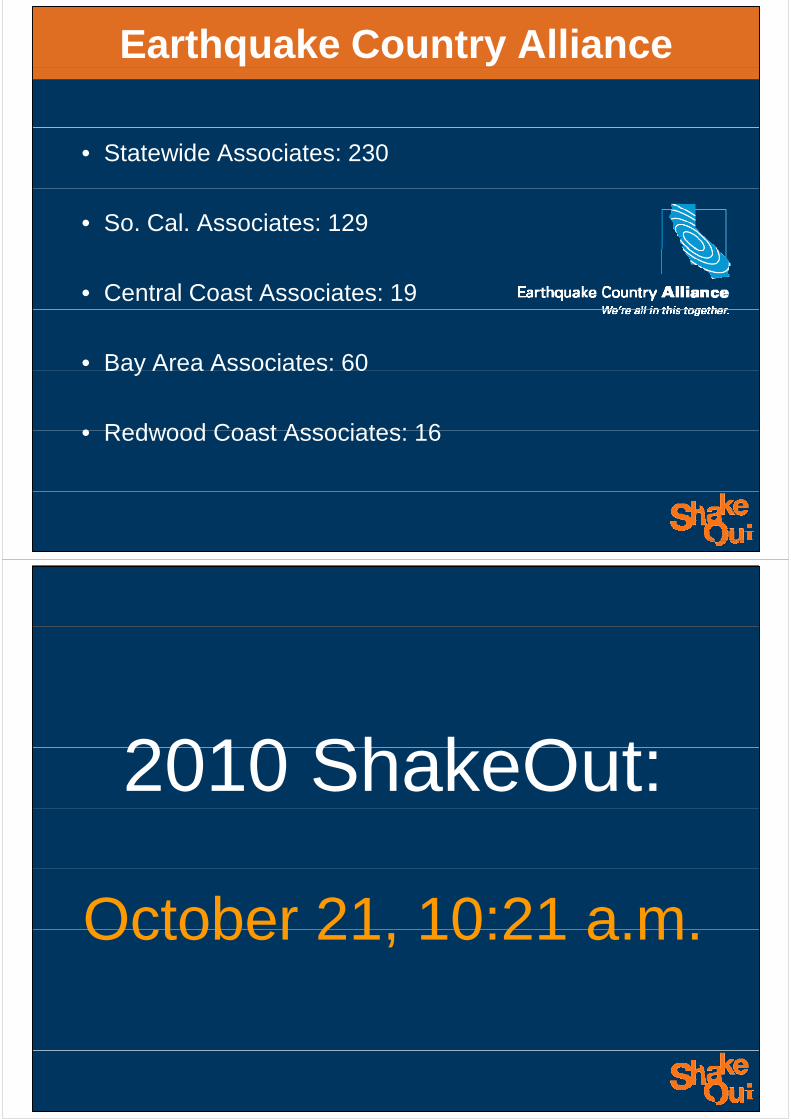
Earthquake Country Alliance
• Statewide Associates: 230
• So. Cal. Associates: 129
• Central Coast Associates: 19
• Bay Area Associates: 60Bay Area Associates: 60
• Redwood Coast Associates: 16• Redwood Coast Associates: 16
2010 Sh k O t2010 ShakeOut:
October 21 10:21 a mOctober 21, 10:21 a.m.
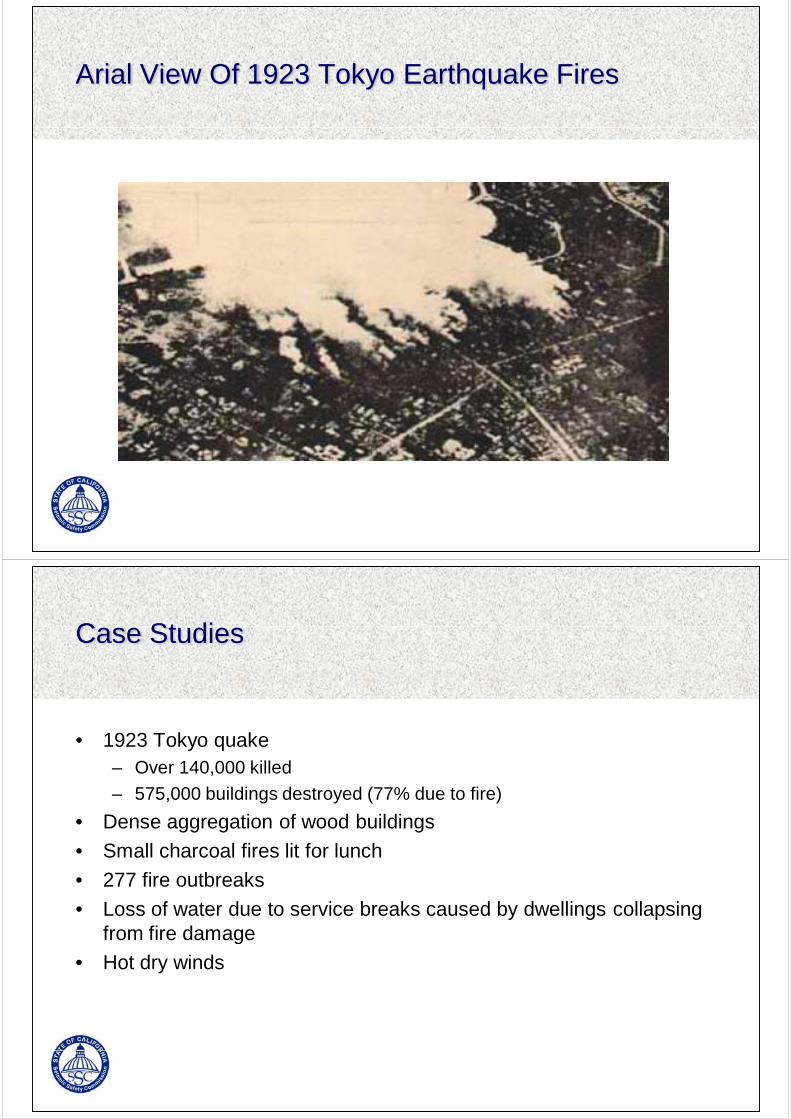
A i l Vi Of 1923 T k E th k FiArial View Of 1923 Tokyo Earthquake Fires
C St diCase Studies
• 1923 Tokyo quakey q– Over 140,000 killed
– 575,000 buildings destroyed (77% due to fire)
• Dense aggregation of wood buildings
• Small charcoal fires lit for lunch
• 277 fire outbreaks
• Loss of water due to service breaks caused by dwellings collapsing from fire damagefrom fire damage
• Hot dry winds
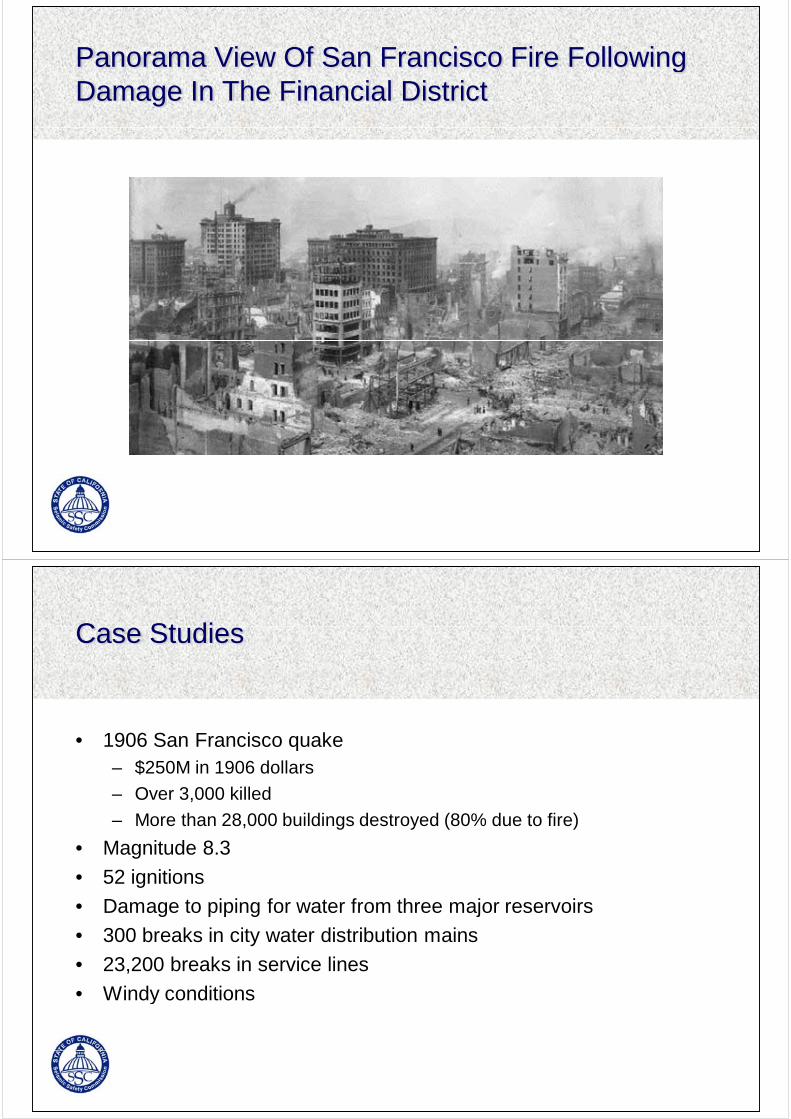
Panorama View Of San Francisco Fire Following gDamage In The Financial District
C St diCase Studies
• 1906 San Francisco quakeq– $250M in 1906 dollars
– Over 3,000 killed
– More than 28,000 buildings destroyed (80% due to fire)
• Magnitude 8.3
• 52 ignitions
• Damage to piping for water from three major reservoirs
300 b k i it t di t ib ti i• 300 breaks in city water distribution mains
• 23,200 breaks in service lines
Windy conditions• Windy conditions
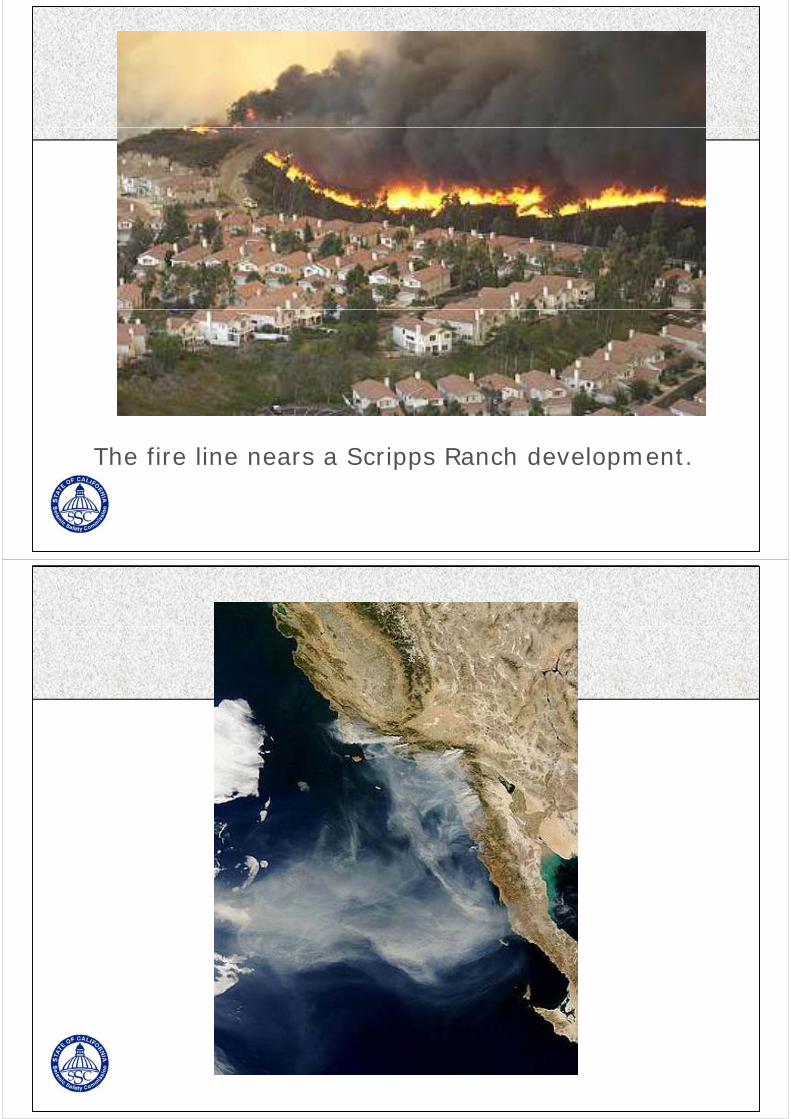
The fire line nears a Scripps Ranch development.
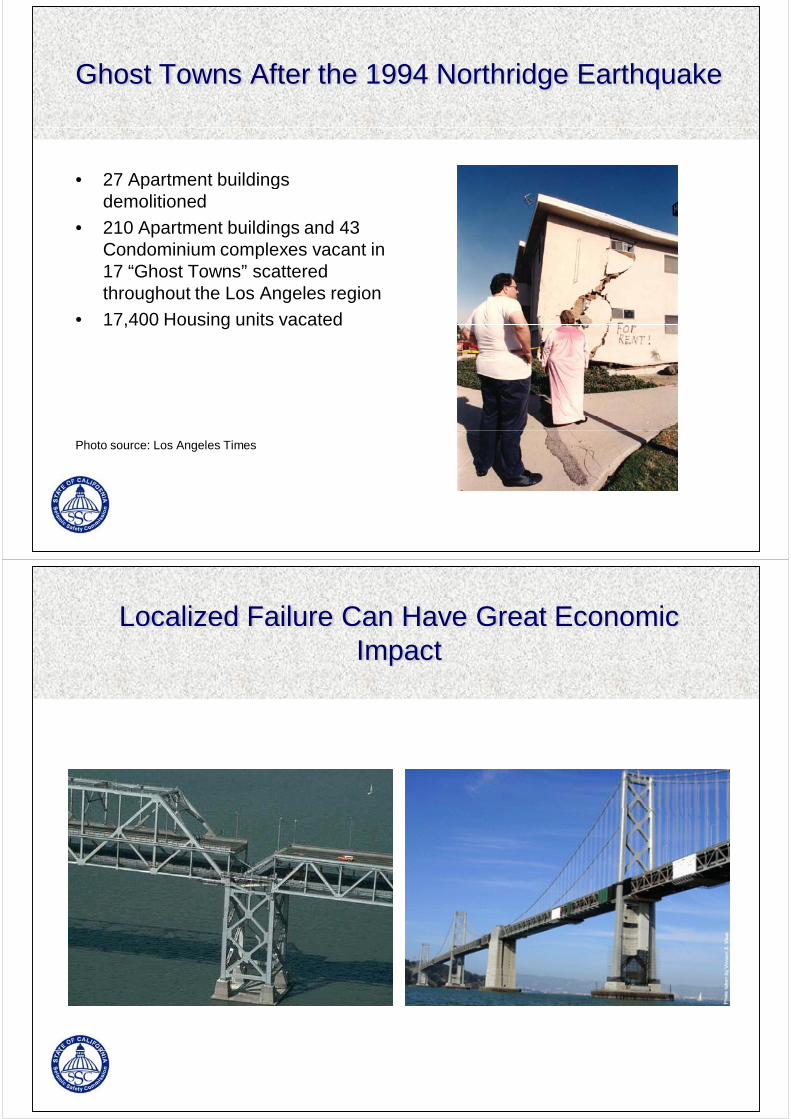
Gh t T Aft th 1994 N th id E th kGhost Towns After the 1994 Northridge Earthquake
• 27 Apartment buildings p gdemolitioned
• 210 Apartment buildings and 43 Condominium complexes vacant inCondominium complexes vacant in 17 “Ghost Towns” scattered throughout the Los Angeles region
• 17,400 Housing units vacated
Photo source: Los Angeles Times
Localized Failure Can Have Great Economic Impact