Embed Size (px)
Citation preview

1
CALIFORNIA INFRASTRUCTURE AND ECONOMIC DEVELOPMENT BANK (IBank)
STAFF REPORT
INFRASTRUCTURE STATE REVOLVING FUND PROGRAM (ISRF) DIRECT FINANCING EXECUTIVE SUMMARY
Applicant:
The City of San Luis Obispo (City)
ISRF Project Type:
Water Treatment and Distribution
Financing Amount:
$14,300,000 (Financing)
Financing Term:
20 years
Interest Rate:
2.50%1
Source of Repayment:
Net system revenues (Net Revenues) and all legally available amounts in the Water Enterprise Fund (Fund)
Existing Debt Rating/Date:
S& P AA-, June 14, 2018
Project Name:
Water Energy Efficiency Project (Project)
Project Location:
1900 Stenner Creek Road, San Luis Obispo, CA 93401 (Water Treatment Plant Address) and various locations throughout the City of San Luis Obispo.
Project Description / Sources and Uses of Proceeds: The Project includes, but is not limited to, upgrades and improvements to the following components of the City’s Water Treatment Plant (WTP) and water delivery system (System): 1) Ozone sanitation system, 2) transfer pump station, 3) plant service water system, and 4) supervisory control and data acquisition (SCADA) controls.
Use of Financing Proceeds:
The Financing would fund all components necessary to complete the Project, including but not limited to equipping, machinery, installation, design, engineering, architecture, construction,
construction contingency 2
, demolition, removal, resurfacing, restoration, landscaping, environmental review, permitting, construction management, project administration, and general project development activities. IBank’s loan origination fee will be paid by the City.
Project Uses
Project Sources
IBank
City of San Luis
Obispo Total
Water Energy Efficiency Project $14,300,000 $14,300,000
Origination Fee $143,000 $143,000
Total $14,300,000 $143,000 $14,443,000
1 Interest Rate quoted November 12, 2019 2 Staff concludes no contingency needed since the Fund has over $17 million in unrestricted cash.

2
Credit Considerations:
Cash flow and debt service analysis for the Financing is summarized as follows:
2014 2015 2016 2017 2018
Cash Available for Debt Service 5,333,353 4,986,944 4,230,459 3,762,840 4,224,334
Total Existing MADS Debt Service 1,462,900 1,462,900 1,462,900 1,462,900 1,462,900
Proposed IBank MADS (1) 953,206 953,206 953,206 953,206 953,206
Total Obligations MADS $2,416,106 $2,416,106 $2,416,106 $2,416,106 $2,416,106
Debt Service Coverage Ratio (2)2.21 2.06 1.75 1.56 1.75
(1) Calculated as $14,300,000 at 2.50% for 20 years(2)
CASH FLOW
For Fiscal Year Ending (FYE) June 30
Debt Service Calculation
Existing Parity Debt Minimum Required DSCR 1.25
Analysis of the historical cash flow over the last five years demonstrates the Fund has the capacity to service the proposed Financing with a debt service coverage ratio (DSCR) of 1.56 or greater in all five years reviewed. Refer to the Cash Flow and Debt Service Analysis section of this Staff Report for further details.
Support for Staff Recommendations:
1. Cash flow demonstrates the Fund’s ability to service existing debt and proposed Financing. 2. The District has successfully increased rates to maintain its debt service. 3. The estimated useful life of the Project is 20 years, which meets the term of the Financing.
Special Terms and Conditions:
1. Changes to the District’s rate structure will comply with the requirements of Proposition 218 (Prop 218), the statutes implementing it, and any case law interpreting it. Further, the District is to notify IBank immediately upon the filing of any legal challenge to its rates or charges.
2. No disbursements will be allowed until the City provides evidence reasonably satisfactory to IBank that all parity debt conditions precedent set forth in the State Water Resources Control Board (SWRCB) financing agreement have been satisfied and the City’s Utilities Manager (or appropriate official) to certify the SWRCB debt has been retired.
Criteria Waivers
1. The Criteria requires that financing applicants pre-qualify contractors bidding on an IBank-financed project using the Department of Industrial Relations’ model pre-qualification questionnaire (the “Model Questionnaire”). The City normally pre-qualifies its public works contractors with its own internally-required pre-qualification questionnaire, which is substantially similar to the Model Questionnaire. However, the City relates that the City’s Charter exempts the Project from compliance with the City’s standard procurement process. Additionally, Government Code Section 4217.1, et. seq., allows the City to forego standard procurement processes for energy projects. Therefore, the City requests that the Board waive compliance with the Criteria requirement that contractors be pre-qualified using the Model Questionnaire.
IBank Staff:
Lina Benedict, John Weir, John Lee
Date of Staff Report:
January 6, 2020
Date of IBank Board Meeting:
February 26, 2020
Resolution Number:
20-02
Staff Recommendation: Staff recommends approval of Resolution No. 20-02 authorizing ISRF Program financing to the City of San Luis Obispo for the Water Energy Efficiency Project in an amount not to exceed $14,300,000.

3
The City of San Luis Obispo (City) requests Infrastructure State Revolving Fund (ISRF) Program financing in the amount of $14,300,000 to fund the City’s Water Energy Efficiency Project (Project). The Project is expected to begin construction in March 2020 and be completed in one year. The Project will include the following upgrades and improvements to the City’s Water Treatment Plant (WTP) and water delivery system (System):
1. Ozone System Upgrade
2. Transfer Pump Station Upgrades
3. Plant Service Water System Upgrades
4. Supervisory control and data acquisition (SCADA) Control Upgrades
The specific elements of the Project include, but are not limited to the following: Ozone System Upgrade
The WTP treats water from the City’s three water sources; the Whale Rock Reservoir, the Salinas Reservoir (Santa Margarita Lake), and the Nacimiento Water Project. Treating raw water through the ozone process has proven to be an effective disinfectant for these water sources. The current equipment is approximately 25 years old and is experiencing increased service and repair costs. The largest cost associated with increased maintenance is the ozone system generators which have become difficult to service due to the scarcity of replacement parts and overall obsolescence. The Project will include a new ozone generation system that offers improved reliability, functionality and increased energy efficiency. Transfer Pump Station Upgrades
Transfer Pump Station upgrades include variable control systems to eliminate pressure spikes
and to modulate pump speeds to meet variable demand. Upgrading will improve overall
system efficiency by optimizing energy use and reducing staff requirements for manual
operation.
Plant Service Water System Upgrades
The WTP maintains an internal cooling system to service the equipment used in the treatment
process including ozone generators, power supply units, and air compressors. Following the
installation of the new ozone system, the existing booster pumps used in this system will be
inadequately configured for the water-cooling system. The Project will replace the existing
equipment with a variable speed pump to more efficiently maintain service, reduce
maintenance costs, and will be compatible with the new ozone system generators.
SCADA Control Upgrades
The existing control system is confined to the WTP at Stenner Creek Road and currently has no capability for remote access or interface with systems outside of the plant. In addition, the existing controllers consist of an aging platform with limited availability of spare parts and service providers which results in continually rising maintenance costs. The Project will
PROJECT DESCRIPTION

4
upgrade or replace existing controllers to a modern platform that will allow the monitoring and optimization of connected systems that comprise the entire system.
PUBLIC AND PROJECT BENEFITS The objective of the Project is to satisfy the City’s major goals outlined in its 2019-2020 Financial Plan. Key elements of the goals include assessing the requirements to achieve a “net-zero carbon City” target and implementing cost-effective measures. The Project is expected to contribute towards this goal by reducing green-house gas emissions from City operations by as much as 15% of the reduction target and 29% of the WTP’s target identified in the City’s Climate Action Plan. In addition to the operational need, the Project’s proposed efficiency measures are expected to reduce the City’s water utility’s current annual electricity consumption by nearly 19% which is estimated to equal $115,830 in annual energy costs. In addition, new equipment and operating efficiencies are projected to achieve annual operation and maintenance savings of $11,230 for a combined savings of $127,060 per year. Other benefits of the Project are aligned with the City’s vision to create community assets that provide economic, social, and environmental value to the community and include:
leveraging renewable energy generation by maximizing the use of on-site solar generation and capitalizing on hydro generation
Reducing energy consumption, improving infrastructure, and enhancing operational resiliency
The City is located 190 miles north of Los Angeles in southern California’s Central coast region. The city has a total area of 10.8 square miles of which 10.6 square miles is land and 0.18 square miles (1.66%) is water. Situated in a coastal valley approximately 10 miles inland from the Pacific Ocean, the City’s Mediterranean climate provides for mild and dry summers and cool winters, with an annual average of about 23 inches of precipitation. The City has 15,300 water connections servicing approximately 46,800 full time residents and a day-time population of over 70,000 which includes a significant number of individuals who commute into the City for work or leisure. The Project service area is shown in Exhibit 1. The City is a full-service charter city that provides police, fire, water, sewer, streets, transit, parking, planning, building, engineering, and parks and recreation service to the community. The City operates under the Council-Mayor-City Manager form of government. There are four Council members who are elected and serve overlapping four-year terms. The Mayor is also elected for a two-year term and serves as an equal member of the Council. The City Council appoints the City Manager. All other department heads are appointed by the City Manager. In addition to services provided within City limits, through the use of a special agreement, the City provides water treatment services to California Polytechnic State University (Cal Poly). Cal Poly has its own water rights and raw water conveyance system that delivers raw water to the City's water treatment plant.
GENERAL CITY INFORMATION

5
The City procures raw water from three primary surface sources: Whale Rock Reservoir, Salinas Reservoir (Santa Margarita Lake), and Nacimiento Reservoir, to provide a clean, dependable supply of raw water for treatment at the WTP. In addition, the system provides highly treated recycled water from the City’s Water Resource Recovery Facility that is used for irrigation and other approved purposes such as dust control and compaction on construction sites. Primary Water Supplies The Salinas Reservoir is owned by the Army Corps of Engineers (the Corps). The Corps contracts with the City to deliver the full yield of the reservoir and the City pays all costs associated with the reservoir’s water delivery operation. The Whale Rock Reservoir is jointly owned by the City, the California Men's Colony, and the California Polytechnic State University at San Luis Obispo with the City owning 55% of the storage rights. The Nacimiento Reservoir is owned and operated by the Monterey County Water Resources Agency (MCWRA). Under an agreement with the County of San Luis Obispo (County), MCWRA gives the County annual water rights to 17,500 acre-feet (AF) of which the City is entitled to 5,482 AF. The three primary water sources plus treated recycled water combined provide the City up to 10,130 AF of annual yield. Recycled Water Supply The City currently utilizes tertiary treated recycled water for irrigation purposes for roughly 50 large irrigation customers within City limits. Recycled water use is currently around 230 AF per year with the potential to increase to nearly 1,000 AF per year. Water Distribution The City’s potable water distribution system delivers water from the WTP to approximately 15,500 metered customers and over 2,000 fire hydrants via two storage reservoirs, five hydro-pneumatic tanks, eight pump stations, ten water tanks, and approximately 185 miles of water mains. Over the next 5 years the City anticipates between 200 and 250 new metered water connections to be installed annually. Given the mild climate on the central coast and the increase in new residents, these properties are projected to increase water demand by 0.67% annually.
System Capital Improvement Plan (CIP) The Project addresses significant capital improvements. In addition to the Project, the City also has plans for a number of water projects that will be under construction in the next few years addressing aging infrastructure and regulatory requirements. This includes waterline replacements, pipeline repairs to the Salinas Reservoir pipeline that delivers water to the City and work on pipelines associated with the Nacimiento Reservoir. The following table reflects that the Number of Users by Category has remained relatively
SYSTEM DESCRIPTION

6
stable over the five years. The table further reflects a high proportion of residential users, which is consistent with the residential nature of the City.
For Fiscal Year Ending (FYE) June 30 2014 2015 2016 2017 2018
Residential 12,761 12,937 13,082 13,148 13,282
Commercial 1,665 1,674 1,685 1,685 1,690
Other 544 547 553 560 565
Total 14,970 15,158 15,320 15,393 15,537
% change N/A 1.26% 1.07% 1.55% 0.94%
Source: Financing Application Addendum
NUMBER OF USERS BY CATEGORY
The table below displays Current System Revenues as of June 30, 2019. Residential users accounted for 58.8% of Gross Annual Revenues.
Annual Usage
(CCF)(1)% Annual Usage
Gross Annual
Revenue
% Gross Annual
Revenue
Residential 1,208,148 57.0% $11,645,223 58.8%
Commercial 685,095 32.0% 5,677,478 28.7%
Other 228,812 10.8% 2,484,930 12.5%
Total 2,122,055 99.8% $19,807,631 100.0%
Source: Financing Application(1) Hundred cubic feet
CURRENT SYSTEM USAGE & REVENUE
The City hires a consultant to study the City's revenue requirements, ensure rates adhere to Proposition 218, and to recommend rate increases. Prior to rate adoption, the City conducts a Proposition 218 protest process by sending a ballot to all water customers and all City property owners. Over the past three years, rate increases have been unanimously adopted by the City Council as shown in the table below.
Date Adopted Date Effective Percent Increase
June 19, 2019 July 1, 2019 5.50%
June 19, 2018 July 1, 2018 2.90%
June 6, 2017 July 1, 2017 5.00%
June 14, 2016 July 1, 2016 0.00%
June 16, 2015 July 1, 2015 0.00%
Source: Financing Application Addendum
HISTORICAL RATE INCREASES OF THE PAST FIVE YEARS
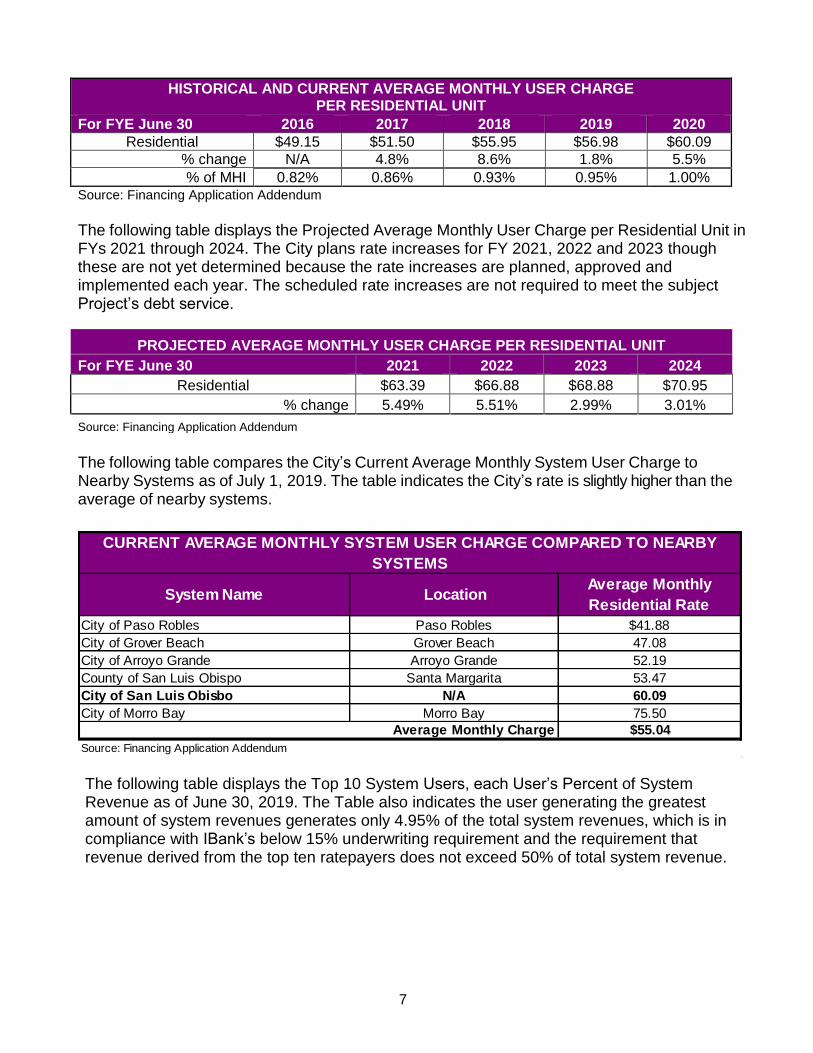
The following table displays the Historical and Current Average Monthly User Charge per Residential Unit and the year-over-year percent increases since FY 2016. The table also reflects each year’s charge as a percent of the City’s Median Household Income (MHI) for residential units as of FY 2019. The table demonstrates the percentages paid by ratepayers are all well below the 2.0% of the MHI affordability threshold established by the California Department of Public Health.
7
HISTORICAL AND CURRENT AVERAGE MONTHLY USER CHARGE PER RESIDENTIAL UNIT
For FYE June 30 2016 2017 2018 2019 2020
Residential $49.15 $51.50 $55.95 $56.98 $60.09
% change N/A 4.8% 8.6% 1.8% 5.5%
% of MHI 0.82% 0.86% 0.93% 0.95% 1.00% Source: Financing Application Addendum
The following table displays the Projected Average Monthly User Charge per Residential Unit in FYs 2021 through 2024. The City plans rate increases for FY 2021, 2022 and 2023 though these are not yet determined because the rate increases are planned, approved and implemented each year. The scheduled rate increases are not required to meet the subject Project’s debt service.
PROJECTED AVERAGE MONTHLY USER CHARGE PER RESIDENTIAL UNIT
For FYE June 30 2021 2022 2023 2024
Residential $63.39 $66.88 $68.88 $70.95
% change 5.49% 5.51% 2.99% 3.01%
Source: Financing Application Addendum
The following table compares the City’s Current Average Monthly System User Charge to Nearby Systems as of July 1, 2019. The table indicates the City’s rate is slightly higher than the average of nearby systems.
System Name LocationAverage Monthly
Residential Rate
City of Paso Robles Paso Robles $41.88
City of Grover Beach Grover Beach 47.08
City of Arroyo Grande Arroyo Grande 52.19
County of San Luis Obispo Santa Margarita 53.47
City of San Luis Obisbo N/A 60.09
City of Morro Bay Morro Bay 75.50
Average Monthly Charge $55.04
Source: Financing Application Addendum
CURRENT AVERAGE MONTHLY SYSTEM USER CHARGE COMPARED TO NEARBY
SYSTEMS
The following table displays the Top 10 System Users, each User’s Percent of System Revenue as of June 30, 2019. The Table also indicates the user generating the greatest amount of system revenues generates only 4.95% of the total system revenues, which is in compliance with IBank’s below 15% underwriting requirement and the requirement that revenue derived from the top ten ratepayers does not exceed 50% of total system revenue.

8
User % System Use% System
RevenuesCustomer Class
1 Cal Poly 10.20 4.95 Commercial
2 City Parks 3.10 3.33 Other
3 SLO Coastal Unified 0.97 1.10 Commercial
4 Mustang Village 1.00 0.77 Residential
5 Silver City Mobile Home Park 0.95 0.69 Residential
6 Sierra Vista Hospital 0.68 0.64 Commercial
7 Laguna Lake Mobile Home Park 0.78 0.59 Residential
8 Embassy Suites 0.49 0.50 Commercial
9 Creekside Community 0.55 0.44 Residential
10 Irish Hills Hamlet 0.49 0.39 Residential
Total 19.2% 13.4%
Source: Financing Application Addendum
TOP 10 SYSTEM USERS
AS OF JUNE 30, 2019

9
Source of Financing and Security The ISRF Program Financing would be secured by a lien on Net Revenues and all legally available amounts in the Fund.
Source of Revenue to Repay Proposed ISRF Financing:
Net Revenues and all legally available amounts in the Fund.
Outstanding Obligations: The City has two Water Revenue Refunding Bonds (2012 and 2018). See Debt Section of this staff report for details.
Type of Audited Financial Documents Reviewed:
[X] Comprehensive Annual Financial Reports (CAFR) [ ] Basic Financial Statements (F/S) [ ] Other:
Fiscal Year Ends: June 30
Audit Fiscal Years Reviewed: 2014-2018
The auditor’s reports for all years indicate that the financial statements present fairly, in all material respects, the financial position of the City, and that the results of its operations and the cash flows are in conformity with generally accepted accounting principles.
[X] Yes [ ] No. [If no, explain]
Adopted Budget(s) Reviewed: [X] Yes [ ] No. [If no, explain]
Budget Year(s) Reviewed: 2019-2020
CREDIT ANALYSIS

10
Comparative Statement of Fund Net Position The Fund’s Comparative Statement of Fund Net Position for the last five fiscal years is as
follows:
2014 2015 2016 2017 2018
Source: CAFR % CAFR % CAFR % CAFR % CAFR %
Current Assets
Cash and Cash Equivalents $621,194 0.6% $5,547,777 5.4% $160,747 0.2% $382,881 0.4% $1,532,390 1.5%
Investments 17,266,322 17.3% 16,367,733 15.9% 15,918,304 15.3% 16,934,518 16.2% 17,580,648 16.8%
Accounts Receivable 1,903,979 1.9% 2,182,478 2.1% 2,855,749 2.7% 2,790,240 2.7% 2,718,691 2.6%
Accrued Interest Receivable 39,048 0.0% 38,132 0.0% 48,536 0.0% 64,633 0.1% 92,347 0.1%
Prepayments 5,831,567 5.6% 5,619,037 5.4% 5,794,131 5.5%
Due from Other Governments 71,622 0.1%Total Current Assets 19,902,165 19.9% 24,136,120 23.4% 24,814,903 23.8% 25,791,309 24.7% 27,718,207 26.4%
Noncurrent Assets
Cash and Investments Held by Fiscal Agent 1,642,349 1.6% 1,639,406 1.6% 1,654,826 1.6% 1,623,009 1.6% 1,554,220 1.5%
Investment in Joint Venture 698,000 0.7% 906,000 0.9% 1,052,700 1.0%Capital Assets:
Land 915,926 0.9% 915,926 0.9% 945,926 0.9% 945,926 0.9% 945,926 0.9%
Infrastructure 96,258,042 96.3% 96,258,042 93.5% 98,608,048 94.6% 98,608,048 94.6% 98,703,469 94.1%
Buildings and Improvements 19,134,912 19.1% 19,134,912 18.6% 19,134,912 18.4% 19,134,912 18.4% 19,134,912 18.2%
Equipment 3,763,752 3.8% 3,861,786 3.8% 4,284,455 4.1% 4,217,640 4.0% 4,474,806 4.3%
Construction in Progress 991,395 1.0% 1,641,254 1.6% 712,646 0.7% 1,372,947 1.3% 2,360,018 2.2%Total Capital Assets 121,064,027 121.1% 121,811,920 118.3% 123,685,987 118.6% 124,279,473 119.2% 125,619,131 119.7%
Less Accumulated Depreciation (42,837,003) -42.8% (45,515,228) -44.2% (48,032,223) -46.1% (50,574,950) -48.5% (53,205,191) -50.7%
Capital Assets Net of Accumulated Depreciation 78,227,024 78.2% 76,296,692 74.1% 75,653,764 72.6% 73,704,523 70.7% 72,413,940 69.0%Total Non Current Assets 79,869,373 79.9% 77,936,098 75.7% 78,006,590 74.8% 76,233,532 73.1% 75,020,860 71.5%
Subtotal Assets 99,771,538 99.8% 102,072,218 99.2% 102,821,493 98.6% 102,024,841 97.9% 102,739,067 97.9%
DEFERRED OUTFLOWS OF RESOURCES
Pension Related 650,536 0.6% 1,245,627 1.2% 2,050,530 2.0% 1,975,740 1.9%
Other Post-Employment Benefits Related 158,894 0.2% 92,686 0.1%
Unamortized Loss on Refunding of Debt 134,759 0.1%
Deferred Amounts from Refunding of Debt 231,299 207,164 183,029Total Deferred Outflow of Resources 231,299 0.2% 857,700 0.8% 1,428,656 1.4% 2,209,424 2.1% 2,203,185 2.1%
Total of All Assets 100,002,837 100.0% 102,929,918 100.0% 104,250,149 100.0% 104,234,265 100.0% 104,942,252 100.0%
Liabilities
Accounts Payable 262,704 0.3% 379,794 0.4% 405,728 0.4% 493,190 0.5% 516,185 0.5%
Accrued Liabilities 88,127 0.1% 310,478 0.3% 134,452 0.1% 9,739 0.0% 27,712 0.0%
Compensated Absences 102,736 0.1% 90,140 0.1% 191,323 0.2% 259,484 0.2% 171,869 0.2%
Deposits Payable 30,960 0.0% 31,680 0.0% 29,340 0.0% 21,780 0.0% 6,240 0.0%
Interest Payable 172,942 0.2% 161,843 0.2% 150,323 0.1% 138,519 0.1% 128,035 0.1%
Current Portion of Long Term Debt 1,244,700 1.2% 1,285,686 1.2% 1,332,288 1.3% 1,379,482 1.3% 1,410,799 1.3%Total Current Liabilities 1,902,169 1.9% 2,259,621 2.2% 2,243,454 2.2% 2,302,194 2.2% 2,260,840 2.2%
Noncurrent Liabilities
Compensated Absences 147,844 0.1% 193,697 0.2% 112,728 0.1% 60,730 0.1% 106,062 0.1%
Lease Revenue Bonds 18,172,495 18.2% 17,297,300 16.8% 16,385,760 15.7% 15,855,977 15.2% 14,800,176 14.1%
Bond Premium 603,643 541,906 480,169
Installment Sale Agreement
State/Loan Note Payable 4,598,807 4.6% 4,188,347 4.1% 3,767,598 3.6% 3,336,331 3.2% 2,894,282 2.8%
Net Pension Liability 0.0% 8,104,149 7.9% 8,389,149 8.0% 9,387,364 9.0% 10,687,147 10.2%
Net Other Post-Employment Benefits Liability 990,028 0.9%Total Noncurrent Liabilities 23,522,789 23.5% 30,325,399 29.5% 29,135,404 27.9% 28,640,402 27.5% 29,477,695 28.1%
Total Liabilities 25,424,958 25.4% 32,585,020 31.7% 31,378,858 30.1% 30,942,596 29.7% 31,738,535 30.2%
Deferred Inflows of Resources
Pension Related 789,883 0.8% 1,263,617 1.2% 863,605 0.8% 50,073 0.0%
Other-Post-Employment Benefits Related 19,401 0.0%Total Deferred Inflows of Resources 789,883 0.8% 1,263,617 1.2% 863,605 0.8% 69,474 0.1%
Net Position:
Net Investment in Capital Assets 53,838,678 53.8% 53,190,617 51.7% 53,870,978 51.7% 53,291,627 51.1% 53,443,442 50.9%Restricted:
Debt Service 1,642,349 1.6% 1,639,406 1.6% 1,654,826 1.6% 1,623,009 1.6% 1,554,220 1.5%
Subsequent Year Expenditures 1,638,811 1.6% 448,499 0.4% 1,298,017 1.2% 585,126 0.6%Committed:
Rate Stabilization Fund 1,776,193 1.7% 1,650,000 1.6%
Contingency Fund 4,175,416 4.1% 2,950,800 2.8%Unrestricted 19,096,852 19.1% 7,134,572 6.9% 11,032,571 10.6% 16,215,411 15.6% 17,551,455 16.7%
$74,577,879 74.6% $69,555,015 67.6% $71,607,674 68.7% $72,428,064 69.5% $73,134,243 69.7%Net Position
For Fiscal Year Ending (FYE) June 30
CITY OF SAN LUIS OBISPO
WATER ENTERPRISE FUNDSTATEMENT OF FUND NET POSITION

11
The Water Enterprise Fund accounts for the provision of water services to the residents of the City as well as some customers in the County. All activities necessary to provide such services are accounted for in this fund. Current Assets grew 139% to $27,718,207 million in the period reviewed due to buildup of cash from operations, Accounts Receivable, Accrued Interest Receivable, and Prepayments while Noncurrent Assets decreased by 6% to $75,020,860 over the same period due to an increased in accumulated depreciation. This resulted in an increase in the Total of All Assets by approximately 105% to $104,942,252 over the same period when all deferrals are included. Total Liabilities increased slightly under 125% over the review period due to increases in pension and retirement benefits that began in FY 2015 and continued through FY 2018. However, since FY 2015, Total Liabilities have remained relatively flat.

12
Comparative Statement of Revenues, Expenses, and Changes in Fund Net Position
Source: CAFR % CAFR % CAFR % CAFR % CAFR %
% Change N/A 3% -3% 2% 9%
Charges for Sales and Service $18,645,973 94.8% $17,761,926 87.2% $18,182,433 91.5% $18,757,311 92.9% $19,779,515 89.1%
Impact Fees 819,477 4.2% 2,471,502 12.1% 1,542,268 7.8% 1,266,674 6.3% 2,131,345 9.6%
Other Revenues 210,749 1.1% 137,736 0.7% 146,310 0.7% 162,054 0.8% 285,272 1.3%
Total Operating Revenues 19,676,199 100.0% 20,371,164 100.0% 19,871,011 100.0% 20,186,039 100.0% 22,196,132 100.0%
Operating Expenses
Salaries and Benefits 2,926,028 14.9% 2,852,010 14.0% 3,236,393 16.3% 3,615,448 17.9% 4,578,651 20.6%
Supplies and Maintenance 1,506,090 7.7% 1,263,952 6.2% 1,412,312 7.1% 1,682,244 8.3% 1,271,043 5.7%
Contract Services 8,295,509 42.2% 8,275,084 40.6% 8,715,864 43.9% 8,842,359 43.8% 8,815,633 39.7%
General Government 1,268,800 6.4% 1,167,004 5.7% 1,328,061 6.7% 1,477,598 7.3% 1,485,450 6.7%
Depreciation 2,716,681 13.8% 2,700,098 13.3% 2,608,348 13.1% 2,665,385 13.2% 2,645,460 11.9%
Total Operating Expenses 16,713,108 84.9% 16,258,148 79.8% 17,300,978 87.1% 18,283,034 90.6% 18,796,237 84.7%
Operating Income (Loss) 2,963,091 15.1% 4,113,016 20.2% 2,570,033 12.9% 1,903,005 9.4% 3,399,895 15.3%
Nonoperating Revenues (Expenses)
Interest on Investments, Net 136,205 0.7% 165,281 0.8% 306,307 1.5% 63,970 0.3% 111,060 0.5%
Interest expense (862,853) -4.4% (869,893) -4.3% (835,142) -4.2% (786,933) -3.9% (727,499) -3.3%
Income from Investment in Joint Venture 239,200 1.2% 206,700 1.0% 209,300 0.9%
Miscellaneous Nonoperating revenues (Expenses) 79,710 0.4% 75,567 0.4% 13,839 0.1% (5,108) 0.0% 5,937 0.0%
Total Nonoperating Revenues (Expenses) (646,938) -3.3% (629,045) -3.1% (275,796) -1.4% (521,371) -2.6% (401,202) -1.8%
Income (Loss Before Operating Transfers) 2,316,153 11.8% 3,483,971 17.1% 2,294,237 11.5% 1,381,634 6.8% 2,998,693 13.5%
Transfers (20,800) (469,607) (561,244) (934,306)
Total Transfers (20,800) (469,607) (561,244) (934,306)
Change In Net Position 2,316,153 3,463,171 1,824,630 820,390 2,064,387
Net Position Beginning of Year 72,261,726 74,577,879 69,555,015 71,607,674 72,428,064
Prior Year Restatements (8,486,035) 228,029 (1,358,208)
Net Position, Beginning of Year, As Restated 72,261,726 66,091,844 69,783,044 71,607,674 71,069,856
Net Position End of Year $74,577,879 $69,555,015 $71,607,674 $72,428,064 $73,134,243
For Fiscal Year Ending (FYE) June 30 2014 2015 2018
CITY OF SAN LUIS OBISPO
WATER ENTERPRISE FUND
STATEMENT OF REVENUES, EXPENSES, AND CHANGES IN FUND POSITION
Operating Revenue
2016 2017
Summary of the Fund’s Comparative Statement of Revenues, Expenses and Changes in Fund Position for the last five years is as follows: In 2015, Charges for Sales and Service decreased by $884,000 or 4.7% as a consequence of the drought and State regulations related to water saving. However, Impact Fees increased by $1.65 million compared to the prior year which more than offset the decrease in the sale of water. Since the end of the drought, revenues from Sales and Services have slowly increased. Income from Investment in Joint Venture for FY 2016, 2017, and 2018 was derived from the Whale Rock Commission which operates and maintains the Whale Rock Reservoir. The City’s share of the Commission’s expenses are recorded as an expense of the Water Fund. Revenue in excess of expenditures is included as income. All receipts and disbursements of the Commission are included in the Whale Rock Agency Fund. The City’s Net Position End of Year over the five-year period remained strong at $73.1M at the end of FY 2018.

13
Existing Obligations Payable from the Fund The table below shows information for the City’s outstanding obligations payable from the Fund and the proposed Financing for the Project.
Debt IssuedUnderlying Rating
(at issuance)
Date
IssuedMaturity
Amount
Issued Outstanding Balance
Water Revenue Refunding Bonds, Series 2018 Bonds S&P AA- 2018 2036 $16,905,000 $9,462,900
2012 Water Revenue Refunding Bonds S&P AA- /Fitch: AA 2012 2023 4,960,000 1,585,000
Proposed IBank Financing 14,300,000 14,300,000
Total $36,165,000 $25,347,900
WATER ENTERPRISE FUND OBLIGATIONS
The Water Fund currently has two bond obligations: the 2012 bonds were a refunding of the 2002 bonds, and the 2018 bonds were a refunding of the 2006 bonds. The debt is related to capital improvements to the System.
A 20-year State Water Resources Control Board (SWRCB) loan was paid off in January of 2020. A condition of this financing is that the City’s Utilities Manager (or appropriate official) is to certify the SWRCB debt has been retired.
Fund Cash Flow and Debt Service Analysis Fund cash flow table and debt service analysis for the Financing is as follows:
2014 2015 2016 2017 2018
Operating Income (Loss) $2,963,091 $4,113,016 $2,570,033 $1,903,005 $3,399,895
+ Depreciation 2,716,681 2,700,098 2,608,348 2,665,385 2,645,460
+ 136,205 165,281 306,307 63,970 111,060
+ 336,853 500,851 757,646 958,398 699,264
- (819,477) (2,471,502) (1,542,268) (1,266,674) (2,131,345)
- Transfers (20,800) (469,607) (561,244) (500,000)
Total of all Adjustments 2,370,262 873,928 1,660,426 1,859,835 824,439
Cash Available for Debt Service 5,333,353 4,986,944 4,230,459 3,762,840 4,224,334
Total Existing MADS Debt Service 1,462,900 1,462,900 1,462,900 1,462,900 1,462,900
Proposed IBank MADS (1) 953,206 953,206 953,206 953,206 953,206
Total Obligations MADS $2,416,106 $2,416,106 $2,416,106 $2,416,106 $2,416,106
Debt Service Coverage Ratio (2)2.21 2.06 1.75 1.56 1.75
(1) Calculated as $14,300,000 at 2.50% for 20 years(2)
CASH FLOW
For Fiscal Year Ending (FYE) June 30
Transaction Specific Adjustments
Interest on Investments, Net
Source of Supply Capital
Debt Service Calculation
Existing Parity Debt Minimum Required DSCR 1.25
Impact Fees
Analysis of the historical cash flow over the last five years demonstrates the Fund has the capacity to service the proposed Financing with a DSCR of 1.56 or greater in all five years reviewed. Interest earned on investments is added back as this is recurring ongoing income. Source of Supply Capital is added back to cash flow as this is used for one time capital projects that are discretionary.

14
Development Impact Fee income is not counted in the cash flow analysis as impact fees are considered non-recurring for purpose of this report. Transfers to other funds are owed and ongoing and are reimbursements for services. The Operating Expenses on the Revenue and Expense Statement of the Fund includes “Contract Payments” which include approx. $4.7M/yr. per the Nacimiento Project Water Delivery Entitlement Contract. While this payment is part of a water delivery contract, the payment itself is used to pay debt service of the owner of the Nacimiento Project. The (Borrower) is obligated to make these payments irrespective of the volume of water it receives under the Nacimiento Project Water Delivery Entitlement Contract. While these payments could be viewed as debt service, because they are required under a water contract, IBank Staff treated them as operating expenses. This is the same way that the City’s CAFR and Water Fund Revenue Statement, the San Luis Obispo City’s Finance Department, and the 2018 Bond Official Statements treat these payments. Risk Factors
1. Certain aspects of the City’s rate structure are similar to those successfully challenged in a
recent California appellate court case as having violated Prop 218 requirements. 2. The City is not prohibited from incurring additional obligations payable from the Fund. Mitigating Factors
1. The City has implemented prior rate increases to maintain revenues at levels needed for
the City to maintain its ability to meet its expenses and service debt. 2. In implementing rates and charges, the City will covenant that its rate structure will conform
to the requirements of Prop. 218 and statutes implementing it and case law interpreting it. Further, in its financing agreement, the City will covenant to notify IBank immediately upon the filing of any legal challenge to its rates or charges.
3. The City will be prohibited from issuing future debt senior to IBank financing, and new parity debt would only be permitted if Net Revenues accumulated within the Fund are at least 1.25 times the Maximum Annual Debt Service (MADS).
Compliance with IBank Underwriting Criteria
Revenues derived from the top ten System ratepayers do not exceed 50% of annual System revenues
Revenues derived from any single ratepayer do not exceed 15% of annual System revenues
The estimated useful life of the Project (calculated using a blended average of the useful life of the Project components) is 20 years, which is equal to the Financing term.
The City has the power to establish and enact rates and charges without the approval of any other governing body
Criteria Waivers
1. The Criteria requires that financing applicants pre-qualify contractors bidding on an IBank-financed project using the Department of Industrial Relations’ model pre-qualification questionnaire (the “Model Questionnaire”). The City normally pre-qualifies its public works contractors with its own internally-required pre-qualification questionnaire, which is

15
substantially similar to the Model Questionnaire. However, the City relates that the City’s Charter exempts the Project from compliance with the City’s standard procurement process. Additionally, Government Code Section 4217.1, et. seq., allows the City to forego standard procurement processes for energy projects. Therefore, the City requests that the Board waive compliance with the Criteria requirement that contractors be pre-qualified using the Model Questionnaire.
16
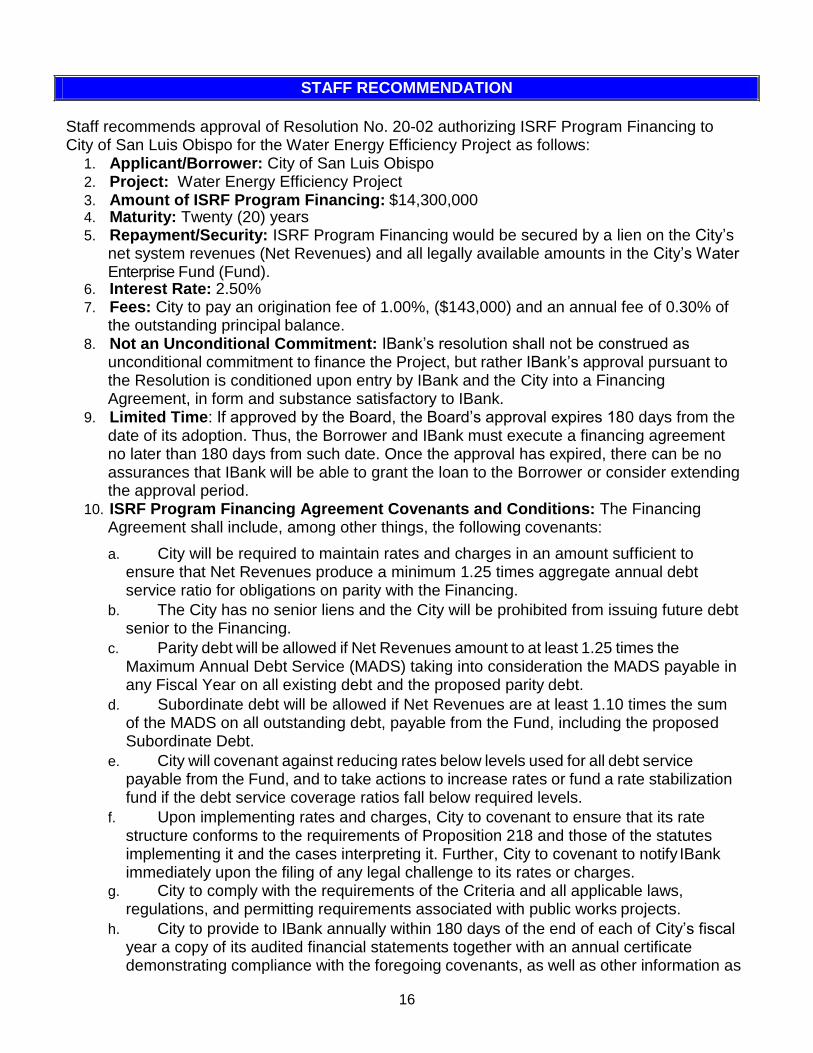
Staff recommends approval of Resolution No. 20-02 authorizing ISRF Program Financing to City of San Luis Obispo for the Water Energy Efficiency Project as follows:
1. Applicant/Borrower: City of San Luis Obispo 2. Project: Water Energy Efficiency Project 3. Amount of ISRF Program Financing: $14,300,000 4. Maturity: Twenty (20) years 5. Repayment/Security: ISRF Program Financing would be secured by a lien on the City’s
net system revenues (Net Revenues) and all legally available amounts in the City’s Water Enterprise Fund (Fund).
6. Interest Rate: 2.50% 7. Fees: City to pay an origination fee of 1.00%, ($143,000) and an annual fee of 0.30% of
the outstanding principal balance. 8. Not an Unconditional Commitment: IBank’s resolution shall not be construed as
unconditional commitment to finance the Project, but rather IBank’s approval pursuant to the Resolution is conditioned upon entry by IBank and the City into a Financing Agreement, in form and substance satisfactory to IBank.
9. Limited Time: If approved by the Board, the Board’s approval expires 180 days from the date of its adoption. Thus, the Borrower and IBank must execute a financing agreement no later than 180 days from such date. Once the approval has expired, there can be no assurances that IBank will be able to grant the loan to the Borrower or consider extending the approval period.
10. ISRF Program Financing Agreement Covenants and Conditions: The Financing Agreement shall include, among other things, the following covenants:
a. City will be required to maintain rates and charges in an amount sufficient to ensure that Net Revenues produce a minimum 1.25 times aggregate annual debt service ratio for obligations on parity with the Financing.
b. The City has no senior liens and the City will be prohibited from issuing future debt senior to the Financing.
c. Parity debt will be allowed if Net Revenues amount to at least 1.25 times the Maximum Annual Debt Service (MADS) taking into consideration the MADS payable in any Fiscal Year on all existing debt and the proposed parity debt.
d. Subordinate debt will be allowed if Net Revenues are at least 1.10 times the sum of the MADS on all outstanding debt, payable from the Fund, including the proposed Subordinate Debt.
e. City will covenant against reducing rates below levels used for all debt service payable from the Fund, and to take actions to increase rates or fund a rate stabilization fund if the debt service coverage ratios fall below required levels.
f. Upon implementing rates and charges, City to covenant to ensure that its rate structure conforms to the requirements of Proposition 218 and those of the statutes implementing it and the cases interpreting it. Further, City to covenant to notify IBank immediately upon the filing of any legal challenge to its rates or charges.
g. City to comply with the requirements of the Criteria and all applicable laws, regulations, and permitting requirements associated with public works projects.
h. City to provide to IBank annually within 180 days of the end of each of City’s fiscal year a copy of its audited financial statements together with an annual certificate demonstrating compliance with the foregoing covenants, as well as other information as
STAFF RECOMMENDATION

17
IBank may request from time to time.
i. No disbursements will be allowed until the City provides evidence reasonably satisfactory to IBank that all parity debt conditions precedent set forth in the State Water Resources Control Board financing agreement have been satisfied.
j. The City’s Utilities Manager (or appropriate official) to certify the State Water Resources Control Board debt has been retired.

18
PROJECT SERVICE AREA (Exhibit 1)