Embed Size (px)
DESCRIPTION
California Healthy Watersheds Assessment. Status Update March 7, 2013. U.S. EPA Healthy Watersheds Initiative. EPA HWI website: www.epa.gov/healthywatersheds Overarching goals of the Initiative: Protect and maintain healthy watersheds, and increase their numbers over time. - PowerPoint PPT Presentation
Citation preview
California Healthy Watersheds AssessmentStatus UpdateMarch 7, 2013
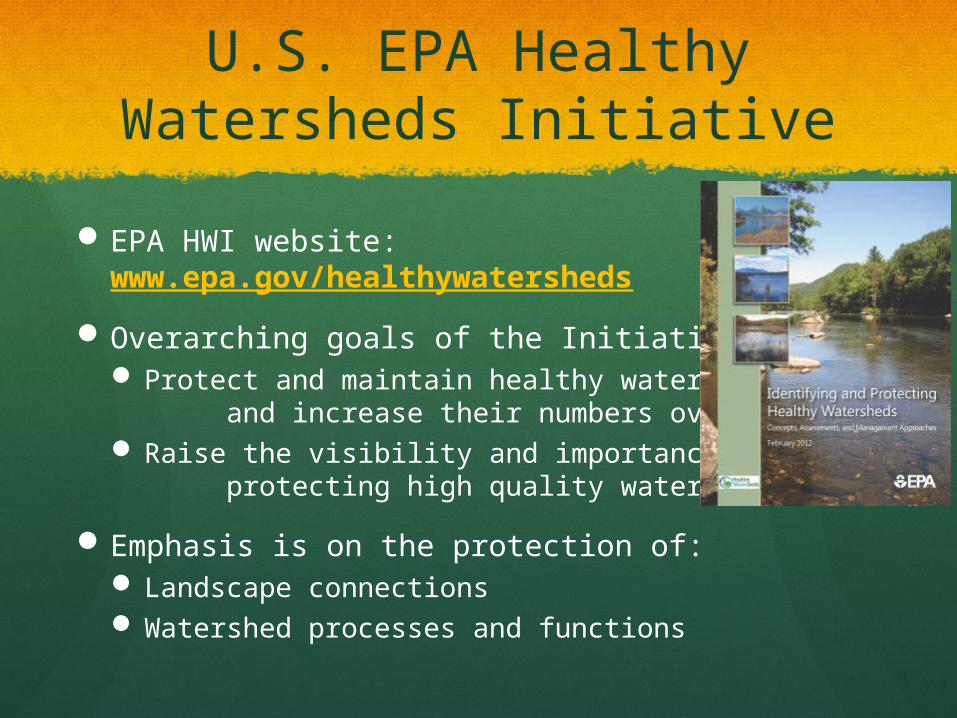
U.S. EPA Healthy Watersheds Initiative
EPA HWI website: www.epa.gov/healthywatersheds
Overarching goals of the Initiative: Protect and maintain healthy watersheds,
and increase their numbers over time. Raise the visibility and importance of
protecting high quality waters.
Emphasis is on the protection of: Landscape connections Watershed processes and functions
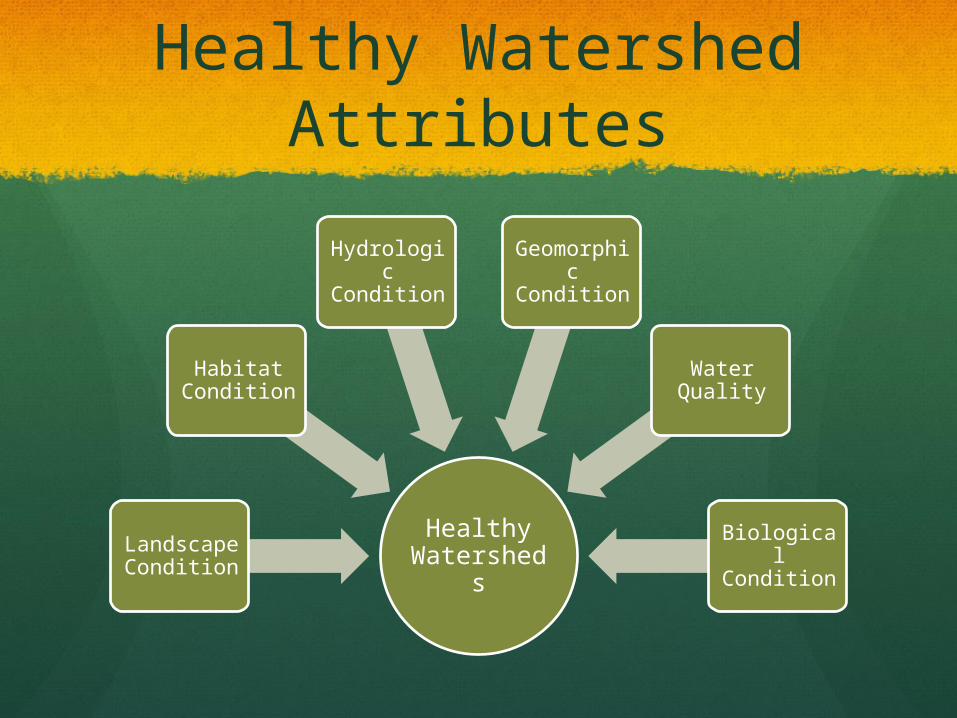
Healthy Watershed Attributes
Healthy Watershed
s
Landscape Condition
Habitat Condition
Hydrologic Condition
Geomorphic Condition
Water Quality
Biological Condition
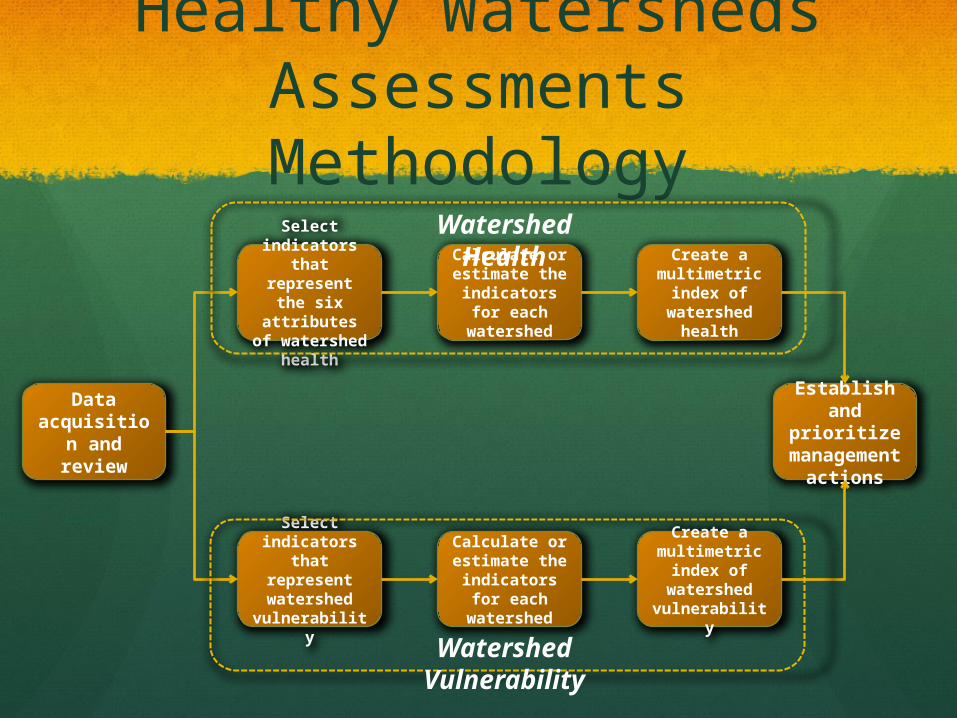
Healthy Watersheds Assessments Methodology
Select indicators that represent
the six attributes of watershed
health
Calculate or estimate the indicators for
each watershed
Data acquisition and review
Create a multimetric
index of watershed
health
Select indicators that represent
watershed vulnerability
Calculate or estimate the indicators for
each watershed
Create a multimetric
index of watershed
vulnerability
Establish and prioritize
management actions
Watershed Health
Watershed Vulnerability
Project Goals & Objectives
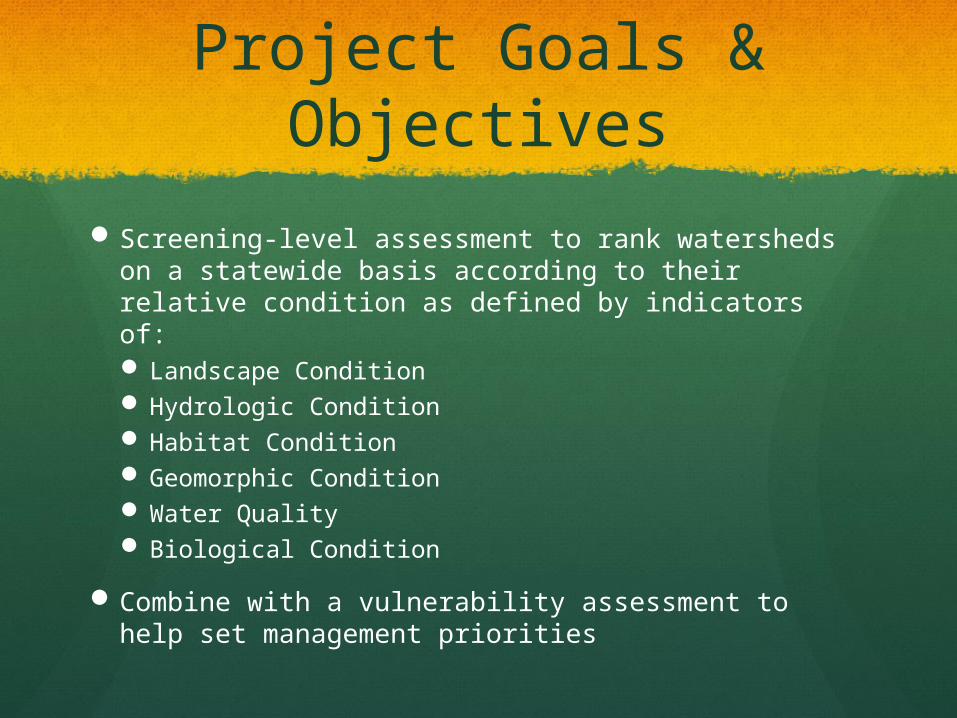
Screening-level assessment to rank watersheds on a statewide basis according to their relative condition as defined by indicators of: Landscape Condition Hydrologic Condition Habitat Condition Geomorphic Condition Water Quality Biological Condition
Combine with a vulnerability assessment to help set management priorities
Timeline
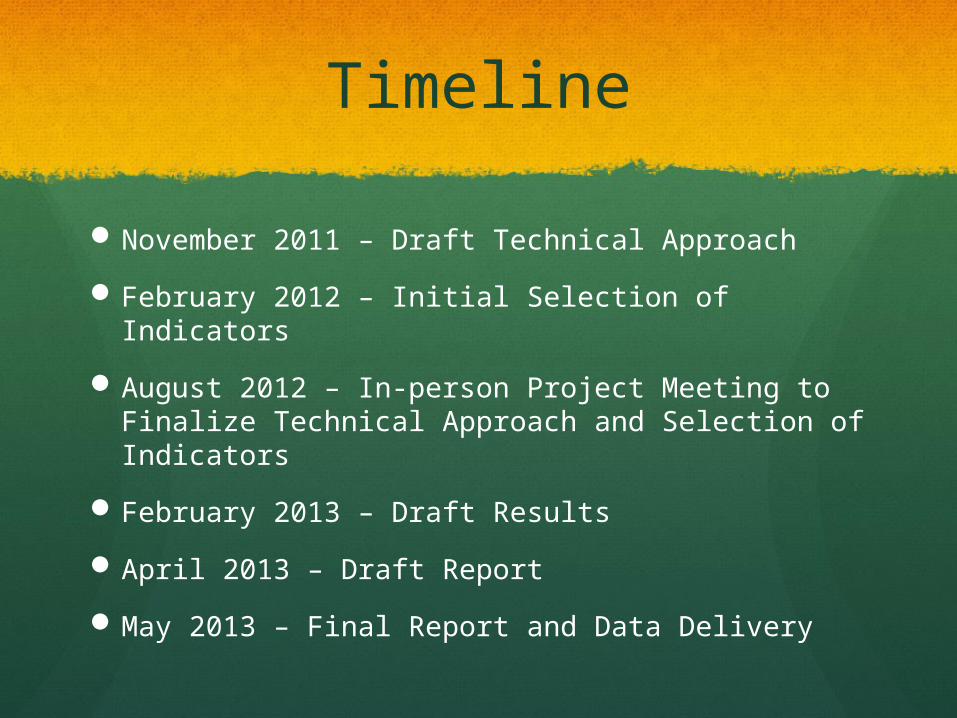
November 2011 – Draft Technical Approach
February 2012 – Initial Selection of Indicators
August 2012 – In-person Project Meeting to Finalize Technical Approach and Selection of Indicators
February 2013 – Draft Results
April 2013 – Draft Report
May 2013 – Final Report and Data Delivery
Outcome from August Meeting
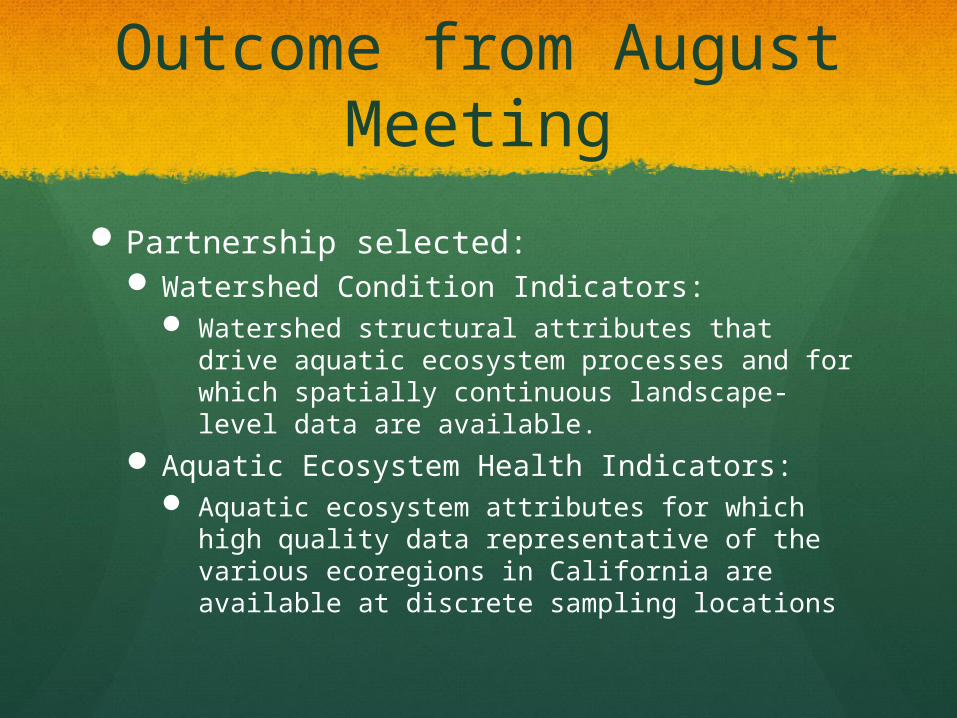
Partnership selected: Watershed Condition Indicators:
Watershed structural attributes that drive aquatic ecosystem processes and for which spatially continuous landscape-level data are available.
Aquatic Ecosystem Health Indicators: Aquatic ecosystem attributes for which high
quality data representative of the various ecoregions in California are available at discrete sampling locations
Watershed Condition Indicators
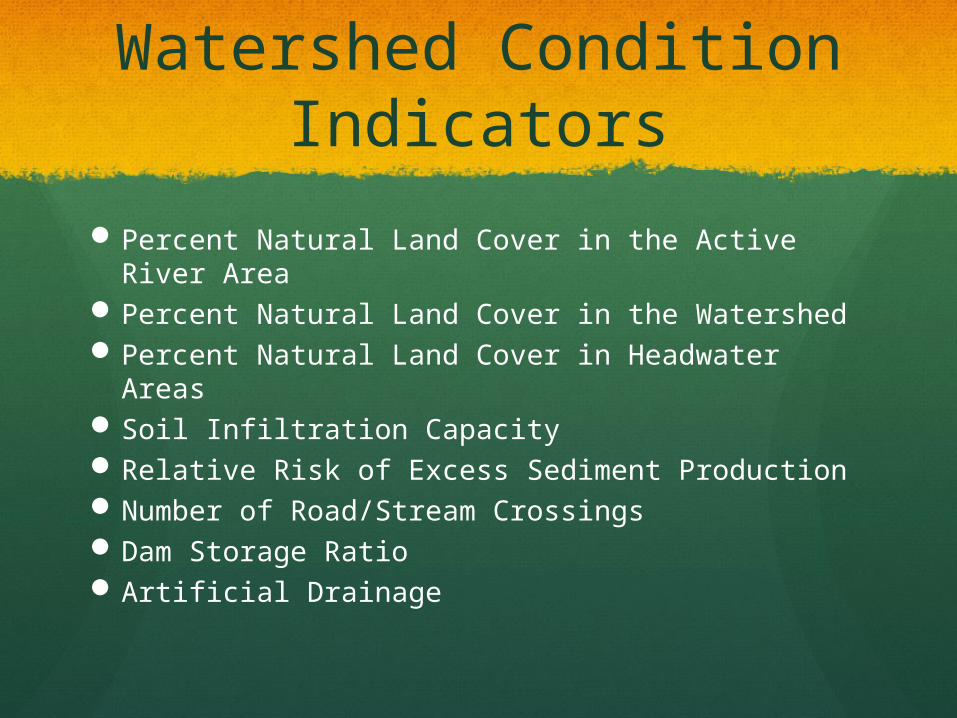
Percent Natural Land Cover in the Active River Area
Percent Natural Land Cover in the WatershedPercent Natural Land Cover in Headwater
AreasSoil Infiltration Capacity Relative Risk of Excess Sediment Production Number of Road/Stream CrossingsDam Storage RatioArtificial Drainage
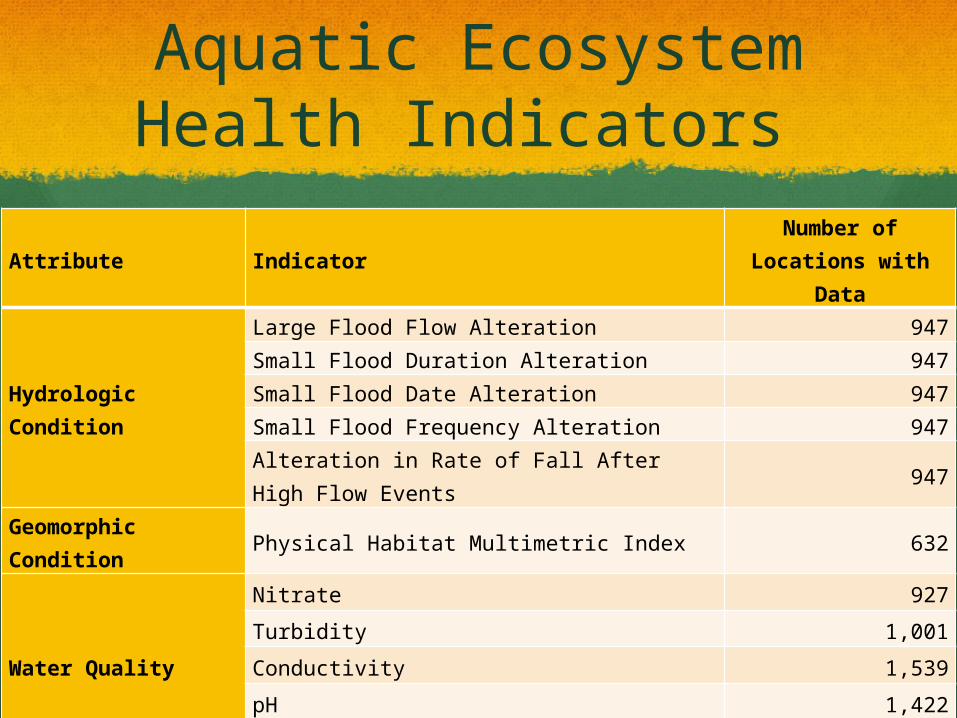
Aquatic Ecosystem Health Indicators
Attribute IndicatorNumber of
Locations with Data
Hydrologic Condition
Large Flood Flow Alteration 947Small Flood Duration Alteration 947Small Flood Date Alteration 947Small Flood Frequency Alteration 947Alteration in Rate of Fall After High Flow Events
947
Geomorphic Condition
Physical Habitat Multimetric Index 632
Water Quality
Nitrate 927
Turbidity 1,001
Conductivity 1,539
pH 1,422
Temperature 1,606
Habitat Condition CRAM 848
Biological Condition
Combined Stream Condition Index 1,698
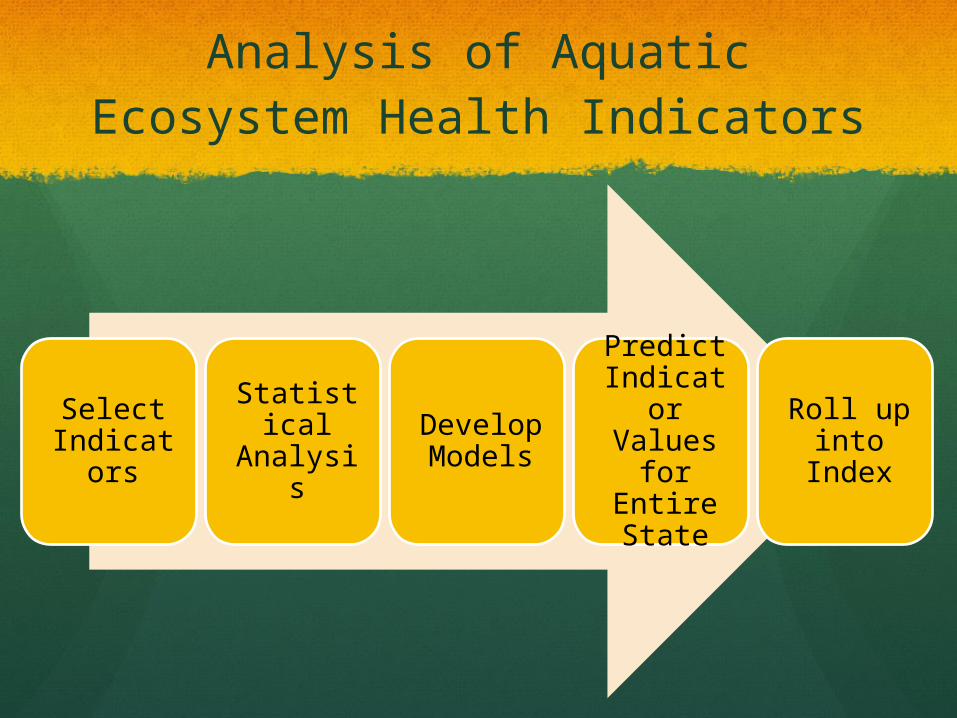
Analysis of Aquatic Ecosystem Health Indicators
Select Indicator
s
Statistical Analysis
Develop Models
Predict Indicator Values
for Entire State
Roll up into
Index
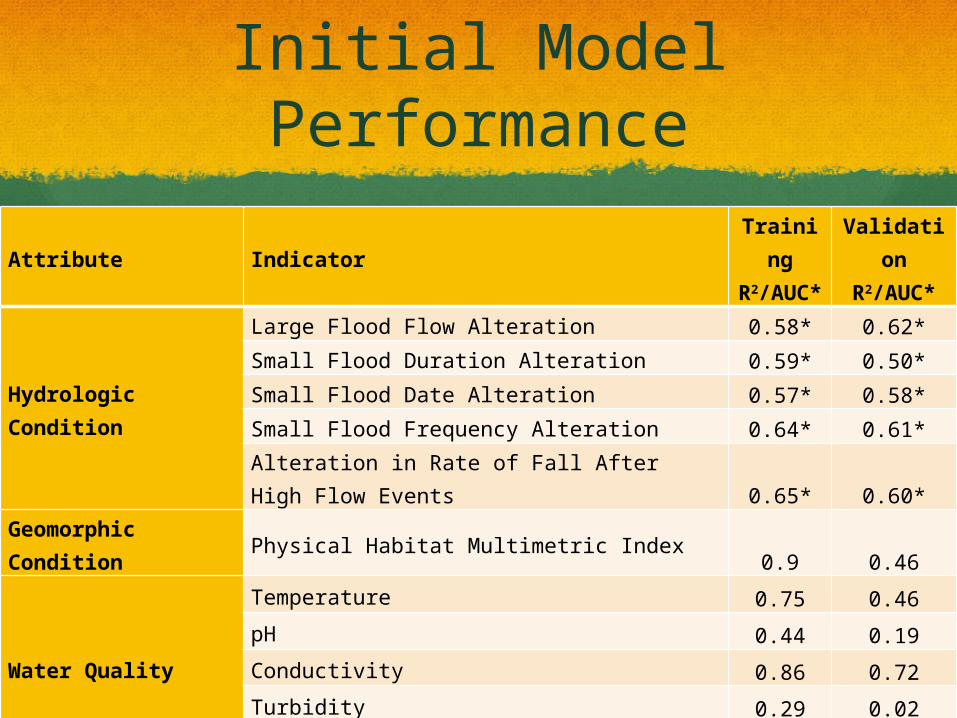
Initial Model Performance
Attribute Indicator
Training
R2/AUC*
Validation
R2/AUC*
Hydrologic Condition
Large Flood Flow Alteration 0.58* 0.62*Small Flood Duration Alteration 0.59* 0.50*Small Flood Date Alteration 0.57* 0.58*Small Flood Frequency Alteration 0.64* 0.61*Alteration in Rate of Fall After High Flow Events 0.65* 0.60*
Geomorphic Condition
Physical Habitat Multimetric Index0.9 0.46
Water Quality
Temperature 0.75 0.46
pH 0.44 0.19
Conductivity 0.86 0.72
Turbidity 0.29 0.02
Nitrate 0.69 0.51
Habitat Condition California Rapid Assessment Method Index 0.76 0.53Biological Condition
Combined Stream Condition Index0.72 0.49
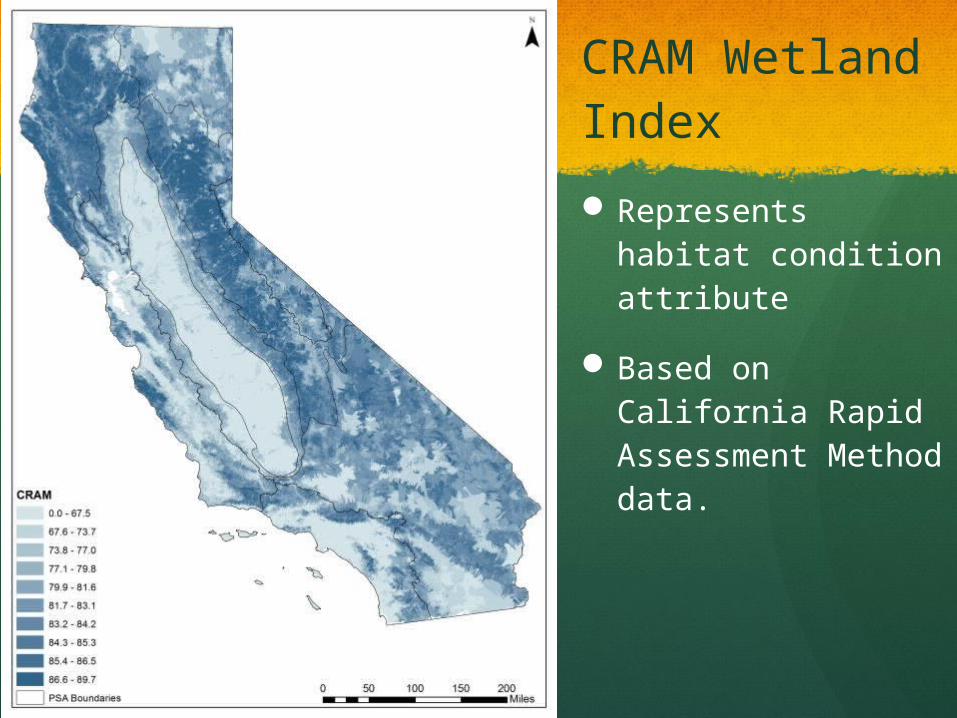
CRAM Wetland Index
Represents habitat condition attribute
Based on California Rapid Assessment Method data.
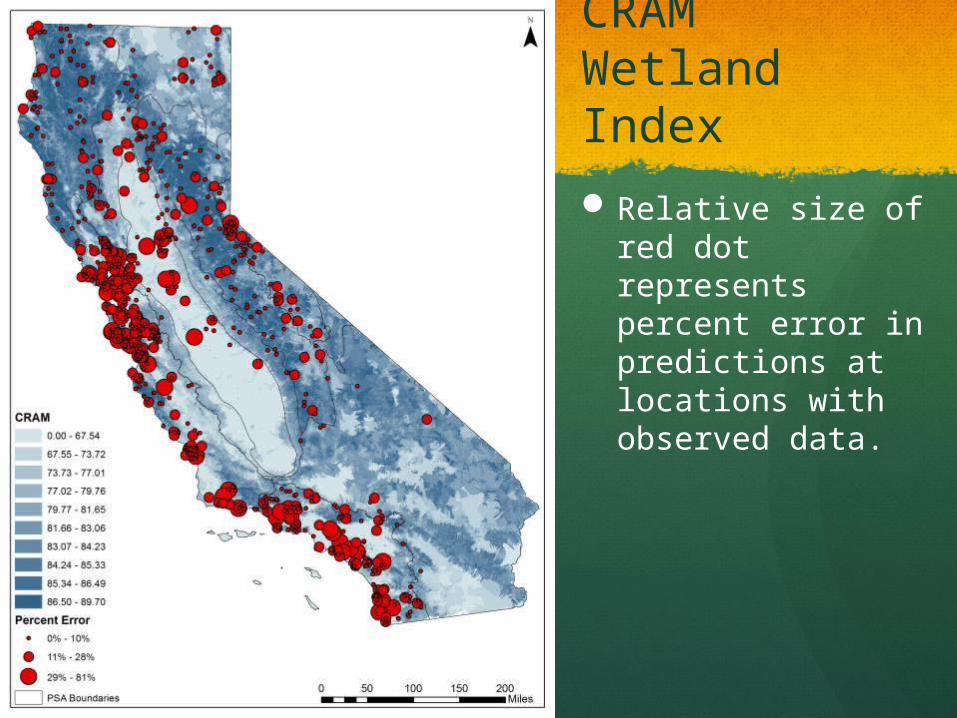
CRAM Wetland Index
Relative size of red dot represents percent error in predictions at locations with observed data.
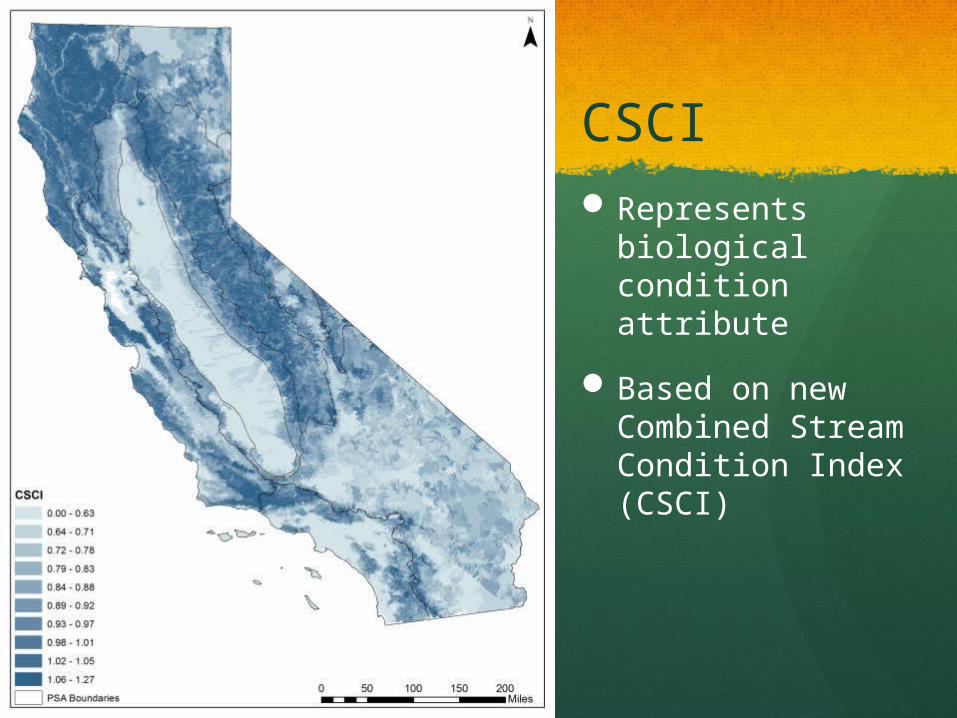
CSCIRepresents
biological condition attribute
Based on new Combined Stream Condition Index (CSCI)
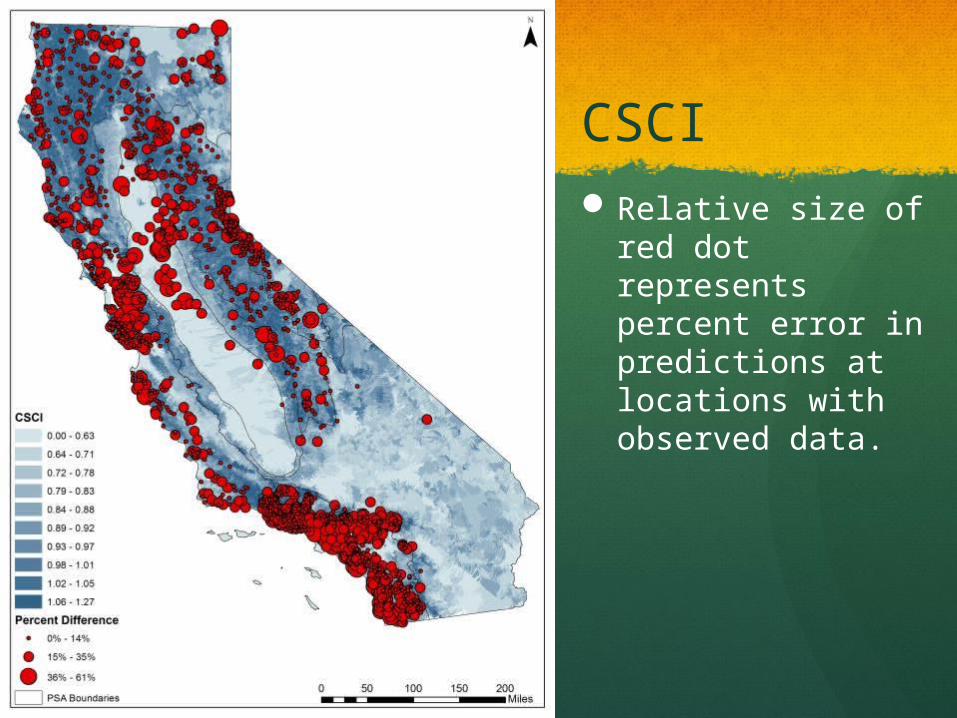
CSCIRelative size of red
dot represents percent error in predictions at locations with observed data.
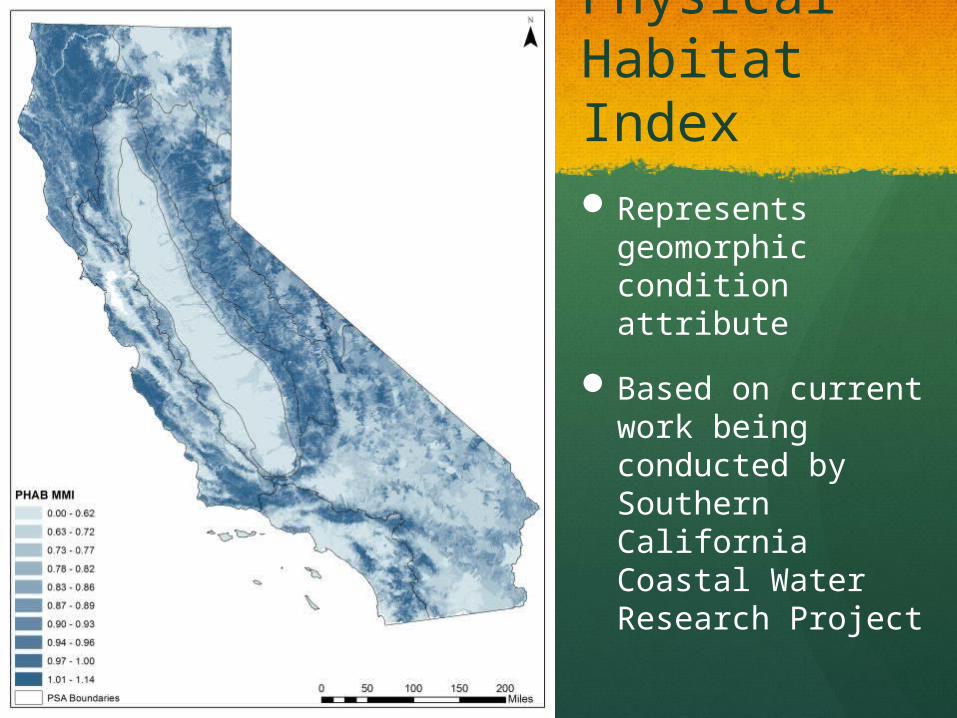
Physical Habitat IndexRepresents
geomorphic condition attribute
Based on current work being conducted by Southern California Coastal Water Research Project
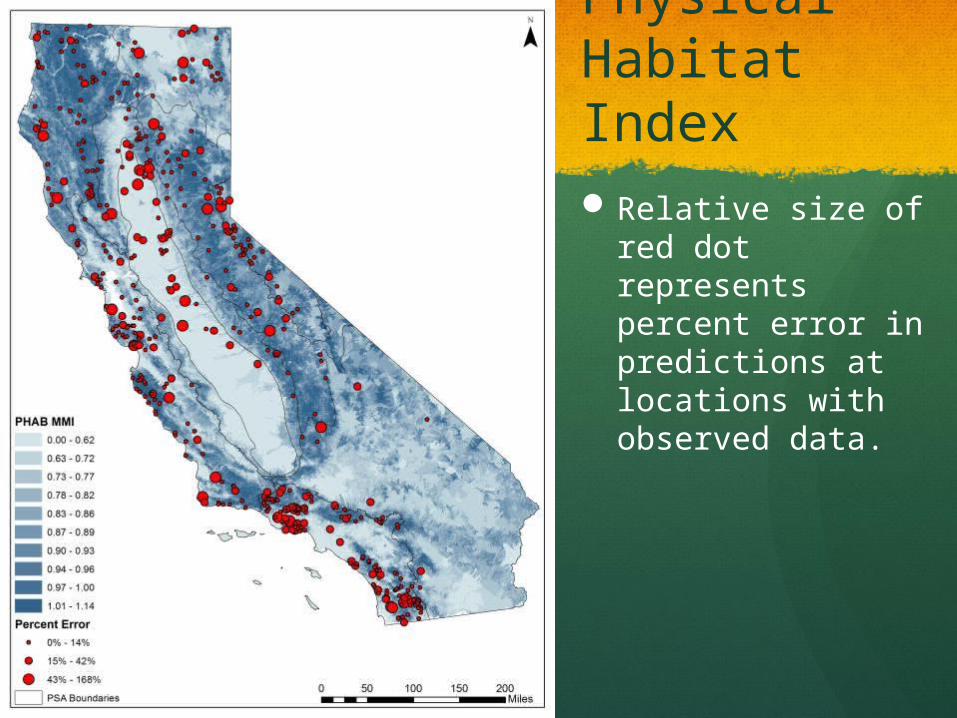
Physical Habitat IndexRelative size of red
dot represents percent error in predictions at locations with observed data.
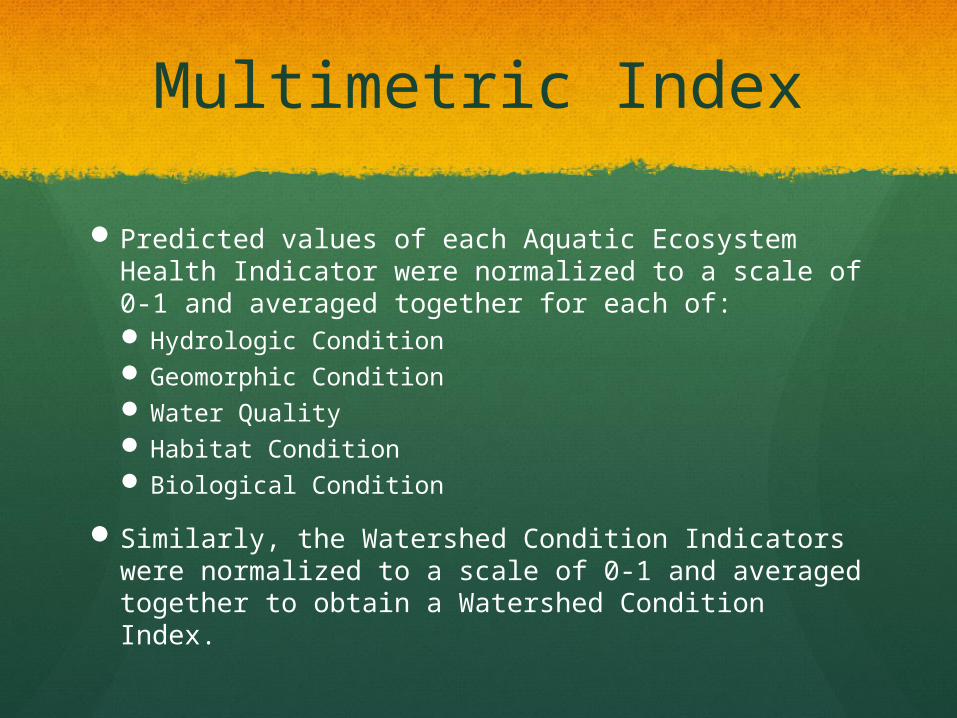
Multimetric Index
Predicted values of each Aquatic Ecosystem Health Indicator were normalized to a scale of 0-1 and averaged together for each of: Hydrologic Condition Geomorphic Condition Water Quality Habitat Condition Biological Condition
Similarly, the Watershed Condition Indicators were normalized to a scale of 0-1 and averaged together to obtain a Watershed Condition Index.
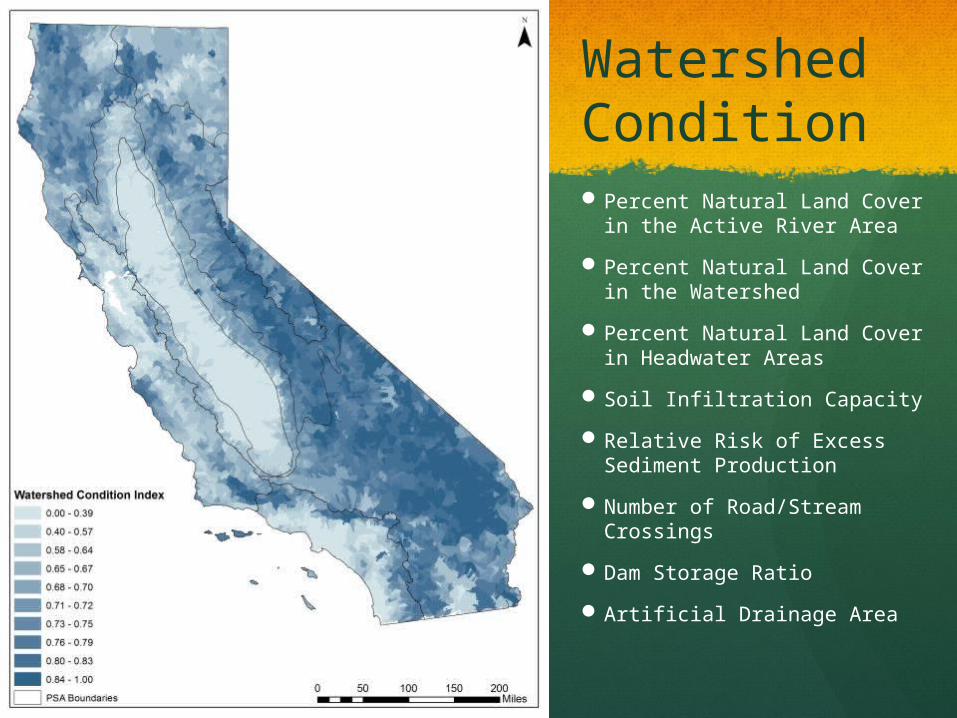
Watershed Condition Percent Natural Land Cover
in the Active River Area
Percent Natural Land Cover in the Watershed
Percent Natural Land Cover in Headwater Areas
Soil Infiltration Capacity
Relative Risk of Excess Sediment Production
Number of Road/Stream Crossings
Dam Storage Ratio
Artificial Drainage Area
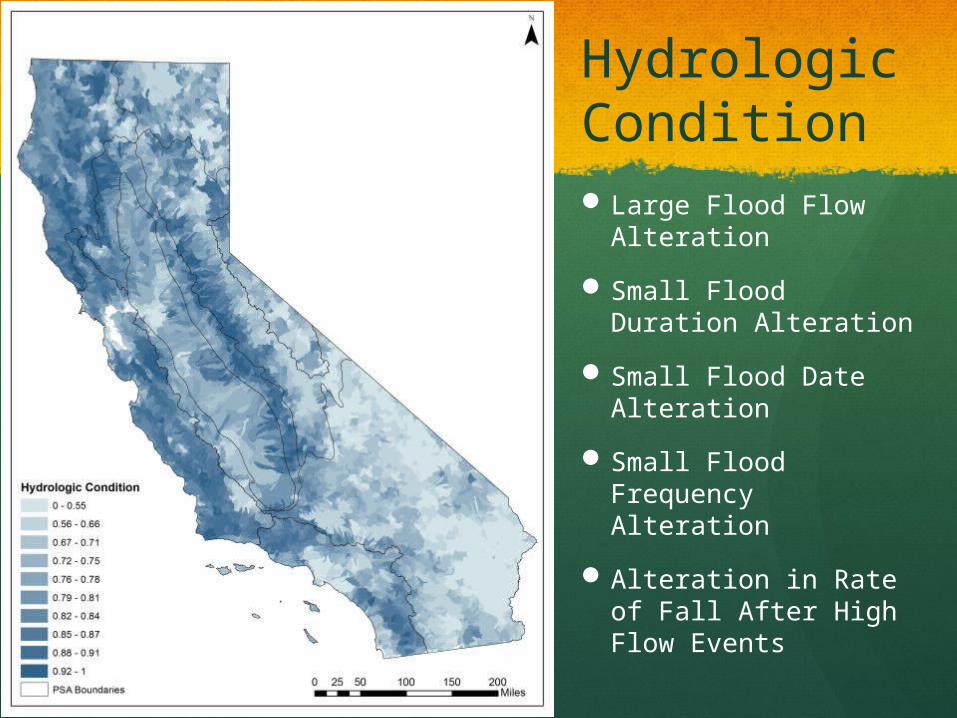
Hydrologic Condition Large Flood Flow
Alteration
Small Flood Duration Alteration
Small Flood Date Alteration
Small Flood Frequency Alteration
Alteration in Rate of Fall After High Flow Events
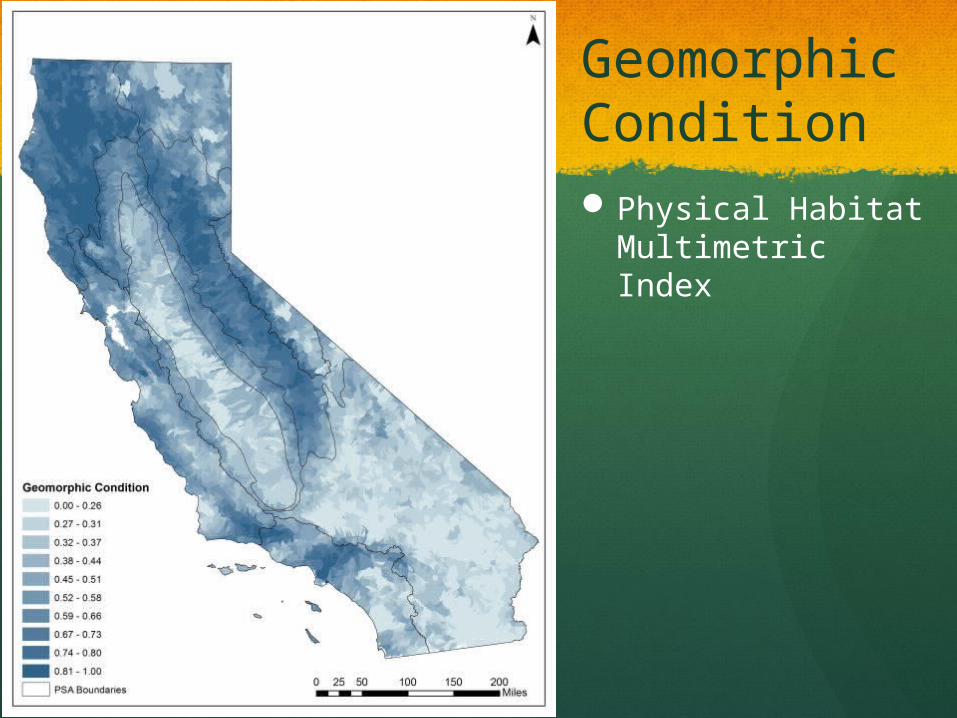
Geomorphic ConditionPhysical Habitat
Multimetric Index
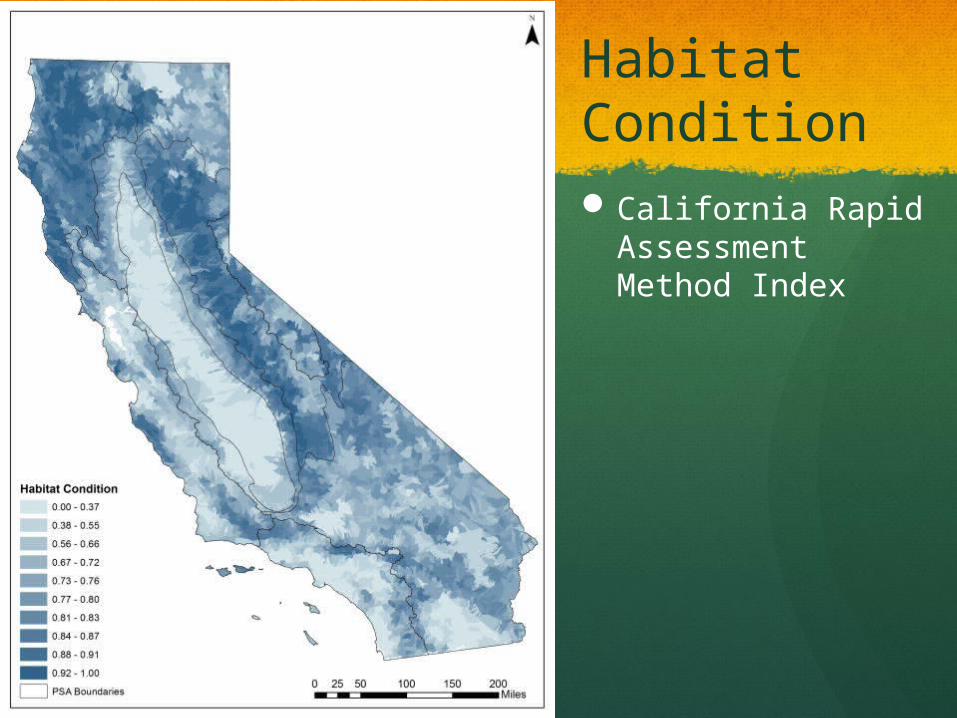
Habitat ConditionCalifornia Rapid
Assessment Method Index
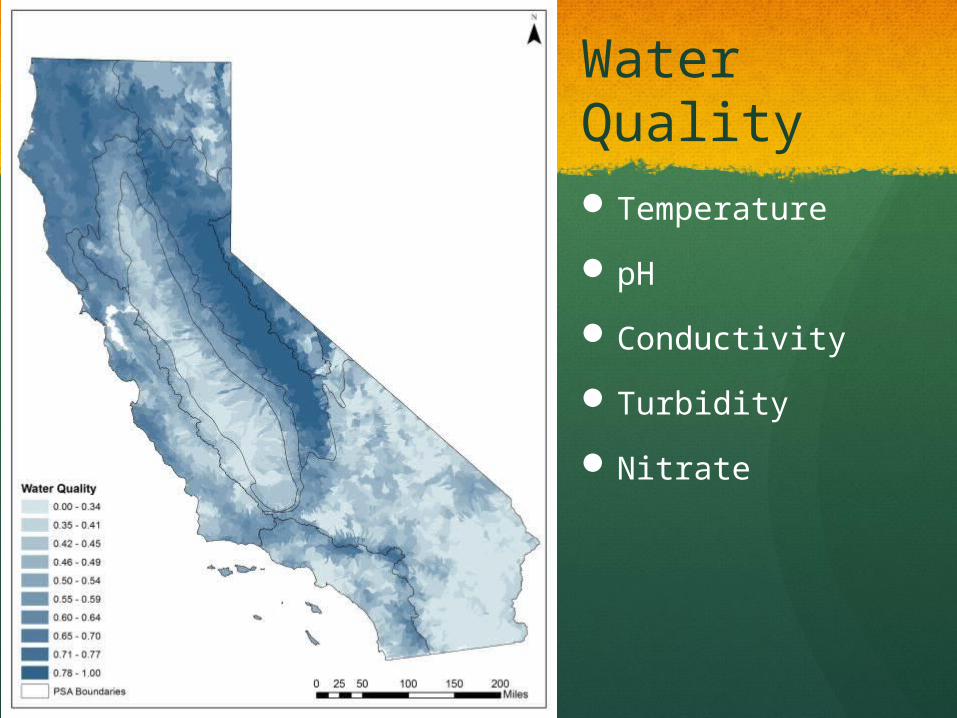
Water QualityTemperature
pH
Conductivity
Turbidity
Nitrate
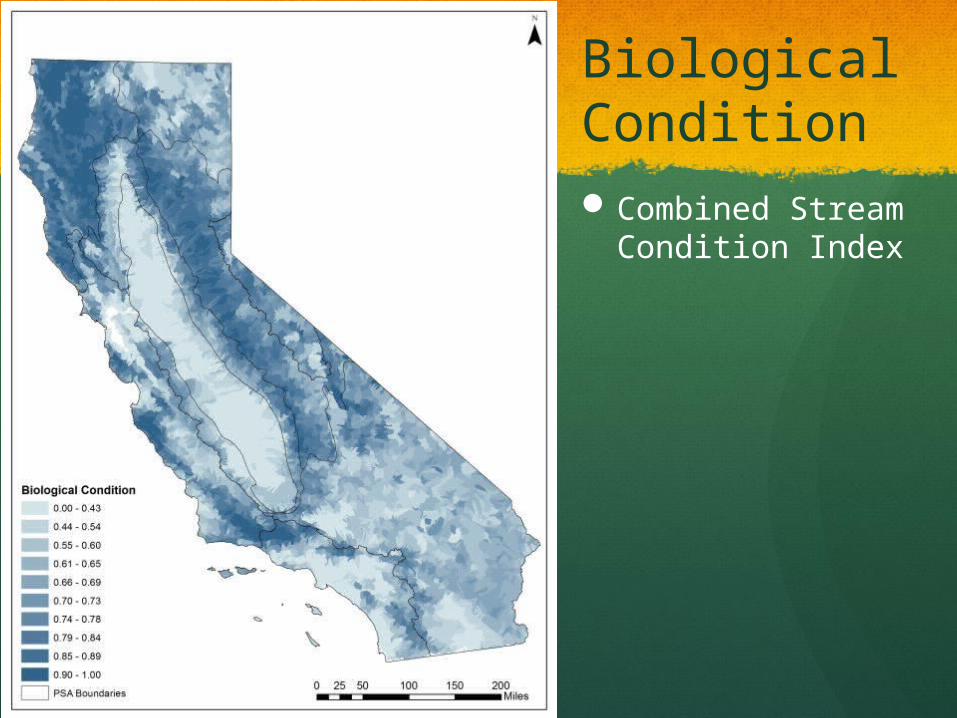
Biological ConditionCombined Stream
Condition Index
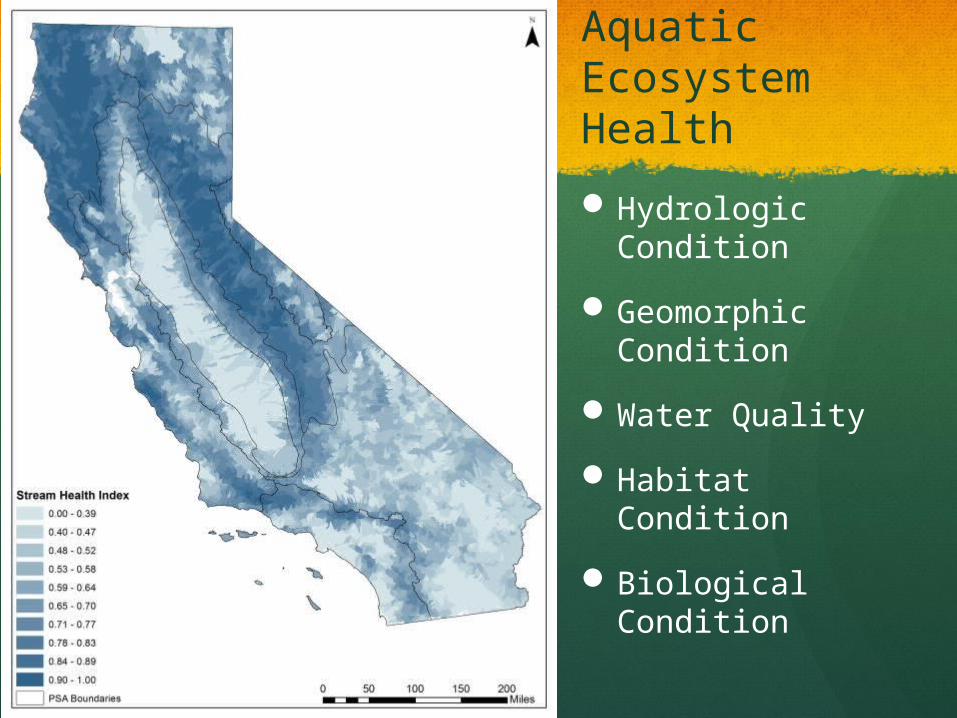
Aquatic Ecosystem Health
Hydrologic Condition
Geomorphic Condition
Water Quality
Habitat Condition
Biological Condition
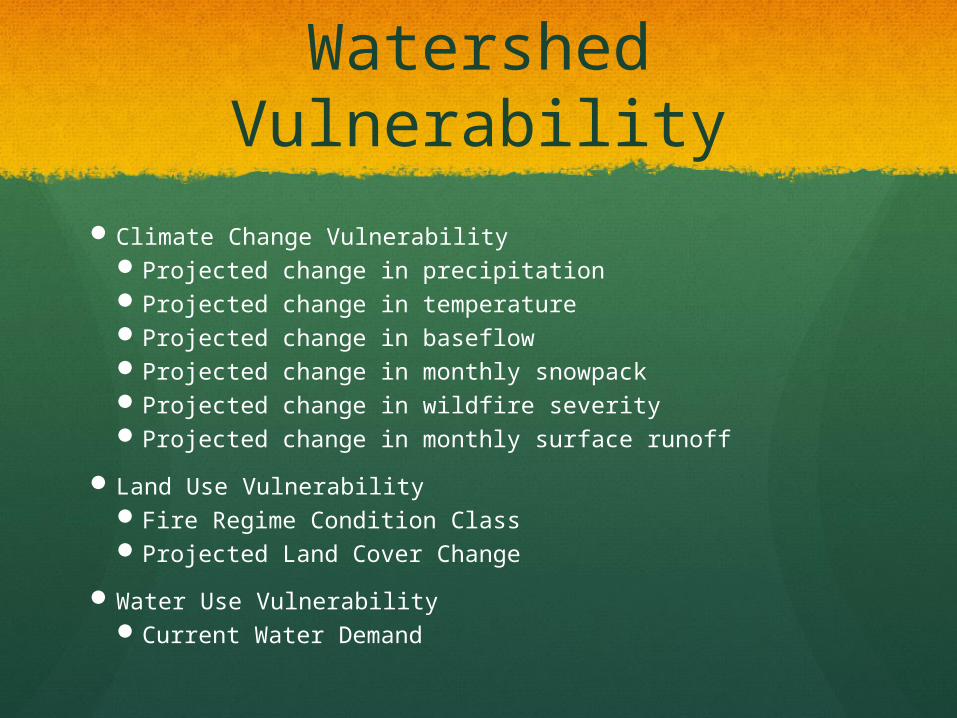
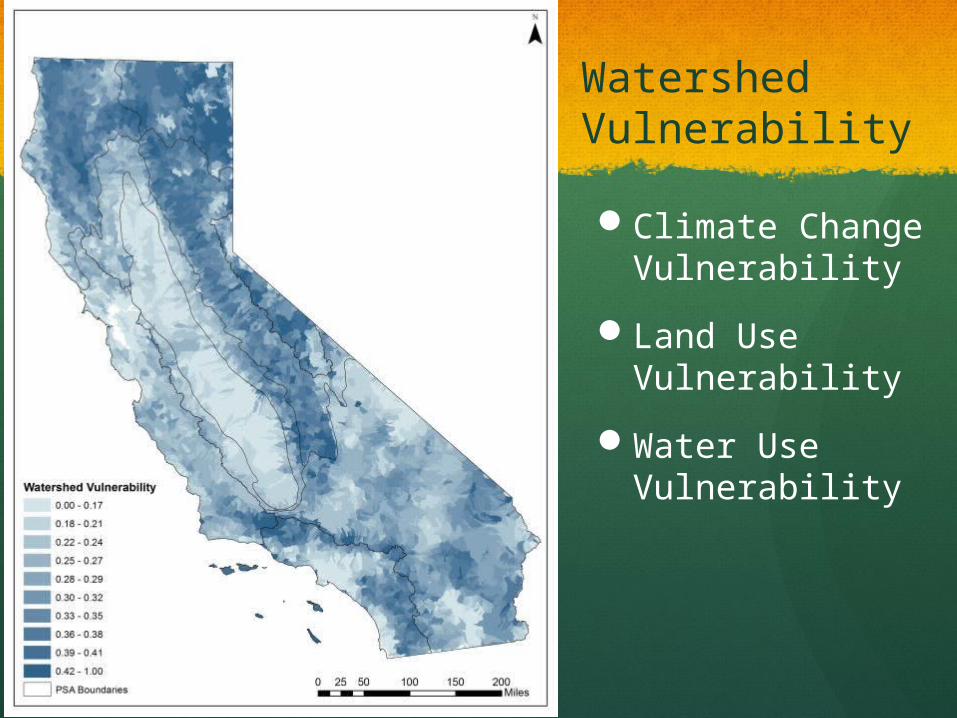
Watershed Vulnerability
Climate Change Vulnerability Projected change in precipitation Projected change in temperature Projected change in baseflow Projected change in monthly snowpack Projected change in wildfire severity Projected change in monthly surface runoff
Land Use Vulnerability Fire Regime Condition Class Projected Land Cover Change
Water Use Vulnerability Current Water Demand
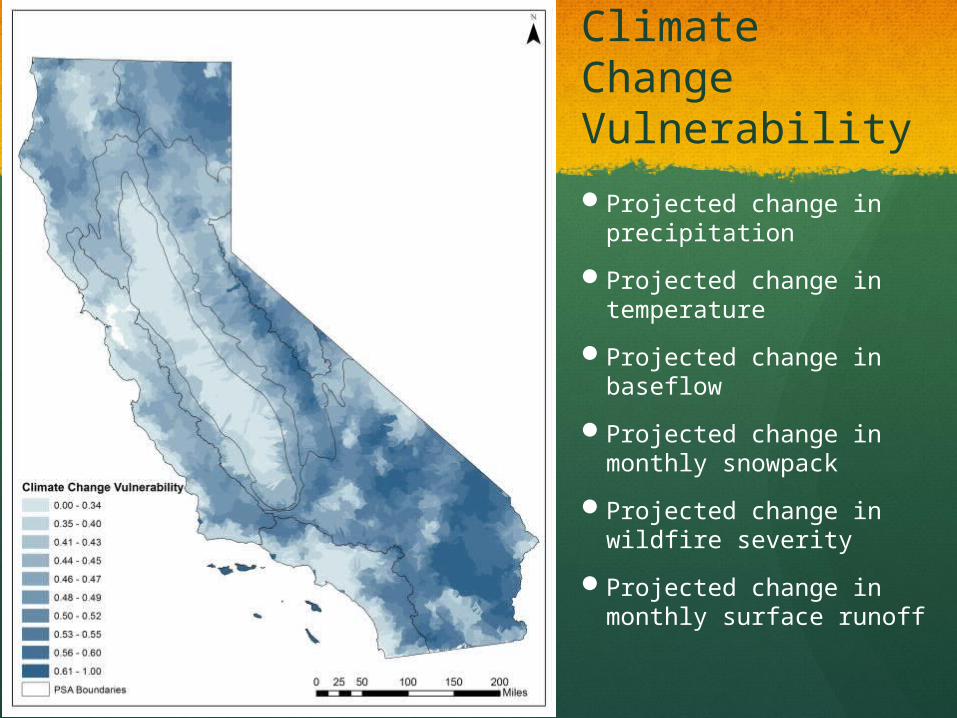
Climate Change Vulnerability
Projected change in precipitation
Projected change in temperature
Projected change in baseflow
Projected change in monthly snowpack
Projected change in wildfire severity
Projected change in monthly surface runoff
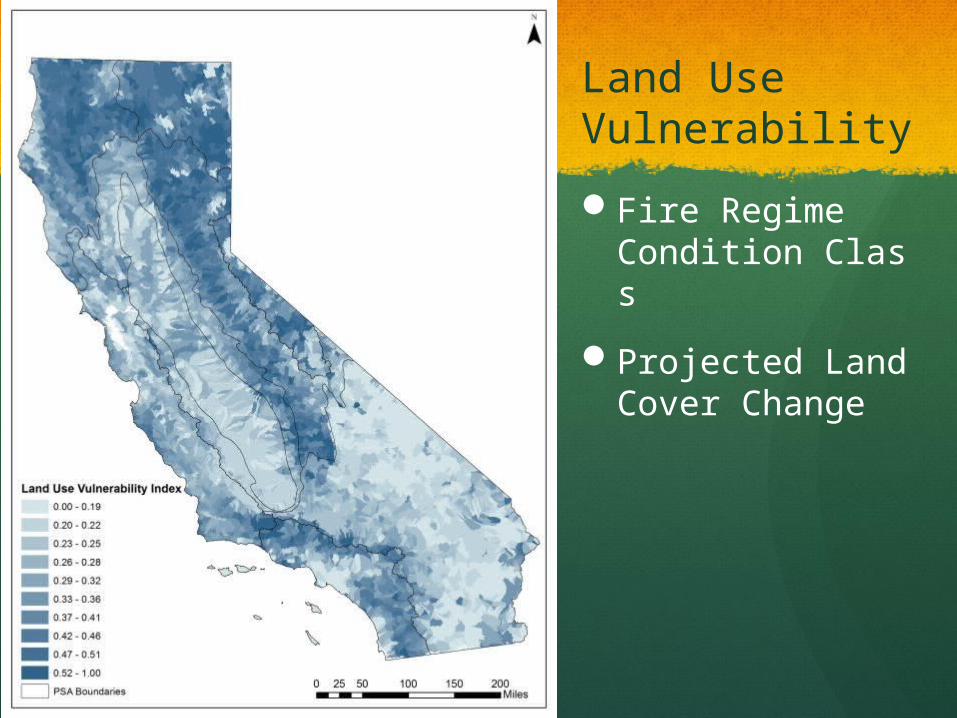
Land Use Vulnerability
Fire Regime Condition Class
Projected Land Cover Change
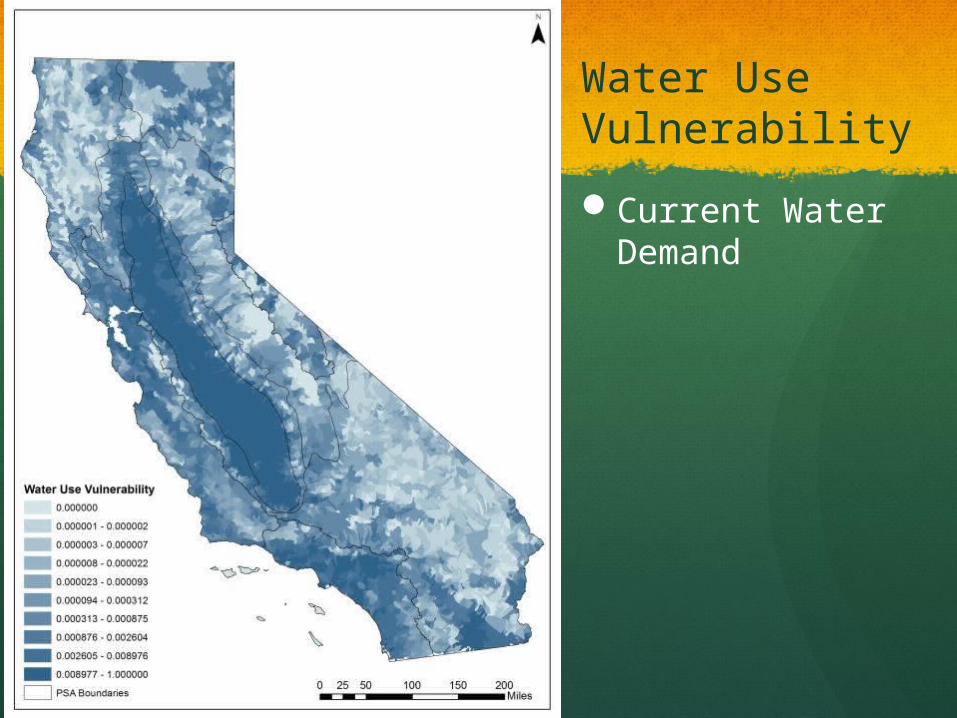
Water Use Vulnerability
Current Water Demand
Watershed Vulnerability
Climate Change Vulnerability
Land Use Vulnerability
Water Use Vulnerability
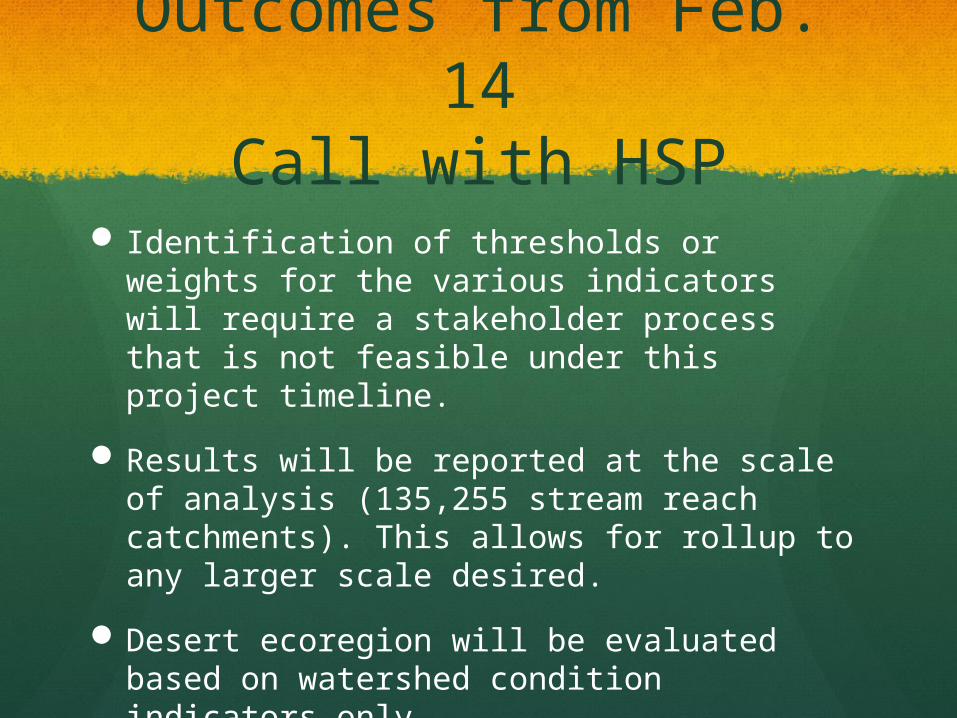
Outcomes from Feb. 14Call with HSP
Identification of thresholds or weights for the various indicators will require a stakeholder process that is not feasible under this project timeline.
Results will be reported at the scale of analysis (135,255 stream reach catchments). This allows for rollup to any larger scale desired.
Desert ecoregion will be evaluated based on watershed condition indicators only.
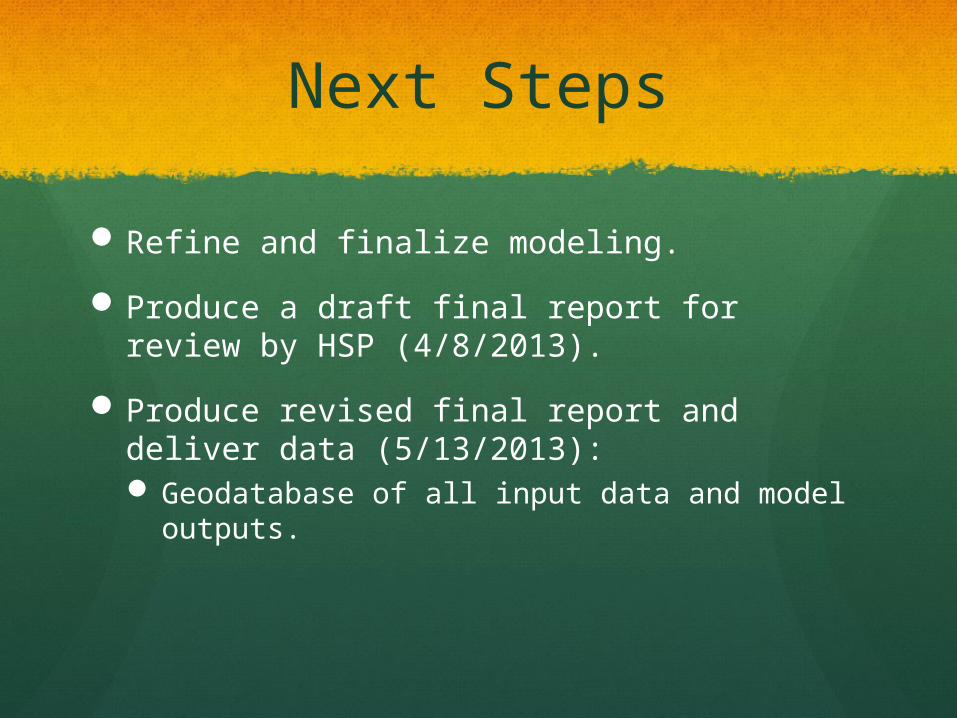
Next Steps
Refine and finalize modeling.
Produce a draft final report for review by HSP (4/8/2013).
Produce revised final report and deliver data (5/13/2013): Geodatabase of all input data and model
outputs.
Discussion
What are the Council recommendations for presenting the results in the final report and the Healthy Streams Portal?