Embed Size (px)
Citation preview
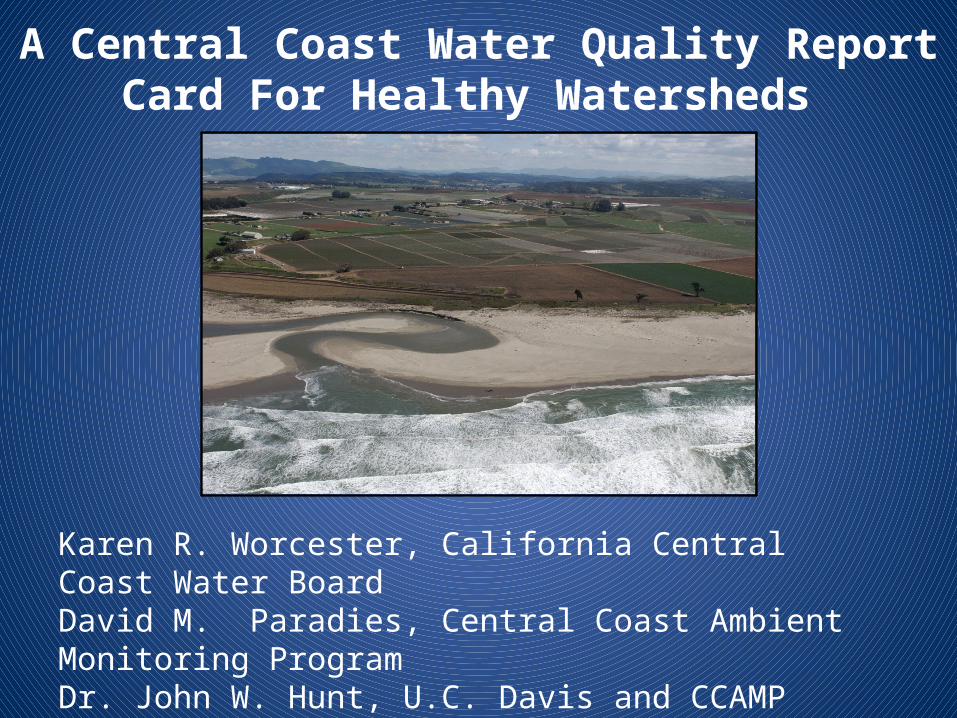
A Central Coast Water Quality Report Card For Healthy Watersheds
Karen R. Worcester, California Central Coast Water BoardDavid M. Paradies, Central Coast Ambient Monitoring ProgramDr. John W. Hunt, U.C. Davis and CCAMP

What do water quality managers and decision-makers need from their data?
Where is the problem? What is causing the problem? What land uses are associated with the problem? Where are our best places, that need to be
protected? Where are places that could be enhanced or
improved? Are things getting better or worse? Where??

We can answer these types of questions in an assessment report
But can we answer them with an online tool that updates as the data does??

We can…!

5
Our Vision for the Central Coast…
Healthy Watersheds
By 2025:Healthy Aquatic Habitat - 80% of aquatic habitat is healthy; remaining 20% exhibit positive trends in key parameters
Proper Land Management - 80% of land is managed to maintain proper watershed functions; remaining 20% exhibit positive trends in key parameters
Clean Groundwater- 80 percent of ground water is clean, and the remaining 20 percent will exhibit positive trends in key parameters

To address our goals we needed to characterize both status (health) and change
Multi-metric approach Measured and modeled data Consistent, threshold-based scoring approach Change at different scales– Analyte and multi-metric scales– Site, waterbody, and watershed scales

General principles
Help the user answer Where, Why, What? Data from readily available online sources Transparency of methods Drill down for detail Staff-maintained technical content via wikis

Healthy Watersheds Web Report Card, publically available later this year
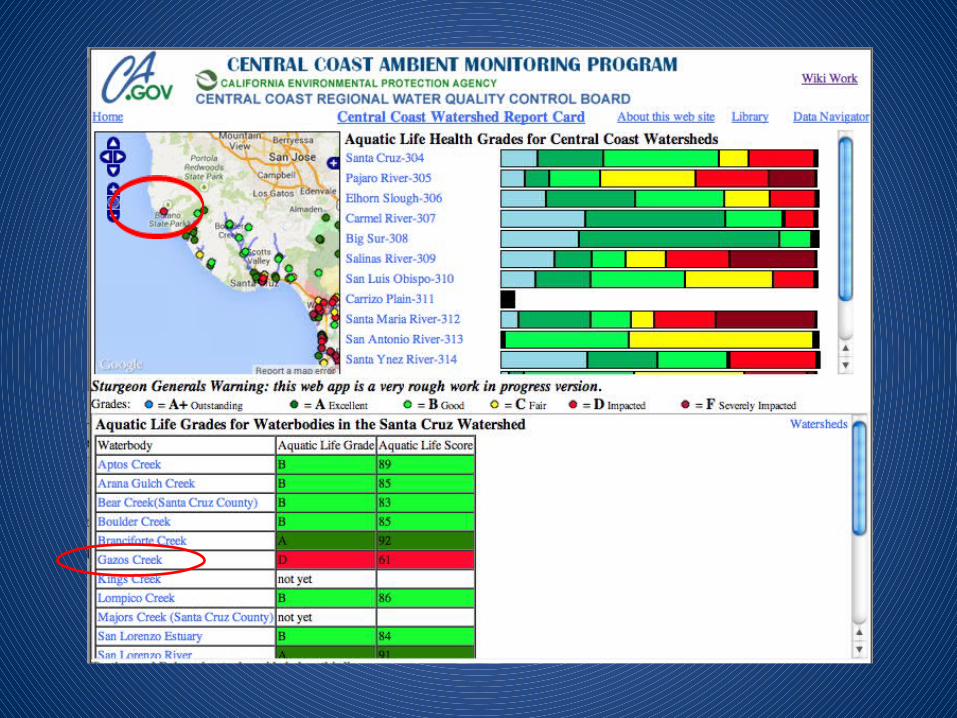


Report Card will connect to CCAMP Data Navigator to access data, maps, graphs, summary stats, trend analysis and other statistical tools

Change analysis at San Simeon Creek

Digging into the details…

Setting Chemical Thresholds in Sediment and Water

Our system is designed to allow selection of different thresholds for
different purposes
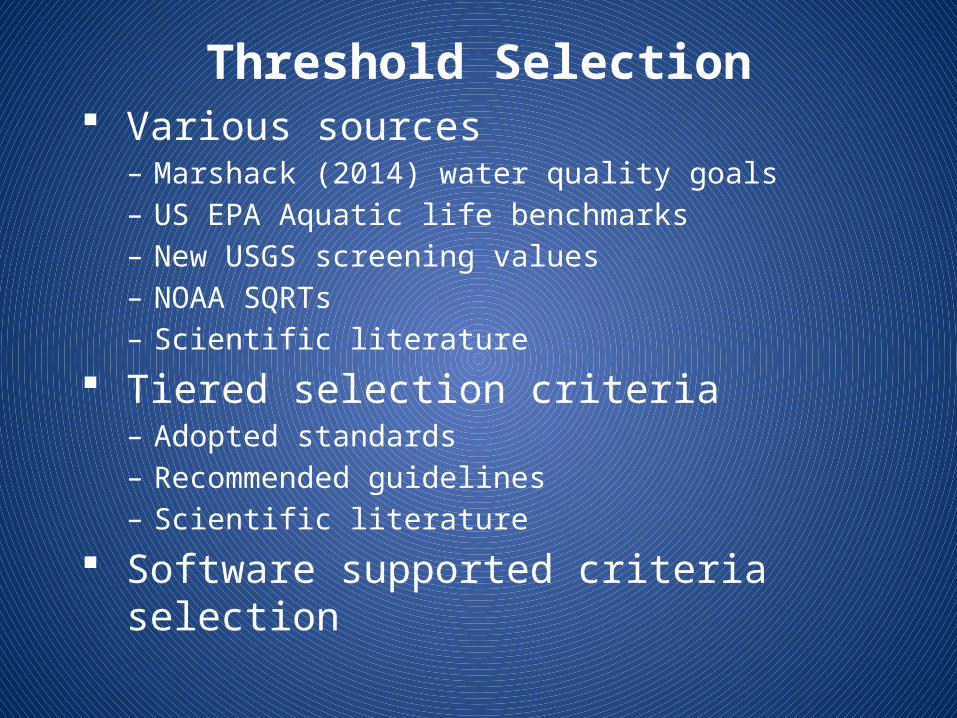
Threshold Selection Various sources– Marshack (2014) water quality goals– US EPA Aquatic life benchmarks– New USGS screening values– NOAA SQRTs– Scientific literature
Tiered selection criteria – Adopted standards – Recommended guidelines– Scientific literature
Software supported criteria selection
Threshold selections and underlying algorithms have been peer reviewed by several experts and are currently being
finalized

Adapted from Canadian Water Quality Index (CCME) Magnitude and exceedance components “Report card” paradigm
We are also designating Outstanding (A+) for “Blue Water Streams”that score Excellent across all measures.
Scoring Approach
A 100 to 90B 90 to 80C 80 to 65D 65 to 40F 45 to 1
5
Excellent
Good
Fair
Poor
Very Poor

Indices of Health
Human Health IndexDrinking water• Nitrogen species• Salts• Metals • Organic ChemicalsWater Contact• Pathogens
Aquatic Life Index• Conventional Analytes• Toxicity• Bioassessment• Biostimulatory Risk• Metals• Organic Chemicals

Aquatic Life IndexConventional water quality pH departure Water temperature Nitrate - N Total and unionized
ammonia Orthophosphate - P Total suspended solids Turbidity
Pesticides and other Organics• sediment and water
Metals • sediment and water
Biostimulation Oxygen departure Chlorophyll a (ug/L) % floating mats NNE oxygen deficit NNE predicted benthic
chlorophyll biomass
Toxicity• Algal cell growth• Fish survival• Fish growth• Invert survival in water• Invert reproduction in water• Invert survival in sediment

Habitat Scoring (future) Regionally-scaled riparian assessment using imagery analysis
in combination with field measures (Central Coast Wetlands Group)
Physical habitat measures from bioassessment sampling CRAM
Biology Benthic invertebrates Algae Other biological measures as available
Aquatic Life Index, cont.

Human Health Index
DRINKING WATERNitrogen Species• Nitrate• Ammonia• Nitrite
Salts• Boron• Chloride• Sodium• TDS
Pesticides and other Organics• sediment and water
Metals• sediment and water
WATER CONTACTPathogens• E. coli• Fecal coliform


Aggregating scores into an sub-index
Different combining approaches are used for different types of parameters
Mean average
Harmonic Mean
Worst score

Scoring Change

Why is this important?
For our region, it allows us to address the change component in our Vision goals:
Healthy Aquatic Habitat - 80% of aquatic habitat is healthy; remaining 20% exhibit positive trends in key parameters

From our website: Nitrate in the Monterey Area
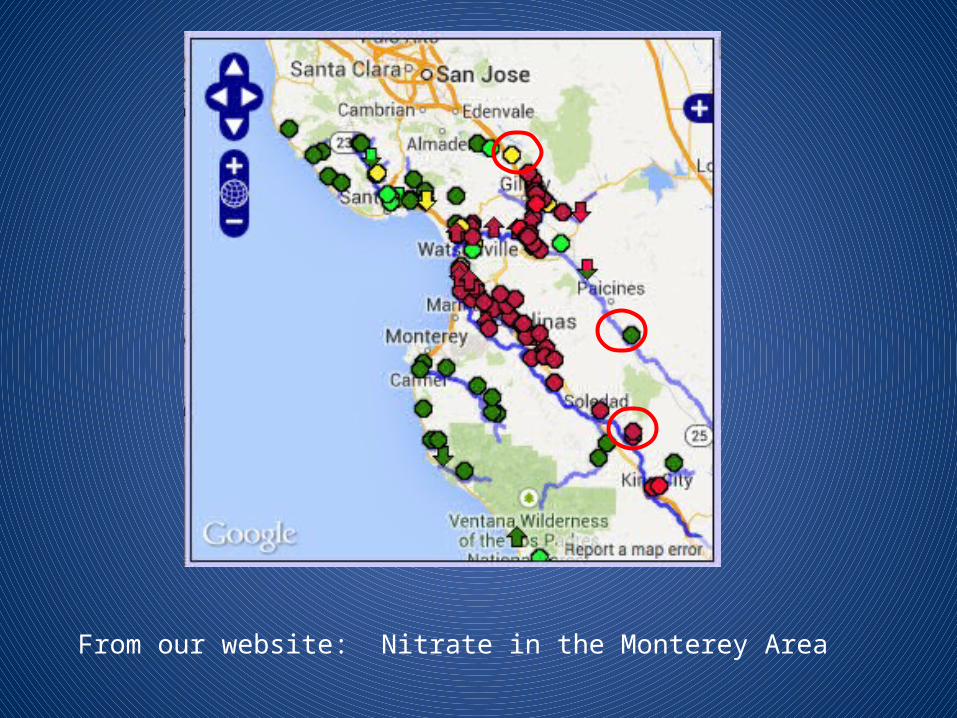
From our website: Nitrate in the Monterey Area

From our website: Nitrate in the Monterey Area (note arrow icons denoting change).

We look at change in two ways:Kendall Trend Analysis

We look at change in two ways:Kendall Trend Analysis

Some change doesn’t fit a straight line:

Some change doesn’t fit a straight line:

Some change doesn’t fit a straight line:

Change Point Analysis defines probable change points in a time series of data
In this case, a treatment plant upgrade went online in May, 2007

Apply scoring to data on each side of Change Point to grade (color) two sections
of arrow icon

Scoring whole watersheds
(currently in progress)

Flow and Loading• Assign scores to upstream reaches.
• Use modeled data to score unmonitored areas

Scoring Reaches
NHD reach network allows site scores to travel upstream to
next site or a land use boundary

Modeled data from California’s recent Healthy Watersheds (CADMUS) Assessment

Next Steps
• Public release of Data Navigator in September.
• Methods manual to the SWAMP program for peer review this fall.
• Public release of Phase 1 of the Central Coast Healthy Watersheds Report Card this winter

Phase 2 of the Healthy Watersheds Report Card
• Link to GeoTracker to incorporate groundwater data into Human Health Goal
• Address Goal 2 related to watershed function
• Provide access to land management indicators • Pesticide applications• Impervious surfaces• Ag program metrics• Stormwater program metrics• etc.

What is CCAMP OpenWater?An Internet-based Open Source Software Toolkit
focused on water quality and quantity assessment and visualization.
"If I can't picture it, I can't understand it." (Albert Einstein)
• Multi-server environment• Scheduled data mining from multiple databases• Data grooming• Statistical Analysis• Data visualization tools

Why Open Source?
Reduces system development failure risk Provides access to international community of code
developers and standards Empowers agency staff, users, and development
partners Avoids pre-committing the State and others to
licensing agreements with sole source commercial vendors

Current Data Flow
CEDEN (future)
GeoTracker
CDPR Pesticide Use Report
SWAMP
USGS NWIS
SWRCB Water Quality Goals
CCAMP Staging Data Tables
Web Views
The system is intended to use routine automated queries to keep data up-to-date.
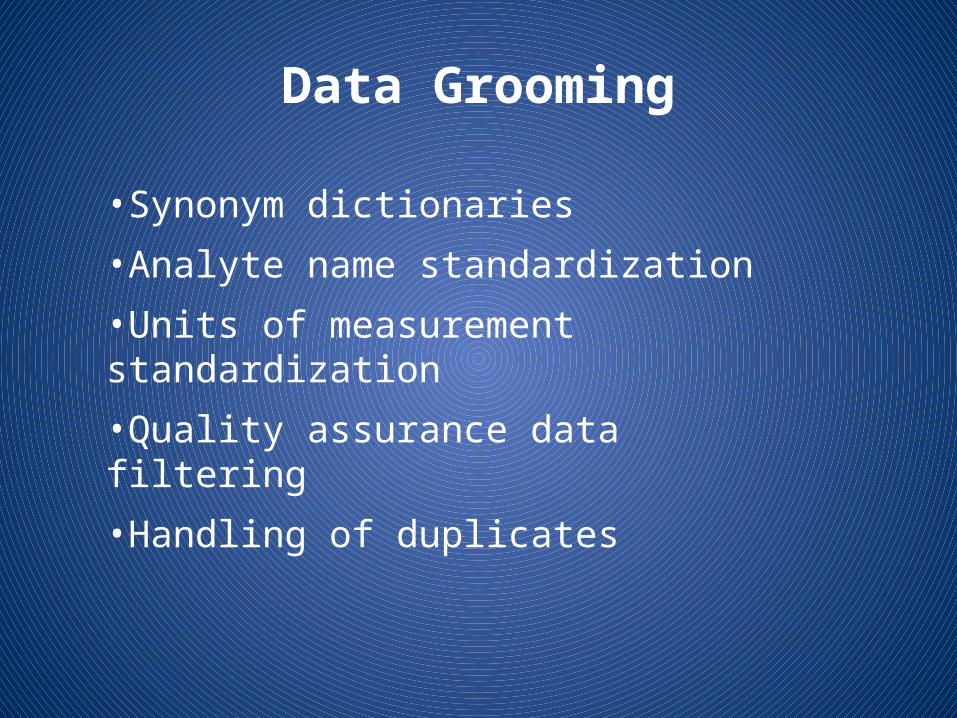
Data Grooming
•Synonym dictionaries
•Analyte name standardization
•Units of measurement standardization
•Quality assurance data filtering
•Handling of duplicates

GeoSpatial processing and linking
• Automated linking of monitoring sites to GIS layers
• Handling GIS layer idiosyncrasies• Linking of land use and other datasets to sites• Pesticide use characterization• Land Cover characterization• Flow and Load estimation
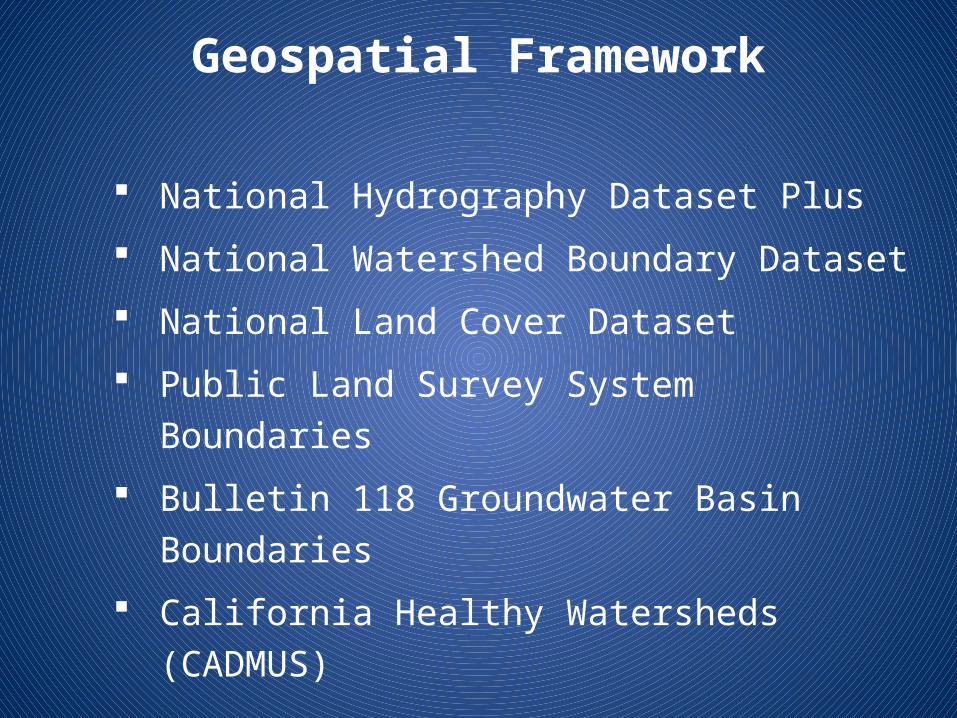
Geospatial Framework
National Hydrography Dataset Plus
National Watershed Boundary Dataset
National Land Cover Dataset
Public Land Survey System Boundaries
Bulletin 118 Groundwater Basin Boundaries
California Healthy Watersheds (CADMUS)

Adoption of this project in a state-wide framework?
• Software is open source and is available for use by others
• We have provided Moss Landing Regional Data Center with Regional versions of the Data Navigator
• State Board has expressed interest in adopting Data Navigator for broader use in association with CEDEN
• The Council’s Healthy Streams workgroup has expressed interest in adopting the Report Card for broader use in the Healthy Streams web portal.

?