Embed Size (px)
Citation preview
California Child Mental Health Performance Outcomes System: Recommendation Report
Prepared for: California Department of Health Care Services
Nadereh Pourat, PhD, MSPH Bonnie Zima, MD, MPH Alethea Marti, PhD Christopher Lee, MPH
August 2017
P a g e | 2
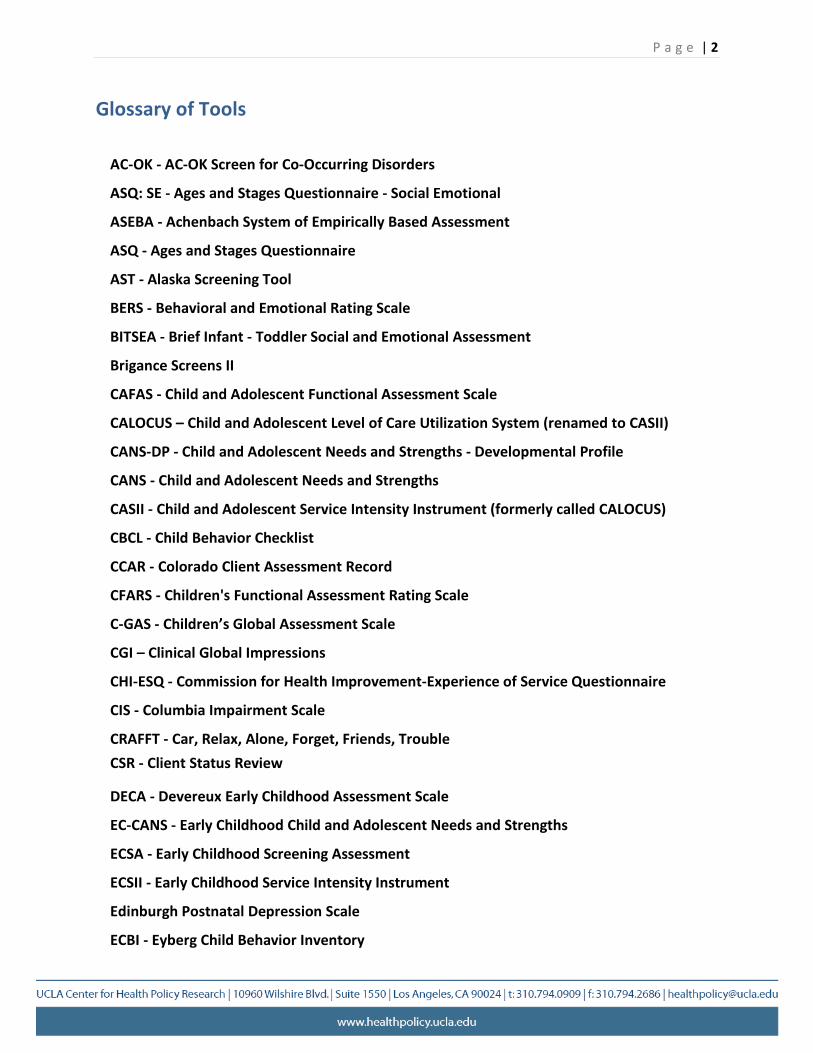
Glossary of Tools
AC-OK - AC-OK Screen for Co-Occurring Disorders
ASQ: SE - Ages and Stages Questionnaire - Social Emotional
ASEBA - Achenbach System of Empirically Based Assessment
ASQ - Ages and Stages Questionnaire
AST - Alaska Screening Tool
BERS - Behavioral and Emotional Rating Scale
BITSEA - Brief Infant - Toddler Social and Emotional Assessment
Brigance Screens II
CAFAS - Child and Adolescent Functional Assessment Scale
CALOCUS – Child and Adolescent Level of Care Utilization System (renamed to CASII)
CANS-DP - Child and Adolescent Needs and Strengths - Developmental Profile
CANS - Child and Adolescent Needs and Strengths
CASII - Child and Adolescent Service Intensity Instrument (formerly called CALOCUS)
CBCL - Child Behavior Checklist
CCAR - Colorado Client Assessment Record
CFARS - Children's Functional Assessment Rating Scale
C-GAS - Children’s Global Assessment Scale
CGI – Clinical Global Impressions
CHI-ESQ - Commission for Health Improvement-Experience of Service Questionnaire
CIS - Columbia Impairment Scale
CRAFFT - Car, Relax, Alone, Forget, Friends, Trouble CSR - Client Status Review
DECA - Devereux Early Childhood Assessment Scale
EC-CANS - Early Childhood Child and Adolescent Needs and Strengths
ECSA - Early Childhood Screening Assessment
ECSII - Early Childhood Service Intensity Instrument
Edinburgh Postnatal Depression Scale
ECBI - Eyberg Child Behavior Inventory
P a g e | 3
FIHS – Factors Influencing Health Status
GAS - Goal Attainment Scale
GAPS - Guidelines for Adolescent Preventive Services
GBO - Goal Based Outcome HEADSS - Home, Education, Activities, Drug use and abuse, Sexual behavior, Suicidality and Depression Psychosocial Interview for Adolescents HoNOSCA – Health of the Nation Outcome Scale for Children and Adolescents
Idaho Behavioral Health Standards
Kutcher Adolescent Depression Scale
M-CHAT - Modified Checklist for Autism in Toddlers
Ohio Scales - Ohio Youth Problems, Functional and Satisfaction
ORS - Outcome Rating Scale
PEDS - Parents’ Evaluation of Developmental Status
PHQ-2 - Patient Health Questionnaire - 2
PHQ-9 - Patient Health Questionnaire
PSC-Y - Pediatric Symptom Checklist - Youth Report
PSC - Pediatric Symptom Checklist
PSC-35 - Pediatric Symptom Checklist (35 items)
PECFAS - Preschool and Early Childhood Functional Assessment Scale (version of CAFAS)
SCARED - Self-Report for Childhood Anxiety Related Emotional Disorder
Social-Emotional Screening Tool
SDQ - Strengths and Difficulties Questionnaire
SDQ:SE - Strengths and Difficulties Questionnaire - Social Emotional
SRS - Session Rating Scale
SWYC/SWYC-MA - Survey of Wellbeing of Young Children
TABS - Temperament and Atypical Behavior Scale
TOP – Treatment Outcomes Package
TRF – Teacher Report Form (part of ASEBA)
Vanderbilt Diagnostic Rating Scale
Y-OQ - Youth Outcome Questionnaire
P a g e | 4
YSR - Youth Self Report (part of ASEBA)
P a g e | 5
Table of Contents
Executive Summary ............................................................................................................... 7
Part I: Develop a List of Candidate Tools........................................................................................7
Part II: Modified Delphi Panel Review ...........................................................................................8
Part III: Final Recommendation for a Statewide Outcomes Measurement Tool...............................8
Part I: Develop a List of Candidate Tools ............................................................................... 9
Environmental Scan.......................................................................................................................9
County and Provider Surveys .......................................................................................................14
Systematic Literature Review of Clinical Outcomes Tools..............................................................22
Final List of Candidate Tools.........................................................................................................24
Part II: Convene a Modified Delphi Panel ............................................................................ 28
Modified Delphi Panel .................................................................................................................28
Panelist selection ........................................................................................................................29
Ratings........................................................................................................................................29
Panel Discussion: Data Collection and Analyses............................................................................30
Overall Summary.........................................................................................................................31
Part III: Recommendation for a Clinical Outcome Tool......................................................... 35
Outcomes Measurement Tool......................................................................................................35
Considerations for the Interpretation of Outcomes Data ..............................................................41
Using Outcomes Data for Quality Improvement Efforts ................................................................46
Conclusions ......................................................................................................................... 47
References .......................................................................................................................... 48
P a g e | 6
Appendices:
Appendix I: List of Tools Used by States ..................................................................................... A-1
Appendix II: Copy of DHCS County Survey ................................................................................ A-26
Appendix III: Article Inclusion and Exclusion Criteria for Literature Scan...................................A-102
Appendix IV: Article Inclusion and Exclusion Criteria for Psychometrics Studies........................A-104
Appendix V: Evidence Tables of Studies Examined for Measure Report....................................A-105
Appendix VI: Bibliographic Citations for Literature Scan ..........................................................A-170
Appendix VII: Information on the 11 Candidate Measurement Tools........................................A-181
Appendix VIII: Modified Delphi Panel Individual Tool Ratings and Discussions .........................A-211
Appendix IX: Materials Provided to Panelists ..........................................................................A-232
Appendix X: Modified Delphi Panel Mean Scores ....................................................................A-241
Appendix XI: Common Themes in Delphi Panel Discussion.......................................................A-244
P a g e | 7
Executive Summary The UCLA Center for Health Policy Research (UCLA) was charged by the California Department of Health Care Services (DHCS) to examine available tools for the measurement of improvements in mental health and functioning status for children and adolescents served by California’s publicly funded specialty mental health systems. UCLA used scientifically rigorous methods to develop a recommendation for a tool that fits the scientific criteria for assessment of outcomes of care in this target population. The study was conducted in three parts. Part I included three distinct activities to identity a list of candidate tools. Part II included conducting a modified Delphi panel to examine the scientific properties of candidate tools and rate them for measuring outcomes statewide. Part III involved examining the evidence gathered from Parts I and II to produce a recommendation to DHCS for a tool to assess child/adolescent functional status outcomes.
Part I: Develop a List of Candidate Tools
UCLA conducted an environmental scan of the tools used to measure functional status by other states or nations, a survey of county mental health plans (MHPs) and their contracted providers on tools currently in use, and an in-depth literature review of the most frequently used tools identified in the environmental scan and survey to assess their psychometric properties and use as an outcome measure. Findings from these efforts were used to identify tools to be reviewed by the modified Delphi Panel in Part II of this study. The primary criteria for final selection included: (1) more than two citations in the scientific literature OR (2) used by at least 2 county mental health agencies in California. The final pool of candidate tools that met these criteria were:
Achenbach System of Empirically Based Assessment (ASEBA)
Clinical Global Impressions (CGI)
Strengths and Difficulties Questionnaire (SDQ)
Child and Adolescent Needs and Strengths (CANS)
Child and Adolescent Functional Assessment Scale (CAFAS)
Eyberg Child Behavior Inventory (ECBI)
Pediatric Symptom Checklist (35 items; PSC-35)
Treatment Outcomes Package (TOP)
Children’s Global Assessment Scale (C-GAS)
Ohio Youth Problems, Functional and Satisfaction (Ohio Scales)
Youth Outcomes Questionnaire (YOQ)
P a g e | 8
Part II: Modified Delphi Panel Review
A modified Delphi Panel, which is a well-established approach that combines review of scientifi c evidence with expert clinical judgment, was used to evaluate the 11 tools identified in Part I. This technique is a widely used and well-accepted method for achieving a convergence of opinion concerning real-world knowledge solicited from experts within the relevant field. The modified Delphi panel consistently rated the ASEBA, SDQ, and PSC-35 in the highest range for overall utility, effectiveness of care, scientific acceptability, usability and feasibility. Common strengths included broad range of symptoms and functioning, applicability for use with a wide age range, availability in California threshold languages and relatively strong scientific acceptability.
Part III: Final Recommendation for a Statewide Outcomes Measurement Tool
Minimum criteria for final selection were established based on the goals of DHCS and included a tool that:
Includes children of all ages Is easy to use Covers a broad range of symptoms Is patient centered Is available in California’s top three Is rated in the highest range for
threshold languages overall utility Measures current functioning and Is supported by high quality
can be used to measure change over scientific evidence to insure time reliability and validity
Has low respondent time burden
The PSC-35 (parent version) was the only tool that satisfied all nine minimum criteria for monitoring the effectiveness of publicly-funded child mental health care.
P a g e | 9
Introduction The UCLA Center for Health Policy Research (UCLA) was charged by the California Department of Health Care Services (DHCS) to examine available tools for the measurement of improvements in mental health and functioning status for children and adolescents served by California’s publicly funded specialty mental health systems. UCLA used scientifically rigorous methods to develop a recommendation for a tool that fits the scientific criteria for assessment of outcomes of care in this target population. The study was conducted in three parts. Part I included three distinct activities to identity a list of candidate tools. Part II included conducting a modified Delphi panel to examine the scientific properties of candidate tools and rate them for measuring outcomes statewide. Part III included examining the evidence gathered from Parts I and II activities to recommend a single tool for assessing outcomes by DHCS. This report provides detailed information on the methods of data collection and findings of each activity that culminate in the recommended tool and also includes a discussion of the challenges and considerations for implementation.
Part I: Develop a List of Candidate Tools Three activities were conducted to create a comprehensive list of standardized tools that are currently used to track clinical outcomes for children and youth receiving publicly funded community-based mental health care: an environmental scan, a survey of California county mental health agencies, and a literature search of scientific peer-reviewed articles. Table 1 identified the criteria included for each of these activities.
Table 1. Activities to develop a List of Candidate Tools
Activity Geographic Scope Time Frame Inclusion Criteria for
Preliminary Pool
Environmental scan of the websites of the Departments of Mental Health for each of the 49 states (excluding California)
USA Present Mandated use in ≥ 1 state
Survey of California county mental health agencies and providers California December
2015 Reported use by
≥ 2 county programs
Literature search of scientific peer-reviewed articles published in the past 5 years that measure clinical outcomes in target population.
International (published in
English)
2010-present
Used for tracking outcomes in
> 2 published studies
Environmental Scan
The use of mental health and functioning status standardized assessment tools (SATs) is required in Medicaid and the Children’s Health Insurance Program (CHIP) under the Early, Periodic Screening, Diagnostic and Treatment (EPSDT) benefit for all enrolled children under the age of 21. As part of the EPSDT guidelines, children are required to receive behavioral and developmental screening using approved SATs. The environmental scan revealed that the
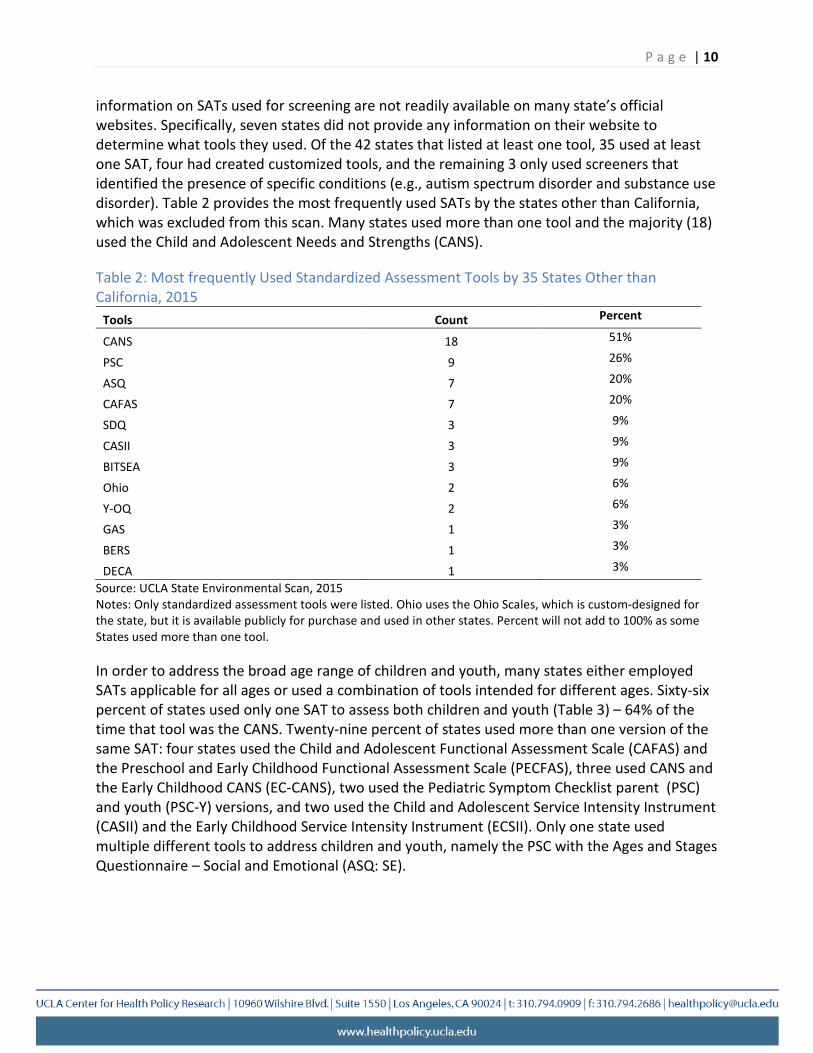
P a g e | 10
information on SATs used for screening are not readily available on many state’s official websites. Specifically, seven states did not provide any information on their website to determine what tools they used. Of the 42 states that listed at least one tool, 35 used at least one SAT, four had created customized tools, and the remaining 3 only used screeners that identified the presence of specific conditions (e.g., autism spectrum disorder and substance use disorder). Table 2 provides the most frequently used SATs by the states other than California, which was excluded from this scan. Many states used more than one tool and the majority (18) used the Child and Adolescent Needs and Strengths (CANS).
Table 2: Most frequently Used Standardized Assessment Tools by 35 States Other than California, 2015
Tools Count Percent
CANS 18 51%
PSC 9 26%
ASQ 7 20%
CAFAS 7 20%
SDQ 3 9%
CASII 3 9%
BITSEA 3 9%
Ohio 2 6%
Y-OQ 2 6%
GAS 1 3%
BERS 1 3%
DECA 1 3%
Source: UCLA State Environmental Scan, 2015 Notes: Only standardized assessment tools were listed. Ohio uses the Ohio Scales, which is custom-designed for the state, but it is available publicly for purchase and used in other states. Percent will not add to 100% as some States used more than one tool.
In order to address the broad age range of children and youth, many states either employed SATs applicable for all ages or used a combination of tools intended for different ages. Sixty-six percent of states used only one SAT to assess both children and youth (Table 3) – 64% of the time that tool was the CANS. Twenty-nine percent of states used more than one version of the same SAT: four states used the Child and Adolescent Functional Assessment Scale (CAFAS) and the Preschool and Early Childhood Functional Assessment Scale (PECFAS), three used CANS and the Early Childhood CANS (EC-CANS), two used the Pediatric Symptom Checklist parent (PSC) and youth (PSC-Y) versions, and two used the Child and Adolescent Service Intensity Instrument (CASII) and the Early Childhood Service Intensity Instrument (ECSII). Only one state used multiple different tools to address children and youth, namely the PSC with the Ages and Stages Questionnaire – Social and Emotional (ASQ: SE).
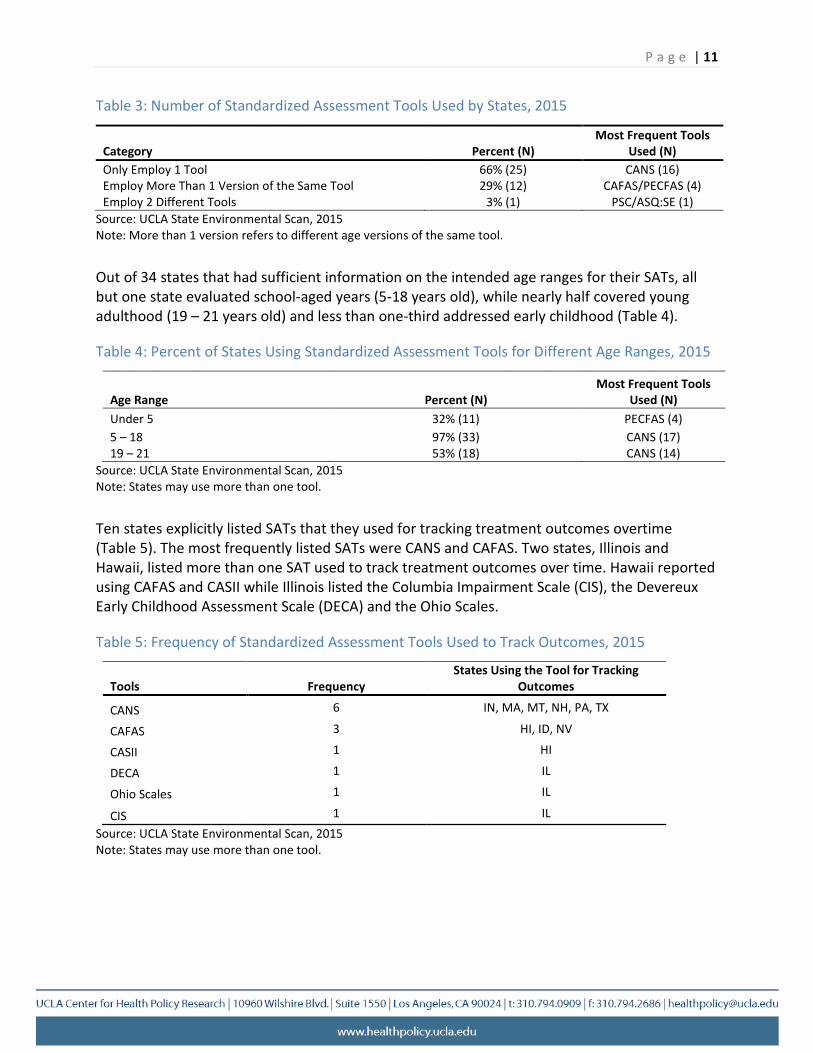
P a g e | 11
Table 3: Number of Standardized Assessment Tools Used by States, 2015
Most Frequent Tools Category Percent (N) Used (N) Only Employ 1 Tool 66% (25) CANS (16) Employ More Than 1 Version of the Same Tool 29% (12) CAFAS/PECFAS (4) Employ 2 Different Tools 3% (1) PSC/ASQ:SE (1)
Source: UCLA State Environmental Scan, 2015 Note: More than 1 version refers to different age versions of the same tool.
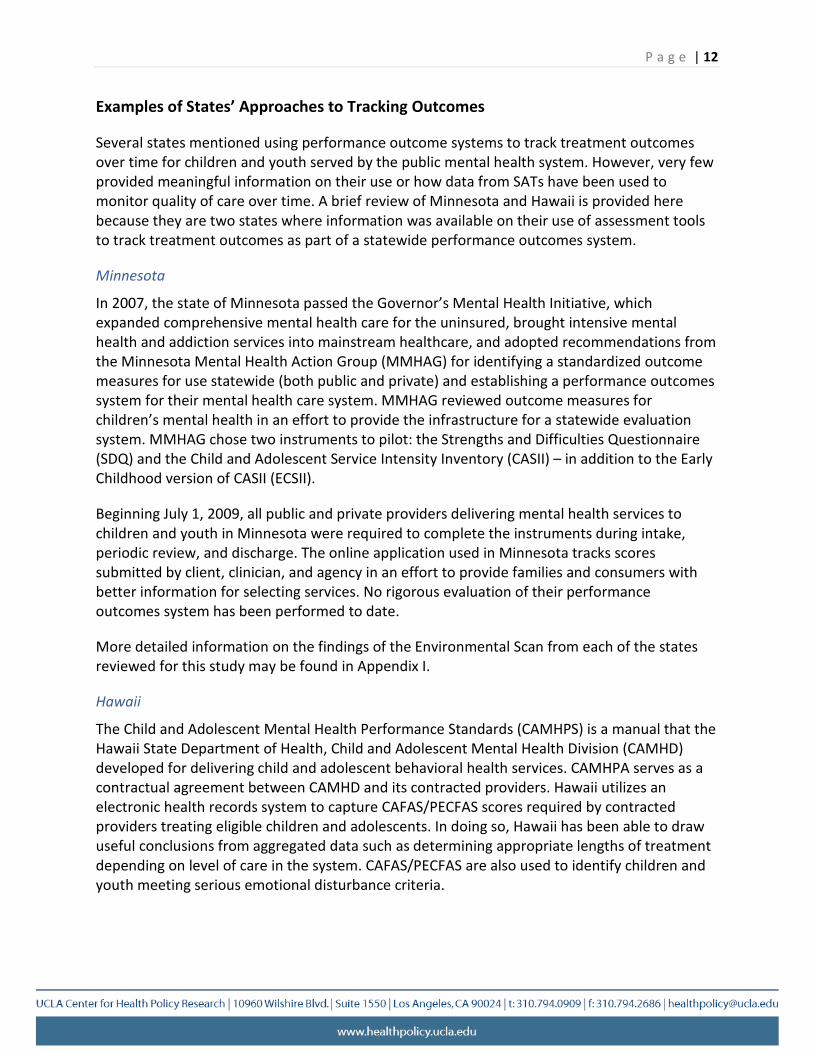
Out of 34 states that had sufficient information on the intended age ranges for their SATs, all but one state evaluated school-aged years (5-18 years old), while nearly half covered young adulthood (19 – 21 years old) and less than one-third addressed early childhood (Table 4).
Table 4: Percent of States Using Standardized Assessment Tools for Different Age Ranges, 2015
Most Frequent Tools Age Range Percent (N) Used (N) Under 5 32% (11) PECFAS (4) 5 – 18 97% (33) CANS (17) 19 – 21 53% (18) CANS (14)
Source: UCLA State Environmental Scan, 2015 Note: States may use more than one tool.
Ten states explicitly listed SATs that they used for tracking treatment outcomes overtime (Table 5). The most frequently listed SATs were CANS and CAFAS. Two states, Illinois and Hawaii, listed more than one SAT used to track treatment outcomes over time. Hawaii reported using CAFAS and CASII while Illinois listed the Columbia Impairment Scale (CIS), the Devereux Early Childhood Assessment Scale (DECA) and the Ohio Scales.
Table 5: Frequency of Standardized Assessment Tools Used to Track Outcomes, 2015
States Using the Tool for Tracking Tools Frequency Outcomes
CANS 6 IN, MA, MT, NH, PA, TX
CAFAS 3 HI, ID, NV
CASII 1 HI
DECA 1 IL
Ohio Scales 1 IL
CIS 1 IL Source: UCLA State Environmental Scan, 2015
Note: States may use more than one tool.
P a g e | 12
Examples of States’ Approaches to Tracking Outcomes
Several states mentioned using performance outcome systems to track treatment outcomes over time for children and youth served by the public mental health system. However, very few provided meaningful information on their use or how data from SATs have been used to monitor quality of care over time. A brief review of Minnesota and Hawaii is provided here because they are two states where information was available on their use of assessment tools to track treatment outcomes as part of a statewide performance outcomes system.
Minnesota
In 2007, the state of Minnesota passed the Governor’s Mental Health Initiative, which expanded comprehensive mental health care for the uninsured, brought intensive mental health and addiction services into mainstream healthcare, and adopted recommendations from the Minnesota Mental Health Action Group (MMHAG) for identifying a standardized outcome measures for use statewide (both public and private) and establishing a performance outcomes system for their mental health care system. MMHAG reviewed outcome measures for children’s mental health in an effort to provide the infrastructure for a statewide evaluation system. MMHAG chose two instruments to pilot: the Strengths and Difficulties Questionnaire (SDQ) and the Child and Adolescent Service Intensity Inventory (CASII) – in addition to the Early Childhood version of CASII (ECSII).
Beginning July 1, 2009, all public and private providers delivering mental health services to children and youth in Minnesota were required to complete the instruments during intake, periodic review, and discharge. The online application used in Minnesota tracks scores submitted by client, clinician, and agency in an effort to provide families and consumers with better information for selecting services. No rigorous evaluation of their performance outcomes system has been performed to date.
More detailed information on the findings of the Environmental Scan from each of the states reviewed for this study may be found in Appendix I.
Hawaii
The Child and Adolescent Mental Health Performance Standards (CAMHPS) is a manual that the Hawaii State Department of Health, Child and Adolescent Mental Health Division (CAMHD) developed for delivering child and adolescent behavioral health services. CAMHPA serves as a contractual agreement between CAMHD and its contracted providers. Hawaii utilizes an electronic health records system to capture CAFAS/PECFAS scores required by contracted providers treating eligible children and adolescents. In doing so, Hawaii has been able to draw useful conclusions from aggregated data such as determining appropriate lengths of treatment depending on level of care in the system. CAFAS/PECFAS are also used to identify children and youth meeting serious emotional disturbance criteria.
P a g e | 13
International Findings
Information on use of SATs for tracking outcomes were found for England and Australia.
England
Over the past two decades, the 28 member countries in the European Union (EU) have collectively been focused on ensuring continuity in meeting service needs across member countries. In December 2010, the Executive Agency for Health and Consumers (now called the Consumers, Health and Food Executive Agency) commissioned a report on the status of mental health systems across the European Union. The report found that all but two countries had prioritized mental health care in their public health system. Most countries had realized the importance and value of performance outcomes, but few had taken steps to implement national tools to measure effectiveness of care among children and youth.
Detailed information on specific tools used to track outcomes was lacking for many EU countries. However, information on the use of performance outcomes systems in child mental health services were available for Denmark and England, but only England provided sufficient information for a brief review.
England has developed a national system to routinely measure treatment outcomes among children and adolescents. England’s Child and Adolescent Mental Health Services (CAMHS) created a consortium that recommended a range of SATs to be used as outcome measures including the Strengths and Difficulties Questionnaire (SDQ), the Children’s Global Assessment Scale (C-GAS), the Health of the Nation Outcome Scale for Children and Adolescents (HoNOSCA), the Commission for Health Improvement Experience of Service Questionnaire (CHI-ESQ), Goal Based Outcomes (GBO), the Outcome Rating Scale (ORS) and the Session Rating Scale (SRS). Together, these recommended tools are used to evaluate treatment outcomes from the perspective of both clinicians and service users. The CAMHS Outcome Research Consortium (CORC) also established guidelines for use of these tools. CORC recommends HoNOSCA and C-GAS be used to assess patient functioning, while the SDQ and GBOs be used to allow the service user to evaluate their functioning. The CHI-ESQ is recommended for use to allow patients an opportunity to provide feedback on their experience. According to CORC guidelines, HoNOSCA, SDQ or C-GAS should be completed at baseline and at a 6-month follow-up, or sooner.
CORC also analyzes outcome measurement data in order to evaluate uptake of tools and guidelines. Recent reports found that, while implementation of these tools remains low, there has been an increase in the use of HoNOSCA, C-GAS and SDQ. CORC also found that clinician-completed tools were more likely to be completed at baseline and follow-up than tools completed by patients or service-users. In addition, tools that assess general domains of mental health, rather than symptom-specific tools, were more likely to be used at baseline and follow-up. Clinicians reported constraints on time and resources, lack of timely feedback from completed tools, lack of training, and concerns with how the data would be used as reasons for barriers to use. Despite the challenges presented during the adoption of these tools, their
P a g e | 14
repeated use, which is required to track treatment outcomes over time, has increased and CAMHS is focusing on increasing clinician awareness and training for these tools, as well as education that specifically addresses the need to assess effectiveness of mental health care.
Australia
In the late 1990’s the Australian Government identified routine outcome measurement as a crucial step in improving the effectiveness of publicly-funded mental health services and service efficiency. By 2002, four tools had been identified that were required to be used and reported on by all states/territories: HoNOSCA, C-GAS and Factors Influencing Health Status (FIHS) for clinician-rated assessments and SDQ for self-assessment. Australia’s Mental Health National Outcomes and Casemix Collection protocol required all states/territories to routinely administer the clinician-rated assessments during intake, review, and discharge for every patient receiving public mental health services – including community, inpatient and ambulatory care settings. States/territories were required to report two sets of data: de-identified patient-level outcome data, and episodes of care and community contacts. Together, these data allow the tracking of changes in individual patient outcomes over time, comparisons of outcomes across groups of patients, and analysis of resource use by consumers.
Although information on the results of Australia’s outcomes system is largely unavailable, some issues were identified. Australia initially experienced difficulty in linking patients in the reported data to other relevant datasets due to non-unique patient identifiers. Clinicians reported problems completing assessments, citing training inconsistencies and vagueness in protocol requirements as reasons. Similar to England, Australia found that the clinician-rated tools were more likely to be completed at intake, review, and discharge than the consumer-rated tool.
County and Provider Surveys
In December 2015, UCLA surveyed all California county behavioral health directors and a purposive sample of county-contracted providers to identify which SATs they used in their respective child specialty mental health clinics and to obtain further detail on how data were gathered and used. The UCLA survey specifically included the CANS, the Child Behavior Checklist (CBCL), the Eyberg Child Behavior Inventory (ECBI), the Youth Outcome Questionnaire (YOQ), the Child and Adolescent Level of Care Utilization System (CALOCUS), and PSC because these tools were identified as being commonly used functional assessment tools in a 2013 survey of California counties conducted by DHCS. The UCLA survey also allowed respondents to list up to three additional tools. The surveys were emailed by DHCS to all county behavioral health directors, and a sample of individual providers and provider organizations, through Survey Monkey. A copy of the county survey is shown in Appendix II.
The sample of provider survey participants were selected from 395,042 provider organizations and 830,210 individual providers. One hundred and twenty providers were selected based on total approved expenditures during State Fiscal Year (FY) 2014 and region based on population size: large, medium, small, small-rural with Los Angeles county as its own category.
The respondents were reminded to complete the survey every week for 5 weeks. After 6 weeks, 56 counties and 27 contracted providers completed the survey. Results for each of the topic areas of the survey (i.e., types and frequency of functional assessment tools used, length of time the most frequent tools were in use, county data collection methods, data storage and county requirements, and feasibility of tools for evaluating functional status) are reflected below for counties and providers separately.
County Findings
Types & Frequency of Functional Assessment Tools Used
As shown in Table 6, the UCLA survey found that CANS was reported to be the most frequently used tool by 33 counties, followed by the CBCL (14 counties), and the ECBI (12 counties). The CAFAS, ASQ, and PSC were also identified, but used by few California counties. Of the three counties that reported they did not use any tool for evaluating functional status, one county stated that they were currently evaluating whether to implement the CANS.
Table 6: Functional Assessment Tools Used by California Counties, 2015
Tool # Counties CANS 33 CBCL 14
ECBI 12 YOQ 9 CALOCUS 7 CAFAS 2 ASQ 2 PSC 1
Other Tools 23
P a g e | 15
Source: UCLA Survey of California County Mental Health Plans and Rendering Providers Note: Other refers to tools used for purposes other than tracking outcomes of care. Some counties used more than one tool.
Twenty-seven out of 56 reporting counties (48%) reported only using one tool, the remainder of the counties reported using up to six tools (data not shown). Seventeen out of the 27 counties that used one tool reported using the CANS (data not shown). ECBI, on the other hand, was never used in isolation. No mention was made of why counties used more than one tool. Twenty-five out of 56 counties (45%) reported using tools that were either diagnosis-specific (e.g., autism assessment tools) or not functional assessment tools.
In the following analyses in this section, we included data on seven specific tools used including CANS, CBCL, ECBI, YOQ, CALOCUS, CAFAS and PSC. We did not include information on the ASQ as it does not evaluate functional status.
P a g e | 16
Length of Time the Most Frequent Tools Were in Use
Nearly one-third of counties stated that they had been using their tool(s) for more than five years, with most using either the CBCL or ECBI (Table 7). Among counties that had started to use the tool in the last three years, 72% indicated they used the CANS.
Table 7: Length of Time Using Selected Functional Assessment Tools, California Counties, 2015
Length of Time CANS CBCL ECBI YOQ CALOCUS CAFAS PSC Total
Less Than 1 Year 30% (10) 21% (3) 8% (1) 11% (1) 14% (1) 0 0 21% (16)
1 year or more but less than 3 years 42% (14) 14% (2) 33% (4) 22% (2) 0 0 0 29% (22)
3 years or more but less than 5 years 15% (5) 14% (2) 8% (1) 33% (3) 43% (3) 50% (1) 0 18% (14)
5 years or more 12% (4) 50% (7) 50% (6) 33% (3) 43% (3) 50% (1) 100% (1) 32% (24)
Total 100% (33)
100% (14)
100% (12)
100% (9)
100% (7)
100% (2)
100% 100% (1) (76)
Source: UCLA survey of California County Mental Health Plans and Rendering Providers, 2015. Note: Percentages represent the percentage of counties that reported using the tool for that length out of the total number of counties that use the tool. The numbers of reporting counties are in parentheses.
County Data Collection Methods
Counties were asked to report on the frequency that each tool was administered, which providers administered the tool, whether data were gathered electronically, and in which languages each tool was administrated. Many counties did not provide this information consistently. Twenty-one percent of counties reported using tools that they administered at least at the beginning and end of treatment. Six percent of counties reported that they administered their tools every 3 months and 38% administered it every 6 months.
When asked who administers the tool, marriage and family therapists were most frequently cited (79%), followed by social workers (55%), behavioral health counselors (52%) and case managers (41%). Psychiatrists (9%) and psychologists (27%) were not frequently cited by counties. Most counties reported only using paper forms to administer their tools (50%), while 18% of counties only used electronic systems. Seventy-seven percent indicated that they either used tools that were available in languages other than English or translated the tools into the appropriate languages. Counties indicated that the ECBI (75%), CBCL (71%), YOQ (56%) and CANS (40%) were available in Spanish. CALOCUS was the only tool that was reported as not being available in Spanish.
Data Storage and County Requirements
Thirty-five counties (63%) indicated that they used electronic health records (EHR) to store the information captured from the tools. The remainder used Microsoft Excel and software provided by the tool. Thirty counties (54%) indicated that they required their contracted providers to use a specific tool, while 23 (41%) indicated they did not. Six counties (11%) stated that they required contracted providers to report aggregate scores from the assessment tools,
P a g e | 17
26 (46%) required scores for each client and 21 (38%) did not require scores to be reported at all. Three counties did not provide answers to questions on reporting requirements.
Feasibility of Tools for Evaluating Functional Status
Counties were asked to indicate what they used the tool for and to score the tool’s usefulness in that area on a scale of one to three, with “1 = not useful”, “2 = somewhat useful”, and “3 = very useful.” Table 8 illustrates that counties use these tools for multiple purposes and consider the majority to be at least somewhat useful for those purposes. For example, among the four most frequently used tools reported by counties, YOQ was scored the highest for tracking improvement in behavioral health outcomes over time and for treatment goal tracking. CBCL and YOQ were both scored the highest for screening and diagnosing behavioral health disorders.
Most counties reported that it took between 10 to 60 minutes to administer their respective tool(s); however, some reported that it could take longer than 60 minutes to complete the CANS, CBCL and CAFAS.
Table 8: Purpose of Tools and Administration Time, California Counties, 2015
Domain Topic CANS CBCL ECBI YOQ CALOCUS CAFAS PSC
Number of Counties Using Tool 33 14 12 9 7 2 1
Screening 2.2 (23) 2.6 (11) 2.5 (10) 2.6 (5) 1.8 (5) 2 (1) 3 (1)
Diagnosing 2.3 (23) 2.6 (11) 2.2 (9) 2.6 (5) 1.5 (4) 1 (1) 2 (1)
Level of Care Purpose for Tracking
administering Outcomes the Tool Treatment
Goals Quality Improvement
2.6 (25)
2.6 (31)
2.6 (31)
2.6 (27)
2.2 (11)
2.7 (12)
2.3 (11)
2.2 (11)
2.3 (8)
2.8 (12)
2.8 (10)
2.6 (10)
2.2 (5)
2.9 (8)
2.9 (8)
2.6 (8)
2.6 (7)
2.3 (6)
1.75 (4)
2.4 (5)
3 (1)
3 (1)
2 (1)
2 (1)
1 (1)
2 (1)
2 (1)
2 (1)
< 5 minutes 5 minutes -10 minutes 10 minutes -
Administration 30 minutes Time 30 minutes -
60 minutes
> 60 minutes Total
-
7% (2)
37% (11)
37% (11)
20% (6)
30
7% (1)
-
65% (9)
21% (3)
7% (1)
14
-
45% (5)
45% (5)
9% (1)
-
11
-
11% (1)
44% (4)
44% (4)
-
9
14% (1)
14% (1)
71% (5)
-
-
7
-
-
-
50% (1)
50% (1)
2
-
-
-
100% (1)
-
1 Source: UCLA Survey of California County Mental Health Plans and Rendering Providers, 2015 Note: Scores for purpose of administering the tool are averages across all counties and in parenthesis are the number of counties reporting that they use it for that purpose
P a g e | 18
Counties were asked what problems, if any, they have experienced using the tools. Table 9 provides the percentage of reporting counties that indicated a specific problem. For example, of the 33 counties that reported using CANS, 22 indicated experiencing at least one problem. Among those 22 counties that indicated at least one problem with the CANS, 36% reported experiencing problems with the reliability of the scores/results from the tool. Counties indicated experiencing the most problems across all domains with CBCL and YOQ.
Table 9: Problems Experienced with Tools, California Counties, 2015
Problem CANS CBCL ECBI YOQ CALOCUS CAFAS PSC
Number of Counties Using Tool 33 14 12 9 7 2 1
Completion because of Length 0 63% (5) 0 43% (3) 25% (1) 50% (1) 0
Burden on Administrator 0 50% (4) 50% (2) 57% (4) 50% (2) 50% (1) 0
Burden on Patient 18% (4) 25% (2) 15% (1) 71% (5) 0 0 0 Accuracy in Assessing What it Intends to Assess 18% (4) 25% (2) 0 29% (2) 50% (2) 0 100% (1)
Reliability of Scores/Results 36% (8) 13% (1) 75% (3) 14% (1) 50% (2) 0 0
Total 22 8 4 7 4 2 1 Source: UCLA Survey of California County Mental Health Plans and Rendering Providers, 2015 Note: Percentages represent the percentage of counties that reported a particular problem out of the total number of counties that use the tool. The numbers of reporting counties are in parentheses. Totals represent the number of respondents that indicated at least one problem for that tool.
Ease of use and interpretation were scored by counties and the averages are provided in Table 10. Scores were measured on a five-point scale with “1 = very difficult”, “2 = somewhat difficult”, “3 = neutral”, “4 = somewhat easy” and “5 = very easy.” Counties rated the CBCL as the easiest tool to use and interpret, while CANS received the lowest scores for ease of use and interpretation among the most frequently used tools.
Also provided in Table 10 are scores for how useful the tool is in assessing the effectiveness of care for patients on a three-point scale with “1 = not useful”, “2 = somewhat useful” and “3 = very useful.” Counties scored YOQ as the most useful tool in assessing effectiveness of care. Counties indicated that most of the tools supported clinical decision-making, but CBCL had the lowest percentage.
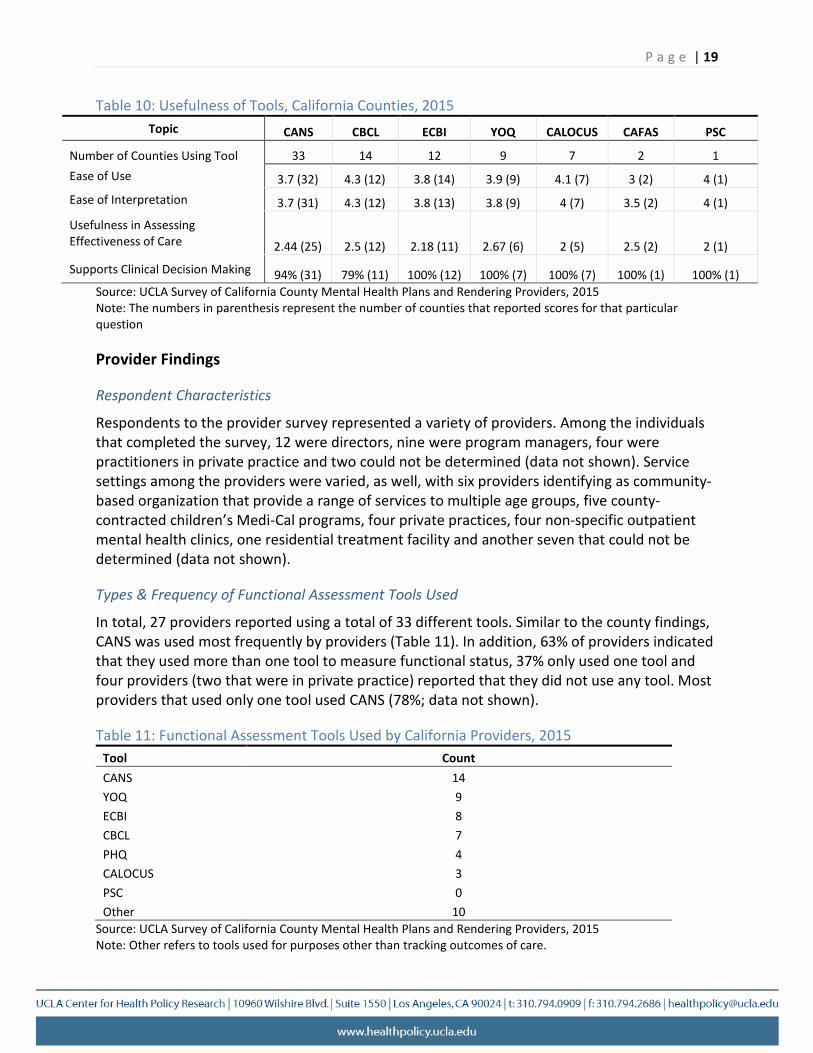
P a g e | 19
Table 10: Usefulness of Tools, California Counties, 2015 Topic CANS CBCL ECBI YOQ CALOCUS CAFAS PSC
Number of Counties Using Tool 33 14 12 9 7 2 1 Ease of Use 3.7 (32) 4.3 (12) 3.8 (14) 3.9 (9) 4.1 (7) 3 (2) 4 (1) Ease of Interpretation 3.7 (31) 4.3 (12) 3.8 (13) 3.8 (9) 4 (7) 3.5 (2) 4 (1)
Usefulness in Assessing Effectiveness of Care 2.44 (25) 2.5 (12) 2.18 (11) 2.67 (6) 2 (5) 2.5 (2) 2 (1)
Supports Clinical Decision Making 94% (31) 79% (11) 100% (12) 100% (7) 100% (7) 100% (1) 100% (1) Source: UCLA Survey of California County Mental Health Plans and Rendering Providers, 2015 Note: The numbers in parenthesis represent the number of counties that reported scores for that particular question
Provider Findings
Respondent Characteristics
Respondents to the provider survey represented a variety of providers. Among the individuals that completed the survey, 12 were directors, nine were program managers, four were practitioners in private practice and two could not be determined (data not shown). Service settings among the providers were varied, as well, with six providers identifying as community-based organization that provide a range of services to multiple age groups, five county-contracted children’s Medi-Cal programs, four private practices, four non-specific outpatient mental health clinics, one residential treatment facility and another seven that could not be determined (data not shown).
Types & Frequency of Functional Assessment Tools Used
In total, 27 providers reported using a total of 33 different tools. Similar to the county findings, CANS was used most frequently by providers (Table 11). In addition, 63% of providers indicated that they used more than one tool to measure functional status, 37% only used one tool and four providers (two that were in private practice) reported that they did not use any tool. Most providers that used only one tool used CANS (78%; data not shown).
Table 11: Functional Assessment Tools Used by California Providers, 2015 Tool Count CANS 14 YOQ 9 ECBI 8 CBCL 7 PHQ 4 CALOCUS 3 PSC 0 Other 10
Source: UCLA Survey of California County Mental Health Plans and Rendering Providers, 2015 Note: Other refers to tools used for purposes other than tracking outcomes of care.
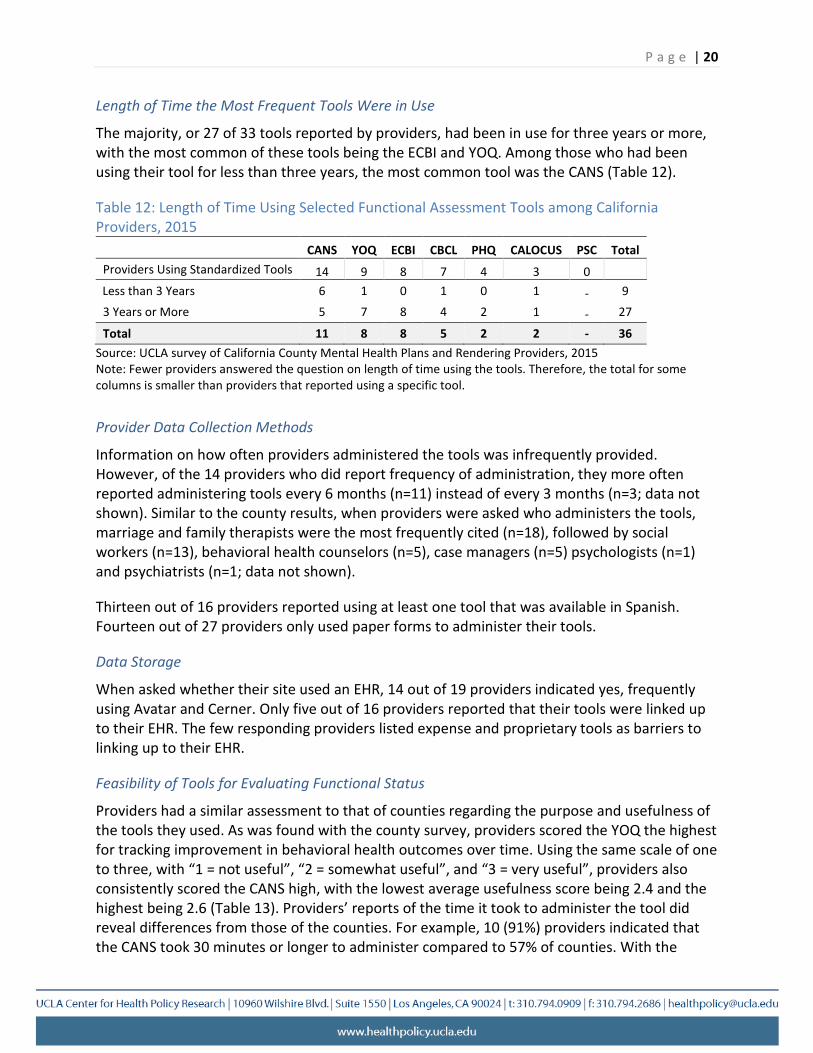
Length of Time the Most Frequent Tools Were in Use
The majority, or 27 of 33 tools reported by providers, had been in use for three years or more, with the most common of these tools being the ECBI and YOQ. Among those who had been using their tool for less than three years, the most common tool was the CANS (Table 12).
Table 12: Length of Time Using Selected Functional Assessment Tools among California Providers, 2015
CANS YOQ ECBI CBCL PHQ CALOCUS PSC Total Providers Using Standardized Tools 14 9 8 7 4 3 0
Less than 3 Years 6 1 0 1 0 1 - 9 3 Years or More 5 7 8 4 2 1 - 27
Total 11 8 8 5 2 2 - 36
P a g e | 20
Source: UCLA survey of California County Mental Health Plans and Rendering Providers, 2015 Note: Fewer providers answered the question on length of time using the tools. Therefore, the total for some columns is smaller than providers that reported using a specific tool.
Provider Data Collection Methods
Information on how often providers administered the tools was infrequently provided. However, of the 14 providers who did report frequency of administration, they more often reported administering tools every 6 months (n=11) instead of every 3 months (n=3; data not shown). Similar to the county results, when providers were asked who administers the tools, marriage and family therapists were the most frequently cited (n=18), followed by social workers (n=13), behavioral health counselors (n=5), case managers (n=5) psychologists (n=1) and psychiatrists (n=1; data not shown).
Thirteen out of 16 providers reported using at least one tool that was available in Spanish. Fourteen out of 27 providers only used paper forms to administer their tools.
Data Storage
When asked whether their site used an EHR, 14 out of 19 providers indicated yes, frequently using Avatar and Cerner. Only five out of 16 providers reported that their tools were linked up to their EHR. The few responding providers listed expense and proprietary tools as barriers to linking up to their EHR.
Feasibility of Tools for Evaluating Functional Status
Providers had a similar assessment to that of counties regarding the purpose and usefulness of the tools they used. As was found with the county survey, providers scored the YOQ the highest for tracking improvement in behavioral health outcomes over time. Using the same scale of one to three, with “1 = not useful”, “2 = somewhat useful”, and “3 = very useful”, providers also consistently scored the CANS high, with the lowest average usefulness score being 2.4 and the highest being 2.6 (Table 13). Providers’ reports of the time it took to administer the tool did reveal differences from those of the counties. For example, 10 (91%) providers indicated that the CANS took 30 minutes or longer to administer compared to 57% of counties. With the
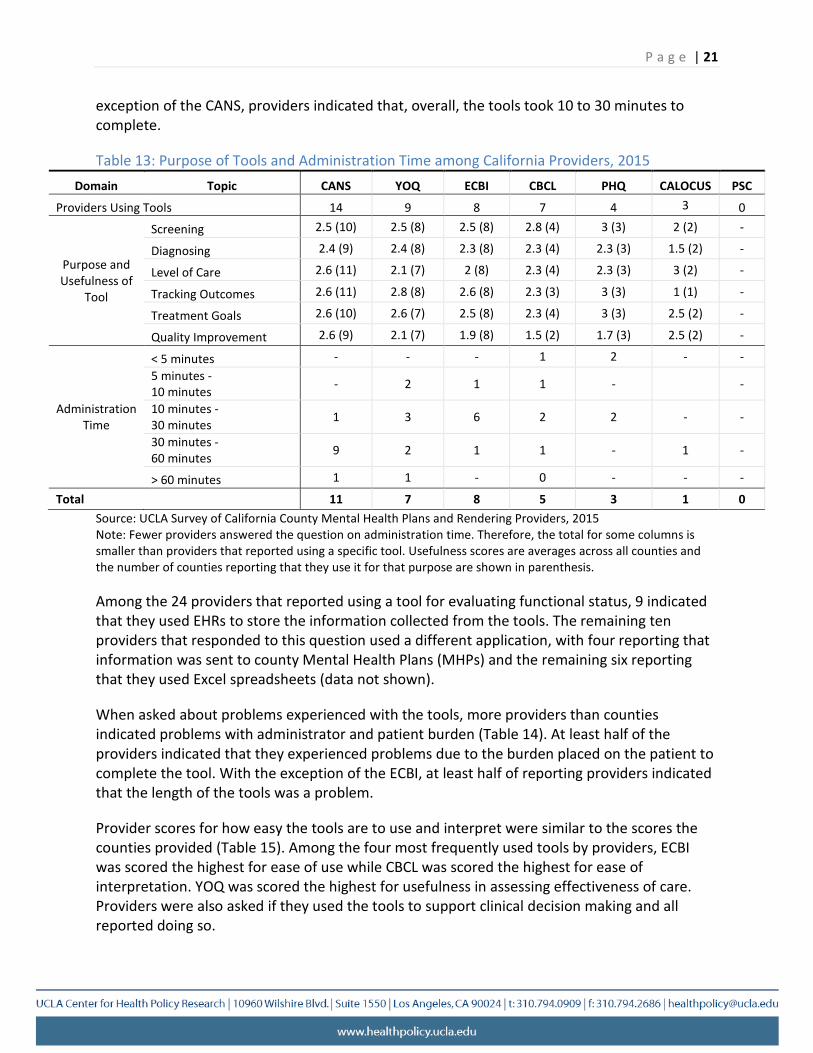
P a g e | 21
exception of the CANS, providers indicated that, overall, the tools took 10 to 30 minutes to complete.
Table 13: Purpose of Tools and Administration Time among California Providers, 2015 Domain Topic CANS YOQ ECBI CBCL PHQ CALOCUS PSC
Providers Using Tools 14 9 8 7 4 3 0
Screening
Diagnosing Purpose and Level of Care Usefulness of
Tracking Outcomes Tool Treatment Goals
Quality Improvement
2.5 (10)
2.4 (9)
2.6 (11)
2.6 (11)
2.6 (10)
2.6 (9)
2.5 (8)
2.4 (8)
2.1 (7)
2.8 (8)
2.6 (7)
2.1 (7)
2.5 (8)
2.3 (8)
2 (8)
2.6 (8)
2.5 (8)
1.9 (8)
2.8 (4)
2.3 (4)
2.3 (4)
2.3 (3)
2.3 (4)
1.5 (2)
3 (3)
2.3 (3)
2.3 (3)
3 (3)
3 (3)
1.7 (3)
2 (2)
1.5 (2)
3 (2)
1 (1)
2.5 (2)
2.5 (2)
-
-
-
-
-
-
< 5 minutes 5 minutes -10 minutes
Administration 10 minutes -Time 30 minutes
30 minutes -60 minutes
-
-
1
9
-
2
3
2
-
1
6
1
1
1
2
1
2
-
2
-
-
-
1
-
-
-
-
> 60 minutes 1 1 - 0 - - -
Total 11 7 8 5 3 1 0 Source: UCLA Survey of California County Mental Health Plans and Rendering Providers, 2015 Note: Fewer providers answered the question on administration time. Therefore, the total for some columns is smaller than providers that reported using a specific tool. Usefulness scores are averages across all counties and the number of counties reporting that they use it for that purpose are shown in parenthesis.
Among the 24 providers that reported using a tool for evaluating functional status, 9 indicated that they used EHRs to store the information collected from the tools. The remaining ten providers that responded to this question used a different application, with four reporting that information was sent to county Mental Health Plans (MHPs) and the remaining six reporting that they used Excel spreadsheets (data not shown).
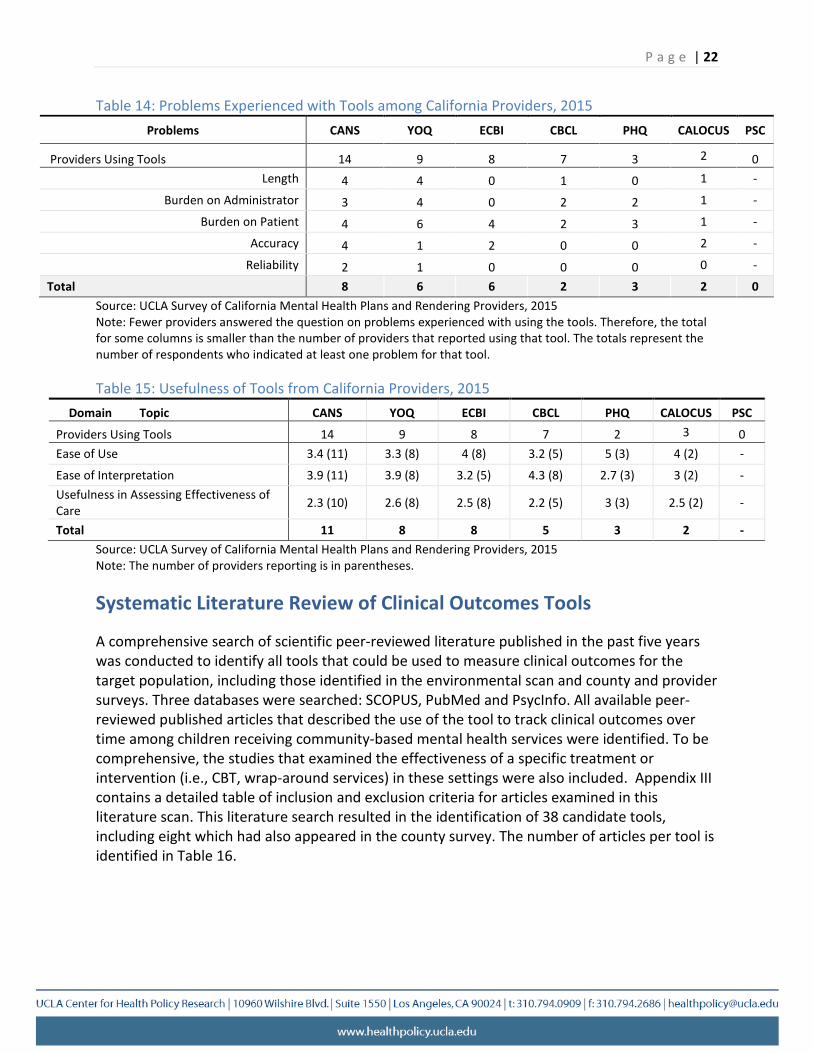
When asked about problems experienced with the tools, more providers than counties indicated problems with administrator and patient burden (Table 14). At least half of the providers indicated that they experienced problems due to the burden placed on the patient to complete the tool. With the exception of the ECBI, at least half of reporting providers indicated that the length of the tools was a problem.
Provider scores for how easy the tools are to use and interpret were similar to the scores the counties provided (Table 15). Among the four most frequently used tools by providers, ECBI was scored the highest for ease of use while CBCL was scored the highest for ease of interpretation. YOQ was scored the highest for usefulness in assessing effectiveness of care. Providers were also asked if they used the tools to support clinical decision making and all reported doing so.
P a g e | 22
Table 14: Problems Experienced with Tools among California Providers, 2015 Problems CANS YOQ ECBI CBCL PHQ CALOCUS PSC
Providers Using Tools 14 9 8 7 3 2 0 Length 4 4 0 1 0 1 -
Burden on Administrator 3 4 0 2 2 1 -
Burden on Patient
Accuracy 4
4
6
1
4
2
2
0
3
0
1
2
-
-
Reliability
Total 2 8
1 6
0 6
0 2
0 3
0
2
-
0 Source: UCLA Survey of California Mental Health Plans and Rendering Providers, 2015 Note: Fewer providers answered the question on problems experienced with using the tools. Therefore, the total for some columns is smaller than the number of providers that reported using that tool. The totals represent the number of respondents who indicated at least one problem for that tool.
Table 15: Usefulness of Tools from California Providers, 2015 Domain Topic CANS YOQ ECBI CBCL PHQ CALOCUS PSC
Providers Using Tools 14 9 8 7 2 3 0 Ease of Use 3.4 (11) 3.3 (8) 4 (8) 3.2 (5) 5 (3) 4 (2) -
Ease of Interpretation 3.9 (11) 3.9 (8) 3.2 (5) 4.3 (8) 2.7 (3) 3 (2) -Usefulness in Assessing Effectiveness of Care 2.3 (10) 2.6 (8) 2.5 (8) 2.2 (5) 3 (3) 2.5 (2) -
Total 11 8 8 5 3 2 -Source: UCLA Survey of California Mental Health Plans and Rendering Providers, 2015 Note: The number of providers reporting is in parentheses.
Systematic Literature Review of Clinical Outcomes Tools
A comprehensive search of scientific peer-reviewed literature published in the past five years was conducted to identify all tools that could be used to measure clinical outcomes for the target population, including those identified in the environmental scan and county and provider surveys. Three databases were searched: SCOPUS, PubMed and PsycInfo. All available peer-reviewed published articles that described the use of the tool to track clinical outcomes over time among children receiving community-based mental health services were identified. To be comprehensive, the studies that examined the effectiveness of a specific treatment or intervention (i.e., CBT, wrap-around services) in these settings were also included. Appendix III contains a detailed table of inclusion and exclusion criteria for articles examined in this literature scan. This literature search resulted in the identification of 38 candidate tools, including eight which had also appeared in the county survey. The number of articles per tool is identified in Table 16.
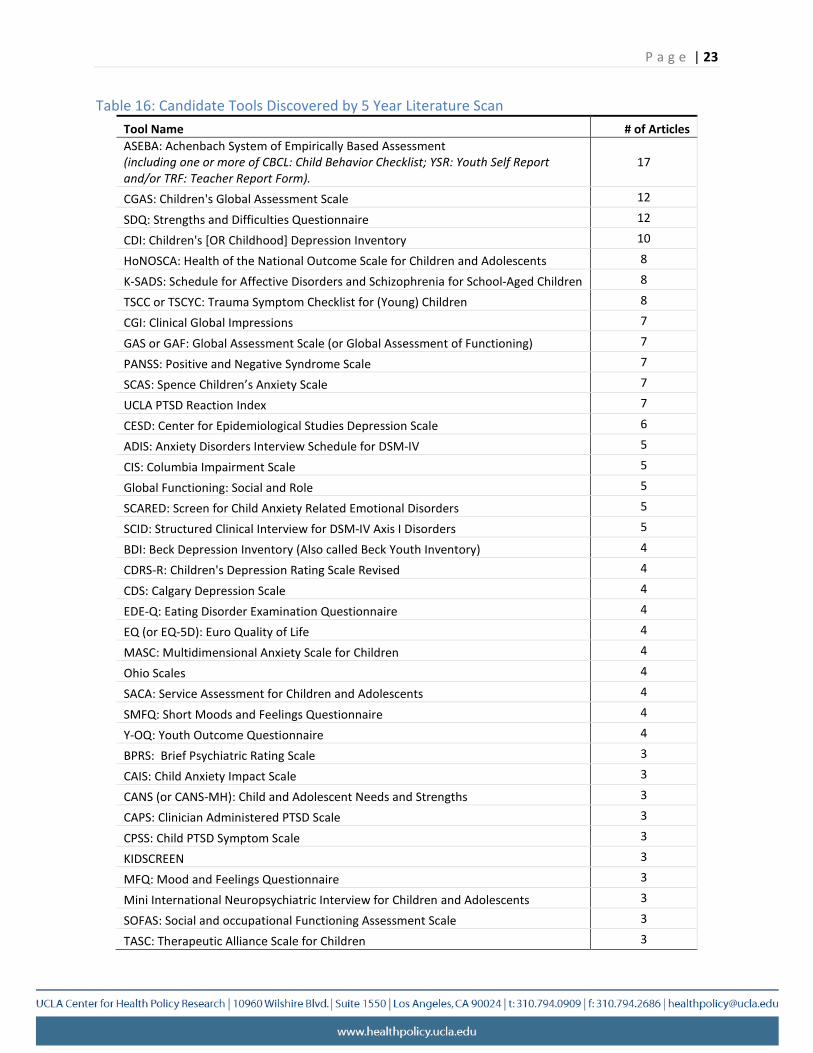
Table 16: Candidate Tools Discovered by 5 Year Literature Scan Tool Name
ASEBA: Achenbach System of Empirically Based Assessment (including one or more of CBCL: Child Behavior Checklist; YSR: Youth Self Report
and/or TRF: Teacher Report Form). CGAS: Children's Global Assessment Scale
SDQ: Strengths and Difficulties Questionnaire CDI: Children's [OR Childhood] Depression Inventory
HoNOSCA: Health of the National Outcome Scale for Children and Adolescents K-SADS: Schedule for Affective Disorders and Schizophrenia for School-Aged Children
TSCC or TSCYC: Trauma Symptom Checklist for (Young) Children CGI: Clinical Global Impressions
GAS or GAF: Global Assessment Scale (or Global Assessment of Functioning) PANSS: Positive and Negative Syndrome Scale
SCAS: Spence Children’s Anxiety Scale UCLA PTSD Reaction Index CESD: Center for Epidemiological Studies Depression Scale ADIS: Anxiety Disorders Interview Schedule for DSM-IV CIS: Columbia Impairment Scale Global Functioning: Social and Role
SCARED: Screen for Child Anxiety Related Emotional Disorders SCID: Structured Clinical Interview for DSM-IV Axis I Disorders
BDI: Beck Depression Inventory (Also called Beck Youth Inventory) CDRS-R: Children's Depression Rating Scale Revised
CDS: Calgary Depression Scale EDE-Q: Eating Disorder Examination Questionnaire
EQ (or EQ-5D): Euro Quality of Life MASC: Multidimensional Anxiety Scale for Children
Ohio Scales SACA: Service Assessment for Children and Adolescents
SMFQ: Short Moods and Feelings Questionnaire Y-OQ: Youth Outcome Questionnaire
BPRS: Brief Psychiatric Rating Scale CAIS: Child Anxiety Impact Scale
CANS (or CANS-MH): Child and Adolescent Needs and Strengths CAPS: Clinician Administered PTSD Scale CPSS: Child PTSD Symptom Scale
KIDSCREEN MFQ: Mood and Feelings Questionnaire
Mini International Neuropsychiatric Interview for Children and Adolescents SOFAS: Social and occupational Functioning Assessment Scale
TASC: Therapeutic Alliance Scale for Children
# of Articles
17
12 12 10
8 8 8 7 7 7 7 7 6 5 5 5 5 5 4 4 4 4 4 4 4 4 4 4 3 3 3 3 3 3 3 3 3 3
P a g e | 23
P a g e | 24
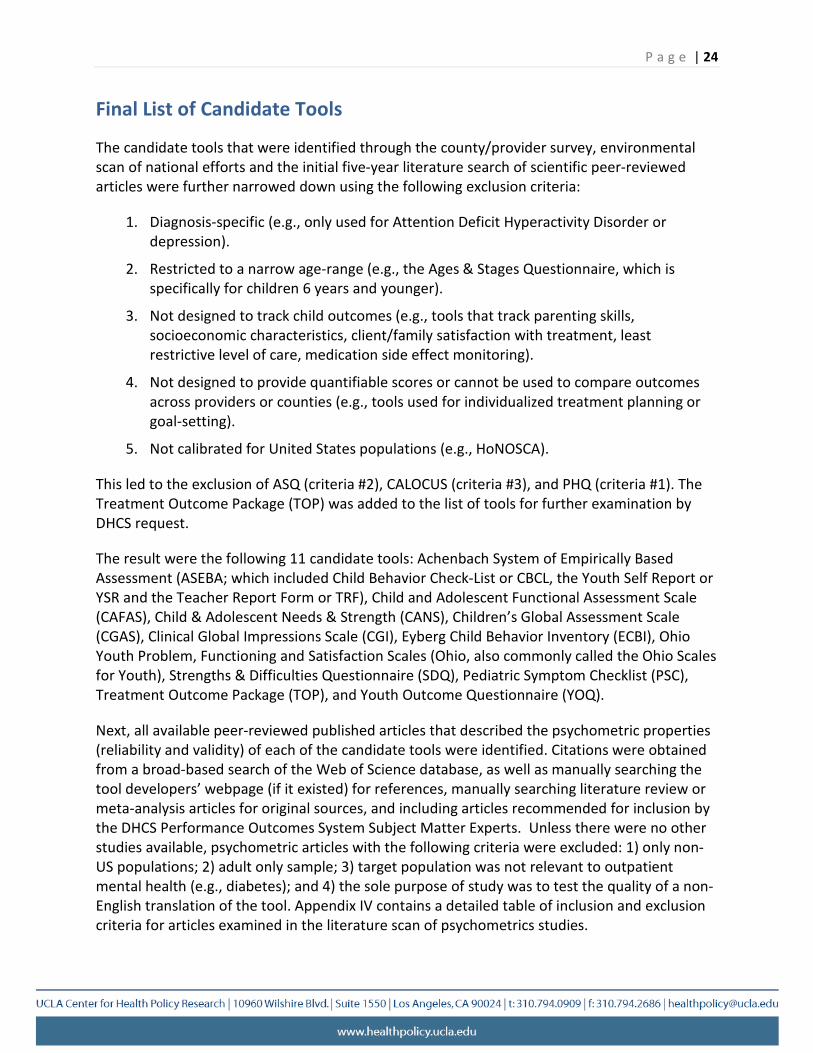
Final List of Candidate Tools
The candidate tools that were identified through the county/provider survey, environmental scan of national efforts and the initial five-year literature search of scientific peer-reviewed articles were further narrowed down using the following exclusion criteria:
1. Diagnosis-specific (e.g., only used for Attention Deficit Hyperactivity Disorder or depression).
2. Restricted to a narrow age-range (e.g., the Ages & Stages Questionnaire, which is specifically for children 6 years and younger).
3. Not designed to track child outcomes (e.g., tools that track parenting skills, socioeconomic characteristics, client/family satisfaction with treatment, least restrictive level of care, medication side effect monitoring).
4. Not designed to provide quantifiable scores or cannot be used to compare outcomes across providers or counties (e.g., tools used for individualized treatment planning or goal-setting).
5. Not calibrated for United States populations (e.g., HoNOSCA).
This led to the exclusion of ASQ (criteria #2), CALOCUS (criteria #3), and PHQ (criteria #1). The Treatment Outcome Package (TOP) was added to the list of tools for further examination by DHCS request.
The result were the following 11 candidate tools: Achenbach System of Empirically Based Assessment (ASEBA; which included Child Behavior Check-List or CBCL, the Youth Self Report or YSR and the Teacher Report Form or TRF), Child and Adolescent Functional Assessment Scale (CAFAS), Child & Adolescent Needs & Strength (CANS), Children’s Global Assessment Scale (CGAS), Clinical Global Impressions Scale (CGI), Eyberg Child Behavior Inventory (ECBI), Ohio Youth Problem, Functioning and Satisfaction Scales (Ohio, also commonly called the Ohio Scales for Youth), Strengths & Difficulties Questionnaire (SDQ), Pediatric Symptom Checklist (PSC), Treatment Outcome Package (TOP), and Youth Outcome Questionnaire (YOQ).
Next, all available peer-reviewed published articles that described the psychometric properties (reliability and validity) of each of the candidate tools were identified. Citations were obtained from a broad-based search of the Web of Science database, as well as manually searching the tool developers’ webpage (if it existed) for references, manually searching literature review or meta-analysis articles for original sources, and including articles recommended for inclusion by the DHCS Performance Outcomes System Subject Matter Experts. Unless there were no other studies available, psychometric articles with the following criteria were excluded: 1) only non-US populations; 2) adult only sample; 3) target population was not relevant to outpatient mental health (e.g., diabetes); and 4) the sole purpose of study was to test the quality of a non-English translation of the tool. Appendix IV contains a detailed table of inclusion and exclusion criteria for articles examined in the literature scan of psychometrics studies.
P a g e | 25
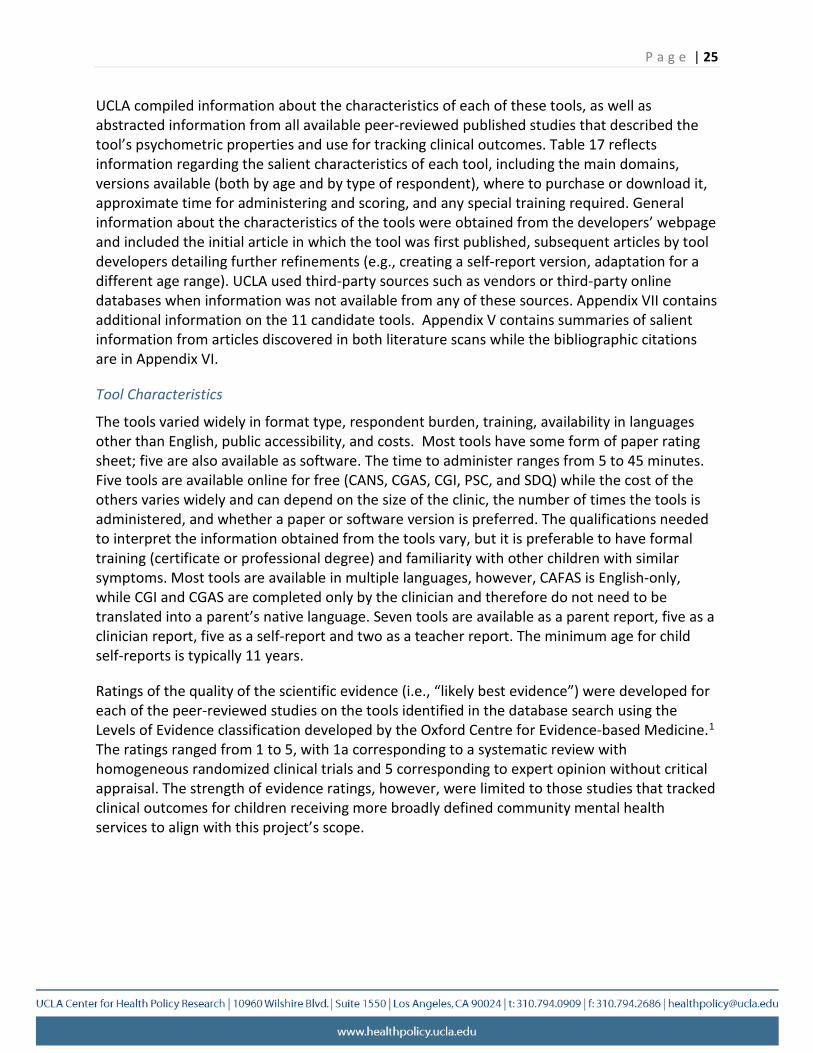
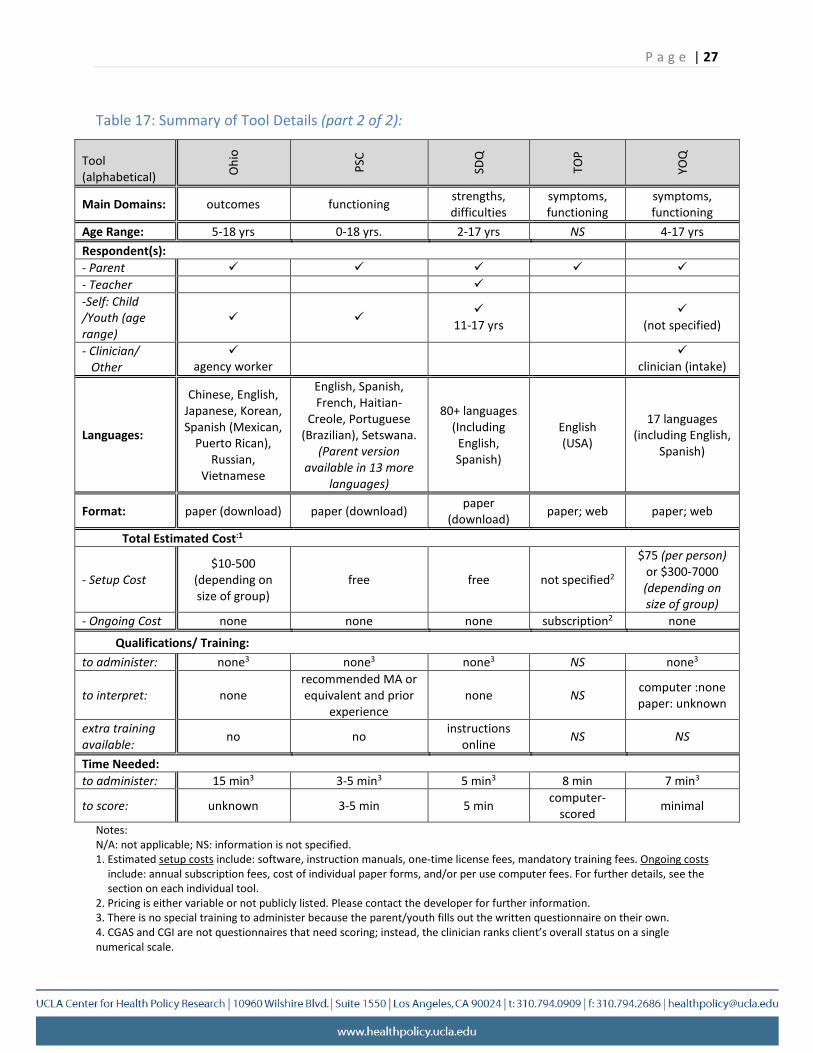
UCLA compiled information about the characteristics of each of these tools, as well as abstracted information from all available peer-reviewed published studies that described the tool’s psychometric properties and use for tracking clinical outcomes. Table 17 reflects information regarding the salient characteristics of each tool, including the main domains, versions available (both by age and by type of respondent), where to purchase or download it, approximate time for administering and scoring, and any special training required. General information about the characteristics of the tools were obtained from the developers’ webpage and included the initial article in which the tool was first published, subsequent articles by tool developers detailing further refinements (e.g., creating a self-report version, adaptation for a different age range). UCLA used third-party sources such as vendors or third-party online databases when information was not available from any of these sources. Appendix VII contains additional information on the 11 candidate tools. Appendix V contains summaries of salient information from articles discovered in both literature scans while the bibliographic citations are in Appendix VI.
Tool Characteristics
The tools varied widely in format type, respondent burden, training, availability in languages other than English, public accessibility, and costs. Most tools have some form of paper rating sheet; five are also available as software. The time to administer ranges from 5 to 45 minutes. Five tools are available online for free (CANS, CGAS, CGI, PSC, and SDQ) while the cost of the others varies widely and can depend on the size of the clinic, the number of times the tools is administered, and whether a paper or software version is preferred. The qualifications needed to interpret the information obtained from the tools vary, but it is preferable to have formal training (certificate or professional degree) and familiarity with other children with similar symptoms. Most tools are available in multiple languages, however, CAFAS is English-only, while CGI and CGAS are completed only by the clinician and therefore do not need to be translated into a parent’s native language. Seven tools are available as a parent report, five as a clinician report, five as a self-report and two as a teacher report. The minimum age for child self-reports is typically 11 years.
Ratings of the quality of the scientific evidence (i.e., “likely best evidence”) were developed for each of the peer-reviewed studies on the tools identified in the database search using the Levels of Evidence classification developed by the Oxford Centre for Evidence-based Medicine.1
The ratings ranged from 1 to 5, with 1a corresponding to a systematic review with homogeneous randomized clinical trials and 5 corresponding to expert opinion without critical appraisal. The strength of evidence ratings, however, were limited to those studies that tracked clinical outcomes for children receiving more broadly defined community mental health services to align with this project’s scope.
P a g e | 26
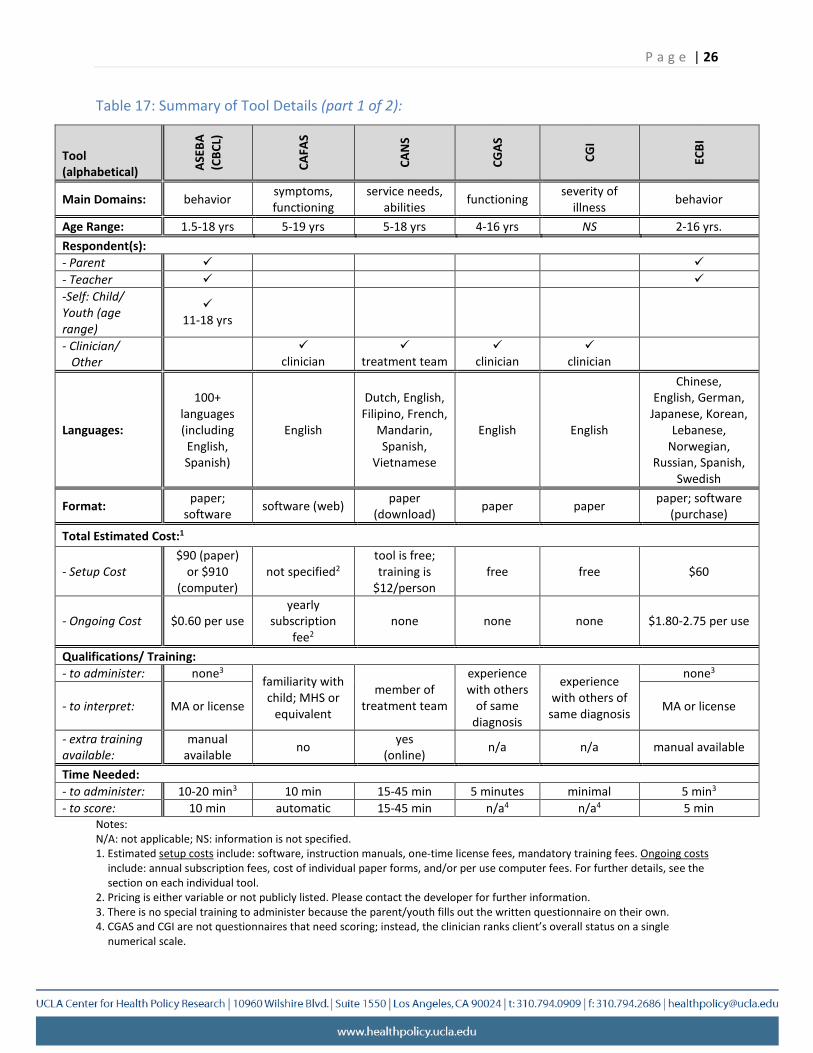
Table 17: Summary of Tool Details (part 1 of 2):
Tool (alphabetical) AS
EBA
(CBC
L)
CAFA
S
CAN
S
CGAS
CGI
ECBI
Main Domains: behavior symptoms, functioning
service needs, abilities functioning severity of
illness behavior
Age Range: 1.5-18 yrs 5-19 yrs 5-18 yrs 4-16 yrs NS 2-16 yrs. Respondent(s): - Parent - Teacher -Self: Child/ Youth (age range)
11-18 yrs
- Clinician/ Other
clinician
treatment team
clinician
clinician
Languages:
100+ languages (including English, Spanish)
English
Dutch, English, Filipino, French,
Mandarin, Spanish,
Vietnamese
English English
Chinese, English, German,
Japanese, Korean, Lebanese,
Norwegian, Russian, Spanish,
Swedish
Format: paper; software software (web) paper
(download) paper paper paper; software (purchase)
Total Estimated Cost:1
- Setup Cost $90 (paper)
or $910 (computer)
not specified2 tool is free; training is
$12/person free free $60
- Ongoing Cost $0.60 per use yearly
subscription fee2
none none none $1.80-2.75 per use
Qualifications/ Training: - to administer: none3
familiarity with child; MHS or
equivalent
member of treatment team
experience with others
of same diagnosis
experience with others of
same diagnosis
none3
- to interpret: MA or license MA or license
- extra training available:
manual available no yes
(online) n/a n/a manual available
Time Needed: - to administer: 10-20 min3 10 min 15-45 min 5 minutes minimal 5 min3
- to score: 10 min automatic 15-45 min n/a4 n/a4 5 min Notes: N/A: not applicable; NS: information is not specified. 1. Estimated setup costs include: software, instruction manuals, one-time license fees, mandatory training fees. Ongoing costs
include: annual subscription fees, cost of individual paper forms, and/or per use computer fees. For further details, see the section on each individual tool.
2. Pricing is either variable or not publicly listed. Please contact the developer for further information. 3. There is no special training to administer because the parent/youth fills out the written questionnaire on their own. 4. CGAS and CGI are not questionnaires that need scoring; instead, the clinician ranks client’s overall status on a single
numerical scale.
P a g e | 27
Table 17: Summary of Tool Details (part 2 of 2):
Tool (alphabetical) O
hio
PSC
SDQ
TOP
YOQ
Main Domains: outcomes functioning strengths, difficulties
symptoms, functioning
symptoms, functioning
Age Range: 5-18 yrs 0-18 yrs. 2-17 yrs NS 4-17 yrs Respondent(s): - Parent - Teacher -Self: Child /Youth (age range)
11-17 yrs
(not specified)
- Clinician/ Other
agency worker
clinician (intake)
Languages:
Chinese, English, Japanese, Korean, Spanish (Mexican,
Puerto Rican), Russian,
Vietnamese
English, Spanish, French, Haitian-
Creole, Portuguese (Brazilian), Setswana.
(Parent version available in 13 more
languages)
80+ languages (Including
English, Spanish)
English (USA)
17 languages (including English,
Spanish)
Format: paper (download) paper (download) paper (download) paper; web paper; web
Total Estimated Cost:1
- Setup Cost $10-500
(depending on size of group)
free free not specified2
$75 (per person) or $300-7000 (depending on size of group)
- Ongoing Cost none none none subscription2 none
Qualifications/ Training: to administer: none3 none3 none3 NS none3
to interpret: none recommended MA or equivalent and prior
experience none NS computer :none
paper: unknown
extra training available: no no instructions
online NS NS
Time Needed: to administer: 15 min3 3-5 min3 5 min3 8 min 7 min3
to score: unknown 3-5 min 5 min computer-scored minimal
Notes: N/A: not applicable; NS: information is not specified. 1. Estimated setup costs include: software, instruction manuals, one-time license fees, mandatory training fees. Ongoing costs
include: annual subscription fees, cost of individual paper forms, and/or per use computer fees. For further details, see the section on each individual tool.
2. Pricing is either variable or not publicly listed. Please contact the developer for further information. 3. There is no special training to administer because the parent/youth fills out the written questionnaire on their own. 4. CGAS and CGI are not questionnaires that need scoring; instead, the clinician ranks client’s overall status on a single numerical scale.
P a g e | 28
Most tools received a level 4 evidence rating for use as a clinical outcome measure, corresponding to a poor quality cohort study. The most common reasons a cohort study was rated as poor quality was because the analyses did not address missing data problems at follow-up or variation in the child’s episode of care. For example, if the assessment of the clinical outcome was conducted during the last mental health visit when it was clinically determined that a child successfully completed therapy, the following methodologic flaws would considerably weaken the study: 1) the episode of care was different for each child so the follow-up period was not consistent; 2) clinical outcomes data for those who completed therapy introduced selection bias and overestimate effectiveness; and 3) clinical criteria for successful treatment was not operationally defined leading to different clinical status, especially for children with different disorders. However, the CAFAS had one low quality randomized clinical trial of wrap-around services meriting a higher 2b rating because it compared patients within wrap-around care with a control group of patients not receiving such care. Also, evidence was not rated for the TOP because all studies were based on predominantly adult samples. The strength of evidence supporting the reliability and validity of the tools varied widely, from relatively large pool of rigorous studies (CBCL) to none (CGI). Typically, the clinical outcomes were established using relatively few studies, approaches varied widely, and very few used ethnically diverse samples. Of the studies that described change in clinical outcomes, none examined whether change in symptoms or functioning were related to receiving high quality care.
Part II: Convene a Modified Delphi Panel Following the identification of the 11 candidate tools, UCLA conducted a Modified Delphi Panel to assess the existing evidence for these tools and rank the tools on several criteria including their overall utility for outcome measurement.
Modified Delphi Panel
The Delphi method, also called the RAND/UCLA appropriateness method, is a well-established approach that combines expert judgment and scientific literature analysis to produce the best possible information.2 The standard method entails: 1) a panel of nine experts assessing the existing scientific evidence of quality indicators and anonymously ranking tools based on that evidence and their expert opinion or expertise, followed by 2) confidential feedback to panel members on their response in relation to rest of the group, 3) a discussion of the evidence among the panel to reach consensus, and 4) a final confidential ranking of indicators following the discussion.3
For the current panel, the general procedures were modified as follows: 1) the size of the panel was increased from 9 to up to 15 people; 2) the panel was not solely composed of academic experts but included individuals from varied backgrounds and with different types of experience in the field of child mental health care; 3) the National Quality Forum’s4 relevant rating domains for scientific acceptability, feasibility and usability were modified to fit the
P a g e | 29
subject matter; and 4) ratings were gathered confidentially rather than anonymously, in order to allow for face-to-face discussion between panelists.
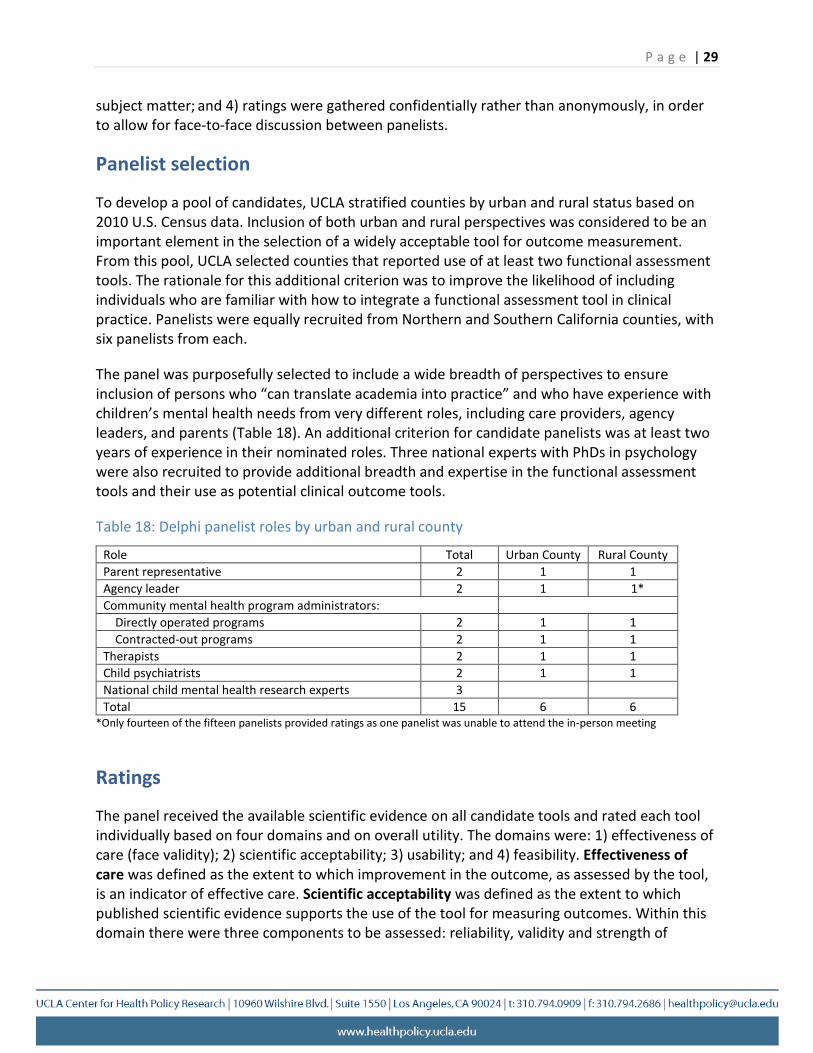
Panelist selection
To develop a pool of candidates, UCLA stratified counties by urban and rural status based on 2010 U.S. Census data. Inclusion of both urban and rural perspectives was considered to be an important element in the selection of a widely acceptable tool for outcome measurement. From this pool, UCLA selected counties that reported use of at least two functional assessment tools. The rationale for this additional criterion was to improve the likelihood of including individuals who are familiar with how to integrate a functional assessment tool in clinical practice. Panelists were equally recruited from Northern and Southern California counties, with six panelists from each.
The panel was purposefully selected to include a wide breadth of perspectives to ensure inclusion of persons who “can translate academia into practice” and who have experience with children’s mental health needs from very different roles, including care providers, agency leaders, and parents (Table 18). An additional criterion for candidate panelists was at least two years of experience in their nominated roles. Three national experts with PhDs in psychology were also recruited to provide additional breadth and expertise in the functional assessment tools and their use as potential clinical outcome tools.
Table 18: Delphi panelist roles by urban and rural county
Role Total Urban County Rural County Parent representative 2 1 1 Agency leader 2 1 1* Community mental health program administrators:
Directly operated programs 2 1 1 Contracted-out programs 2 1 1
Therapists 2 1 1 Child psychiatrists 2 1 1 National child mental health research experts 3 Total 15 6 6
*Only fourteen of the fifteen panelists provided ratings as one panelist was unable to attend the in-person meeting
Ratings
The panel received the available scientific evidence on all candidate tools and rated each tool individually based on four domains and on overall utility. The domains were: 1) effectiveness of care (face validity); 2) scientific acceptability; 3) usability; and 4) feasibility. Effectiveness of care was defined as the extent to which improvement in the outcome, as assessed by the tool, is an indicator of effective care. Scientific acceptability was defined as the extent to which published scientific evidence supports the use of the tool for measuring outcomes. Within this domain there were three components to be assessed: reliability, validity and strength of
P a g e | 30
evidence supporting use of the tool to track clinical outcomes among children receiving community-based mental health services. Usability was defined as the extent to which the intended audience can understand the results of the tool and find them useful for decision-making. Feasibility was defined as the extent to which the data obtained from the tool are readily available or could be captured without undue burden, and the extent to which the tool could be practically implemented by counties to track clinical outcomes for children receiving publicly-funded community-based specialty mental health care. Overall utility was defined as the extent to which a panelist would recommend the tool for statewide use to track clinical outcomes among children and youth served in publicly-funded community-based specialty mental health programs. For each of these domains, panelists were asked to provide a numerical rating ranging from 1-9, with 1 corresponding to lowest, 4-6 as equivocal/uncertain, and 9 as the highest.
Of the 15 panelists recruited, 14 were able to attend the in-person meeting. After in-person discussion, panelists were asked to individually and privately re-rate each of the tools, and could adjust or maintain their previous scores. Panelists were not required to give any justification for their decision to change or maintain a score. The second round of panelist ratings was analyzed and mean scores and standard deviations were calculated for the ratings in each domain. All numerical data in this report are drawn from the second round of ratings. Further analyses of the patterns of response showed a high level of consensus between panelists with different backgrounds and perspectives.
Panel Discussion: Data Collection and Analyses
The panel discussion was audio-taped and transcribed for qualitative analysis with the consent of the panelists. The panel discussion started with introductory remarks about the discussion process and individual panelist introductions. The remainder of the session consisted of discussion of each tool followed by a re-rating of that tool. Appendix VIII contains summaries of the rankings and qualitative discussion for each of the individual tools. Materials provided to panelists are available in Appendix IX.
Qualitative analysis of the discussion was conducted in 4 stages:
1) The entire transcript was coded, topic by topic, using codes based on theme, affect (positive or negative) and relevant domain(s).
2) The discussion of each tool was analyzed independently, and a synthesis of topics relevant to that tool was created. These topics were categorized into strengths (positive), weaknesses (negative), or mixed (cases in which panelists had differing or contradictory perspectives), and marked with the relevant corresponding domain(s). Some topics were referenced multiple times in a discussion in the context of different domains.
3) The entire session was analyzed holistically and a separate synthesis was created of common themes that appeared repeatedly across multiple tools or that were flagged by panelists themselves as being of general concern. The common themes were also classified according to relevant domain(s) based on the context in which they were raised.
P a g e | 31
4) The qualitative analyses were compared to the quantitative numerical rankings to assess if (and how) patterns in the numerical scores for each tool’s domain could be explained or contextualized by the panel discussion.
The qualitative data were used to inform the findings from the panel ratings. The panel discussion of each tool explains why and how a tool is ranked high or low in a given domain. This approach is necessary because the number of strengths or weaknesses per tool is not a useful marker of its ranking. A panelist, for example, may rate one tool high across all domains despite its having multiple minor flaws, while another tool may receive a low ranking because one major flaw was considered unacceptable.
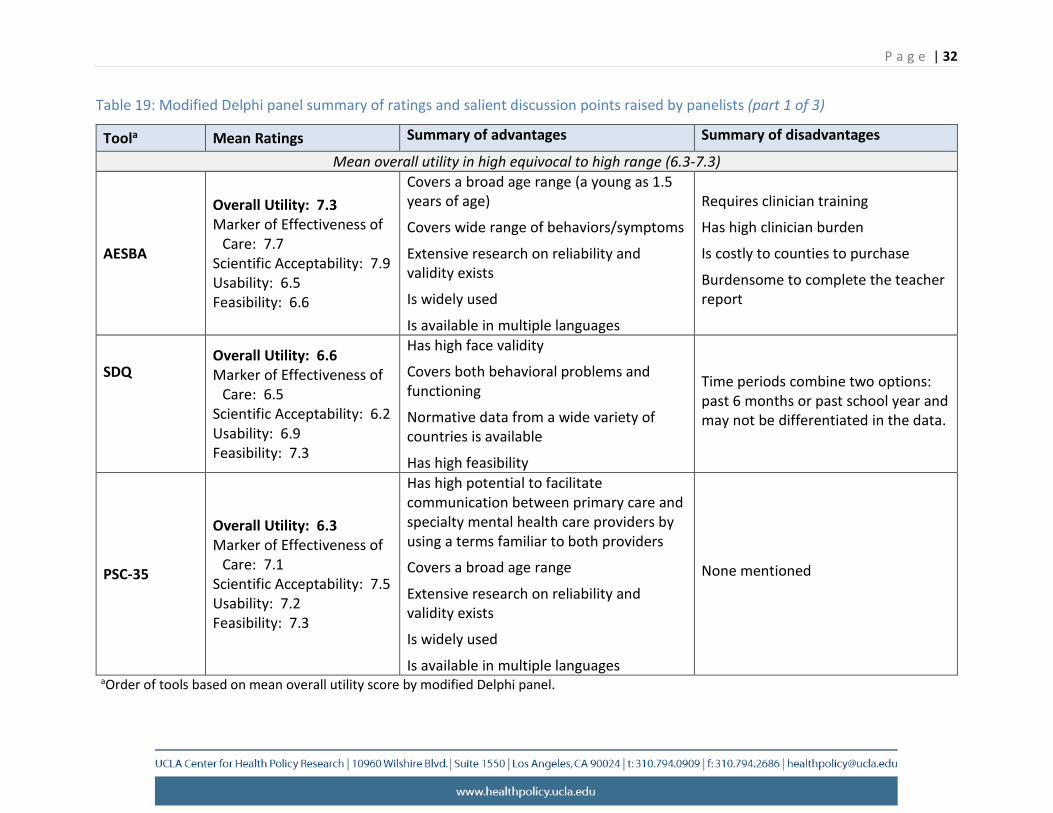
Overall Summary
The quantitative tool rankings and qualitative analysis of the discussion showed general consistency across all tools. AESBA, SDQ, and PSC-35 were consistently rated on average in the “very high” (average rating = 9) to “high” (average ratings = 7) ranges for overall utility, effectiveness of care, scientific acceptability, usability and feasibility. Appendix X includes comparisons of mean ratings.
Common strengths in these tools included applicability to a broad range of symptoms and functioning, applicability for use with wide age range, availability in multiple languages, and relatively strong scientific acceptability. The main limitation of the ASEBA was respondent burden and cost, including ongoing costs for clinician training. The latter may be especially problematic for agencies with high staff turn-over. The limitations of the AESBA and SDQ were also related to the specified time periods for parent recall of child’s symptoms and functioning, which may make aligning clinical outcomes to a child’s episode of care challenging.
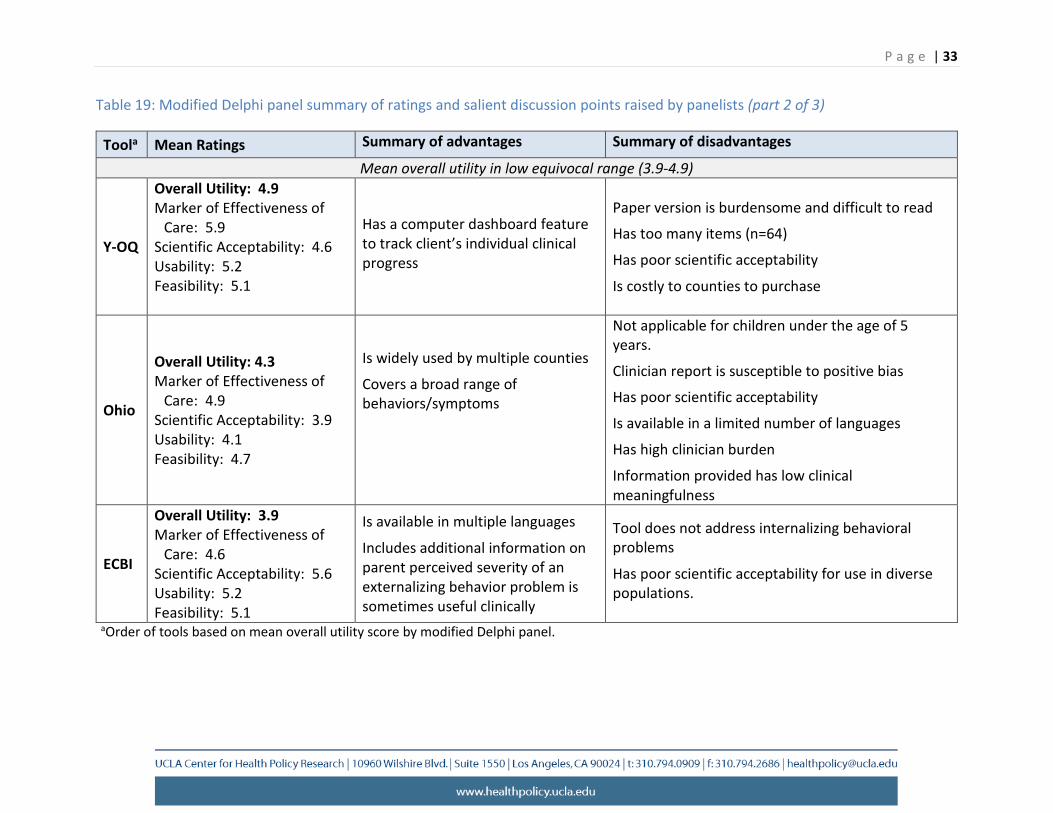
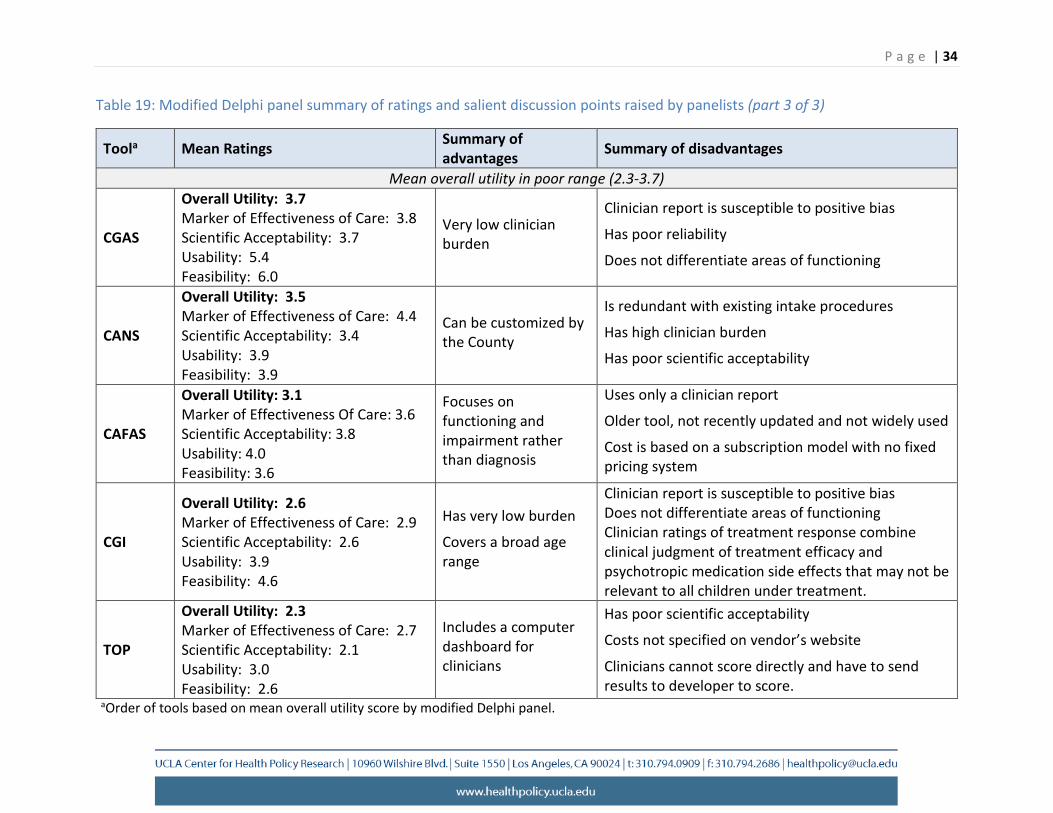
Table 19 summarizes the main strengths and weaknesses raised during the discussion of each tool in order to provide context for the numerical rankings. Appendix XI contains the detailed synthesis of common themes that were raised across multiple panel discussions, as well as individual examinations of the rankings and discussions for each tool. The table indicates that all other tools had several limitations that led to overall utility scores of 4.9 or lower, a noticeably lower score than the first three tools identified above. None of these tools were therefore considered to be good candidates for measuring outcomes statewide.
P a g e | 32
Table 19: Modified Delphi panel summary of ratings and salient discussion points raised by panelists (part 1 of 3)
Toola Mean Ratings Summary of advantages Summary of disadvantages
Mean overall utility in high equivocal to high range (6.3-7.3)
AESBA
Overall Utility: 7.3 Marker of Effectiveness of
Care: 7.7 Scientific Acceptability: 7.9 Usability: 6.5 Feasibility: 6.6
Covers a broad age range (a young as 1.5 years of age)
Covers wide range of behaviors/symptoms
Extensive research on reliability and validity exists
Is widely used
Is available in multiple languages
Requires clinician training
Has high clinician burden
Is costly to counties to purchase
Burdensome to complete the teacher report
SDQ Overall Utility: 6.6 Marker of Effectiveness of
Care: 6.5 Scientific Acceptability: 6.2 Usability: 6.9 Feasibility: 7.3
Has high face validity
Covers both behavioral problems and functioning
Normative data from a wide variety of countries is available
Has high feasibility
Time periods combine two options: past 6 months or past school year and may not be differentiated in the data.
PSC-35
Overall Utility: 6.3 Marker of Effectiveness of
Care: 7.1 Scientific Acceptability: 7.5 Usability: 7.2 Feasibility: 7.3
Has high potential to facilitate communication between primary care and specialty mental health care providers by using a terms familiar to both providers
Covers a broad age range
Extensive research on reliability and validity exists
Is widely used
Is available in multiple languages
None mentioned
aOrder of tools based on mean overall utility score by modified Delphi panel.
P a g e | 33
Table 19: Modified Delphi panel summary of ratings and salient discussion points raised by panelists (part 2 of 3)
Toola Mean Ratings Summary of advantages Summary of disadvantages
Mean overall utility in low equivocal range (3.9-4.9)
Y-OQ
Overall Utility: 4.9 Marker of Effectiveness of
Care: 5.9 Scientific Acceptability: 4.6 Usability: 5.2 Feasibility: 5.1
Has a computer dashboard feature to track client’s individual clinical progress
Paper version is burdensome and difficult to read
Has too many items (n=64)
Has poor scientific acceptability
Is costly to counties to purchase
Ohio
Overall Utility: 4.3 Marker of Effectiveness of
Care: 4.9 Scientific Acceptability: 3.9 Usability: 4.1 Feasibility: 4.7
Is widely used by multiple counties
Covers a broad range of behaviors/symptoms
Not applicable for children under the age of 5 years.
Clinician report is susceptible to positive bias
Has poor scientific acceptability
Is available in a limited number of languages
Has high clinician burden
Information provided has low clinical meaningfulness
ECBI
Overall Utility: 3.9 Marker of Effectiveness of
Care: 4.6 Scientific Acceptability: 5.6 Usability: 5.2 Feasibility: 5.1
Is available in multiple languages
Includes additional information on parent perceived severity of an externalizing behavior problem is sometimes useful clinically
Tool does not address internalizing behavioral problems
Has poor scientific acceptability for use in diverse populations.
aOrder of tools based on mean overall utility score by modified Delphi panel.
P a g e | 34
Table 19: Modified Delphi panel summary of ratings and salient discussion points raised by panelists (part 3 of 3)
Toola Mean Ratings Summary of advantages Summary of disadvantages
Mean overall utility in poor range (2.3-3.7)
CGAS
Overall Utility: 3.7 Marker of Effectiveness of Care: 3.8 Scientific Acceptability: 3.7 Usability: 5.4 Feasibility: 6.0
Very low clinician burden
Clinician report is susceptible to positive bias
Has poor reliability
Does not differentiate areas of functioning
CANS
Overall Utility: 3.5 Marker of Effectiveness of Care: 4.4 Scientific Acceptability: 3.4 Usability: 3.9 Feasibility: 3.9
Can be customized by the County
Is redundant with existing intake procedures
Has high clinician burden
Has poor scientific acceptability
CAFAS
Overall Utility: 3.1 Marker of Effectiveness Of Care: 3.6 Scientific Acceptability: 3.8 Usability: 4.0 Feasibility: 3.6
Focuses on functioning and impairment rather than diagnosis
Uses only a clinician report
Older tool, not recently updated and not widely used
Cost is based on a subscription model with no fixed pricing system
CGI
Overall Utility: 2.6 Marker of Effectiveness of Care: 2.9 Scientific Acceptability: 2.6 Usability: 3.9 Feasibility: 4.6
Has very low burden
Covers a broad age range
Clinician report is susceptible to positive bias Does not differentiate areas of functioning Clinician ratings of treatment response combine clinical judgment of treatment efficacy and psychotropic medication side effects that may not be relevant to all children under treatment.
TOP
Overall Utility: 2.3 Marker of Effectiveness of Care: 2.7 Scientific Acceptability: 2.1 Usability: 3.0 Feasibility: 2.6
Includes a computer dashboard for clinicians
Has poor scientific acceptability
Costs not specified on vendor’s website
Clinicians cannot score directly and have to send results to developer to score.
aOrder of tools based on mean overall utility score by modified Delphi panel.
P a g e | 35
There was also general consistency across the domain ratings for the tools that were rated in the “equivocal” or “low” ranges for overall utility. Reasons for not being suitable for statewide use included: proprietary instruments that had unspecified costs, high burden, lack of breadth of symptoms and functioning, narrow age range, and poor scientific acceptability. For some of these tools, panelists referenced prior mandated use in agencies as one possible indicator of feasibility of future implementation, however, panelists also described problems that emerged during such mandates and hypothetical scenarios for how the integrity of the data reported may be compromised by busy clinicians. In addition, while being customizable to a particular agency or program was perceived as an advantage, it had the unintended consequence of making a tool less useful for comparing clinical outcomes across multiple programs or counties. Further, the qualitative data revealed instances in which standardized tools were modified for use in community mental health programs in ways that might decrease their validity. Unintended consequences from this practice include the loss of scientific acceptability, capacity to use established clinical cut-points based on normative data, and comparability with findings from published studies using this tool.
Overall, the Modified Delphi Panel identified three tools that were rated higher than the other 9 candidate tools, had critical advantages, and the least number of disadvantages and were the most likely candidates for use in monitoring outcomes: the ASEBA, SDQ, and PSC-35.
Part III: Recommendation for a Clinical Outcome Tool The final activity in this project was to assess all the evidence gathered in prior activities, recommend a final clinical outcome tool, discuss the considerations for the interpretation of the data, and identify potential implementation challenges and solutions.
Outcomes Measurement Tool
Minimum Criteria for Recommending a Tool
UCLA developed a list of 9 minimum criteria to compare the 11 tools rated by the Modified Delphi Panel. The nine minimum criteria were based on DHCS statutory requirements and other considerations for ease of implementation and scientific rigor. These criteria are that a tool must: 1) cover a broad age range, 2) be available in top three California threshold languages, 3) cover a broad range of symptoms and behaviors, 4) use a point in time or current timeframe for assessing functional status, 5) be supported by high quality research evidence, 6) take a short time to complete, 7) be easy to use by county specialty mental health plans, 8) be patient or consumer-centered, and 9) be scored highly on the overall utility by the Modified Delphi Panel. The data for these criteria were obtained from the main findings of the previous reports. Further reasoning behind the choice of these criteria and minimum levels selected for each are explained below.
P a g e | 36
Criteria 1 and 2: Must cover a broad age range and be available in the top 3 California threshold languages. The selected tool was required to be applicable to the wide age range of children and youth served in publicly-funded mental health programs and to match California’s ethnically and linguistically diverse population. Because very few tools were applicable to infants or newborns, the minimum age criteria was set as 2-18 years of age. The minimum language availability criteria was set to Spanish, Vietnamese, and Chinese as those are the top 3 threshold languages from a list of all languages spoken by more than 1% of the California population. Partial credit was given if the tool was only available in Spanish.
Criteria 3: Must cover a broad range of symptoms and behaviors. The selected tool was required to assess both internalizing and externalizing symptoms and behaviors. Internalizing symptoms include depressed mood and anxiety, while externalizing behaviors include oppositional or defiant behaviors, impulsivity, and hyperactivity. Tools that did not cover a broad range of symptoms and behaviors were considered to be inadequate because they would have required using more than one tool to address domain gaps.
Criteria 4: Must Use the current timeframe for assessment of a child’s clinical status. The selected tool was required to assess the child’s current functioning at the time the tool was filled out in order to be able to identify the subsequent improvements in clinical outcomes and thus measure the effectiveness of care delivered for that episode of care. Many existing tools require rating a child’s functioning over a fixed past time interval (e.g., past six months or past school year). Such a time frame does not necessarily align with the chronological time points (symptoms-> treatment -> outcome) within the child’s unique episode of care. For instance, if a child has been diagnosed with severe anxiety in the past month and has been receiving cognitive behavioral therapy following that diagnosis, assessing the child’s functioning over the past six months or school year would not be a valid measure of the effectiveness of care. In addition, a tool that elicits a report of the child’s current status avoids potential recall bias by the parent or child.
Criteria 5: Is supported by high quality scientific evidence. This criterion reflects both the availability of rigorous scientific studies, as well as whether available studies showed the tool reliably measures a relationship between mental health service use and changes in behavior over time. The strength of scientific evidence was rated using the Oxford Centre for Evidence-based Medicine ratings.1 The minimum criteria was a rating of 2b, which corresponds to a body of scientific evidence supporting its use as a clinical outcome measure in a community-based mental health setting that is based on either a low quality randomized clinical trial or an individual cohort study. The few studies receiving a 2b rating were determined to be low quality randomized clinical trials because the comparison between the intervention and control groups had several methodologic flaws that could impact data interpretation and the study’s conclusions. Partial credit was also given for a slightly lower 2c rating, corresponding to generic “outcomes research” or ecological studies. One study was assigned this rating because it analyzed existing data from a very large longitudinal cohort study of U.S. children at risk for maltreatment to examine the relationship between use of mental health services and clinical need based on the tool.
P a g e | 37
Criteria 6: Must take a short time to complete. In order to keep respondent burden low, the selected tool should not require significant time for the respondent to complete. Longer tools reduce the productivity of providers, are less likely to be completed accurately by respondents, and therefore yield lower quality aggregate data. The minimum criteria were set to less than 10 minutes for a respondent to answer all the questions in the tool. Partial credit was given to tools that took 10-20 minutes to complete.
Criteria 7: Must be easy to use. The selected tool was required to be considered relatively easy to use by the county specialty mental health plans and their contracted providers. Mental health plans and contracted providers who participated in the UCLA survey were asked to report ease of use on a scale of low (1) to high (5). The minimum criteria was set to at least a 3 (the midpoint of the scale).
Criteria 8: Must be patient or consumer-centered: The selected tool was required to capture the youth’s or parent’s perception of a child’s functioning. For the assessment of clinical outcomes among young and school-age children, the consumer of mental health services is usually the parent or primary caregiver and for adolescents the consumer is usually the youth themselves. Tools that report parent or youth perceptions are closely aligned with the current movement in health care to engage patients in their care, empower them in their interactions with the providers, and improve compliance with the care plan.5,6 This approach is also consistent with prior related legislation on performance outcomes measurement.7 The minimum criteria was that a parent and/or youth version of the tool must be available.
Criteria 9: Must have a high Delphi panel overall utility score. The selected tool was required to have an average overall utility score of 6 or higher (out of 9) by the panelists. The overall utility score was based on panelists’ assessment of each tool along validity, scientific acceptability, usability, and feasibility domains. Once the Delphi panelists discussed each tool in depth along these domains, they rated the overall utility of each tool as an outcome tracking tool. Each tool was rated on its own merits from low (1) corresponding to “definitely not recommend” to high (9) corresponding to “definitely recommend.”
Recommended Tool and Rationale
The methodology for selection of the tool to be used for tracking outcomes of care included allowing one point for passing each minimum criterion, with some criteria allowing for a partial point (0.5) if they are only partially met and zero points for each failed criterion. These points were added with equal weight for a final score ranging from a minimum of 0 to a maximum of 9. The tool with the highest score was recommended for tracking outcomes statewide.
Table 20 displays the individual scores for each criterion for each tool and shows that PSC-35 was the only tool that passed all the minimum criteria with a score of 9 and was therefore identified as best-suited for monitoring the effectiveness of publicly-funded child mental health care. The ASEBA and SDQ were in second place, each receiving a score of 7. All other tools scored lower and some (i.e., CGI and CGAS) failed multiple criteria. Some criteria were nearly universally passed (e.g., translation into top threshold languages in California and time to
P a g e | 38
completion), but other criteria were less frequently passed (e.g., broad age range, high modified Delphi panel score, or high quality of scientific evidence). While all criteria were weighted equally, some criteria have direct implications for implementation of the final selected tool statewide. For example, availability in top three threshold languages reduces the need for investing resources to translate the tools into the most frequently used languages in California. Similarly, covering a broad age range reduces the need for using multiple tools to cover all required age ranges. Availability of supporting high quality evidence and high overall utility scores by the Modified Delphi panel improves potential buy-in from multiple types of providers, county administrators, parents, and other experts who were represented in the panel.
The fact that the PSC-35 passed all 9 minimum criteria is significant. The PSC-35 is available for all age groups subject to the legislative mandate for outcome measurement, particularly very young children not covered in other tools examined. The PSC-35’s focus on current (rather than past or retrospective) child mental health status is an important consideration because a child’s episode of care varies in length and there may be gaps in care due to various barriers in access or other issues. The PSC-35 was the only high-scoring tool that had the capacity to measure clinical outcomes at chronologic time points that could potentially align with the receipt of recommended care or adherence to quality indicators within a child’s unique episode of care. This capacity is important because conclusions about whether or not care is effective require that changes in clinical outcomes be interpreted within the context of the quality of care delivered. In contrast, the time frame for the ASEBA is “past 6 months” and for the SDQ it is “past 6 months or school year”. Thus, neither of these tools have the capacity to align a child’s symptoms with the time point for receipt of the recommended care processes. This longer time frame also increases risk for recall bias.
Among the tools that had an evidence rating of 2b, the evidence supporting the PSC-35 most closely aligned with the purpose of California’s Performance Outcomes System (POS). Two studies were identified that used the parent version of the PSC (hereafter referred to as the PSC) to track clinical outcomes among children receiving clinic-based child mental health services.8,9 The study designs were both pre-/post- treatment with follow-up at three and six months. The sample sizes were sufficient (n=106) and large (n=1,294). Improvement in outcomes was detected in both studies, and the PSC-35 was successfully used as part of the clinic’s electronic outcomes rating form.
The CAFAS and SDQ each received a 2b rating based on one low quality randomized clinical trial study.10 However, findings from this relatively small study (n=93, with half of the sample each receiving one of two different interventions) found no significant differences in outcome scores on either tool by type of care received. The ASEBA received a 2c rating for one study, which was rigorous, but did not show a positive relationship between mental health service use and changes in behavior over time in a national longitudinal cohort study of children receiving care in the child welfare system. In addition, an older study comparing the CAFAS and ASEBA (specifically YSR and CBCL) showed that agreement between the two tools was poor and there was substantial attrition at the six month follow-up.11
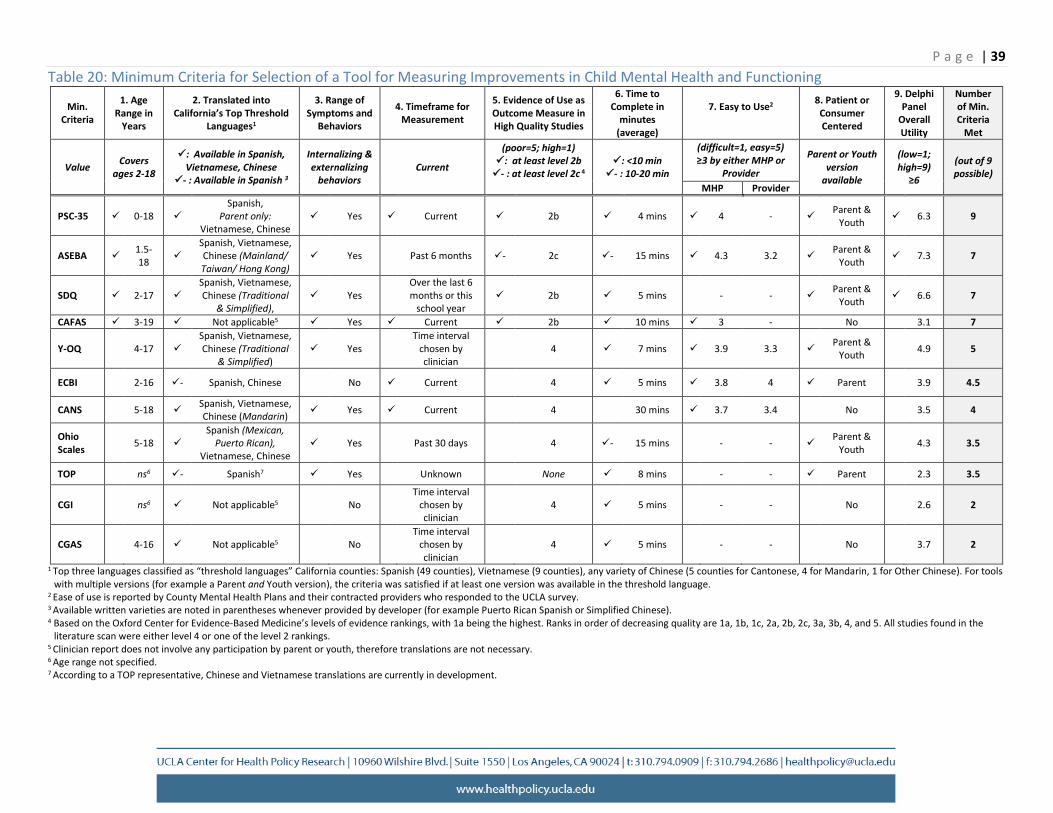
P a g e | 39 Table 20: Minimum Criteria for Selection of a Tool for Measuring Improvements in Child Mental Health and Functioning
Min. Criteria
1. Age Range in
Years
2. Translated into California’s Top Threshold
Languages1
3. Range of Symptoms and
Behaviors
4. Timeframe for Measurement
5. Evidence of Use as Outcome Measure in High Quality Studies
6. Time to Complete in
minutes (average)
7. Easy to Use2 8. Patient or Consumer Centered
9. Delphi Panel
Overall Utility
Number of Min. Criteria
Met
Value Covers ages 2-18
: Available in Spanish, Vietnamese, Chinese
3- : Available in Spanish
Internalizing & externalizing
behaviors Current
(poor=5; high=1) : at least level 2b
4- : at least level 2c : <10 min - : 10-20 min
(difficult=1, easy=5) ≥3 by either MHP or
Provider
Parent or Youth version
available
(low=1; high=9)
≥6
(out of 9 possible)
MHP Provider
PSC-35 0-18 Spanish,
Parent only: Vietnamese, Chinese
Yes Current 2b 4 mins 4 - Parent & Youth 6.3 9
ASEBA 1.5- 18
Spanish, Vietnamese, Chinese (Mainland/
Taiwan/ Hong Kong) Yes Past 6 months - 2c - 15 mins 4.3 3.2 Parent &
Youth 7.3 7
SDQ 2-17 Spanish, Vietnamese,
Chinese (Traditional & Simplified),
Yes Over the last 6 months or this
school year 2b 5 mins - - Parent &
Youth 6.6 7
CAFAS 3-19 Not applicable5 Yes Current 2b 10 mins 3 - No 3.1 7
Y-OQ 4-17 Spanish, Vietnamese,
Chinese (Traditional & Simplified)
Yes Time interval
chosen by clinician
4 7 mins 3.9 3.3 Parent & Youth
4.9 5
ECBI 2-16 - Spanish, Chinese No Current 4 5 mins 3.8 4 Parent 3.9 4.5
CANS 5-18 Spanish, Vietnamese, Chinese (Mandarin) Yes Current 4 30 mins 3.7 3.4 No 3.5 4
Ohio Scales
5-18 Spanish (Mexican,
Puerto Rican), Vietnamese, Chinese
Yes Past 30 days 4 - 15 mins - - Parent & Youth
4.3 3.5
TOP ns6 - Spanish7 Yes Unknown None 8 mins - - Parent 2.3 3.5
CGI ns6 Not licable5 app No Time interval
chosen by clinician
4 5 mins - - No 2.6 2
CGAS 4-16 Not applicable5 No Time interval
chosen by clinician
4 5 mins - - No 3.7 2
1 Top three languages classified as “threshold languages” California counties: Spanish (49 counties), Vietnamese (9 counties), any variety of Chinese (5 counties for Cantonese, 4 for Mandarin, 1 for Other Chinese). For tools with multiple versions (for example a Parent and Youth version), the criteria was satisfied if at least one version was available in the threshold language.
2 Ease of use is reported by County Mental Health Plans and their contracted providers who responded to the UCLA survey. 3 Available written varieties are noted in parentheses whenever provided by developer (for example Puerto Rican Spanish or Simplified Chinese). 4 Based on the Oxford Center for Evidence-Based Medicine’s levels of evidence rankings, with 1a being the highest. Ranks in order of decreasing quality are 1a, 1b, 1c, 2a, 2b, 2c, 3a, 3b, 4, and 5. All studies found in the
literature scan were either level 4 or one of the level 2 rankings. 5 Clinician report does not involve any participation by parent or youth, therefore translations are not necessary. 6 Age range not specified. 7 According to a TOP representative, Chinese and Vietnamese translations are currently in development.
P a g e | 40
Another significant consideration for ease of implementation is respondent burden. The PSC-35 takes approximately five minutes to administer and an equal amount of time to score. Scoring the PSC-35 is simple and involves rating each item from 0 to 2, then summing a subset of items across 3 subdomain scores (Attention, Internalizing, and Externalizing), each with an average of 5 to 7 items, and summing all items for a total score of 70. A child who scores above the standard suggested cutoff is considered to have psychosocial impairment. The cut-points for risk for the total score and the subdomain scores are well validated for children ages 3-5 years and 6-18 years. There is no need to reverse code or omit a subdomain scale from the total score (as in the SDQ) or calculate a T-score to determine whether a child exceeds a clinical cut-point (as in the ASEBA).
The ability of the PSC-35 to determine psychosocial impairment in both medical and mental health specialty settings is particularly important to allow for care coordination between Medi-Cal managed care plans and County Mental Health Plans. The PSC-35 provides the opportunity for employing a tool that is systemically used by both medical and mental health care providers to screen and measure improvements in outcomes, thereby facilitating coordinating care across care these sectors within managed care plans. PSC-35’s use of a common language also anticipates the increasingly intensive efforts towards integration of behavioral health services in primary care, which is a national priority.12
The PSC-35 is well-established for use in both primary care and mental health settings and has the capacity to compare clinical outcomes for children with similar levels of clinical severity across primary care clinics and specialty mental health programs. In contrast, none of the other tools were developed for use in a pediatric primary care setting or had evidence supporting their use to track clinical outcomes within a large health care system. Thus, only the PSC-35 is well positioned to track clinical outcomes for children as California transitions to use of co-located, collaborative and integrated care models for children.
Considerations for Incorporating a Clinician-completed Assessment
All the clinician-completed tools examined in this study received lower overall scores than PSC-35 and are not recommended for outcome measurement. However, CAFAS was the highest rated among clinician tools (7 out of 9) and can be considered as a second, complementary tool despite its limitations. The CAFAS did not pass two of the minimum criteria, namely patient-centeredness (because it does not have a parent or youth report version) and receiving a score of 6 or higher from the Delphi Panel (it received a 3.1, which is quite low). Additionally, it had other significant limitations in measuring change in outcomes. This option can be considered as a supplement to PSC in the absence of other clinician-completed standardized tools that met the minimum criteria for implementation.
Abstracting data from the electronic health record to assess improvements in functioning may also be considered, but requires careful examination. For example, achieving individualized treatment plan (ITP) goals from the clinical record can be used as an indicator of clinical improvement in functioning. ITPs are assessed by the entire clinical team at frequent intervals and are unlikely to be based on any single provider perspective, allowing for a mix of
P a g e | 41
assessments from team members with different clinical expertise including psychiatrists, psychologists, clinical social workers, and counselors. These results are also available during a single episode of care and can accurately reflect improvement, maintenance, or worsening in function. If these data were systematically abstracted into a common database, it may be possible to align changes in PSC-35 scores at three and six months at the population level with percentage of children who met their ITP goals at those time points. However, these data should be interpreted with caution because the validity and reliability of use of ITP goals for assessing outcomes are not established. This approach would be susceptible to various issues such as disagreements among the clinical team and individual variations in achievement of goals and scoring that is not standardized across providers. Yet, the advantage of this approach is that it builds capacity to examine agreement between improvement based on PSC-35 scores and a more individualized indicator of improvement based on clinical judgment.
Considerations for the Interpretation of Outcomes Data
Implementation of the legislative mandate for the POS requires developing an administrative infrastructure to monitor the quality of care delivered, which involves using data to inform quality improvement interventions on a statewide level. The selection of a standardized tool to track clinical outcomes for children and youth receiving publicly-funded mental health care is only the first step in bolstering the ability of DHCS to track outcomes. After selection of the tool, adequate infrastructure is needed to gather data from providers without significant additional burden, and data should be accurately analyzed to avoid misinterpretation. An important consideration in statewide measurement of outcomes is the current lack of established norms for expected improvements over time using the PSC-35 or other standardized tools. Thus, the data gathered on functional status for the first one to two years should be considered as a baseline, and specific methods for adjusting for clinical context, episodes of care, case-mix, provider variations in outcomes, and age-based scoring should be established using this baseline in order to have fair and accurate assessment of outcomes in future years.1
Once baseline data are obtained and adjusted for variations in case mix and other factors (described below), achievement targets have to be established to measure progress by providers in improving outcomes. Achievement targets should be set for total and subdomain scores as well as proportion at risk of psychosocial impairment using recommended cut-points for PSC-35. Appropriate targets can be selected from the combination of available literature, expert opinion, and DHCS goals and in consultation with providers. Important considerations for selecting targets include setting realistic goals for improvements overtime and the possibility of diminishing returns. For example, improvement goals can be set to 5%
1 Additional work will be required to gather the specific data needed for adjustments to PSC-35 scores reported by County mental health plans and their providers. Data for adjustments for case-mix (i.e., type of diagnosis, number of comorbid diagnoses) and age, are available in Medi-Cal enrollment and claims data. Data for adjustments for episodes of care can be obtained by further analyses of claims data including dates of services and procedures. Adjustments for provider mix or severity of the condition might require further administrative data from specialty mental health plans and providers.
P a g e | 42
improvement over baseline in the first year, and a similar rate per year over the previous year for five years, and maintenance of an established rate going forward. Alternatively, improvement goals for the second year and after can be set at lower values overtime, acknowledging that further improvements overtime can be harder to achieve.
Clinical Context
Developing the administrative infrastructure includes building the capacity to interpret the collected outcome data and set it within the context of the child’s clinical needs and the care received. For example, a child with a chronic mental health disorder may have only stable clinical outcomes over time with no improvement, despite high utilization of community-based services. No improvement in mental health and functional status would be observed even though high quality care was in fact delivered and hospitalization and other costly and intensive treatment was avoided. Alternatively, an acutely stressed child who only requires and receives crisis intervention may have poor baseline functioning, but show quick clinical improvement. No follow-up clinical outcomes data would be available for this child because no additional care was clinically indicated. In both instances, the baseline clinical functioning suggested high need for care, but clinical outcomes did not improve or were missing. If examined without context, the outcome scores could yield potentially misleading conclusions, despite the delivery of high quality appropriate care. Therefore, the outcomes data gathered have to be paired with other information on clinical diagnosis, severity, and services delivered for meaningful interpretation.
Episodes of Care
Accurate interpretation of outcomes data requires defining both the episode and the pattern of care received within the episode. For example, common scenarios such as a gap in treatment during an episode of care before the course of treatment is complete, or re-entry into care with similar or worse symptoms as the baseline, could both lead to the wrong conclusion that care was not effective. Reliance on data from those who remain in care is also problematic because it could potentially overestimate clinical improvement because of selection of children more likely to receive continuous, recommended care. This problem can be partially addressed by examining Medi-Cal administrative data to identify the population of children who had received specialty mental health services and examine receipt of any mental health services (e.g., claims for outpatient, emergency room, or hospital visits with a mental health diagnoses; paid claims for psychotropic medications) in other settings after their case was closed. This information can be used to identify children who left care prior to completing the course of treatment or those who may have had a recurrence but did not return to the specialty mental health setting.
Definition of an episode of care may be accomplished by using enrollment and claims/encounter data to determine when a child first received treatment, whether it was for a new or previous diagnosis, and the gap in care for those with previous and similar diagnosis. A new episode may be defined as the absence of any mental health services in the past 3 months with no psychotropic medication prescriptions being filled within that time period. Information such as number of visits and types of providers seen overall or within a given episode can also
P a g e | 43
be used to assess patterns of care. In addition, clinicians may be given the option to assess clinical outcomes using the PSC-35 at other time points that align to clinically meaningful dates.
Case Mix
Clinical outcomes data should be adjusted to account for variation in population characteristics that may lead to variations in outcomes that are unexplained by receipt of treatment. Children served in publicly-funded mental health programs can have differential access to care due to residence in rural areas, economic variations in different California regions, or other barriers due to sociodemographic factors. Severity adjustment can be accomplished by measuring the number of psychiatric diagnoses or types of comorbidity (e.g., Attention-deficit/hyperactivity disorder and Oppositional Defiant Disorder, Major Depression and substance abuse). Indicators of psychosocial complexity may include history of foster care placement, parental medical or behavioral health problems, parental incarceration, and homelessness. Lack of case mix adjustment may lead to inaccurate assessment of the quality of care delivered by the provider or agency. Adjusting for case mix by using demographic and enrollment data can provide a clear picture of outcomes for Medi-Cal enrollees, identify areas of health care disparities, and target quality improvement efforts. Additional data for psychosocial complexity adjustment may be obtained from the clinical record, such as parental serious and chronic mental illness or homelessness. These characteristics may influence a child’s likelihood of improvement and indicate need for more comprehensive services.
Variations in Child Outcomes by Provider and County
Provider variations in treatment are documented in multiple settings. Different providers within the same clinic may differ in the delivery of recommended care and provider practices may also be influenced by organizational approaches or culture. Thus, tracking outcomes should statistically adjust for clustering of patients by provider, clinic, and county when analyzing and reporting outcome data. Such adjustments will ensure that lack of improvement in care is not confounded by variations in practice patterns of specific providers, clinics, or counties.
PSC-35 Scoring by Age
Considerations for implementation of an outcomes tool include setting criteria for how to assess the data, data collection methods, and feedback that providers can use for quality improvement. As indicated, the PSC-35 is simple to administer and score. A clear cut-off score indicates whether there is impairment, and a decrease in a child’s PSC-35 total score over time indicates improvement. Furthermore, using the established cut-points for the child’s age range and subscales improves comparability of findings. The risk cut-points for the total and subdomain scores are well validated for children ages 3-5 years and 6-18 years. According to the developer, the cut-off score for ages 6-18 is 28 or above considered as psychosocially impaired and 27 or below as not impaired. For children ages 3-5, the scores on elementary school related items 5, 6, 17 and 18 are ignored and a total score based on the 31 remaining items is computed with a cutoff of 24 or higher as impaired. Each of the 35 items can have one of three ratings: a score of 0 indicates “Never,” 1 indicates “Sometimes,” and 2 indicates
P a g e | 44
“Often.” Scores are summed, with a possible range of scores from 0-70. Up to three blank scores are given a score of zero, but four or more blank items invalidate the questionnaire.
Administration Timeframe
The methods for data collection should be developed, including the timeframe for assessing baseline and follow-up measurements. More frequent follow-up such as three or six months are more likely to align with shorter episodes of care but might increase respondent burden. Requiring quarterly reporting by the MHPs allows them to use the PSC scores for internal ongoing quality improvement activities or initiation of new quality improvement activities to address poor outcomes. Quarterly measurement and scores are more useful than semi-annual or annual measurement for QI activities such as short PDSA cycles that require quick outcomes in short timeframes. Quarterly measurement also allows for more accurate assessment of patterns of change in the short and long term intervals by DHCS. DHCS can choose semi-annual or annual performance feedback to MHPs. Semi-annual feedback may be a better option for performance improvement in the first years of implementation. A DHCS operated portal and clear guidelines on data content and formatting for MHP reporting would simplify and automate the process.
Allowing a window of time such as two weeks before or after the follow-up measurement period for collecting PSC scores by MPHs would allow for variations in follow-up visit dates. Measurement periods that are not flexible will not account for variations in intensity and receipt of recommended care by child and will lead to less meaningful and useful outcome data.
Multiple observations per child allow for measuring change over time at smaller time intervals. For example, percentage decrease in proportion of at risk children at 3 months, 6 months, and 12 months compared to baseline can be calculated to assess improvements in outcome overtime by MHPs for specific clinics or providers. Comparisons of rate of change to achievement targets can be used by DHCS to assess improvements overtime at California or MHP levels.
Reporting Template
An example of a reporting template for total score and subscale scores per each child is displayed in Table 21. In this example, each MHP will report PSC-35 scores for the clinic (using a facility identifier), provider (using a provider identifier), and child (using a unique patient identifier). The reported scores will include overall baseline score as well as scores at 3, 6, and 12 month periods. The scores for the subdomains for the same time periods will also be reported.
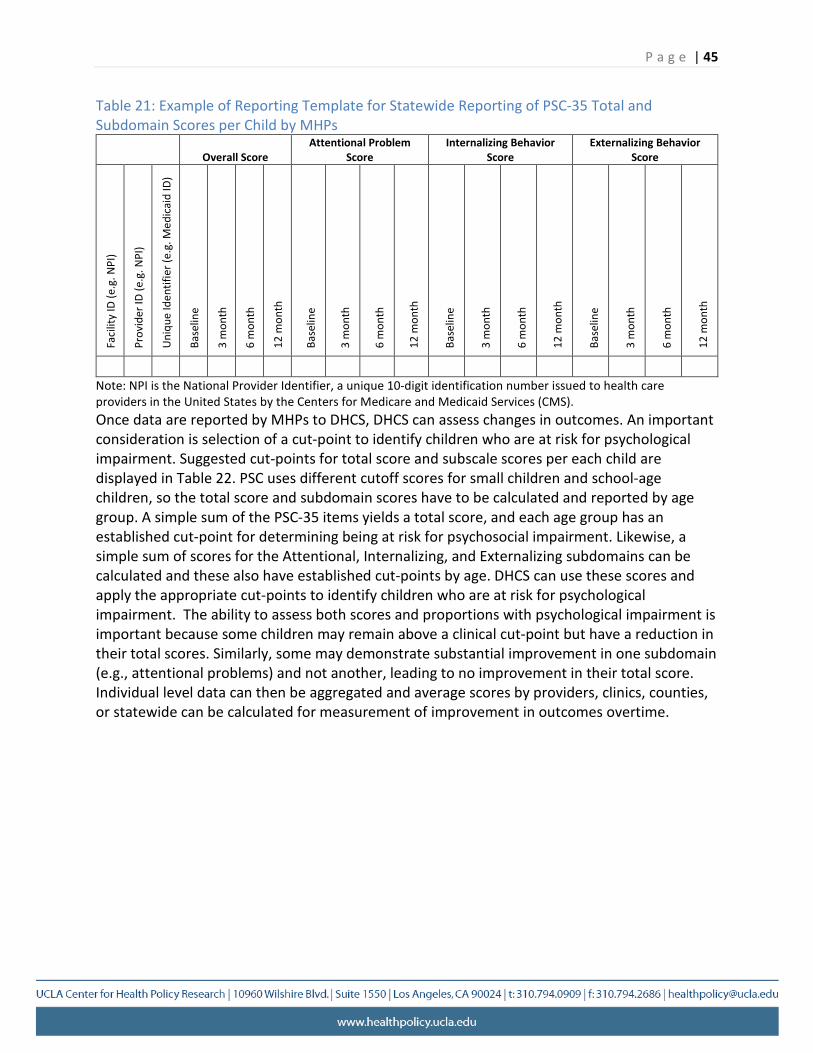
P a g e | 45
Table 21: Example of Reporting Template for Statewide Reporting of PSC-35 Total and Subdomain Scores per Child by MHPs
Overall Score Attentional Problem
Score Internalizing Behavior
Score Externalizing Behavior
Score
Faci
lity
ID (e
.g. N
PI)
Prov
ider
ID (e
.g. N
PI)
Uni
que
Iden
tifie
r (e.
g. M
edic
aid
ID)
Base
line
3 m
onth
6 m
onth
12 m
onth
Base
line
3 m
onth
6 m
onth
12 m
onth
Base
line
3 m
onth
6 m
onth
12 m
onth
Base
line
3 m
onth
6 m
onth
12 m
onth
Note: NPI is the National Provider Identifier, a unique 10-digit identification number issued to health care providers in the United States by the Centers for Medicare and Medicaid Services (CMS). Once data are reported by MHPs to DHCS, DHCS can assess changes in outcomes. An important consideration is selection of a cut-point to identify children who are at risk for psychological impairment. Suggested cut-points for total score and subscale scores per each child are displayed in Table 22. PSC uses different cutoff scores for small children and school-age children, so the total score and subdomain scores have to be calculated and reported by age group. A simple sum of the PSC-35 items yields a total score, and each age group has an established cut-point for determining being at risk for psychosocial impairment. Likewise, a simple sum of scores for the Attentional, Internalizing, and Externalizing subdomains can be calculated and these also have established cut-points by age. DHCS can use these scores and apply the appropriate cut-points to identify children who are at risk for psychological impairment. The ability to assess both scores and proportions with psychological impairment is important because some children may remain above a clinical cut-point but have a reduction in their total scores. Similarly, some may demonstrate substantial improvement in one subdomain (e.g., attentional problems) and not another, leading to no improvement in their total score. Individual level data can then be aggregated and average scores by providers, clinics, counties, or statewide can be calculated for measurement of improvement in outcomes overtime.
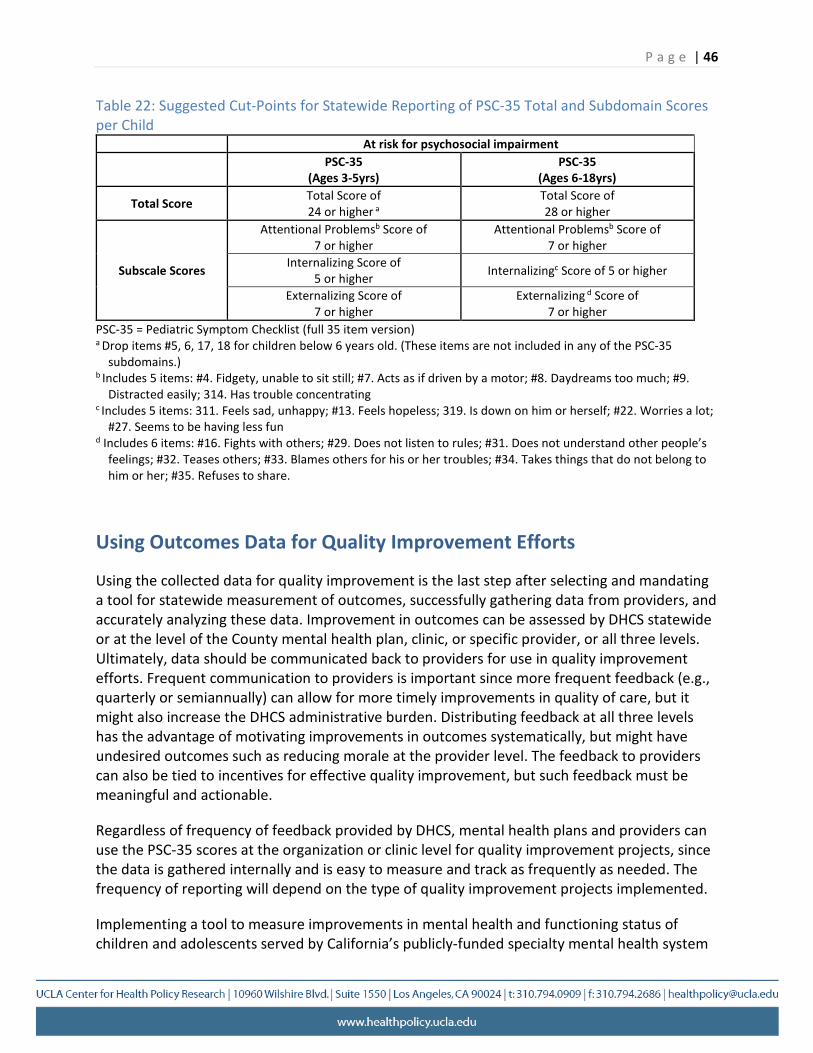
P a g e | 46
Table 22: Suggested Cut-Points for Statewide Reporting of PSC-35 Total and Subdomain Scores per Child
At risk for psychosocial impairment PSC-35
(Ages 3-5yrs) PSC-35
(Ages 6-18yrs)
Total Score Total Score of 24 or higher a
Total Score of 28 or higher
Attentional Problemsb Score of 7 or higher
Attentional Problemsb Score of 7 or higher
Subscale Scores Internalizing Score of 5 or higher Internalizingc Score of 5 or higher
Externalizing Score of 7 or higher
Externalizing d Score of 7 or higher
PSC-35 = Pediatric Symptom Checklist (full 35 item version) a Drop items #5, 6, 17, 18 for children below 6 years old. (These items are not included in any of the PSC-35
subdomains.) b Includes 5 items: #4. Fidgety, unable to sit still; #7. Acts as if driven by a motor; #8. Daydreams too much; #9.
Distracted easily; 314. Has trouble concentrating c Includes 5 items: 311. Feels sad, unhappy; #13. Feels hopeless; 319. Is down on him or herself; #22. Worries a lot;
#27. Seems to be having less fun d Includes 6 items: #16. Fights with others; #29. Does not listen to rules; #31. Does not understand other people’s
feelings; #32. Teases others; #33. Blames others for his or her troubles; #34. Takes things that do not belong to him or her; #35. Refuses to share.
Using Outcomes Data for Quality Improvement Efforts
Using the collected data for quality improvement is the last step after selecting and mandating a tool for statewide measurement of outcomes, successfully gathering data from providers, and accurately analyzing these data. Improvement in outcomes can be assessed by DHCS statewide or at the level of the County mental health plan, clinic, or specific provider, or all three levels. Ultimately, data should be communicated back to providers for use in quality improvement efforts. Frequent communication to providers is important since more frequent feedback (e.g., quarterly or semiannually) can allow for more timely improvements in quality of care, but it might also increase the DHCS administrative burden. Distributing feedback at all three levels has the advantage of motivating improvements in outcomes systematically, but might have undesired outcomes such as reducing morale at the provider level. The feedback to providers can also be tied to incentives for effective quality improvement, but such feedback must be meaningful and actionable.
Regardless of frequency of feedback provided by DHCS, mental health plans and providers can use the PSC-35 scores at the organization or clinic level for quality improvement projects, since the data is gathered internally and is easy to measure and track as frequently as needed. The frequency of reporting will depend on the type of quality improvement projects implemented.
Implementing a tool to measure improvements in mental health and functioning status of children and adolescents served by California’s publicly-funded specialty mental health system
P a g e | 47
will have specific challenges. The success of this effort will depend on careful consideration of how these challenges can be minimized or overcome.
The PSC-35 is infrequently used by California County specialty mental health plans or their contracted providers and, thus, will increase the time needed for them to gather such data. Including a new tool may also require the development of new infrastructure to capture and transmit the data to DHCS. Also, statewide assessment of outcomes may add an additional burden to counties and mental health plans that already conduct quality monitoring and improvement activities. However, doing so does not preclude clinician’s or counties’ use of other existing tools for intake and screening or periodic assessment of patients in clinical care. The ability to incorporate the PSC-35 into the electronic health care record and submit such data to DHCS will be greater for counties that have already invested in such infrastructure and can easily capture and transmit this data. But programs without such capacity will have to develop it and may need technical assistance and resources. Availability of a DHCS operated reporting portal will allow all providers to upload their data directly.
Conclusions Statewide assessment of improvements in outcomes is the essential first step to prepare California DHCS to achieve the Triple Aim of better care, better health, and lower costs. Data captured using a standardized tool to measure outcomes allows for the development of quality improvement projects by county, as well as statewide. This report describes the extensive effort undertaken to identify a scientifically rigorous tool that can be used statewide to assess improvements in children’s mental health functioning by the California Department of Health Care Services. Based on all the data compiled throughout each part of this study, the only tool that satisfied all the minimum criteria was the PSC-35 (parent version). This report has examined the advantages of this tool and considerations for using it statewide, as well as provided recommendations for how to address potential challenges. PSC-35 can be incorporated in quality improvement efforts by DHCS in California.
P a g e | 48
References
1 Centre for Evidence-based Medicine. Oxford Centre for Evidence-based Medicine—Levels of Evidence (March 2009). Available at: http://www.cebm.net/oxford-centre-evidence-based-medicine-levels-evidence-march-2009/. Accessed 10/24/16
2 Brook R. The RAND/UCLA Appropriateness Method. In: Methodology Perspectives. Editors: Kathleen McCormick, Steven Moore, Randie Siegel. From US DHHS, Public Health Service, Agency for Health Care Policy and Research. November 1994. AHCPR pub no 95-0009
3 Fitch K, Berstein SJ, Aguilar MD et al. The RAND/UCLA Appropriateness Method User's Manual published by Rand in 2001 and available at: http://www.rand.org/pubs/monograph_reports/MR1269.html
4 National Quality Forum. Tool Evaluation Criteria and Guidance Summary Tables Effect for Projects Beginning after January 2011. Available at: http://www.qualityforum.org/Publications/2013/10/Review_and_Update_of_Guidance _for_Evaluating_Evidence_and_Tool_Testing_-_Technical_Report.aspx. Accessed 4/2
5 Harrison, ME, McKay MM, and Bannon Jr WM. "Inner-city child mental health service use: The real question is why youth and families do not use services." Community mental health journal 40.2 (2004): 119-131.
6 Lindsey, MA., et al. "Understanding the behavioral determinants of mental health service use by urban, under-resourced Black youth: Adolescent and caregiver perspectives." Journal of child and family studies 22.1 (2013): 107-121.
7 Bronzan-McCorquodale Act (1991), WELFARE AND INSTITUTIONS CODE SECTION 5600-5623.5. California Dept MH. Performance Outcomes and Quality Improvement: History & Legislation.
8 Murphy JM, Blais M, Baer L, Mccarthy A, Kamin H, Masek B, Jellinek M. Measuring outcomes in outpatient child psychiatry: Reliable improvement, deterioration, and clinically significant improvement. Clinical Child Psychology & Psychiatry. 2015;20 (1):39-52
9 Murphy M, Kamin H, Masek B, Vogeli C, Caggiano R, Sklar K, Drubner S, Buonopane R, Picciotto M, Gold J, Jellinek M. Using brief clinician and parent measures to track outcomes in outpatient child psychiatry: Longer term follow-up and comparative effectiveness. Child & Adolescent Mental Health. 2012;17 (4):222-230.
P a g e | 49
10 Bruns, EJ, et al. "Effectiveness of wraparound versus case management for children and adolescents: Results of a randomized study." Administration and Policy in Mental Health and Mental Health Services Research 42.3 (2015): 309-322.
11 Rosenblatt A, Rosenblatt JA. Assessing the effectiveness of care for youth with severe emotional disturbances: Is there agreement between popular outcome measures? The Journal of Behavioral Health Services & Research. 2002. 29(3):259-273.
12 US Department of Health and Human Services. National Quality Strategy. Available at: http://www.ahrq.gov/workingforquality/about.htm. Access 10/24/16