Embed Size (px)
Citation preview

arX
iv:a
stro
-ph/
0310
657v
1 2
2 O
ct 2
003
LYCEN 2003-36October 15th, 2003
Calibration of the EDELWEISS
Cryogenic Heat-and-ionisation
Germanium Detectors
for Dark Matter Search
The EDELWEISS Collaboration:O. Martineau1, A. Benoıt2, L. Berge3, A. Broniatowski3, L. Chabert1,
B. Chambon1, M. Chapellier4, G. Chardin5, P. Charvin5,6, M. De Jesus1, P.Di Stefano1, D. Drain1, L. Dumoulin3, J. Gascon1, G. Gerbier5, E. Gerlic1,C. Goldbach7, M. Goyot1, M. Gros5, J.P. Hadjout1, S. Herve5, A. Juillard3,A. de Lesquen5, M. Loidl5, J. Mallet5, S. Marnieros3, N. Mirabolfathi6,
L. Mosca5,6, X.-F. Navick5, G. Nollez7, P. Pari4, C. Riccio5,6, V. Sanglard1,L. Schoeffel5, M. Stern1, L. Vagneron1
1Institut de Physique Nucleaire de Lyon-UCBL, IN2P3-CNRS, 4 rue Enrico Fermi,
69622 Villeurbanne Cedex, France2Centre de Recherche sur les Tres Basses Temperatures, SPM-CNRS, BP 166,
38042 Grenoble, France3Centre de Spectroscopie Nucleaire et de Spectroscopie de Masse, IN2P3-CNRS,
Universite Paris XI, bat 108, 91405 Orsay, France4CEA, Centre d’Etudes Nucleaires de Saclay, DSM/DRECAM, 91191 Gif-sur-
Yvette Cedex, France5CEA, Centre d’Etudes Nucleaires de Saclay, DSM/DAPNIA, 91191 Gif-sur-Yvette
Cedex, France6Laboratoire Souterrain de Modane, CEA-CNRS, 90 rue Polset, 73500 Modane,
France7Institut d’Astrophysique de Paris, INSU-CNRS, 98 bis Bd Arago, 75014 Paris,
France
Abstract
Several aspects of the analysis of the data obtained with the cryogenicheat-and-ionisation Ge detectors used by the EDELWEISS dark matter searchexperiment are presented. Their calibration, the determination of their en-ergy threshold, fiducial volume and nuclear recoil acceptance are detailed.

1 Introduction
The dominant (∼ 90%) component of the mass budget of the Universe mayconsist in Weakly Interacting Massive Particles (WIMPs), which could be theLightest Supersymmetric Particles (neutralinos in most models)1. WIMPswould be present at the galactic scale as a halo of mass typically ten timeslarger than the visible part of the galaxy. The EDELWEISS collaboration hasdevelopped heat-and-ionisation Ge detectors [2] to measure recoils inducedby elastic scattering of galactic WIMPs on a target nucleus. Constraints onthe spin-independent WIMP-nucleon cross-section in the framework of theMinimal SuperSymmetric Model (MSSM) have been derived from the nuclearrecoil rate measured with the EDELWEISS detectors [3], [4]. We present inthis paper the experimental details of these measurements. In Section 2, wedescribe briefly the experimental setup and the method of detection of anenergy deposit in the target. We then show the calibration procedure for theheat and ionisation signals (Section 3), the trigger threshold determination(Section 4) and the tagging of the nuclear recoils (Section 5). We finallypresent an original method to determine the fiducial volume of the detectors(Section 6).
2 The EDELWEISS detectors
2.1 Experimental setup
The experimental setup of the EDELWEISS-I experiment is described in [3]and [4]. We simply recall that up to three detectors can be housed in a lowbackground dilution cryostat working at a regulated temperature (27 mKin [3] and 17 mK in [4]). The EDELWEISS detectors are made of a ger-manium absorber (target for the incident particles) equiped with a thermalsensor and with metallic electrodes for charge collection. The simultaneousmeasurement of both phonons and charges created by a single interaction istherefore possible.The main characteristics of the detectors studied in this article are given inTable 1. For all of these detectors, the absorber is a ∼320 g Ge cylindricalcrystal (∼70 mm diameter and 20 mm thickness). Their edges have beenbeveled at an angle of 45o (Fig. 1). The electrodes for ionisation measure-ment are made of 100 nm Al layers sputtered on the surfaces after etching.The top electrode is divided in a central part and a guard ring, electricallydecoupled for radial localization of the charge deposition. The bottom elec-
1See e.g. [1] for a review.
1

trode is the common reference. For the GGA1 and GGA3 detectors (GSA1and GSA3), a 60 nm hydrogenated amorphous germanium (silicon) layerwas deposited under the electrodes in order to reduce the charge collectionproblems associated with events where the energy is deposited close to thedetector surface. It has indeed been shown that the probability that chargecarriers be collected on the same-sign electrode during the diffusion phasewhich preceeds the charge collection (dead layer problem) is reduced for thistype of detectors [5, 6].The thermal sensor consists of a Neutron Transmutation Doped germaniumcrystal (NTD)2, close to the metal-insulator transition. It is glued on a sput-tered gold pad near the edge of the bottom Al electrode (Fig. 1). Theresistance of the DC-polarized GeAl6 sensor was chosen to be ∼ 3 MΩ forGeAl6 (Trunning ∼27 mK), and ranged from 3 MΩ to 6 MΩ at 17 mK forthe other detectors. Reliable electrical contacts and heat links have beenachieved by the ultrasonic bonding of gold wires (diameter 25 µm) on goldpads. The thickness of these pads has been chosen to minimize the pro-duction of dislocations in the absorber caused by the bonding. A thermalanalysis of the detectors will be published in Ref. [6].
2.2 Detection method
The rise in temperature due to an energy deposit in the absorber gives rise toa variation ∆R of the thermal sensor resistance. When the sensor is polarizedby a constant current I, ∆R then induces a voltage fluctuation ∆V acrossthe resistor, which corresponds to the heat signal:
∆V = ∆R × I (1)
The ionisation signal is obtained by collection of the electron-hole pairs cre-ated by the interaction in the germanium crystal polarized through a biasvoltage applied to the electrodes. A low bias voltage3 is required to limit theheating of the cristal due to the drift of the charge carriers, known as theNeganov-Luke effect [7].
The energy ER deposited by a particle interacting in the detector can bedetermined by subtracting the Neganov-Luke effect from the heat signal :
ER =
(
1 +V
εγ
)
EH −V
εγEI (2)
2The NTD thermal sensors have been produced by Torre and Mangin for GeAl6 andby Haller-Beeman Associates for the other detectors.
3During the data takings, the bias voltage applied to the top electrode varied from± 3 V to ± 9 V depending on the detector.
2

where V is the bias voltage and εγ = 3 V the mean electron-hole pair cre-ation potential in germanium for γ-ray interactions (electron recoils). Thevariables EH and EI stand respectively for the heat and ionisation signal am-plitudes calibrated for γ-ray interactions following the procedure describedin Section 3.1.
We define the quenching variable Q as:
Q =EI
ER
(3)
This variable is of particular interest in the case of WIMP search since nuclearand electronic recoils correspond to different ionisation efficencies. As EI andEH are calibrated using γ-rays, Q = 1 for electronic interactions by defini-tion. In the case of nuclear recoils (such as those that would be producedby WIMP interactions), this ratio is much lower: Q ∼ 0.3. The simultane-ous measurement of heat and ionisation therefore provides an event-by-eventidentification of the type of recoils and thus gives an efficient method to re-ject the dominant γ-ray background. The precise definition of the rejectioncriteria is discussed in Section 5.
3 Calibration and resolution of heat and ion-
isation signals
3.1 Calibration of heat and ionisation channels
The ionisation signal EI is calibrated using a 57Co source that can be in-serted in the liquid He bath of the cryostat to a distance of ∼ 10 cm fromthe detectors, with only a ∼ 0.5 cm thick copper shielding layer between thesource and the detectors. The 122 and 136 keV peaks are clearly visible onthe spectra (Fig. 2c), allowing a precise calibration of the ionisation signal.The linearity of the signal amplitude has been verified using the 46.52 keVline from 210Pb (Fig. 2b) in the detector environment and the 8.98 and10.37 keV lines from the decay of cosmic-ray induced long life isotopes 65Znand 68Ge in the detector. The calibration factor is observed to be stablewithin a fraction of percent over periods of months. Because of the parasitecapacitance between the centre and guard electrodes, a charge fully collectedon an electrode also induces a signal on the other. This cross-talk of a fewpercents is purely linear and remains constant in time for a given detector.It can thus be easily corrected off-line (Fig. 3). The ionisation signal EI isdefined as the sum of the guard ring and center electrode signal amplitudes
3

after correction of the cross-talk and calibration of the two channels.The heat signal amplitude EH is periodically calibrated using the same 57Cosource. In contrast with ionisation, the heat signal appears to be very sensi-tive to long term drifts of the NTD temperature. It may for example vary bya few percent during several hours after transfers of cryogenic fluids. Betweentwo 57Co calibrations, the heat signal is therefore monitored on a continu-ous basis using the data from the low-background physics runs themselvesby setting the average value of the Q ratio to 1 for electron recoils. The46.52 keV line from 210Pb and the 8.98 and 10.37 keV lines associated withcosmogenesis activation of 65Zn and 68Ge in the detector (Fig. 2a) are usedto check the quality of the calibration of the heat signal.It should be stressed again at this point that the heat and ionisation signalsare calibrated using γ-ray sources, which induce electron recoils. The EI
and EH values thus correspond to the actual energy deposit for this typeof interactions only, and are therefore expressed in keV electron equivalent(keVee).
3.2 Resolution of heat and ionisation channels
For each detector, the baseline resolutions of the heat and the two ionisationchannels are regularly controlled through runs with an automatic randomtrigger. These runs show that the noises of the three channels are not corre-lated. The ionisation baseline resolution can therefore be written as :
(
σ0
I
)2=
(
σ0
center
)2+(
σ0
guard
)2(4)
The 57Co calibrations give a measurement of the resolutions for the ionisa-tion and heat signals at 122 keV. Typical values obtained for the detectorsstudied here are given in Table 2.
We parametrize the heat and ionisation signals resolutions at a given electron-equivalent energy E as :
σI,H(E) =
√
(
σ0I,H
)2+ (aI,HE)2 (5)
where the factors aI and aH are deduced from the resolution of the ionisationand heat signals at 122 keV. The resolutions of the 10.37 and 46.52 keV peaksobserved in low-background physics runs fit well with the expressions σI,H(E)from Eq. (5) (Fig. 2d). It can be noted that the resolutions at EI ∼10 keVee
-an energy below which most of the WIMPs signal is expected- is dominatedby the baseline resolutions σ0
I and σ0H .
Finally, the recoil energy resolution can be computed from the heat and
4

ionisation signal resolutions using Eq. (2). The noises of both signals beinguncorrelated, this resolution can be written as:
σER=
√
(
1 +V
εγ
)2
(σEH)2 +
(
V
εγ
)2
(σEI)2 (6)
In the case of GeAl6, and for the bias voltage applied during the low-background physics run (V=6 V), the resolution values displayed in Table 2lead to σER
∼ 8 keV FWHM around 30 keV. This value is reduced to 4 keVFWHM in the condition of the low-background physics run recorded withGGA1 (V=4 V) [4].
4 Threshold
The ionisation and heat channel data are continuously digitized and filteredat a rate of 200 kHz and 2kHz, respectively. When a filtered ionisation valueexceeds a fixed threshold value, data samples in all detectors are stored todisk. The trigger is defined by requiring a minimum threshold on the absolutevalue of any of the filtered ionisation channels. For each event, the list of alldetectors having triggered is stored as a bit pattern.
The ionisation threshold value, EI,th is defined as the ionisation energy (inkeVee) at which the trigger efficiency reaches 50%. It is the most importantparameter governing the recoil energy dependence of the efficiency. Its valueis measured using two different techniques: one is based on the Comptonplateau observed with a γ-ray source, and the other on coincidence neutrondata.
In the first one, a γ-ray spectra is recorded using a source producing aimportant Compton plateau, such as 60Co or 137Cs. Monte Carlo simula-tions indicate that the shape of the plateau above 10 keV can be linearlyextrapolated to lower energy. The efficiency as a function of EI , ǫ(EI), isthus obtained by dividing the measured rate by the straight line extrapolatedfrom the rate above 10 keV. The resulting ǫ(EI) data is fitted by a integralof a gaussian (erf), yielding the experimental value of EI,th. However, thismethod is limited by the large data sample necessary to obtain a significantnumber of events in the threshold region.
The second technique was made possible by the simultaneous operationof three detectors with a 252Cf neutron source (and thus could not be ap-plied to the GeAl6 detector). Neutron scattering induces a large number ofcoincidence events where at least two detectors are hit. The upper pannel ofFig. 4 shows the EI distribution recorded in one detector with the condition
5

that any of the other two detector triggered (unfilled histogram). Despitethat the detector under study is not requested in the trigger pattern, thepeak at EI=0 due to baseline noise is not overwhelmingly large, due to theimportance of the coincident rate. An unbiased sample of events with EI > 2keV is thus obtained. When in this sample it is further requested that thedetector under study be present in the trigger pattern, the shaded histogramis obtained. The ratio of the two distributions shown in the lower pannel ofFig. 4 correspond to the efficiency ǫ(EI). This interpretation is valid in theregion close to EI,th and above because in that energy range the contribu-tion of the peak due to baseline events is negligible and because the slope ofthe unbiased distribution is reasonnably small compared to the experimen-tal resolution on EI . Indeed, applying this method to a distribution N(EI)proportionnal to exp(−EI/τ) and smeared with an experimental r.m.s. res-olution σ, this method would result in a shift of −σ2/τ of the deduced valueof EI,th relative to the true value. In the present case, where the range ofexponential slopes and resolution are 3 < τ < 8 keV and 1 < 2.35σ < 2 keV,the shift should not exceed 0.2 keV.
Both Compton and neutron coincidence techniques give consistent ioni-sation threshold measurements. The coincidence measurements are the mostprecise, as the neutron source has the advantage of yielding a maximum rateat the lowest energy, and in addition, the quenching of ionisation for nuclearrecoils ensure that the stability of the measurement can be tested by im-posing a cut on the heat signal EH without affecting the ionisation signalswith EI above ∼ EH/2. The measured EI,th values for the different ionisa-tion channels of the detectors under study are listed in the last column ofTable 2.
5 Nuclear recoil band
Figure 5 shows a (ER, Q) distribution from the data recorded with a 252Cfsource emitting γ-rays and neutrons. Experimentally, the Q variable appearsto follow a gaussian distribution at the ∼ 2σ level for both nuclear andelectron recoils populations (Fig. 6). We therefore parametrize the region of90% acceptance for the nuclear recoils by the following cut:
|Q− < Qn > | ≤ 1.65σQn(7)
where < Qn > and σQnare the average value and the standard deviation
of the Q distribution for nuclear recoils, both variables being determinedfor each detector from 252Cf calibration data under the same experimentalconditions as the low-background physics runs.
6

5.1 Neutron line
The neutron line is the average Q value for the nuclear recoils population. Itis parametrized from 252Cf calibration data by :
< Qn > (ER) = a (ER)b (8)
The a and b values resulting from the fit of the experimental data for eachEDELWEISS detector are statistically consistent with the values a = 0.16and b = 0.18 quoted in [8]. The biases on the determination of < Qn >due to experimental calibration uncertainties, heat quenching effects [9], andmultiple scatterings are globally taken into account with this measurement.
5.2 Electron and nuclear recoils zones standard devi-
ations
The standard deviation of the electronic and nuclear recoil distributions,respectively noted σQγ
and σQn, can be calculated with Eqs. (2) and (3) by
propagation of the experimental values σI and σH :
σQγ(ER) =
(1 + V/3)
ER
√
σ2I + σ2
H (9)
σ0
Qn(ER) =
1
ER
√
(
1 +V
3< Qn >
)2
σ2I +
(
1 +V
3
)2
< Qn >2 σ2H(10)
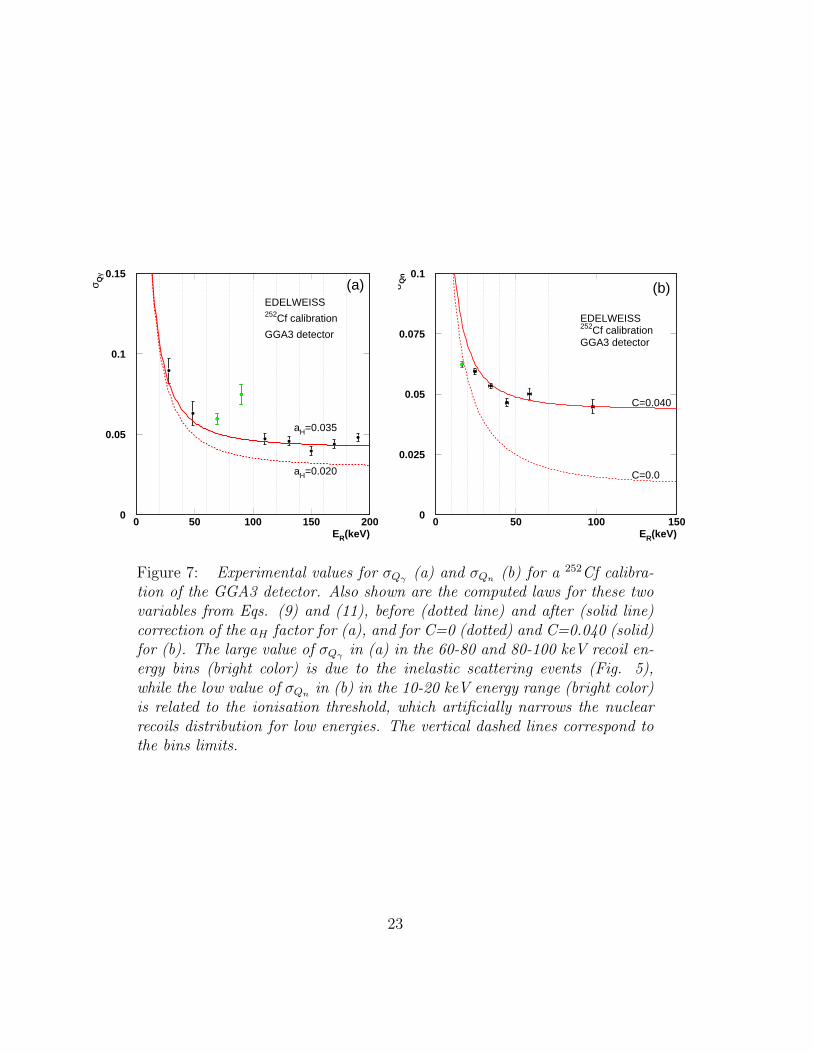
In the case of 60Co, 252Cf calibrations and low-background physics runs, theexperimental values of σQγ
at high energy are significantly larger (up to∼+30% at 122 keV) than those calculated from the resolutions given inTable 2 with Eqs. (4), (5) and (9) (Fig. 7a). A dependance of the heatsignal amplitude on the position of the interaction provides an explanationfor this discrepency. This hypothesis is consistent with the ∼ 1% heat sig-nal amplitude difference observed between center and guard events in 57Cocalibrations. We therefore enlarge the aH coefficient in Eq. (5) so that theanalytic expression given in Eq. (9) for σQγ
(ER) actually follows the exper-imental distribution for 60Co, 252Cf and low-background physics runs. Wehave checked that 90% of the experimental events then fall inside the elec-tron recoil zone defined in this way.Even after correcting the aH value, the nuclear recoils Q distribution of 252Cfcalibration data is broader at high energy than what is expected from Eq.(10) (Fig. 7b). Atomic scattering processes [11], fluctuations in the numberof charges created by a nuclear recoil [12] and multiple scattering (see Section
7

5.3) are in particular expected to give an intrinsic width to the Q distribu-tion for nuclear recoils and thus explain this behavior. The experimentalσQn
dependance on recoil energy is properly described when a constant C isquadratically added to the term associated with the experimental resolution.The equation (10) is thus re-written as follows:
σQn(ER) =
√
σ0Qn
(ER) + C2 (11)
Typical values of C ∼0.040 are determined for each EDELWEISS detectorby fitting the experimental σQn
points using Eq. (11). With this definition,we have checked for each detector that 90% of nuclear recoils induced by252Cf calibrations are inside the nuclear recoil zone defined in Eq. (7).
5.3 Effect of multiple scattering
The nuclear recoil zone is determined through neutron calibrations, for whichthe proportion of multiple interactions is around 40% between 20 and 200 keV.This is of particular importance because in contrast to neutrons, WIMPs areexpected to interact only once in the detector, and the Q variable is in thiscase larger than when the same energy is deposited in multiple nuclear in-teractions, as can be deduced from Eq. (8).We therefore evaluated quantitatively the effect of multiple interactions usinga GEANT [10] simulation of 252Cf calibrations of the EDELWEISS detectors.The Q variable has been calculated for the simulated nuclear events by as-sociating with Eq. (8) an ionisation signal of amplitude eI = 0.16 (eR)
1.18 toan energy deposit eR in a single interaction, and summing each individualeI to obtain the total EI energy for a given neutron. The effect of multipleinteractions has then been evaluated with these simulated data by smearingthe resulting Q distribution with the experimental resolution given in Eq.(10), and then by comparing the distributions obtained when selecting ornot single interactions events (Fig. 8).Although multiple interactions tend to lower < Qn >, this effect remainsweak, and the Q distribution associated with single interactions events isonly slightly narrower and completely included in the wider band. The nu-clear recoils zone determined through 252Cf calibrations has therefore beenconservatively used for the low-bakground physics run analysis.
5.4 Analysis energy range
Equations (9) and (10) predict that the discrimination between electronicand nuclear interactions is deteriorated at low energies (see also Fig. 5).
8

Rejection of the γ-ray background at a given level therefore defines a lowerbound for the analysis energy range.Secondly, the detection efficiency has to be as close to 100% as possible inthe analysis window in order to insure a good quality for the data set. Thetrigger threshold is therefore another factor which has to be taken into ac-count for the definition of the analysis lower energy bound. For both 2000 [3]and 2002 [4] runs, the choice of the analysis lower bound has mainly beendriven by this last factor. The threshold values of 5.7 and 3.5 keVee for theionisation signal indeed correspond respectively to recoil energies of 30 and20 keV for a 100% detection efficiency, and 90% efficiency when the nuclearrecoil zone is taken into account.Extensive γ-rays and neutron calibrations are performed before the physicsdata taking is initiated in order to fix the lowest recoil energy value corre-sponding to acceptable levels of γ-ray background rejection and detectionefficiency. This ensures that the lower limit of the analysis window is notinfluenced by the possible presence of events in the final data set. The defi-nition of the upper bound of the analysis window is described in [4].
6 Fiducial volume
6.1 Modelisation of the collection process
The segmentation of the upper charge collection electrode in a central partand a guard ring leads to the definition of a fiducial volume. This volumeis shielded against a significant amount of the radioactivity of the detectorenvironment by the peripherical volume, as shown in [3]. To allow for theexperimental resolution on the ionisation signals, the fiducial cut is definedas corresponding to a fraction of 3/4 of the charge collected on the centerelectrode. In order to give a robust and precise estimation of the detectorvolume associated with this fiducial cut, it is necessary to relate a given ratioof the two ionisation signal amplitudes to a given volume inside the detec-tor. This is not a straightforward process: first, for non-WIMP interactions,multiple interactions have to be taken into account, and furthermore, inter-actions between charges may play a crucial role in the collection process. Inparticular, the important proportion of events with a charge signal sharedbetween the two channels observed in each detector for 60Co calibrations (seee.g. Fig. 3) hints to the importance of these charge interactions processes.In order to test their influence on the determination of the fiducial volume,we choose to model the collection process with the simplified phenomenolog-ical description of charge collection given in Ref. [13], associated with the
9

hypothesis of a plasma effect before charge drift. We will see that, even ifsome of our results cannot be explained in the framework of this very sim-plified model (Section 6.2), it provides a good empirical tool to determinethe fiducial volume and estimate systematic errors on its value (Section 6.3).The model used here assumes the distribution of the charges in a sphere withuniform density, extending to a maximal radius rb before the charge is fullycollected. Charges are distributed among the two electrodes depending onthe position of the interaction relative to the surface corresponding to theseparation between drift lines going to the center and guard rings. Here, weassume for simplicity that this surface is parametrized by a cylinder of radiusRC (Fig. 11). For an interaction at the radius R > RC + rb in the crystal,the whole charge is fully associated with the guard ring. If R < RC − rb,then the charge has to be associated with the center electrode. Finally, ifRC +rb > R > RC−rb, then the charge is splitted among the two electrodes,with a relative proportion associated with the center electrode correspond-ing to the fraction of the sphere inside the cylinder of radius RC . For givenvalues of rb and RC , the fiducial volume is determined in this model by thefollowing expression of the fiducial radius:
Rfid = RC + 2 cos
(
13π
9
)
rb (12)
A fraction of 1/4 of the total volume of a sphere of radius rb centered onRfid is inside the cylinder of radius RC . In the framework of our model,interactions inside the cylinder of radius Rfid thus correspond to a chargecollection equal or greater than 3/4 of the total charge.
6.2 Validity and limits of the modelisation
In order to test its ability to reproduce the distribution of charge amplitudes,ionisation signals are simulated in the framework of this simple model, us-ing the program GEANT [10] for 60Co and 252Cf calibrations, as describedin Section 5.3. The parameters rb and RC of the simulated data are thenadjusted to match the experimental distribution of the Y variable on a givenenergy range, the Y variable being defined as the normalized difference ofthe ionisation signals:
Y =Eguard − Ecenter
Eguard + Ecenter(13)
The result of this optimisation is shown in Fig. 9 in the case of a 60Co cal-ibration of the GeAl6 detector under 6.3 V bias voltage. The shape of thesimulated distribution closely follows that of the experimental data, while
10
a simulation using an alternative model (linear distribution of the charge,detailed in [14]) clearly exhibits a different pattern.
We have also studied the evolution of the (rb, RC) parameters as a func-tion of bias voltage for the GeAl6 detector [15]. RC should not depend onthe value and sign of the bias voltage, since it is related to the static fielddistribution only, while rb should increase with decreasing bias voltage: asthe field increases, the less time there is for diffusion processes. The valuesof the parameters rb and RC determined for 60Co and 252Cf calibrations ofthe GeAl6 detector versus the applied field are displayed in Fig. 10. The rband RC values follow the expected behavior. Moreover, the mean measuredvalue of RC (< RC >= 24.45± 0.05 mm) is statistically compatible with thevalue Relectro = 24.4 mm expected from numerical calculations of the electricpotential inside this detector (see Table 1).The very large rb values are a clear sign that macroscopic charge extensionperpendicular to the drift direction occurs before the charge collection iscompleted. However the data does not support that this expansion is drivenby the plasma effect invoqued in Ref. [13]: a charge cloud size of the orderor above a millimeter is indeed not compatible with results of studies on thedead layer [5, 16]. Furthermore, Fig. 10 shows that rb(−) << rb(+) andthat the values of rb for
60Co and 252Cf calibrations do not differ significantlyfor a same bias voltage. These two experimental results are also in strongdisagreement with the predictions derived from the hypothesis of a plasmaeffect: firstly, the observed asymmetry for rb values between positive andnegative bias voltage does not find any explanation in the framework of theplasma model, and secondly, the plasma effect should be weaker in the caseof 60Co calibrations than for 252Cf (and thus rb values much smaller), sinceγ-rays induce much lower charge densities than neutrons. These are strongindications that the simple model presented here does not provide a properdescription of the dynamics of the charge drift and collection. Charge re-pulsion during drift, not taken into account here, could for example play animportant role in the collection process. A more detailed study, with dedi-cated detectors, has been initiated in the EDELWEISS collaboration in theaim of better understanding the collection process [16].
6.3 Measurement of the fiducial volume
Our results clearly point out the limits of the modelisation presented in Sec-tion 6.1. Still, it has to be stressed that this model reproduces correctly thedistribution of charges among the electrodes (Fig. 9), which represents thenet effect of the charge collection process. It is therefore sufficient to give a
11

precise determination of the fiducial volume and evaluate possible systematicerrors, before a better, physically motivated model replaces it.We have calculated Rfid with Eq. (12) and the rb and RC values deter-mined from 252Cf calibrations under the same bias voltage as that of the low-background physics run for each detector. For all detectors except GeAl10,the RC values are compatible with those expected from the geometry of theelectrodes and from numerical simulations of the electric potential inside thedetectors. The values determined for Rfid for the detectors are summarizedin Table 3. The systematic error associated with the uncertainty on the ex-act mechanism producing the charge expansion is evaluated by taking thedifference between the fiducial volume value deduced using the linear modeland the one presented in Section 6.1. Despite the poor description of thecharge distribution by the linear model (see Fig. 9), this difference is only1%. The variation of the energy range used to determine the values of rb andRC through comparison of the experimental and simulated Y distributionsproved to be a minor contribution to this systematic error.
An alternative evaluation of the fiducial volume is the fraction of cosmicactivation events at 8.98 and 10.37 keV (see Fig. 2) selected by the fidu-cial volume cut. Such events are expected to be evenly spread inside thedetector, and are observed at rates varying between 3 to 15 events per detec-tor per day. In the few days following a neutron calibration, the 10.37 keVrate is also enhanced due to 71Ge activation (T1/2 = 2.7 d), a populationthat is also expected to be evenly spread inside the detector. The measuredfractions, directly interpreted as Vfid values, are listed in the last column ofTable 3. They are compatible within statistics with the values derived fromthe neutron calibration data and the collection process modelisation. Thecosmic activation data is however less precise due to statistics, but this mea-surement is a good cross-check for the determination of the fiducial volume,and validates the use of the model presented in Section 6.1 to determine thefiducial volume.
7 Conclusion
We have described in the present work the calibration aspects of the dataanalysis in the EDELWEISS experiment. In particular, the nuclear recoilzone and fiducial volume have been estimated using several methods, allow-ing to define a conservative value of these important parameters. A simpleparametrization allows us to reproduce accurately the distribution of thecharges between the centre and guard electrodes associated with 60Co and
12

252Cf calibrations, making possible the systematic studies necessary to es-tablish the robustness of the determination of the fiducial volume of thedetectors.
References
[1] L. Bergstrom, Rep. Prog. Phys 63, 793 (2000).
[2] X.F. Navick et al., NIM A 444, 361 (2000).
[3] A. Benoıt et al., Phys. Lett. B 479 8 (2000).
[4] A. Benoıt et al., Phys. Lett. B 545 43 (2002).
[5] P. Luke et al., IEEE Trans. Nucl. Sci. 41 (4) (1994) 1074.T. Shutt et al., NIM A 444, 340 (2000).T. Shutt et al., in Proc. 9th Int. Workshop on Low Temperature Detec-tors, AIP conference proceedings 605, 513 (2001).
[6] XF. Navick et al., to be published.
[7] B. Neganov and V. Trofimov, USSR patent No 1037771, Otkrytia iizobreteniya 146, 215 (1985).P.N. Luke, J. Appl. Phys. 64, 6858 (1988).
[8] P. Di Stefano et al., Astropart. Phys. 14, 329 (2001).
[9] E. Simon et al., NIM A 507, 643 (2003).
[10] R. Brun et al., GEANT3, CERN report DD/EE/84-1 (1987).
[11] J. Lindhard et al., Mat. Phys. Medd. Dan. Vid. Selsk 10, 1 (1963).
[12] T. Yamaya et al., NIM 159, 181 (1979).
[13] M.J. Penn et al., in Proc. 6th Int. Workshop on Low Temperature De-tectors, NIM A 370, 215 (1996).
[14] O. Martineau et al., in Proc. 9th Int. Workshop on Low TemperatureDetectors, AIP conference proceedings 605, 505 (2001).
[15] O. Martineau, Recherche de WIMPs par l’experience EDELWEISS: car-acterisation des detecteurs et analyse des donnees, PhD thesis, Univer-site Lyon I (2002) (in french).Available at http://edelweiss.in2p3.fr/pub/fichiers/theses.html.
13
[16] A. Broniatowski et al., in Proc. 9th Int. Workshop on Low TemperatureDetectors, AIP conference proceedings 605, 521 (2001).A. Broniatowski, to be published in LTD10 proceedings (Genova, July2003).
14

Label Mass Relectro Vol. NTD Amorphous Trunning
(g) (mm) (mm3) layer (mK)GeAl6 321.62 24.4 4.0 none 27GeAl9 325.43 24.0 5.6 none 17GeAl10 323.91 24.0 5.6 none 17GGA1 318.50 24.0 1.64 Ge 17GGA3 324.40 24.0 5.6 Ge 17GSA1 313.68 24.0 5.6 Si 17GSA3 297.03 24.0 5.6 Si 17
Table 1: Main parameters for the EDELWEISS detectors studied in thisarticle. ”Relectro” refers to the radius value of the cylindrical volume associ-ated with charge collection on the center electrode. These values are calculatedthrough electrostatic simulation of the detector, taking into account the actualelectrodes geometry. The existence of an amorphous Ge or Si layer under theelectrodes is also mentionned. ”Trunning” is the value of the regulated cryostattemperature while running.
15

FWHM @ 0 keV FWHM @ 122 keV Trigger ThresholdCenter Guard Heat Ion. Heat Center Guard
Detector (keVee) (keVee) (keVee) (keVee) (keVee) (keVee) (keVee)GeAl6 2.0 1.4 2.2 2.8 3.5 6.0 4.0GeAl9 1.2 1.4 0.5 2.6 3.3 4.3 4.9GeAl10 1.1 1.3 0.4 3.0 3.5 3.3 4.3GGA1 1.3 1.3 1.3 2.8 3.5 3.5 3.5GGA3 1.3 1.5 0.4 3.1 2.7 2.9 3.9GSA1 1.2 1.4 0.6 3.1 2.8 3.5 3.4GSA3 1.1 1.3 1.4 3.3 3.3 3.0 3.4
Table 2: Typical values obtained in keVee for the full width half maximumresolution for heat and ionisation signals at 0 and 122 keV for the detectorsstudied in this article. The precision on these measurements are ±0.1 keVat 0 keV and ∼ ±0.2 keV at 122 keV. Also given here are the thresholdvalues for the center and guard channels. The precision is ±0.1 keV for bothchannels, except for GeAl6 where it is ±0.5 keV.
Detector Bias rb RC Rfid Vfid Activation(V) (mm) (mm) (mm) (%) Vfid(%)
GeAl6 +6.34 4.3± 0.2 24.5± 0.3 23.0± 0.3 54.6± 1.4 50± 3GeAl9 +2.00 6.1± 0.2 23.5± 0.4 21.4± 0.4 47.4± 2.0 53± 4GeAl10 -3.00 2.3± 0.2 21.9± 0.4 21.1± 0.4 46.0± 1.7 50± 4GGA1 -4.00 1.6± 0.1 24.6± 0.2 24.1± 0.2 60.1± 1.1 57± 3GGA3 -4.00 1.4± 0.1 24.1± 0.2 23.6± 0.2 57.7± 0.7 60± 5GSA1 -4.00 1.5± 0.1 24.2± 0.2 23.7± 0.2 58.3± 0.8 61± 4GSA3 -4.00 1.5± 0.1 23.9± 0.2 23.3± 0.2 56.2± 0.8 61± 5
Table 3: Values of various parameters for the EDELWEISS bolometersdetermined from 252Cf calibrations under the given bias voltage. The errorbars correspond to statistical errors. The systematic error on Vfid is ∼1%.”Activation” refers to the fraction of 8.98 and 10.34 keV events recorded withthe fiducial volume cuts (Ecenter > 3Eguard).
16

Figure 1: Top pannel: EDELWEISS GGA1 detector (Φ =70 mm). Bottompannel: close-up on the NTD thermal sensor glued on its golden pad on thebeveled part of the crystal.
17

0
50
100
5 7.5 10 12.5 15 17.50
20
40
40 60 80
0
50
100
110 120 130 140 150
Heat signal (keV)
GeAl10
Cu + Ga
activation
Ionization - guard (keV)
GeAl10210Pb
Ionization - centre (keV)
GGA1
57Co
Co
un
ts
Heat signal (keV)
FW
HM
re
so
luti
on
(k
eV
)
GeAl10
heat resolution(keV FWHM)
Guard events
Eqn. (5)
0
2
4
0 50 100
Figure 2: Figs. a), b), c): spectra obtained with the GeAl10 and GGA1detectors in various energy regions during physics background runs (a and b)and 57Co calibration runs (c). For the first two spectra, the lines associatedwith 65Zn (8.98 keV) and 68Ge decays (10.37 keV) (a) and 210Pb contami-nation (46.52 keV)(b) are clearly visible. In Fig. d), the baseline and peakresolutions of the GeAl10 detector heat channel for the 10.37, 46.52 and 122.1lines are fitted by the expression given in Eq. (5).
18

EDELWEISS60Co calibration
(b)
Ecenter (keV)
Eg
uar
d (
keV
)
0
250
500
750
1000
1250
0 250 500 750 1000 1250
Figure 3: Distribution of the guard ring versus the center electrod signals fora 60Co calibration of the GeAl6 detector at a bias voltage of +6.34 V before(a) and after (b) linear correction of the cross-talk between the two channels.On Fig. (b), the events along the horizontal (vertical) axis correspond tocenter (guard) events, for which the charge is fully collected on the centerelectrode (guard ring), and the events between the two axis correspond toshared events. Shared events represent a proportion of ∼ 50% of the totalnumber of events for this calibration.
19

1
10
10 2
10 3
-2 0 2 4 6 8 10
External trigger
+ GGA1 trigger
Co
un
ts /
0.5
keV
Ionisation signal (keV)
Tri
gg
er E
ffic
ien
cy
GGA1
Neutron sourcecoincidence data 50% at 3.5 keV
0
0.2
0.4
0.6
0.8
1
-2 0 2 4 6 8 10
Figure 4: Top pannel: plot of the data recorded in the GGA1 detector dur-ing neutron calibration for any other detector (GeAl9 or GeAl10) triggering(line), and with the additional condition that GGA1 also triggers (hatchedarea). Bottom pannel: experimental efficiency curve for the GGA1 detectorcorresponding to the ratio of the two distributions from the top pannel. The100% efficiency is reached at 5.5 keVee energy, corresponding to 20 keV recoilenergy.
20

Q
ER(keV)
EDELWEISS252Cf calibration
GGA1 detector Electron recoils
Nuclear recoils
Ionization threshold0
0.5
1
1.5
0 50 100 150 200
Figure 5: Projection in the (ER, Q) plane of the events recorded in theGGA1 detector during a 252Cf calibration. The thick lines represent the 90%nuclear and electronic recoils zone (±1.645σ around < Qn > and < Qγ >respectively). The dotted line corresponds to the ionisation threshold curve(EI=3.5 keVee in this case). The dashed lines show where events associatedwith the inelastic scattering of neutrons on 73Ge (13.26 and 68.75 keV excitedlevels) are expected in this plane.
21

0
500
1000
1500
0 0.2 0.4 0.6 0.8 1 1.2 1.4
EDELWEISS GGA1
γ calibration
40<ER<200 keV
252Cf calibration (n+γ)40<ER<60 keV
Q = Ionization/Recoil
0
50
100
0 0.2 0.4 0.6 0.8 1 1.2 1.4
Figure 6: Top pannel: spectrum of the Q variable in the 40-200 keV re-coil energy range for events recorded in the GGA1 detector during a 60Cocalibration (electron recoils). No events are seen for Q < 0.6. This showsthe excellent quality of the charge collection for this detector. This test isperformed for every detector before a low-background physics run is started.Bottom pannel: Spectrum of the Q variable in the 40-60 keV recoil energyrange for events recorded in the GGA1 detector during a 252Cf calibration(nuclear and electronic recoils). As the fit shows, the nuclear and electronrecoils populations follow gaussian distributions down to the 2σ level.
22
EDELWEISS252Cf calibration
GGA3 detector
aH=0.020
aH=0.035
(a)
ER(keV)
σ Qγ
0
0.05
0.1
0.15
0 50 100 150 200
EDELWEISS252Cf calibrationGGA3 detector
C=0.040
C=0.0
(b)
ER(keV)
σ Qn
0
0.025
0.05
0.075
0.1
0 50 100 150
Figure 7: Experimental values for σQγ(a) and σQn
(b) for a 252Cf calibra-tion of the GGA3 detector. Also shown are the computed laws for these twovariables from Eqs. (9) and (11), before (dotted line) and after (solid line)correction of the aH factor for (a), and for C=0 (dotted) and C=0.040 (solid)for (b). The large value of σQγ
in (a) in the 60-80 and 80-100 keV recoil en-ergy bins (bright color) is due to the inelastic scattering events (Fig. 5),while the low value of σQn
in (b) in the 10-20 keV energy range (bright color)is related to the ionisation threshold, which artificially narrows the nuclearrecoils distribution for low energies. The vertical dashed lines correspond tothe bins limits.
23

Q
Simulated 252Cf calibrationExperimental resolution smearing40<ER<60keV
Single
All
0
0.5
1
0 0.2 0.4 0.6
Q
Simulated 252Cf calibrationExperimental resolution smearing90<ER<200keV
Single
All
0
0.5
1
0 0.2 0.4 0.6
Figure 8: Normalized spectra of the Q variable for a GEANT simulationof a 252Cf calibration, selecting (hatched area) or not (continuous line) singleinteractions, in the 40-60 keV (top pannel) and 90-200 keV (bottom pannel)energy ranges. The distribution corresponding to all interactions is slightlyshifted down (∼ 0.015 units between 20 and 200 keV) in regards to the singleinteractions distribution, and is only slightly broader.
24

Y
Data (V=+6.34V)
Model with a spherical repartition of charge
Model with a linear repartition of charge
EDELWEISS60Co calibrationGeAl6 detector
30 keV<ER<1400 keV
1
10
10 2
10 3
-1 0 1
Figure 9: Distribution of the Y =Eguard−Ecenter
Eguard+Ecentervariable for events of
60Co calibration under +6,3 V bias voltage with 30 keV< EI <1400 keV(cross). The two other spectra correspond to the simulated distributions ob-tained for modelisations in the case of a charge reparted in a sphere (dashed,rb=4.2 mm, RC=24.5 mm) and charge reparted linearly (dotted, for param-eters giving the same fiducial volume).
25

2
4
6
0 1 2 3 4 5
60Co V>060Co V<0252Cf V>0252Cf V<0
E (V/cm)
rb (
mm
)
60Co V>060Co V<0252Cf V>0252Cf V<0
E (V/cm)
Rc
(mm
)
23.5
24
24.5
25
0 1 2 3 4 5
Figure 10: Optimized values for rb (top pannel) and RC (lower pannel) for60Co (circles) and 252Cf (triangles) calibrations of the GeAl6 detector versusapplied field values. Positive (negative) bias voltages correspond to the empty(filled) symbols. The rb distribution is fitted by a power law: rb = aE−b.The fit gives a+ = 5.7 ± 0.1, a
−= 1.8 ± 0.1, b+ = −0.24 ± 0.02 and b− =
−0.28± 0.09.
26

Rfid = 24.1 mm± 0.2 (stat.) ± 0.5 (syst)
Vfid = 60.1 %± 1.1 (stat.) ± 0.7 (syst.)
Rfid
RC
GGA1 detectorRC=24.6 mmrb=1.6 mm
R (cm)
Z (
cm)
-1.5
-1
-0.5
0
0.5
1
1.5
0 0.5 1 1.5 2 2.5 3 3.5
Figure 11: Representation of the GGA1 detector in the (R,Z) plane. Thethick line corresponds to Rfid = 24.1 mm. Also shown is the line RC =24.6 mm delimiting the volumes associated with collection on the center andguard electrodes (dotted) and a circle of radius rb=1.6 mm centered on RC
(dotted). These values correspond to the optimum for a 252Cf calibration ofthe GGA1 detector under a bias voltage of -4.00 V.
27