Embed Size (px)
Citation preview
Calibration of hybrid SCE-CSSM analytical model
for piezocone penetration in clays Fawad S. Niazi, & Paul W. Mayne School of CEE, Georgia Institute of Technology, Atlanta, Georgia, USA David J. Woeller ConeTec Investigations Ltd., Richmond, British Columbia,Canada ABSTRACT Piezocone penetration test (CPTu) readings of total tip resistance (qt), corrected sleeve friction (fst), and shoulder porewater pressure (u2) in fine-grained soils can be modeled using spherical cavity expansion (SCE) theory and critical state soil mechanics (CSSM) concepts. The predicted profiles can be fitted to the measured CPTu response using input
of soil parameters: preconsolidation stress ( p'), total unit weight ( t), effective friction angle ( '), rigidity index (IR), and compressibility parameters (Cc and Cs). This paper presents application of such a formulation for CPTu representation obtainable using a hybrid SCE-CSSM model to a variety of clays sites which have been field tested by CPTu. These
deposits have known profiles of t, ', p' and compressibility parameters determined from laboratory tests, and shear stiffness (Gmax) obtained from field measurement of shear wave velocity (Vs). Undrained shear strength (su) evaluated via critical-state concepts are used together with Gmax to evaluate IR over a range of applicable strains. RÉSUMÉ Les lectures de la résistance à la pointe, de la friction sur les parois du manchon de friction et de la pression d’eau interstitielle d’un essai au piézocône, peuvent être modélisées à l’aide de la théorie de l’expansion de cavité sphérique (SCE) et des concepts de mécanique des sols aux états critiques (CCSM). Les profils modélisés peuvent être comparés aux lectures prisent par le piézocône en utilisant les propriétés du sol telles que la contrainte de préconsolidation, le poids du sol en place, l’angle de friction, l’indice de rigidité, et les paramètres de compression. Cet article présente cette application avec la modélisation d’essais au piézocône obtenue en utilisant le modèle SCE-CSSM pour une grande variété d’argiles testées sur le terrain avec le piézocône. Ces dépôts ont déterminés par des essais de laboratoire. Les valeurs de rigidité ont été obtenues aussi sur le terrain par des essais au piézocône sismique. Les résistances au cisaillement en condition non drainée ont été évaluées par la théorie des états critiques et la valeur du module pour évaluer le paramètre de rigidité Ir pour une vaste étendue de niveau de déformation. 1 INTRODUCTION Ever since the use of cone penetrometer test (CPT) in geotechnical investigations, attempts have been made to interpret different soil engineering parameters from its readings. The evolution of CPT from single parameter measuring device to the hybrid seismic piezocone tests (SCPTu), which can measure up to four different readings (qt, fs, u2 and Vs), has resulted in simultaneous increases in formulation of well-established relationships based on multiple regression analyses on extensive database. A need is constantly felt for improvement of the existing correlations based on the 'ground truth' obtained through comparisons of laboratory test data with CPT readings from the continually increasing number of geotechnical test sites. An alternate approach for such improvements is a framework that utilizes fundamental soil properties to model CPTu readings. The SCE solution by Vesic (1977) together the Cambridge CSSM concepts provides for such a framework to be possibly established. 2 HYBRID SCE-CSSM CPTU MODEL Using a SCE solution together with a CSSM representation of undrained loading for triaxial compression mode, Mayne (1991, 1993, 2007) showed
that the CPTu readings of qt, fst, and u2 could be modeled in clays. Here, the penetrometer readings can be expressed in closed-form solutions:
qt = vo + [(4/3)(lnIR + 1) + /2 + 1]∙(M/2)(OCR/2) ∙ vo' [1]
u2 = uo + (4/3)∙(lnIR)∙(M/2)∙(OCR/2) ∙ vo' +
[1 – (OCR/2) ]∙ vo' [2]
fst = [Ko – {1 – (OCR/2) }]∙ vo'∙tan ' [3]
where qt is the total tip stress = qc+(1-an)∙u2; an is the net area ratio of the cone; fst is the corrected sleeve friction =
fs–bn∙u2; bn is the friction correction factor; IR is the operational rigidity index = G/su; G is the operational shear modulus; su is the undrained shear strength; OCR
is the overconsolidation ratio = p'/ vo'; p' is the
preconsolidation stress; is the plastic volumetric strain potential = 1–Cs/Cc; Cs is the swelling index; Cc is the virgin compression index; M is the frictional parameter of
Cambridge q–p' space = 6sin '/(3−sin '); ' is the effective
friction angle; vo' is the effective vertical stress = vo–uo;
vo is the total overburden stress = ti∙zi; uo is the

hydrostatic porewater pressure = w∙hw; ti and zi are the total unit weight and depth of i
th soil layer, respectively; hw
is the height of water; w is the unit weight of water = 9.8
kN/m3; tan is the interface friction ≈ 0.4∙tan ' and Ko is
the lateral stress coefficient = ho'/ vo'. In order to study the reliability of this model, an
attempt has been made to apply it to a variety of clays sites which have been field tested by CPTu or SCPTu.
These deposits have known profiles of t, ', p' and
compressibility parameters (Cs, Cc, ) determined from laboratory tests, and the fundamental shear stiffness (Gmax) obtained from field measurement of shear wave velocity (Vs). The su evaluated via critical-state concepts is used together with Gmax to estimate appropriate values of IR over a range of applicable strains.
3 CASE STUDY APPLICATIONS
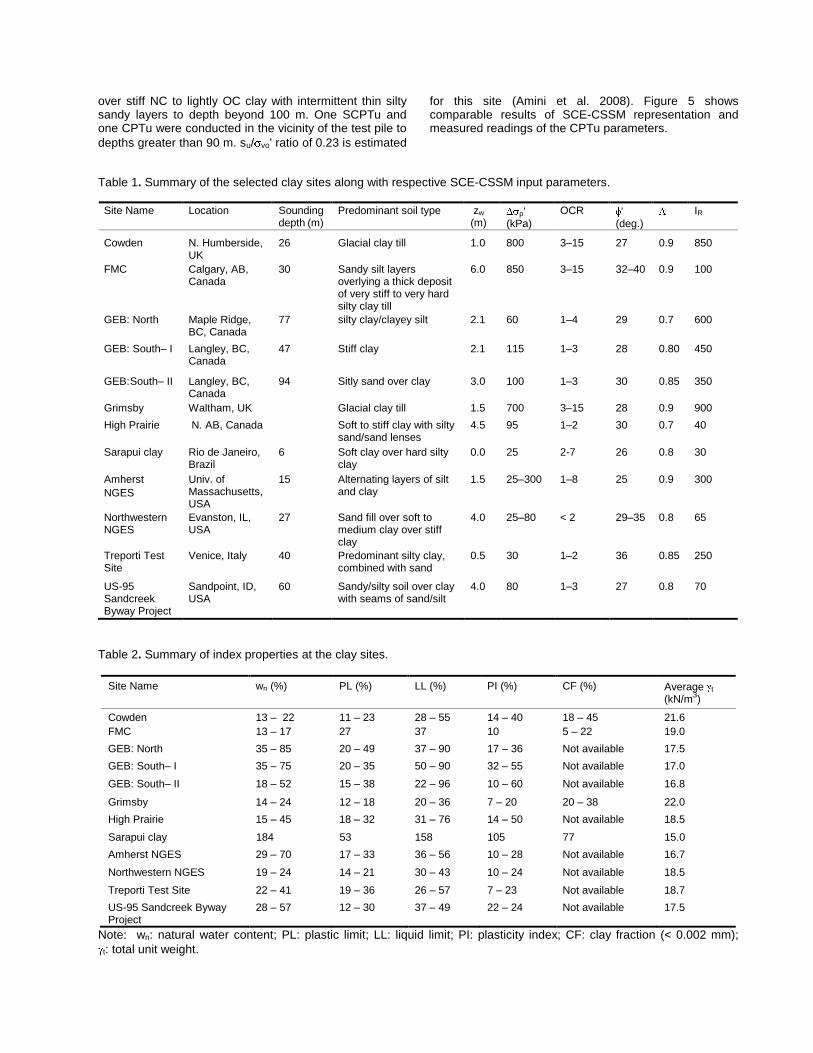
Data on the fundamental soil parameters from a variety of worldwide prominent sites (predominantly clay and silty clay) are used to generate full profiles of CPTu: qt, fst, and u2. Table 1 summarizes the necessary input parameters that drive the complete SCE-CSSM analysis for each case study. These sites represent a wide variety of geomaterials: soft to stiff clay, silty clay/clayey silt, alternating clay and silty/sandy clay beds, clay with silt and sand seams, and glacial clay till. In terms of stress history, these deposits range from normally consolidated (NC) to heavily overconsolidated (OC) (OCR > 10).
Accordingly, the overconsolidation difference (OCD = p'
= p'– vo') ranges from 25 to 900 kPa. The maximum depths of CPT soundings taken at these sites vary from 6 to 94 m. The depth to groundwater table (zw) ranges from
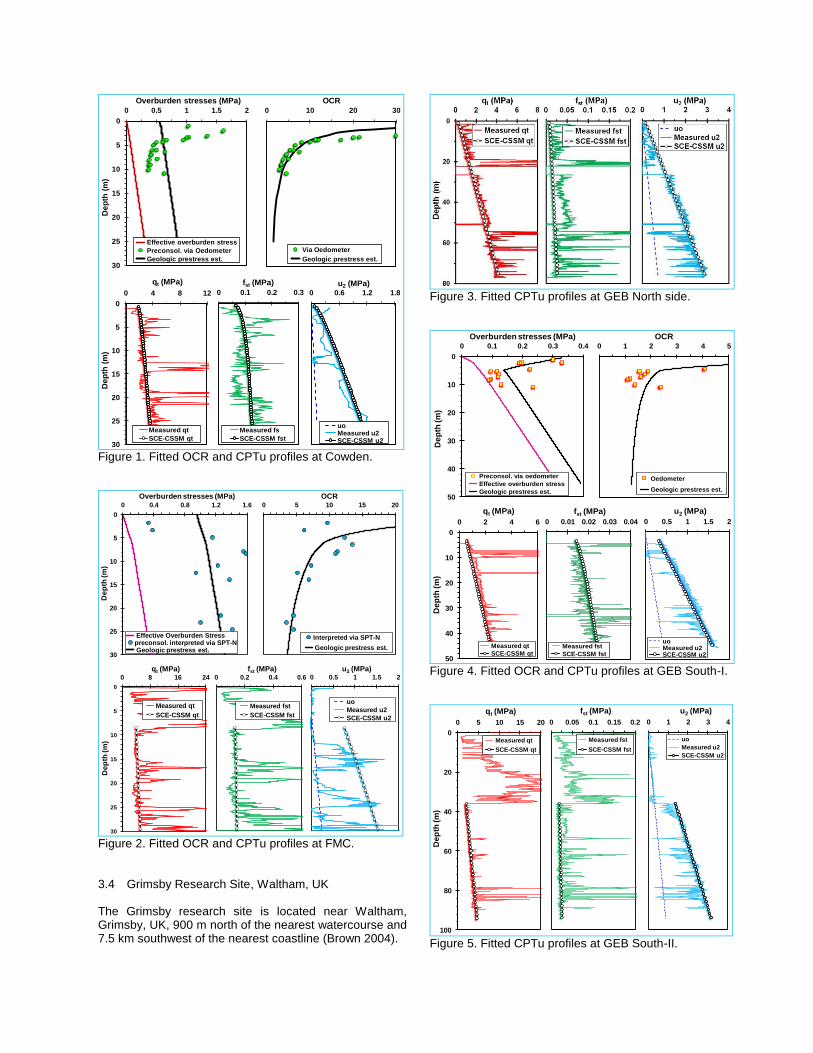
0 to 6 m. The friction characteristics of soils ( ') vary from 23O to 40O. The characteristic value of IR for each site was selected from the information on Gmax and su. Further descriptions, reference sources, and the resulting CPTu calibrations are separately given in this paper. The remaining parameters, required for these analyses, summarized in Table 1, have been selected from the information directly given in the relevant references cited in this paper. The index properties of the geomaterials at each site are also summarized in Table 2. 3.1 Cowden, North Humberside, UK The site at Cowden, located on the Holderness coast in UK was first established in 1976 for research and to determine parameters to be used as standard against which to evaluate a wide range of laboratory and in-situ tests. Since then, this site has been extensively used for geotechnical investigations and widely reported in multiple publications (e.g., Powell & Butcher 1991, 2003, Lunne et al. 1986, Powell et al. 1988, Atkinson et al. 1989). The site is characterized by the presence of a 25 m deep sequence of predominantly clayey glacial deposit, underlain by dissected plateau of Cretaceous chalk. The clay at this site is heavily OC in the upper layer with the degree of overconsolidation decreasing with depth. This site has been investigated by extensive cone penetrometer testing: CPT, CPTu, and SCPTu. Figure 1 shows the forward fitting of the SCE-CSSM model for
typical CPTu profiles at this site, by using representative values of the required parameters summarized in Table 1. 3.2 Foothills Medical Center, Calgary, Alberta, Canada
The construction of a new Foothills Medical Center (FMC) in Calgary, AB, Canada warranted the use of drilled shaft foundations for support of building loads (Mayne and Woeller 2008). The site is underlain by thin shallow fill and sandy silt layers overlying a thick deposit of very stiff to very hard silty clay till. The site investigations program included soil borings/sampling with standard penetration testing (SPT), CPTu, and SCPTu. The SPT N-values between 25 and 65 blows/0.3 m indicate a very hard nature of the clay till bearing stratum (Kort 2005, Elbanna et al. 2007). The OCD was estimated from the SPT-N
based correlation for p' (after Mayne et al. 2007). The forward fitting of CPTu readings from the SCE-CSSM algorithms are presented in Figure 2. 3.3 Golden Ears Bridge, British Columbia, Canada The Golden Ears Bridge (GEB) is a 970-m long newly constructed cable-stayed bridge over the Fraser River connecting Maple Ridge and Pitt Meadows to Langley and Surrey in BC, Canada. Extensive geotechnical testing was conducted for site characterizations on both the bridge approaches (Amini et al. 2008, Naesgaard et al. 2008). Specific details of investigation results on the north and south approaches of the GEB are given below. 3.3.1 North approach Field investigations at this site include borings/sampling and SCPTu. The subsoils at this site consist of 12 m of soft NC silty clay/clayey silt, overlying lightly OC to OC silty clay. The Gmax profile interpreted from Vs readings of
SCPTu and t represent Gibson type soil. Using representative values of the required parameters listed in Table 1, SCE-CSSM solutions yield reasonable match with the measured CPTu parameters (see Figure 3). 3.3.2 South approach
Two sets of site investigations were conducted on the south approach adjacent to the two pile load test locations, about 1600 m apart.
The soils at the head-down load test location consist of 2.5 m of gravelly sand fill over 3 m of sandy gravel, overlying lightly to OC stiff clay to the maximum depth of exploration of 50 m (Amini et al. 2008). Two SCPTu and one CPTu were conducted in the vicinity of the test pile to depths greater than 45 m. Information on su was obtained from the data of the standard, Nilcon and Geonor field vane tests at the site (Amini et al. 2008, and Sully 1991).
Average su/ vo' ratio of 0.4 are found to be reasonable estimates for this site. The Gmax profile at the site was interpreted from Vs reading of SCPTu. Using
representative values of ', IR, , and OCD (see Table 1). CPTu representations of SCE-CSSM expressions are shown in Figure 4.
The soil profile at the Osterberg cell load test location consists of 40 m of loose to dense sand and silty sand
over stiff NC to lightly OC clay with intermittent thin silty sandy layers to depth beyond 100 m. One SCPTu and one CPTu were conducted in the vicinity of the test pile to
depths greater than 90 m. su/ vo' ratio of 0.23 is estimated
for this site (Amini et al. 2008). Figure 5 shows comparable results of SCE-CSSM representation and measured readings of the CPTu parameters.
Table 1. Summary of the selected clay sites along with respective SCE-CSSM input parameters.
Site Name Location Sounding depth (m)
Predominant soil type zw (m)
p' (kPa)
OCR ' (deg.)
IR
Cowden N. Humberside, UK
26 Glacial clay till 1.0 800 3–15 27 0.9 850
FMC Calgary, AB, Canada
30 Sandy silt layers overlying a thick deposit of very stiff to very hard silty clay till
6.0 850 3–15 32–40 0.9 100
GEB: North Maple Ridge, BC, Canada
77 silty clay/clayey silt 2.1 60 1–4 29 0.7 600
GEB: South– I Langley, BC, Canada
47 Stiff clay 2.1 115 1–3 28 0.80 450
GEB: South– II Langley, BC, Canada
94 Sitly sand over clay 3.0 100 1–3 30 0.85 350
Grimsby Waltham, UK Glacial clay till 1.5 700 3–15 28 0.9 900
High Prairie N. AB, Canada Soft to stiff clay with silty sand/sand lenses
4.5 95 1–2 30 0.7 40
Sarapui clay Rio de Janeiro, Brazil
6 Soft clay over hard silty clay
0.0 25 2-7 26 0.8 30
Amherst
NGES
Univ. of Massachusetts, USA
15 Alternating layers of silt and clay
1.5 25–300 1–8 25 0.9 300
Northwestern NGES
Evanston, IL, USA
27 Sand fill over soft to medium clay over stiff clay
4.0 25–80 < 2 29–35 0.8 65
Treporti Test Site
Venice, Italy 40 Predominant silty clay, combined with sand
0.5 30 1–2 36 0.85 250
US-95 Sandcreek Byway Project
Sandpoint, ID, USA
60 Sandy/silty soil over clay with seams of sand/silt
4.0 80 1–3 27 0.8 70
Table 2. Summary of index properties at the clay sites.
Site Name wn (%) PL (%) LL (%) PI (%) CF (%) Average t (kN/m
3)
Cowden 13 – 22 11 – 23 28 – 55 14 – 40 18 – 45 21.6
FMC 13 – 17 27 37 10 5 – 22 19.0
GEB: North 35 – 85 20 – 49 37 – 90 17 – 36 Not available 17.5
GEB: South– I 35 – 75 20 – 35 50 – 90 32 – 55 Not available 17.0
GEB: South– II 18 – 52 15 – 38 22 – 96 10 – 60 Not available 16.8
Grimsby 14 – 24 12 – 18 20 – 36 7 – 20 20 – 38 22.0
High Prairie 15 – 45 18 – 32 31 – 76 14 – 50 Not available 18.5
Sarapui clay 184 53 158 105 77 15.0
Amherst NGES 29 – 70 17 – 33 36 – 56 10 – 28 Not available 16.7
Northwestern NGES 19 – 24 14 – 21 30 – 43 10 – 24 Not available 18.5
Treporti Test Site 22 – 41 19 – 36 26 – 57 7 – 23 Not available 18.7
US-95 Sandcreek Byway Project
28 – 57 12 – 30 37 – 49 22 – 24 Not available 17.5
Note: wn: natural water content; PL: plastic limit; LL: liquid limit; PI: plasticity index; CF: clay fraction (< 0.002 mm);
t: total unit weight.
0 10 20 30
OCR
Via Oedometer
Geologic prestress est.
0
5
10
15
20
25
30
0 0.5 1 1.5 2D
ep
th (
m)
Overburden stresses (MPa)
Effective overburden stress
Preconsol. via Oedometer
Geologic prestress est.
0
5
10
15
20
25
30
0 4 8 12
Dep
th (
m)
qt (MPa)
Measured qt
SCE-CSSM qt
0 0.1 0.2 0.3
fst (MPa)
Measured fs
SCE-CSSM fst
0 0.6 1.2 1.8
u2 (MPa)
uoMeasured u2SCE-CSSM u2
Figure 1. Fitted OCR and CPTu profiles at Cowden.
0
5
10
15
20
25
30
0 0.4 0.8 1.2 1.6
Dep
th (m
)
Overburden stresses (MPa)
Effective Overburden Stresspreconsol. interpreted via SPT-NGeologic prestress est.
0 5 10 15 20
OCR
Interpreted via SPT-N
Geologic prestress est.
0
5
10
15
20
25
30
0 8 16 24
Dep
th (m
)
qt (MPa)
Measured qt
SCE-CSSM qt
0 0.2 0.4 0.6
fst (MPa)
Measured fst
SCE-CSSM fst
0 0.5 1 1.5 2
u2 (MPa)
uo
Measured u2
SCE-CSSM u2
Figure 2. Fitted OCR and CPTu profiles at FMC. 3.4 Grimsby Research Site, Waltham, UK The Grimsby research site is located near Waltham, Grimsby, UK, 900 m north of the nearest watercourse and 7.5 km southwest of the nearest coastline (Brown 2004).
Figure 3. Fitted CPTu profiles at GEB North side.
0
10
20
30
40
50
0 2 4 6
De
pth
(m
)
qt (MPa)
Measured qt
SCE-CSSM qt
0 0.01 0.02 0.03 0.04
fst (MPa)
Measured fst
SCE-CSSM fst
0 0.5 1 1.5 2
u2 (MPa)
uoMeasured u2SCE-CSSM u2
0
10
20
30
40
50
0 0.1 0.2 0.3 0.4
De
pth
(m
)
Overburden stresses (MPa)
Preconsol. via oedometer
Effective overburden stress
Geologic prestress est.
0 1 2 3 4 5
OCR
Oedometer
Geologic prestress est.
Figure 4. Fitted OCR and CPTu profiles at GEB South-I.
0
20
40
60
80
100
0 5 10 15 20
De
pth
(m
)
qt (MPa)
Measured qt
SCE-CSSM qt
0 0.05 0.1 0.15 0.2
fst (MPa)
Measured fst
SCE-CSSM fst
0 1 2 3 4
u2 (MPa)
uo
Measured u2
SCE-CSSM u2
Figure 5. Fitted CPTu profiles at GEB South-II.
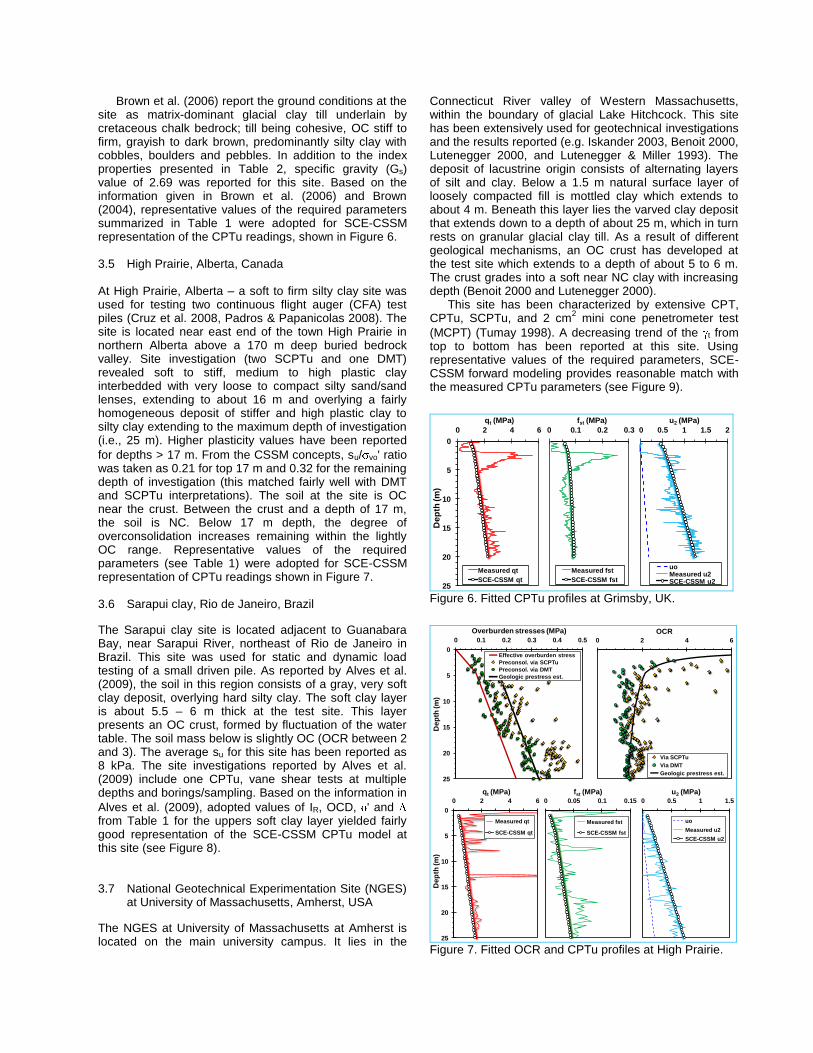
Brown et al. (2006) report the ground conditions at the site as matrix-dominant glacial clay till underlain by cretaceous chalk bedrock; till being cohesive, OC stiff to firm, grayish to dark brown, predominantly silty clay with cobbles, boulders and pebbles. In addition to the index properties presented in Table 2, specific gravity (Gs) value of 2.69 was reported for this site. Based on the information given in Brown et al. (2006) and Brown (2004), representative values of the required parameters summarized in Table 1 were adopted for SCE-CSSM representation of the CPTu readings, shown in Figure 6. 3.5 High Prairie, Alberta, Canada At High Prairie, Alberta – a soft to firm silty clay site was used for testing two continuous flight auger (CFA) test piles (Cruz et al. 2008, Padros & Papanicolas 2008). The site is located near east end of the town High Prairie in northern Alberta above a 170 m deep buried bedrock valley. Site investigation (two SCPTu and one DMT) revealed soft to stiff, medium to high plastic clay interbedded with very loose to compact silty sand/sand lenses, extending to about 16 m and overlying a fairly homogeneous deposit of stiffer and high plastic clay to silty clay extending to the maximum depth of investigation (i.e., 25 m). Higher plasticity values have been reported
for depths > 17 m. From the CSSM concepts, su/ vo' ratio was taken as 0.21 for top 17 m and 0.32 for the remaining depth of investigation (this matched fairly well with DMT and SCPTu interpretations). The soil at the site is OC near the crust. Between the crust and a depth of 17 m, the soil is NC. Below 17 m depth, the degree of overconsolidation increases remaining within the lightly OC range. Representative values of the required parameters (see Table 1) were adopted for SCE-CSSM representation of CPTu readings shown in Figure 7. 3.6 Sarapui clay, Rio de Janeiro, Brazil
The Sarapui clay site is located adjacent to Guanabara Bay, near Sarapui River, northeast of Rio de Janeiro in Brazil. This site was used for static and dynamic load testing of a small driven pile. As reported by Alves et al. (2009), the soil in this region consists of a gray, very soft clay deposit, overlying hard silty clay. The soft clay layer is about 5.5 – 6 m thick at the test site. This layer presents an OC crust, formed by fluctuation of the water table. The soil mass below is slightly OC (OCR between 2 and 3). The average su for this site has been reported as 8 kPa. The site investigations reported by Alves et al. (2009) include one CPTu, vane shear tests at multiple depths and borings/sampling. Based on the information in
Alves et al. (2009), adopted values of IR, OCD, ' and from Table 1 for the uppers soft clay layer yielded fairly good representation of the SCE-CSSM CPTu model at this site (see Figure 8). 3.7 National Geotechnical Experimentation Site (NGES)
at University of Massachusetts, Amherst, USA
The NGES at University of Massachusetts at Amherst is located on the main university campus. It lies in the
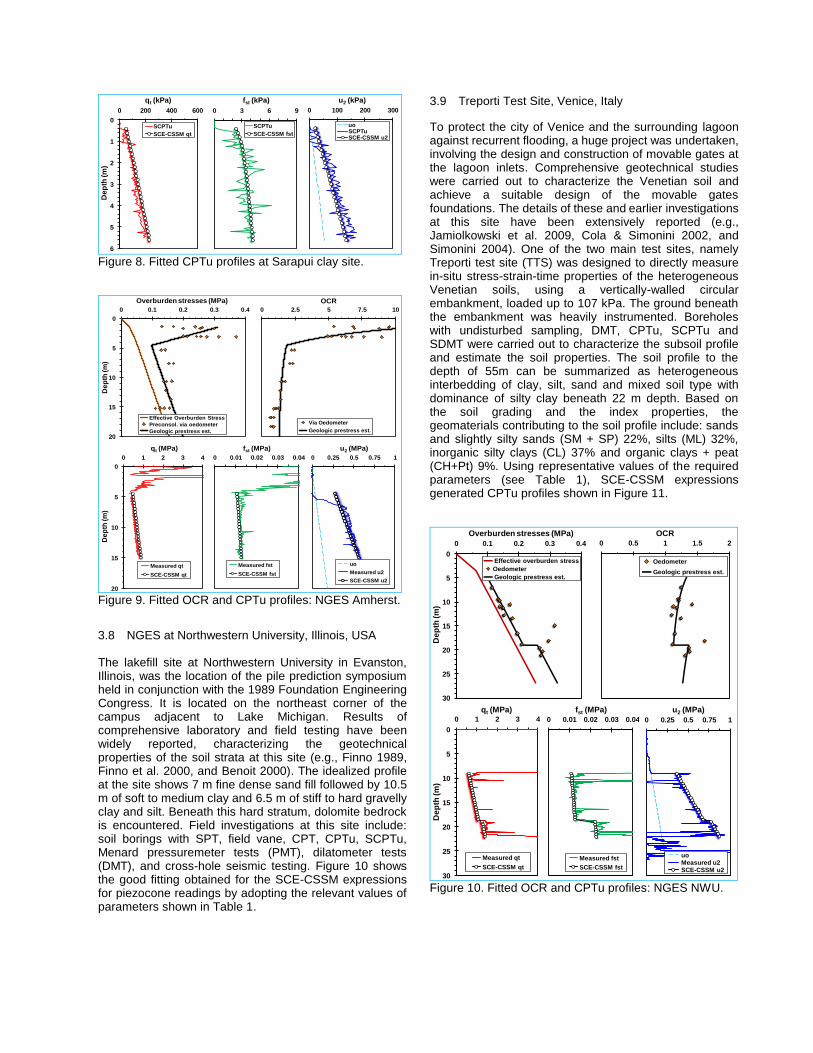
Connecticut River valley of Western Massachusetts, within the boundary of glacial Lake Hitchcock. This site has been extensively used for geotechnical investigations and the results reported (e.g. Iskander 2003, Benoit 2000, Lutenegger 2000, and Lutenegger & Miller 1993). The deposit of lacustrine origin consists of alternating layers of silt and clay. Below a 1.5 m natural surface layer of loosely compacted fill is mottled clay which extends to about 4 m. Beneath this layer lies the varved clay deposit that extends down to a depth of about 25 m, which in turn rests on granular glacial clay till. As a result of different geological mechanisms, an OC crust has developed at the test site which extends to a depth of about 5 to 6 m. The crust grades into a soft near NC clay with increasing depth (Benoit 2000 and Lutenegger 2000).
This site has been characterized by extensive CPT, CPTu, SCPTu, and 2 cm
2 mini cone penetrometer test
(MCPT) (Tumay 1998). A decreasing trend of the t from top to bottom has been reported at this site. Using representative values of the required parameters, SCE-CSSM forward modeling provides reasonable match with the measured CPTu parameters (see Figure 9).
0
5
10
15
20
25
0 2 4 6D
ep
th (m
)
qt (MPa)
Measured qt
SCE-CSSM qt
0 0.1 0.2 0.3
fst (MPa)
Measured fst
SCE-CSSM fst
0 0.5 1 1.5 2
u2 (MPa)
uoMeasured u2SCE-CSSM u2
Figure 6. Fitted CPTu profiles at Grimsby, UK.
0 2 4 6
OCR
Via SCPTu
Via DMT
Geologic prestress est.
0
5
10
15
20
25
0 0.1 0.2 0.3 0.4 0.5
Dep
th (m
)
Overburden stresses (MPa)
Effective overburden stress
Preconsol. via SCPTu
Preconsol. via DMT
Geologic prestress est.
0
5
10
15
20
25
0 2 4 6
Dep
th (m
)
qt (MPa)
Measured qt
SCE-CSSM qt
0 0.05 0.1 0.15
fst (MPa)
Measured fst
SCE-CSSM fst
0 0.5 1 1.5
u2 (MPa)
uo
Measured u2
SCE-CSSM u2
Figure 7. Fitted OCR and CPTu profiles at High Prairie.
0 3 6 9
fst (kPa)
SCPTu
SCE-CSSM fst
0 100 200 300
u2 (kPa)
uoSCPTuSCE-CSSM u2
0
1
2
3
4
5
6
0 200 400 600D
ep
th (m
)qt (kPa)
SCPTu
SCE-CSSM qt
Figure 8. Fitted CPTu profiles at Sarapui clay site.
0
5
10
15
20
0 1 2 3 4
Dep
th (m
)
qt (MPa)
Measured qt
SCE-CSSM qt
0 0.01 0.02 0.03 0.04
fst (MPa)
Measured fst
SCE-CSSM fst
0 0.25 0.5 0.75 1
u2 (MPa)
uo
Measured u2
SCE-CSSM u2
0
5
10
15
20
0 0.1 0.2 0.3 0.4
Dep
th (m
)
Overburden stresses (MPa)
Effective Overburden Stress
Preconsol. via oedometer
Geologic prestress est.
0 2.5 5 7.5 10
OCR
Via Oedometer
Geologic prestress est.
Figure 9. Fitted OCR and CPTu profiles: NGES Amherst.
3.8 NGES at Northwestern University, Illinois, USA The lakefill site at Northwestern University in Evanston, Illinois, was the location of the pile prediction symposium held in conjunction with the 1989 Foundation Engineering Congress. It is located on the northeast corner of the campus adjacent to Lake Michigan. Results of comprehensive laboratory and field testing have been widely reported, characterizing the geotechnical properties of the soil strata at this site (e.g., Finno 1989, Finno et al. 2000, and Benoit 2000). The idealized profile at the site shows 7 m fine dense sand fill followed by 10.5 m of soft to medium clay and 6.5 m of stiff to hard gravelly clay and silt. Beneath this hard stratum, dolomite bedrock is encountered. Field investigations at this site include: soil borings with SPT, field vane, CPT, CPTu, SCPTu, Menard pressuremeter tests (PMT), dilatometer tests (DMT), and cross-hole seismic testing. Figure 10 shows the good fitting obtained for the SCE-CSSM expressions for piezocone readings by adopting the relevant values of parameters shown in Table 1.
3.9 Treporti Test Site, Venice, Italy
To protect the city of Venice and the surrounding lagoon against recurrent flooding, a huge project was undertaken, involving the design and construction of movable gates at the lagoon inlets. Comprehensive geotechnical studies were carried out to characterize the Venetian soil and achieve a suitable design of the movable gates foundations. The details of these and earlier investigations at this site have been extensively reported (e.g., Jamiolkowski et al. 2009, Cola & Simonini 2002, and Simonini 2004). One of the two main test sites, namely Treporti test site (TTS) was designed to directly measure in-situ stress-strain-time properties of the heterogeneous Venetian soils, using a vertically-walled circular embankment, loaded up to 107 kPa. The ground beneath the embankment was heavily instrumented. Boreholes with undisturbed sampling, DMT, CPTu, SCPTu and SDMT were carried out to characterize the subsoil profile and estimate the soil properties. The soil profile to the depth of 55m can be summarized as heterogeneous interbedding of clay, silt, sand and mixed soil type with dominance of silty clay beneath 22 m depth. Based on the soil grading and the index properties, the geomaterials contributing to the soil profile include: sands and slightly silty sands (SM + SP) 22%, silts (ML) 32%, inorganic silty clays (CL) 37% and organic clays + peat (CH+Pt) 9%. Using representative values of the required parameters (see Table 1), SCE-CSSM expressions generated CPTu profiles shown in Figure 11.
0 0.5 1 1.5 2
OCR
Oedometer
Geologic prestress est.
0
5
10
15
20
25
30
0 0.1 0.2 0.3 0.4
Dep
th (m
)
Overburden stresses (MPa)
Effective overburden stress
Oedometer
Geologic prestress est.
0
5
10
15
20
25
30
0 1 2 3 4
Dep
th (m
)
qt (MPa)
Measured qt
SCE-CSSM qt
0 0.01 0.02 0.03 0.04
fst (MPa)
Measured fst
SCE-CSSM fst
0 0.25 0.5 0.75 1
u2 (MPa)
uoMeasured u2SCE-CSSM u2
Figure 10. Fitted OCR and CPTu profiles: NGES NWU.

0
10
20
30
40
0 0.1 0.2 0.3 0.4D
ep
th b
elo
w m
sl (m
)Overburden stresses (MPa)
Effective Overburden Stress
Preconsol.' via oedomete
Preconsol. via embank. monitoring
Geologic prestress est.
0 0.05 0.1 0.15
fst (MPa)
Measured fst
SCE-CSSM fst
0 0.5 1 1.5 2
u2 (MPa)
uo
Measured u2
SCE-CSSM u2
0
10
20
30
40
0 4 8 12
Dep
th b
elo
w m
sl (m
)
qt (MPa)
Measured qt
SCE-CSSM qt
0 1 2 3 4OCR
Via oedometer
Via embankment monitoring
Geologic prestress est.
Figure 11. Fitted OCR and CPTu profiles: Treporti Test Site, Venice, Italy. 3.10 US-95 Sandcreek Byway Project, Sandpoint, Idaho,
USA
To study the pile response to axial loading for a proposed bridge foundation along the realigned US-95 highway, a static loading test was conducted on a steel pipe pile in Sandpoint, Northern Idaho, along the shores of Lake Pend Oreille. Published documents (e.g., Breckenridge & Sprenke 1997, and Fellenius et al. 2004) contain details of the geology and geotechnical properties evaluated at this site. The postglacial alluvial soil consists of 9 m thick sandy/silty layer above a 40 m thick slightly OC clay layer with many sandy silt and silty sand seams. Field explorations at this site include soil borings/sampling and CPTu soundings advanced beyond the clay layer. In addition to the index properties presented in Table 2, the su has been reported as increasing with depth within the range of 30–70 kPa. Forecasting of CPTu readings via SCE-CSSM expressions yield fairly good match with the measured profiles in the 40 m thick clay layer (see Figure 12). 4 SUMMARY AND CONCLUSIONS The hybrid SCE-CSSM model provides a logical framework for forecasting the CPTu profiles in clayey soils corresponding to constant volume. The concept was applied to twelve different sites with clay and silty clay as predominant geomaterials and which have been field tested using cone penetrometers. The overall results of the predictions compared to the measured CPTu response
0
20
40
60
80
0 0.2 0.4 0.6 0.8
Dep
th (m
)
Overburden stresses (MPa)
Effective overburden stress
Preconsol. via oedometer
Geologic prestress est.
0 1 2 3
OCR
Via oedometer
Geologic prestress est.
0 0.005 0.01 0.015
fst (MPa)
Measured fst
SCE-CSSM fst
0 1 2 3
u2 (MPa)
uo
Measured u2
SCE-CSSM u2
0
20
40
60
80
0 1 2 3
Dep
th (m
)
qt (MPa)
Measured qt
SCE-CSSM qt
Figure 12. Fitted OCR and CPTu profiles at US95 HW project, Sandpoint, Idaho, USA. lead to the following conclusions: 4.1 This model in its present form is adequate to
capture the general trend of CPTu readings in clayey soils from the well established information on the required parametric input.
4.2 The key parameters that play significant role in fitting models of CPTu readings via SCE-CSSM
concept are the stress history ( p', OCR, OCD) and
IR (derived from G and su). Other parameters: t, '
, Ko and ' appear to have relatively lesser significance in fitting of the model.
4.3 SCE-CSSM in its current form is inadequate to model CPTu readings for mixed soil types (e.g., silty/sandy clays), where partially drained conditions dominate.
REFERENCES Alves, A.M.L., Lopes, F.R., Randloph, M.F., & Danziger,
B.R. (2009). "Investigations on the dynamic behavior of small-strain diameter pile driven in soft clay." Can. Geotech. J. 46: 1418 – 1430.
Amini, A., Fellenius, B.H., Sabbagh, M., Naesgaard, E., and Buehler, M. (2008). "Pile loading tests at Golden Ears Bridge." 61
st Can. Geotech. Conf., Edmonton,
September 21-24, 8p. Atkinson, J.H., Lau, W.H.W., & Powell, J.J.M. (1989).
"Determination of soil stiffness parameters in stress path probing tests." Proc. 12
th ICSMFE, Rio, Brazil: 7–
10.

Benoit, J. (2000). "The United States National Geotechnical Experimentation Sites Program: The First Decade." National Geotechnical Experimentation Sites, GSP No. 93, eds.: Benoit, J. & Lutenegger, A.J., ASCE, Reston, Virginia: 1 – 25.
Breckenridge, R.M., & Sprenke, K.F. (1997). An overdeepened glaciated basin, Lake Pend Oreille, northern Idaho. Glacial Geology & Geomorphology, 3: 1 – 10.
Brown, M.J. (2004). The rapid load testing of piles in fine grained soils. Ph.D. Thesis, University of Sheffield, UK: 151 – 198.
Brown, M.J., Hyde, A.F.L., & Anderson, W.F. (2006). Analysis of a rapid load test on an instrumented bored pile in clay. Geotechnique 56 (9): 627 – 638.
Cola, S. & Simonini, P. (2002). Mechanical behaviour of silty soils of the Venice lagoon as a function of their grading properties. Can. Geotech. J., 39 (4): 879 – 893.
Cruz, I.R., Howie, J.A., Padros, G., Papanicolas, D., & Weemees, I.A. (2008). "An evaluation of pile load capacity estimates using CPTu and DMT methods in silty clay in High Prairie, Alberta." Proc. 61
st Can.
Geotech. Conf., Edmonton, Canada. Elbanna M., Hendry C., Sharp J., Woeller D., & Greig J.
(2007). "Axial pile capacity: predicted versus measured response in southern Alberta clay till." Proc. Can. Geotech. Conf., Ottawa.
Fellenius, B.H., Harris, D.E., & Anderson, D.G. (2004). "Static loading test on a 45 m long pipe pile in Sandpoint, Idaho." Can. Geotech. J. 41: 613 – 628.
Finno, R.J. (1989). "Subsurface conditions and pile installation data: 1989 foundation engineering congress test section." Proc. Prediction and Observed Axial Behavior of Piles, ASCE, Northwestern Univ., Evanston, 1 – 74.
Finno, R.J., Gassman, S.L., & Calvello, M. (2000). "The NGES at Northwestern University." Proc., National Geotechnical Experimentation Sites, GSP No. 95, ASCE, Reston, VA: 130 – 159.
Iskander, M., Roy, D., Kelley, S., & Ealy, C. (2003). "Drilled shaft defects: detection, and effects on capacity in varved clay." J. Geotech. & Geoenviron. Engrg., 129(12): 1128 – 1137.
Jamiolkowski, M., Ricceri, M., & Simonini, P. (2009). "Safeguarding Venice from high tides: site characterization and geotechnical problems." Proc. 17
th Intl Conf. on Soil Mech. and Geotech. Engrg., M.
Hamza et al. (ed.), IOS Press: 3209 – 3227. Kort, D. A. (2005). "Report on drilled pile load testing
(Osterberg method)." Test pile 1, Foothills Medical Center, Calgary, Alberta, Project LT-9121, prepared by Load Test Inc. for Golder Associates.
Lunne, T., Powell, J.J.M., Eidsmoen, T., & Quaterman, R.S.T. (1986). "Piezocone testing in overconsolidated clays." Proc. 39
th Can. Geotech. Conf., Ottawa: 209 –
218. Lutenegger, A.L. (2000). "National Geotechnical
Experimentation Site: University of Massachusetts." National Geotechnical Experimentation Sites, GSP No. 93, eds. Benoit, J. and Lutenegger, A.J., ASCE, Reston, Virginia: 102 – 129.
Lutenegger, A.J., & Miller, G.A. (1993). "Evaluation of dilatometer method to determine axial capacity of driven model pipe piles in clay." ASCE GSP No. 38, ASCE, New York, 41 – 63.
Mayne, P.W. (1991). "Determination of OCR in clays by piezocone tests using cavity expansion and critical state concepts." Soils and Foundations 31(1): 65–76.
Mayne, P.W. (1993). "In-situ determination of clay stress history by piezocone model." Predictive Soil Mechanics, Thomas Telford, London: 483 – 495.
Mayne, P.W. (2007). "Overview Paper: In-situ test calibrations for evaluating soil parameters", Characterisation & Engineering Properties of Natural Soils, Vol. 3, Taylor & Francis Group, London: 1601– 1652.
Mayne, P.W. & Woeller, D.J. (2008). "O-Cell response using elastic pile and seismic piezocone tests." Proc. 2
nd British Geotechnical Association Intl Conf. on
Foundations (ICOF 2008), Vol. 1, Dundee, IHS BRE Press, UK: 235 – 246.
Naesgaard, E., Azizian, A., Yang, D., Uthayakumar, M., Amini, A., & Byrne, P.M. (2008). "Golden Ears Bridge – Geotechnical seismic design aspects." Proc. 61
st
Can. Geotech. Conf., Edmonton, Sept. 21-24: 1002 – 1009.
Padros, G., & Papanicolas, D. (2008). "Compressive load tests on continuous flight auger piles in glaciolacustrine silty clay soils in High Prairie, Alberta." Proc. 61
st Can. Geotech. Conf., Edmonton,
Canada. Powell, J.J.M. & Butcher, A.P. (1991). "Assessment of
ground stiffness from field and laboratory tests." Proc. 10
th ECSMFE, Florence: 1: 153 – 156.
Powell, J.J.M. & Butcher, A.P. (2003). "Characterisation of a glacial till at Cowden, Humberside." Proc. International Workshop on Characterisation and Engineering Properties of Natural Soils, Balkema. Vol. 2: 983 – 1020.
Powell, J.J.M., Quarterman, R.S.T., & Lunne, T. (1988). "Interpretation and use of piezocones in UK clays." Proc. Conf. on Penetration testing in the UK, Birmingham, Thomas Telford: 151 – 156.
Simonini, P. (2004). "Characterization of the Venice lagoon silts from insitu tests and the performance of a test embankment." Keynote Lecture. ISC’02, Geotechnical and Geophysical Site Characterization, Porto, 1, Rotterdam Millpress: 187 – 207.
Sully, J.P. (1991). "Measurement of in-situ lateral stress during full-displacement penetration tests," Ph.D. thesis, University of British Columbia, Vancouver.
Vesic´, A.S. (1977). Design of pile foundations. NCHRP Synthesis 42, Transportation Research Board, National Research Council, Washington, D.C., 68p.