Embed Size (px)
Citation preview

CALIBRATING AUTOMATIC EXPOSURE CONTROL FOR DIGITAL RADIOGRAPHYDIGITAL RADIOGRAPHYA. Kyle Jones, Ph.D., DABRInstructorDepartment of Imaging PhysicsDepartment of Imaging PhysicsU.T. M. D. Anderson Cancer CenterHouston, TX

Introduction
AEC is an essential part of modern radiographic p g psystems
Consistent, reproducible exposuresC f d f fCompensation for a wide range of factorsPatient – size, anatomy imagedTechnical factors – kVp, time, desired receptor dosep, , p
Calibrations may need to be adjusted for digital receptors
Energy response
Film O.D. can no longer be used to verify calibrationcalibration
A. Kyle Jones, Ph.D. AAPM 2009

AEC System Diagramy g
Generator
AEC Controller
Backup
Terminate?
Reference Voltage‐3 ‐2 ‐1 0 +1 +2 +3
kVp
ComparatorAmplifier
Loosely based on Bushberg, Seibert, Leidholdt, and Boone, The Essential Physics of Medical Imaging.
Amplifier
A. Kyle Jones, Ph.D. AAPM 2009

Fundamental AEC performance pcharacteristics
Initial acceptance testingSensor selector/locationDensity correction
Ongoing QC testingAEC sensitivityDensity correction
Screen sensitivity adjustmentSensitivity vs. speed settingReproducibilityAEC balance/field sensitivity
kVp trackingPatient thickness trackingReproducibilityAEC balanceAEC balance/field sensitivity
matchingAEC sensitivityPatient thickness trackingkVp tracking
AEC balanceBackup timerMinimum response time
kVp trackingBeam quality correction curve
Backup timerCell mappingMinimum response time
AAPM 2008 – Extensive look at many fundamental performance characteristicsA. Kyle Jones, Ph.D. AAPM 2009

http://www.instablogsimages.com/images/2007/11/23/digital‐flat‐panel‐x‐ray‐detector_28.jpg
≠
A. Kyle Jones, Ph.D. AAPM 2009

kVp correctionp
Many existing AEC systems were Many existing AEC systems were calibrated for use with screen‐film systemsThe energy response of
d li i lfid (Gd O S) 1.00E+03
1.00E+04
CsIGd2O2SBaFBrI
gadolinium oxysulfide (Gd2O2S) screens is substantially different from that of image receptors used in digital radiography 1.00E+01
1.00E+02
Abs
orpt
ion
cros
s se
ctio
n (c
m2 /g
)
Thus, to properly expose digital radiographs, we must recalculate the kVp correction curve for our AEC systems to
1.00E-01
1.00E+00
0 20 40 60 80 100 120 140 160
Photon energy (keV)yrespond correctly considering the image receptor characteristics
A. Kyle Jones, Ph.D. AAPM 2009

kVp correction curves for DR
Doyle and Martin have calculated theoretical kVp correction curves for both CR and iDRfor both CR and iDRdetectorsAlso note that the addition of small amounts of Cu filt ti d t filtration does not significantly affect the calibration
Doyle, P and Martin, CJ, Calibrating automatic exposure control devices for digital radiography, Phys. Med. Biol. 51:5475‐5485, 2006. A. Kyle Jones, Ph.D. AAPM 2009

kVp Tracking Unit #1
600
700
800
100
120
300
400
500
Pixe
l val
ue
60
80 Noise/SNR
Pixel valueNoiseSNR
100
200
300P
20
40
R
060 70 80 90 100 110 120 130
kVp
0
A. Kyle Jones, Ph.D. AAPM 2009

kVp Tracking - Unit #2
225 80
215
220
60
70
200
205
210
Pix
el v
alue
30
40
50 Noise/SNR
Pixel valueNoiseSNR
185
190
195
0
10
20
18550 70 90 110 130
kVp
0
A. Kyle Jones, Ph.D. AAPM 2009

AEC Balance
Field sensitivity matchinge d se s t ty atc gTo achieve consistent exposures for all views, AEC cells should be balancedManufacturers of x‐ray systems use several different schemes for AEC balancingThus, a one‐size‐fits‐all test will not be valid if you work with a variety of systems
A. Kyle Jones, Ph.D. AAPM 2009

AEC Balance
Test AEC balance during acceptance testing to set a g p gbaseline standard for balanceAsk your service engineer about the calibration/balancing procedurecalibration/balancing procedure
Many manufacturers today use AEC systems that are not serviceable for balance – they can only be replacedIn this case you are stuck with manufacturer’s balance schemeIn this case you are stuck with manufacturer s balance schemeOther manufacturers still have tunable AEC cells
Pots in generatorSoftware interfacePots in detector housing
Published guidelines/recommendations± 5% across all combinations (AAPM 14)*± 5% across all combinations (AAPM 14)
A. Kyle Jones, Ph.D. AAPM 2009

AEC Balance
Cells must also be matched when used in combinations
AEC systems may terminate the exposure when the most sensitive cell reaches the required current, or may average the signal between the cells being usedthe signal between the cells being used
Same criteria apply
CC LL RR L+RL+R L+CL+C R+CR+C AllAll
Unit 1Unit 1 6.326.32 7.237.23 7.167.16 7.167.16 6.736.73 6.76.7 6.836.83
Unit 2Unit 2 46.646.6 69.969.9 70.470.4 69.969.9 55.755.7 55.955.9 59.859.8
Unit 3Unit 3 4.54.5 4.324.32 4.444.44 4.394.39 4.394.39 4.444.44 4.394.39
See also ‘X‐ray generator and automatic exposure control device acceptance testing’ by Raymond P. Rossi, M.S., in Specification, Acceptance Testing and Quality Control of Diagnostic X‐ray Imaging Equipment, Proceedings of the 1991 AAPM Summer School A. Kyle Jones, Ph.D. AAPM 2009

AEC SENSITIVITY

Methods for calibration
Noise‐based methodNoise‐based methodKa‐based methods
Use a CR cassette with a cutout for a detectorcutout for a detectorSolid‐state detector behind gridPre‐detector Ka and primary
i i h h id*transmission through grid*
Exposure indicator (EI) –based methods
EIEIPixel value
Characteristic functionSNR
Doyle, P and Martin, CJ, Calibrating automatic exposure control devices for digital radiography, Phys. Med. Biol. 51:5475‐5485, 2006.
SNR
A. Kyle Jones, Ph.D. AAPM 2009

Noise‐based AEC calibration
For each kVp, an S number can be associated with p,the standard deviation of pixel values that produce the desired noise characteristicsRecommend use of an SNR‐based threshold for Recommend use of an SNR‐based threshold for choosing noise level
Example: SNRthreshold of 5 → Signal difference of 50 can be seen with σ = 10seen with σ = 10Still some determination to be done
Setting up AEC in Semi‐automatic EDR mode yields clinically valid results in Automatic EDR mode
Christodoulou, EG, Goodsitt, MG, Chan, H, and Hepburn, T, Phototimer setup for CR imaging, Med. Phys. 27:2652‐2658, 2000.
A. Kyle Jones, Ph.D. AAPM 2009

Ka‐based methodsa
CR cassette with cutout*CR cassette with cutoutS ~ 200/E, E = exposure (mR) for Fuji CRCutout machined into IP cassette to accept Cutout machined into IP cassette to accept solid state dosimeter
Introduces realistic scatter* from cassette Introduces realistic scatter* from cassette, overcomes cassette sensing
Doyle P, Gentle D, Martin CJ, Optimising automatic exposure gcontrol in computed radiography and the impact on patient dose, Rad. Prot. Dosim. 114:236‐39, 2005.
A. Kyle Jones, Ph.D. AAPM 2009

Ka‐based methodsa
Solid‐state dosimeter with lead backing can be used to reduce the effect of backscatterNot possible for all DR systems
http://www.unfors.com/products.php?catid=168http://www.rpi.edu/dept/radsafe/public_html/RADIATION%20DETECTORS_files/MOSFET.jpg
Doyle P, and Martin CJ, Calibrating automatic exopsure control devices for digital radiography, Phys. Med. Biol. 51:5475‐85, 2006.
A. Kyle Jones, Ph.D. AAPM 2009

Pre‐detector Kaa
Simple measurement to makeSimple measurement to makeEliminates backscatterNecessitates measurement of T or B of antiNecessitates measurement of Tp or B of anti‐scatter gridSome inacc rac introd ced d e to beam Some inaccuracy introduced due to beam hardening by grid which is not considered in this measurementthis measurement
A. Kyle Jones, Ph.D. AAPM 2009

EI‐based
Calibrate using the EI provided by the g p ymanufacturerMany caveats to consider
Calibration conditionsAECDetectorDetectorEI
PracticalityUsefulness of EI
Basically the same as Ka‐based methodsDependence of EI on beam conditions grid etcDependence of EI on beam conditions, grid, etc.
A. Kyle Jones, Ph.D. AAPM 2009

Three different methods…
GE Si F jiGEVariable PMMA
Siemens0.6 mm Cu filter to
Fuji80 kVp bare beam to PMMA
thickness (vs kVp) to
lib t EI
filter to calibrate AEC, EI, and detector
calibrate EIWe use 0.5 mm Cu + 1 calibrate EI
20 mm Al phantom to
detector70 kVp
mm Cu + 1 mm AlThey don’t calibrate the p
calibrate AEC and detector8 kV
calibrate the AEC for retrofitted systems80 kVp systems
A. Kyle Jones, Ph.D. AAPM 2009

To what value should I calibrate?
CR –Calibrate AEC to deliver the desired Ka at the image plane
Vary Ka by body part and view using exposure indicator targetsE g S 200 general S 100 extremityE.g. S = 200 general, S = 100 extremity
DR – Calibrate AEC to manufacturer’s specificationsspecifications
E.g. 2.5 µGy@ 400 sensitivity settingUse sensitivity setting to vary Ka by body part and y g y a y y pview
A. Kyle Jones, Ph.D. AAPM 2009
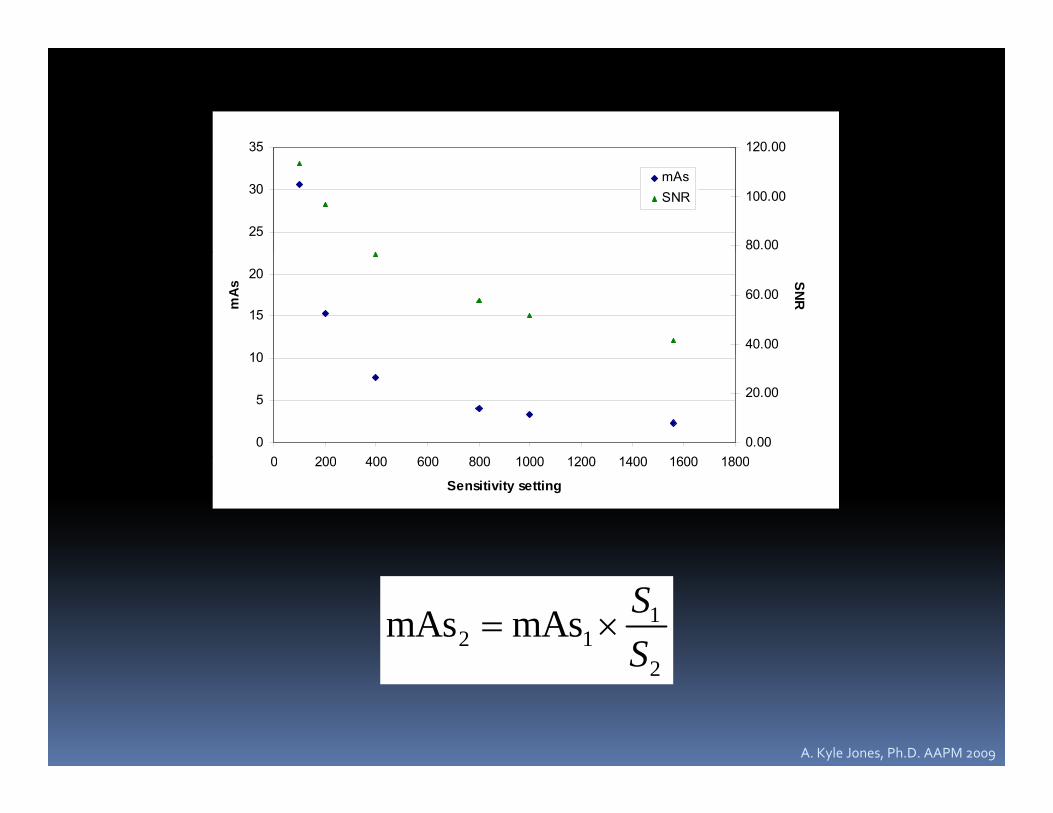
35 120.00
25
30
35
80.00
100.00
120.00
mAsSNR
10
15
20
mA
s
40.00
60.00
SNR
0
5
10
0 200 400 600 800 1000 1200 1400 1600 18000.00
20.00
0 200 400 600 800 1000 1200 1400 1600 1800
Sensitivity setting
12 1
2
mAs mAs SS
= ×2S
A. Kyle Jones, Ph.D. AAPM 2009

SNR vs. Sensitivity setting
120.00
80 00
100.00PMMAAluminum
60.00
80.00
SNR
20.00
40.00
0.000 200 400 600 800 1000 1200 1400 1600
Sensitivity
A. Kyle Jones, Ph.D. AAPM 2009

CR
Test tool (e g Radchex) SimplestTest tool (e.g. Radchex)CR plate, Sensitivity (semi‐EDR), calibrated reader (use EI)
p
calibrated reader (use EI)Measure X or Ka at detector planeplane
Most Complex
A. Kyle Jones, Ph.D. AAPM 2009
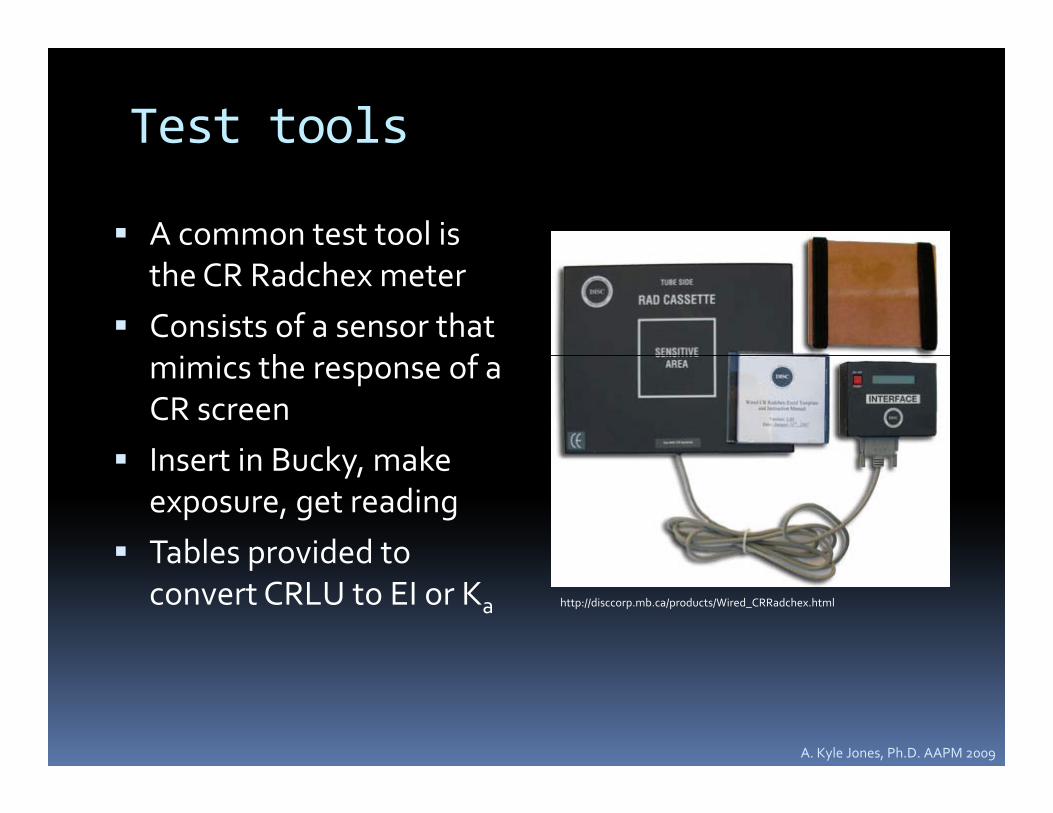
Test tools
A common test tool is the CR Radchex meterConsists of a sensor that
h fmimics the response of a CR screenInsert in Bucky make Insert in Bucky, make exposure, get readingTables provided to Tables provided to convert CRLU to EI or Ka http://disccorp.mb.ca/products/Wired_CRRadchex.html
A. Kyle Jones, Ph.D. AAPM 2009

Radchex meter
Pros ConsFastDoes not require plate or
d
May not exactly simulate response of CR plateM l i l reader
EasyDefeats cassette sensing
May not exactly simulate clinical situationExpensiveDefeats cassette sensing pLack of patient‐like attenuatorTransmitted spectrum Transmitted spectrum through 1.5 mm Cu –CRLU to EI conversion may not be correctmay not be correct
A. Kyle Jones, Ph.D. AAPM 2009

A. Kyle Jones, Ph.D. AAPM 2009

A. Kyle Jones, Ph.D. AAPM 2009

A. Kyle Jones, Ph.D. AAPM 2009

A. Kyle Jones, Ph.D. AAPM 2009

CR plate and readerp
Use a patient‐equivalent attenuator and Use a patient equivalent attenuator and expose a CR plate in the Bucky
‘Test’ plate confirmed to be uniform with clinical Test plate confirmed to be uniform with clinical stockReader calibration must be verified
Exposure indicator is the test quantity‘Test’ mode – e.g. Sensitivity, Semi‐EDRg y,
A. Kyle Jones, Ph.D. AAPM 2009

A. Kyle Jones, Ph.D. AAPM 2009

CR plate and readerp
Pros ConsCheapSimple if reader
Reader must be calibratedSimple if reader
calibration is known to be good
Takes more time than Radchex meter
Exactly simulates response of CR plate
Multiplied with more exposuresWait period
Simulates clinical situationDefeats cassette sensing
Wait period
Defeats cassette sensing
A. Kyle Jones, Ph.D. AAPM 2009

A. Kyle Jones, Ph.D. AAPM 2009
A. Kyle Jones, Ph.D. AAPM 2009

Measure Kaa
Use ionization chamber in Bucky to measure Use o at o c a be uc y to easu eKa
Doyle et al. proposed that an old cassette be y p pmodified to hold a solid state device to more accurately simulate the clinical caseA solid state dosimeter can also be used
Behind AEC chambersPb b k d l b k tt Pb‐backed, so less backscatter concernDoes not integrate scatter from 2π in front
Still helpful to “mount” to keep centeredStill helpful to mount to keep centeredDoyle P, Gentle D, Martin CJ, Optimising automatic exposure control in computed radiography and the impact on patient dose, Rad.Prot. Dosim. 114:236‐39, 2005.
A. Kyle Jones, Ph.D. AAPM 2009

Measure Kaa
Pros ConsCheap†Accurately simulates
Does not simulate response of CR plate*Accurately simulates
clinical situationDirect measurement of
response of CR plateTime consuming
SetupDirect measurement of Ka
Independent
p
Requires additional equipment (modified Independent
verification – does not rely on plates or reader
q pcassette)
A. Kyle Jones, Ph.D. AAPM 2009

A. Kyle Jones, Ph.D. AAPM 2009

Comparison of methodsp
Scenario mAs S# µGy CRLU/Speed #
CR cassette w/screen 72.5 196 8.53
CR cassette w/o screen 86.1
15 cc chamber in wood 78 7 11 3915 cc chamber in wood 78.7 11.39
15 cc chamber in wood w/Pb 73.4 13.74
Nothing in Bucky 87.7
Unfors Xi 91.1 9.95
Radchex w/PMMA* 82.2 11.5 15.7/127
Radchex w/1.5 mm Cu* 22.4 11.6 18.6/107
Target Ka in Bucky at detector plane = 8.76 µGy
8.76 µGy to plate under calibration conditions (0.5 Cu/1 Al) yielded S# of 191
A. Kyle Jones, Ph.D. AAPM 2009

iDR and dDR
Use exposure indicator to determine SimplestpKa
Must verify accuracy of indicatorTG 116
p
TG 116Measure pre‐detector Ka and calculate Ka at detector plane
N d t k T f idNeed to know TP of gridDepends on calibration conditions
Measure Ka at detector planea pMeasure CF for clinical conditions and use it to calculate Ka
Most Complex
A. Kyle Jones, Ph.D. AAPM 2009

Ideallyy
Verify EI at calibration conditions and use the EI yto calibrate the AECManufacturer methods
GE: 2 5 µGy to detector @ 400 sensitivity measured GE: 2.5 µGy to detector @ 400 sensitivity, measured, factors applied for distance and table/coverWithout grid if removable“Grid factor” used for dedicated chest systemsGrid factor used for dedicated chest systems20 mm Al phantom, 80 kVp
Unfortunately, EI conditions are differentSiemens Detector dose 1000/SensitivitySiemens: Detector dose = 1000/Sensitivity2.5 µGy@ 400 sensitivity, no grid, 70 kVpEI conditions are the same
A. Kyle Jones, Ph.D. AAPM 2009

VERIFYING THE EI

A. Kyle Jones, Ph.D. AAPM 2009

A. Kyle Jones, Ph.D. AAPM 2009

A. Kyle Jones, Ph.D. AAPM 2009

GE Siemens
A. Kyle Jones, Ph.D. AAPM 2009

Technical modeA. Kyle Jones, Ph.D. AAPM 2009

A. Kyle Jones, Ph.D. AAPM 2009

GE EI verification
UDExp CDExpMeasured
Post‐grid Post‐gridScenario
UDExp(µGy)
CDExp(µGy)
DEI pre‐grid (µGy)
Post grid (Tp) (µGy)
Post grid(B) (µGy)
70 kVp id
4.95 5.59 1.32 5.53 5.53no grid
4 95 5 59 3 5 53 5 53
80 kVpno grid
5.84 5.84 1.46 5.48 5.48
kV90 kVpno grid
5.07 4.74 1.21 4.46 4.46
70 kVpgrid
4.28 3.41 1.45 8.86 4.34grid
80 kVpgrid
3.21 2.23 1.00 5.48 2.74 1.69
90 kVp90 kVpgrid
2.82 1.91 0.82 4.46 2.19
A. Kyle Jones, Ph.D. AAPM 2009

Siemens EI verification
Calculated from Measured pre‐ Post‐grid (T ) Scenario EXI
Calculated fromEXI (µGy)
Measured pregrid (µGy)
Post grid (Tp) (µGy)
60 kVp no grid
354 2.24 2.24g
70 kVpno grid
401 2.65 2.20 2.20
81 kVp no 6
8 p ogrid
496 2.27 2.27
60 kVp grid 358 4.28 2.77
70 kVp grid 389 2 57 4 18 2 7470 kVp grid 389 2.57 4.18 2.74
81 kVp grid 439 4.52 3.00
A. Kyle Jones, Ph.D. AAPM 2009

Effect of table or cover
Attenuation by the table may be significantAttenuation by the table may be significantManufacturer 1: 0.80 to 0.82 from 60 – 81 kVpManufacturer 2: 0.91 at 80 kVpManufacturer 2: 0.91 at 80 kVp
Detector covers had very little influence
A. Kyle Jones, Ph.D. AAPM 2009

Other considerations
Measuring Ka at detector plane may not be g a p ypossibleRemoval of the anti‐scatter grid may alter AEC responseresponseExposure indicator is usually providedWould like to verify it’s performance under y pcalibration conditions (hopefully the same as AEC conditions) and with presence of grid
kVp correction – if EI is correct under calibration kVp correction if EI is correct under calibration conditions for AEC, rely on kVp correction/SNR tracking instead of worrying about EI and kVpdependencep
A. Kyle Jones, Ph.D. AAPM 2009

Clinical simulation
8” PMMA phantomp10 x 10 in field size at tabletopAEC, center cell,GE: 80 kVpSiemens : 70 kVp
mAs UDExp (µGy) CDExp (µGy) DEI
11 29 3 53 2 45 1 111.29 3.53 2.45 1.1
mAs EXI Calculated (µGy)
27.76 284 1.88
A. Kyle Jones, Ph.D. AAPM 2009

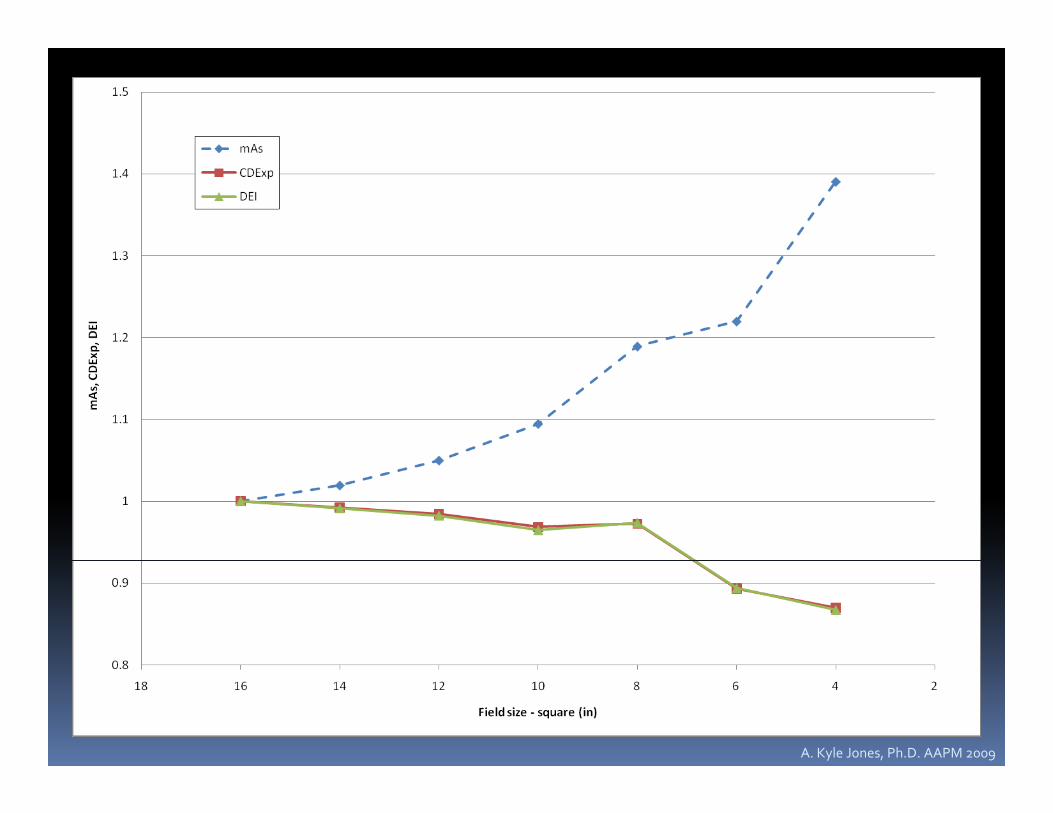
Other questionsq
Dependence of AEC calibration on field sizeDependence of AEC calibration on field sizeBatch‐to‐batch PMMA variation
A. Kyle Jones, Ph.D. AAPM 2009
A. Kyle Jones, Ph.D. AAPM 2009

A. Kyle Jones, Ph.D. AAPM 2009

Batch‐to‐batch PMMA
I tested two different batches of PMMA and I tested two different batches of PMMA, and found:
3% variation in mAs3% variation in mAs1% variation in EI
n=1, variation in batches/sources of PMMA n 1, variation in batches/sources of PMMA was not a concern
A. Kyle Jones, Ph.D. AAPM 2009

OneOne
http://www.toolandtechnology.com/images/vernier%20calipers.jpg
A. Kyle Jones, Ph.D. AAPM 2009

HugeHuge
learnwithmst.wordpress.com
A. Kyle Jones, Ph.D. AAPM 2009

ProblemProblem
http://www.ricardodiaz.com/wp‐content/uploads/2009/01/axe.jpg
A. Kyle Jones, Ph.D. AAPM 2009

Image receptor doseg p
Relatively simple task with screen/film imaging –y p g gachieve O.D. in linear portion of H+D curveDigital imaging is not contrast‐limited, but noise limitedlimitedHow can you set up your AEC system to deliver the desired amount of noise in an image?AEC system must be calibrated to deliver the desired Ka to the image receptorFundamental difference from S/F: Wide range of Fundamental difference from S/F: Wide range of Ka will yield usable images, must decide on acceptable noise level in images
A. Kyle Jones, Ph.D. AAPM 2009

Rong XJ, Shaw CC, Liu X, Lemacks MR, Thompson SK, Rong XJ, Shaw CC, Liu X, Lemacks MR, Thompson SK, Comparison of an amorphous silicon/cesium iodide flat‐panel digital chest radiography system with screen/film and computed radiography systems —A contrast‐detail h d M d Ph 8( ) 8 phantom study, Med. Phys. 28(11):2328‐35, 2001.
Use of scored images of contrast‐detail phantom (CDRAD) under clinical image processing conditions to attempt to determine detector exposure
i d t hi i il d t t bilit f ll l t t t trequired to achieve similar detectability for small low‐contrast targets
Conclusion: 0.43 mR required to achieve similar LCD for 0.5 mm object compared to 2.09 mR for the same screen‐film image (21%)
A. Kyle Jones, Ph.D. AAPM 2009

Huda W, Slone RM, Belden CJ, Williams JL, Cumming WA, Palmer CK, Huda W, Slone RM, Belden CJ, Williams JL, Cumming WA, Palmer CK, Mottle on computed radiographs of the chest in pediatric patients, Med. Phys. 199:242‐252, 1996.
Use of a rating system based on degrees of mottle to determine what sensitivity number of a Fuji AC series would be needed to match the mottle in a 600‐speed s/f system, then use the actual sensitivity numbers
d t CR t /fmeasured to compare CR to s/f.
Conclusion: To achieve comparable mottle to 600‐speed s/f system a two‐fold p p yincrease in exposure is needed as compared to mean sensitivity number. An exposure consistent with a 200‐speed s/f system would be needed to achieve negligible mottle.
A. Kyle Jones, Ph.D. AAPM 2009

Liu X and Shaw, CC, Liu X and Shaw, CC, a‐Si:H/CsI(Tl) flat‐panel versus computed radiography for chest imaging applications: image quality metrics measurement, Med. Phys. 31(1):98‐110, 2004.3 ( ) 9 , 4
Compare indirect digital radiography and cassette‐based digital radiography systems in terms of fundamental image quality metrics.
Conclusion: Indirect digital radiography detector has significantly higher DQE g g p y g y gand lower NPS than cassette‐based digital radiography (CR) detector. The magnitude of the differences is illustrated in the graphs from the manuscript.
A. Kyle Jones, Ph.D. AAPM 2009

Give radiologists a visual idea of what the impact of dose to the image i i li h d dreceptor is on image quality – CDRAD phantom exposed under PMMA
Can also be done with other phantoms –ACR R/F phantom, anthropomorphic phantom, or even add noise to a patient image for comparison
A. Kyle Jones, Ph.D. AAPM 2009

Caveats
Image processing has a large impact on noise Image processing has a large impact on noise (low‐contrast detectability) and high‐contrast resolution, and thus AEC sensitivity should be , yconfigured with this in mind.Also, pixel size has an impact on noise in Also, pixel size has an impact on noise in images – this is especially important for digital receptors where pixel size is variable, g p p ,such as PSP systems
A. Kyle Jones, Ph.D. AAPM 2009
Conclusions or
Several methods can be used for AEC sensitivity ycalibrationOther AEC performance characteristics should be monitored and evaluatedbe monitored and evaluatedExposure conditions have a tremendous impact on AEC sensitivity calibrationClinical exposures are made using clinical exposure conditions
GridGridScatterField size
A. Kyle Jones, Ph.D. AAPM 2009

Questions left unansweredQ
How does one decide what dose to the o does o e dec de at dose to t ereceptor is needed?How does one evaluate the impact of pincreased or reduced detector dose?
Dose – fairly easyImage quality – hardClinical images – anatomical noiseImage processingImage processingNot round objects and nice orderly line pairsThis is a really hard question
A. Kyle Jones, Ph.D. AAPM 2009