Embed Size (px)
Citation preview
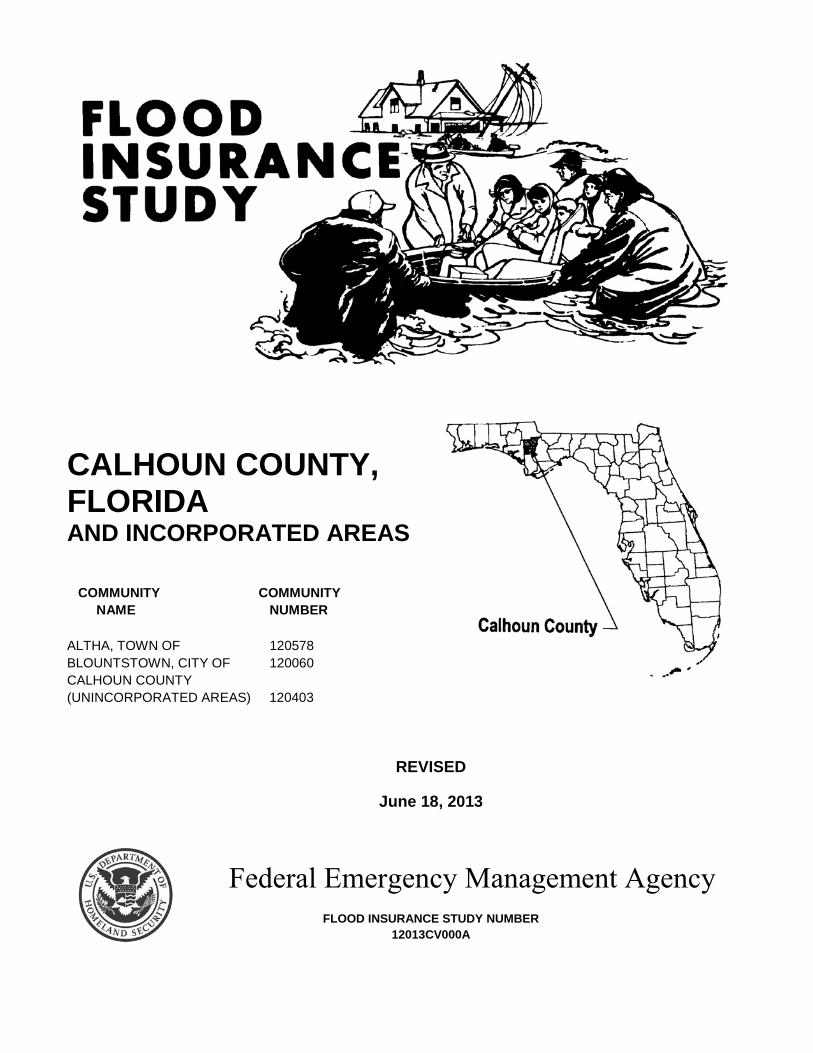
CALHOUN COUNTY, FLORIDA AND INCORPORATED AREAS COMMUNITY COMMUNITY NAME NUMBER ALTHA, TOWN OF 120578 BLOUNTSTOWN, CITY OF 120060 CALHOUN COUNTY (UNINCORPORATED AREAS) 120403
REVISED
June 18, 2013
Federal Emergency Management Agency FLOOD INSURANCE STUDY NUMBER
12013CV000A

NOTICE TO FLOOD INSURANCE STUDY USERS
Communities participating in the National Flood Insurance Program (NFIP) have established repositories of flood hazard data for floodplain management and flood insurance purposes. This Flood Insurance Study (FIS) may not contain all data available within the repository. It is advisable to contact the community repository for any additional data. Part or all of this FIS may be revised and republished at any time. In addition, part of this FIS may be revised by the Letter of Map Revision process, which does not involve republication or redistribution of the FIS. It is, therefore, the responsibility of the user to consult with community officials and to check the community repository to obtain the most current FIS components. Initial Countywide FIS Effective Date: June 18, 1987 Revised Countywide FIS Dates: December 6, 2000 June 18, 2013

i
TABLE OF CONTENTS
Page
1.0 INTRODUCTION ...............................................................................................................1 1.1 Purpose of Study ......................................................................................................1 1.2 Authority and Acknowledgments ............................................................................1 1.3 Coordination ............................................................................................................2
2.0 AREA STUDIED.................................................................................................................3
2.1 Scope of Study .........................................................................................................3 2.2 Community Description ...........................................................................................6 2.3 Principal Flood Problems .........................................................................................6 2.4 Flood Protection Measures ......................................................................................6
3.0 ENGINEERING METHODS ..............................................................................................6
3.1 Hydrologic Analyses ................................................................................................7 3.2 Hydraulic Analyses ................................................................................................15 3.3 Vertical Datum .......................................................................................................19
4.0 FLOODPLAIN MANAGEMENT APPLICATIONS .......................................................20
4.1 Floodplain Boundaries ...........................................................................................20 4.2 Floodways ..............................................................................................................21
5.0 INSURANCE APPLICATIONS .......................................................................................24 6.0 FLOOD INSURANCE RATE MAP .................................................................................26 7.0 OTHER STUDIES .............................................................................................................26 8.0 LOCATION OF DATA .....................................................................................................28 9.0 BIBLIOGRAPHY AND REFERENCES ..........................................................................29

ii
TABLE OF CONTENTS - continued
Page FIGURES Figure 1 - Floodway Schematic .......................................................................................................... 24 TABLES Table 1 - Scope of Revision .................................................................................................................. 3 Table 2 - Summary of Discharges ........................................................................................................ 8 Table 3 - Floodway Data ..................................................................................................................... 23 Table 4 - Community Map History .................................................................................................... 27
APPENDICES
Appendix A Calhoun County Limited Detail Studies - Water Surface Elevations
EXHIBITS Exhibit 1 - Flood Profiles Apalachicola River Panels 01P-11P Chipola River Panels 12P-18P Sutton Creek Panel 19P Exhibit 2 - Flood Insurance Rate Map Index Flood Insurance Rate Map

1
FLOOD INSURANCE STUDY CALHOUN COUNTY, FLORIDA AND INCORPORATED AREAS
1.0 INTRODUCTION
1.1 Purpose of Study
This countywide Flood Insurance Study (FIS) revises and updates a previous countywide FIS/Flood Insurance Rate Map (FIRM) for the geographic area of Calhoun County, Florida, including the Town of Altha, City of Blountstown, and the Unincorporated Areas of Calhoun County (hereinafter referred to as Calhoun County). This FIS aids in the administration of the National Flood Insurance Act of 1968 and the Flood Disaster Protection Act of 1973. This study has developed flood risk data for various areas of the community that will be used to establish actuarial flood insurance rates. This information will also be used by Calhoun County to update existing floodplain regulations as part of the Regular Phase of the National Flood Insurance Program (NFIP), and will also be used by local and regional planners to further promote sound land use and floodplain development. Minimum floodplain management requirements for participation in the NFIP are set forth in the Code of Federal Regulations at 44 CFR, 60.3. In some states or communities, floodplain management criteria or regulations may exist that are more restrictive or comprehensive than the minimum Federal requirements. In such cases, the more restrictive criteria take precedence and the state (or other jurisdictional agency) will be able to explain them.
1.2 Authority and Acknowledgments The sources of authority for this FIS are the National Flood Insurance Act of 1968 and the Flood Disaster Protection Act of 1973.
This FIS was prepared to include all jurisdictions within Calhoun County in a countywide FIS. For the original June 18, 1987, countywide FIS, the hydrologic and hydraulic analyses were prepared by the U.S. Geological Survey (USGS) for the Federal Emergency Management Agency (FEMA) under Inter-Agency Agreement No. EMW-85-E-1823, Project Order No. 12. That work was completed in November 1985. The hydrologic and hydraulic analyses for portions of Sutton Creek were taken from the previously printed City of Blountstown FIS (FEMA, 1979 and 1980).

2
For the December 6, 2000 revision, the revised hydrologic and hydraulic analyses for the Apalachicola River were taken from the unincorporated areas of Liberty County FIS (FEMA, 1991). The Chipola River hydrologic and hydraulic analyses were obtained from a report prepared for Calhoun County by Preble-Rish Consulting Engineers, while a portion of the Chipola River was revised to incorporate data taken from the Jackson County, Florida and Incorporated Areas FIS (Preble-Rish Consulting Engineers, 1998 and FEMA, 1990). For this countywide FIS revision, additional hydrologic and hydraulic analyses were prepared for FEMA by URS Corporation under contract with the Northwest Florida Water Management District (NWFWMD), a FEMA Cooperating Technical Partner (CTP). Floodplains for all of the detailed and limited detailed studies, including unrevised streams, have been redelineated using updated topographic data provided to FEMA as part of this revision. This work was performed for FEMA by URS Corporation. The digital base map files were derived from Florida Department of Revenue photography, dated 2007, produced at a scale of 1:200. The coordinate system used for the production of the digital FIRM is State Plane in the Florida “HARN” North projection zone, referenced to the North American Datum of 1983.
1.3 Coordination Consultation Coordination Officer’s (CCO) meetings may be held for each jurisdiction in this countywide FIS. An initial CCO meeting is held typically with representatives of FEMA, the community, and the Study Contractor to explain the nature and purpose of a FIS, and to identify the streams to be studied by detailed methods. A final CCO meeting is held typically with representatives of FEMA, the community, and the Study Contractor to review the results of the study. For the June 18, 1987 countywide FIS, a final CCO meeting was held on July 21, 1986, and was attended by representatives of the county, the USGS, and FEMA. For the December 6, 2000 revision, the county was notified by letter on January 26, 1998, that its FIS would be revised using the analyses previously mentioned. For this countywide FIS revision, an initial CCO (Scoping) meeting was held on March 19, 2008 and was attended by representatives of the Study Contractor, the communities, NWFWMD, and FEMA. A final CCO meeting was held on November 5, 2009.

3
2.0 AREA STUDIED
2.1 Scope of Study This FIS covers the geographic area of Calhoun County, Florida. For the June 18, 1987 countywide FIS, flooding caused by overflow of portions of the Apalachicola River was studied in detail. The December 6, 2000 revision incorporated the detailed restudies of the Apalachicola River for its entire length within the county, and the Chipola River from the aforementioned FISs. Sutton Creek has been revised from South Mayhem Drive to Sherry Drive to reflect backwater effects from the detailed restudy of the Apalachicola River. This revision also includes new detailed analyses of portions of the Chipola River, from the northern county boundary to a point approximately 2.7 miles downstream of State Route (SR) 274. The communities affected by the revised analyses were the City of Blountstown and the unincorporated areas of Calhoun County. For this countywide FIS revision, new or revised limited detail hydrologic and hydraulic analyses were included for the flooding sources shown in Table 1, “Scope of Revision.”
TABLE 1 - SCOPE OF REVISION
Stream
Limits of New or Revised Limited Detailed Study
Apalachicola River From Franklin County Boundary to Gadsden County Boundary.
Chinkapin Branch From the confluence with Fourmile Creek upstream 0.36 miles.
Ditch Pond Branch From the confluence with Fourmile Creek upstream 0.32 miles.
Fourmile Creek From the confluence with Chipola River upstream 18.79 miles.
Fourmile Creek Unnamed Tributary 1
From the confluence with Fourmile Creek upstream 0.46 miles.
Fourmile Creek Unnamed Tributary 2
From the confluence with Fourmile Creek upstream 0.28 miles.
Fourmile Creek Unnamed Tributary 3
From the confluence with Fourmile Creek upstream 1.33 miles.
Holliman Branch From confluence with the Chipola River upstream 2.82 miles near the Town of Altha, Florida.

4
TABLE 1 - SCOPE OF REVISION (cont.)
Stream
Limits of New or Revised Limited Detailed Study
Hollis Branch From confluence with the Chipola River upstream 2.89 miles near the Town of Altha, Florida.
Jack Creek From the confluence with Tenmile Creek upstream 1.26 miles.
Jack Creek Unnamed Tributary
From the confluence with Jack Creek upstream 0.58 miles.
Juniper Creek From confluence with the Chipola River upstream 22.88 miles southwest of the Town of Altha, Florida.
Mayo Mill Branch From the confluence with Tenmile Creek upstream 5.89 miles.
Mossy Pond Branch From the confluence with Fourmile Creek upstream 0.38 miles.
Panther Branch From the confluence with Fourmile Creek upstream 0.41 miles.
Pippin Branch From the confluence with Tenmile Creek upstream 0.81 miles.
Reedy Creek From confluence with the Sutton Creek upstream 2.62 miles near the City of Blountstown, Florida.
Ring Jaw Branch From confluence with the Chipola River upstream 2.85 miles near the Town of Altha, Florida.
Sutton Creek From Northwest 11th Street upstream 4.73 miles near Lake Hilda and the City of Blountstown, Florida.
Taylor Branch From the confluence with Fourmile Creek upstream 0.39 miles.
Tenmile Creek From the confluence with Chipola River upstream 18.69 miles.
Tenmile Creek Unnamed Tributary 1
From the confluence with Tenmile Creek upstream 1.94 miles.
Tenmile Creek Unnamed Tributary 2
From the confluence with Tenmile Creek upstream 2.19 miles.
Tenmile Creek Unnamed Tributary 3
From the confluence with Tenmile Creek upstream 0.76 miles.

5
TABLE 1 - SCOPE OF REVISION (cont.)
Stream
Limits of New or Revised Limited Detailed Study
Tenmile Creek Unnamed Tributary 4
From the confluence with Tenmile Creek upstream 1.10 miles.
Tenmile Creek Unnamed Tributary 5
From the confluence with Tenmile Creek upstream 1.01 miles.
Tenmile Creek Unnamed Tributary 6
From the confluence with Tenmile Creek upstream 2.21 miles.
Tenmile Creek Unnamed Tributary 7
From the confluence with Tenmile Creek upstream 1.45 miles.
Unnamed Tributary to Tenmile Creek Unnamed Tributary 2
From the confluence with Tenmile Creek Unnamed Tributary 2 upstream 0.61 miles.
Unnamed Tributary to Tenmile Creek Unnamed Tributary 6
From the confluence with Tenmile Creek Unnamed Tributary 6 upstream 0.53 miles.
Watson Branch From the confluence with Fourmile Creek upstream 0.31 miles.
Whitewater Creek From the confluence with Tenmile Creek upstream 5.28 miles.
Whitewater Creek Unnamed Tributary 1
From the confluence with Whitewater Creek upstream 0.47 miles.
Whitewater Creek Unnamed Tributary 2
From the confluence with Whitewater Creek upstream 1.48 miles.
Whitewater Creek Unnamed Tributary 3
From the confluence with Whitewater Creek upstream 2.07 miles.
Whitewater Creek Unnamed Tributary 4
From the confluence with Whitewater Creek upstream 0.25 miles.
Limits of detailed study are indicated on the Flood Profiles (Exhibit 1) and on the FIRM (Exhibit 2). The areas studied by detailed or limited detail methods were selected with priority given to all known flood hazard areas and areas of projected development and proposed construction. Numerous streams were studied by approximate methods. Approximate analyses were used to study those areas having a low development potential or minimal flood hazards. The scope and methods of study were proposed to, and agreed upon by FEMA, NWFWMD, and Calhoun County.

6
2.2 Community Description Calhoun County is located in northwestern Florida and occupies 568 square miles. Calhoun County is bounded by Liberty County and the Apalachicola River on the east, Gulf County on the south, Bay County on the west, and Jackson County on the north. The county is served by SR 20 and SR 69. The 2011 population estimate for the county was reported to be 14,750 (U.S. Census Bureau, 2012).
2.3 Principal Flood Problems The largest flood recorded at the U.S. Army Corps of Engineers (USACE) stream gaging station No. 02358700, the Apalachicola River near Blountstown, occurred on July 10, 1994, with a maximum elevation of 53.71 feet North American Vertical Datum of 1988 (NAVD88) and a peak discharge of 209,000 cubic feet per second (cfs). This flood had a recurrence interval of 21 years. Prior to the 1957 installation of the USACE stream gaging station, the highest known elevation since at least 1920 was 55.10 feet NAVD88 on March 21, 1929. Flooding within the corporate limits of Blountstown occurs in many areas due to poor drainage systems and inadequate road culverts and outlets.
2.4 Flood Protection Measures Calhoun County has no existing flood protection measures. However, the flow of the Apalachicola River is regulated to some extent by the Jim Woodruff Dam, completed in 1957 and located about 30 miles upstream in the City of Chattahoochee, Florida.
3.0 ENGINEERING METHODS
For the flooding sources studied in detail in the county, standard hydrologic and hydraulic study methods were used to determine the flood hazard data required for this FIS. Flood events of a magnitude which are expected to be equaled or exceeded once on the average during any 10-, 50-, 100-, or 500-year period (recurrence interval) have been selected as having special significance for floodplain management and for flood insurance rates. These events, commonly termed the 10-, 50-, 100-, and 500-year floods, have a 10, 2, 1, and 0.2 percent chance, respectively, of being equaled or exceeded during any year. Although the recurrence interval represents the long-term average period between floods of a specific magnitude, rare floods could occur at short intervals or even within the same year. The risk of experiencing a rare flood increases when periods greater than 1 year are considered. For example, the risk of having a flood that equals or exceeds the 100-year flood (1 percent chance of annual exceedance) in any 50-year period is approximately 40 percent (4 in 10), and, for any 90-year period, the risk increases to approximately 60 percent (6 in 10). The analyses reported herein reflect flooding potentials based on conditions existing in the county at the time of completion of this FIS. Maps and flood elevations will be amended periodically to reflect future changes.
7
3.1 Hydrologic Analyses Hydrologic analyses were carried out to establish the peak discharge-frequency relationships for each flooding source studied in detail affecting the county. June 18, 1987 Countywide FIS Discharges for the Apalachicola River were determined by the USACE stream gage No. 02358700, 500 feet upstream of Neal’s Landing. The gage site was established as a continuous recording station on August 2, 1957, and was upgraded in July 1974. Stream flow records are not available for Sutton Creek. In order to develop discharge frequency data, it was necessary to transpose data from three nearby gaged streams that had similar characteristics of soil, slope, land use, and size. The three gages and their lengths of record are as follows: No. 02359300 on Sandy Creek near Panama City, 1961-1975; No. 02330200 on the New River near Vilas, 1961-1975; and No. 02359550 on Bear Creek near Youngstown, 1962-1975. Discharge frequency data for these streams was developed by the USGS, which also operates all three gages. The USGS adjusted this information for changes in drainage areas using weighted values, and then plotted it on log-log paper to determine discharge frequency data for Sutton Creek. December 6, 2000 Revision There are three stream flow gaging stations within the Apalachicola River reach studied in Liberty County, Florida. Data were collected for the City of Blountstown, Florida, for 29 years, between the years 1958 and 1986; for Sumatra, Florida, for 9 years, between the years 1978 and 1986; and for the City of Wewahitchka, Florida, for 31 years, between the years 1956-67, 1966-82, and 1984-85, respectively. Discharge data for stream flow gaging stations near the Cities of Blountstown and Wewahitchka were used in a two-station comparison computation as outlined in Bulletin No. 17B with the Chattahoochee gaging station (U.S. Department of the Interior, Geological Survey, September 1981, revised March 1982). The Chattahoochee gaging station has a longer period of record, 67 years, from 1920 through 1986. Due to a short period of record at the gaging station near Sumatra, data were not utilized for a two-station comparison computation of the discharges for the Apalachicola River. The 1-percent annual chance flood discharges at SR 274 were determined by the analysis of data from the USGS Altha gage using the USGS PEAKFQ computer program in accordance with Bulletin No. 17B (U.S. Department of the Interior, Geological Survey, September 1981, revised March 1982). This gage, No. 02359000, has annual peak flow records from the following water years: 1913, 1922-1927, 1930-1931, and 1994-1995.

8
Revised Countywide Analyses For this countywide FIS, the areas below were analyzed by detailed or limited detail methods. For the Apalachicola River, frequency analysis to estimate flood peak discharges for different return periods was performed with the PeakFQ following the methods presented in the Bulletin 17B. Estimates of instantaneous annual-maximum peak flows for recurrence intervals of 10-, 2-, 1-, and 0.2-percent annual chance frequency were obtained from USGS gage stations 02358000 (Chattahoochee), 02358700 (Blountstown), 202358754 (Wewahitchka), and 02359170 (Sumatra). Discharge data at stream flow gaging station (No. 02358000) on the Apalachicola River at Chattahoochee have been collected since 1920. The entire period of record, 90 years, was used in the frequency analysis. The results were fit to a log-Pearson Type III distribution and peak discharge values for frequencies of 10-, 2-, 1-, and 0.2-percent annual were obtained. The peak flows were transformed into synthetic hydrographs following the dimensionless unit hydrograph technique developed by the NRCS. A summary of the drainage area-peak discharge relationships for the streams studied by detailed methods is shown in Table 2, “Summary of Discharges”.
TABLE 2 - SUMMARY OF DISCHARGES
FLOODING SOURCE AND LOCATION
DRAINAGE AREA
(sq. miles)
PEAK DISCHARGE (CFS) 10-
PERCENT ANNUAL CHANCE
2- PERCENT ANNUAL CHANCE
1- PERCENT ANNUAL CHANCE
0.2- PERCENT ANNUAL CHANCE
APALACHICOLA RIVER
At Blountstown stream gage 17,600 160,000 220,000 248,000 313,000 At Sumatra stream gage 19,200 169,000 230,000 257,000 322,000 At Wewahitchka stream gage 17,800 163,000 222,000 250,000 314,000
CHINKAPIN BRANCH At confluence of Fourmile Creek 0.6 * * 518 *
CHIPOLA RIVER
At State Route 71 993 * * 38,387 * At confluence of Juniper River 980 * * 37,209 * At State Route 20 897 * * 30,368 * At State Route 274 781 * * 21,872 *
* Data not available

9
TABLE 2 - SUMMARY OF DISCHARGES (cont.)
FLOODING SOURCE AND LOCATION
DRAINAGE AREA
(sq. miles)
PEAK DISCHARGE (CFS) 10-
PERCENT ANNUAL CHANCE
2- PERCENT ANNUAL CHANCE
1- PERCENT ANNUAL CHANCE
0.2- PERCENT ANNUAL CHANCE
DITCH POND BRANCH
At confluence of Fourmile Creek 1.1 * * 610 * FOURMILE CREEK
At confluence of Big Brook 29.8 * * 4,520 * At confluence of Chinkapin Branch 24.6 * * 3,917 * At confluence of Chipola River 37.6 * * 5,440 * At confluence of Ditch Pond Branch 8.6 * * 2,732 * At confluence of Fourmile Creek Unnamed Tributary 1 10.6 * * 2,428 *
At confluence of Fourmile Creek Unnamed Tributary 2 17.5 * * 2,012 *
At confluence of Fourmile Creek Unnamed Tributary 3 4.2 * * 1,424 *
At confluence of Max Spring Branch 15.8 * * 2,806 * At confluence of Mossy Pond Branch 11.4 * * 2,520 *
At confluence of Otter Creek 34.2 * * 5,127 * At confluence of Palmetto Branch 27.3 * * 4,293 * At confluence of Panther Branch 22.1 * * 3,391 * At confluence of Taylor Branch 21.1 * * 2,583 * At confluence of Watson Branch 21.1 * * 3,242 *
FOURMILE CREEK UNNAMED TRIBUTARY 1
At confluence of Fourmile Creek 0.7 * * 457 * FOURMILE CREEK UNNAMED TRIBUTARY 2
At confluence of Fourmile Creek 1.1 * * 552 * FOURMILE CREEK UNNAMED TRIBUTARY 3
At confluence of Fourmile Creek 1.7 * * 247 * * Data not available

10
TABLE 2 - SUMMARY OF DISCHARGES (cont.)
FLOODING SOURCE AND LOCATION
DRAINAGE AREA
(sq. miles)
PEAK DISCHARGE (CFS) 10-
PERCENT ANNUAL CHANCE
2- PERCENT ANNUAL CHANCE
1- PERCENT ANNUAL CHANCE
0.2- PERCENT ANNUAL CHANCE
HOLLIMAN BRANCH
At confluence of Chipola River 2.06 * * 1,717 * HOLLIS BRANCH
At confluence of Chipola River 2.34 * * 1,598 * JACK CREEK
At confluence of Tenmile Creek 10.0 * * 2,589 * At confluence of Jack Creek Unnamed Tributary 9.1 * * 2,340 *
JACK CREEK UNNAMED TRIBUTARY
At confluence of Jack Creek 0.7 * * 693 *
JUNIPER CREEK At confluence of Chipola River 57.40 * * 6,554 * At State Highway 73 48.56 * * 6,104 * At County Highway 1 36.84 * * 5,390 * At State Highway 20 28.34 * * 4,487 *
MAYO MILL BRANCH
At confluence of Tenmile Creek 3.6 * * 1,376 * At confluence of Unnamed Tributary 1.4 * * 474 *
MOSSY POND BRANCH
At confluence of Fourmile Creek 0.8 * * 119 * PANTHER BRANCH
At confluence of Fourmile Creek 2.5 * * 1,087 * * Data not available

11
TABLE 2 - SUMMARY OF DISCHARGES (cont.)
FLOODING SOURCE AND LOCATION
DRAINAGE AREA
(sq. miles)
PEAK DISCHARGE (CFS) 10-
PERCENT ANNUAL CHANCE
2- PERCENT ANNUAL CHANCE
1- PERCENT ANNUAL CHANCE
0.2- PERCENT ANNUAL CHANCE
PIPPIN BRANCH
At confluence of Tenmile Creek 2.44 * * 1,141 * REEDY CREEK
At confluence of Sutton Creek 3.84 * * 816 * RING JAW BRANCH
At confluence of Chipola River 2.69 * * 1,797 *
SUTTON CREEK At confluence with the Apalachicola River 13.71 1,620 2,268 2,700 3,510
At SR 71 8.95 1,206 1,688 2,010 2,613 At SR 20 8.69 1,176 1,646 1,960 2,548 Appproximately 2,400 feet upstream of E. Johns Road 8.54 1,161 1,625 1,935 2,515
At Northwest 11th Street 5.33 * * 1,740 * At confluence of Reedy Creek 2.12 * * 508 *
TAYLOR BRANCH
At confluence of Fourmile Creek 1.1 * * 589 * TENMILE CREEK
At confluence of Chipola River 61.2 * * 6,607 * At confluence of Jack Creek 31.1 * * 3,802 * At confluence of Mayo Mill Branch 55.0 * * 5,906 * At confluence of Pippin Branch 21.9 * * 3,253 * At confluence of Tenmile Creek Unnamed Tributary 1 53.2 * * 5,719 *
At confluence of Tenmile Creek Unnamed Tributary 5 12.2 * * 2,958 *
At confluence of Tenmile Creek Unnamed Tributary 6 8.2 * * 2,958 *
At confluence of Tenmile Creek Unnamed Tributary 7 3.3 * * 1,211 *
At confluence of Whitewater Creek 39.8 * * 4,212 * * Data not available
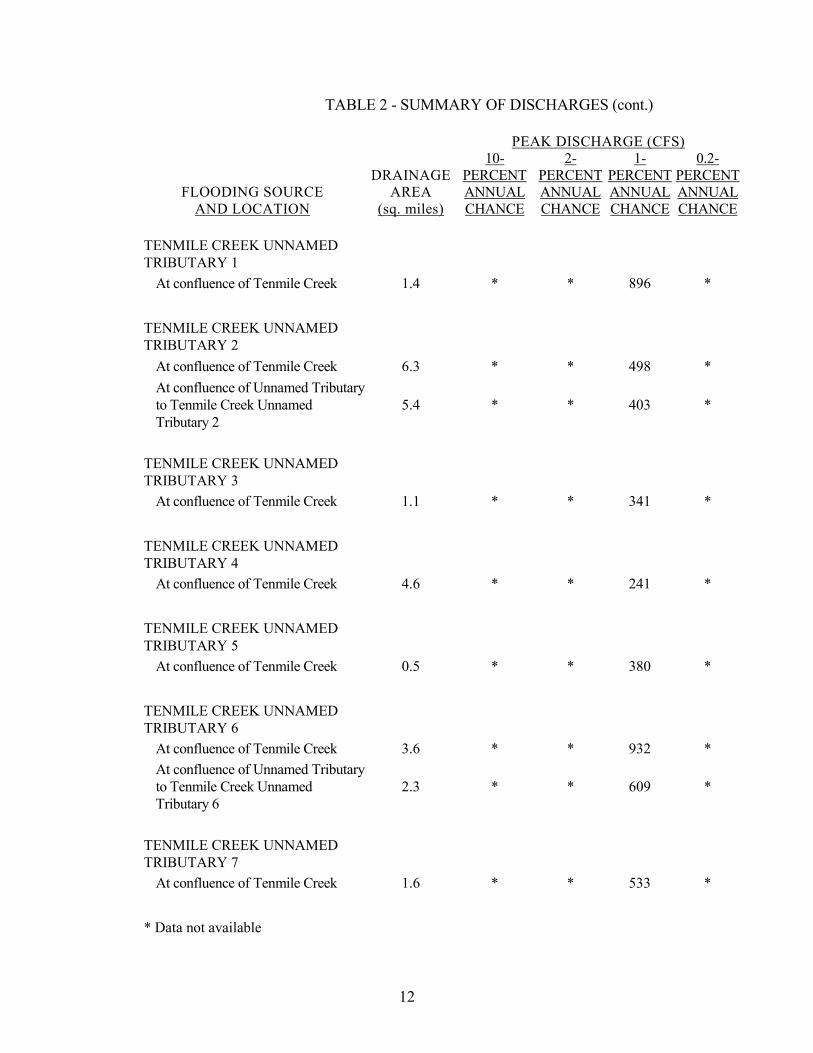
12
TABLE 2 - SUMMARY OF DISCHARGES (cont.)
FLOODING SOURCE AND LOCATION
DRAINAGE AREA
(sq. miles)
PEAK DISCHARGE (CFS) 10-
PERCENT ANNUAL CHANCE
2- PERCENT ANNUAL CHANCE
1- PERCENT ANNUAL CHANCE
0.2- PERCENT ANNUAL CHANCE
TENMILE CREEK UNNAMED TRIBUTARY 1
At confluence of Tenmile Creek 1.4 * * 896 * TENMILE CREEK UNNAMED TRIBUTARY 2
At confluence of Tenmile Creek 6.3 * * 498 * At confluence of Unnamed Tributary to Tenmile Creek Unnamed Tributary 2
5.4 * * 403 *
TENMILE CREEK UNNAMED TRIBUTARY 3
At confluence of Tenmile Creek 1.1 * * 341 * TENMILE CREEK UNNAMED TRIBUTARY 4
At confluence of Tenmile Creek 4.6 * * 241 * TENMILE CREEK UNNAMED TRIBUTARY 5
At confluence of Tenmile Creek 0.5 * * 380 * TENMILE CREEK UNNAMED TRIBUTARY 6
At confluence of Tenmile Creek 3.6 * * 932 * At confluence of Unnamed Tributary to Tenmile Creek Unnamed Tributary 6
2.3 * * 609 *
TENMILE CREEK UNNAMED TRIBUTARY 7
At confluence of Tenmile Creek 1.6 * * 533 * * Data not available

13
TABLE 2 - SUMMARY OF DISCHARGES (cont.)
FLOODING SOURCE AND LOCATION
DRAINAGE AREA
(sq. miles)
PEAK DISCHARGE (CFS) 10-
PERCENT ANNUAL CHANCE
2- PERCENT ANNUAL CHANCE
1- PERCENT ANNUAL CHANCE
0.2- PERCENT ANNUAL CHANCE
UNNAMED TRIBUTARY to TENMILE CREEK UNNAMED TRIBUTARY 2
At confluence of Tenmile Creek Unnamed Tributary 2 0.9 * * 172 *
UNNAMED TRIBUTARY to TENMILE CREEK UNNAMED TRIBUTARY 6
At confluence of Tenmile Creek Unnamed Tributary 6 0.6 * * 313 *
WATSON BRANCH
At confluence of Fourmile Creek 0.9 * * 570 * WHITEWATER CREEK
At confluence of Tenmile Creek 10.2 * * 3,004 * At confluence of Whitewater Creek Unnamed Tributary 1 8.1 * * 2,487 *
At confluence of Whitewater Creek Unnamed Tributary 2 5.7 * * 1,781 *
At confluence of Whitewater Creek Unnamed Tributary 3 3.5 * * 1,057 *
At confluence of Whitewater Creek Unnamed Tributary 4 2.1 * * 541 *
WHITEWATER CREEK UNNAMED TRIBUTARY 1
At confluence of Whitewater Creek 1.0 * * 433 * WHITEWATER CREEK UNNAMED TRIBUTARY 2
At confluence of Whitewater Creek 0.8 * * 602 * * Data not available

14
TABLE 2 - SUMMARY OF DISCHARGES (cont.)
FLOODING SOURCE AND LOCATION
DRAINAGE AREA
(sq. miles)
PEAK DISCHARGE (CFS) 10-
PERCENT ANNUAL CHANCE
2- PERCENT ANNUAL CHANCE
1- PERCENT ANNUAL CHANCE
0.2- PERCENT ANNUAL CHANCE
WHITEWATER CREEK UNNAMED TRIBUTARY 3
At confluence of Whitewater Creek 1.8 * * 722 * WHITEWATER CREEK UNNAMED TRIBUTARY 4
At confluence of Whitewater Creek 0.6 * * 362 * * Data not available
Streamflows for each of the limited detail study reaches were estimated using USGS Regional Regression Equations for a series of flood frequencies. Flood frequency methods (Section C.1.1.2) were used to estimate streamflows at USGS gages within and adjacent to Calhoun County on streams with characteristics similar to those of the study reaches. Estimated streamflows for each of the study reaches (both methods) were compared to a log plot of discharge versus drainage area for the gage estimates, and assessed against their fit within confidence limits representing plus or minus one standard deviation for a normal distribution. The comparison was conducted for all flood frequencies determined as part of this assessment. USGS Regional Regression Equations developed for use in this study were based on methodologies and equations presented in detail in USGS, Water Resources Investigations 82-4012, Technique for Estimating Magnitude and Frequency of Floods on Natural-Flow Streams in Florida, 1982. The National Flood Frequency (NFF) Program, Version 3, was used compute streamflow estimates for this analysis. Drainage basin maps for the study areas were prepared using GIS. Input data required for the regression equation estimates, including Drainage Area, Channel Slope, and Lake Area, were all determined using GIS-based data. Peak discharge-drainage area relationships for the 10-, 2-, 1-, and 0.2-percent annual chance floods of each flooding source studied by detailed or limited detail methods in the community are also shown in Table 2.

15
3.2 Hydraulic Analyses
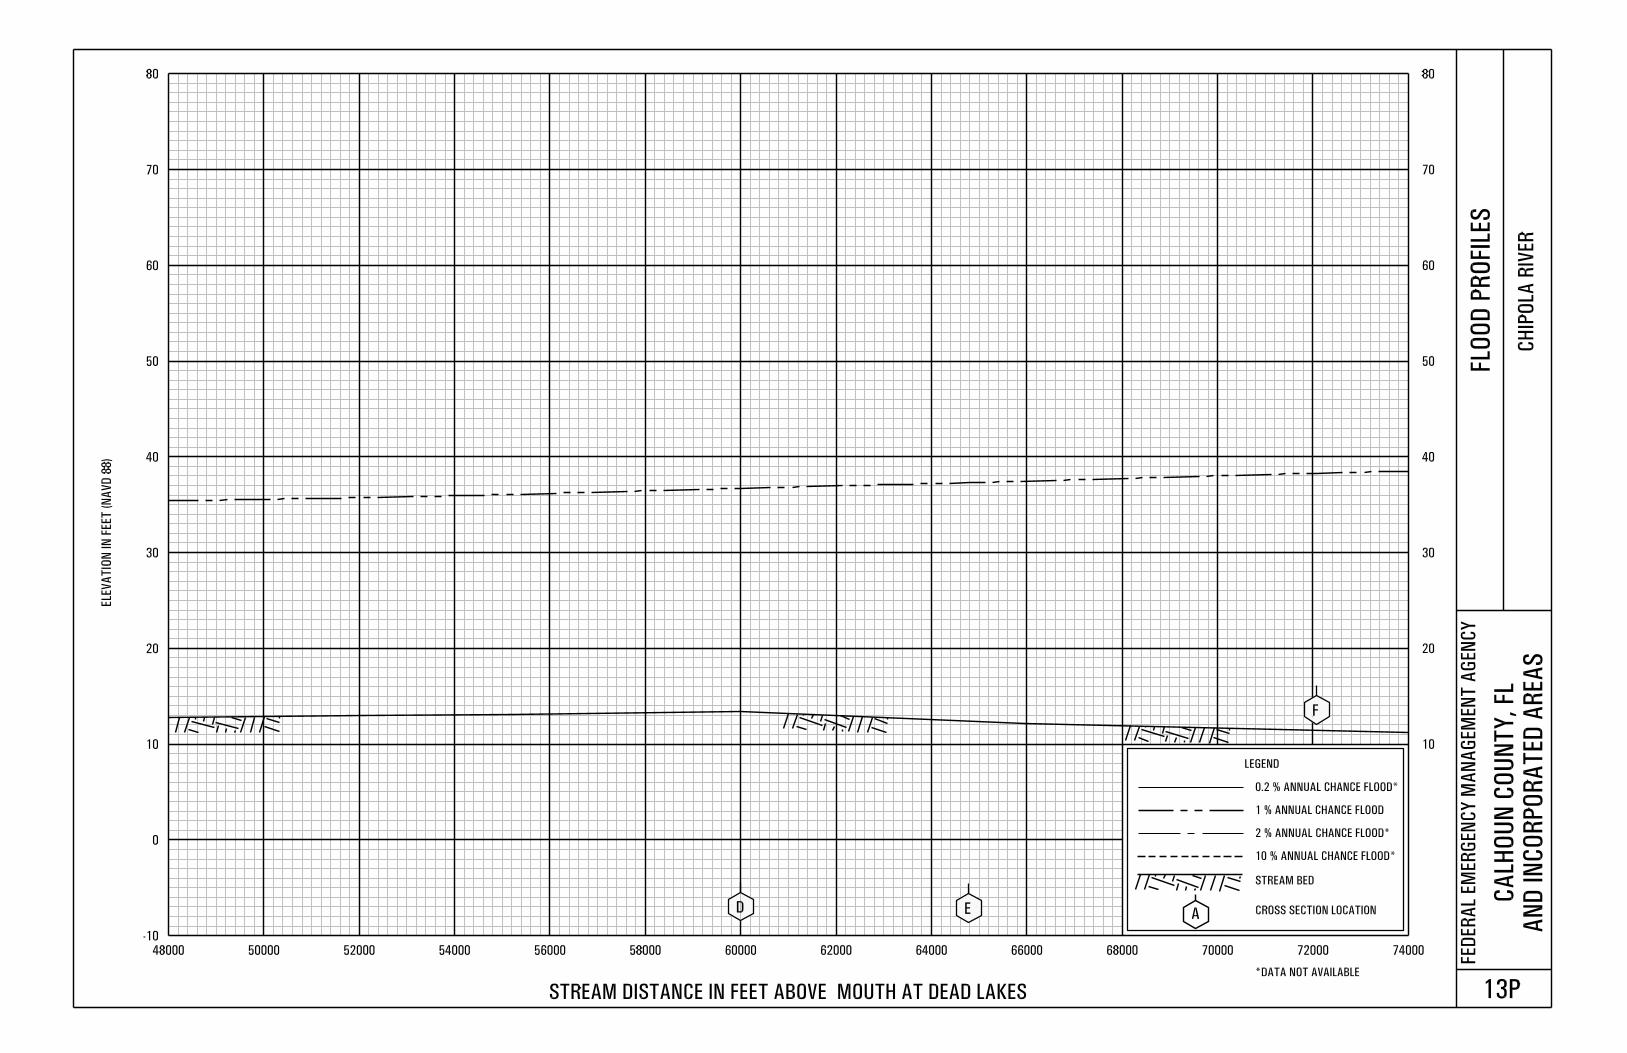
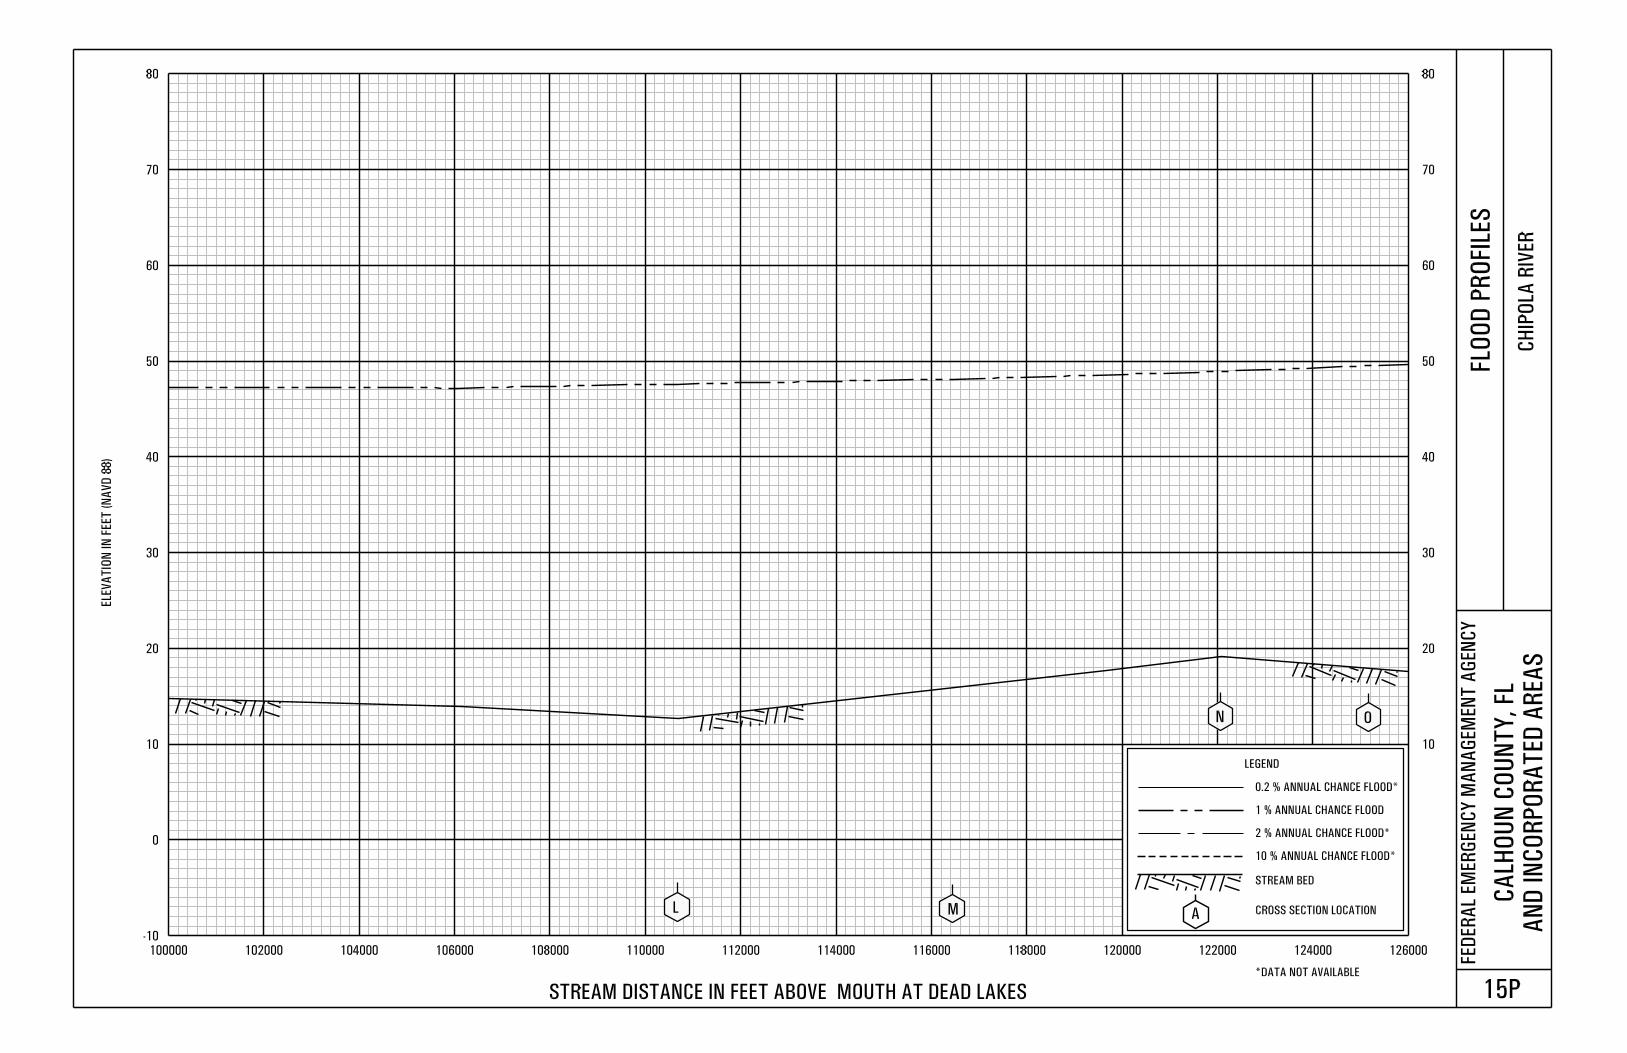
Analyses of the hydraulic characteristics of flooding from the sources studied were carried out to provide estimates of the elevations of floods of the selected recurrence intervals. Users should be aware that flood elevations shown on the FIRM represent rounded whole-foot elevations and may not exactly reflect the elevations shown on the Flood Profiles or in the Floodway Data tables in the FIS report. For construction and/or floodplain management purposes, users are encouraged to use the flood elevation data presented in this FIS in conjunction with the data shown on the FIRM. The hydraulic analyses for this FIS were based on unobstructed flow. The flood elevations shown on the profiles are thus considered valid only of hydraulic structures remain unobstructed, operate properly, and do not fail. June 18, 1987 and December 6, 2000 Countywide Analyses Cross section information for the Apalachicola River was obtained from the USACE, Mobile District (USACE, 1985). In some cases, topographic maps were used to extend surveyed cross sections for floodplain geometry (U.S. Department of the Interior, Geological Survey, 1945). All bridges, dams, and culverts were field surveyed to obtain elevation data and structural geometry. Cross sections for Sutton Creek were obtained from topographic maps at a scale of 1:4,800 with a contour interval of 1 foot (Continental Aerial Survey, 1977). These maps were developed from aerial photographs flown in the fall of 1977. Cross sections for the Chipola River were obtained from field surveys. Locations of selected cross sections used in the hydraulic analyses are shown on the Flood Profiles (Exhibit 1). For stream segments for which a floodway was computed (Section 4.2), selected cross section locations are also shown on the FIRM (Exhibit 2). Water-surface elevations of floods of the selected recurrence intervals for the Chipola River were computed using the USACE HEC-RAS computer program (USACE, 1997). Water-surface elevations of floods of the selected recurrence intervals for the Apalachicola River were computed using the USACE HEC-2 step-backwater computer program (USACE, 1984). Water-surface elevations for Sutton Creek were computed through use of the U.S. Department of Agriculture (USDA) Soil Conservation Service (SCS) WSP-2 water-surface profile computer program (USDA, SCS, 1976). Starting water-surface elevations for the sources studied in detail were calculated using the slope/area method. Values for the 1-percent annual chance flood profile upstream of SR 274 along the Chipola River were obtained by interpolation using USGS gage data and topographic maps. Flood profiles for the Apalachicola River and Sutton Creek were drawn showing computed water-surface elevations for floods of the selected recurrence intervals.
16
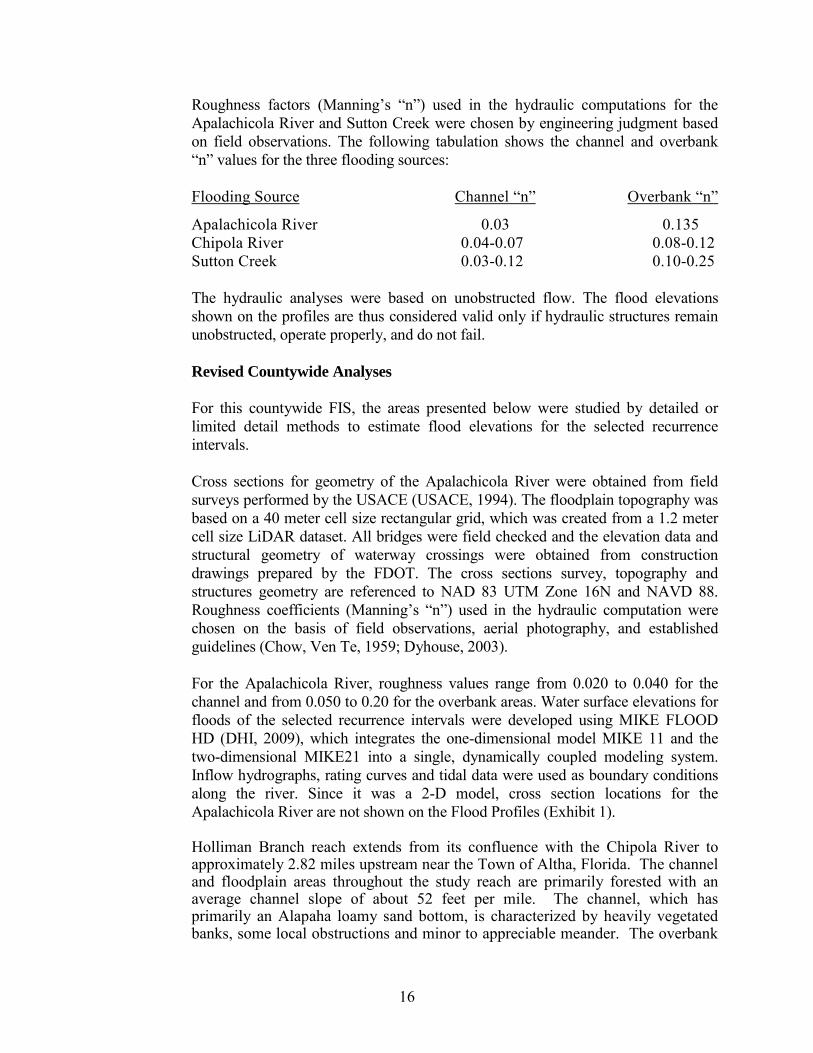
Roughness factors (Manning’s “n”) used in the hydraulic computations for the Apalachicola River and Sutton Creek were chosen by engineering judgment based on field observations. The following tabulation shows the channel and overbank “n” values for the three flooding sources: Flooding Source Channel “n” Overbank “n”
Apalachicola River 0.03 0.135 Chipola River 0.04-0.07 0.08-0.12 Sutton Creek 0.03-0.12 0.10-0.25 The hydraulic analyses were based on unobstructed flow. The flood elevations shown on the profiles are thus considered valid only if hydraulic structures remain unobstructed, operate properly, and do not fail. Revised Countywide Analyses For this countywide FIS, the areas presented below were studied by detailed or limited detail methods to estimate flood elevations for the selected recurrence intervals. Cross sections for geometry of the Apalachicola River were obtained from field surveys performed by the USACE (USACE, 1994). The floodplain topography was based on a 40 meter cell size rectangular grid, which was created from a 1.2 meter cell size LiDAR dataset. All bridges were field checked and the elevation data and structural geometry of waterway crossings were obtained from construction drawings prepared by the FDOT. The cross sections survey, topography and structures geometry are referenced to NAD 83 UTM Zone 16N and NAVD 88. Roughness coefficients (Manning’s “n”) used in the hydraulic computation were chosen on the basis of field observations, aerial photography, and established guidelines (Chow, Ven Te, 1959; Dyhouse, 2003). For the Apalachicola River, roughness values range from 0.020 to 0.040 for the channel and from 0.050 to 0.20 for the overbank areas. Water surface elevations for floods of the selected recurrence intervals were developed using MIKE FLOOD HD (DHI, 2009), which integrates the one-dimensional model MIKE 11 and the two-dimensional MIKE21 into a single, dynamically coupled modeling system. Inflow hydrographs, rating curves and tidal data were used as boundary conditions along the river. Since it was a 2-D model, cross section locations for the Apalachicola River are not shown on the Flood Profiles (Exhibit 1). Holliman Branch reach extends from its confluence with the Chipola River to approximately 2.82 miles upstream near the Town of Altha, Florida. The channel and floodplain areas throughout the study reach are primarily forested with an average channel slope of about 52 feet per mile. The channel, which has primarily an Alapaha loamy sand bottom, is characterized by heavily vegetated banks, some local obstructions and minor to appreciable meander. The overbank

17
areas are heavy vegetated with trees and underbrush causing a high degree of roughness. This reach has one culvert crossing at County Highway 274.
Hollis Branch reach extends from its confluence with the Chipola River to approximately 2.89 miles upstream near the Town of Altha, Florida. The channel and floodplain areas throughout the study reach are primarily forested with an average channel slope of about 42 feet per mile. The channel, which has primarily an Alapaha loamy sand bottom, is characterized by heavily vegetated banks, some local obstructions and minor to appreciable meander. The overbank areas are heavy vegetated with trees and underbrush causing a high degree of roughness. This reach has one culvert crossing at County Highway 274.
Juniper Creek reach extends from its confluence with the Chipola River to approximately 22.88 miles upstream southwest of the Town of Altha, Florida. The channel and floodplain areas throughout the study reach are primarily forested with an average channel slope of about 42 feet per mile. The channel, which has primarily a Pamlico soil bottom in the upper reach and a Croatan soil bottom in the downstream reach, is characterized by heavily vegetated banks, some local obstructions and minor to appreciable meander. The overbank areas are heavy vegetated with trees and underbrush causing a high degree of roughness. This reach has one bridge crossing at State Highway 73 and two culvert crossings at State Highway 20 and County Highway 1.
Ring Jaw Branch reach extends from its confluence with the Chipola River to approximately 2.85 miles upstream near the Town of Altha, Florida. The channel and floodplain areas throughout the study reach are primarily forested with an average channel slope of about 42 feet per mile. The channel, which has primarily an Alapaha loamy sand bottom, is characterized by heavily vegetated banks, some local obstructions and minor to appreciable meander. The overbank areas are heavy vegetated with trees and underbrush causing a high degree of roughness. This reach has one culvert crossing at Northwest Musgrove Road.
Reedy Creek reach extends from its confluence with the Sutton Creek to approximately 2.62 miles upstream near the City of Blountstown, Florida. The channel and floodplain areas throughout the study reach are primarily forested with an average channel slope of about 42 feet per mile. The channel, which has primarily a Croatan soil bottom, is characterized by heavily vegetated banks, some local obstructions and minor to appreciable meander. The overbank areas are heavy vegetated with trees and underbrush causing a high degree of roughness. This reach has two culvert crossings with both being located at Northwest John F Bailey Road.
Sutton Creek reach extends from the culvert structure located at Northwest 11th Street to approximately 4.73 miles upstream near Lake Hilda and the City of Blountstown, Florida. The channel and floodplain areas throughout the study reach are primarily forested with an average channel slope of about 42 feet per mile. The channel, which has primarily a Croatan soil bottom, is characterized by heavily vegetated banks, some local obstructions and minor to appreciable meander. The overbank areas are heavy vegetated with trees and underbrush

18
causing a high degree of roughness. This reach has four culvert crossings at Northwest 11th Street, Northwest Pioneer Road, Northwest John F Bailey Road, and Northwest Williard Smith Road. HEC-RAS models were developed to simulate flood elevations. Each model included details of natural channel geometry and considered all structures which potentially impact flood levels such as bridges and culverts. Channel cross sections were obtained from LiDAR topographic data for Calhoun County topographic data. Bridge and culvert structures were field reviewed to obtain estimated elevation data and structural geometry. Available Bridge and culvert structure data was also obtained from the Florida Department of Transportation (FDOT) and Calhoun County. Channel and floodplain roughness coefficients (Manning’s “n”) were estimated based on the methodology documented in the USGS’ Water Supply Paper 2339. A combination of field observation, photographs, and aerial photography was used to establish the parameters used in the methodology. Roughness values for the main channels ranged from 0.035 to 0.05, and overbank values ranged from 0.050 to 0.10 for the streams studied in limited detail in this revised analysis. The starting water-surface elevations for the HEC-RAS models were determined using either normal depth or known water surface elevations for areas that were a continuation of the previous FIS. No floodways or flood profiles were determined for the streams in this study using limited detailed methods. Elevations for floods of the selected recurrence interval for the limited detailed studies for Calhoun County are shown in Appendix A. All qualifying bench marks within a given jurisdiction that are cataloged by the National Geodetic Survey (NGS) and entered into the National Spatial Reference System (NSRS) as First or Second Order Vertical and have a vertical stability classification of A, B, or C are shown and labeled on the FIRM with their 6-character NSRS Permanent Identifier. Bench marks cataloged by the NGS and entered into the NSRS vary widely in vertical stability classification. NSRS vertical stability classifications are as follows: • Stability A: Monuments of the most reliable nature, expected to hold
position/elevation well (e.g., mounted in bedrock) • Stability B: Monuments which generally hold their position/elevation
well (e.g., concrete bridge abutment) • Stability C: Monuments which may be affected by surface ground
movements (e.g., concrete monument below frost line)

19
• Stability D: Mark of questionable or unknown vertical stability (e.g.,
concrete monument above frost line, or steel witness post) In addition to NSRS bench marks, the FIRM may also show vertical control monuments established by a local jurisdiction; these monuments will be shown on the FIRM with the appropriate designations. Local monuments will only be placed on the FIRM if the community has requested that they be included, and if the monuments meet the aforementioned NSRS inclusion criteria. To obtain current elevation, description, and/or location information for bench marks shown on the FIRM for this jurisdiction, please contact the Information Services Branch of the NGS at (301) 713-3242, or visit their Web site at www.ngs.noaa.gov. It is important to note that temporary vertical monuments are often established during the preparation of a flood hazard analysis for the purpose of establishing local vertical control. Although these monuments are not shown on the FIRM, they may be found in the Technical Support Data Notebook associated with this FIS and FIRM. Interested individuals may contact FEMA to access this data.
3.3 Vertical Datum All FISs and FIRMs are referenced to a specific vertical datum. The vertical datum provides a starting point against which flood, ground, and structure elevations can be referenced and compared. Until recently, the standard vertical datum in use for newly created or revised FISs and FIRMs was the National Geodetic Vertical Datum of 1929 (NGVD29). With the finalization of the North American Vertical Datum of 1988 (NAVD88), many FIS reports and FIRMs are being prepared using NAVD88 as the referenced vertical datum. All flood elevations shown in this FIS report and on the FIRM are referenced to NAVD 88. Structure and ground elevations in the community must, therefore, be referenced to NAVD 88. It is important to note that adjacent communities may be referenced to NGVD 29. This may result in differences in Base Flood Elevations (BFEs) across the corporate limits between the communities. Prior versions of the FIS report and FIRM were referenced to NGVD 29. When a datum conversion is affected for an FIS report and FIRM, the Flood Profiles, BFEs and Elevation Reference Marks (ERMs) reflect the new datum values. To compare structure and ground elevations to the 1 percent annual chance flood elevations shown in the FIS and on the FIRM, the subject structure and ground elevations must be referenced to the new datum values. As noted above, the elevations shown in the FIS report and on the FIRM for Calhoun County and incorporated areas are referenced to NAVD 88. Ground, structure, and flood elevations may be compared and/or referenced to NGVD 29

20
using a standard conversion factor. The conversion factor from NGVD 29 to NAVD 88 is -0.46 feet. The BFEs shown on the FIRM represent whole-foot rounded values. For example, a BFE of 102.4 will appear as 102 on the FIRM and 102.6 will appear as 103. Therefore, users that wish to convert the elevations in this FIS to NGVD 29 should apply the stated conversion factor(s) to elevations shown on the Flood Profiles and supporting data tables in the FIS report, which are shown at a minimum to the nearest 0.1 foot. For more information on NAVD 88, see Converting the National Flood Insurance Program to the North American Vertical Datum of 1988, FEMA Publication FIA20/June 1992, or contact the National Geodetic Survey (NGS) Information Services, National Oceanic and Atmospheric Administration (NOAA) N/NGS12, National Geodetic Survey, SSMC-3, #9202, 1315 East-West Highway, Silver Spring, Maryland 20910-3282 (http://www.ngs.noaa.gov).
4.0 FLOODPLAIN MANAGEMENT APPLICATIONS
The NFIP encourages state and local governments to adopt sound floodplain management programs. To assist in this endeavor, each FIS provides 1 percent annual chance floodplain data, which may include a combination of the following: 10-, 2-, 1-, and 0.2- percent annual chance flood elevations; delineations of the 1-percent and 0.2-percent annual chance floodplains; and the 1-percent annual chance floodway. This information is presented on the FIRM and in many components of the FIS, including Flood Profiles, Floodway Data tables, and Summary of Stillwater Elevation tables. Users should reference the data presented in the FIS as well as additional information that may be available at the local community map repository before making flood elevation and/or floodplain boundary determinations. 4.1 Floodplain Boundaries
To provide a national standard without regional discrimination, the 1-percent annual chance flood has been adopted by FEMA as the base flood for floodplain management purposes. The 0.2-percent annual chance flood is employed to indicate additional areas of flood risk in the county. For the flooding sources studied in detail, the 1-percent and 0.2-percent floodplains have been delineated using the flood elevations determined at each cross section. In the June 18, 1987 countywide FIS, the boundaries were interpolated between cross sections, using topographic maps at a scale of 1:24,000 with a contour interval of 10 feet for the unincorporated areas of Calhoun County and topographic maps at a scale of 1:4,800 with a contour interval of 1 foot for the City of Blountstown (U.S. Department of the Interior, Geological Survey, 1945 and Continental Aerial Survey, 1977). For the December 6, 2000 revision, the boundaries were interpolated between cross sections, using topographic maps at a scale of 1:24,000 with a contour interval of 10 feet (U.S. Department of the Interior, Geological Survey, 1945).
21
For this countywide FIS, floodplains for all of the detailed and limited detailed studies, including unrevised streams, have been redelineated using updated LiDAR topographic data provided to FEMA as part of this revision (Northwest Florida Water Management District, March 2007). LiDAR data is remotely sensed high resolution elevation data collected by an airborne collection platform. The LiDAR data used to delineate floodplain boundaries for the countywide analysis was collected from two separate projects. The first project collected LiDAR data from February 22, 2007 to March 13, 2007 for the northern portion of the county. The average point spacing for this data is 0.7 m and vertical accuracy is 11.12 cm RMSEz. The second project collected LiDAR from July 18, 2007 to July 20, 2007 for the southern portion of the county. The average point spacing for this data is 0.7 m and vertical accuracy is 9.45 cm RMSEz. For the streams studied by approximate methods, the 1-percent floodplain boundary was taken from the previously printed FIS/FIRM for Calhoun County and incorporated areas (FEMA, June 1987). The 1-and 0.2-percent annual chance floodplain boundaries are shown on the FIRM. On this map, the 1-percent annual chance floodplain boundary corresponds to the boundary of the areas of special flood hazards (Zones A and AE) and the 0.2- percent annual chance floodplain boundary corresponds to the boundary of areas of moderate flood hazards. In cases where the 1-and 0.2-percent annual chance floodplain boundaries are close together, only the 1-percent annual chance floodplain boundary has been shown. Small areas within the floodplain boundaries may lie above the flood elevations but cannot be shown due to limitations of the map scale and/or lack of detailed topographic data. For the streams studied by approximate methods, only the 1-percent annual chance floodplain boundary is shown on the FIRM (Exhibit 2).
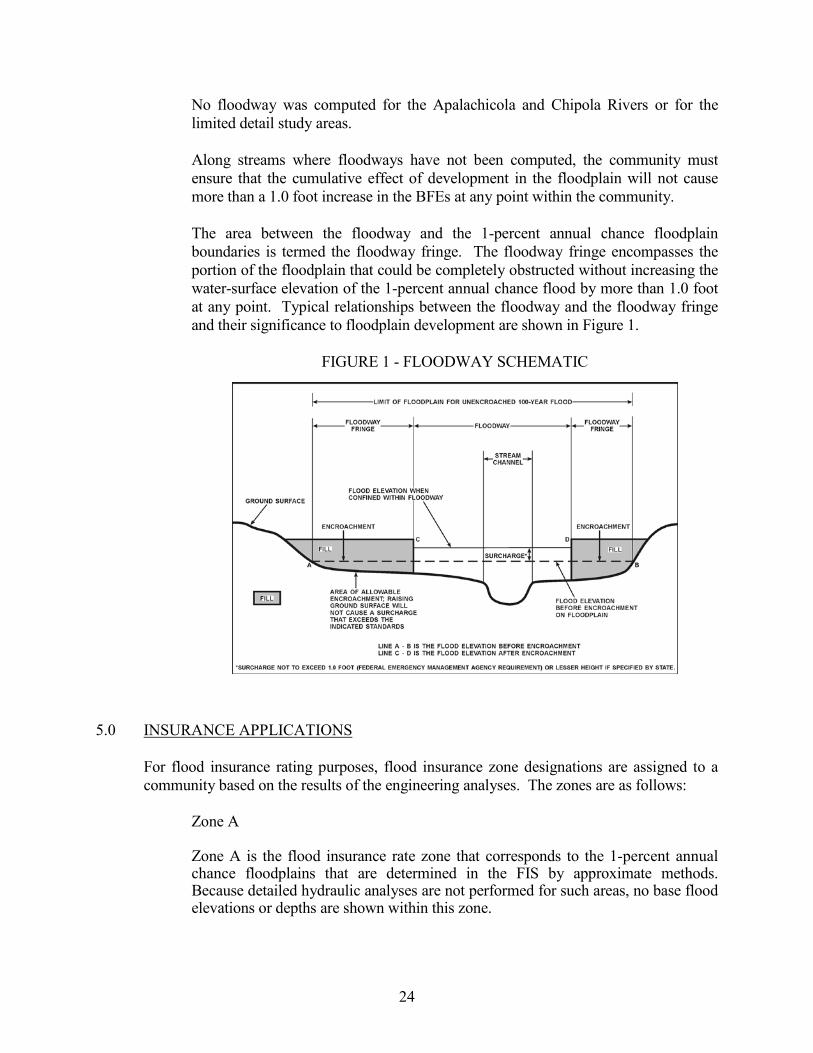
4.2 Floodways Encroachment on floodplains, such as structures and fill, reduces the flood-carrying capacity, increases the flood heights and velocities, and increases flood hazards in areas beyond the encroachment itself. One aspect of floodplain management involves balancing the economic gain from floodplain development against the resulting increase in flood hazard. For purposes of the NFIP, a floodway is used as a tool to assist local communities in this aspect of floodplain management. Under this concept, the area of the 1-percent annual chance floodplain is divided into a floodway and a floodway fringe. The floodway is the channel of a stream plus any adjacent floodplain areas that must be kept free of encroachment so that the 1 percent annual chance flood can be carried without substantial increases in flood heights. Minimum Federal standards limit such increases to 1.0 foot, provided that hazardous velocities are not produced. The floodways in this study are presented to local agencies as minimum standards that can be adopted directly or that can be used as a basis for additional floodway studies.

22
The floodways presented in this FIS were computed for certain stream segments on the basis of equal conveyance reduction from each side of the floodplain. Floodway widths were computed at cross sections. Between cross sections, the floodway boundaries were interpolated. The results of the floodway computations are tabulated for selected cross sections (Table 3, Floodway Data). The computed floodways are shown on the FIRM (Exhibit 2). In cases where the floodway and 1-percent annual chance floodplain boundaries are either close together or collinear, only the floodway boundary is shown.
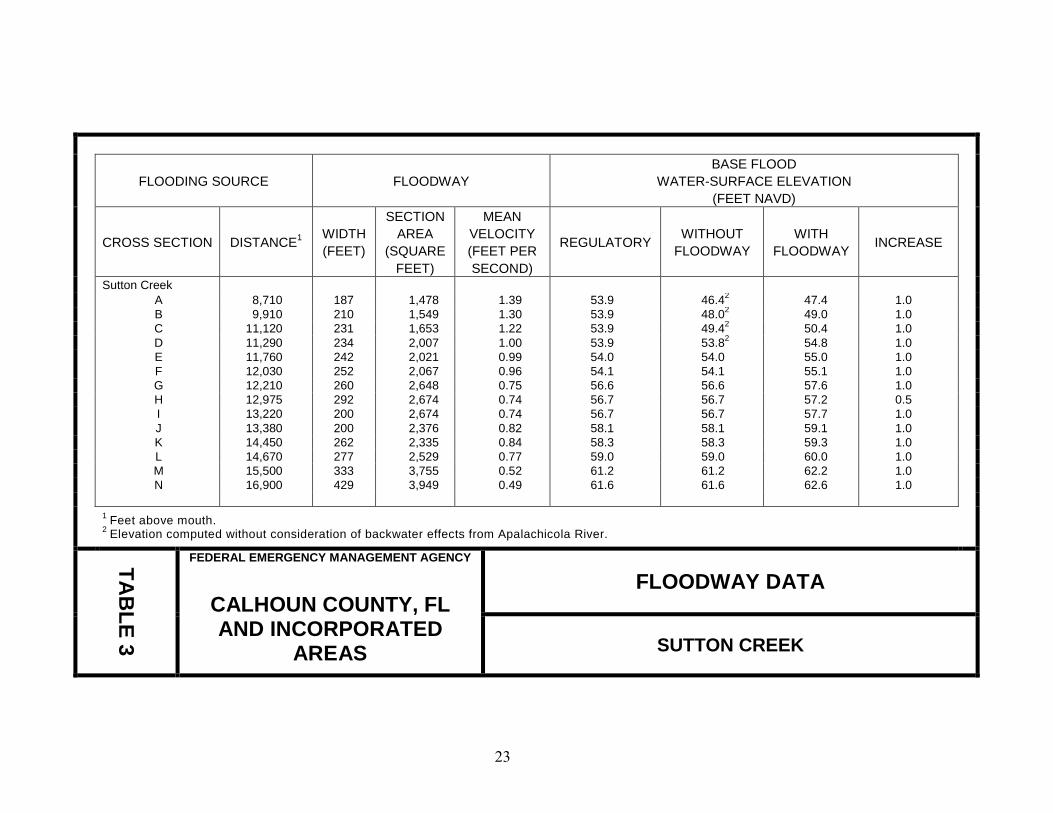
23
FLOODING SOURCE FLOODWAY BASE FLOOD
WATER-SURFACE ELEVATION (FEET NAVD)
CROSS SECTION DISTANCE1 WIDTH
(FEET)
SECTION AREA
(SQUARE FEET)
MEAN VELOCITY (FEET PER SECOND)
REGULATORY WITHOUT FLOODWAY
WITH FLOODWAY INCREASE
Sutton Creek A 8,710 187 1,478 1.39 53.9 46.42 47.4 1.0 B 9,910 210 1,549 1.30 53.9 48.02 49.0 1.0 C 11,120 231 1,653 1.22 53.9 49.42 50.4 1.0 D 11,290 234 2,007 1.00 53.9 53.82 54.8 1.0 E 11,760 242 2,021 0.99 54.0 54.0 55.0 1.0 F 12,030 252 2,067 0.96 54.1 54.1 55.1 1.0 G 12,210 260 2,648 0.75 56.6 56.6 57.6 1.0 H 12,975 292 2,674 0.74 56.7 56.7 57.2 0.5 I 13,220 200 2,674 0.74 56.7 56.7 57.7 1.0 J 13,380 200 2,376 0.82 58.1 58.1 59.1 1.0 K 14,450 262 2,335 0.84 58.3 58.3 59.3 1.0 L 14,670 277 2,529 0.77 59.0 59.0 60.0 1.0 M 15,500 333 3,755 0.52 61.2 61.2 62.2 1.0 N 16,900 429 3,949 0.49 61.6 61.6 62.6 1.0 1 Feet above mouth.
2 Elevation computed without consideration of backwater effects from Apalachicola River.
TAB
LE 3
FEDERAL EMERGENCY MANAGEMENT AGENCY
CALHOUN COUNTY, FL AND INCORPORATED
AREAS
FLOODWAY DATA
SUTTON CREEK
24
No floodway was computed for the Apalachicola and Chipola Rivers or for the limited detail study areas. Along streams where floodways have not been computed, the community must ensure that the cumulative effect of development in the floodplain will not cause more than a 1.0 foot increase in the BFEs at any point within the community. The area between the floodway and the 1-percent annual chance floodplain boundaries is termed the floodway fringe. The floodway fringe encompasses the portion of the floodplain that could be completely obstructed without increasing the water-surface elevation of the 1-percent annual chance flood by more than 1.0 foot at any point. Typical relationships between the floodway and the floodway fringe and their significance to floodplain development are shown in Figure 1.
FIGURE 1 - FLOODWAY SCHEMATIC
5.0 INSURANCE APPLICATIONS
For flood insurance rating purposes, flood insurance zone designations are assigned to a community based on the results of the engineering analyses. The zones are as follows:
Zone A Zone A is the flood insurance rate zone that corresponds to the 1-percent annual
chance floodplains that are determined in the FIS by approximate methods. Because detailed hydraulic analyses are not performed for such areas, no base flood elevations or depths are shown within this zone.
25
Zone AE
Zone AE is the flood insurance rate zone that corresponds to the 1-percent annual chance floodplains that are determined in the FIS by detailed methods. In most instances, whole-foot base flood elevations derived from the detailed hydraulic analyses are shown at selected intervals within this zone.
Zone AH Zone AH is the flood insurance rate zone that corresponds to the areas of 1-percent
annual chance shallow flooding (usually areas of ponding) where average depths are between 1 and 3 feet. Whole-foot base flood elevations derived from the detailed hydraulic analyses are shown at selected intervals within this zone.
Zone AO Zone AO is the flood insurance rate zone that corresponds to the areas of 1-percent
annual chance shallow flooding (usually sheet flow on sloping terrain) where average depths are between 1 and 3 feet. Average whole-foot depths derived from the detailed hydraulic analyses are shown within this zone.
Zone AR
Area of special flood hazard formerly protected from the 1-percent annual chance flood event by a flood control system that was subsequently decertified. Zone AR indicates that the former flood control system is being restored to provide protection from the 1-percent annual chance or greater flood event.
Zone A99 Zone A99 is the flood insurance rate zone that corresponds to areas of the 1-percent
annual chance floodplain that will be protected by a Federal flood protection system where construction has reached specified statutory milestones. No base flood elevations or depths are shown within this zone.
Zone X Zone X is the flood insurance rate zone that corresponds to areas outside the 0.2-
percent annual chance floodplain, areas within the 0.2-percent annual chance floodplain, and to areas of 1-percent annual chance flooding where average depths are less than 1 foot, areas of 1-percent annual chance flooding where the contributing drainage area is less than 1 square mile, and areas protected from the 1-percent annual chance flood by levees. No base flood elevations or depths are shown within this zone.
Zone D Zone D is the flood insurance rate zone that corresponds to unstudied areas where
flood hazards are undetermined, but possible.

26
6.0 FLOOD INSURANCE RATE MAP
The FIRM is designed for flood insurance and floodplain management applications. For flood insurance applications, the map designates flood insurance rate zones as described in Section 5.0 and, in the 1-percent annual chance floodplains that were studied by detailed methods, shows selected whole-foot BFEs or average depths. Insurance agents use the zones and BFEs in conjunction with information on structures and their contents to assign premium rates for flood insurance policies. For floodplain management applications, the map shows by tints, screens, and symbols the 1- and 0.2-percent annual chance floodplains, the floodways, and the locations of selected cross sections used in the hydraulic analyses and floodway computations. The current FIRM presents flooding information for the entire geographic area of Calhoun County. Previously, separate Flood Hazard Boundary Maps (FHBMs) and/or FIRMs were prepared for each identified flood-prone incorporated community and the unincorporated areas of the county. This countywide FIRM also includes flood hazard information that was presented separately on Flood Boundary and Floodway Maps (FBFMs), where applicable. Historical data relating to the maps prepared for each community, prior to the June 18, 1987 countywide, are presented in Table 4, “Community Map History”.
7.0 OTHER STUDIES FISs have been prepared for the unincorporated areas of Liberty County; as well as Jackson County and incorporated areas, Bay County and incorporated areas, and Gulf County and incorporated areas (FEMA, 1991, 2010, 2009, and 2007). Information pertaining to revised and unrevised flood hazards for each jurisdiction within Calhoun County, Florida has been compiled into this FIS. Therefore, this FIS supersedes all previously printed FIS reports, FIRMS, and FBFMs for all jurisdictions within Calhoun County, Florida.

27
COMMUNITY NAME INITIAL
IDENTIFICATION
FLOOD HAZARD BOUNDARY MAP REVISIONS DATE
FIRM EFFECTIVE DATE
FIRM REVISIONS DATE
Altha, Town of June 18, 2013 June 18, 2013 Blountstown, City of May 24, 1974 January 9, 1976 May 1, 1980 Calhoun County (Unincorporated Areas) February 10, 1978 None June 18, 1987
TAB
LE 4
FEDERAL EMERGENCY MANAGEMENT AGENCY
CALHOUN COUNTY, FL AND INCORPORATED AREAS
COMMUNITY MAP HISTORY

28
8.0 LOCATION OF DATA Information concerning the pertinent data used in the preparation of this FIS can be obtained by contacting FEMA, Federal Insurance and Mitigation Division, Koger Center - Rutgers Building, 3003 Chamblee Tucker Road, Atlanta, Georgia 30341.

29
9.0 BIBLIOGRAPHY AND REFERENCES Continental Aerial Survey, Topographic Maps, Scale 1:4,800, Contour Interval 1 Foot: Blountstown, Florida, 1977. Federal Emergency Management Agency, Flood Insurance Study, Bay County. Florida and Incorporated Areas, Washington, D.C., June 2, 2009. ----------, Flood Insurance Study. Gulf County. Florida and Incorporated Areas, Washington, D.C., September 28, 2007. ----------, Flood Insurance Study, Liberty County, Florida (Unincorporated Areas), Washington, D.C., July 16, 1991. ----------, Flood Insurance Study, Jackson County, Florida and Incorporated Areas, Washington, D.C., December 17, 2010. ----------, Flood Insurance Study. Calhoun County, Florida and Incorporated Areas, Washington, D.C., December 6, 2000. ----------, Federal Insurance Administration, Flood Insurance Study, City of Blountstown, Calhoun County, Florida, Washington, D.C., November 1, 1979 (FIS report), May 1, 1980 (FIRM). Northwest Florida Water Management District, Hydraulic Study of Apalachicola River, July 2011. Northwest Florida Water Management District, 2007 Calhoun County, Florida LiDAR, Vector Digital Data, March 18, 2007. Preble-Rish Consulting Engineers, Base Flood Elevation Study for the Chipola River, Calhoun County, Florida, February 1998. U.S. Army Corps of Engineers, Hydrologic Engineering Center, HEC-RAS River Analysis System, Version 2.1, Davis, California, October 1997. ----------, Mobile District, A Preliminary Study of the Hydrologic, Hydraulic, Geographic, and Sediment Transport Characteristics of the Apalachicola River System, August 1985. ----------, Hydrologic Engineering Center, HEC-2 Water Surface Profiles, Computer Program 723-X6-L202A, Davis, California, April 1984. U.S. Department of Agriculture, Soil Conservation Service, Technical Release No. 61, WSP-2 Computer Program, Washington, D.C., May 1976. U.S. Department of Commerce, Bureau of the Census, 2009 Census of Population, Number of Inhabitants. Florida, Washington, D.C., February 2007. U.S. Department of the Interior, Geological Survey, Office of Water Data Collection, Interagency Advisory Committee on Water Data, Guidelines for Determining Flood

30
Flow Frequency, Bulletin No. 17B, Reston, Virginia, revised September 1981, revised March 1982.
----------, 7.5-Minute Series Topographic Maps, Scale 1:24,000, Contour Interval 10 Feet: Calhoun County, Florida, 1945.

APPENDIX A Calhoun County
Limited Detail Studies - Water Surface Elevations

A-1
APPENDIX A
CALHOUN COUNTY LIMITED DETAIL STUDIES - WATER SURFACE ELEVATIONS
Cross Section Letter 1
Stream Station 2
(feet)
Flood Discharge
(cfs)
1% Annual Chance Water Surface
Elevation (feet NAVD 88)
CHINKAPIN BRANCH A 499 519 90.1 B 1,400 507 96.1 C 1,904 507 100.4
DITCH POND BRANCH A 279 610 110.0 B 1,113 610 117.0 C 1,742 581 121.7
FOURMILE CREEK 1,601 5,440 47.0 3 3,592 5,440 47.0 3 4,586 5,440 47.0 3 5,421 5,440 47.0 3 6,830 5,440 47.0 3
A 7,931 5,440 47.0 3 8,762 5,440 47.0 3 9,577 5,440 47.0 3
B 10,262 5,440 47.0 3 C 10,419 5,440 51.0 11,152 5,440 51.5
D 12,490 5,127 52.0 E 13,961 5,127 56.1 15,014 5,095 56.5 16,226 5,095 56.9 17,105 5,095 58.5
F 18,035 5,095 58.6 18,867 5,095 58.7 19,746 5,095 58.3 20,341 5,095 60.2
G 21,341 4,520 60.8 22,415 4,520 61.4 23,637 4,520 62.1 24,835 4,520 62.5

APPENDIX A
CALHOUN COUNTY LIMITED DETAIL STUDIES - WATER SURFACE ELEVATIONS
(Continued)
A-2
Cross Section Letter 1
Stream Station 2
(feet)
Flood Discharge
(cfs)
1 % Annual Chance Water Surface
Elevation (feet NAVD 88)
FOURMILE CREEK H 25,796 4,520 62.7 26,991 4,520 63.9 27,935 4,520 65.0 I 29,164 4,520 66.6 J 29,326 4,520 71.2 30,536 4,520 71.8 31,214 4,520 72.5 32,335 4,520 73.6
K 33,336 4,293 74.5 34,334 4,293 75.2 35,178 4,293 76.3 35,970 4,293 77.1
L 36,474 4,293 78.2 M 36,578 4,293 81.8 37,726 4,293 82.2 39,073 4,293 82.8 39,902 4,293 83.3
N 41,421 4,293 85.7 O 43,573 4,293 89.7 44,243 3,917 90.1 44,542 3,917 90.2 45,181 3,391 90.5
P 46,378 3,391 91.8 47,264 3,242 93.3 48,487 3,242 94.8 49,987 3,242 96.9
Q 51,487 3,242 99.2 52,488 2,807 100.6 53,582 2,807 102.4 54,548 2,807 104.4
R 56,418 2,773 106.8 58,421 2,732 109.2 60,584 2,732 113.8 62,084 2,732 115.7
S 63,085 2,583 117.0 64,191 2,583 118.9

APPENDIX A
CALHOUN COUNTY LIMITED DETAIL STUDIES - WATER SURFACE ELEVATIONS
(Continued)
A-3
Cross Section Letter 1
Stream Station 2
(feet)
Flood Discharge
(cfs)
1 % Annual Chance Water Surface
Elevation (feet NAVD 88)
FOURMILE CREEK 65,211 2,520 119.7
T 65,790 2,520 120.4 66,637 2,428 122.2
U 68,152 2,428 125.1 69,342 2,428 127.1
V 70,101 2,428 128.2 W 70,261 2,428 130.7 71,724 2,428 131.4 72,781 2,428 132.5 73,614 2,013 133.6
X 74,707 2,013 136.1 76,207 2,013 139.8 77,707 2,013 142.2 78,707 1,555 143.7
Y 80,185 1,555 146.2 Z 81,685 1,555 148.9 82,458 1,424 150.3 83,537 1,424 153.7 84,925 1,424 156.6
AA 85,926 1,424 158.7 86,537 1,424 161.0 87,655 1,424 164.1 88,628 1,424 166.8
AB 89,349 1,424 168.9 90,910 1,424 173.2 91,443 1,424 174.5
AC 92,313 1,424 177.5 AD 93,659 1,424 181.3
95,171 1,424 185.5 AE 96,297 358 186.4
96,489 358 187.3 96,682 358 188.1 96,874 358 188.9
AF 97,066 358 189.7 97,259 358 190.4 97,451 358 191.2

APPENDIX A
CALHOUN COUNTY LIMITED DETAIL STUDIES - WATER SURFACE ELEVATIONS
(Continued)
A-4
Cross Section Letter 1
Stream Station 2
(feet)
Flood Discharge
(cfs)
1 % Annual Chance Water Surface
Elevation (feet NAVD 88)
FOURMILE CREEK 97,643 358 193.1 97,799 358 193.2 97,954 358 193.6 98,265 358 196.0 98,265 358 196.0
FOURMILE CREEK UNNAMED TRIBUTARY 1 A 500 457 122.0 B 1,465 457 129.5 C 2,442 388 137.9
FOURMILE CREEK UNNAMED TRIBUTARY 2 A 384 409 135.6 B 821 409 139.1 C 1,502 394 144.2
FOURMILE CREEK UNNAMED TRIBUTARY 3 A 585 247 149.8 699 247 150.2 812 247 150.8 926 247 151.3
B 1,039 247 152.2 1,289 247 152.5 1,539 247 153.1 1,789 247 153.8
C 2,039 247 155.1 D 3,039 247 156.4 E 4,039 247 159.5 F 5,039 180 160.4 5,932 180 160.8
G 7,039 180 162.6 HOLLIMAN BRANCH
2 1,717 53.0 3 529 1,717 53.0 3 1,111 1,717 53.0 3 1,520 1,717 53.0 3
A 1,918 1,581 54.0 2,342 1,581 56.9

APPENDIX A
CALHOUN COUNTY LIMITED DETAIL STUDIES - WATER SURFACE ELEVATIONS
(Continued)
A-5
Cross Section Letter 1
Stream Station 2
(feet)
Flood Discharge
(cfs)
1 % Annual Chance Water Surface
Elevation (feet NAVD 88)
HOLLIMAN BRANCH 2,835 1,581 59.8
B 3,001 1,581 62.1 C 3,066 1,581 66.7 3,186 1,581 66.7 3,611 1,426 67.1
D 4,111 1,426 68.6 4,611 1,426 71.6 5,111 1,083 76.2 5,611 1,083 79.6
E 6,111 1,083 82.5 6,520 1,083 85.1 6,888 1,083 87.7 7,195 1,083 90.2
F 7,672 1,083 94.0 8,400 1,083 99.5 8,909 1,083 103.5 9,243 858 105.6
G 9,712 858 108.0 10,157 858 111.5 10,611 858 114.3 11,111 858 116.9
H 11,651 858 120.8 11,970 858 122.2 12,276 858 122.9 12,621 858 124.5 I 13,111 858 134.5 13,419 858 141.6 13,611 858 145.8 14,041 858 154.2 J 14,611 858 166.9 14,975 858 172.2
K 15,442 858 187.6 HOLLIS BRANCH
2 1,598 54.0 3 928 1,207 54.0 3 1,428 1,207 54.0 3

APPENDIX A
CALHOUN COUNTY LIMITED DETAIL STUDIES - WATER SURFACE ELEVATIONS
(Continued)
A-6
Cross Section Letter 1
Stream Station 2
(feet)
Flood Discharge
(cfs)
1 % Annual Chance Water Surface
Elevation (feet NAVD 88)
HOLLIS BRANCH 1,941 1,207 54.0 3
A 2,428 1,207 55.7 2,837 1,207 56.9
B 3,516 1,207 60.7 4,063 1,207 64.9 4,419 1,207 66.6 4,928 1,207 72.3
C 5,325 1,207 76.4 D 5,396 1,207 80.3 5,522 1,207 80.4
E 5,928 1,207 80.4 6,428 1,207 80.6
F 6,939 1,207 83.4 7,433 1,207 85.7 8,068 1,207 88.9 8,401 1,207 90.4
G 8,743 1,207 92.4 8,928 1,207 96.5 9,428 1,207 99.7 9,928 1,207 102.0
H 10,428 1,207 105.0 I 10,955 1,207 108.4 11,554 1,207 111.3 11,893 1,207 113.9 J 12,141 1,207 117.0 12,428 1,207 119.1 12,928 1,207 122.3 13,428 1,207 124.8
K 13,928 1,207 126.9 14,081 1,207 127.4 14,428 1,207 129.7 14,928 1,207 137.6
L 15,428 1,207 142.4 15,928 1,207 151.3
M 16,428 1,207 158.8
APPENDIX A
CALHOUN COUNTY LIMITED DETAIL STUDIES - WATER SURFACE ELEVATIONS
(Continued)
A-7
Cross Section Letter 1
Stream Station 2
(feet)
Flood Discharge
(cfs)
1 % Annual Chance Water Surface
Elevation (feet NAVD 88)
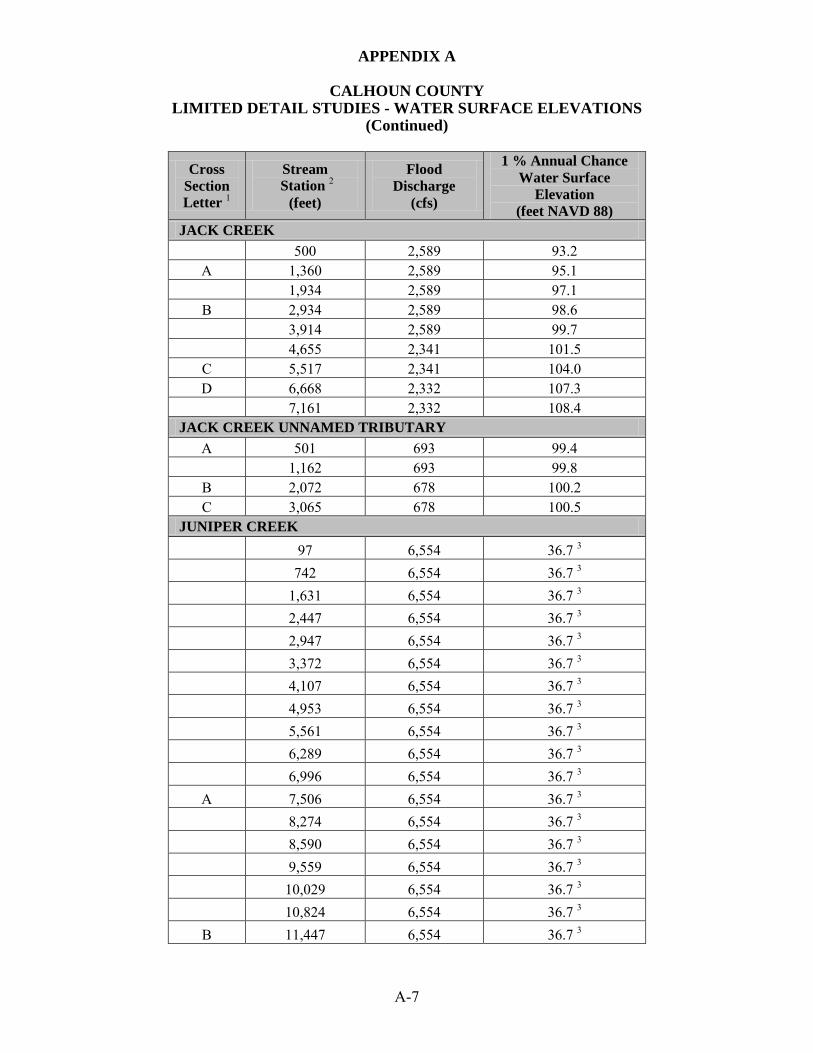
JACK CREEK 500 2,589 93.2
A 1,360 2,589 95.1 1,934 2,589 97.1
B 2,934 2,589 98.6 3,914 2,589 99.7 4,655 2,341 101.5
C 5,517 2,341 104.0 D 6,668 2,332 107.3 7,161 2,332 108.4
JACK CREEK UNNAMED TRIBUTARY A 501 693 99.4 1,162 693 99.8
B 2,072 678 100.2 C 3,065 678 100.5
JUNIPER CREEK 97 6,554 36.7 3 742 6,554 36.7 3 1,631 6,554 36.7 3 2,447 6,554 36.7 3 2,947 6,554 36.7 3 3,372 6,554 36.7 3 4,107 6,554 36.7 3 4,953 6,554 36.7 3 5,561 6,554 36.7 3 6,289 6,554 36.7 3 6,996 6,554 36.7 3
A 7,506 6,554 36.7 3 8,274 6,554 36.7 3 8,590 6,554 36.7 3 9,559 6,554 36.7 3 10,029 6,554 36.7 3 10,824 6,554 36.7 3
B 11,447 6,554 36.7 3

APPENDIX A
CALHOUN COUNTY LIMITED DETAIL STUDIES - WATER SURFACE ELEVATIONS
(Continued)
A-8
Cross Section Letter 1
Stream Station 2
(feet)
Flood Discharge
(cfs)
1 % Annual Chance Water Surface
Elevation (feet NAVD 88)
JUNIPER CREEK 12,411 6,554 36.7 3 12,668 6,554 36.7 3 13,325 6,554 36.7 3 14,108 6,554 37.1 14,701 6,554 37.5
C 15,447 6,554 38.0 15,941 6,554 38.2 16,536 6,554 38.5 16,877 6,554 38.8 17,447 6,554 39.2 17,997 6,554 39.5
D 18,349 6,554 39.8 18,947 6,554 40.1 19,466 6,554 40.3 20,127 6,554 40.7 20,947 6,554 41.2 21,447 6,554 41.5
E 22,063 6,554 42.2 22,447 6,554 42.4 23,447 6,554 43.1 23,947 6,554 43.4 24,580 6,554 43.7 25,501 6,554 44.1
F 26,030 6,554 44.3 26,740 6,554 44.6 27,295 6,554 44.9 27,978 6,554 45.2
G 28,112 6,554 44.9 H 28,180 6,554 45.6 28,339 6,554 46.2 29,600 6,104 46.8 30,520 6,104 47.1 31,424 6,104 47.5 32,427 6,104 48.0 33,249 6,104 48.4 I 34,181 6,104 48.9

APPENDIX A
CALHOUN COUNTY LIMITED DETAIL STUDIES - WATER SURFACE ELEVATIONS
(Continued)
A-9
Cross Section Letter 1
Stream Station 2
(feet)
Flood Discharge
(cfs)
1 % Annual Chance Water Surface
Elevation (feet NAVD 88)
JUNIPER CREEK 35,133 6,104 49.5 35,589 6,104 49.7 35,945 6,104 49.9 36,553 6,104 50.3 37,430 6,104 51.1 J 38,229 6,104 51.7 39,115 6,104 52.3 39,696 6,104 52.7 40,447 6,104 53.0 41,400 6,104 53.4 41,960 6,104 53.8
K 42,947 6,104 54.2 43,356 6,104 54.3 43,952 6,104 55.3 44,313 6,104 55.8 45,271 6,104 56.6 45,997 6,104 56.9 46,745 6,104 57.2
L 47,527 6,104 57.7 48,155 6,104 58.0 49,164 6,104 59.7 49,968 6,104 60.4 50,498 6,104 60.7
M 51,378 6,104 61.5 52,287 6,104 62.0 52,742 6,104 62.3 53,306 6,104 62.7
N 54,150 6,104 63.1 54,443 6,104 63.2 55,396 6,104 63.6 56,138 6,104 64.1 56,854 6,104 64.6 57,523 6,104 64.9
O 58,114 6,104 65.3 58,890 6,104 65.8 59,874 6,104 66.5

APPENDIX A
CALHOUN COUNTY LIMITED DETAIL STUDIES - WATER SURFACE ELEVATIONS
(Continued)
A-10
Cross Section Letter 1
Stream Station 2
(feet)
Flood Discharge
(cfs)
1 % Annual Chance Water Surface
Elevation (feet NAVD 88)
JUNIPER CREEK 60,352 6,104 66.8 60,947 6,104 67.4 62,044 6,104 68.0
P 62,403 6,104 68.2 62,806 6,104 68.5 63,447 6,104 69.1 64,417 6,104 69.8
Q 64,708 6,104 69.9 R 64,796 6,104 71.7 64,991 6,104 71.8 65,947 5,390 72.2 66,946 5,390 72.5 67,947 5,390 72.8 68,447 5,390 73.1
S 68,947 5,390 73.4 69,447 5,390 73.9 69,947 5,390 74.6 70,908 5,390 75.6 71,508 5,390 76.1 72,450 5,390 77.0
T 73,410 5,390 77.7 74,447 5,390 78.5 75,492 5,390 79.3 76,409 5,390 80.0 76,942 5,390 80.4 77,405 5,390 80.7
U 77,947 5,390 81.1 78,379 5,390 81.4 78,947 5,390 82.0 79,343 5,390 82.5 79,947 5,390 83.3 80,568 5,390 83.9
V 81,447 5,390 84.9 82,135 5,390 85.8 83,435 5,390 86.8 84,438 5,390 87.5

APPENDIX A
CALHOUN COUNTY LIMITED DETAIL STUDIES - WATER SURFACE ELEVATIONS
(Continued)
A-11
Cross Section Letter 1
Stream Station 2
(feet)
Flood Discharge
(cfs)
1 % Annual Chance Water Surface
Elevation (feet NAVD 88)
JUNIPER CREEK W 85,447 5,390 88.3 85,947 5,390 88.6 86,397 5,390 89.1 86,983 5,390 90.3
X 87,124 5,390 90.8 Y 87,301 5,390 94.0 87,465 4,487 94.0 87,947 4,487 94.1 88,947 4,487 94.3 89,447 4,487 94.4 89,890 4,487 94.6
Z 90,447 4,487 94.8 90,890 4,487 95.0 91,447 4,487 95.3 91,918 4,487 95.5 92,453 4,487 95.8 92,947 4,487 96.2
AA 93,447 4,487 96.7 93,795 4,487 96.9 94,077 4,487 97.2 94,444 4,487 97.5 94,997 4,487 97.9
AB 95,447 4,487 98.5 95,947 4,487 99.3 96,458 4,487 100.1 96,885 4,487 100.6
AC 97,389 4,487 101.1 98,012 4,487 101.5 98,447 4,487 101.7 98,937 4,487 102.2 99,447 4,487 103.2 99,947 4,487 103.9
AD 100,501 4,072 104.2 100,947 4,072 104.4 101,447 4,072 104.6 101,913 4,072 104.9
APPENDIX A
CALHOUN COUNTY LIMITED DETAIL STUDIES - WATER SURFACE ELEVATIONS
(Continued)
A-12
Cross Section Letter 1
Stream Station 2
(feet)
Flood Discharge
(cfs)
1 % Annual Chance Water Surface
Elevation (feet NAVD 88)
JUNIPER CREEK 102,461 4,072 105.3 103,037 4,072 105.7
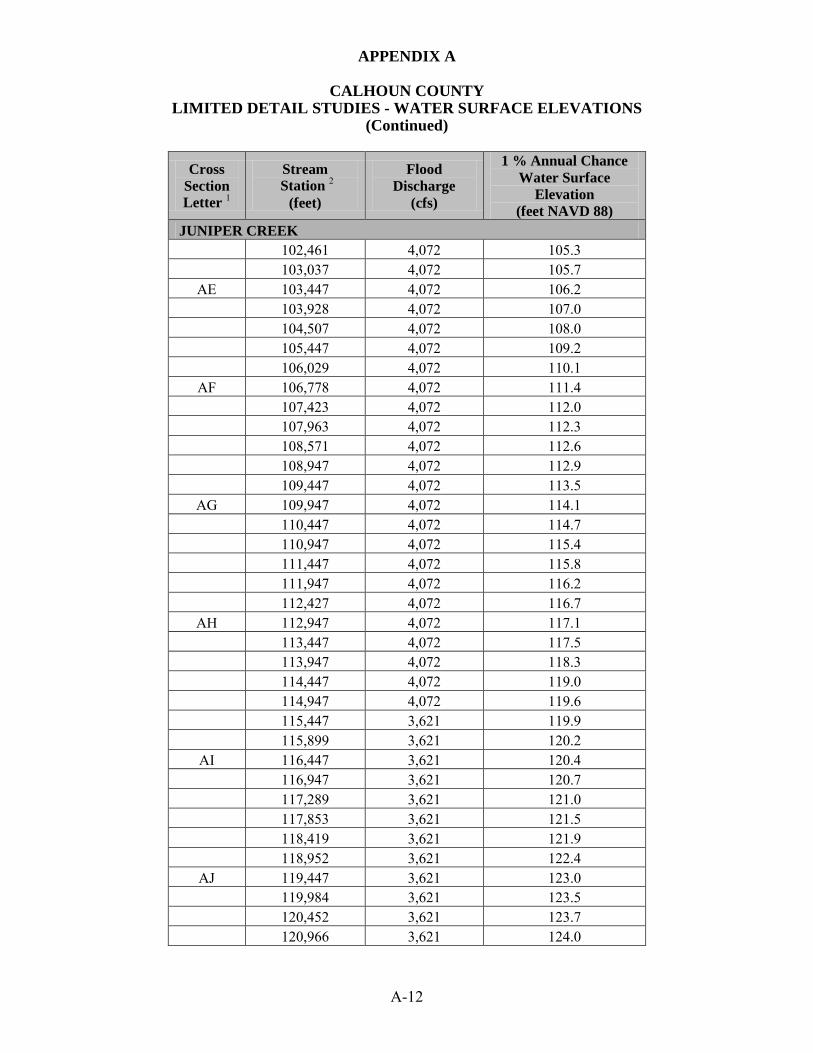
AE 103,447 4,072 106.2 103,928 4,072 107.0 104,507 4,072 108.0 105,447 4,072 109.2 106,029 4,072 110.1
AF 106,778 4,072 111.4 107,423 4,072 112.0 107,963 4,072 112.3 108,571 4,072 112.6 108,947 4,072 112.9 109,447 4,072 113.5
AG 109,947 4,072 114.1 110,447 4,072 114.7 110,947 4,072 115.4 111,447 4,072 115.8 111,947 4,072 116.2 112,427 4,072 116.7
AH 112,947 4,072 117.1 113,447 4,072 117.5 113,947 4,072 118.3 114,447 4,072 119.0 114,947 4,072 119.6 115,447 3,621 119.9 115,899 3,621 120.2
AI 116,447 3,621 120.4 116,947 3,621 120.7 117,289 3,621 121.0 117,853 3,621 121.5 118,419 3,621 121.9 118,952 3,621 122.4
AJ 119,447 3,621 123.0 119,984 3,621 123.5 120,452 3,621 123.7 120,966 3,621 124.0

APPENDIX A
CALHOUN COUNTY LIMITED DETAIL STUDIES - WATER SURFACE ELEVATIONS
(Continued)
A-13
Cross Section Letter 1
Stream Station 2
(feet)
Flood Discharge
(cfs)
1 % Annual Chance Water Surface
Elevation (feet NAVD 88)
JUNIPER CREEK 121,403 3,621 124.3 121,947 3,621 124.9
AK 122,447 3,621 125.3 122,947 3,621 125.7 123,452 3,621 126.3 123,947 3,621 127.0 124,447 3,621 127.7
AL 124,869 3,172 128.5 125,906 3,172 130.0 126,447 3,172 130.5 126,883 3,172 131.0 127,447 3,172 131.9
AM 127,947 3,172 132.6 128,447 3,172 133.2 128,947 3,172 133.9 129,447 3,172 135.0 129,947 3,172 135.7
AN 130,447 3,172 136.5 130,947 2,627 137.3
MAYO MILL BRANCH A 519 1,376 62.6 B 1,281 817 66.0 1,855 817 67.6 2,477 817 67.8
C 3,071 817 70.5 3,626 817 76.1 4,301 817 79.9
D 4,686 817 81.1 E 4,949 817 87.7 5,307 817 87.7 6,301 817 87.9 7,301 817 89.8
F 8,301 817 95.1 9,301 817 100.5 10,301 817 104.5
G 10,679 817 107.0
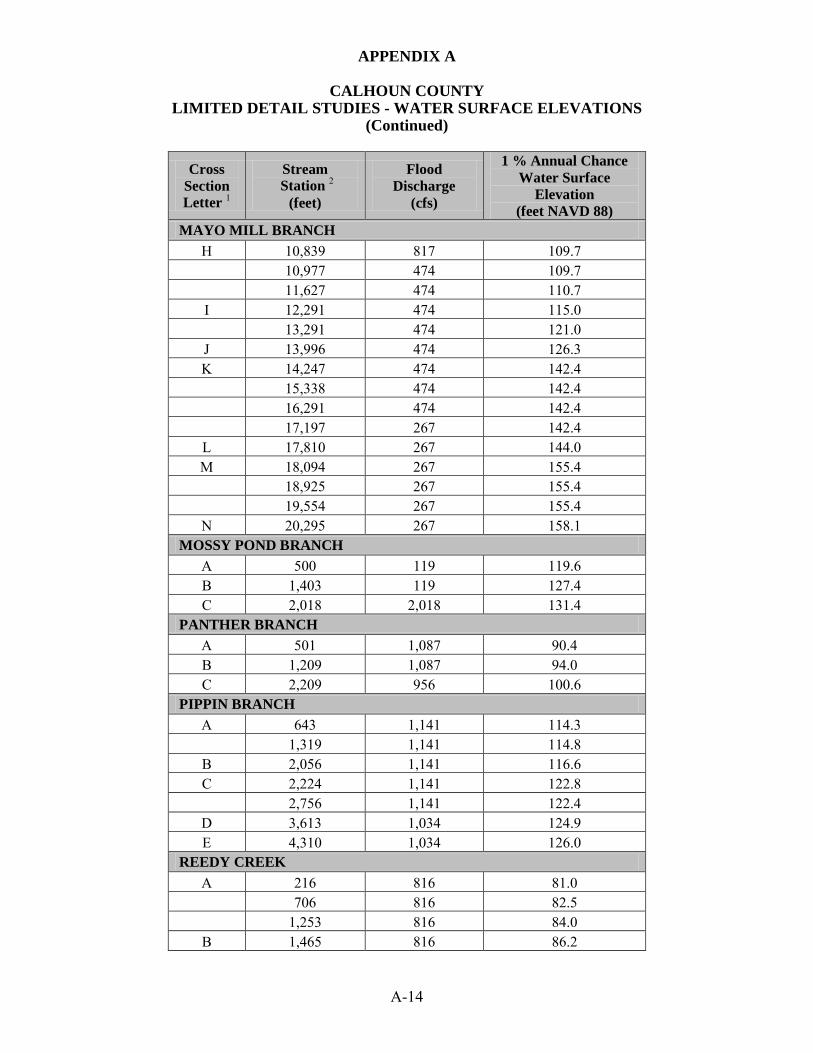
APPENDIX A
CALHOUN COUNTY LIMITED DETAIL STUDIES - WATER SURFACE ELEVATIONS
(Continued)
A-14
Cross Section Letter 1
Stream Station 2
(feet)
Flood Discharge
(cfs)
1 % Annual Chance Water Surface
Elevation (feet NAVD 88)
MAYO MILL BRANCH H 10,839 817 109.7 10,977 474 109.7 11,627 474 110.7 I 12,291 474 115.0 13,291 474 121.0 J 13,996 474 126.3 K 14,247 474 142.4 15,338 474 142.4 16,291 474 142.4 17,197 267 142.4
L 17,810 267 144.0 M 18,094 267 155.4 18,925 267 155.4 19,554 267 155.4
N 20,295 267 158.1 MOSSY POND BRANCH
A 500 119 119.6 B 1,403 119 127.4 C 2,018 2,018 131.4
PANTHER BRANCH A 501 1,087 90.4 B 1,209 1,087 94.0 C 2,209 956 100.6
PIPPIN BRANCH A 643 1,141 114.3 1,319 1,141 114.8
B 2,056 1,141 116.6 C 2,224 1,141 122.8 2,756 1,141 122.4
D 3,613 1,034 124.9 E 4,310 1,034 126.0
REEDY CREEK A 216 816 81.0 706 816 82.5 1,253 816 84.0
B 1,465 816 86.2

APPENDIX A
CALHOUN COUNTY LIMITED DETAIL STUDIES - WATER SURFACE ELEVATIONS
(Continued)
A-15
Cross Section Letter 1
Stream Station 2
(feet)
Flood Discharge
(cfs)
1 % Annual Chance Water Surface
Elevation (feet NAVD 88)
REEDY CREEK C 1,563 816 92.8 1,705 816 92.8 2,206 816 92.8 2,656 816 92.8
D 3,206 816 92.8 3,706 816 92.8 4,226 816 92.9 4,676 609 93.1
E 5,206 609 93.5 5,706 609 94.3 6,210 609 95.9
F 6,697 609 96.7 7,206 403 98.1 7,706 403 99.3 8,206 403 99.9
G 8,706 403 100.5 9,200 403 101.3 9,706 403 102.3 10,216 403 103.0
H 10,706 403 103.3 11,193 403 103.5 11,641 403 104.3 I 11,828 403 105.4 J 11,871 403 106.3 12,055 403 106.4 12,706 403 107.1
K 13,206 403 107.7 13,684 403 108.6
L 14,206 403 110.2 RING JAW BRANCH
93 1,797 57.0 3 692 1,635 57.0 3 1,195 1,635 57.0 3 2,179 1,635 57.0 3 2,979 1,635 57.0 3

APPENDIX A
CALHOUN COUNTY LIMITED DETAIL STUDIES - WATER SURFACE ELEVATIONS
(Continued)
A-16
Cross Section Letter 1
Stream Station 2
(feet)
Flood Discharge
(cfs)
1 % Annual Chance Water Surface
Elevation (feet NAVD 88)
RING JAW BRANCH A 3,400 1,635 58.5 3,946 1,635 65.0 4,346 1,635 68.4 4,711 1,635 70.7
B 4,938 1,635 74.3 C 5,004 1,635 79.9 5,179 1,635 79.9 5,679 1,635 79.9
D 6,179 1,635 80.0 6,679 1,635 82.7 7,179 1,635 85.7
E 7,702 1,064 87.7 8,179 1,064 90.7 8,679 1,064 94.2
F 9,179 1,064 97.0 9,679 1,064 102.2 10,179 1,064 106.9
G 10,679 1,064 109.2 11,179 1,064 112.0 11,679 1,064 115.0
H 12,179 1,064 118.4 12,679 1,064 124.8 13,179 1,064 130.6 I 13,679 1,064 135.1 14,179 1,064 142.1 J 14,679 1,064 147.1 15,179 1,064 153.8
K 15,671 1,064 163.1 SUTTON CREEK
17,656 1,740 62.0 3 O 17,913 1,740 62.0 3 18,149 1,740 62.0 3
P 18,267 1,740 62.0 3 Q 18,345 1,740 62.0 3

APPENDIX A
CALHOUN COUNTY LIMITED DETAIL STUDIES - WATER SURFACE ELEVATIONS
(Continued)
A-17
Cross Section Letter 1
Stream Station 2
(feet)
Flood Discharge
(cfs)
1 % Annual Chance Water Surface
Elevation (feet NAVD 88)
SUTTON CREEK 18,518 1,740 62.0 3
R 19,015 1,707 62.0 3 19,515 1,707 62.0 3
S 20,015 1,707 62.0 3 20,527 1,707 62.0 3 21,015 1,707 62.0 3
T 21,446 1,707 62.0 3 21,842 1,707 62.4
U 21,992 1,707 63.2 V 22,069 1,707 66.5 22,209 1,707 66.5 22,537 1,636 66.5 23,095 1,636 66.6
W 23,557 1,636 67.0 24,009 1,636 66.8 24,515 1,636 66.9 25,015 1,636 67.2 25,531 1,507 67.3
X 26,015 1,507 67.6 26,515 1,507 67.9 27,015 1,476 68.3
Y 27,515 1,476 68.9 28,010 1,476 70.2 28,562 1,401 71.6 29,023 1,401 72.6
Z 29,515 1,401 73.7 30,015 1,401 74.5 30,515 1,401 75.0
AA 30,698 1,401 75.1 AB 30,747 1,401 79.6
30,966 1,401 79.6 31,515 1,401 79.6 32,015 1,401 79.7
AC 32,508 1,308 79.8 33,015 1,308 80.0

APPENDIX A
CALHOUN COUNTY LIMITED DETAIL STUDIES - WATER SURFACE ELEVATIONS
(Continued)
A-18
Cross Section Letter 1
Stream Station 2
(feet)
Flood Discharge
(cfs)
1 % Annual Chance Water Surface
Elevation (feet NAVD 88)
SUTTON CREEK 33,515 1,308 80.2 33,970 1,308 80.3
AD 34,515 508 81.2 35,015 508 84.1 35,515 508 86.5 35,886 508 87.7
AE 36,515 508 88.2 37,015 508 89.2 37,515 508 91.7 38,007 508 92.4
AF 38,515 508 93.1 39,044 508 95.2 39,515 508 100.6 40,015 508 102.4 40,375 508 104.3
AG 40,606 508 105.4 AH 40,679 508 106.5
40,836 508 106.5 41,151 508 106.6 41,515 508 107.2
AI 42,015 508 108.6 42,515 508 109.0
AJ 43,014 508 109.3 TAYLOR BRANCH
A 500 589 116.7 B 1,214 589 123.0 C 2,070 554 130.1
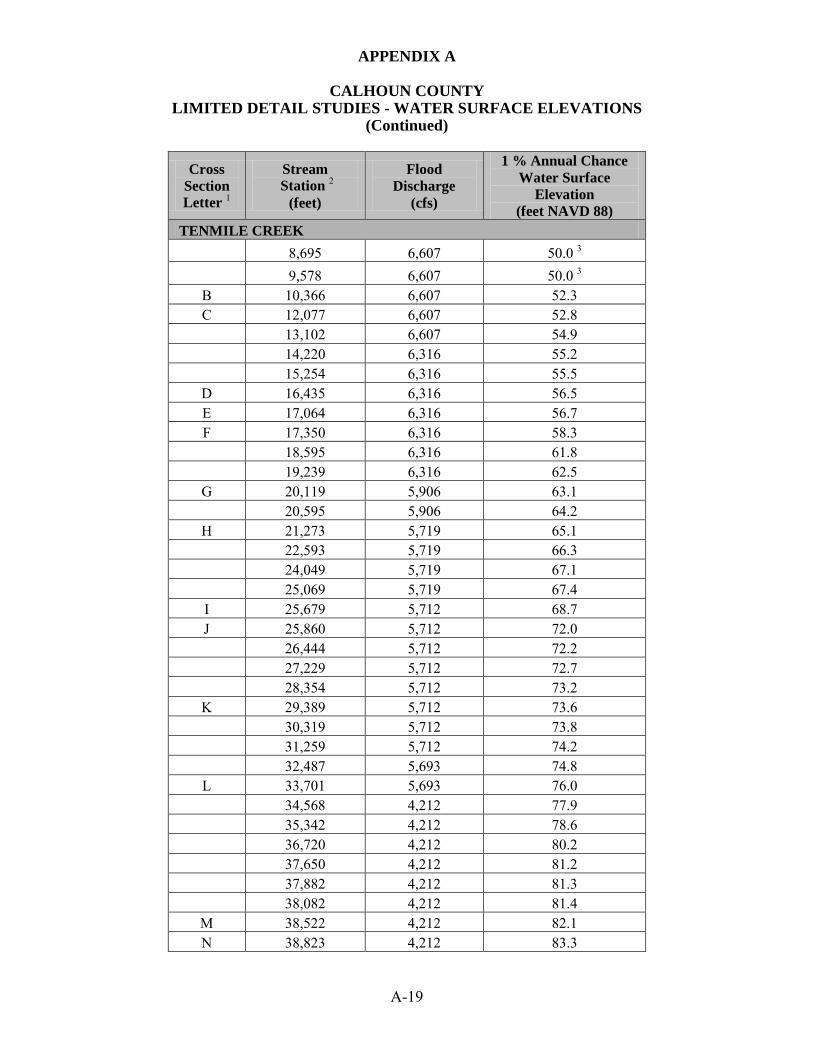
TENMILE CREEK 1,079 6,607 50.0 3 1,676 6,607 50.0 3 2,882 6,607 50.0 3 4,198 6,607 50.0 3 5,365 6,607 50.0 3 6,586 6,607 50.0 3
A 7,736 6,607 50.0 3
APPENDIX A
CALHOUN COUNTY LIMITED DETAIL STUDIES - WATER SURFACE ELEVATIONS
(Continued)
A-19
Cross Section Letter 1
Stream Station 2
(feet)
Flood Discharge
(cfs)
1 % Annual Chance Water Surface
Elevation (feet NAVD 88)
TENMILE CREEK 8,695 6,607 50.0 3 9,578 6,607 50.0 3
B 10,366 6,607 52.3 C 12,077 6,607 52.8 13,102 6,607 54.9 14,220 6,316 55.2 15,254 6,316 55.5
D 16,435 6,316 56.5 E 17,064 6,316 56.7 F 17,350 6,316 58.3 18,595 6,316 61.8 19,239 6,316 62.5
G 20,119 5,906 63.1 20,595 5,906 64.2
H 21,273 5,719 65.1 22,593 5,719 66.3 24,049 5,719 67.1 25,069 5,719 67.4 I 25,679 5,712 68.7 J 25,860 5,712 72.0 26,444 5,712 72.2 27,229 5,712 72.7 28,354 5,712 73.2
K 29,389 5,712 73.6 30,319 5,712 73.8 31,259 5,712 74.2 32,487 5,693 74.8
L 33,701 5,693 76.0 34,568 4,212 77.9 35,342 4,212 78.6 36,720 4,212 80.2 37,650 4,212 81.2 37,882 4,212 81.3 38,082 4,212 81.4
M 38,522 4,212 82.1 N 38,823 4,212 83.3

APPENDIX A
CALHOUN COUNTY LIMITED DETAIL STUDIES - WATER SURFACE ELEVATIONS
(Continued)
A-20
Cross Section Letter 1
Stream Station 2
(feet)
Flood Discharge
(cfs)
1 % Annual Chance Water Surface
Elevation (feet NAVD 88)
TENMILE CREEK 39,206 4,212 83.7 40,172 4,212 84.1 41,348 4,212 84.9
O 42,302 4,212 85.7 43,084 4,212 86.3 44,089 3,868 86.9 44,536 3,868 87.2 44,957 3,868 87.4 45,678 3,868 87.7
P 46,668 3,868 89.0 47,628 3,868 90.8
Q 48,668 3,859 91.7 49,276 3,859 92.0
R 50,224 3,859 92.7 51,262 3,802 93.6
S 52,187 3,802 95.0 52,946 3,802 96.8 53,946 3,802 99.1
T 54,946 3,802 101.1 55,946 3,802 102.2 56,913 3,802 103.1 57,946 3,802 104.7
U 58,946 3,802 105.9 59,946 3,802 106.8 60,840 3,802 107.9 61,946 3,802 110.1
V 62,946 3,802 112.5 63,946 3,802 113.7 64,852 3,253 114.8
W 65,241 3,253 116.9 X 65,401 3,253 121.9 65,726 3,253 121.9 66,615 3,147 121.9 67,485 3,147 122.0
Y 68,554 2,958 122.2 69,811 2,958 123.1

APPENDIX A
CALHOUN COUNTY LIMITED DETAIL STUDIES - WATER SURFACE ELEVATIONS
(Continued)
A-21
Cross Section Letter 1
Stream Station 2
(feet)
Flood Discharge
(cfs)
1 % Annual Chance Water Surface
Elevation (feet NAVD 88)
TENMILE CREEK 70,811 2,958 126.1
Z 71,811 2,958 128.2 72,811 2,387 130.4
AA 73,707 2,387 132.3 AB 74,707 2,387 135.0
75,707 2,387 137.3 76,707 2,387 140.8
AC 77,707 2,387 143.1 78,575 2,387 146.5 79,252 2,387 149.4
AD 79,988 2,387 151.6 AE 80,154 2,387 156.5
80,747 2,387 156.7 81,342 2,387 156.9 82,256 2,387 158.2
AF 83,248 2,387 159.8 84,571 2,134 163.2 86,108 2,134 169.7 86,707 2,134 170.8
AG 87,707 2,134 172.3 88,707 1,211 173.8 89,715 1,211 177.2 90,715 1,211 179.6
AH 91,767 1,211 183.1 92,900 1,211 185.3 94,169 1,211 189.5 94,715 1,211 191.6
AI 95,602 1,211 193.7 96,715 409 196.4 97,857 409 202.6
AJ 98,706 409 205.3 TENMILE CREEK UNNAMED TRIBUTARY 1
A 504 896 66.1 1,284 896 74.2 1,830 896 77.1 2,616 896 82.3
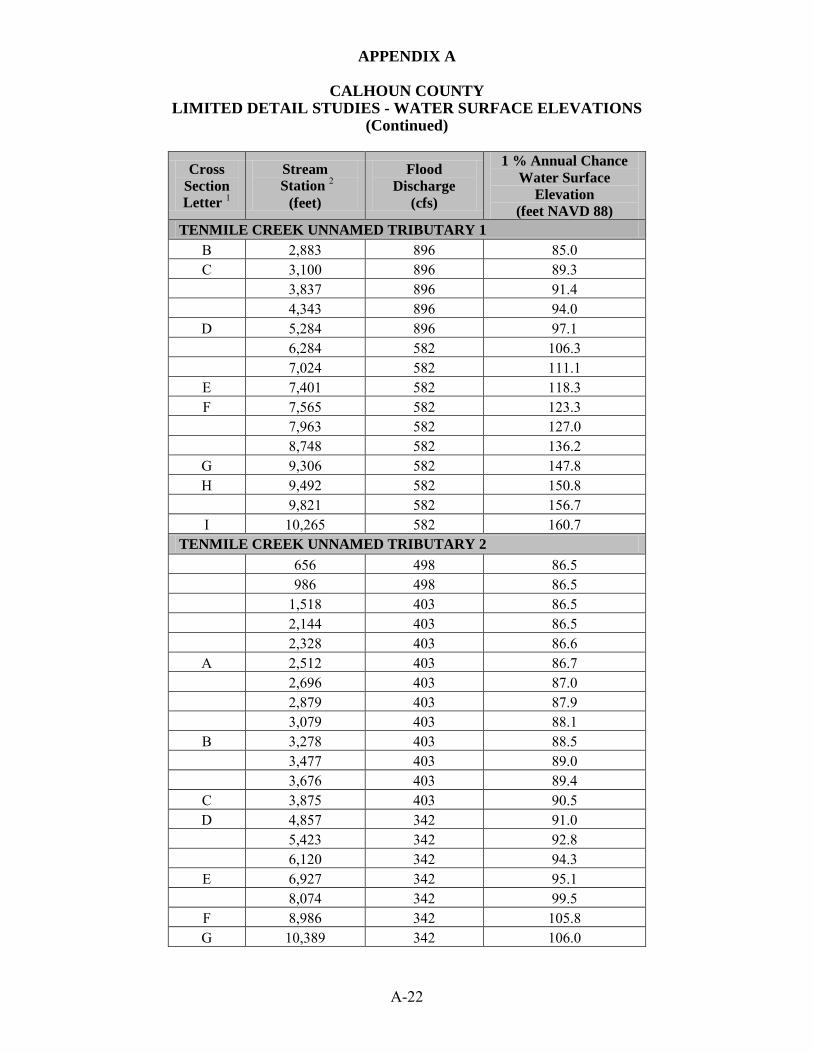
APPENDIX A
CALHOUN COUNTY LIMITED DETAIL STUDIES - WATER SURFACE ELEVATIONS
(Continued)
A-22
Cross Section Letter 1
Stream Station 2
(feet)
Flood Discharge
(cfs)
1 % Annual Chance Water Surface
Elevation (feet NAVD 88)
TENMILE CREEK UNNAMED TRIBUTARY 1 B 2,883 896 85.0 C 3,100 896 89.3 3,837 896 91.4 4,343 896 94.0
D 5,284 896 97.1 6,284 582 106.3 7,024 582 111.1
E 7,401 582 118.3 F 7,565 582 123.3 7,963 582 127.0 8,748 582 136.2
G 9,306 582 147.8 H 9,492 582 150.8 9,821 582 156.7 I 10,265 582 160.7
TENMILE CREEK UNNAMED TRIBUTARY 2 656 498 86.5 986 498 86.5 1,518 403 86.5 2,144 403 86.5 2,328 403 86.6
A 2,512 403 86.7 2,696 403 87.0 2,879 403 87.9 3,079 403 88.1
B 3,278 403 88.5 3,477 403 89.0 3,676 403 89.4
C 3,875 403 90.5 D 4,857 342 91.0 5,423 342 92.8 6,120 342 94.3
E 6,927 342 95.1 8,074 342 99.5
F 8,986 342 105.8 G 10,389 342 106.0

APPENDIX A
CALHOUN COUNTY LIMITED DETAIL STUDIES - WATER SURFACE ELEVATIONS
(Continued)
A-23
Cross Section Letter 1
Stream Station 2
(feet)
Flood Discharge
(cfs)
1 % Annual Chance Water Surface
Elevation (feet NAVD 88)
TENMILE CREEK UNNAMED TRIBUTARY 2 11,536 328 106.0
F 4,630 328 105.8 G 6,033 328 106.0 7,180 328 106.0
TENMILE CREEK UNNAMED TRIBUTARY 3 A 290 341 91.0 1,336 341 94.1
B 2,044 341 98.5 3,044 281 99.8
C 4,026 281 102.2 TENMILE CREEK UNNAMED TRIBUTARY 4
A 560 241 121.9 1,062 241 121.9
B 1,506 241 121.9 2,506 241 122.0
C 3,506 241 122.3 D 4,506 223 126.6 E 5,313 223 127.7 5,840 223 128.0
TENMILE CREEK UNNAMED TRIBUTARY 5 A 500 380 122.0 1,101 371 122.0 1,343 371 122.0
B 2,005 371 124.0 2,247 371 126.9 2,343 371 127.9 2,584 371 129.9
C 2,823 371 130.5 3,174 371 130.7 3,343 371 130.7
D 3,931 371 130.8 4,343 371 131.1 4,937 371 131.6
E 5,334 371 131.9 TENMILE CREEK UNNAMED TRIBUTARY 6
A 500 932 129.3
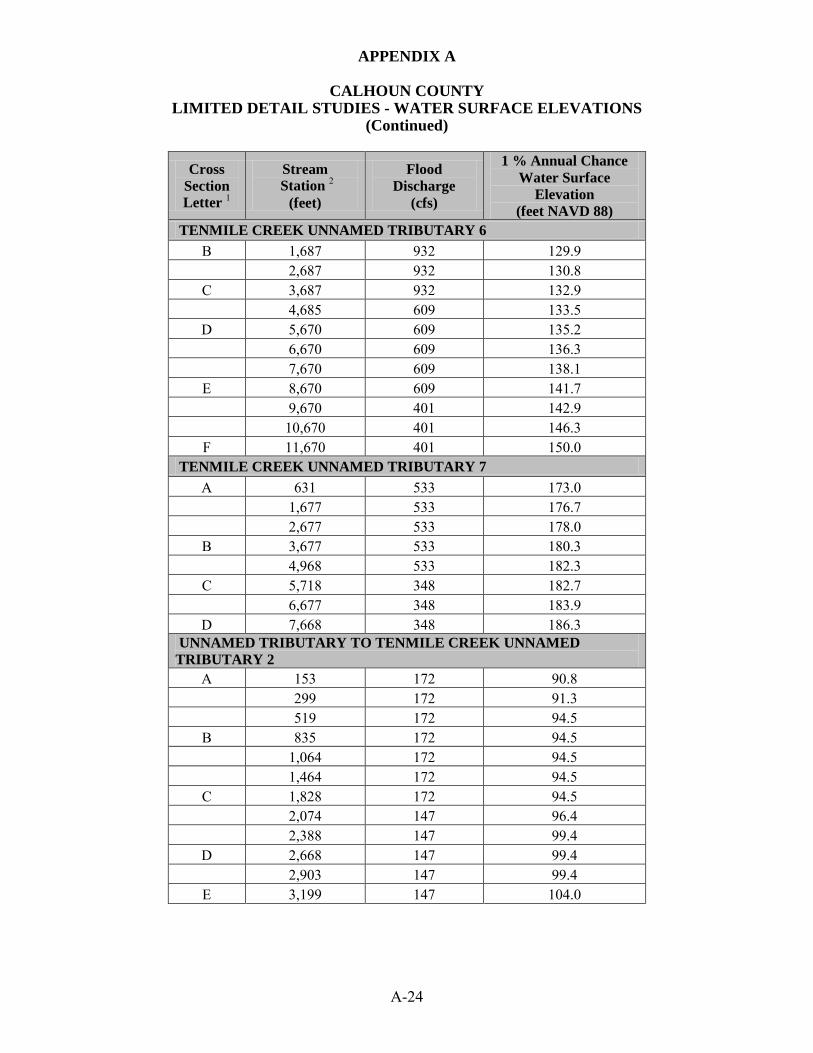
APPENDIX A
CALHOUN COUNTY LIMITED DETAIL STUDIES - WATER SURFACE ELEVATIONS
(Continued)
A-24
Cross Section Letter 1
Stream Station 2
(feet)
Flood Discharge
(cfs)
1 % Annual Chance Water Surface
Elevation (feet NAVD 88)
TENMILE CREEK UNNAMED TRIBUTARY 6 B 1,687 932 129.9 2,687 932 130.8
C 3,687 932 132.9 4,685 609 133.5
D 5,670 609 135.2 6,670 609 136.3 7,670 609 138.1
E 8,670 609 141.7 9,670 401 142.9 10,670 401 146.3
F 11,670 401 150.0 TENMILE CREEK UNNAMED TRIBUTARY 7
A 631 533 173.0 1,677 533 176.7 2,677 533 178.0
B 3,677 533 180.3 4,968 533 182.3
C 5,718 348 182.7 6,677 348 183.9
D 7,668 348 186.3 UNNAMED TRIBUTARY TO TENMILE CREEK UNNAMED TRIBUTARY 2
A 153 172 90.8 299 172 91.3 519 172 94.5
B 835 172 94.5 1,064 172 94.5 1,464 172 94.5
C 1,828 172 94.5 2,074 147 96.4 2,388 147 99.4
D 2,668 147 99.4 2,903 147 99.4
E 3,199 147 104.0

APPENDIX A
CALHOUN COUNTY LIMITED DETAIL STUDIES - WATER SURFACE ELEVATIONS
(Continued)
A-25
Cross Section Letter 1
Stream Station 2
(feet)
Flood Discharge
(cfs)
1 % Annual Chance Water Surface
Elevation (feet NAVD 88)
UNNAMED TRIBUTARY TO TENMILE CREEK UNNAMED TRIBUTARY 6
A 501 313 133.4 1,364 313 134.9
B 2,231 313 142.5 C 2,817 313 148.6
WATSON BRANCH A 239 570 92.2 B 1,065 570 96.6 C 1,660 524 102.1
WHITEWATER CREEK 396 3,004 77.3 878 3,004 77.9 1,862 3,004 80.0 2,133 3,004 82.2 2,330 3,004 83.8
A 2,790 3,004 83.8 3,436 3,004 83.9 4,778 3,004 87.5
B 5,778 3,004 90.4 6,703 2,487 91.8 7,753 2,487 93.9
C 8,595 2,487 97.5 9,573 2,132 99.5
D 10,573 2,132 101.7 E 11,573 2,132 103.6 12,574 1,781 106.5 13,799 1,781 109.2
F 14,799 1,781 111.2 15,800 1,057 112.7 17,164 1,057 116.0 18,164 1,057 122.4
G 19,164 1,057 127.2 20,166 541 133.3 21,018 541 138.0 21,888 541 139.9
H 22,624 541 140.4

APPENDIX A
CALHOUN COUNTY LIMITED DETAIL STUDIES - WATER SURFACE ELEVATIONS
(Continued)
A-26
Cross Section Letter 1
Stream Station 2
(feet)
Flood Discharge
(cfs)
1 % Annual Chance Water Surface
Elevation (feet NAVD 88)
WHITEWATER CREEK 23,635 541 144.3 24,257 541 147.3 I 24,888 541 147.7 25,996 541 153.0 26,993 280 153.6 J 27,888 280 162.5
WHITEWATER CREEK UNNAMED TRIBUTARY 1 448 433 90.9
A 1,630 433 98.3 B 2,477 385 102.3
WHITEWATER CREEK UNNAMED TRIBUTARY 2 519 602 106.1 1,853 602 113.7
A 2,853 602 121.2 3,853 602 128.6
B 4,656 602 134.5 C 4,827 602 140.4 5,203 437 143.6 5,656 437 149.1
D 5,853 437 151.2 6,127 437 156.1 6,466 437 160.4 6,720 437 162.5
E 6,830 437 163.5 7,192 437 167.4 7,468 437 171.5 7,651 437 174.5
F 7,836 437 176.3 WHITEWATER CREEK UNNAMED TRIBUTARY 3
767 722 112.4 A 2,375 722 115.5 3,963 722 122.1 4,963 722 126.4
B 5,684 722 129.6 C 5,883 722 133.3 6,083 722 133.3
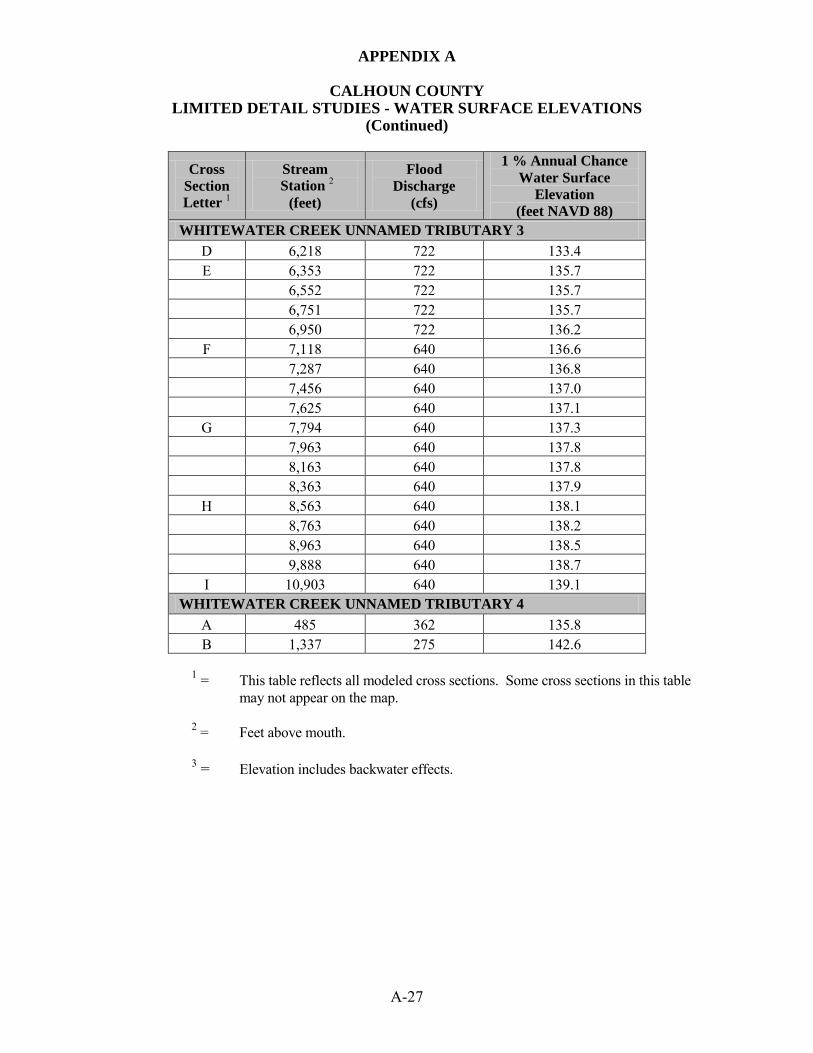
APPENDIX A
CALHOUN COUNTY LIMITED DETAIL STUDIES - WATER SURFACE ELEVATIONS
(Continued)
A-27
Cross Section Letter 1
Stream Station 2
(feet)
Flood Discharge
(cfs)
1 % Annual Chance Water Surface
Elevation (feet NAVD 88)
WHITEWATER CREEK UNNAMED TRIBUTARY 3 D 6,218 722 133.4 E 6,353 722 135.7 6,552 722 135.7 6,751 722 135.7 6,950 722 136.2
F 7,118 640 136.6 7,287 640 136.8 7,456 640 137.0 7,625 640 137.1
G 7,794 640 137.3 7,963 640 137.8 8,163 640 137.8 8,363 640 137.9
H 8,563 640 138.1 8,763 640 138.2 8,963 640 138.5 9,888 640 138.7 I 10,903 640 139.1
WHITEWATER CREEK UNNAMED TRIBUTARY 4 A 485 362 135.8 B 1,337 275 142.6
1 = This table reflects all modeled cross sections. Some cross sections in this table
may not appear on the map. 2 = Feet above mouth. 3 = Elevation includes backwater effects.
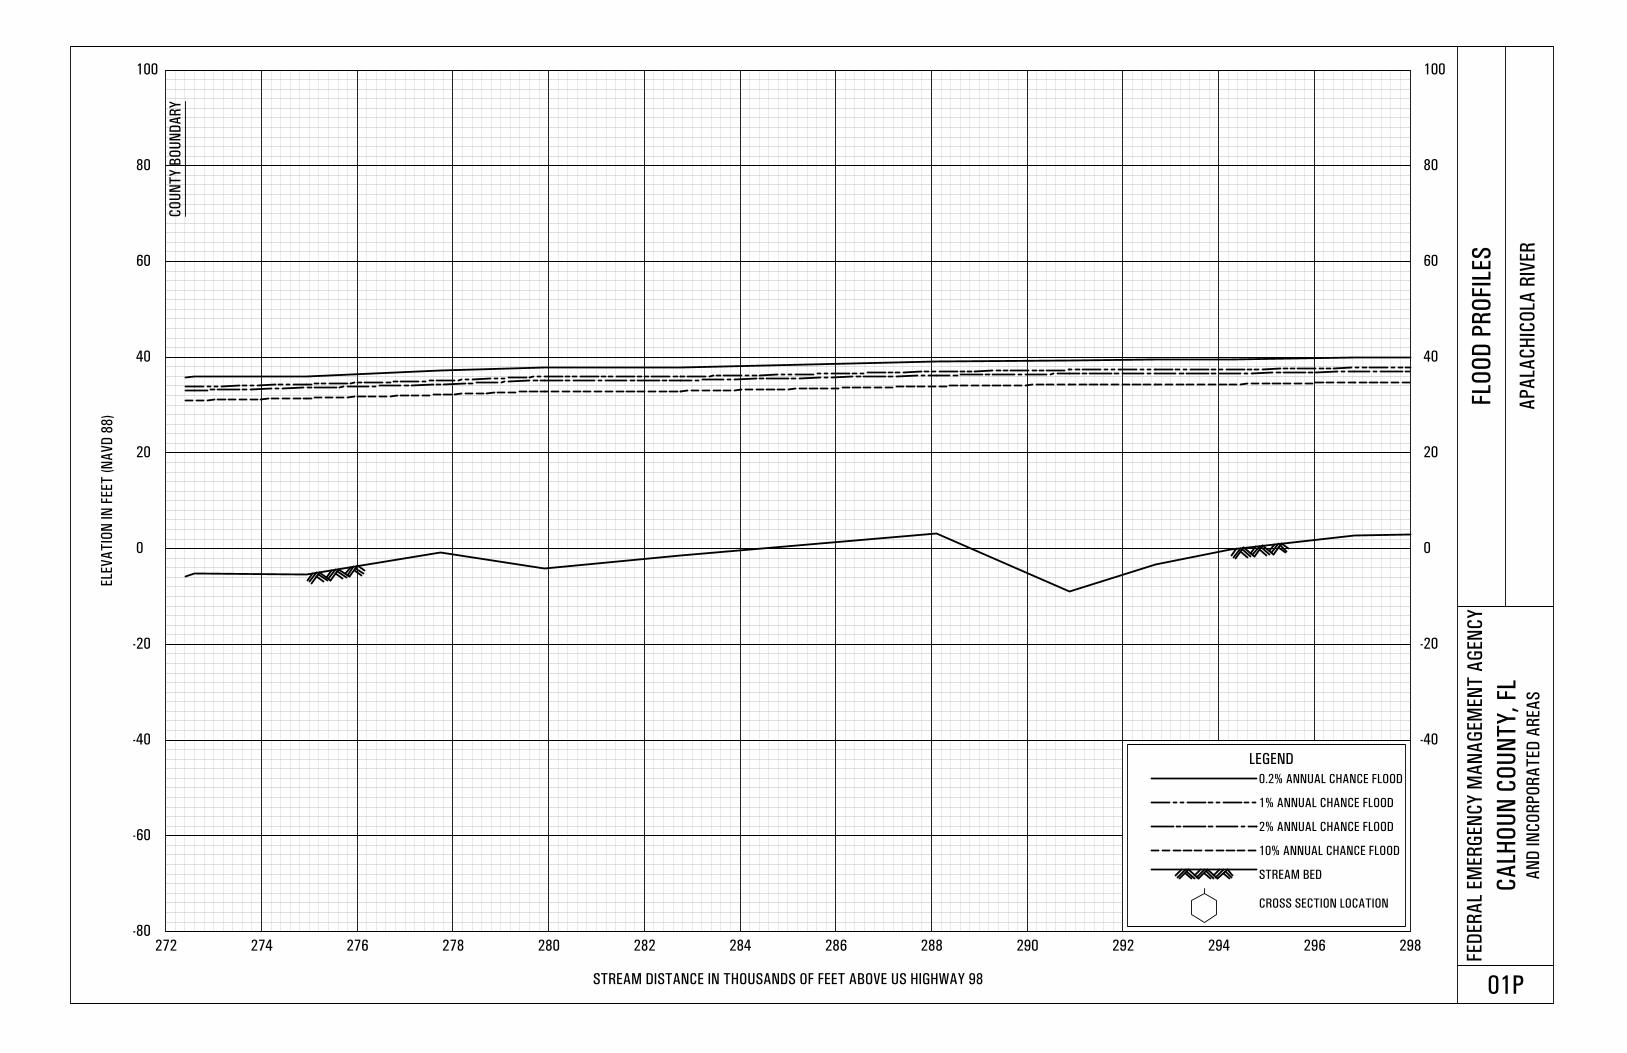
-80
-60
-40 -40
-20 -20
0 0
20 20
40 40
60 60
80 80
100 100
272 274 276 278 280 282 284 286 288 290 292 294 296 298
ELEV
ATIO
N IN
FEE
T (N
AVD
88)
STREAM DISTANCE IN THOUSANDS OF FEET ABOVE US HIGHWAY 98
FEDE
RAL
EME R
GENC
Y M
A NAG
EMEN
T AG
ENC Y
CAL H
OUN
COU N
TY, F
LAN
D IN
COR P
ORAT
ED A
R EAS
F LOO
D PR
O FIL
ES
APAL
ACHI
COL A
RIV
E R
01P
LEGEND0.2% ANNUAL CHANCE FLOOD
1% ANNUAL CHANCE FLOOD
2% ANNUAL CHANCE FLOOD
10% ANNUAL CHANCE FLOOD
STREAM BED
CROSS SECTION LOCATION
COUN
TY B
OUN D
ARY

-80
-60
-40 -40
-20 -20
0 0
20 20
40 40
60 60
80 80
100 100
298 300 302 304 306 308 310 312 314 316 318 320 322 324
ELEV
ATIO
N IN
FEE
T (N
AVD
88)
STREAM DISTANCE IN THOUSANDS OF FEET ABOVE US HIGHWAY 98
FEDE
RAL
EME R
GENC
Y M
A NAG
EMEN
T AG
ENC Y
CAL H
OUN
COU N
TY, F
LAN
D IN
COR P
ORAT
ED A
R EAS
F LOO
D PR
O FIL
ES
APAL
ACHI
COL A
RIV
E R
02P
LEGEND0.2% ANNUAL CHANCE FLOOD
1% ANNUAL CHANCE FLOOD
2% ANNUAL CHANCE FLOOD
10% ANNUAL CHANCE FLOOD
STREAM BED
CROSS SECTION LOCATION

-80
-60
-40 -40
-20 -20
0 0
20 20
40 40
60 60
80 80
100 100
324 326 328 330 332 334 336 338 340 342 344 346 348 350
ELEV
ATIO
N IN
FEE
T (N
AVD
88)
STREAM DISTANCE IN THOUSANDS OF FEET ABOVE US HIGHWAY 98
FEDE
RAL
EME R
GENC
Y M
A NAG
EMEN
T AG
ENC Y
CAL H
OUN
COU N
TY, F
LAN
D IN
COR P
ORAT
ED A
R EAS
F LOO
D PR
O FIL
ES
APAL
ACHI
COL A
RIV
E R
03P
LEGEND0.2% ANNUAL CHANCE FLOOD
1% ANNUAL CHANCE FLOOD
2% ANNUAL CHANCE FLOOD
10% ANNUAL CHANCE FLOOD
STREAM BED
CROSS SECTION LOCATION

-80
-60
-40 -40
-20 -20
0 0
20 20
40 40
60 60
80 80
100 100
350 352 354 356 358 360 362 364 366 368 370 372 374 376
ELEV
ATIO
N IN
FEE
T (N
AVD
88)
STREAM DISTANCE IN THOUSANDS OF FEET ABOVE US HIGHWAY 98
FEDE
RAL
EME R
GENC
Y M
A NAG
EMEN
T AG
ENC Y
CAL H
OUN
COU N
TY, F
LAN
D IN
COR P
ORAT
ED A
R EAS
F LOO
D PR
O FIL
ES
APAL
ACHI
COL A
RIV
E R
04P
LEGEND0.2% ANNUAL CHANCE FLOOD
1% ANNUAL CHANCE FLOOD
2% ANNUAL CHANCE FLOOD
10% ANNUAL CHANCE FLOOD
STREAM BED
CROSS SECTION LOCATION

-80
-60
-40 -40
-20 -20
0 0
20 20
40 40
60 60
80 80
100 100
376 378 380 382 384 386 388 390 392 394 396 398 400 402
ELEV
ATIO
N IN
FEE
T (N
AVD
88)
STREAM DISTANCE IN THOUSANDS OF FEET ABOVE US HIGHWAY 98
FEDE
RAL
EME R
GENC
Y M
A NAG
EMEN
T AG
ENC Y
CAL H
OUN
COU N
TY, F
LAN
D IN
COR P
ORAT
ED A
R EAS
F LOO
D PR
O FIL
ES
APAL
ACHI
COL A
RIV
E R
05P
LEGEND0.2% ANNUAL CHANCE FLOOD
1% ANNUAL CHANCE FLOOD
2% ANNUAL CHANCE FLOOD
10% ANNUAL CHANCE FLOOD
STREAM BED
CROSS SECTION LOCATION

-80
-60
-40 -40
-20 -20
0 0
20 20
40 40
60 60
80 80
100 100
402 404 406 408 410 412 414 416 418 420 422 424 426 428
ELEV
ATIO
N IN
FEE
T (N
AVD
88)
STREAM DISTANCE IN THOUSANDS OF FEET ABOVE US HIGHWAY 98
FEDE
RAL
EME R
GENC
Y M
A NAG
EMEN
T AG
ENC Y
CAL H
OUN
COU N
TY, F
LAN
D IN
COR P
ORAT
ED A
R EAS
F LOO
D PR
O FIL
ES
APAL
ACHI
COL A
RIV
E R
06P
LEGEND0.2% ANNUAL CHANCE FLOOD
1% ANNUAL CHANCE FLOOD
2% ANNUAL CHANCE FLOOD
10% ANNUAL CHANCE FLOOD
STREAM BED
CROSS SECTION LOCATION

-60
-40
-20 -20
0 0
20 20
40 40
60 60
80 80
100 100
120 120
428 430 432 434 436 438 440 442 444 446 448 450 452 454
ELEV
ATIO
N IN
FEE
T (N
AVD
88)
STREAM DISTANCE IN THOUSANDS OF FEET ABOVE US HIGHWAY 98
FEDE
RAL
EME R
GENC
Y M
A NAG
EMEN
T AG
ENC Y
CAL H
OUN
COU N
TY, F
LAN
D IN
COR P
ORAT
ED A
R EAS
F LOO
D PR
O FIL
ES
APAL
ACHI
COL A
RIV
E R
07P
SR-2
0
LEGEND0.2% ANNUAL CHANCE FLOOD
1% ANNUAL CHANCE FLOOD
2% ANNUAL CHANCE FLOOD
10% ANNUAL CHANCE FLOOD
STREAM BED
CROSS SECTION LOCATION
CONF
LUEN
C E W
ITH
THE
BAY O
U
CONF
LUEN
CE W
ITH
SUTT
ON C
REEK

-60
-40
-20 -20
0 0
20 20
40 40
60 60
80 80
100 100
120 120
454 456 458 460 462 464 466 468 470 472 474 476 478 480
ELEV
ATIO
N IN
FEE
T (N
AVD
88)
STREAM DISTANCE IN THOUSANDS OF FEET ABOVE US HIGHWAY 98
FEDE
RAL
EME R
GENC
Y M
A NAG
EMEN
T AG
ENC Y
CAL H
OUN
COU N
TY, F
LAN
D IN
COR P
ORAT
ED A
R EAS
F LOO
D PR
O FIL
ES
APAL
ACHI
COL A
RIV
E R
08P
LEGEND0.2% ANNUAL CHANCE FLOOD
1% ANNUAL CHANCE FLOOD
2% ANNUAL CHANCE FLOOD
10% ANNUAL CHANCE FLOOD
STREAM BED
CROSS SECTION LOCATION

-60
-40
-20 -20
0 0
20 20
40 40
60 60
80 80
100 100
120 120
480 482 484 486 488 490 492 494 496 498 500 502 504 506
ELEV
ATIO
N IN
FEE
T (N
AVD
88)
STREAM DISTANCE IN THOUSANDS OF FEET ABOVE US HIGHWAY 98
FEDE
RAL
EME R
GENC
Y M
A NAG
EMEN
T AG
ENC Y
CAL H
OUN
COU N
TY, F
LAN
D IN
COR P
ORAT
ED A
R EAS
F LOO
D PR
O FIL
ES
APAL
ACHI
COL A
RIV
E R
09P
LEGEND0.2% ANNUAL CHANCE FLOOD
1% ANNUAL CHANCE FLOOD
2% ANNUAL CHANCE FLOOD
10% ANNUAL CHANCE FLOOD
STREAM BED
CROSS SECTION LOCATION
CONF
LUEN
CE W
ITH
GRAV
ES C
REEK
CON F
LUEN
C E W
ITH
THE
BAY O
U
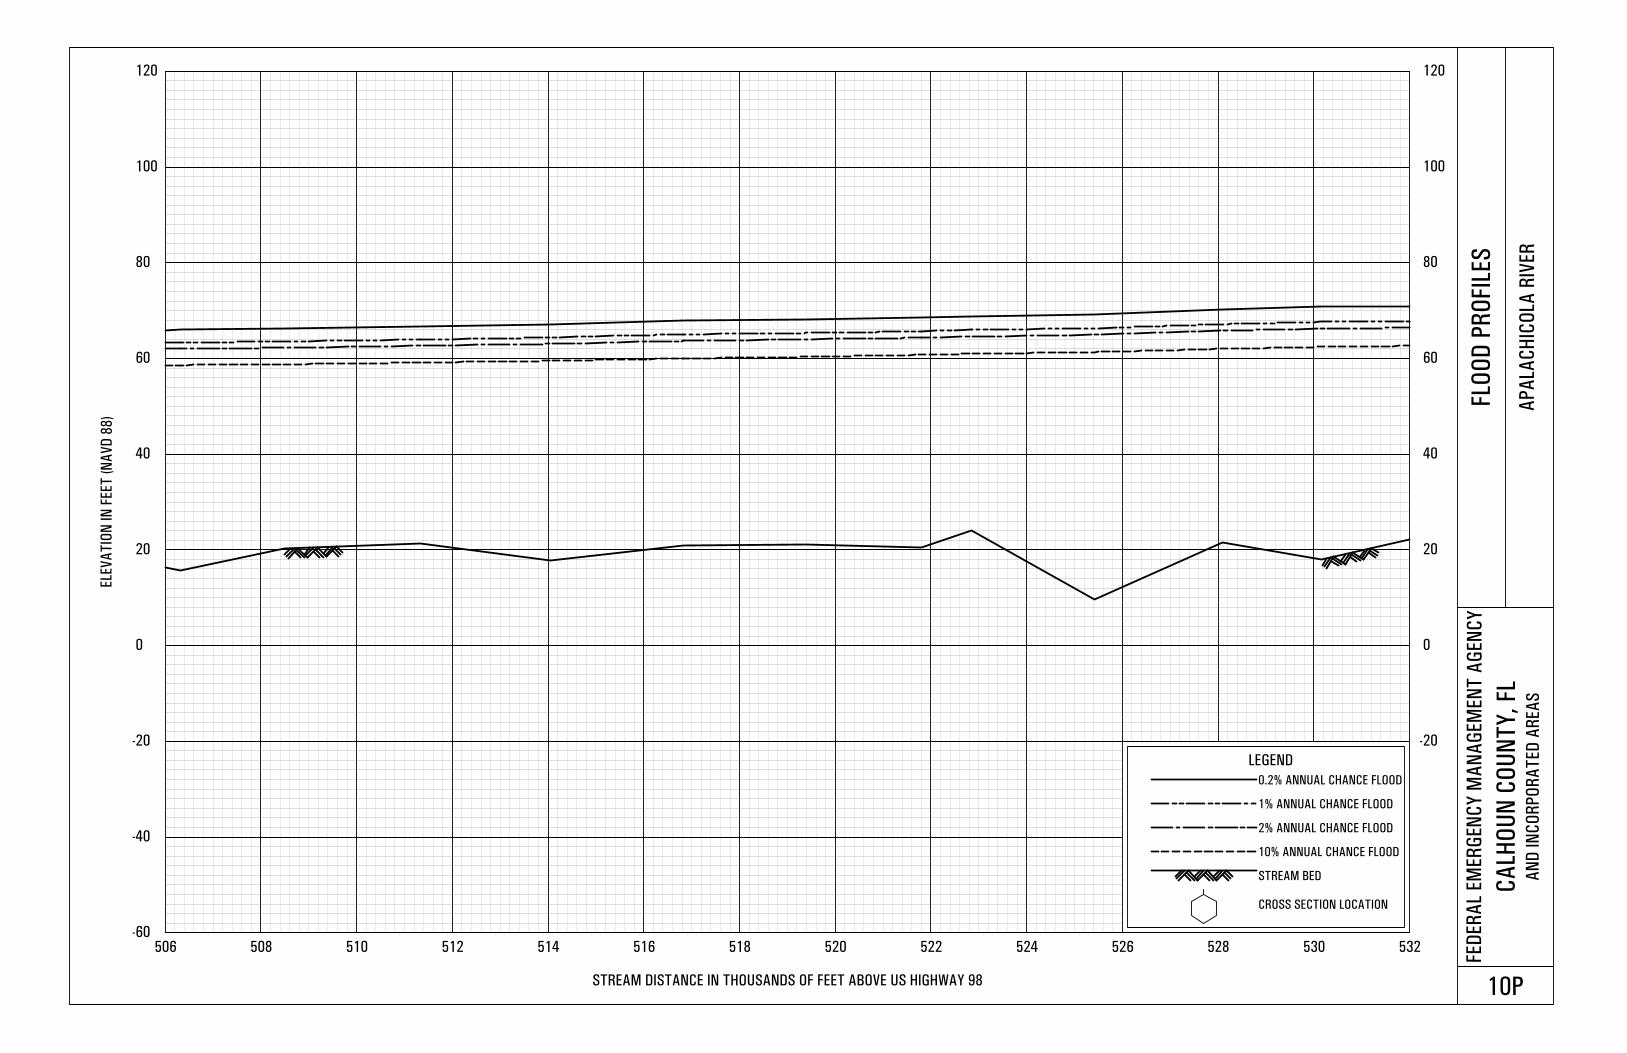
-60
-40
-20 -20
0 0
20 20
40 40
60 60
80 80
100 100
120 120
506 508 510 512 514 516 518 520 522 524 526 528 530 532
ELEV
ATIO
N IN
FEE
T (N
AVD
88)
STREAM DISTANCE IN THOUSANDS OF FEET ABOVE US HIGHWAY 98
FEDE
RAL
EME R
GENC
Y M
A NAG
EMEN
T AG
ENC Y
CAL H
OUN
COU N
TY, F
LAN
D IN
COR P
ORAT
ED A
R EAS
F LOO
D PR
O FIL
ES
APAL
ACHI
COL A
RIV
E R
10P
LEGEND0.2% ANNUAL CHANCE FLOOD
1% ANNUAL CHANCE FLOOD
2% ANNUAL CHANCE FLOOD
10% ANNUAL CHANCE FLOOD
STREAM BED
CROSS SECTION LOCATION
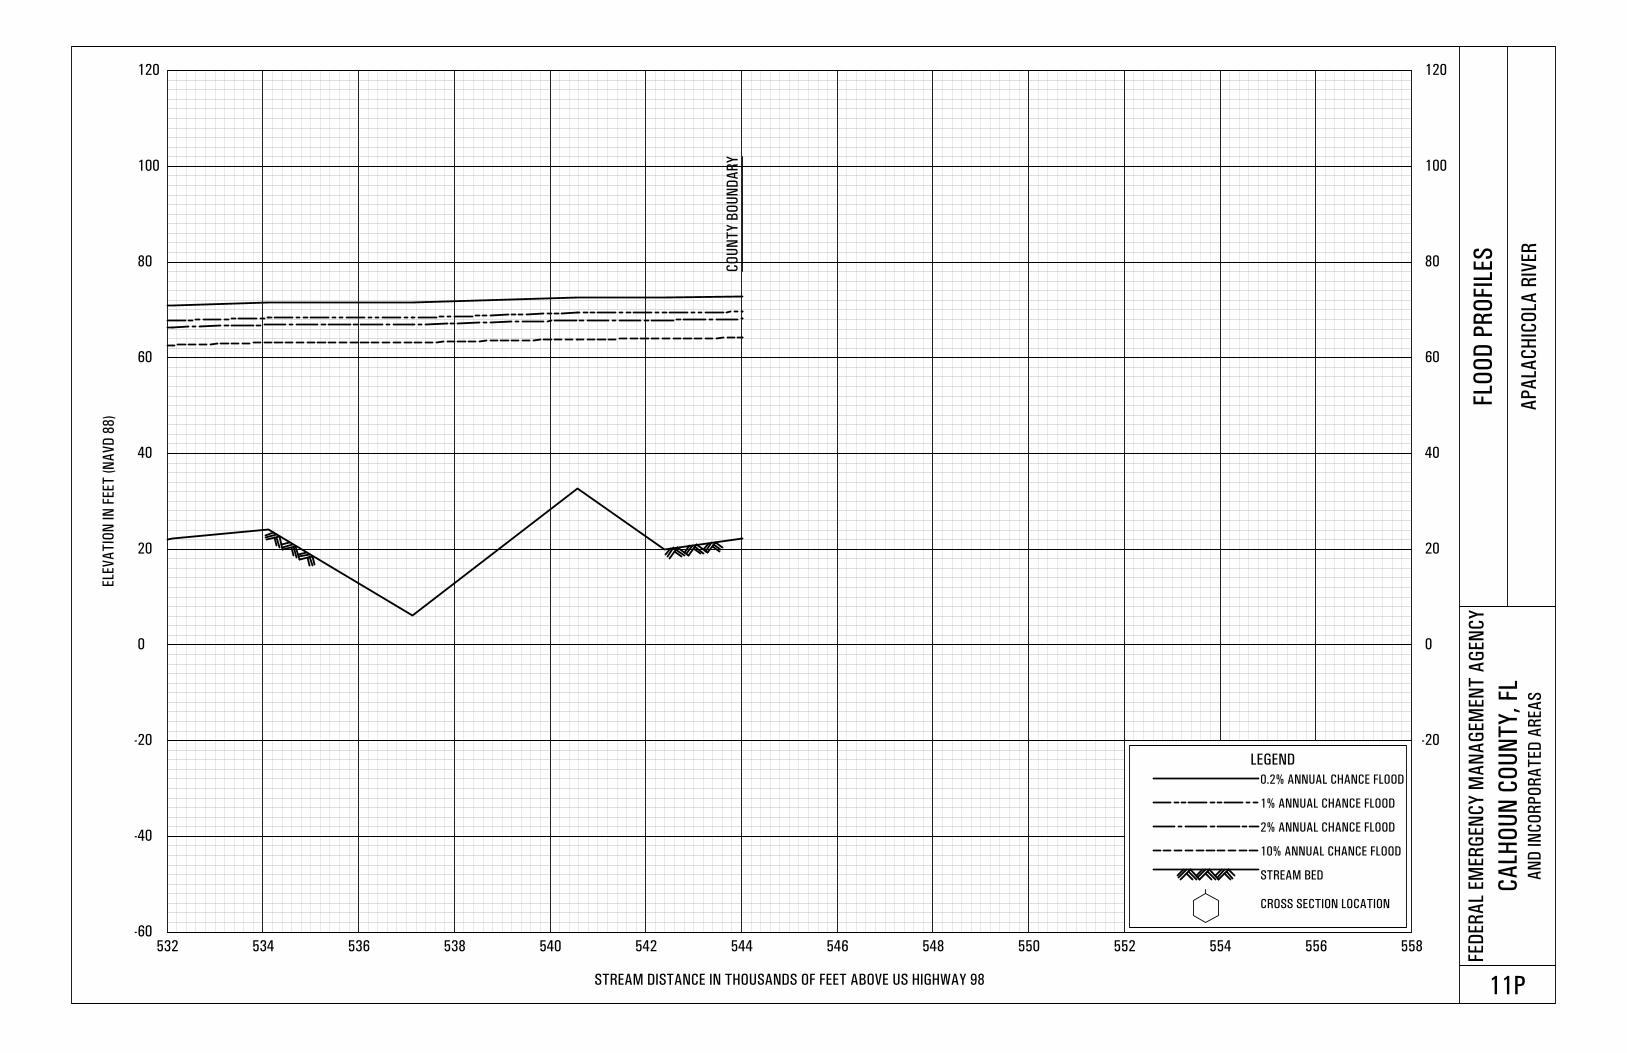
-60
-40
-20 -20
0 0
20 20
40 40
60 60
80 80
100 100
120 120
532 534 536 538 540 542 544 546 548 550 552 554 556 558
ELEV
ATIO
N IN
FEE
T (N
AVD
88)
STREAM DISTANCE IN THOUSANDS OF FEET ABOVE US HIGHWAY 98
FEDE
RAL
EME R
GENC
Y M
A NAG
EMEN
T AG
ENC Y
CAL H
OUN
COU N
TY, F
LAN
D IN
COR P
ORAT
ED A
R EAS
F LOO
D PR
O FIL
ES
APAL
ACHI
COL A
RIV
E R
11P
COUN
TY B
OUN D
ARY
LEGEND0.2% ANNUAL CHANCE FLOOD
1% ANNUAL CHANCE FLOOD
2% ANNUAL CHANCE FLOOD
10% ANNUAL CHANCE FLOOD
STREAM BED
CROSS SECTION LOCATION