Embed Size (px)
Citation preview
COMMUNITY NAME COMMUNITY NUMBER ANNA MARIA, CITY OF 125087 BRADENTON, CITY OF 120155 BRADENTON BEACH, CITY OF 125091 HOLMES BEACH, CITY OF 125114 LONGBOAT KEY, TOWN OF 125126 MANATEE COUNTY, 120153
MANATEE COUNTY, FLORIDA AND INCORPORATED AREAS
UNINCORPORATED AREAS PALMETTO, CITY OF 120159
Effective: March 17, 2014
Federal Emergency Management Agency Flood Insurance Study Number
12081CV000A
NOTICE TO
FLOOD INSURANCE STUDY USERS
Communities participating in the National Flood Insurance Program have established repositories of
flood hazard data for floodplain management and flood insurance purposes. This Flood Insurance Study
(FIS) may not contain all data available within the Community Map Repository. Please contact the
Community Map Repository for any additional data.
The Federal Emergency Management Agency (FEMA) may revise and republish part or all of the FIS at
any time. In addition, FEMA may revise part of this FIS Report by the Letter of Map Revision process,
which does not involve republication or redistribution of the FIS report. Therefore, users should consult
with community officials and check the Community Map Repository to obtain the most current FIS
report components.
Selected Flood Insurance Rate Map panels for the community contain information that was previously
shown separately on the corresponding Flood Boundary and Floodway Map panels (e.g. floodway
boundaries, cross sections). In addition, former flood hazard zone designations have been changed as
shown:
Old Zone New Zone
A1 through A30 AE
B X
C X
Initial Countywide FIS Effective Date: March 17, 2014
i
TABLE OF CONTENTS
Page
1.0 INTRODUCTION 1
1.1 Purpose of Study 1
1.2 Authority and Acknowledgments 1
1.3 Coordination 4
2.0 AREA STUDIED 5
2.1 Scope of Study 5
2.2 Community Description 10
2.3 Principal Flood Problems 12
2.4 Flood Protection Measures 13
3.0 ENGINEERING METHODS 14
3.1 Hydrologic Analyses 14
3.2 Hydraulic Analyses 49
3.3 Vertical Datum 52
4.0 FLOODPLAIN MANAGEMENT APPLICATIONS 53
4.1 Floodplain Boundaries 54
4.2 Floodways 55
5.0 INSURANCE APPLICATION 69
6.0 FLOOD INSURANCE RATE MAP 70
7.0 OTHER STUDIES 72
8.0 LOCATION OF DATA 72
9.0 BIBLIOGRAPHY AND REFERENCES 73
ii
TABLE OF CONTENTS – continued
Page
FIGURES
Figure 1 – Transect Location Map 16
Figure 2 – Typical Transect Schematic 17
Figure 3 – Floodway Schematic 56
TABLES
Table 1 – Pre-Countywide CCO Meetings 4
Table 2 – Flooding Sources Studied by Detailed Methods 5
Table 3 – Flooding Sources Studied by Approximate Methods 7
Table 4 – Scope of Revision 8
Table 5 – Letters of Map Change 9
Table 6 - Parameter Values for Surge Elevation 20
Table 7 – Summary of Discharges 21
Table 8 – Summary of Stillwater Elevations 24
Table 9 – Buffalo Canal / Frog Creek Study - ICPR Node Location Elevations 27
Table 10 – Sources of Original Topographic Data 54
Table 11 – Floodway Data Tables 57
Table 12 – Community Map History 71
iii
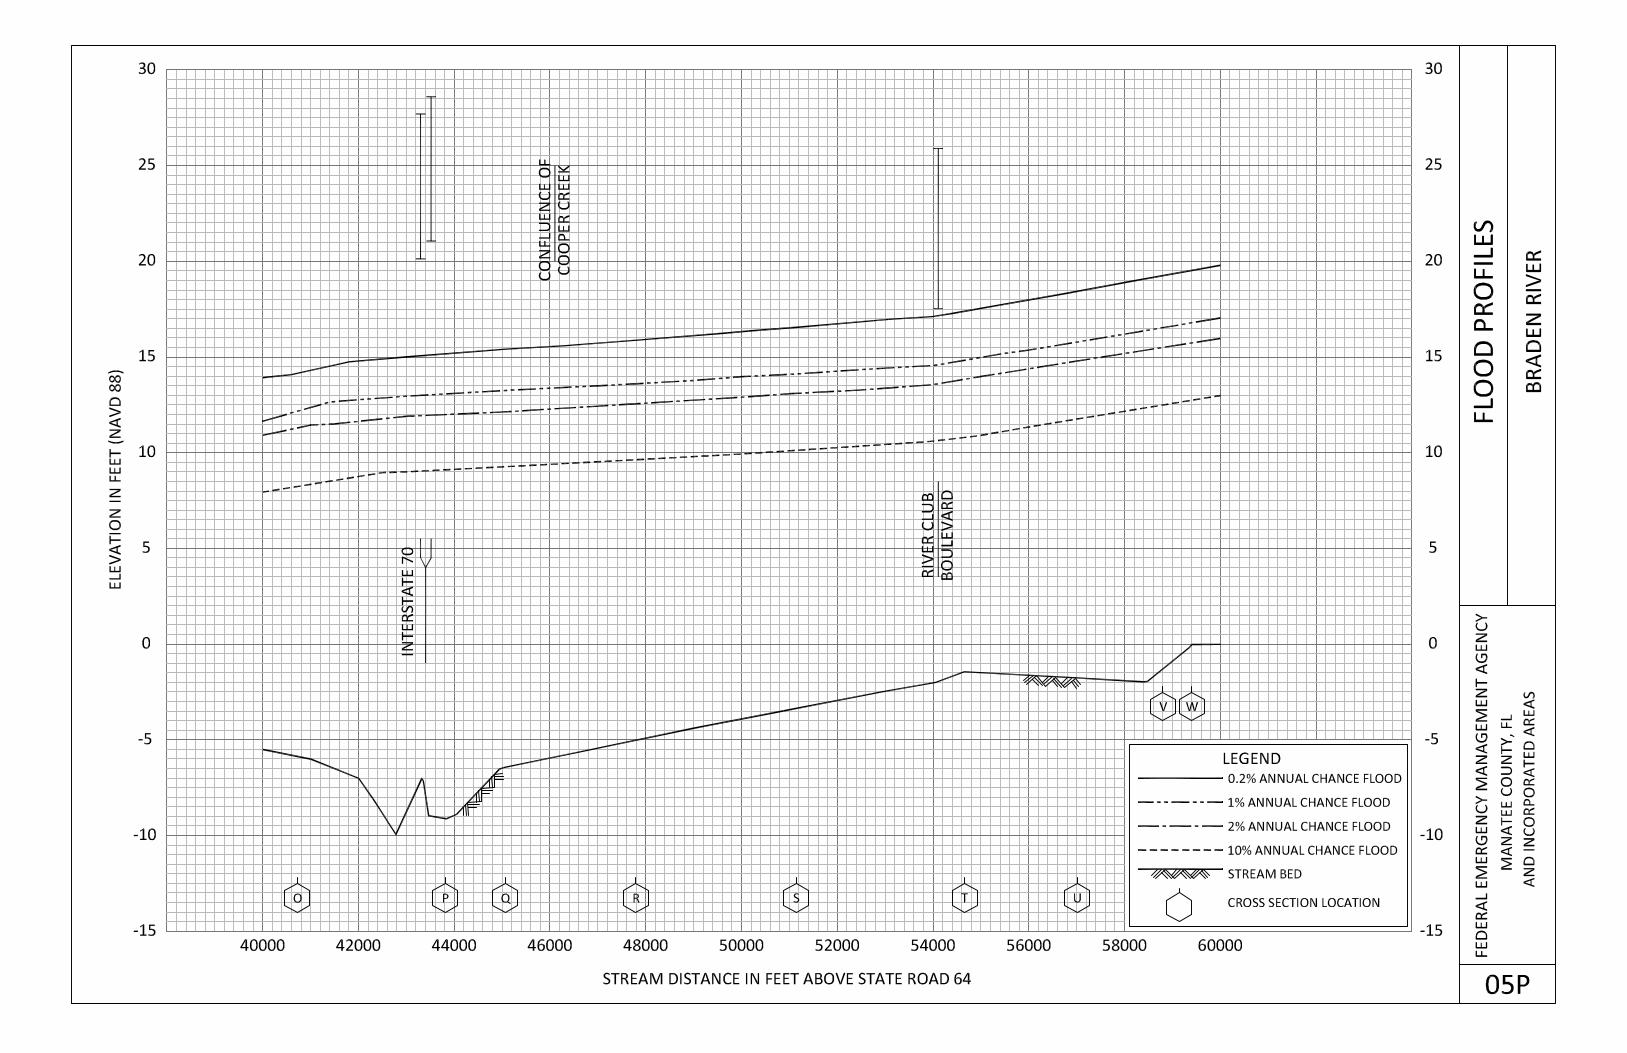
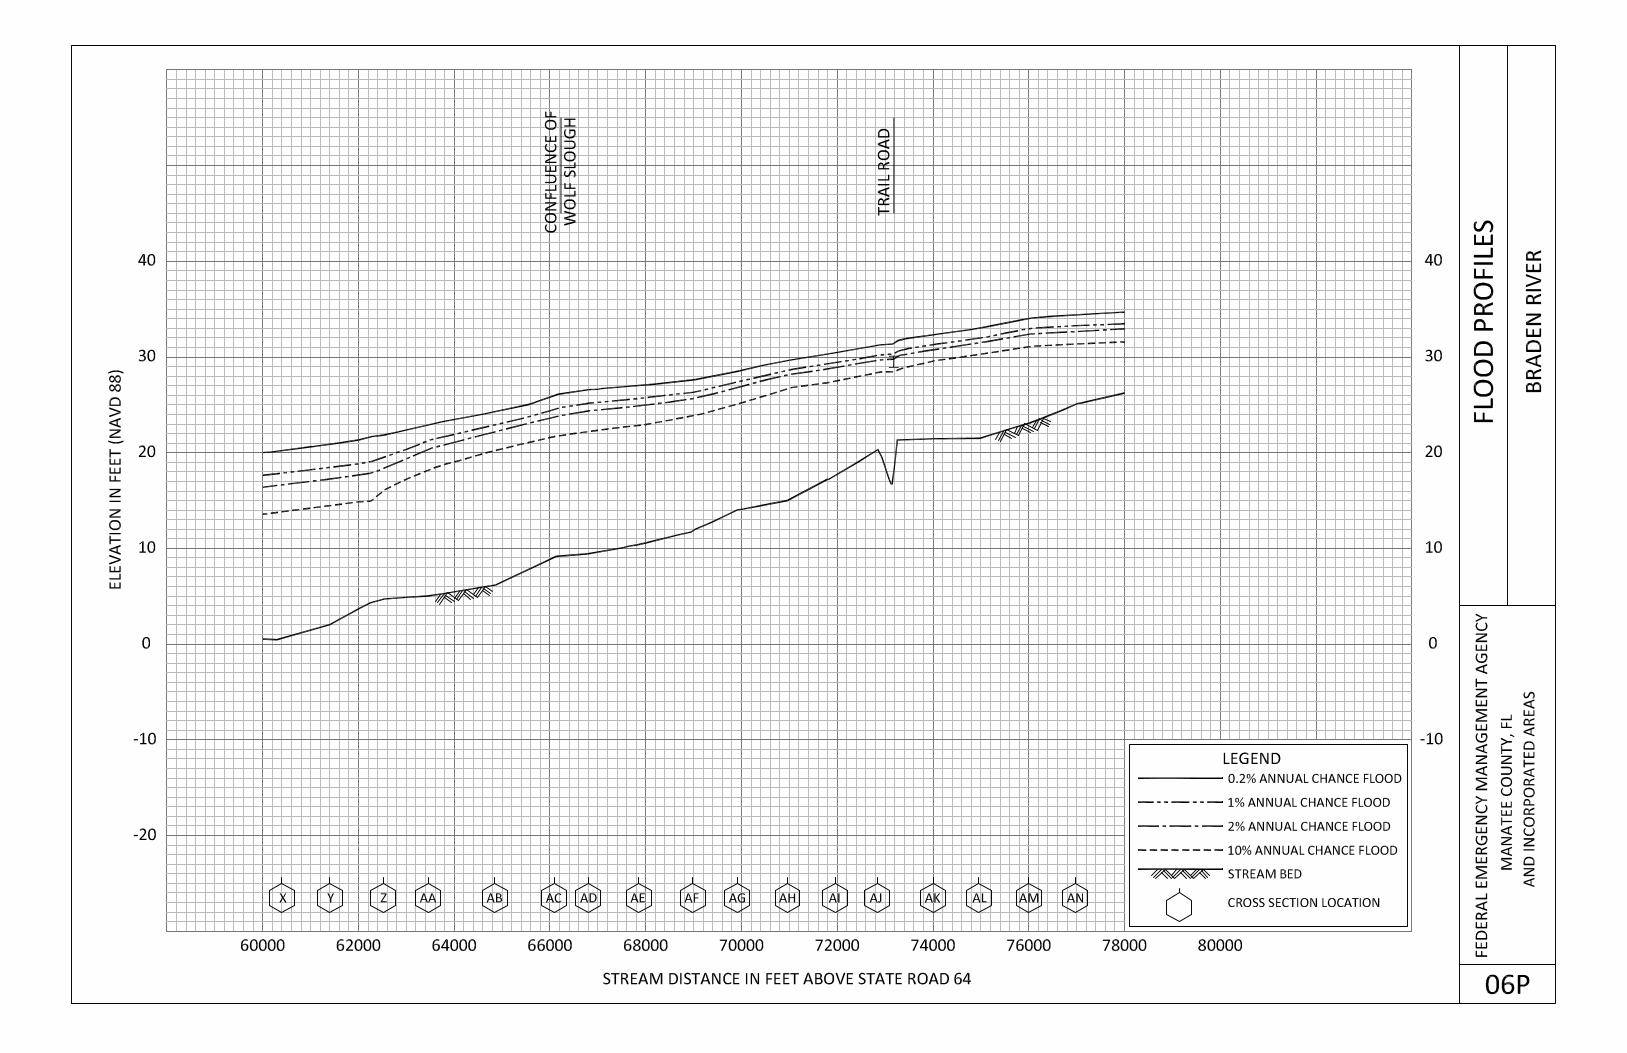
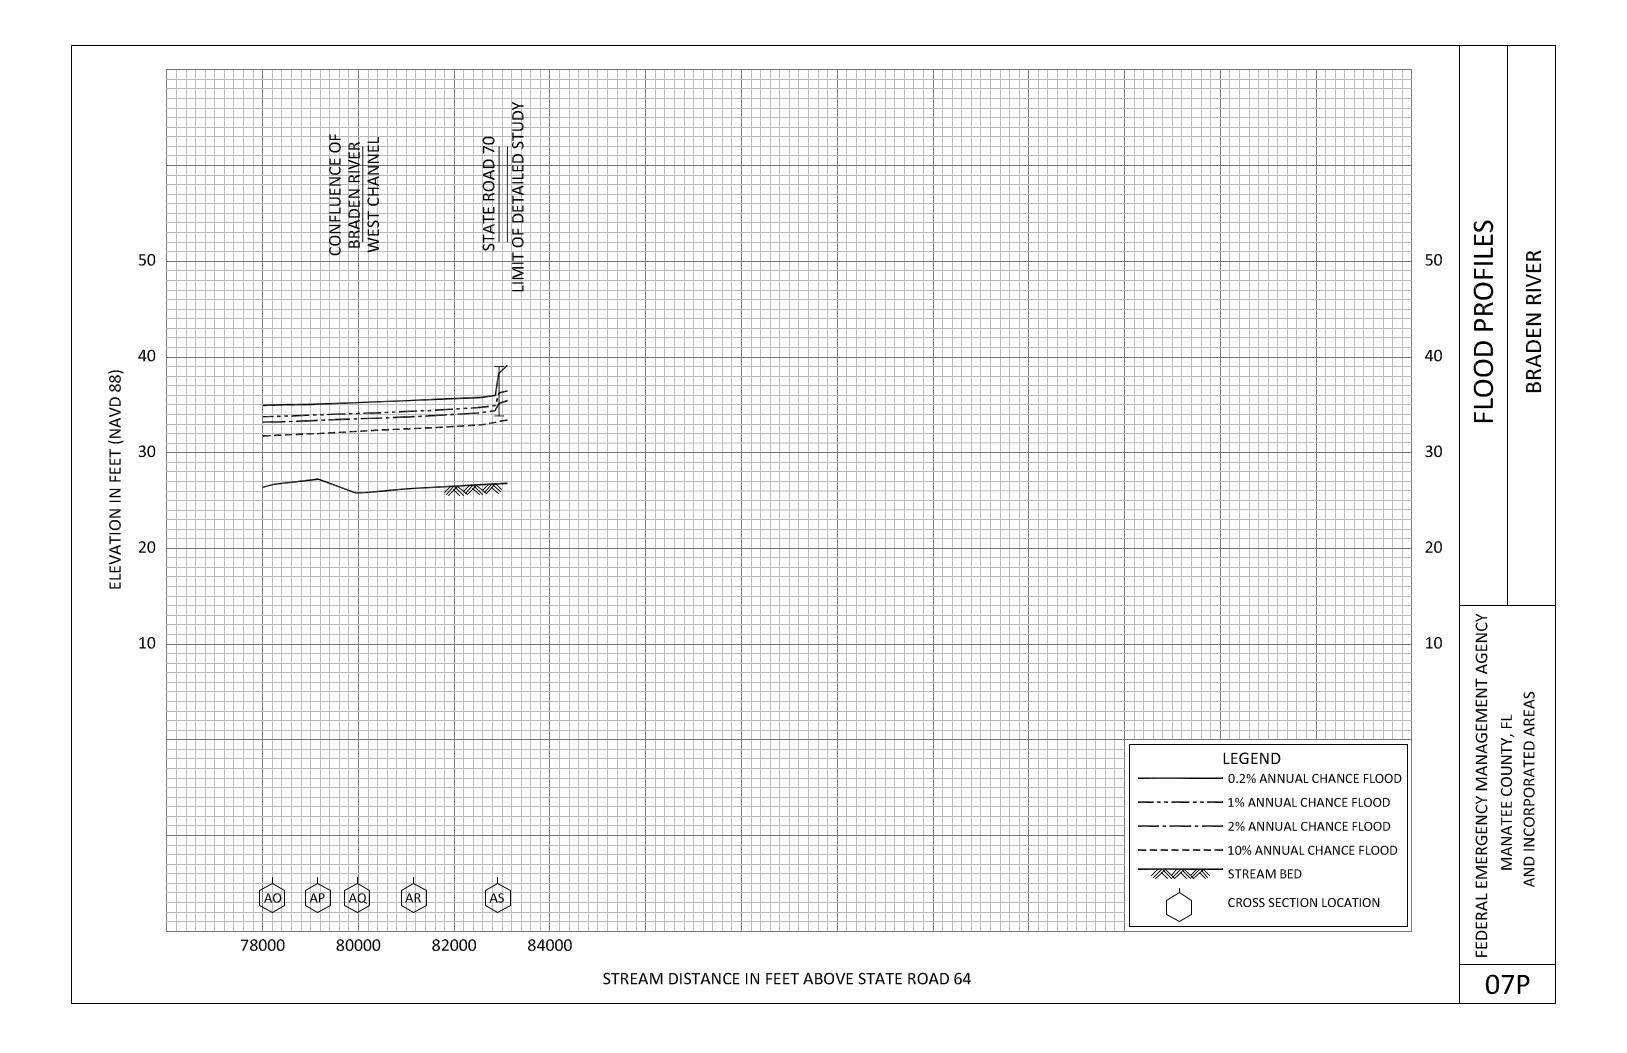
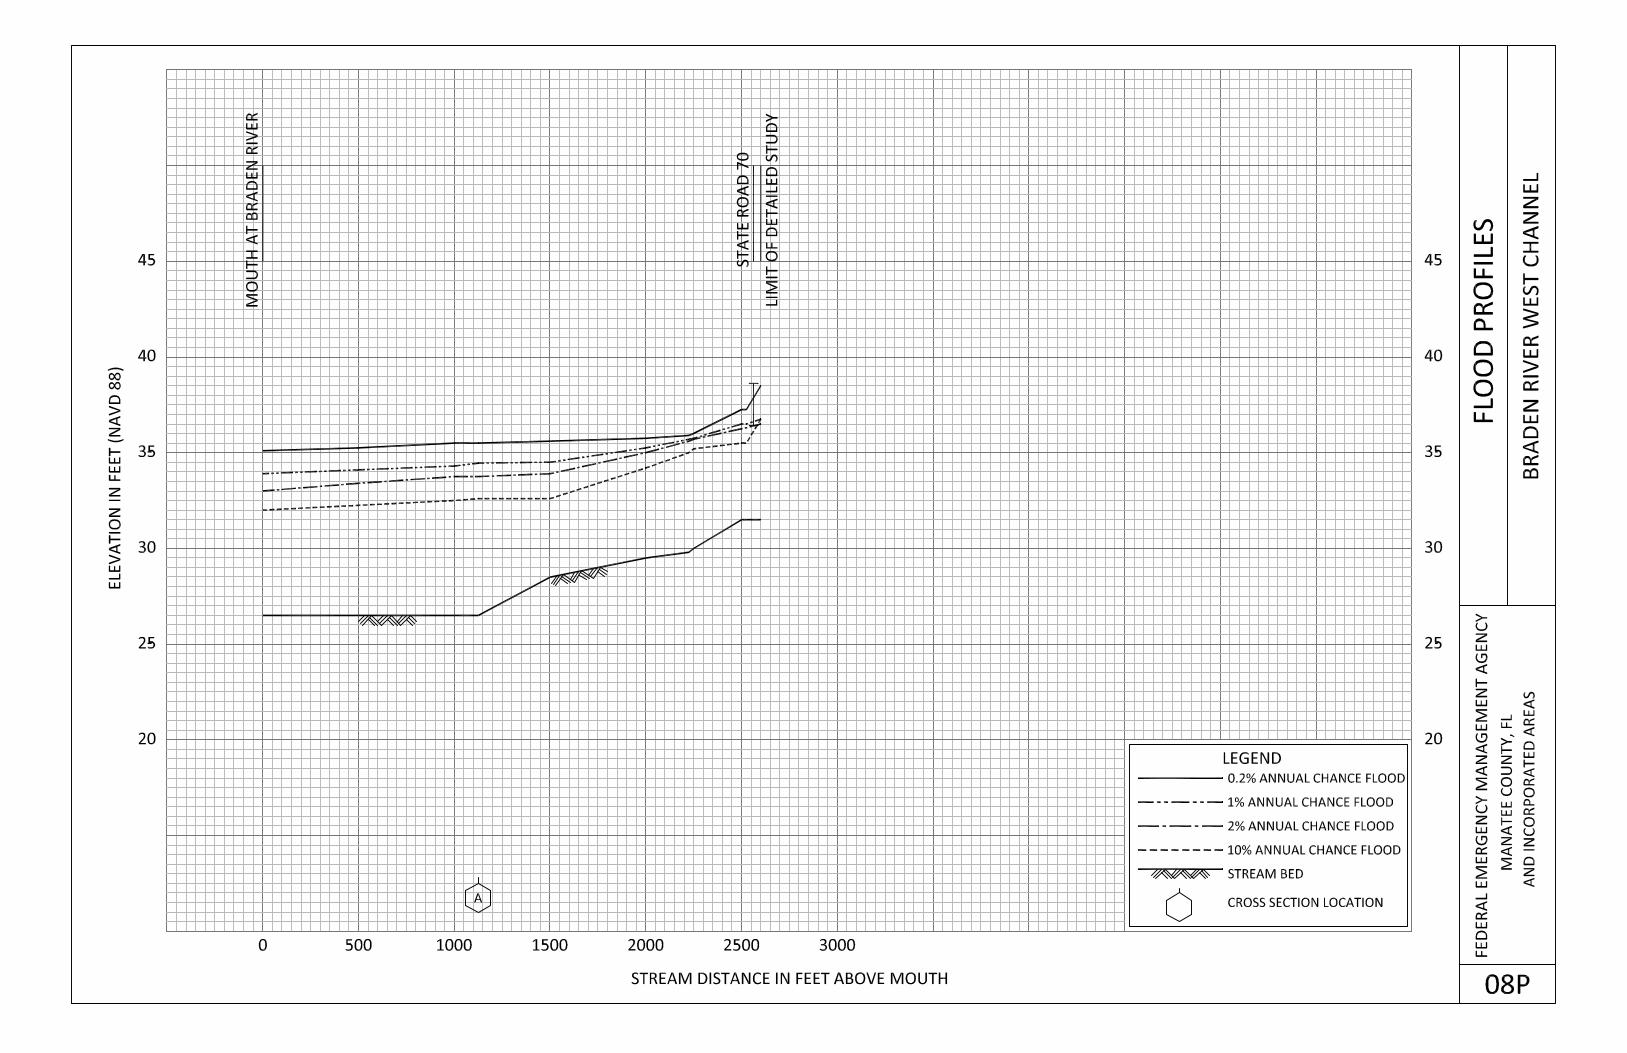
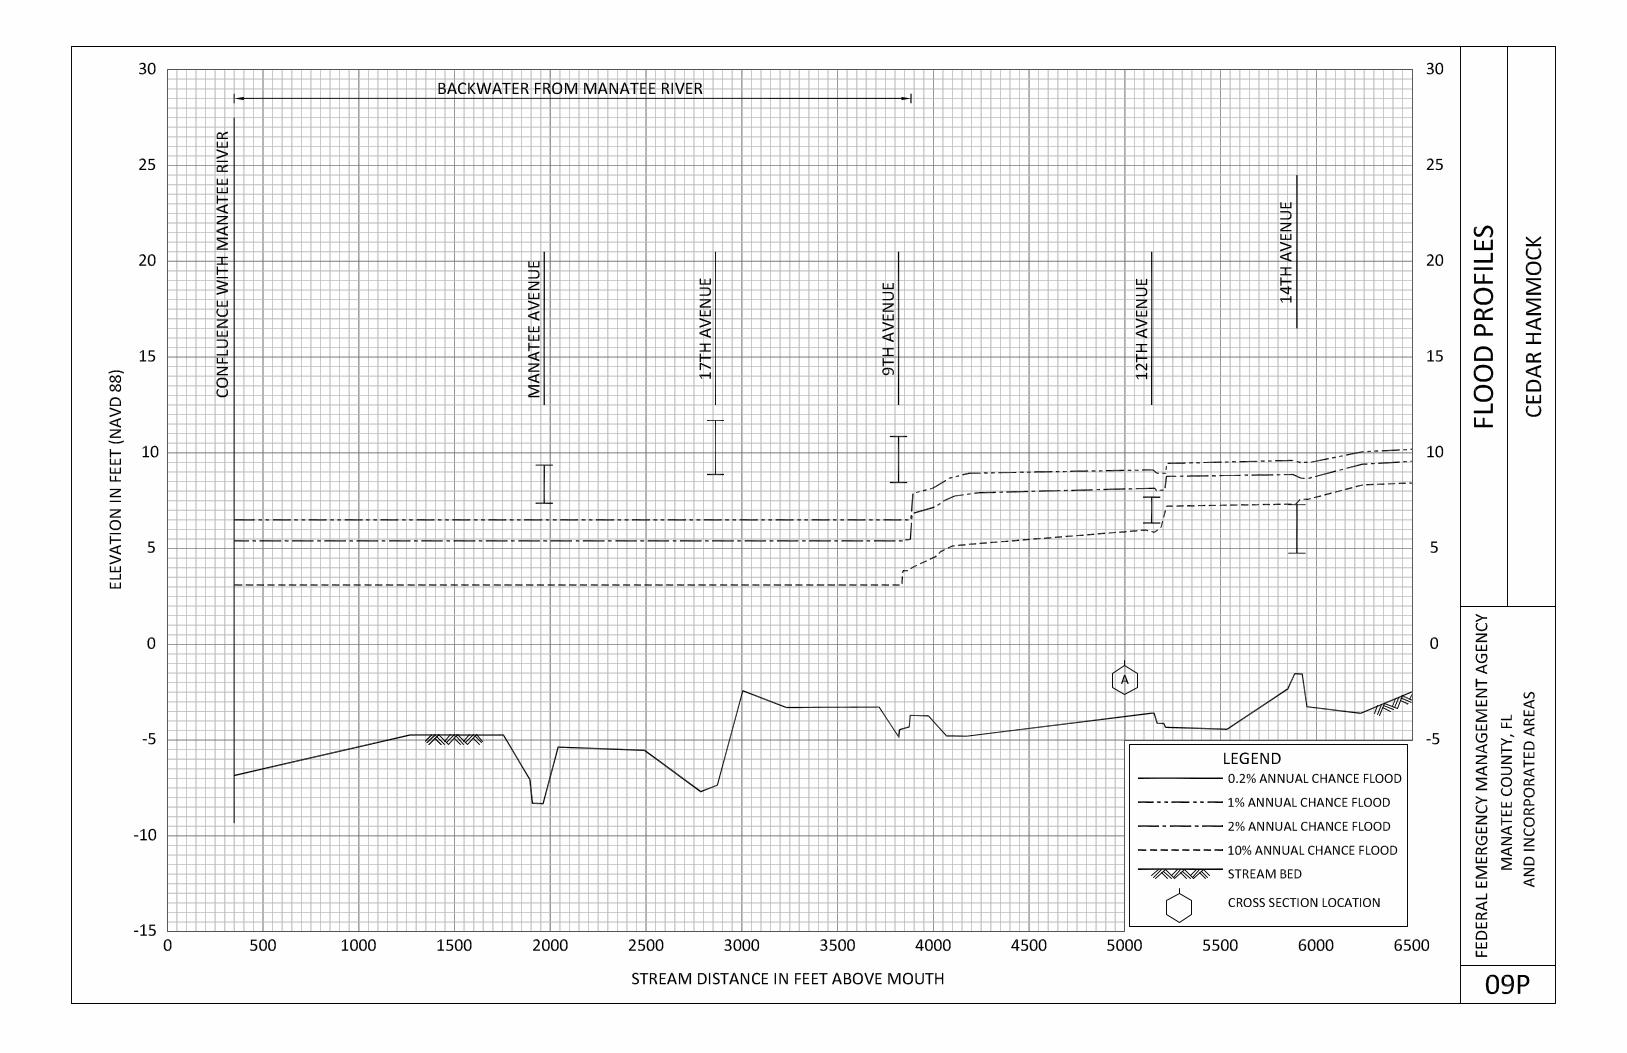
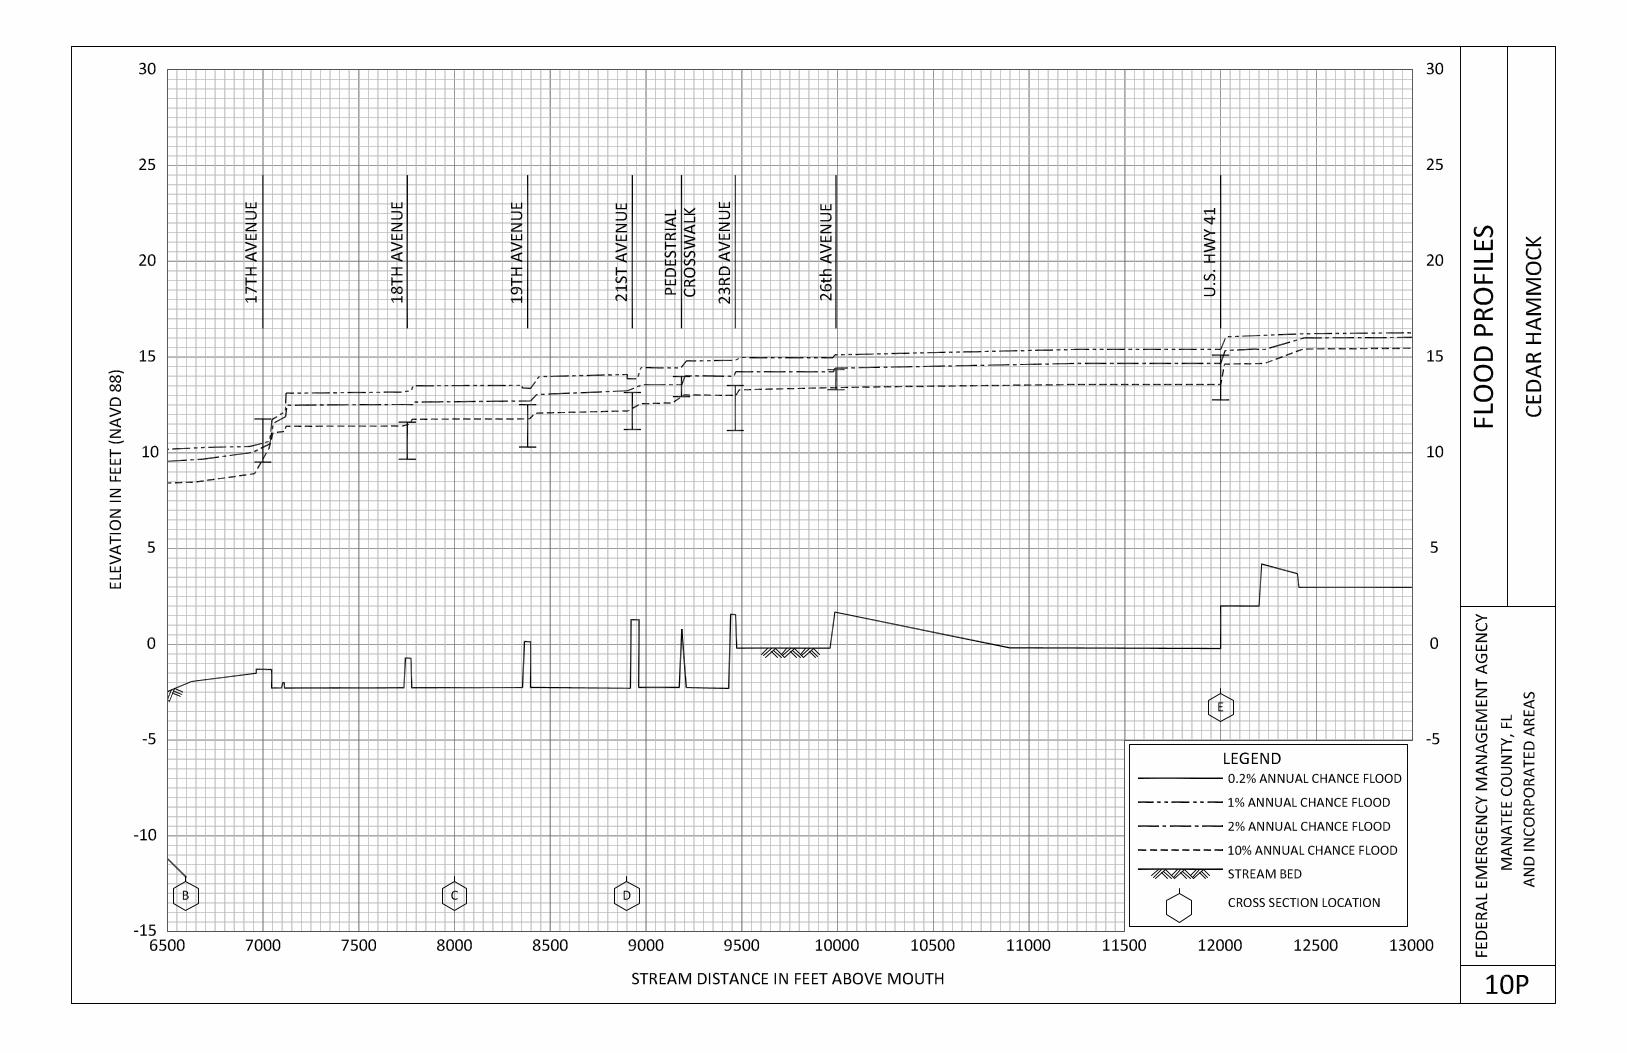
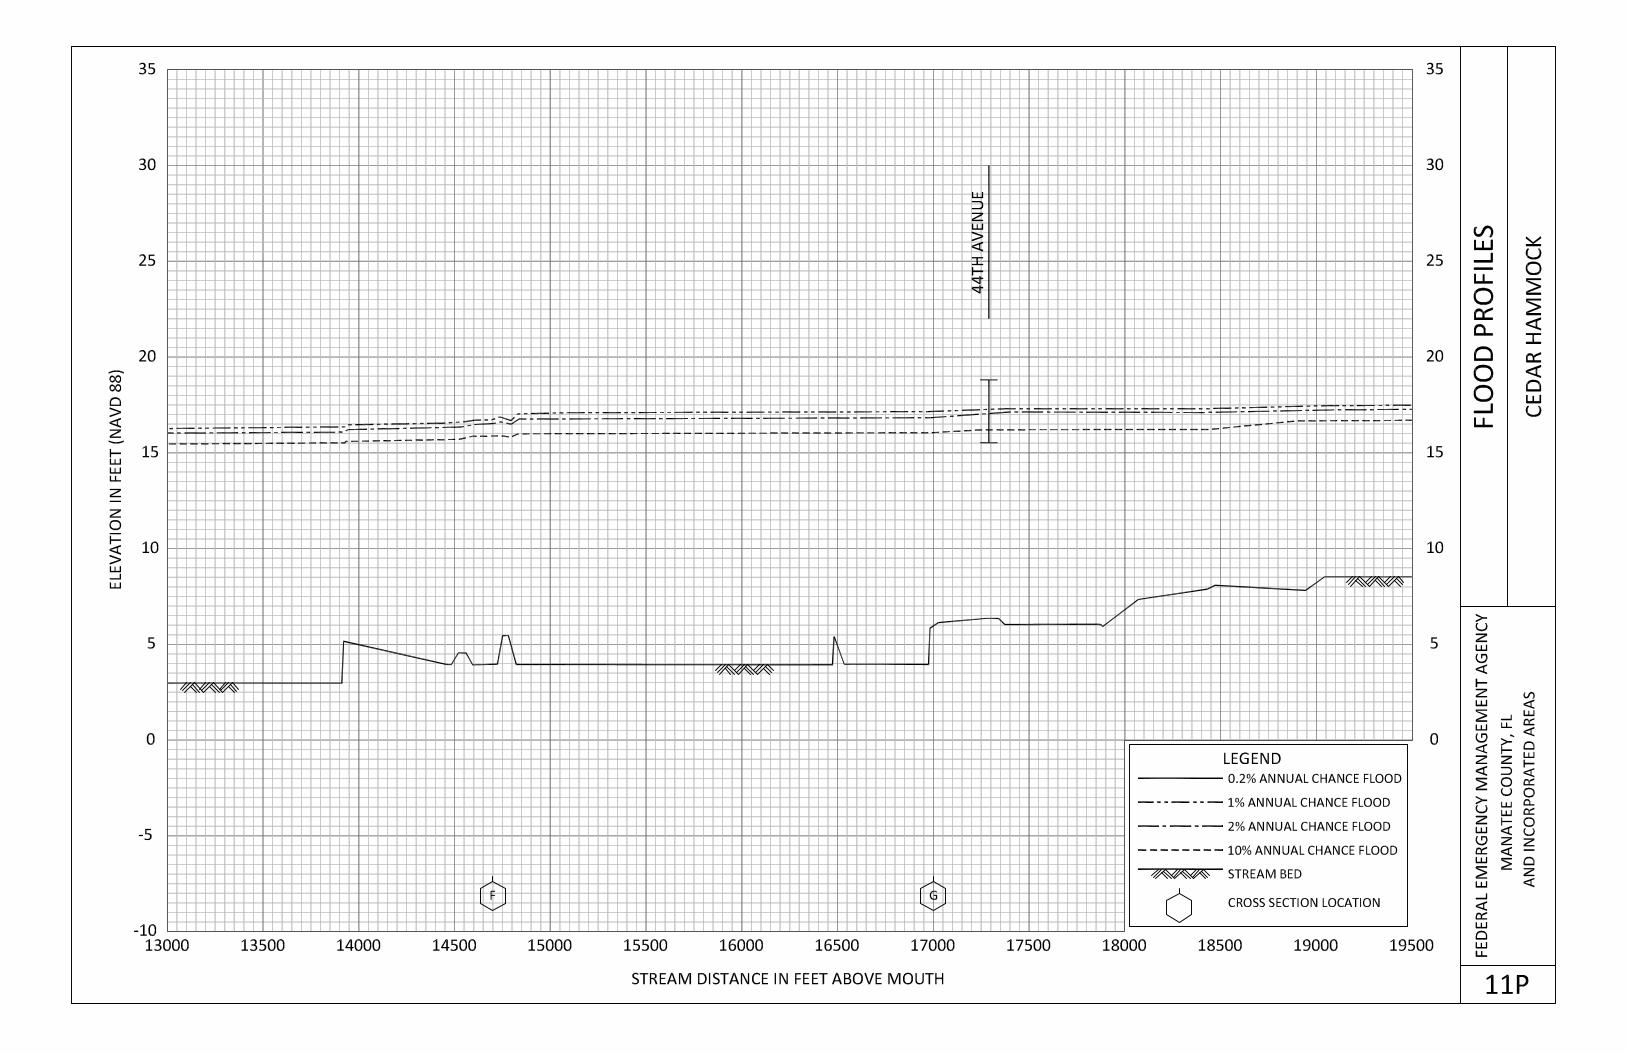
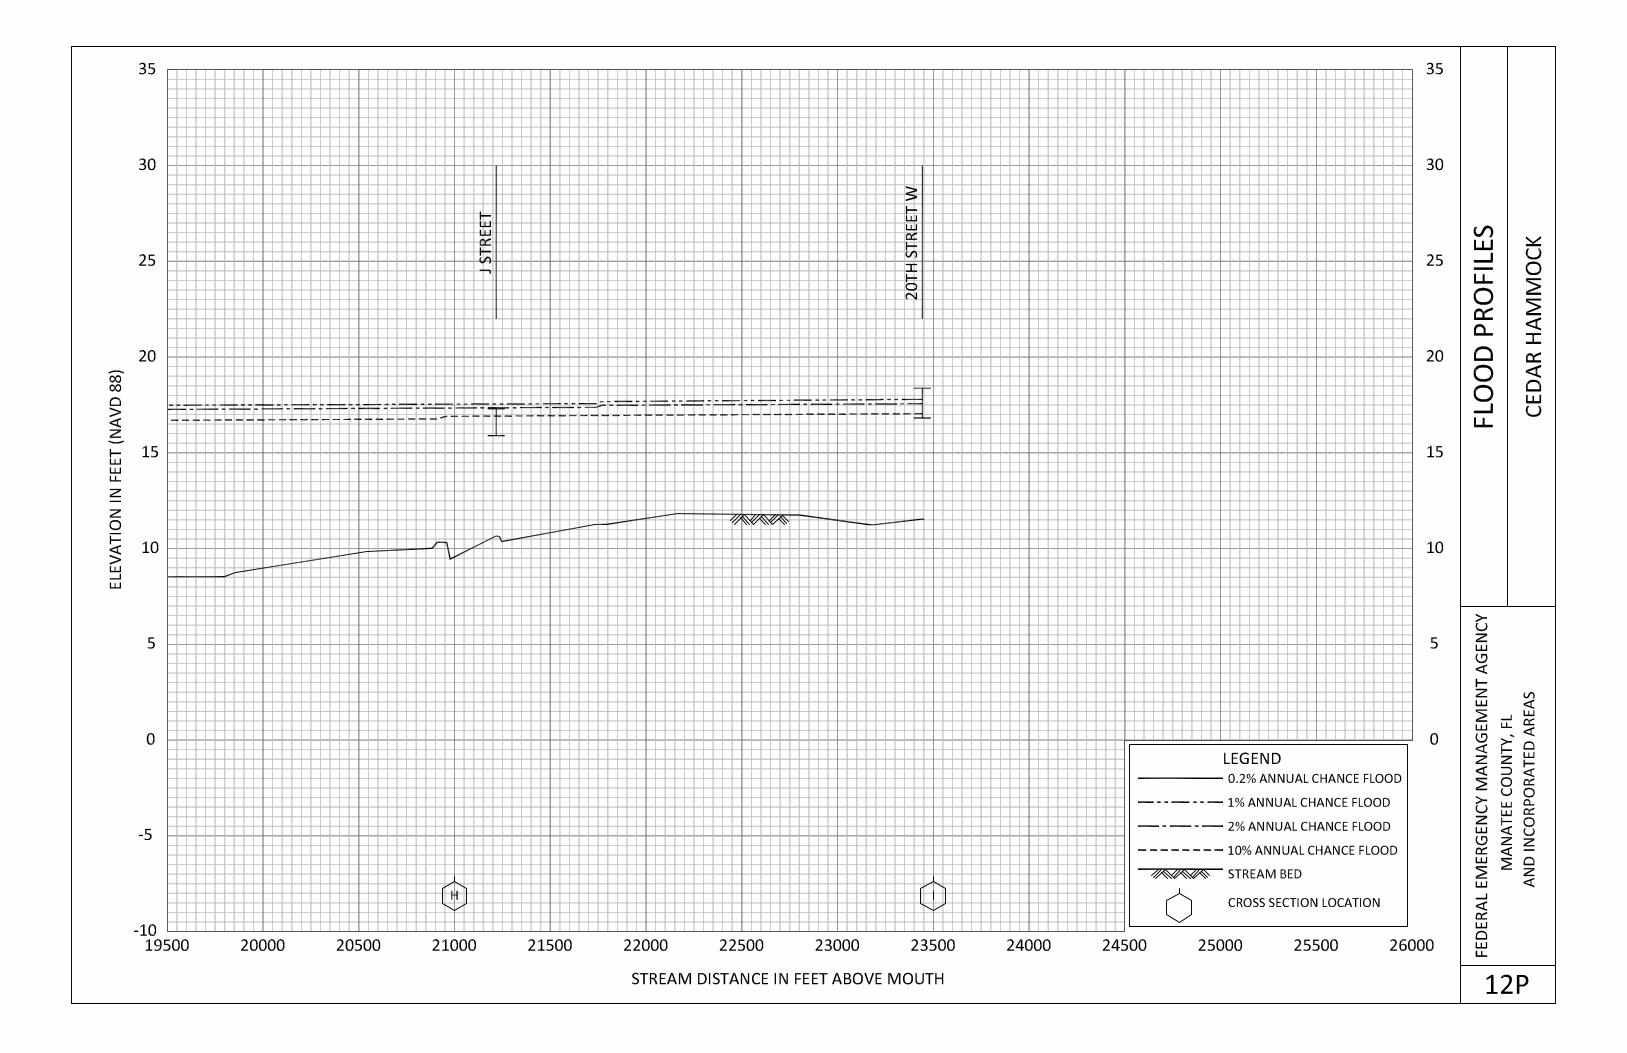
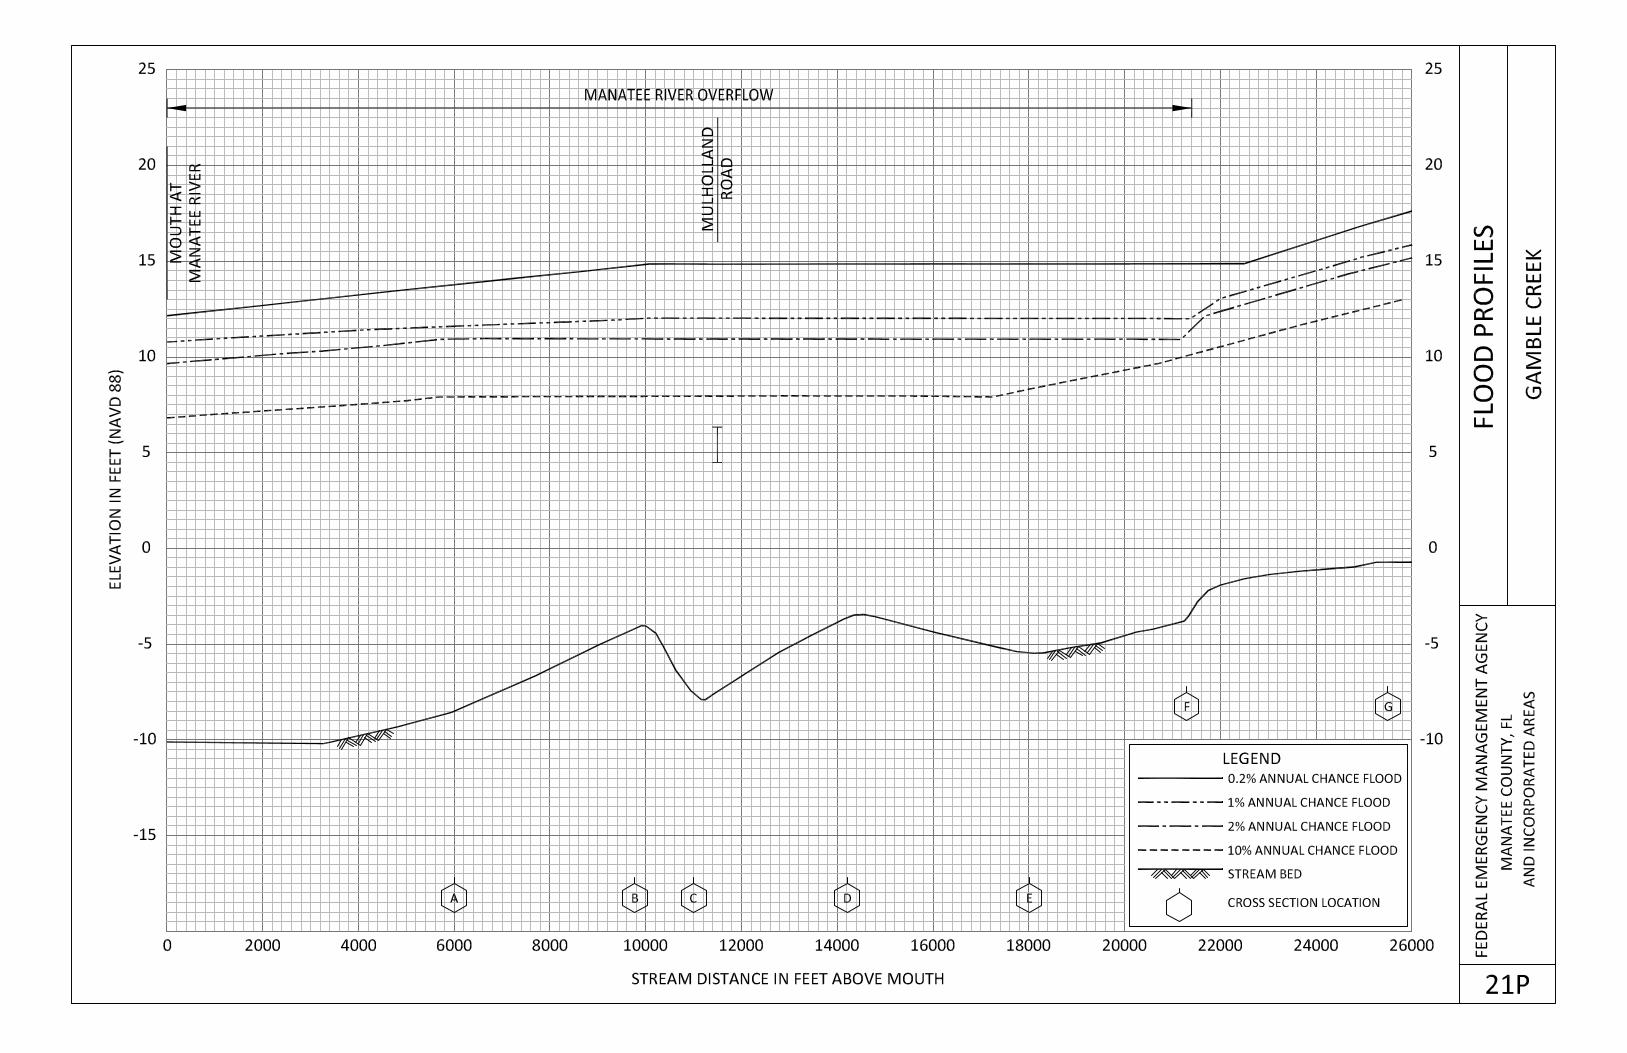
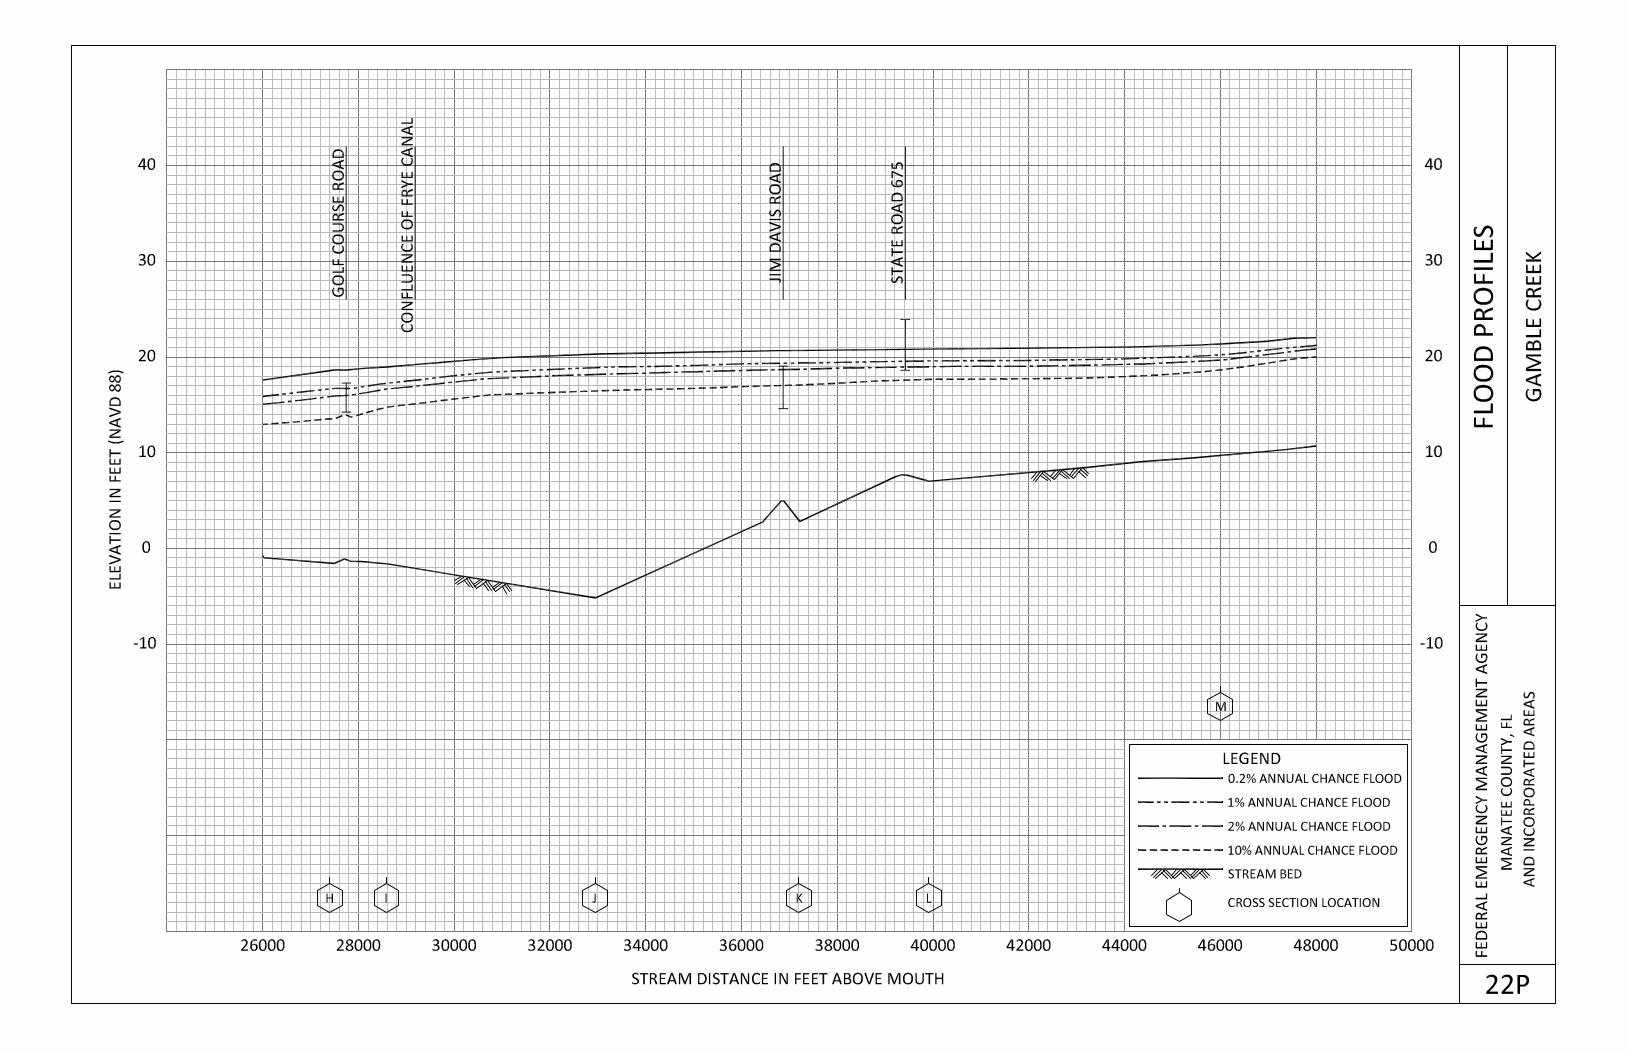
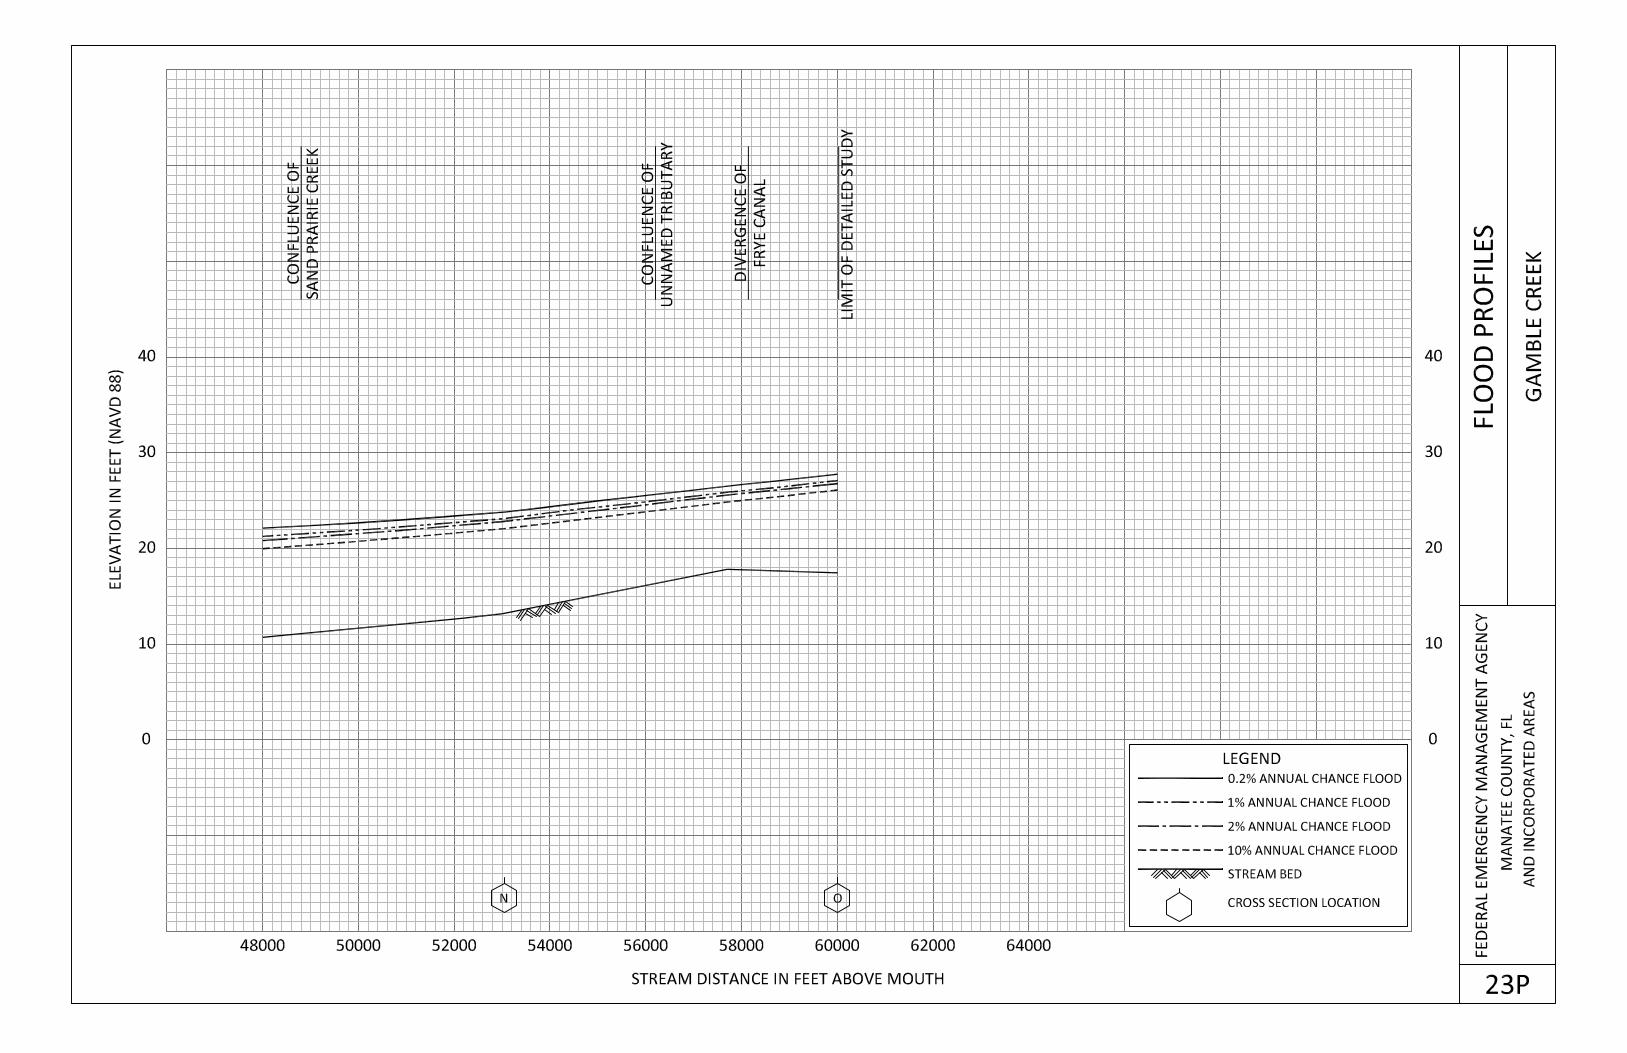
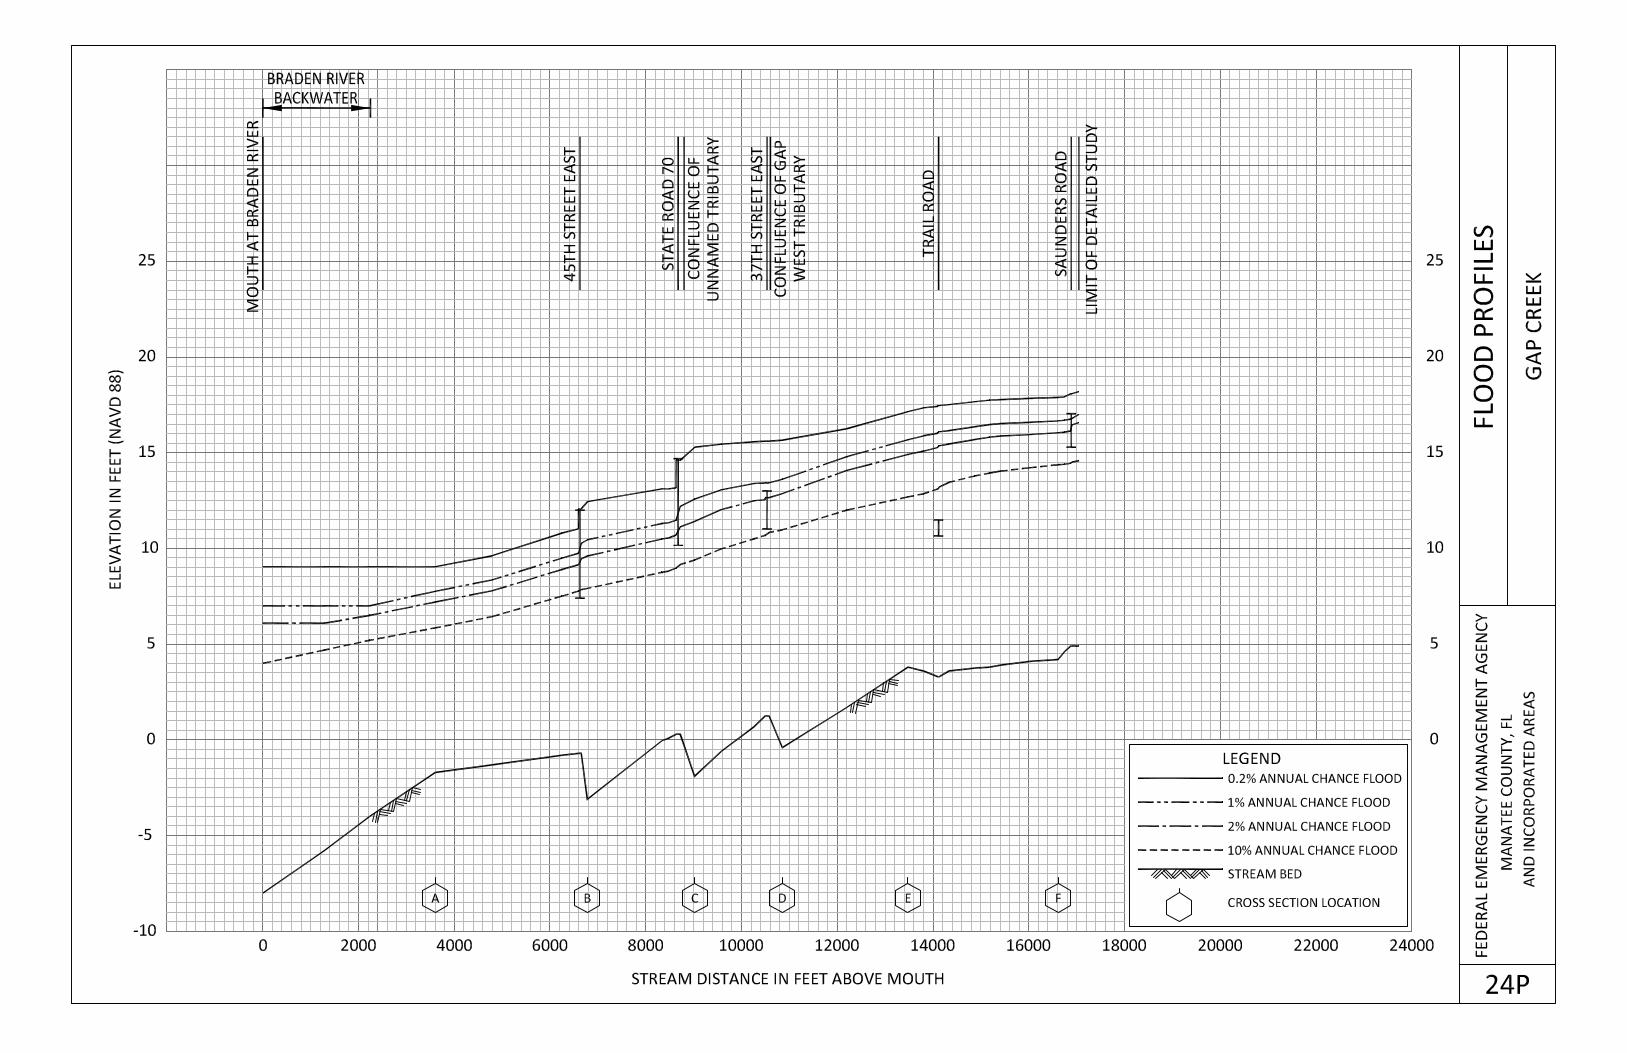
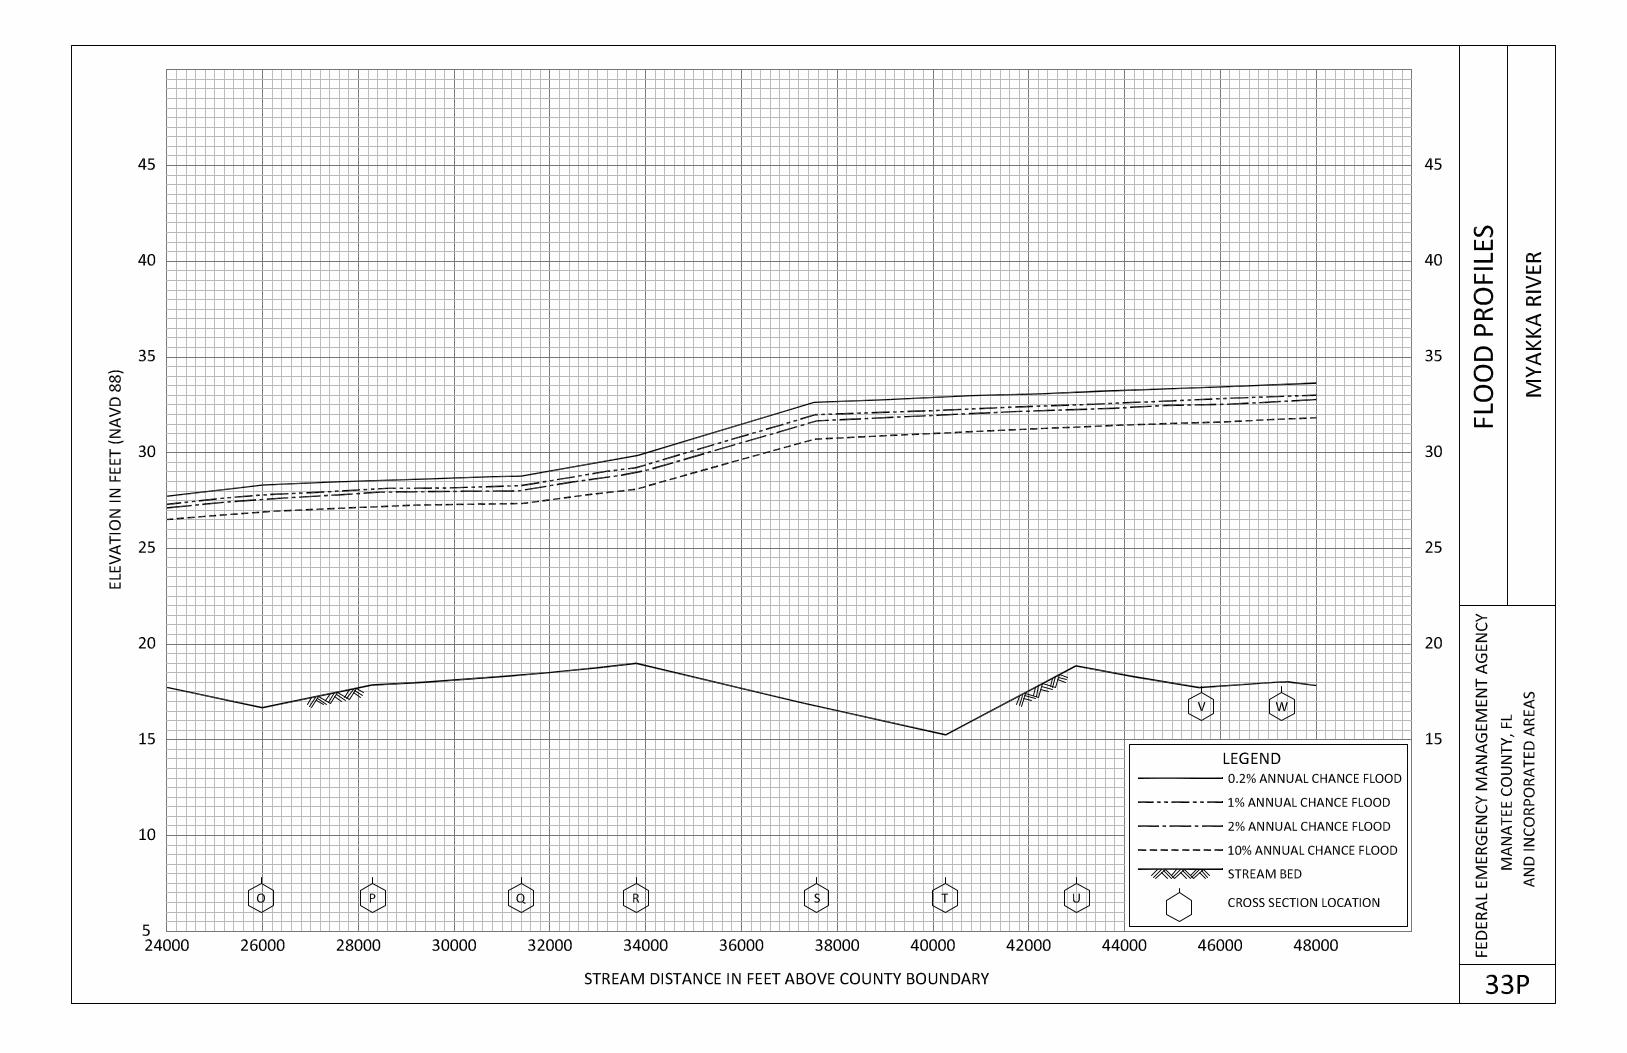
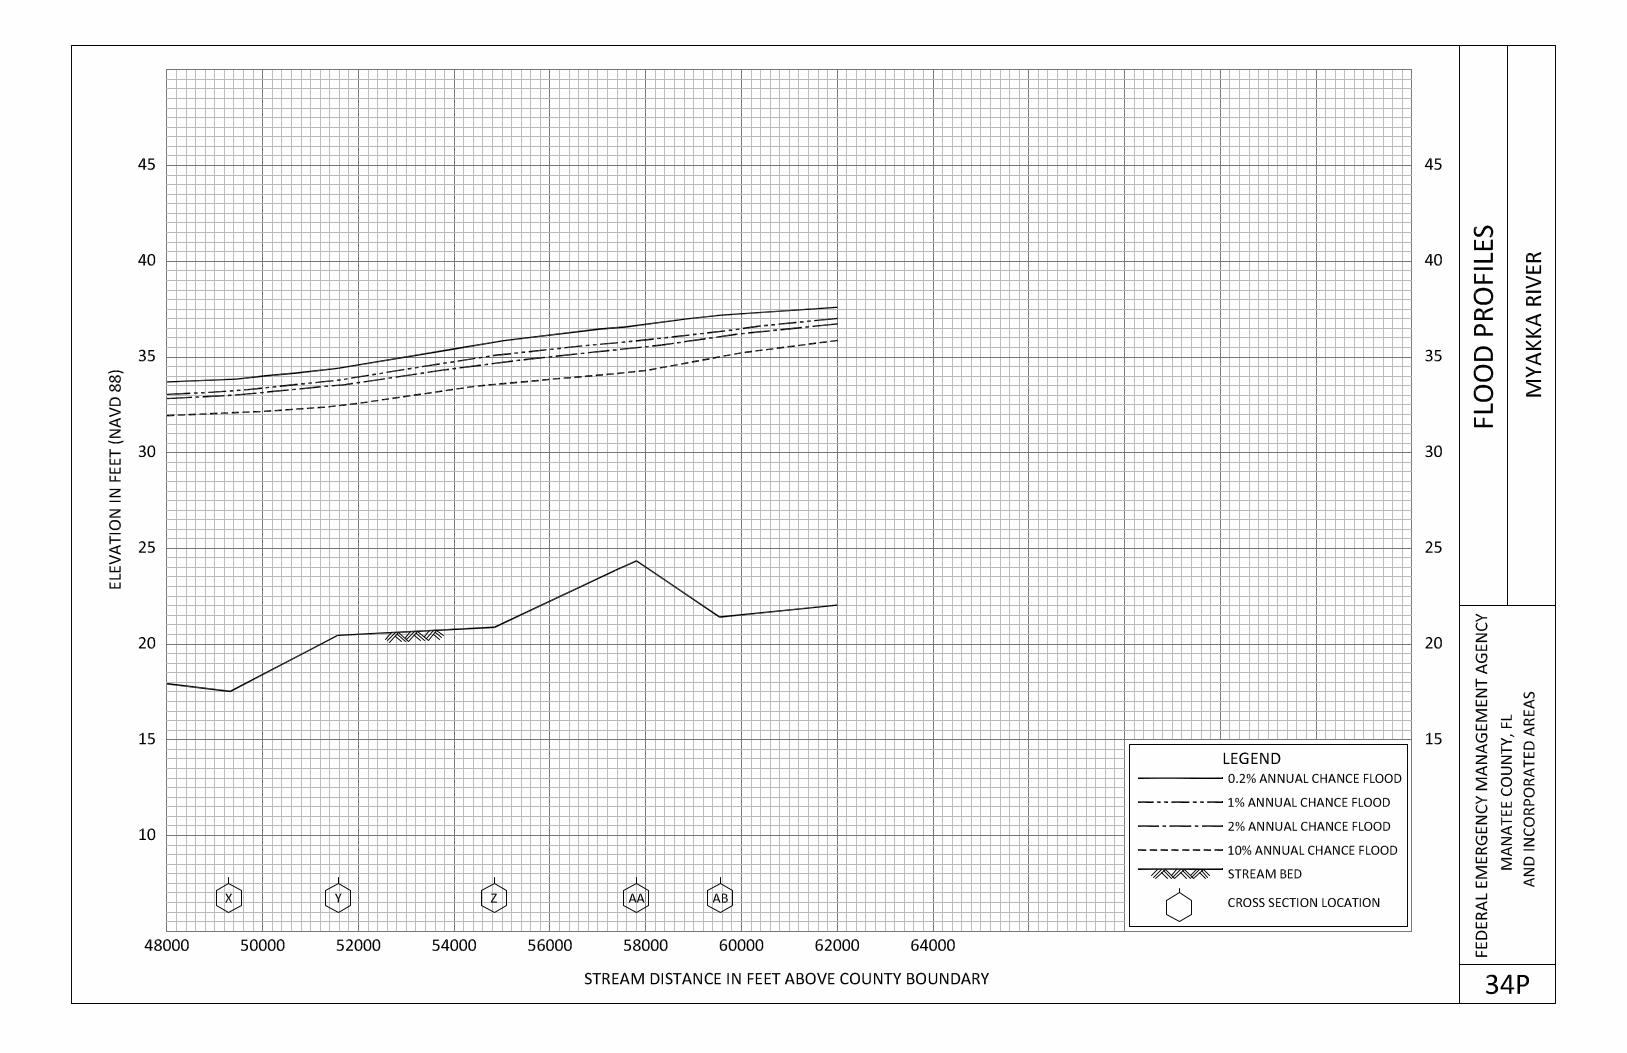
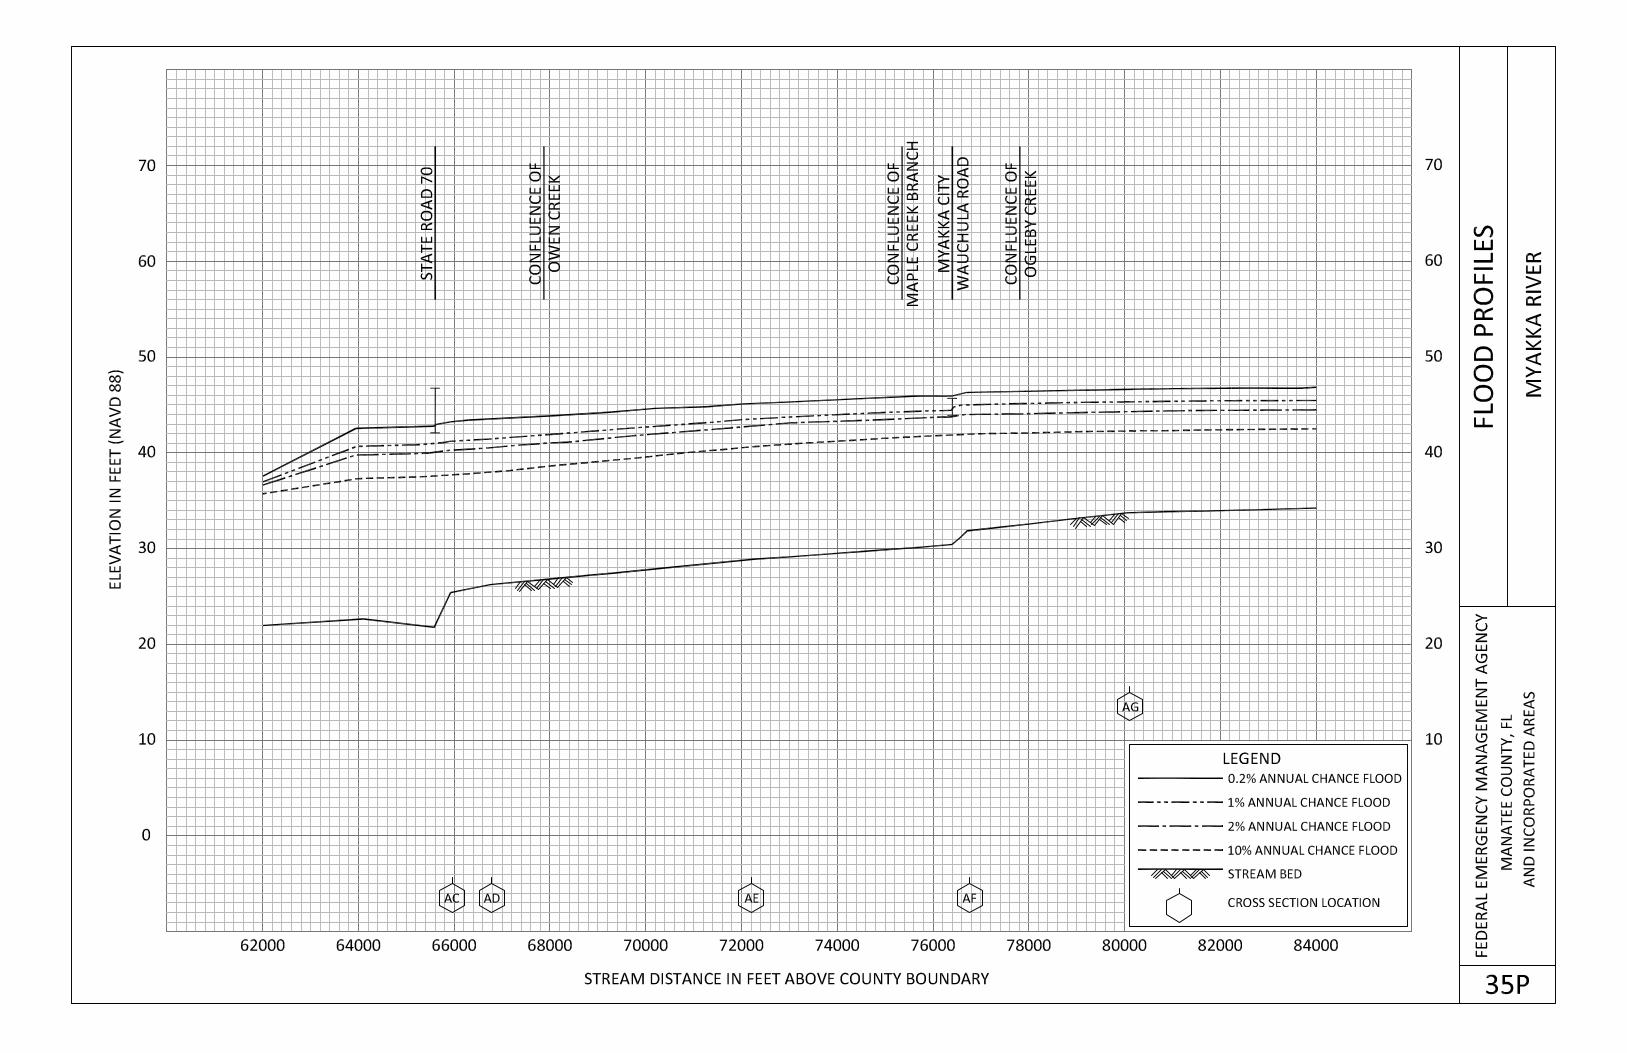
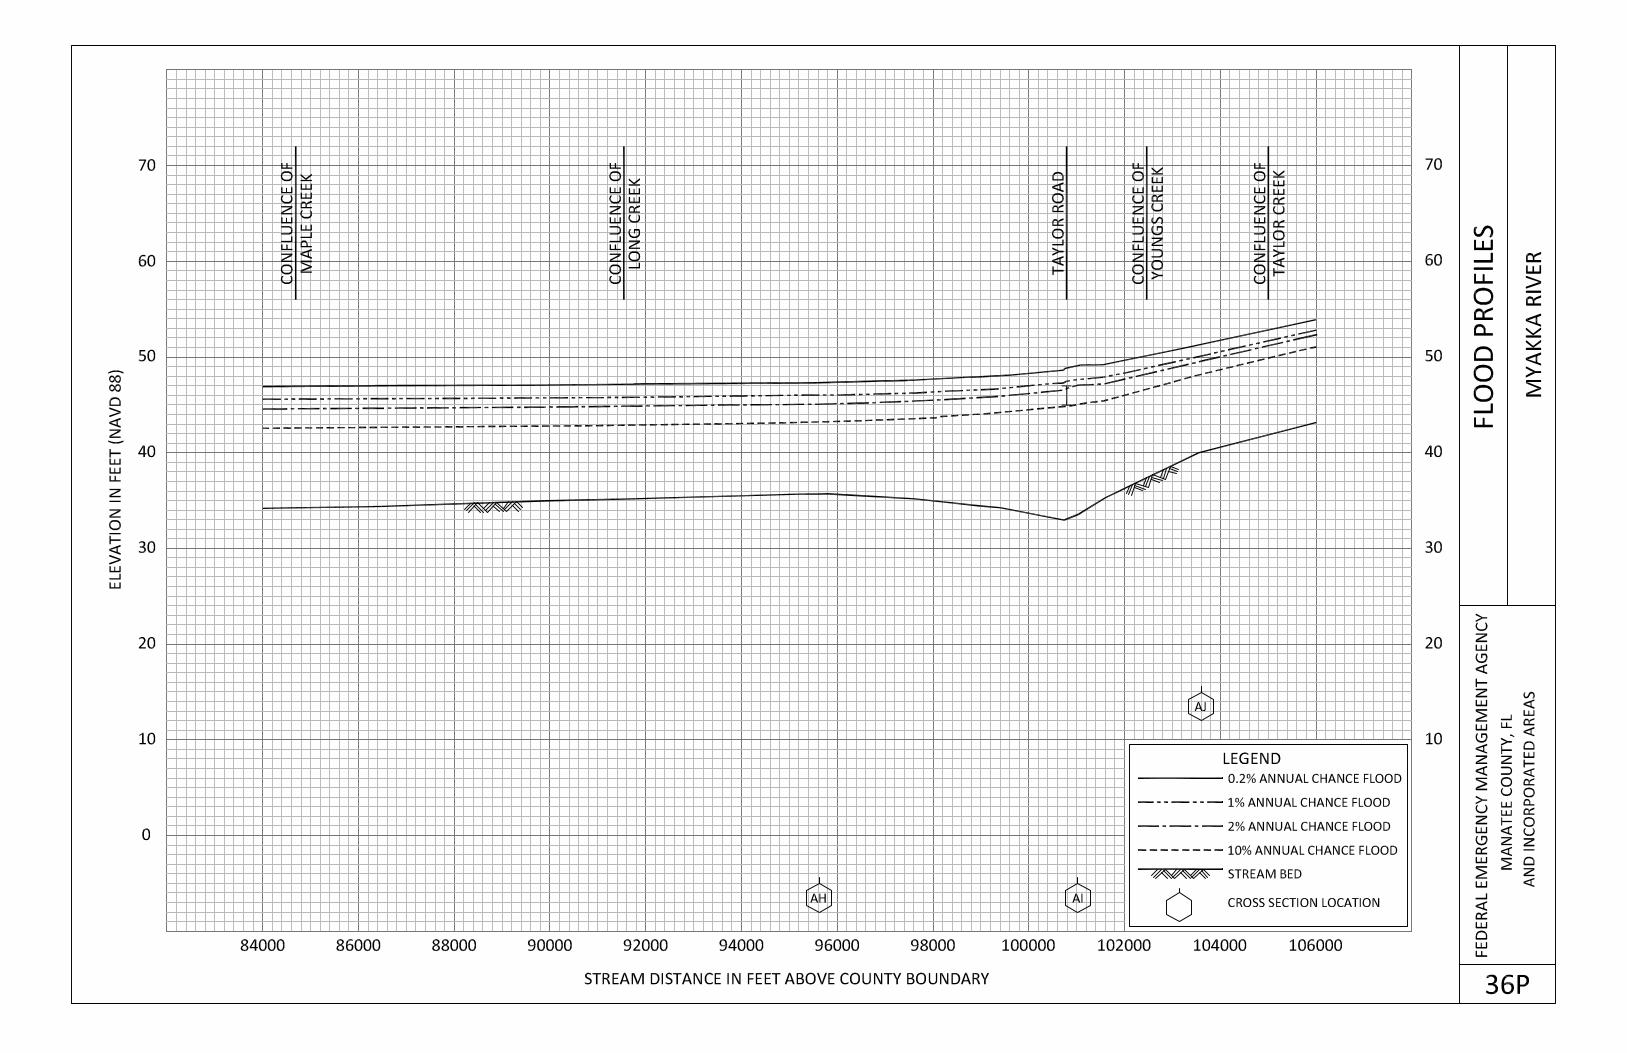
Exhibit 1 – Flood Profiles
EXHIBITS
Bowlees Creek 01P – 03P
Braden River 04P – 07P
Braden River West Channel 08P
Cedar Hammock 09P - 12P
Cooper Creek 13P
Curiosity Creek 14P
Tributary to Curiosity Creek 15P Cypress Strand 16P
East Ditch 17P - 18P
East Fork Cooper Creek 19P
Frye Canal 20P
Gamble Creek 21P – 23P Gap Creek 24P
Gates Creek 25P
Little Manatee River 26P
Manatee River 27P
Manatee River Lake Reach 28P Manatee River Wetland Reach 29P
Mill Creek 30P - 31P
Myakka River 32P – 37P
Rattlesnake Slough 38P
Rattlesnake Slough Diversion Channel 39P
South Fork Little Manatee River 40P – 42P Trunk Ditch 43P – 44P
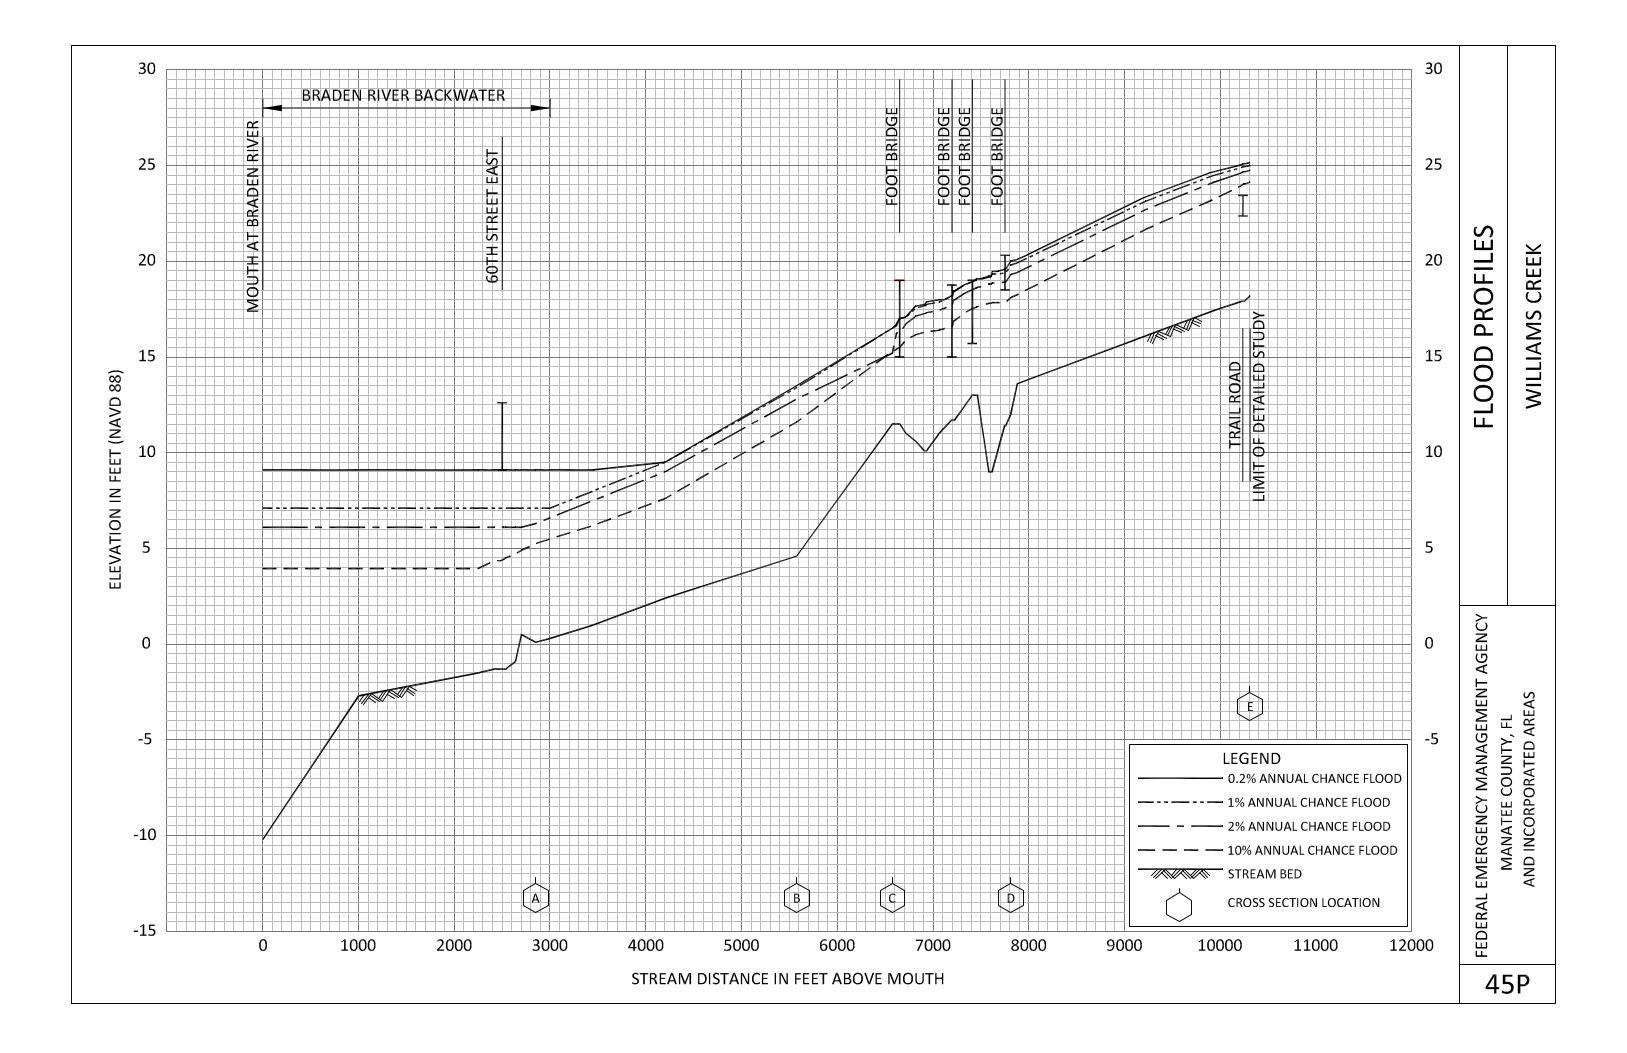
Williams Creek 45P
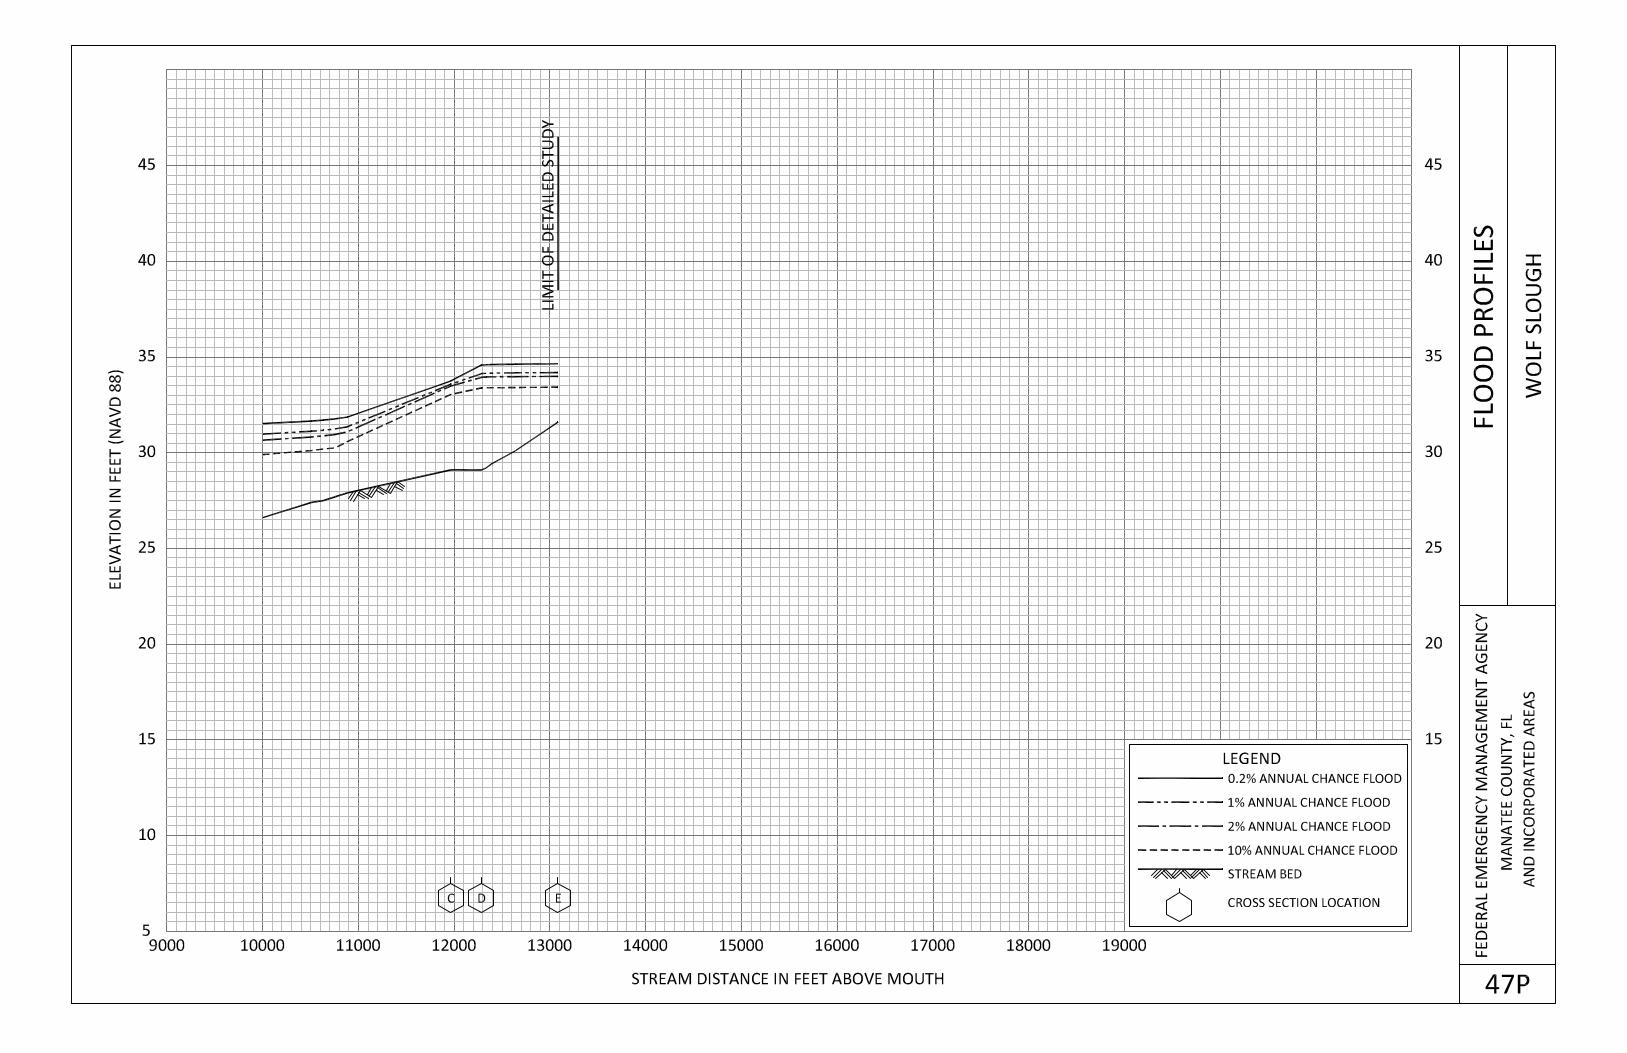
Wolf Slough 46P – 47P
Exhibit 2 – Flood Insurance Rate Map Index
Flood Insurance Rate Map
TABLE OF CONTENTS--continued
1
FLOOD INSURANCE STUDY
MANATEE COUNTY, FLORIDA AND INCORPORATED AREAS
1.0 INTRODUCTION
1.1 Purpose of Study
This Flood Insurance Study (FIS) investigates the existence and severity of flood hazards in, or
revises and updates previous FISs/Flood Insurance Rate Maps (FIRMs) for the geographic area of
Manatee County, Florida, including: the Town of Longboat Key (portion within Manatee County
only); the Cities of Anna Maria, Bradenton, Bradenton Beach, Holmes Beach, Palmetto and the
unincorporated areas of Manatee County (hereinafter referred to collectively as Manatee County).
The portion of the Town of Longboat Key within Sarasota County is not included in this FIS.
This FIS aids in the administration of the National Flood Insurance Act of 1968 and the Flood
Disaster Protection Act of 1973. This study has developed flood risk data for various areas of the
community that will be used to establish actuarial flood insurance rates and assist the community
in its efforts to promoted sound floodplain management. Minimum floodplain management
requirements for participation in the National Flood Insurance Program (NFIP) are set forth in the
Code of Federal Regulations at 44 CFR, 60.3, as amended.
In some states or communities, floodplain management criteria or regulations may exist that are
more restrictive or comprehensive than the minimum Federal requirements. In such cases, the
more restrictive criteria take precedence and the state (or other jurisdictional agency) will be able
to explain them.
1.2 Authority and Acknowledgments
The sources of authority for this Flood Insurance Study are the National Flood Insurance Act of
1968 and the Flood Disaster Protection Act of 1973.
This FIS was prepared to combine the incorporated communities within Manatee County into a
countywide format. Information on the authority and acknowledgments for each jurisdiction
included in this countywide FIS, as compiled from their previously printed FIS reports
(References 1 through 7), is shown below.
Anna Maria, City of: The hydrologic and hydraulic analyses for this
study were performed by Tetra Tech, Inc., for
the Federal Emergency Management Agency,
under Contract No. H-4510. This work, which
was completed in April 1979, covered all
significant flooding sources affecting the City of
Anna Maria. (Reference 8).
Bradenton, City of: The hydrologic and hydraulic analyses for this
study were performed by Tetra Tech, Inc., for
the Federal Emergency Management Agency,
under Contract No. H-4510. This work, which
was completed in March 1979, covered all
significant flooding sources affecting the
2
unincorporated areas of the City of Bradenton,
Florida. (Reference 9).
Bradenton Beach, City of: The hydrologic and hydraulic analyses for this
study were performed by Tetra Tech, Inc., for
the Federal Emergency Management Agency,
under Contract No. H-4510. This work, which
was completed in April 1979, covered all
significant flooding sources affecting the City of
Bradenton Beach. (Reference 8).
Holmes Beach, City of: The hydrologic and hydraulic analyses for this
study were performed by Tetra Tech, Inc., for
the Federal Emergency Management Agency,
under Contract No. H-4510. This work, which
was completed in April 1979, covered all
significant flooding sources affecting the City of
Holmes Beach (Reference 8).
Longboat Key, Town of: The hydrologic and hydraulic analyses for this
study were performed by Tetra Tech, Inc., for
the Federal Emergency Management Agency,
under Contract No. H-4059. This work, which
was completed in July 1978, covered all
significant flooding sources affecting the Town
of Longboat Key. (Reference 10).
Manatee County (Unincorporated Areas): The original hydrologic and hydraulic analyses
for this study were performed by Tetra Tech,
Inc., for the Federal Emergency Management
Agency, under Contract No. H-4510. This work,
which was completed in March 1979, covered
all significant flooding sources affecting the
unincorporated areas of Manatee County,
Florida. (Reference 9).
Updated hydrologic and hydraulic analyses
mentioned in Section 9 - Revisions Description
of the July 15, 1992 FIS report were performed
by Engineering Methods & Application, Inc.,
under Contract No. EMW-89-C-2823 for the
Federal Emergency Management Agency
(FEMA). (Reference 11).
The 1992 study revision included the overflow
of Cabbage Slough; Wade Canal; Frye Canal;
Cooper Creek; Frog Creek, upstream of U.S.
Route 41; Buffalo Canal; Gamble Creek,
upstream of Golf Course Drive; Braden River,
upstream of Interstate 75; Braden River West
Channel; Wolf Slough; Mill Creek, upstream of
3
confluence of unnamed tributary; Rattlesnake
Slough; Gap Creek; Williams Creek; Cypress
Strand; Gates Creek; East Fork Cooper Creek;
Myakka River, upstream of State Road 70; and
South Fork Little Manatee River.
The updated hydrologic and hydraulic analyses
for Cedar Hammock Drainage Canal mentioned
in the July 15, 1992 FIS report Section 9 -
Revisions Description were taken from a COE
reconnaissance report (Reference 12).
Palmetto, City of: The hydrologic and hydraulic analyses for this
study were performed by Tetra Tech, Inc., for
the Federal Emergency Management Agency,
under Contract No. H-4510. This work, which
was completed in April 1979, covered all
significant flooding sources affecting the City of
Palmetto (Reference 8).
For this countywide revision, the conversion to the Digital Flood Insurance Rate Map (DFIRM)
format is based upon updated orthophotography and also involved: the redelineation of coastal
floodplain areas based upon updated Light Detection and Ranging (LiDAR)-derived topographic
data (94 miles), the incorporation of several new community-supplied detailed studies (92 miles),
the addition of new approximate Zone A areas based on SWFWMD wetland and waterbody land
use codes and National Wetland Inventory (NWI) delineations (36 miles), new approximate Zone
A delineations on riverine reaches (76 miles), the incorporation of effective Letters of Map
Revisions (LOMRs) (9 miles), and the transition from the National Geodetic Vertical Datum of
1929 (NGVD 29) to the North American Vertical Datum of 1988 (NAVD 88). The study was
prepared by the BakerAECOM, for FEMA, under Contract No. HSFEHQ-09-0368, Task Order
No. HSFE04-09-0066. This work was completed in September 2011 (Reference 13). Table 4
lists the scope of this revision in more detail.
The Wares Creek / Cedar Hammock Creek hydrologic and hydraulic analyses were prepared by
the U.S. Department of the Army, Army Corps of Engineers, Jacksonville District, in October
2007, and submitted to FEMA during the Flood Insurance Study project scoping phase
(Reference 14).
The Frog Creek/Buffalo Canal watershed was restudied using ICPR V3 by the Southwest Florida
Water Management District (SWFWMD) contractor Jones Edmunds & Associates, Inc. in
October 2007, and submitted to FEMA during the Flood Insurance Study project scoping phase
(Reference 15).
Base map information shown on the FIRM panels was base map orthophotography obtained from
Southwest Florida Water Management District (SWFWMD) from one−foot resolution digital
orthoimagery flown in 2008 and 2009 (Reference 16). Vector base map data was provided by
Manatee County and SWFWMD. Vector information was compiled in 2003−2009 by Manatee
County GIS department (Reference 17). Elevation data for the current study and redelineation
efforts was provided in the form of LiDAR terrain data. (Reference 18). The projection used in
the preparation of this map is Florida State Plane west zone (FIPSZONE 0902), North American
Datum of 1983 (NAD 83), GRS80 spheroid.
4
1.3 Coordination
Consultation Coordination Officer’s (CCO) meetings may be held for each jurisdiction in this
countywide FIS. An initial CCO meeting is held typically with representatives of FEMA, the
community, and the study contractor to explain the nature and purpose of a FIS and to identify the
steams to be studied by detailed methods. A final CCO meeting is held typically with
representatives of FEMA, the community, and the study contractor to review the results of the
study.
An initial time and cost estimation meeting was held on February 16, 1977. Representatives of
the study contractor, the county, and the Federal Emergency Management Agency agreed on the
scope and methods of study. Information describing hydrologic conditions, drainage patterns, and
other flood-related data, as well as information on topography, roads, bench marks, and
demography was sought from the Manatee County Planning and Engineering Departments; the
State of Florida, Department of Community Affairs; the State of Florida, Department of
Transportation; the Manatee Chamber of Commerce; the Manatee County Utility System; the
National Oceanic and Atmospheric Administration; the Seaboard Coast Line Railroad; the U.S.
Soil Conservation Service; the Southwest Florida Water Management District; the Tampa Bay
Regional Planning Council; the U.S. Army Corps of Engineers, Jacksonville District; and the
U.S. Geological Survey.
On August 21, 1979, an intermediate meeting was held and attended by representatives of the
study contractor, the county, and the Federal Emergency Management Agency.
TABLE 1 – PRE-COUNTYWIDE CCO MEETINGS
Community Initial CCO Date Intermediate CCO Date Final CCO Date
Anna Maria, City of * * June 29, 1982
Bradenton, City of * * February 23, 1983
Bradenton Beach, City
of
* * *
Holmes Beach, City of * * June 29, 1982
Longboat Key, Town of * * June 7, 1979
Manatee County
(Unincorporated Areas)
February 16, 1977 August 21, 1979 *
Palmetto, City of * * *
*Data Not Available
The initial meeting was held on November 2, 2009 with FEMA, Southwest Florida Water
Management District, BakerAECOM, Manatee County and the Cities of Anna Maria, Bradenton
Beach, Bradenton Beach, Holmes Beach, Palmetto and the Town of Longboat Key to explain the
5
nature and purpose of the countywide Manatee County FIS and to identify the streams to be
studied and restudied, the DFIRM format and the conversion to the NAVD 88 datum.
The results of the study were reviewed at the final meeting held on June 11, 2012, and attended
by representatives of FEMA, Southwest Florida Water Management District, BakerAECOM,
Manatee County and the Cities of Anna Maria, Bradenton Beach, Bradenton Beach, Holmes
Beach, Palmetto and the Town of Longboat Key All issues and/or concerns raised at that
meeting have been addressed.
2.0 AREA STUDIED
2.1 Scope of Study
This FIS covers the geographic area of Manatee County, Florida.
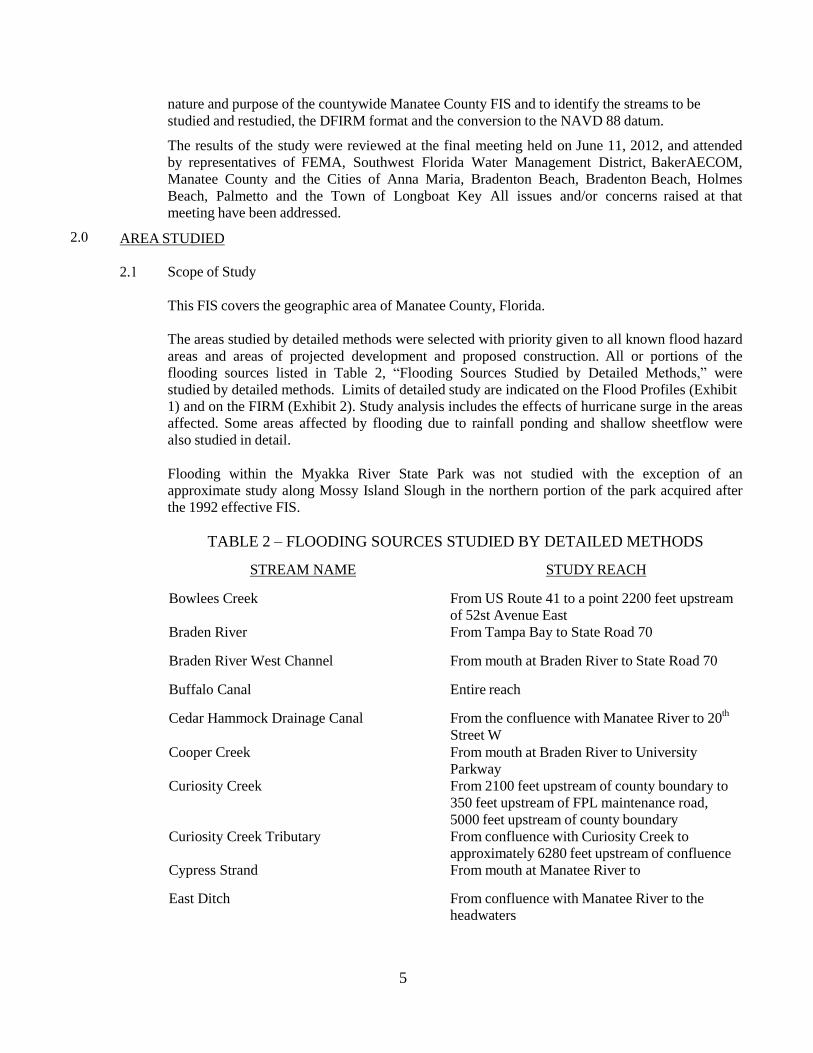
The areas studied by detailed methods were selected with priority given to all known flood hazard
areas and areas of projected development and proposed construction. All or portions of the
flooding sources listed in Table 2, “Flooding Sources Studied by Detailed Methods,” were
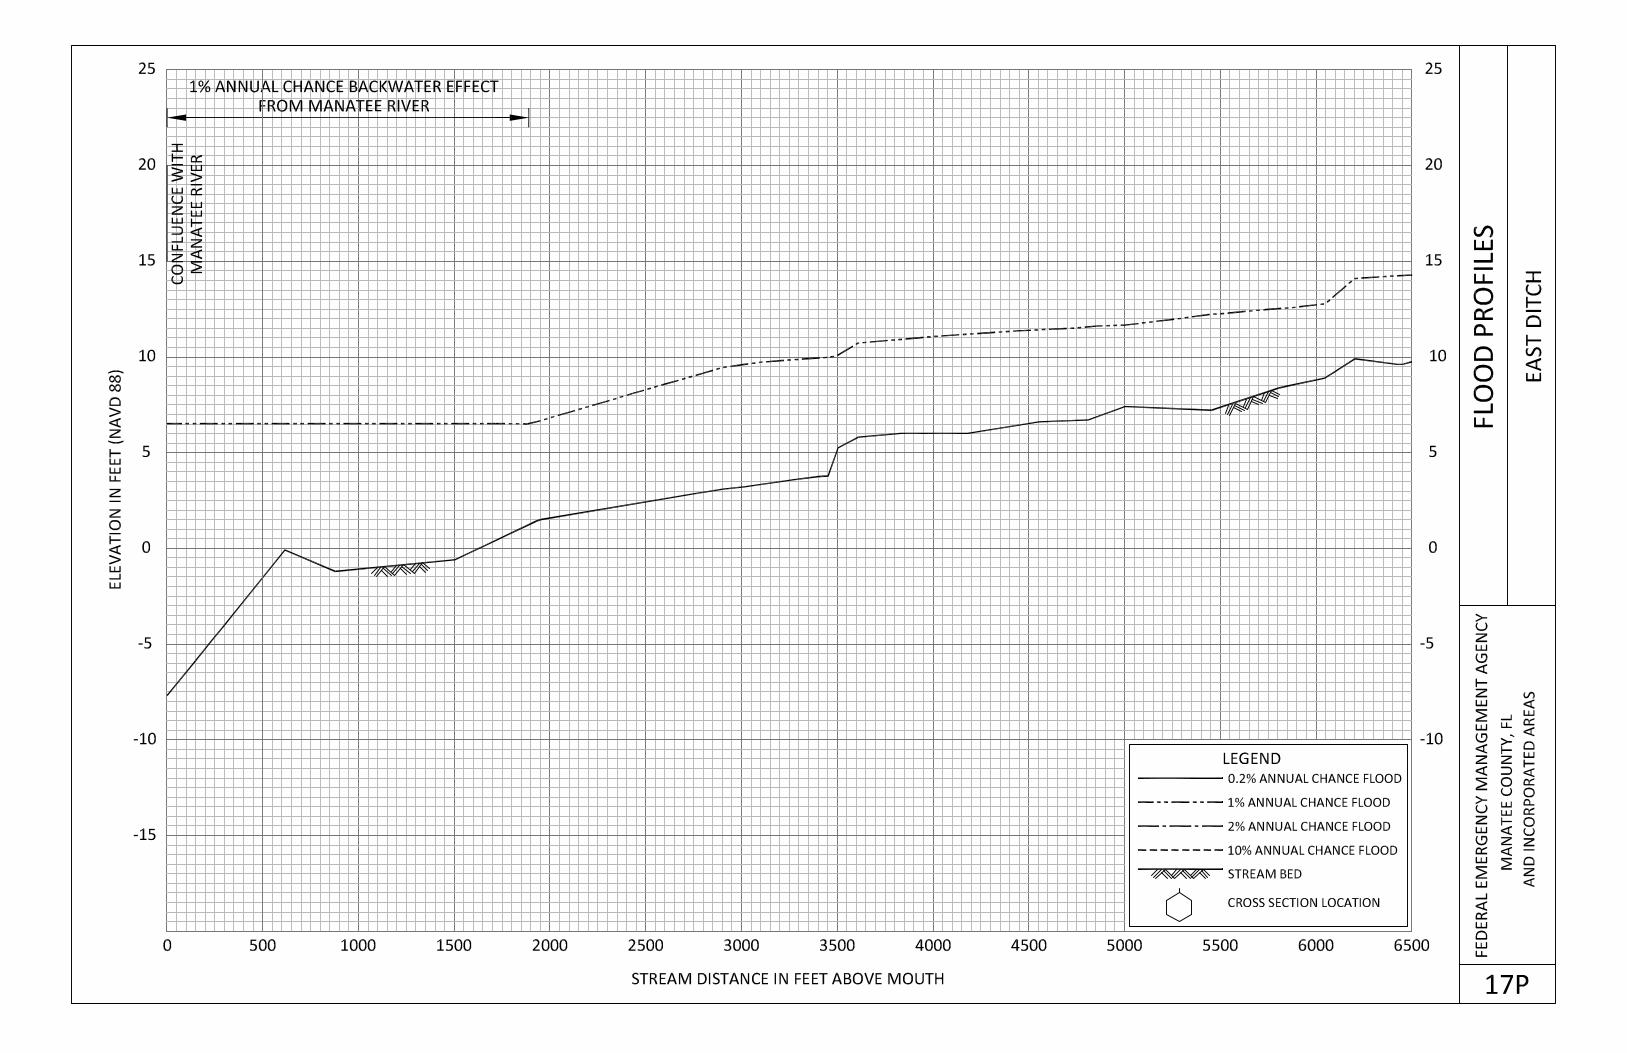
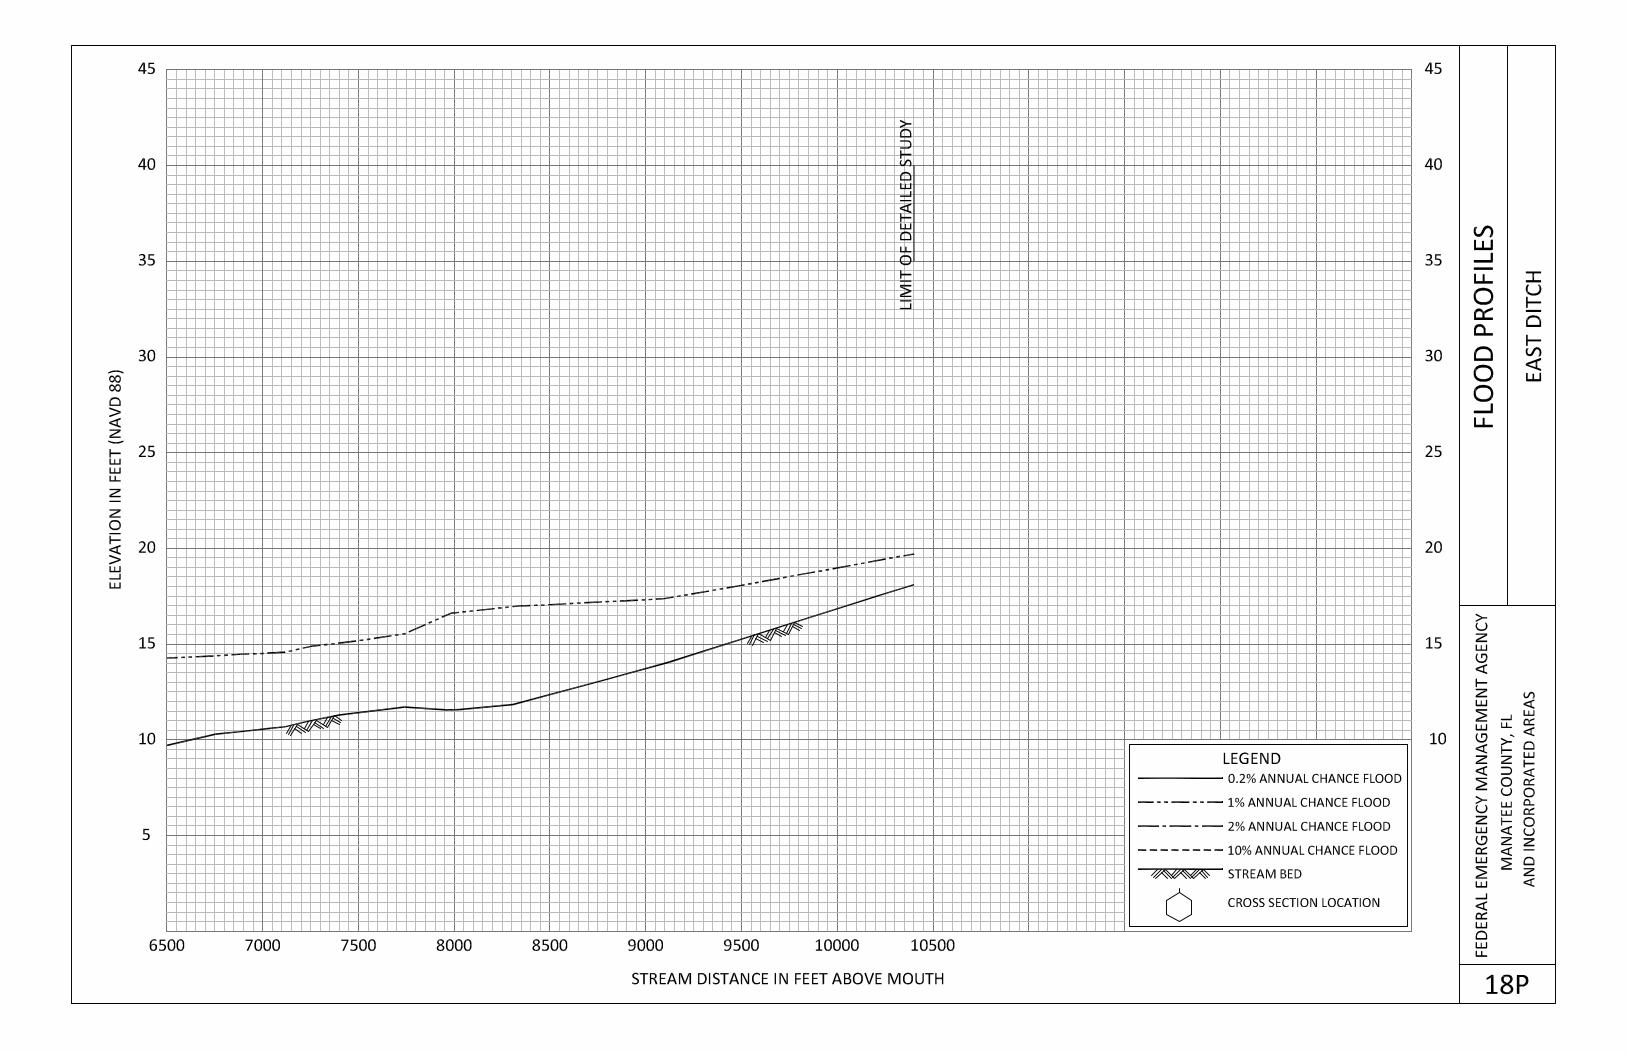
studied by detailed methods. Limits of detailed study are indicated on the Flood Profiles (Exhibit
1) and on the FIRM (Exhibit 2). Study analysis includes the effects of hurricane surge in the areas
affected. Some areas affected by flooding due to rainfall ponding and shallow sheetflow were
also studied in detail.
Flooding within the Myakka River State Park was not studied with the exception of an
approximate study along Mossy Island Slough in the northern portion of the park acquired after
the 1992 effective FIS.
TABLE 2 – FLOODING SOURCES STUDIED BY DETAILED METHODS
STREAM NAME STUDY REACH
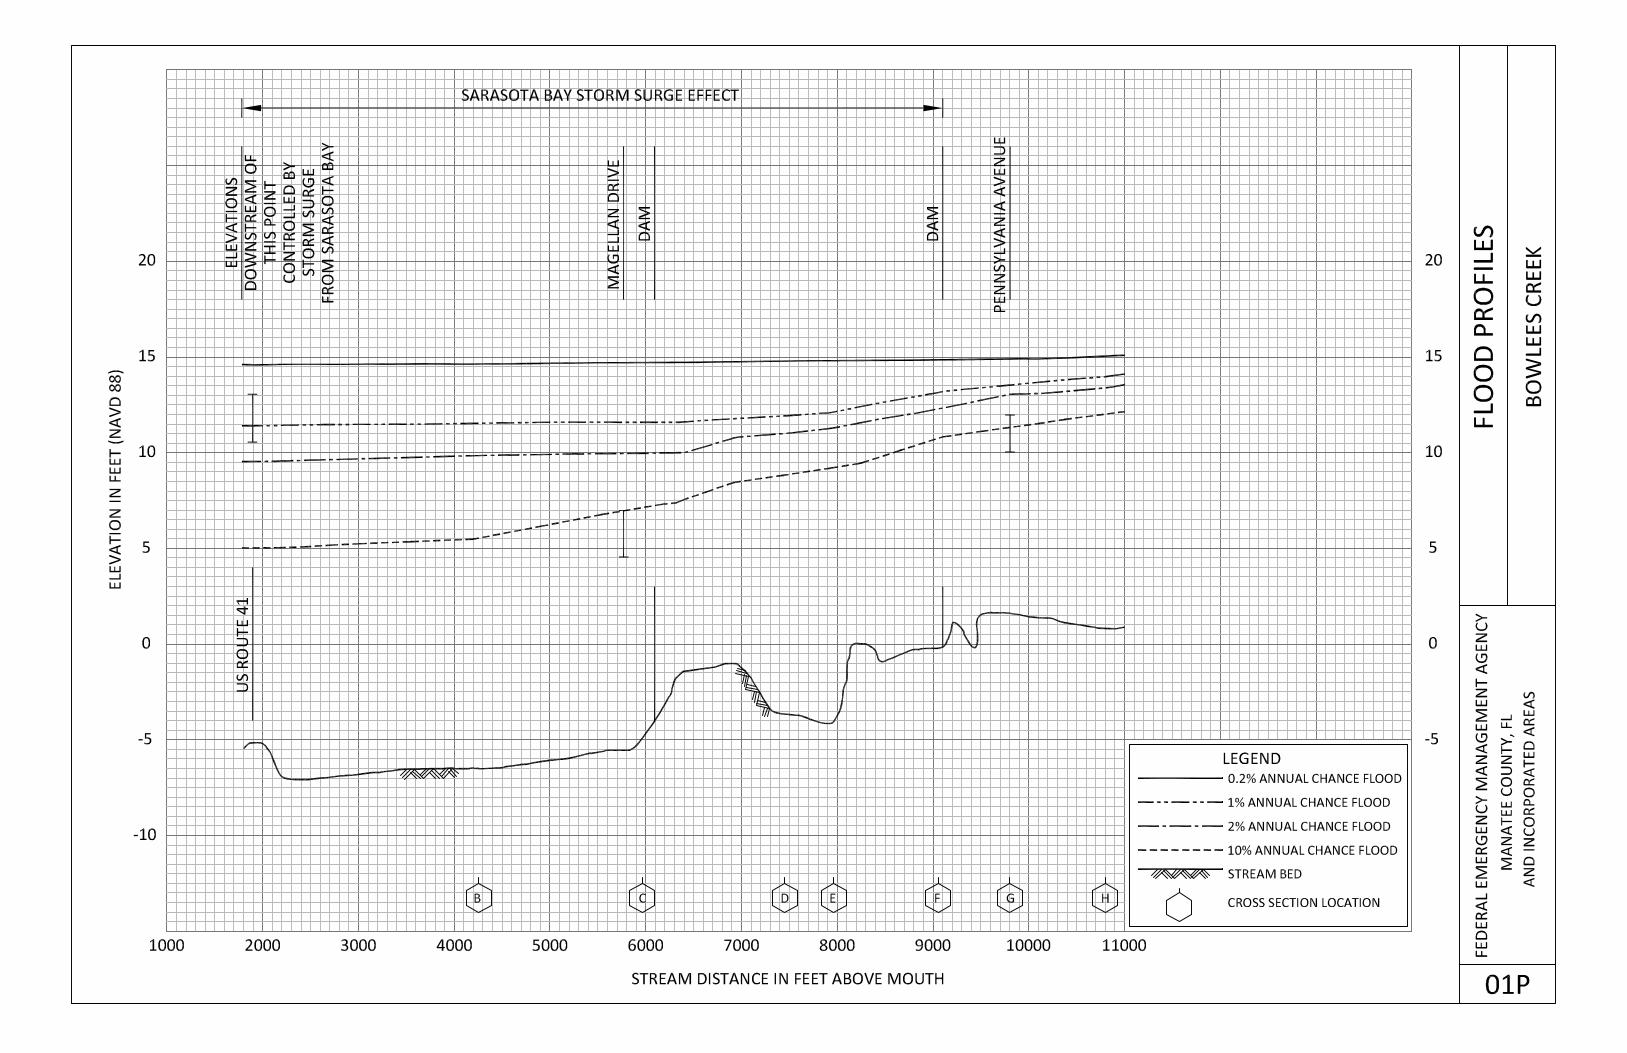
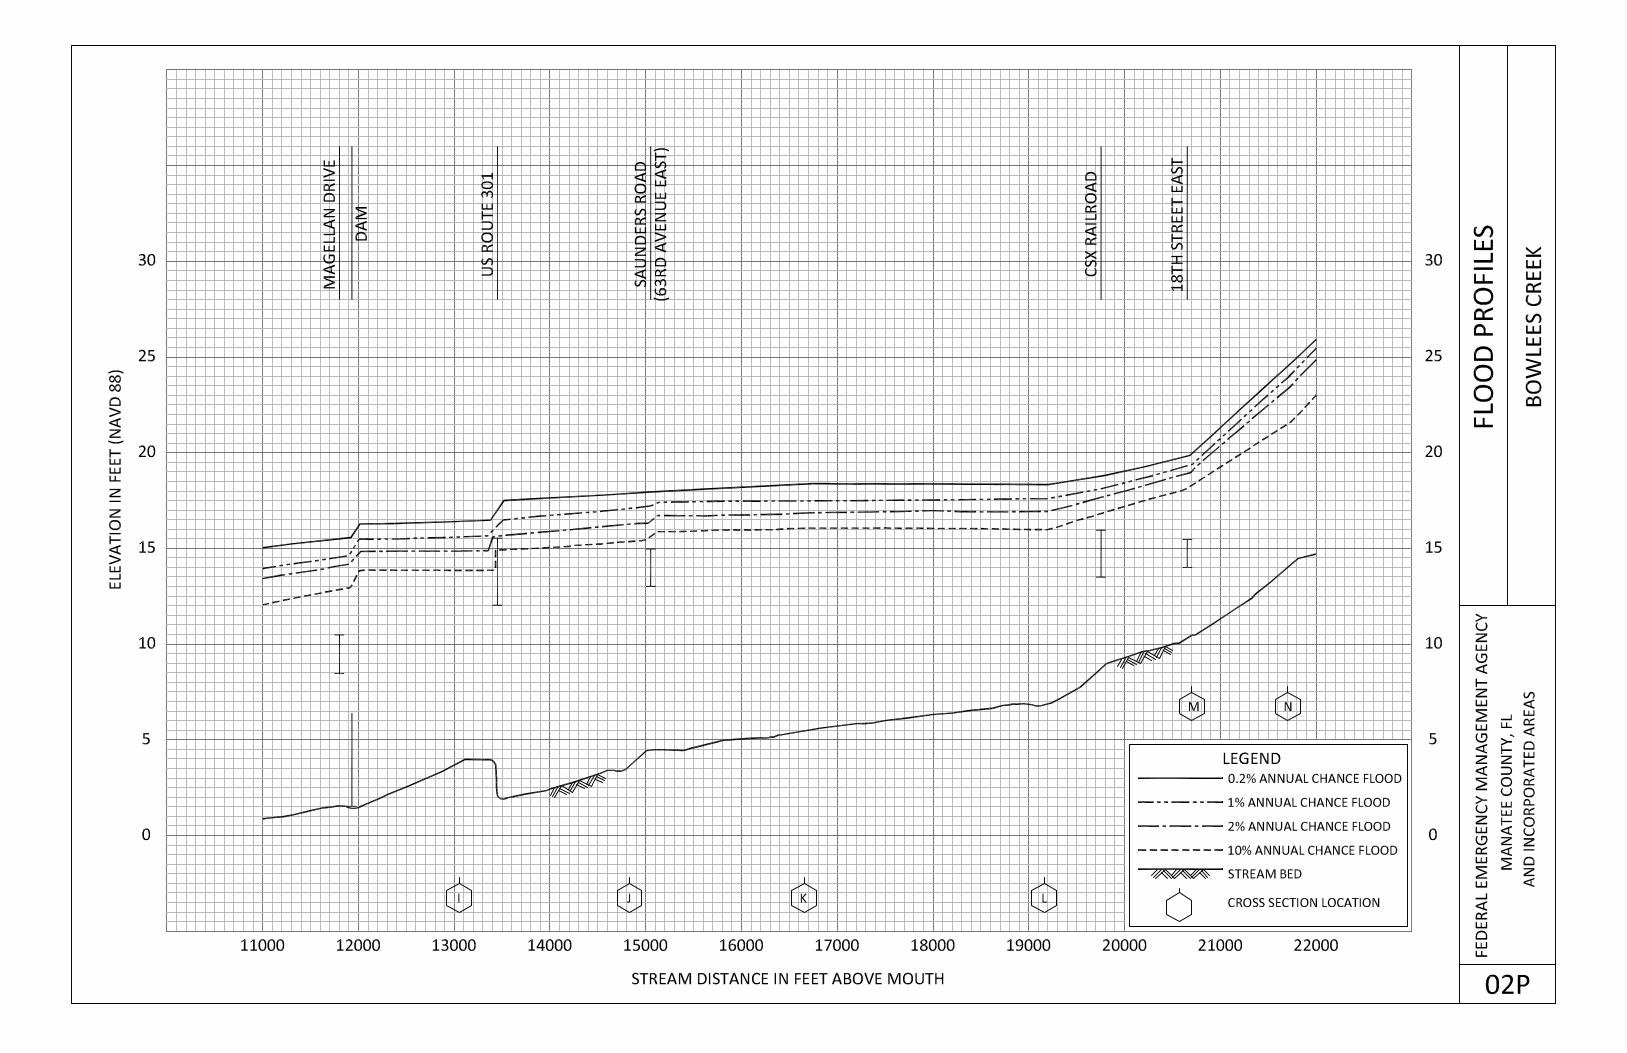
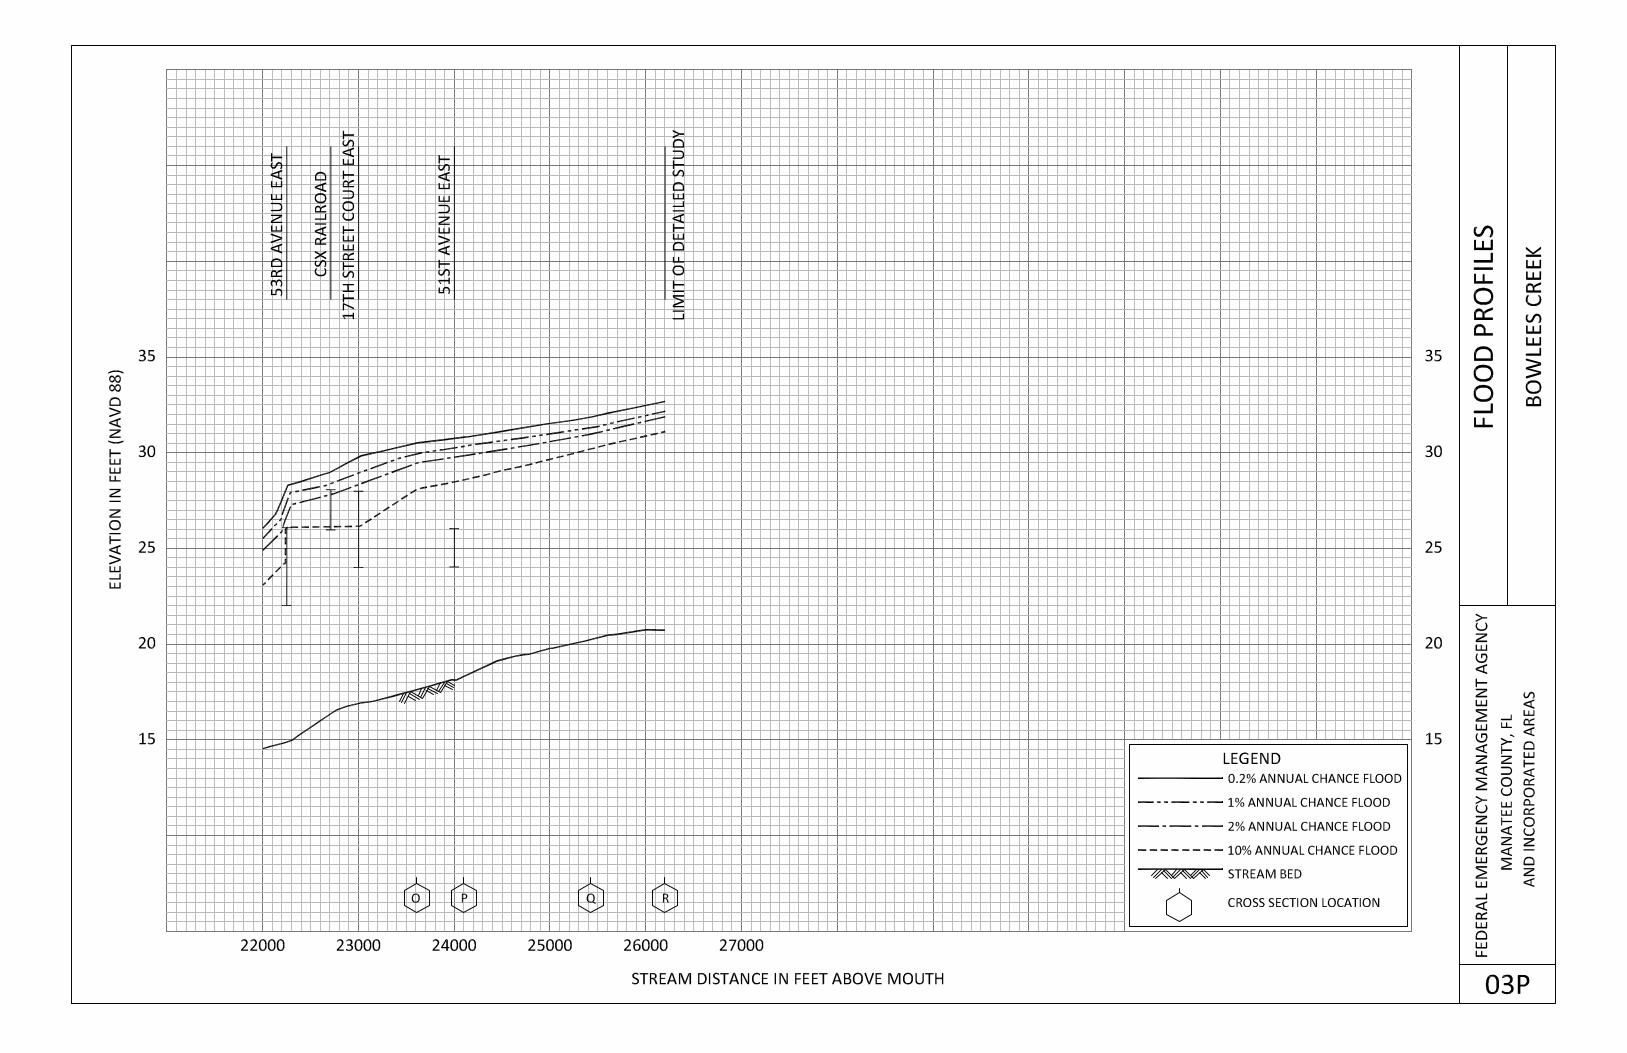
Bowlees Creek From US Route 41 to a point 2200 feet upstream
of 52st Avenue East
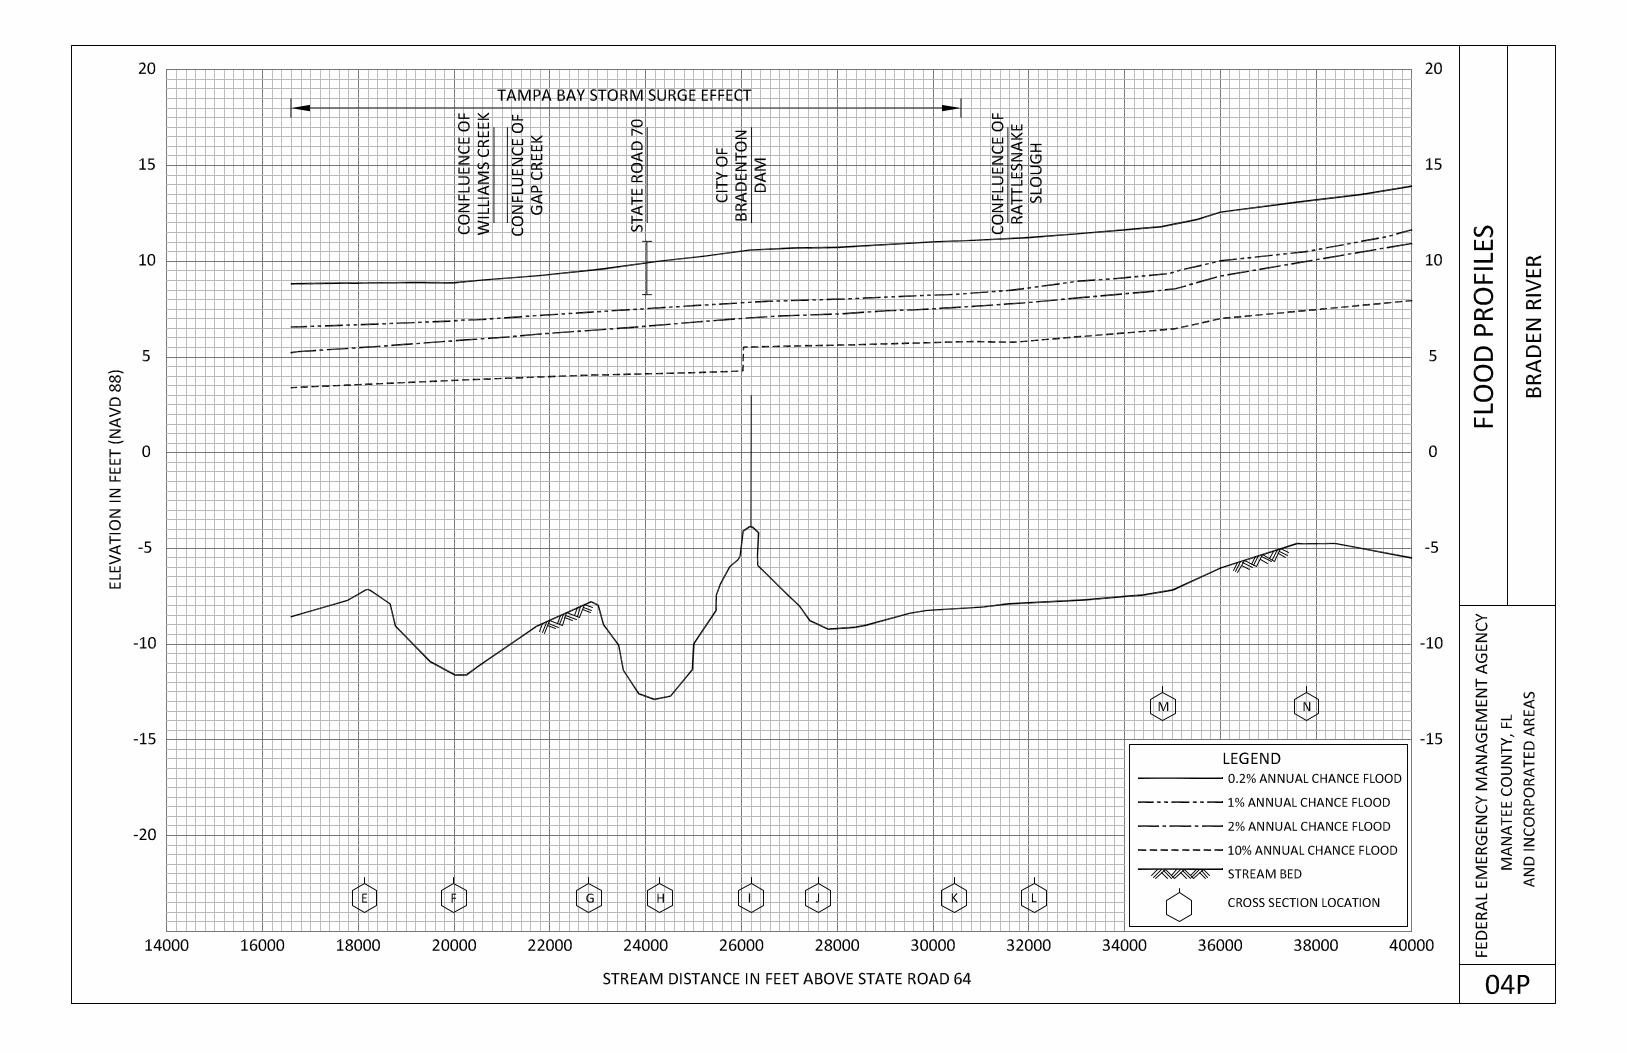
Braden River From Tampa Bay to State Road 70
Braden River West Channel From mouth at Braden River to State Road 70
Buffalo Canal Entire reach
Cedar Hammock Drainage Canal From the confluence with Manatee River to 20th
Street W
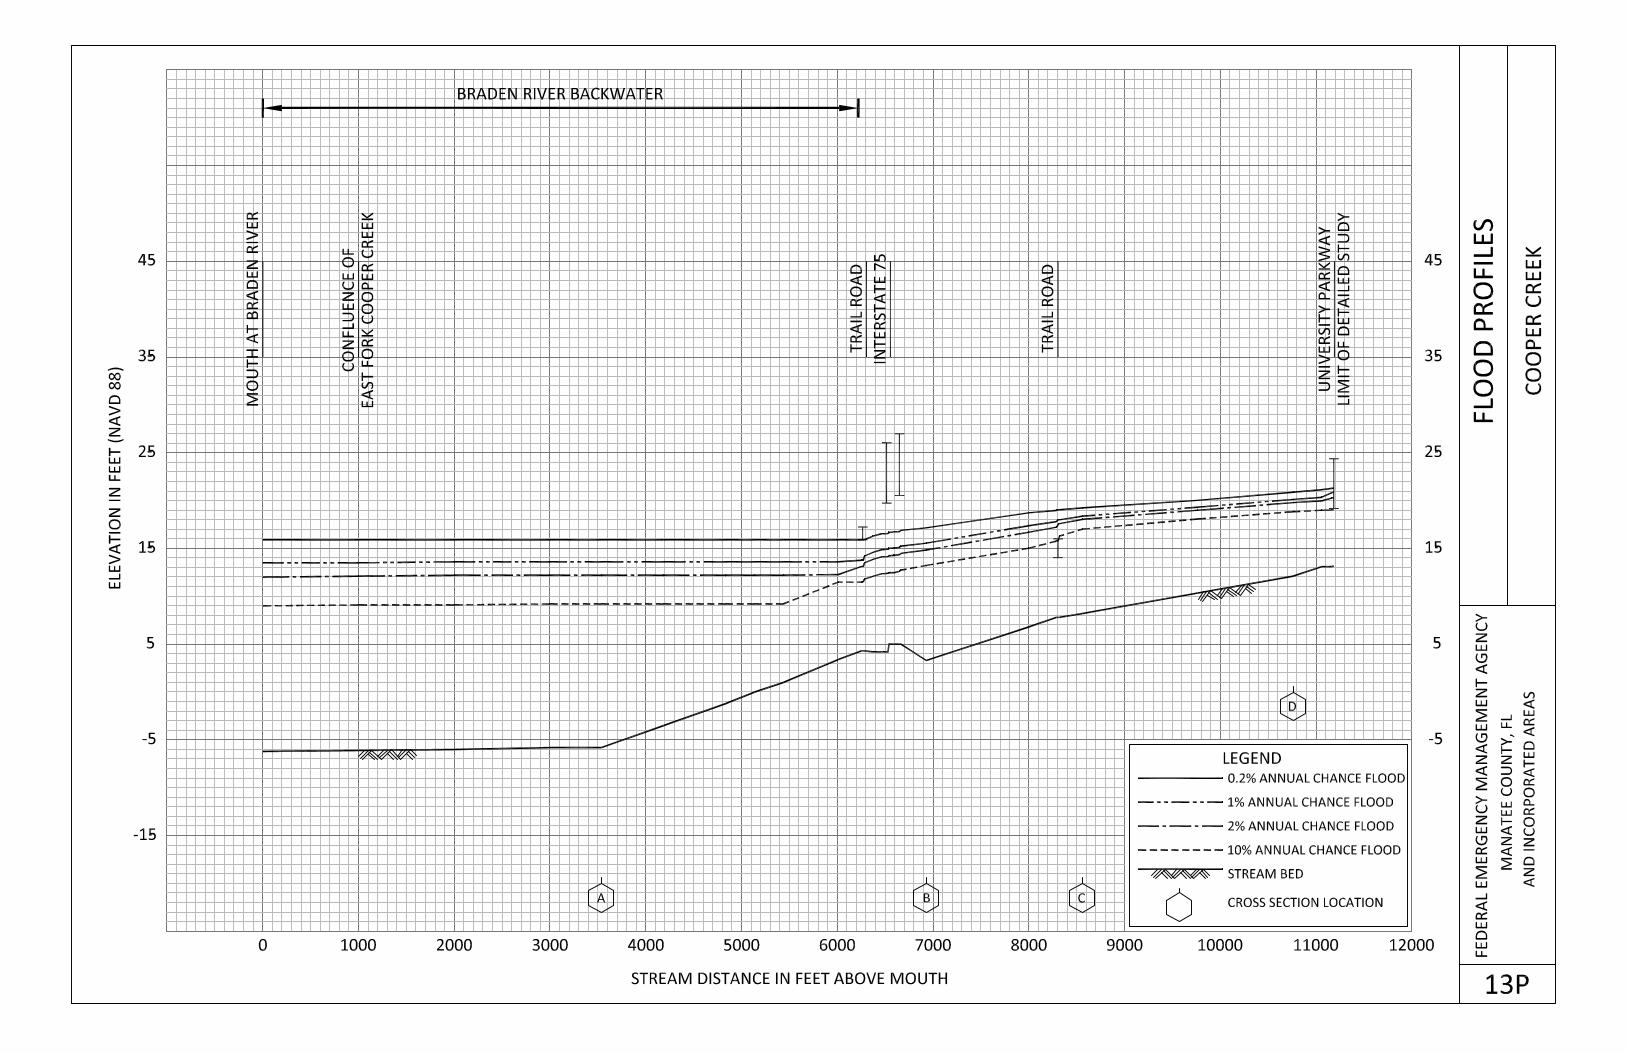
Cooper Creek From mouth at Braden River to University
Parkway
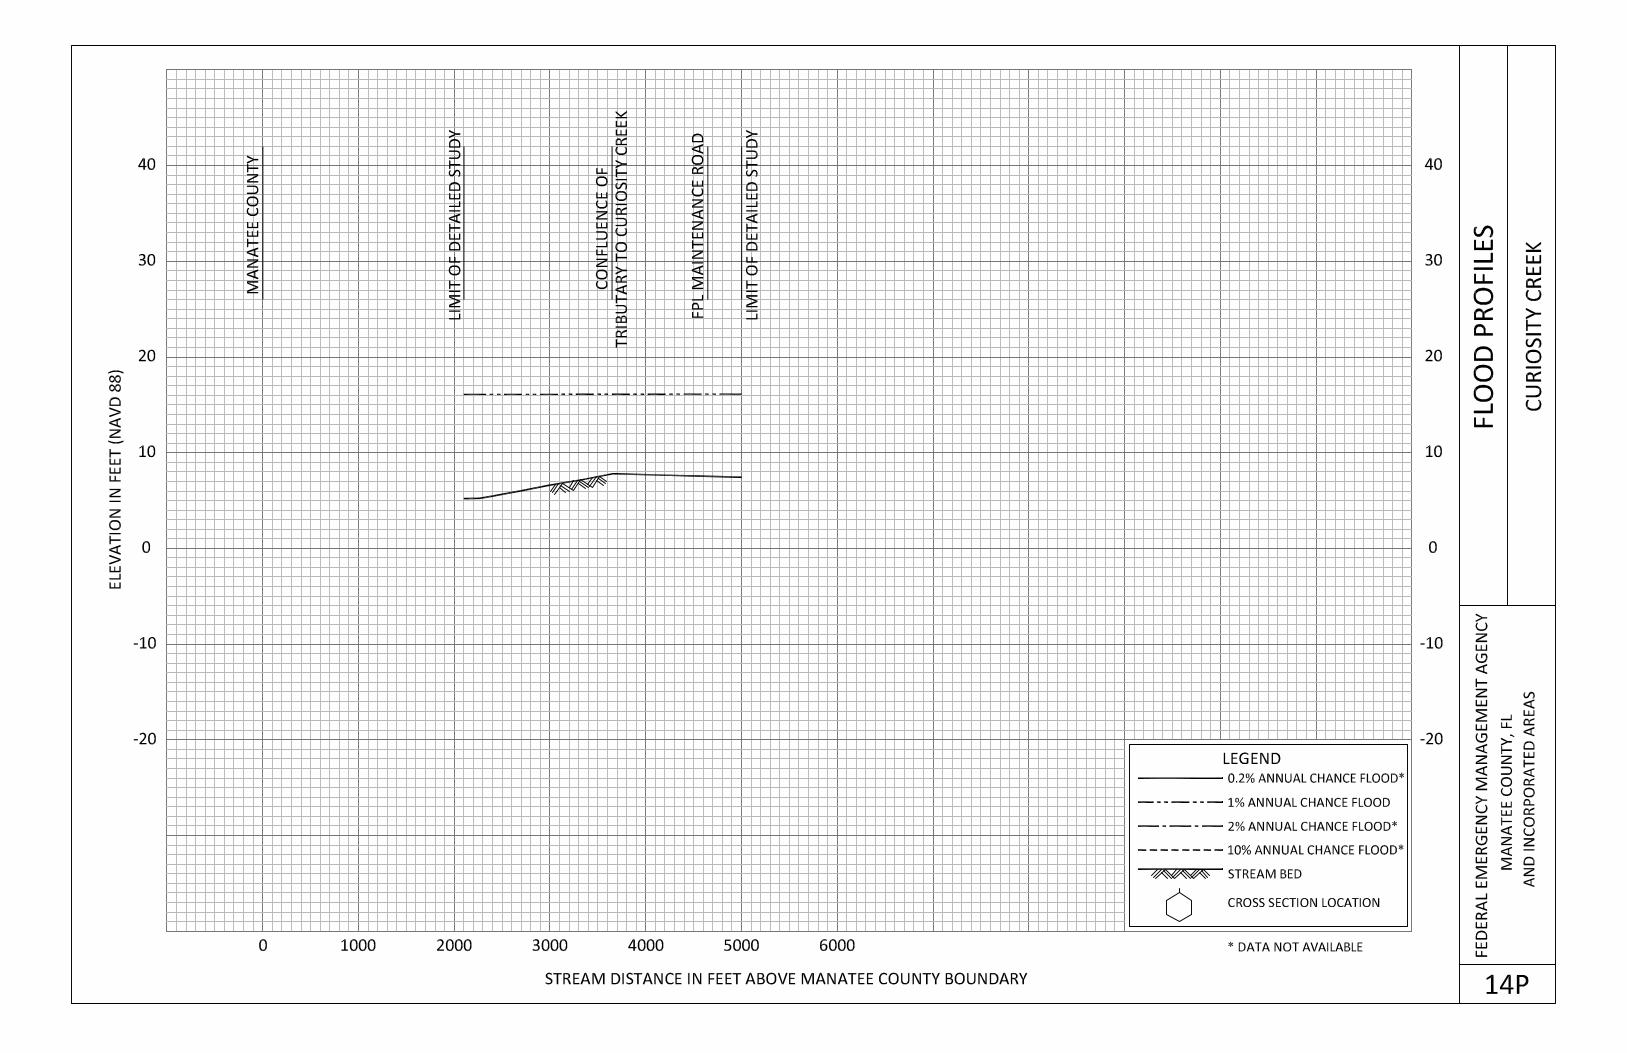
Curiosity Creek From 2100 feet upstream of county boundary to
350 feet upstream of FPL maintenance road,
5000 feet upstream of county boundary
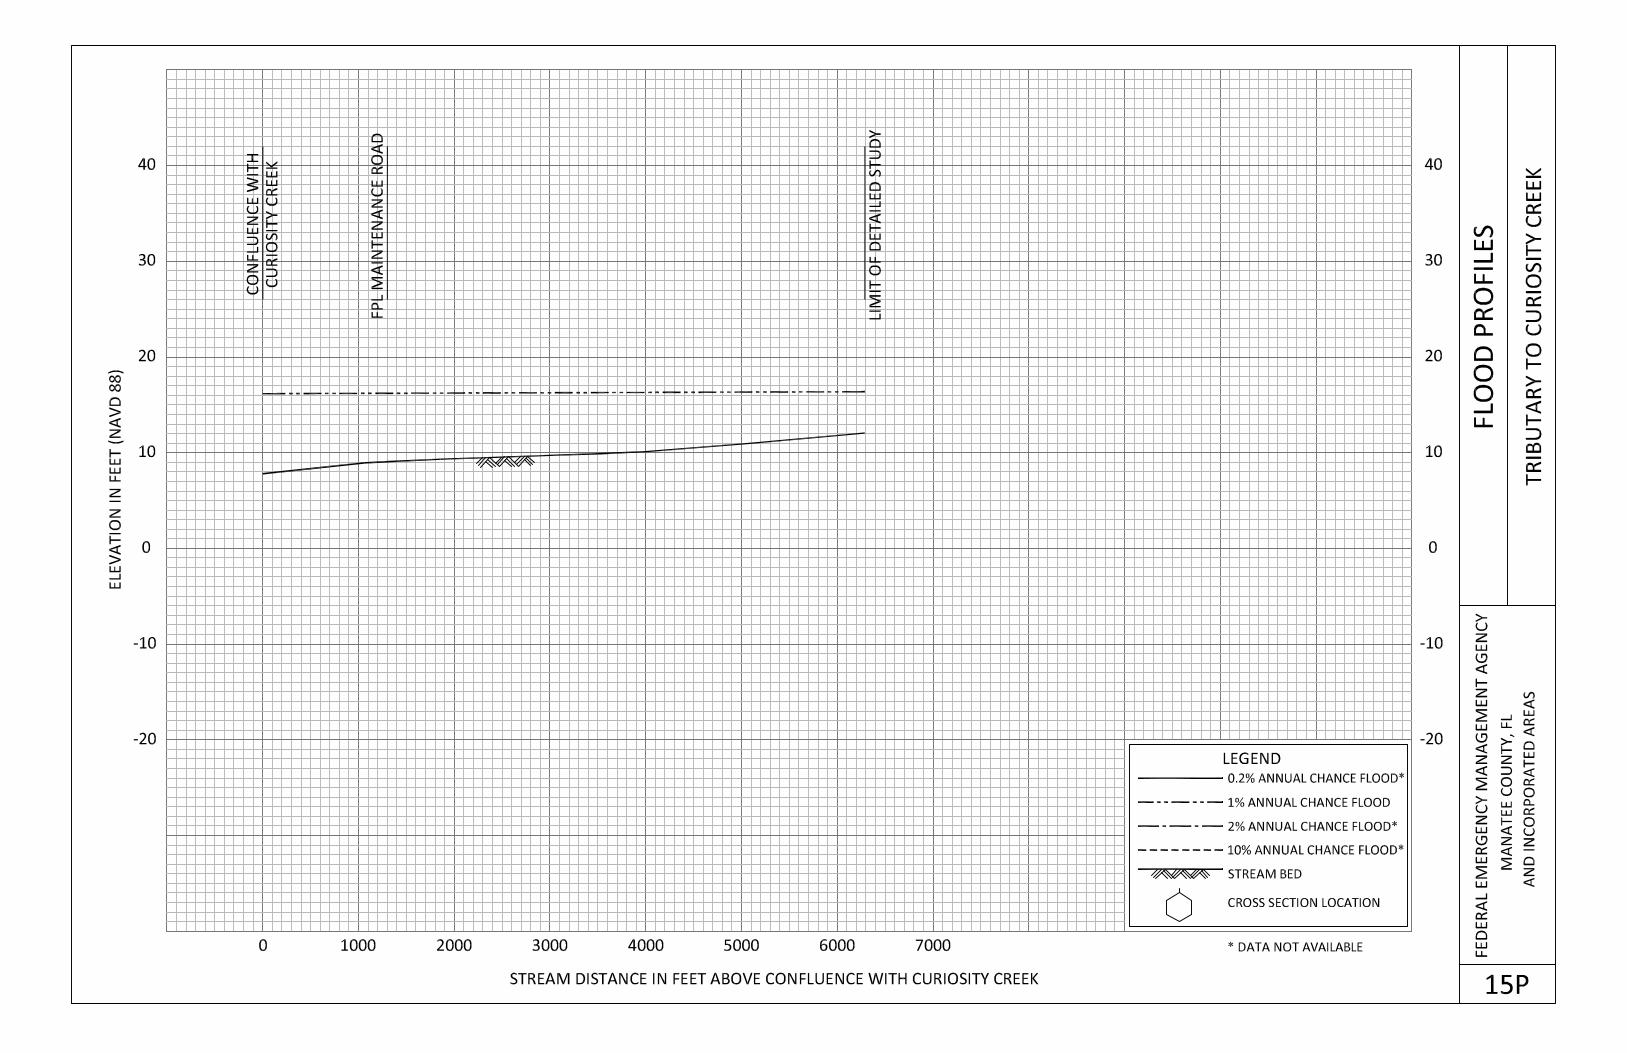
Curiosity Creek Tributary From confluence with Curiosity Creek to
approximately 6280 feet upstream of confluence
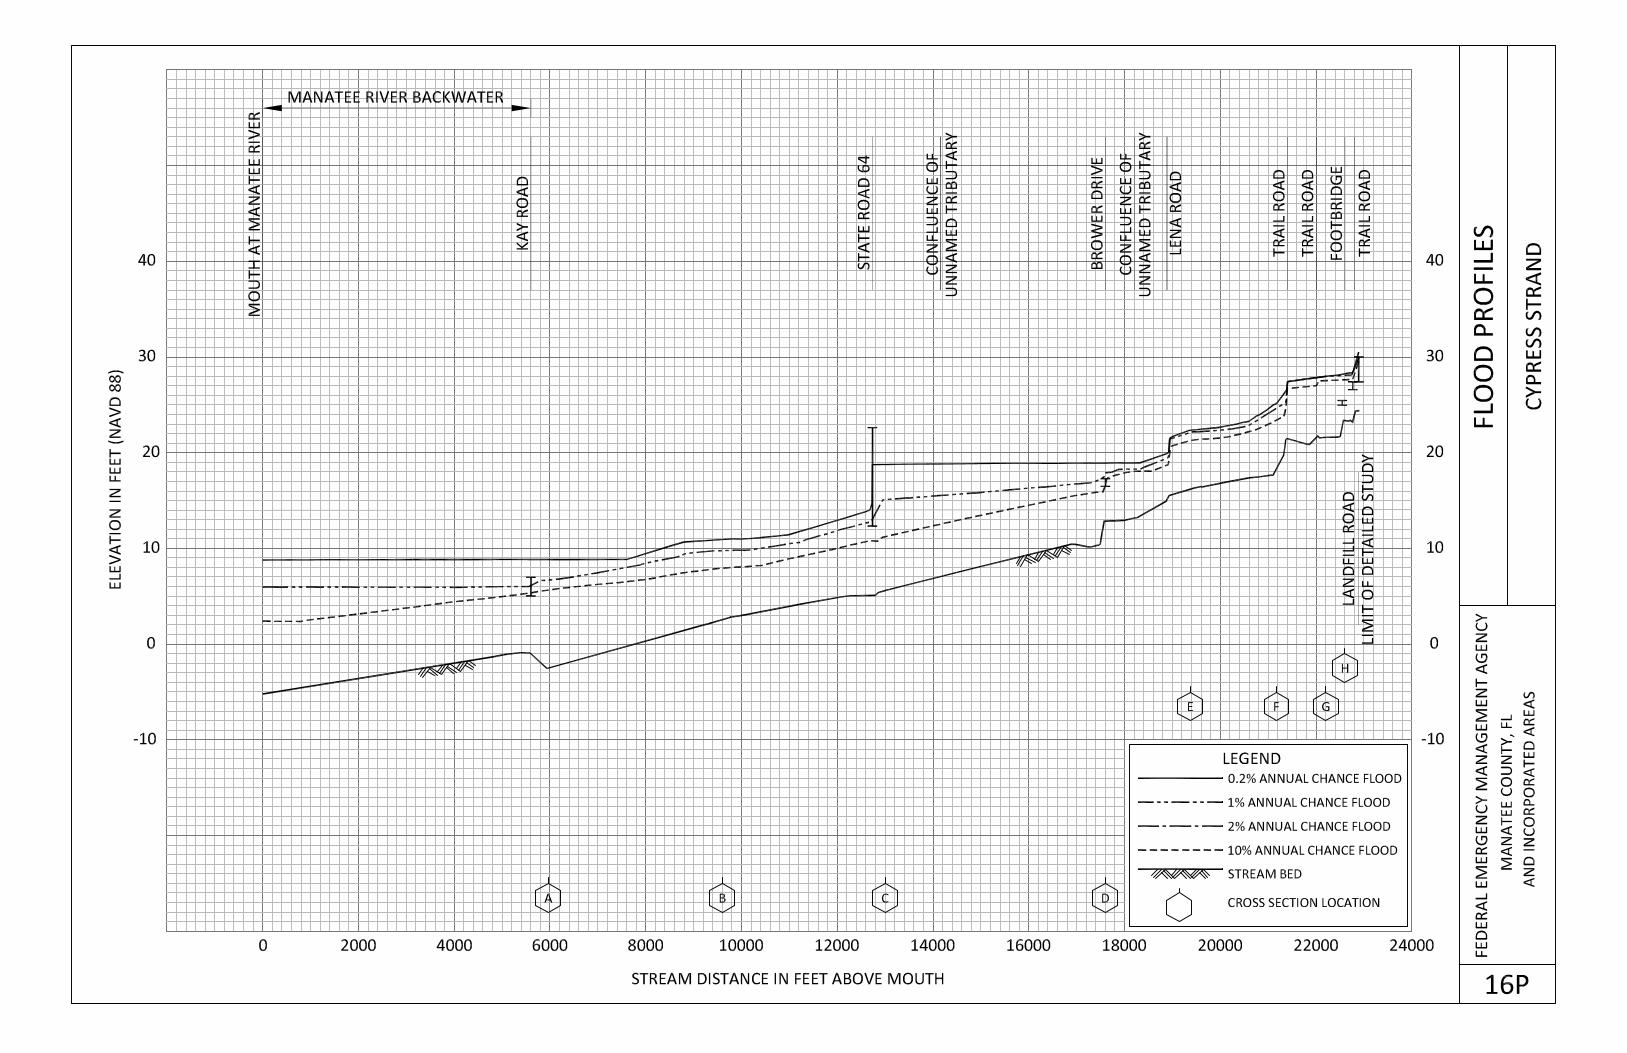
Cypress Strand From mouth at Manatee River to
East Ditch From confluence with Manatee River to the
headwaters
6
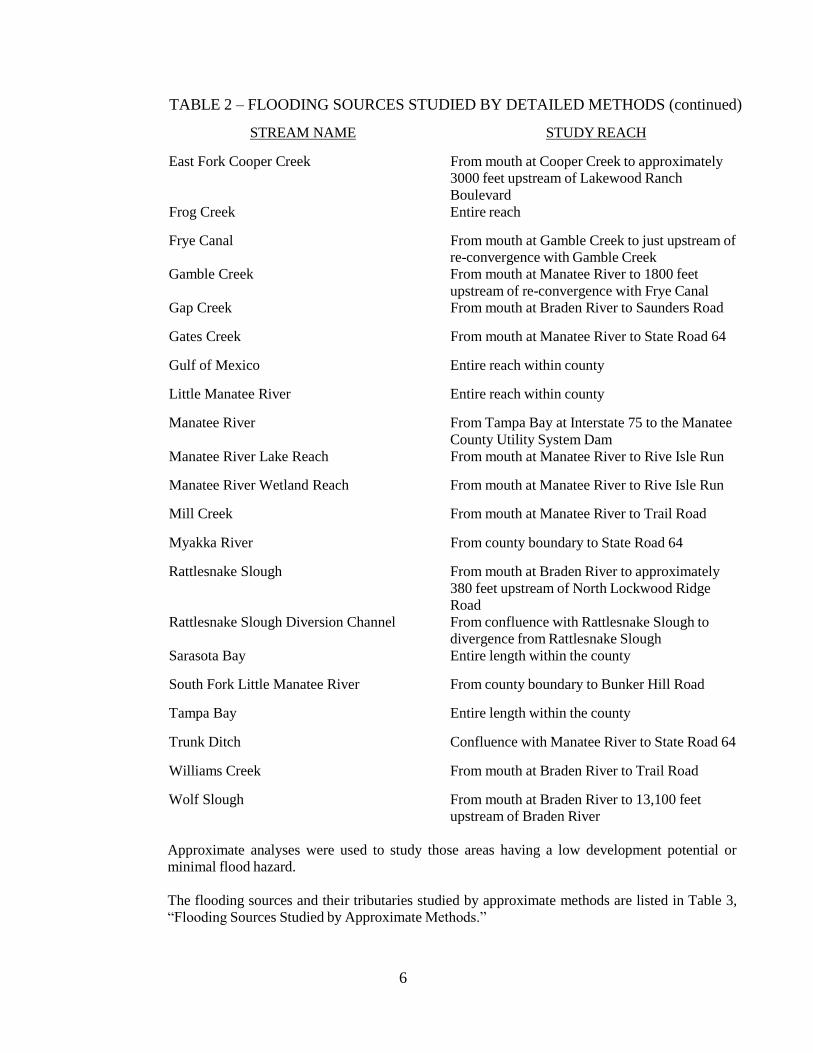
TABLE 2 – FLOODING SOURCES STUDIED BY DETAILED METHODS (continued)
STREAM NAME STUDY REACH
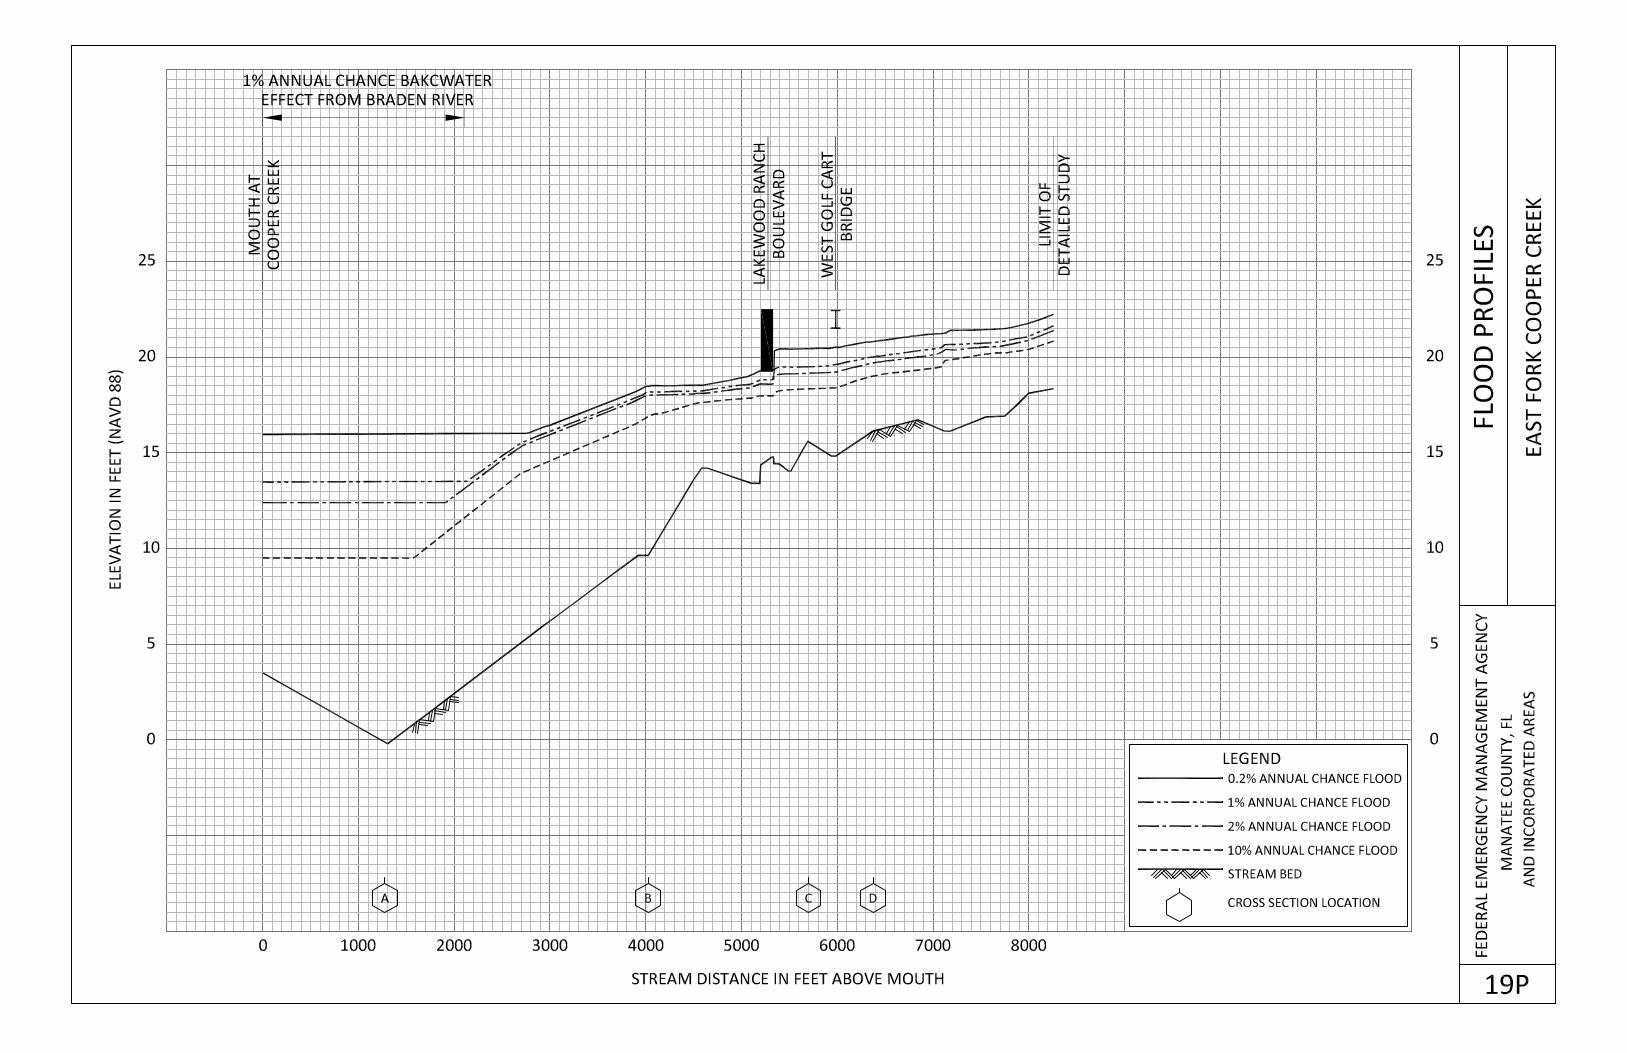
East Fork Cooper Creek From mouth at Cooper Creek to approximately
3000 feet upstream of Lakewood Ranch
Boulevard
Frog Creek Entire reach
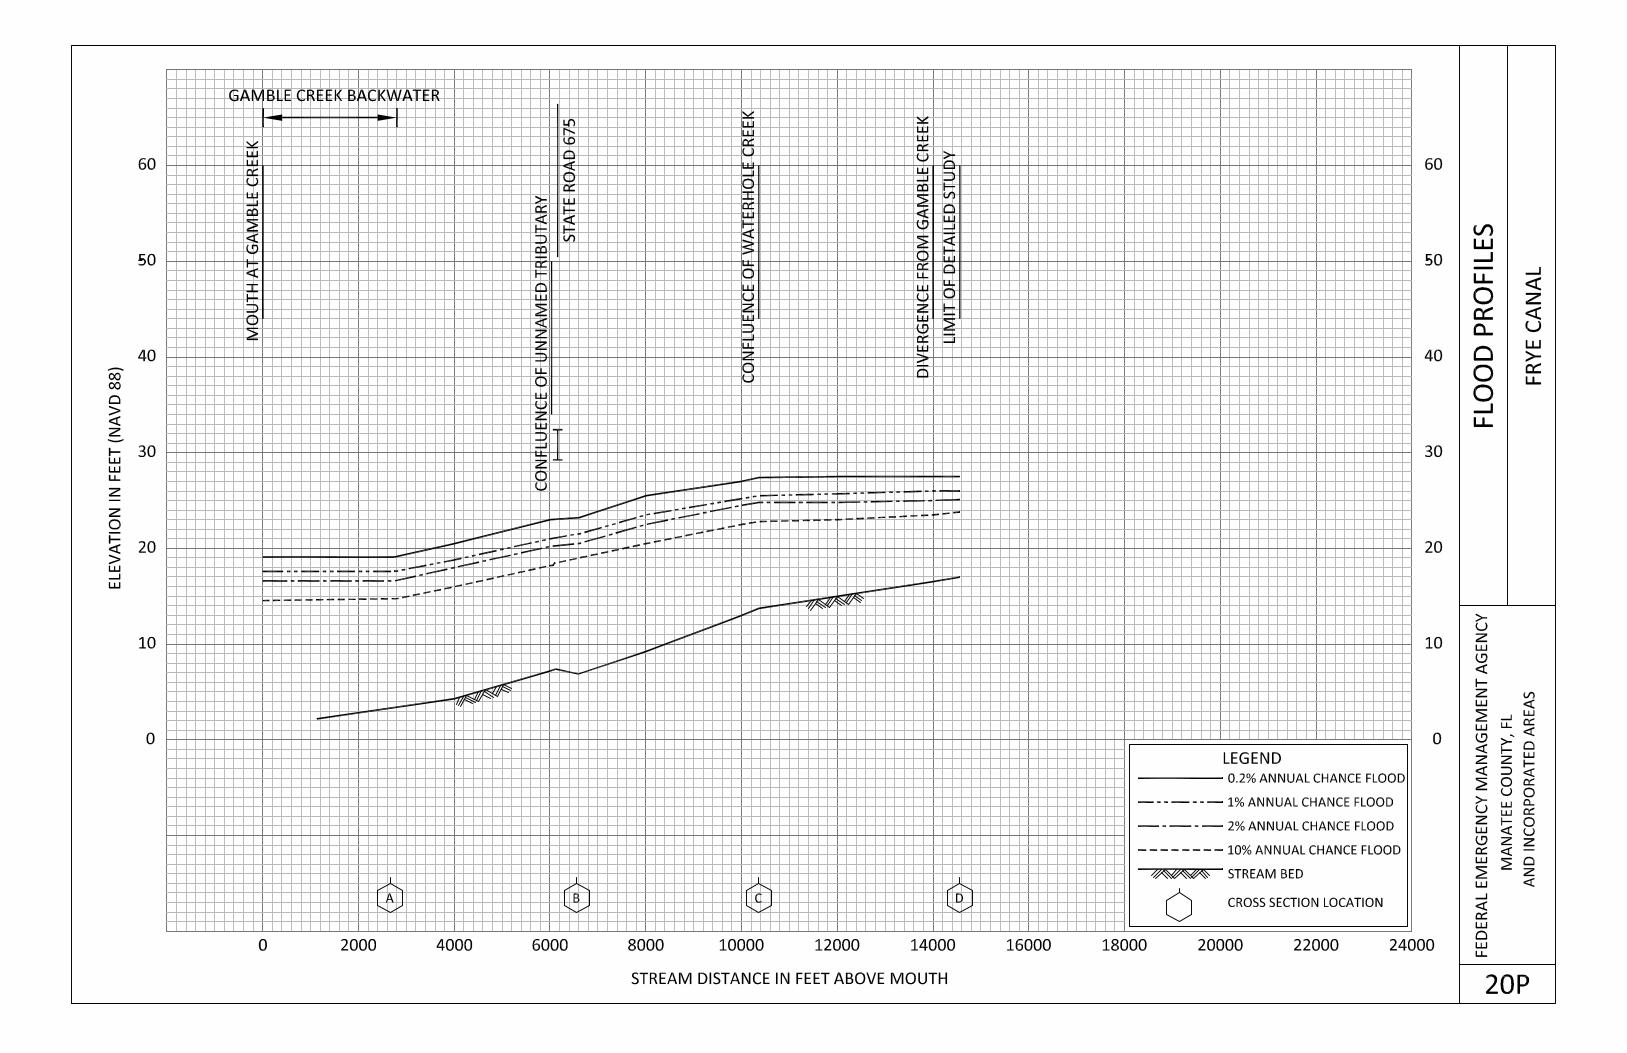
Frye Canal From mouth at Gamble Creek to just upstream of
re-convergence with Gamble Creek
Gamble Creek From mouth at Manatee River to 1800 feet
upstream of re-convergence with Frye Canal
Gap Creek From mouth at Braden River to Saunders Road
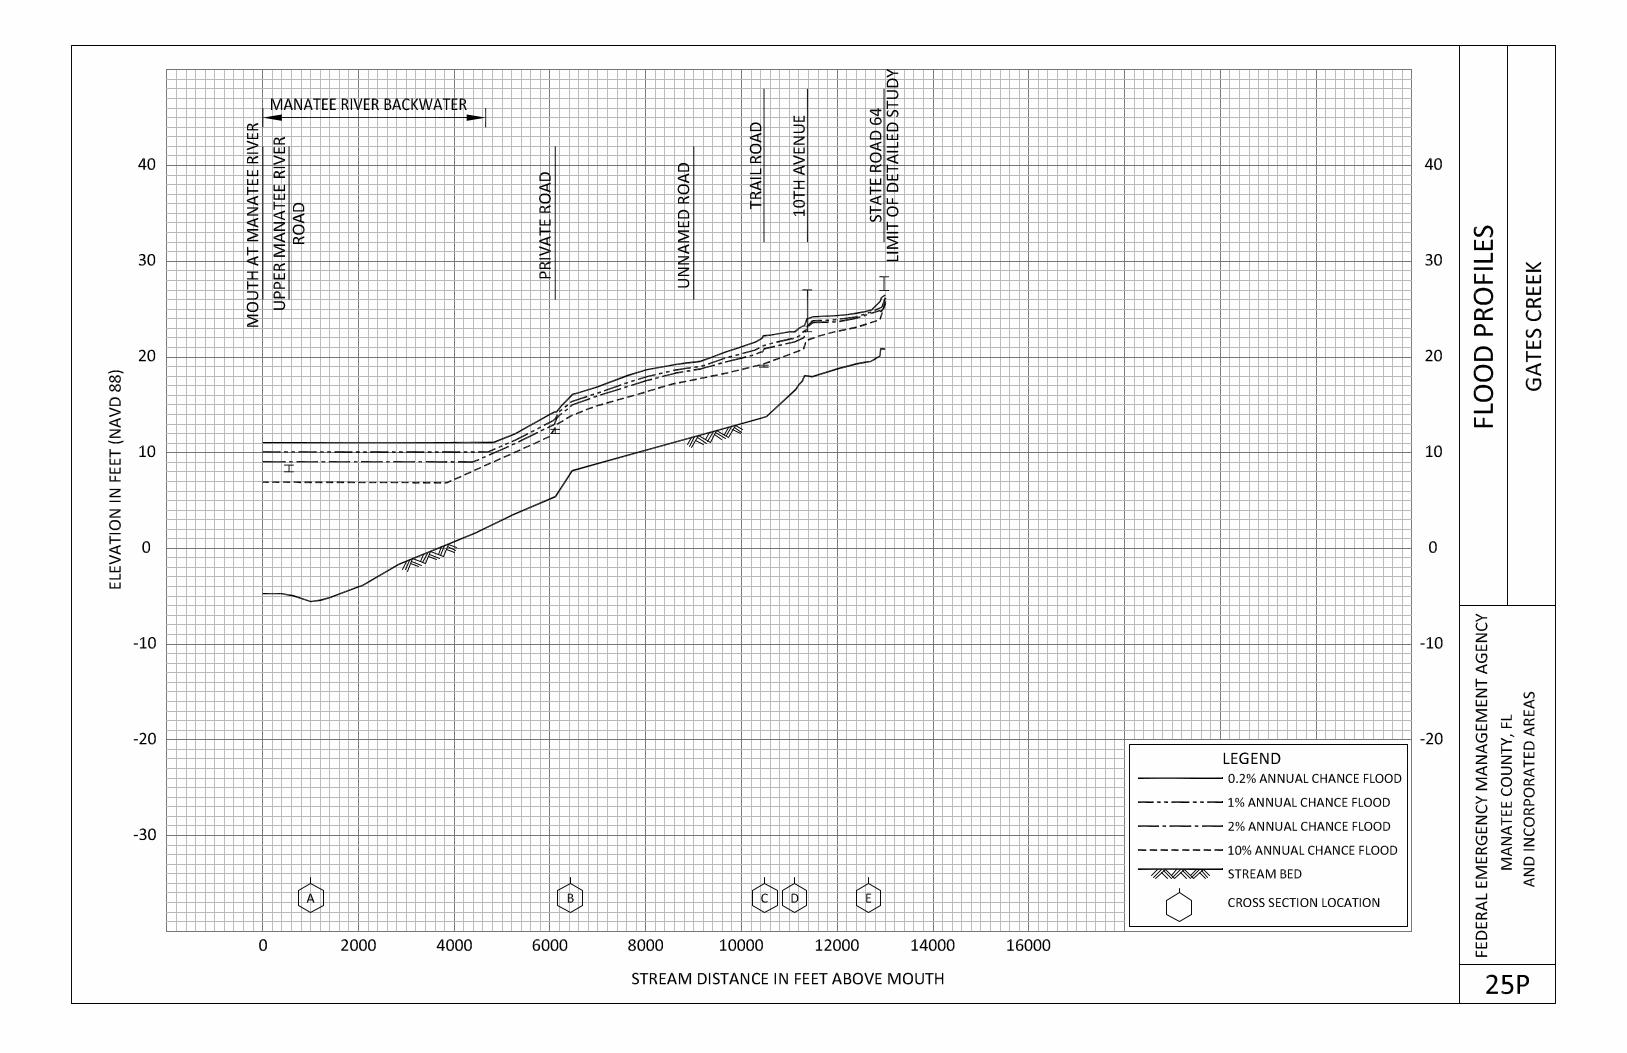
Gates Creek From mouth at Manatee River to State Road 64
Gulf of Mexico Entire reach within county
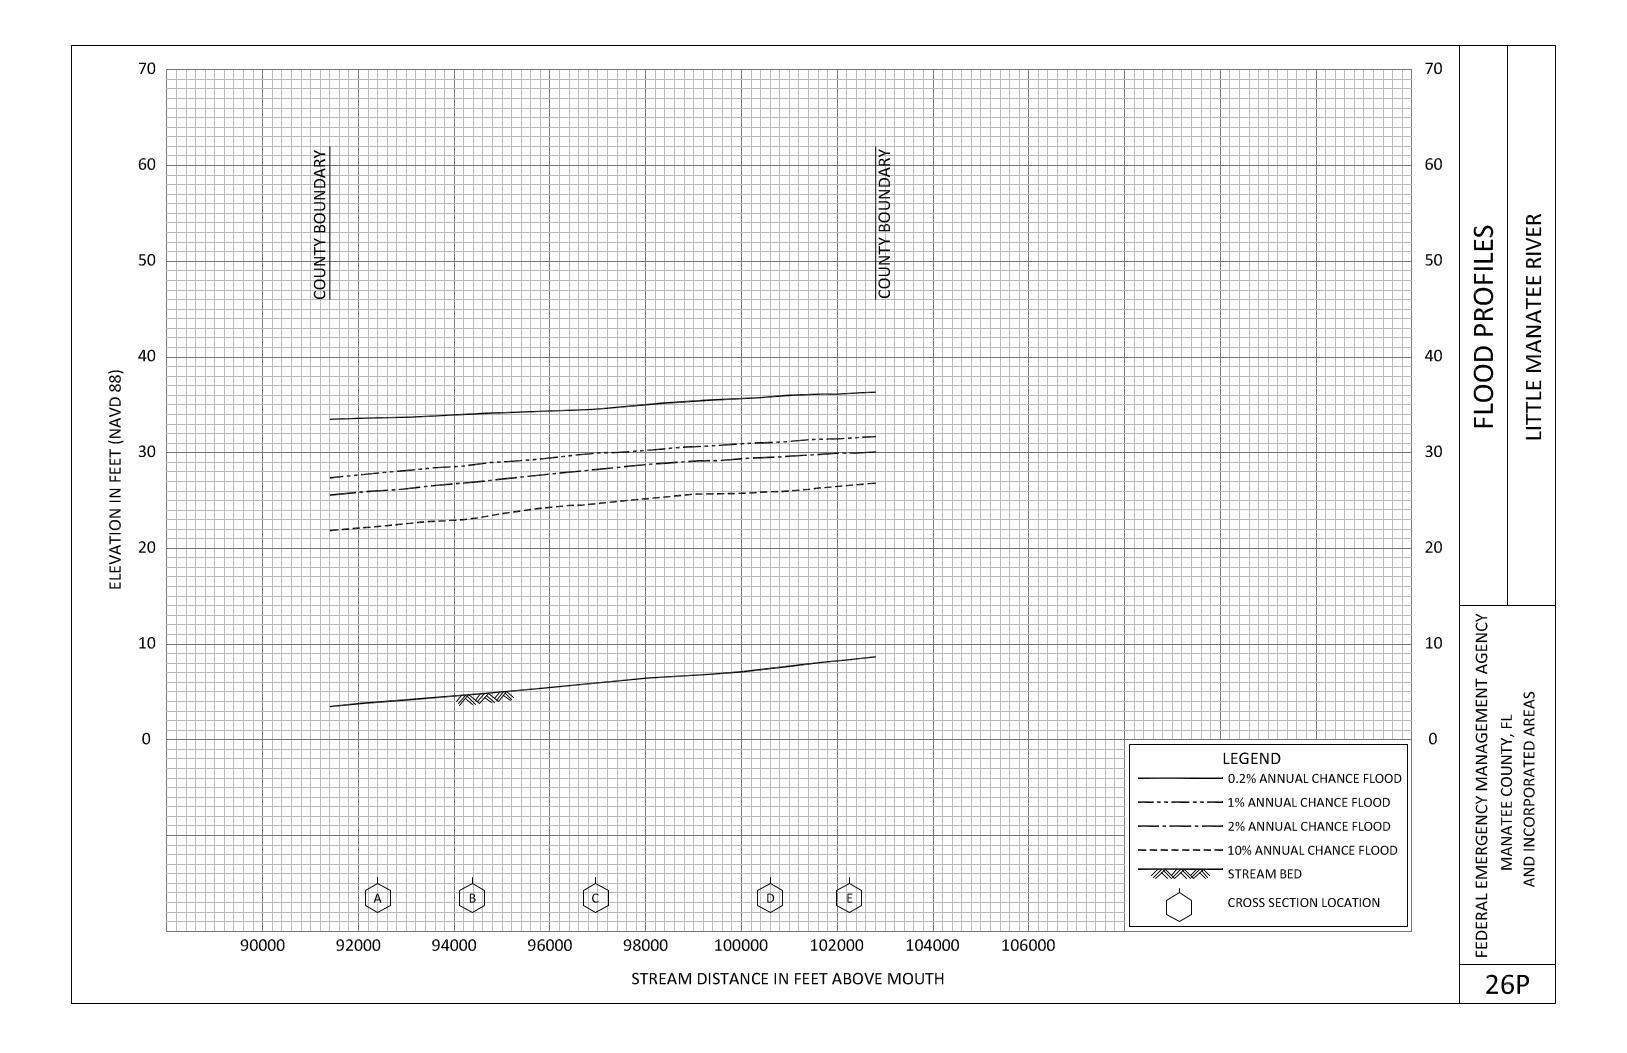
Little Manatee River Entire reach within county
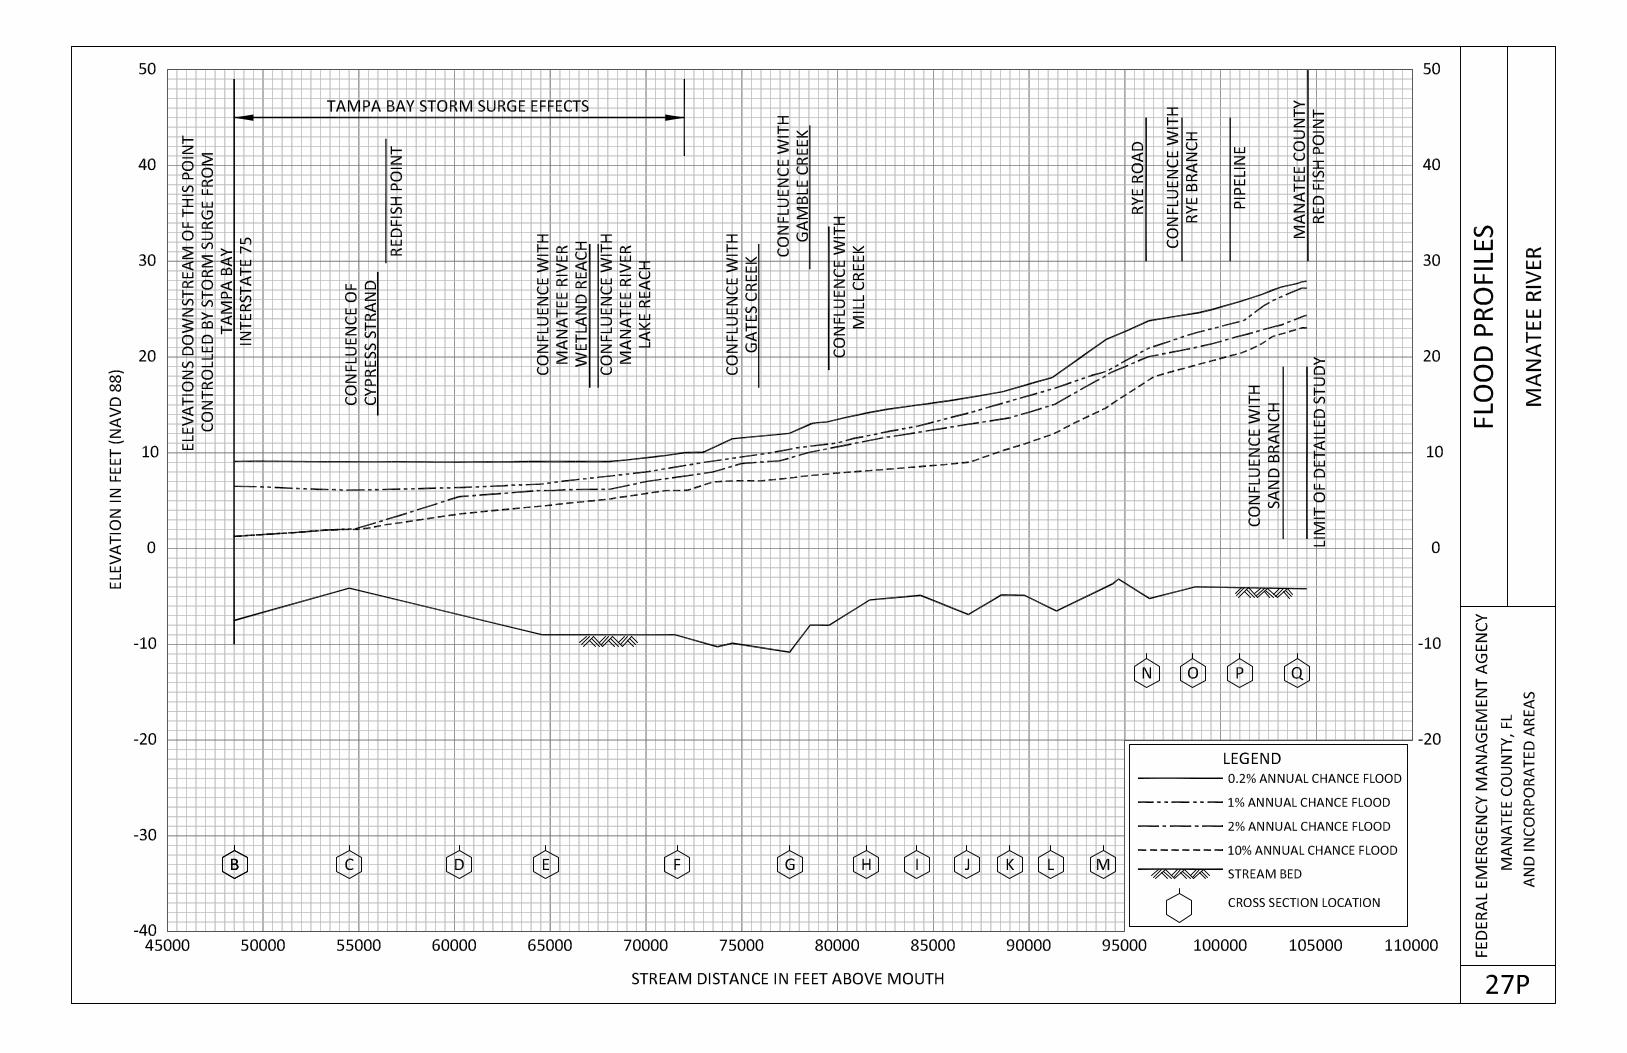
Manatee River From Tampa Bay at Interstate 75 to the Manatee
County Utility System Dam
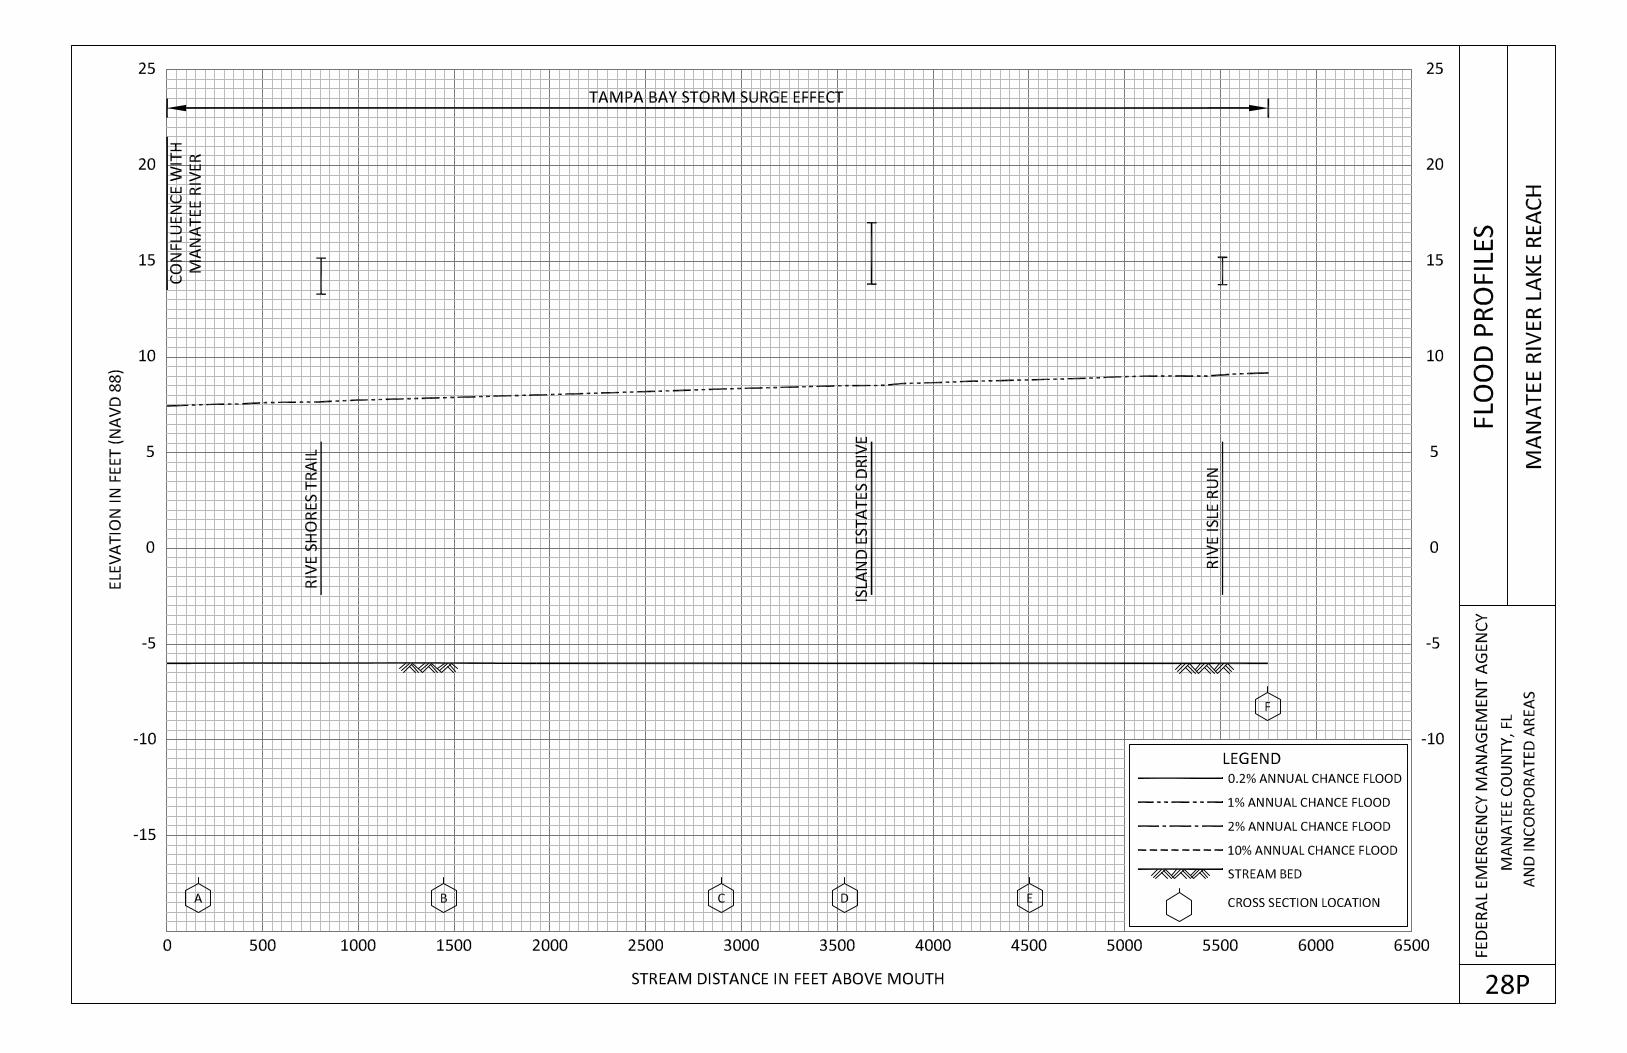
Manatee River Lake Reach From mouth at Manatee River to Rive Isle Run
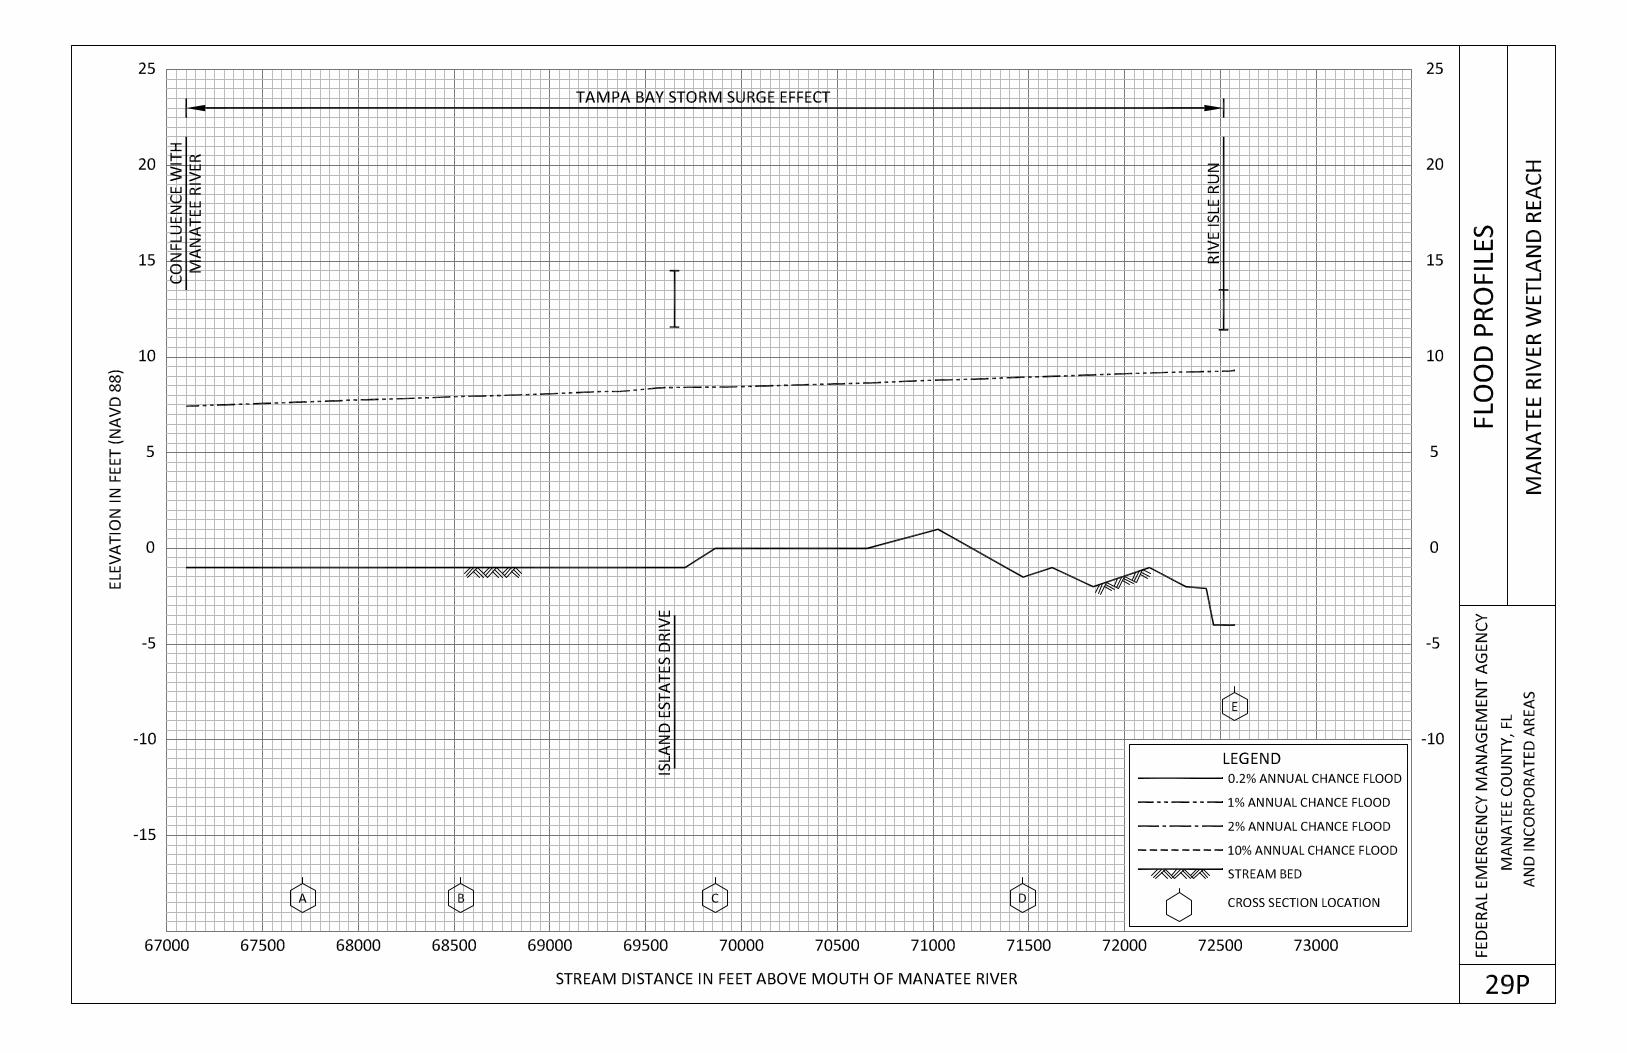
Manatee River Wetland Reach From mouth at Manatee River to Rive Isle Run
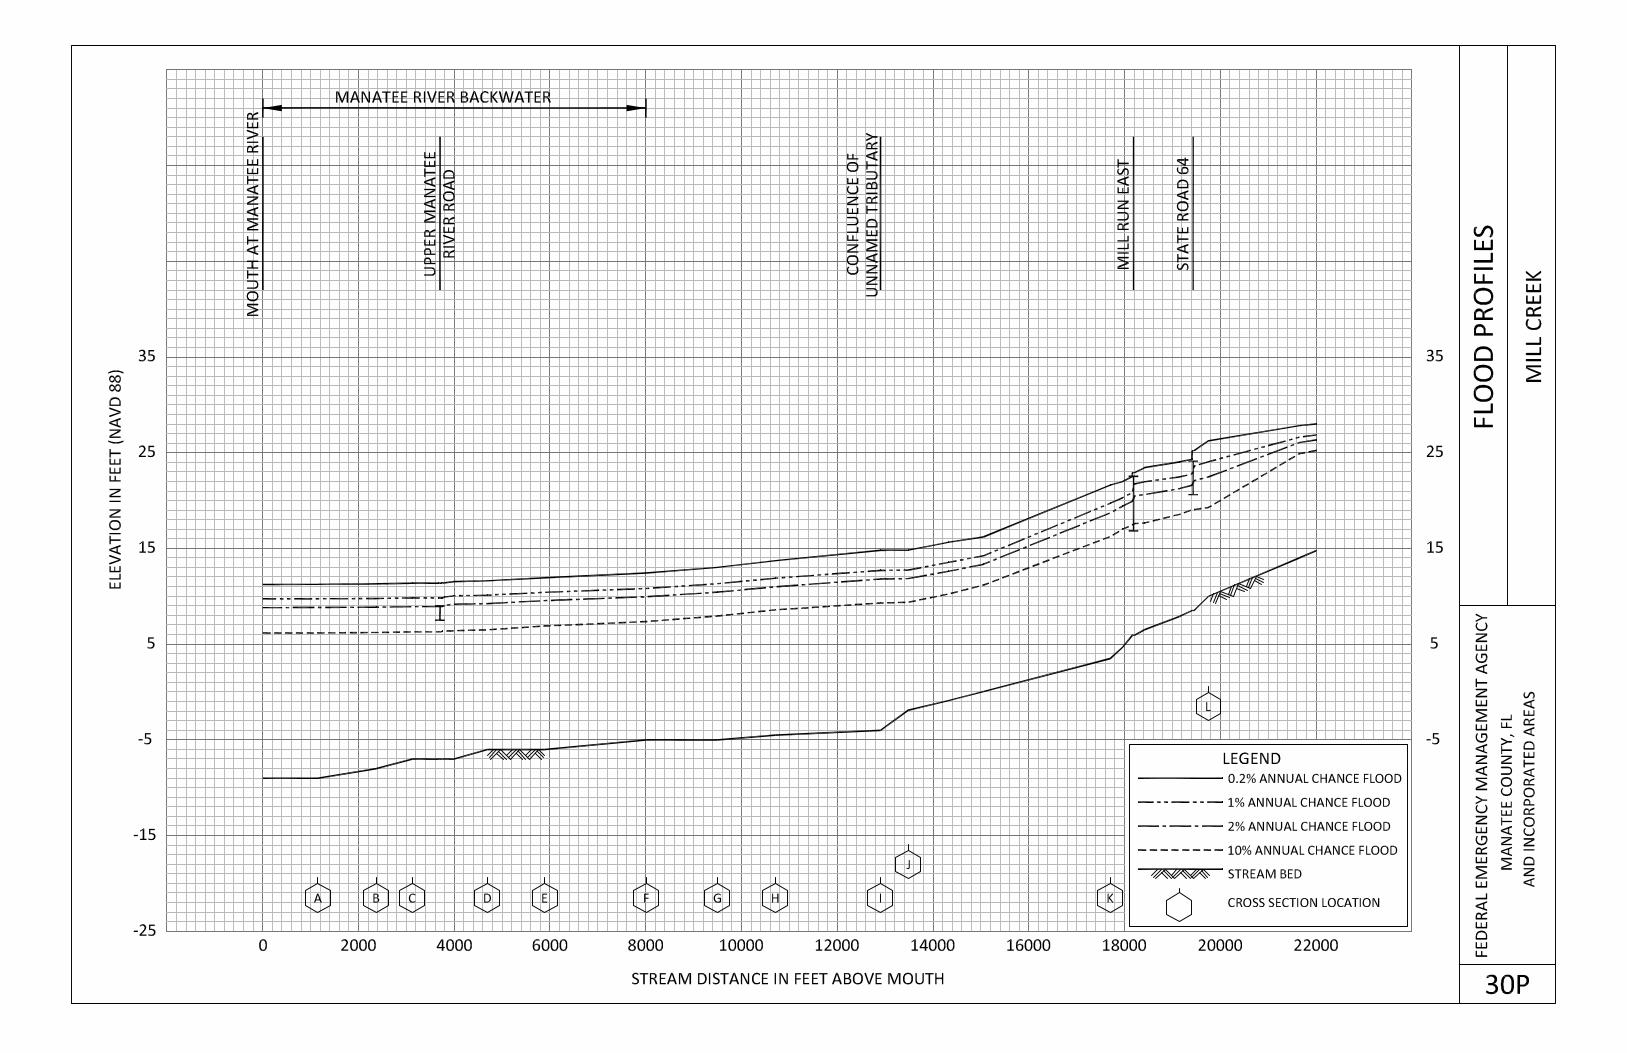
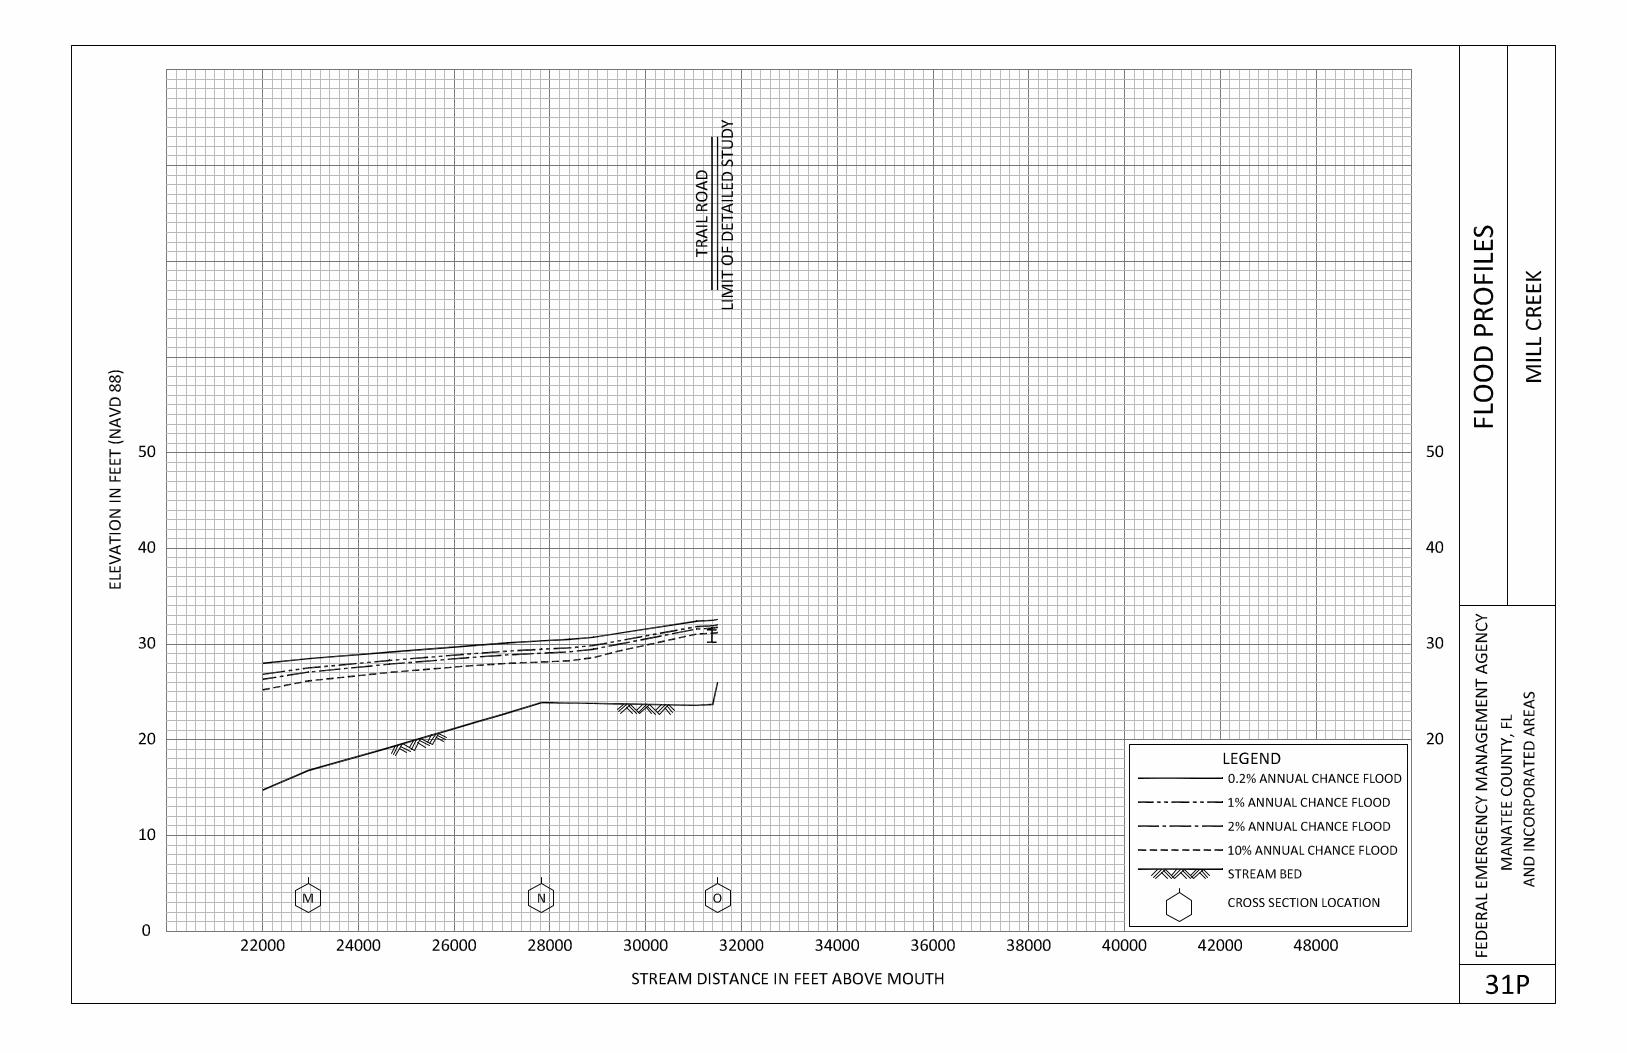
Mill Creek From mouth at Manatee River to Trail Road
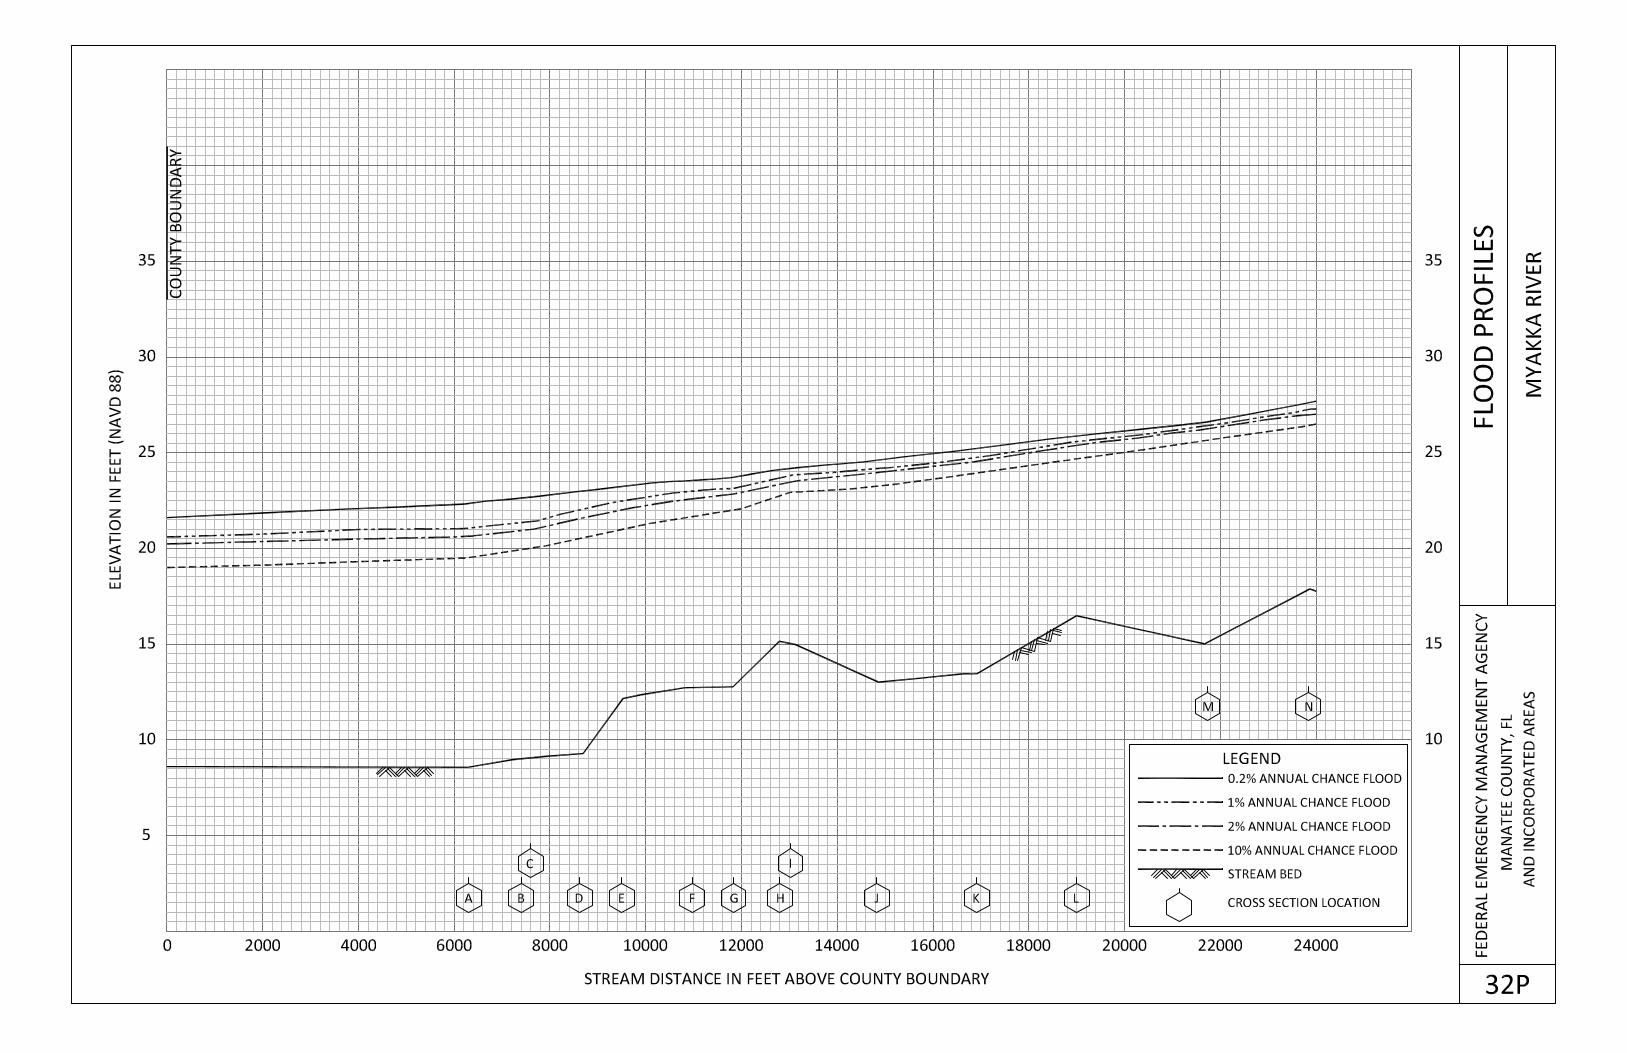
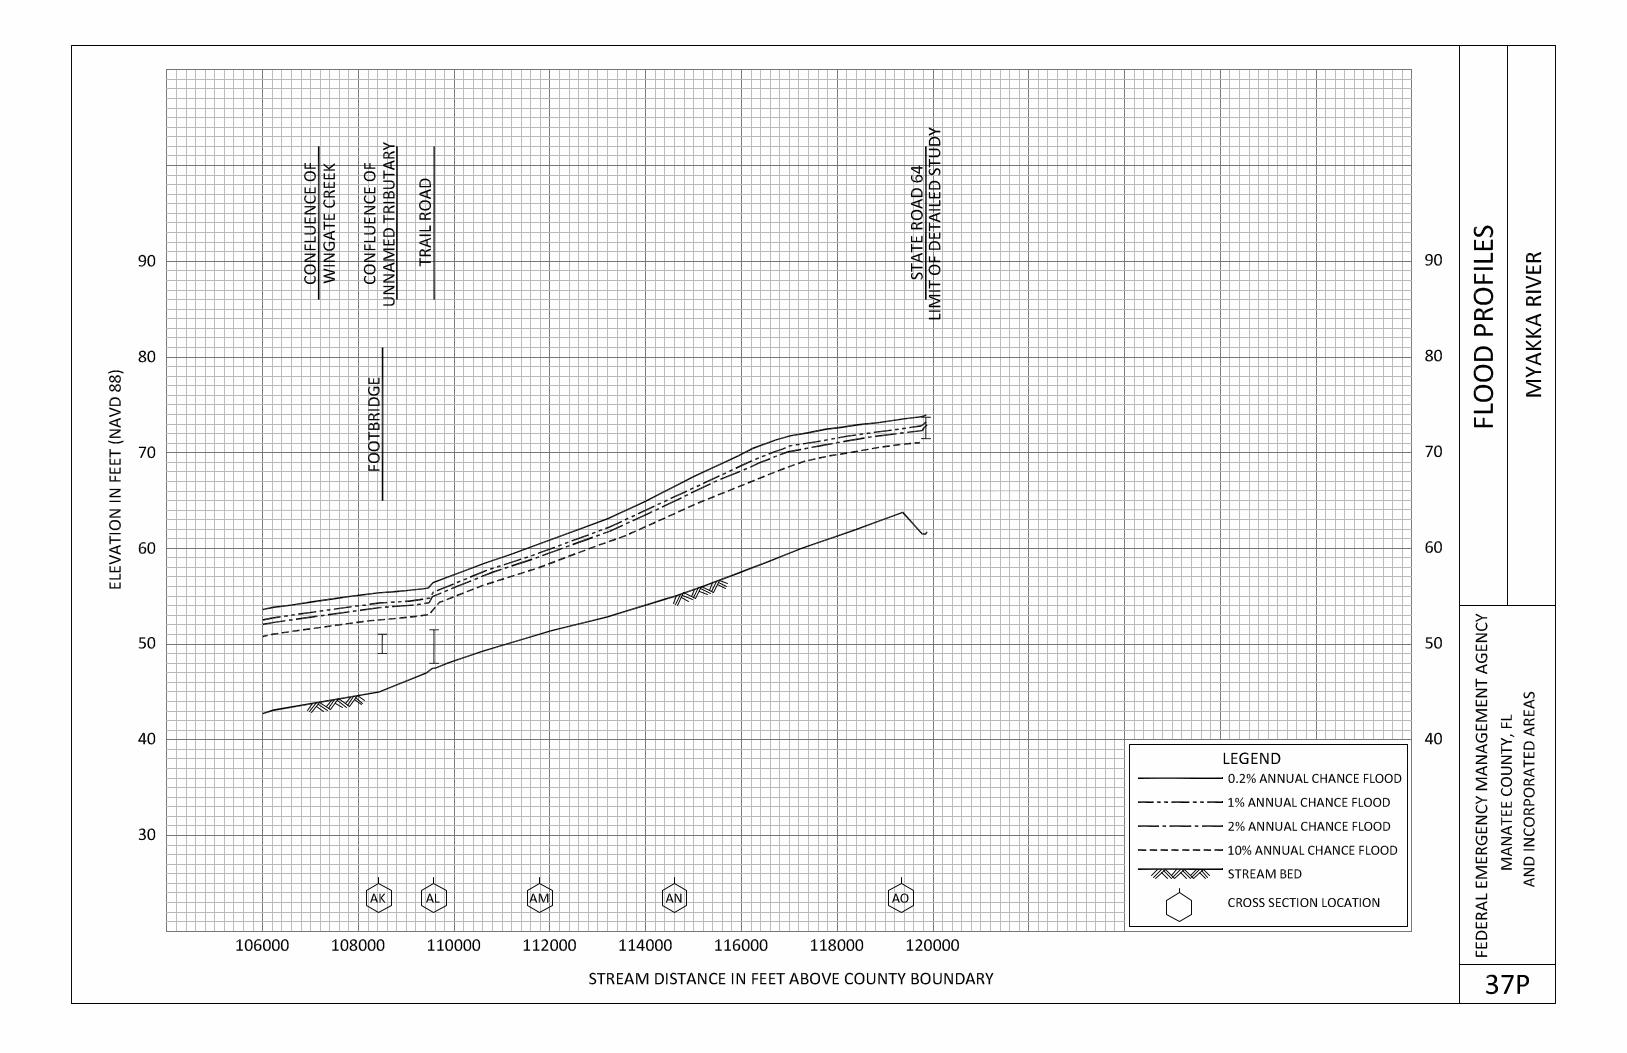
Myakka River From county boundary to State Road 64
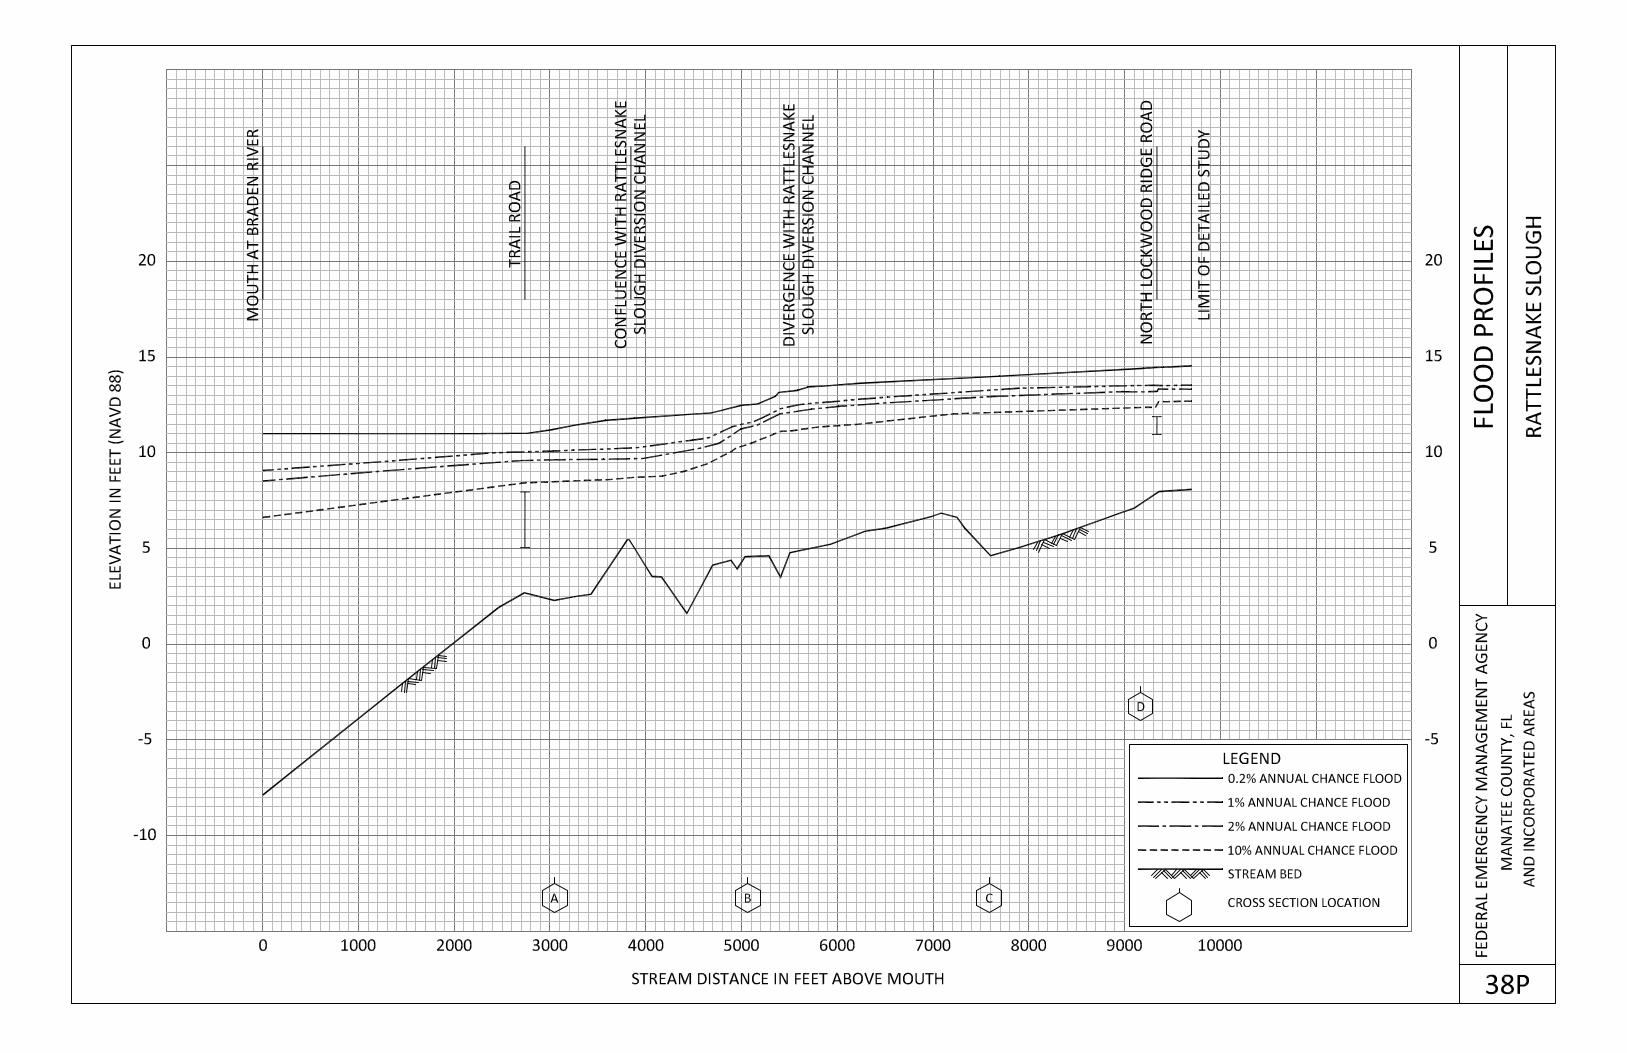
Rattlesnake Slough From mouth at Braden River to approximately
380 feet upstream of North Lockwood Ridge
Road
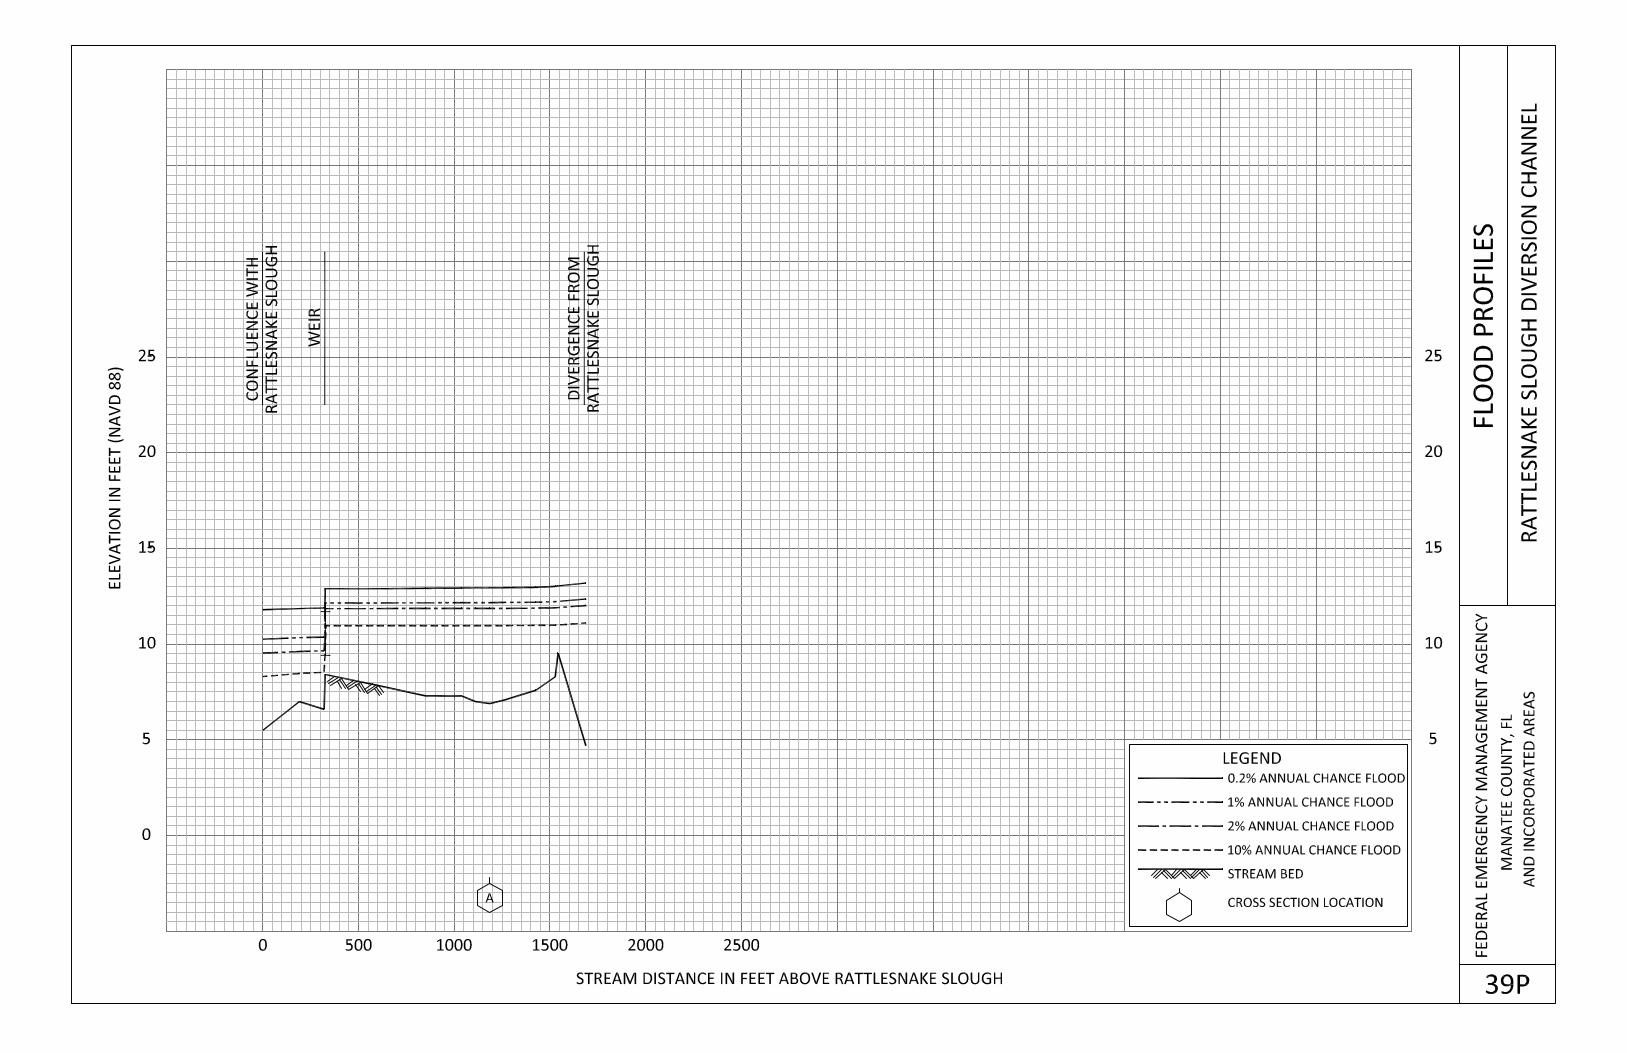
Rattlesnake Slough Diversion Channel From confluence with Rattlesnake Slough to
divergence from Rattlesnake Slough
Sarasota Bay Entire length within the county
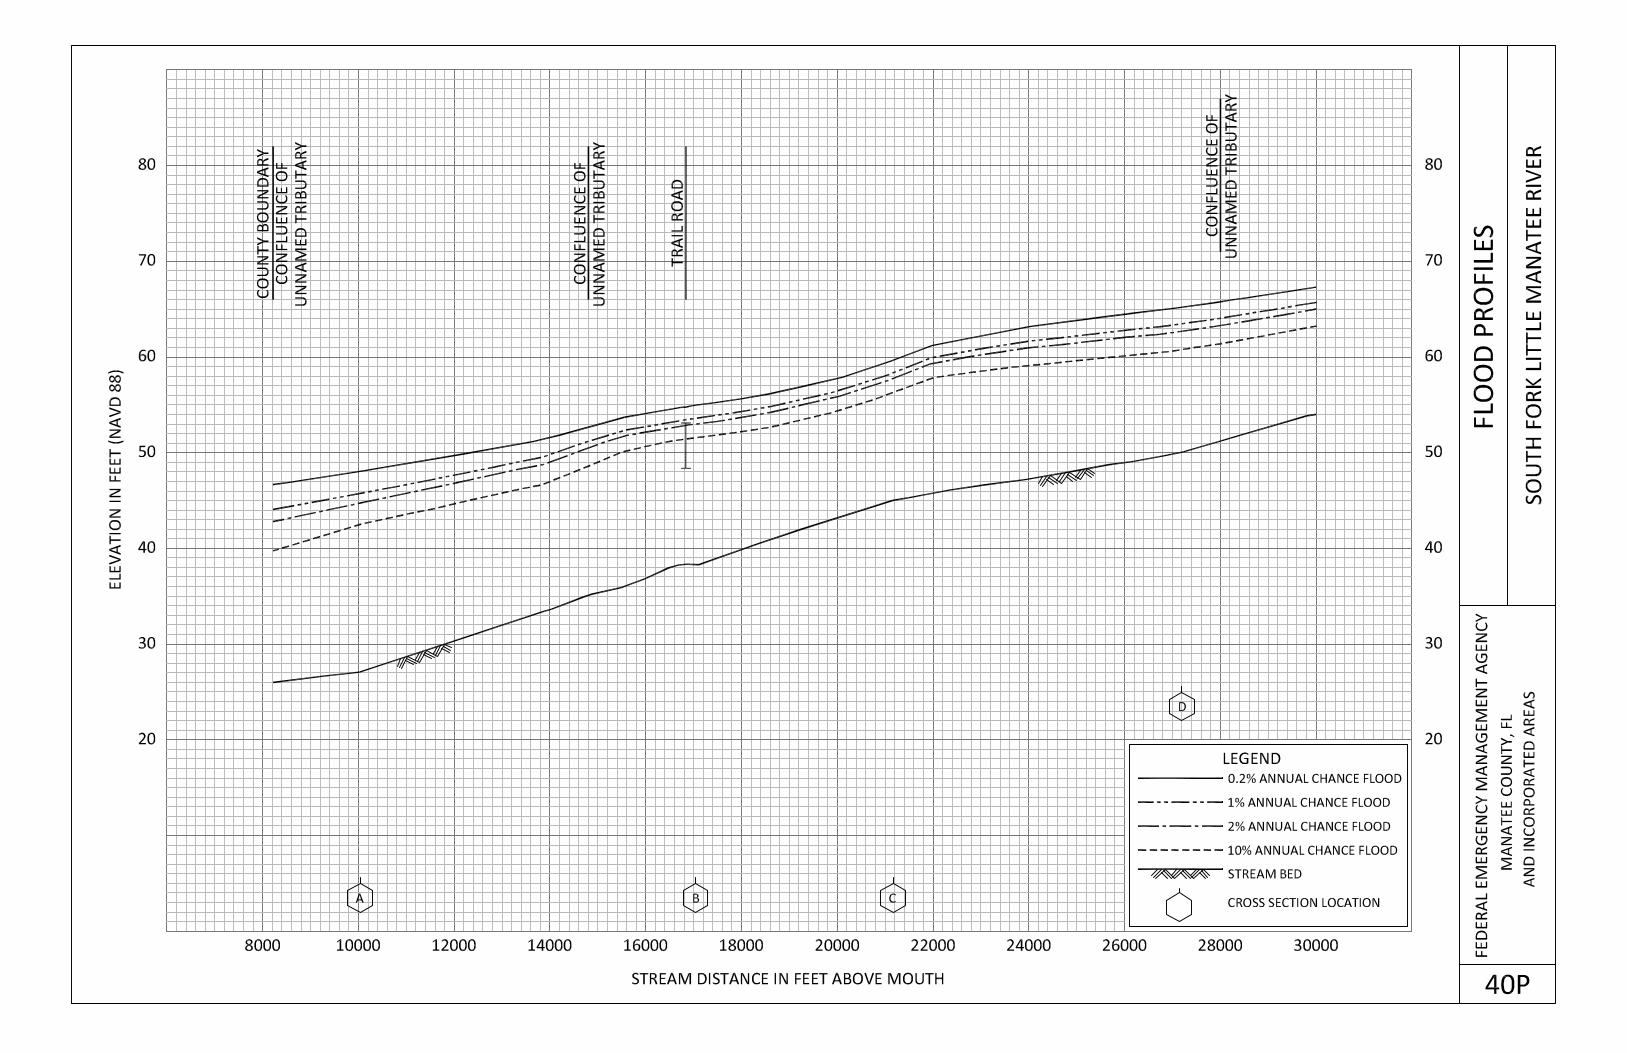
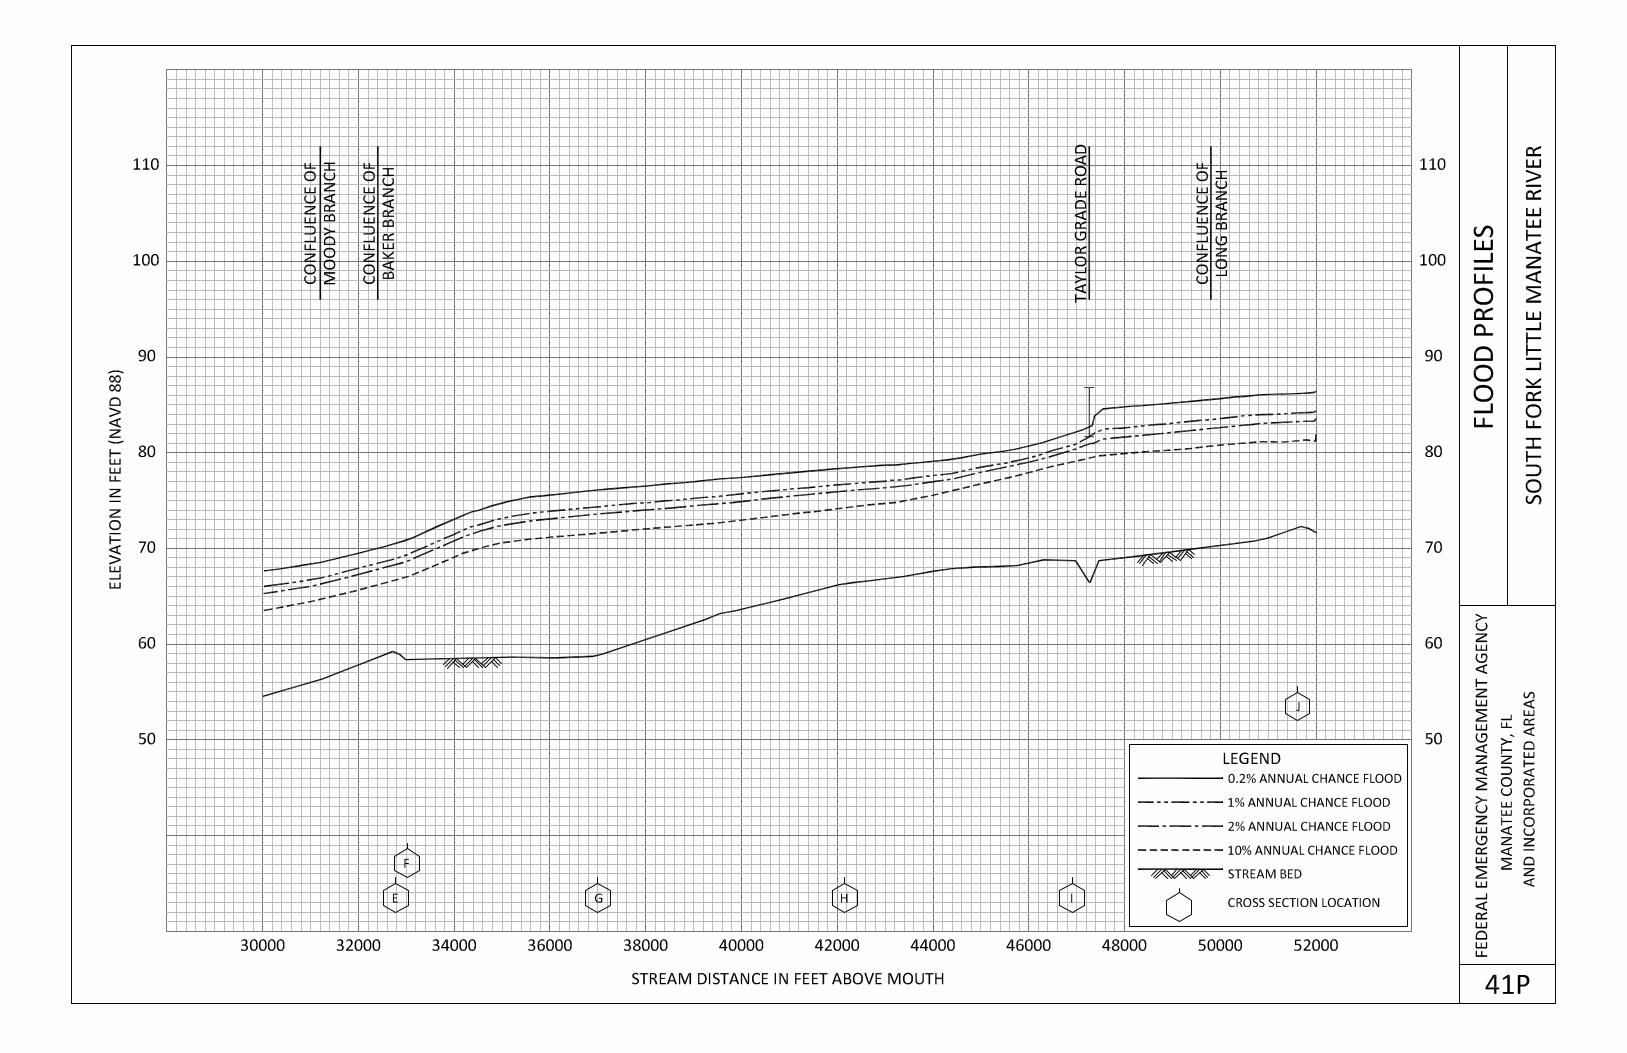
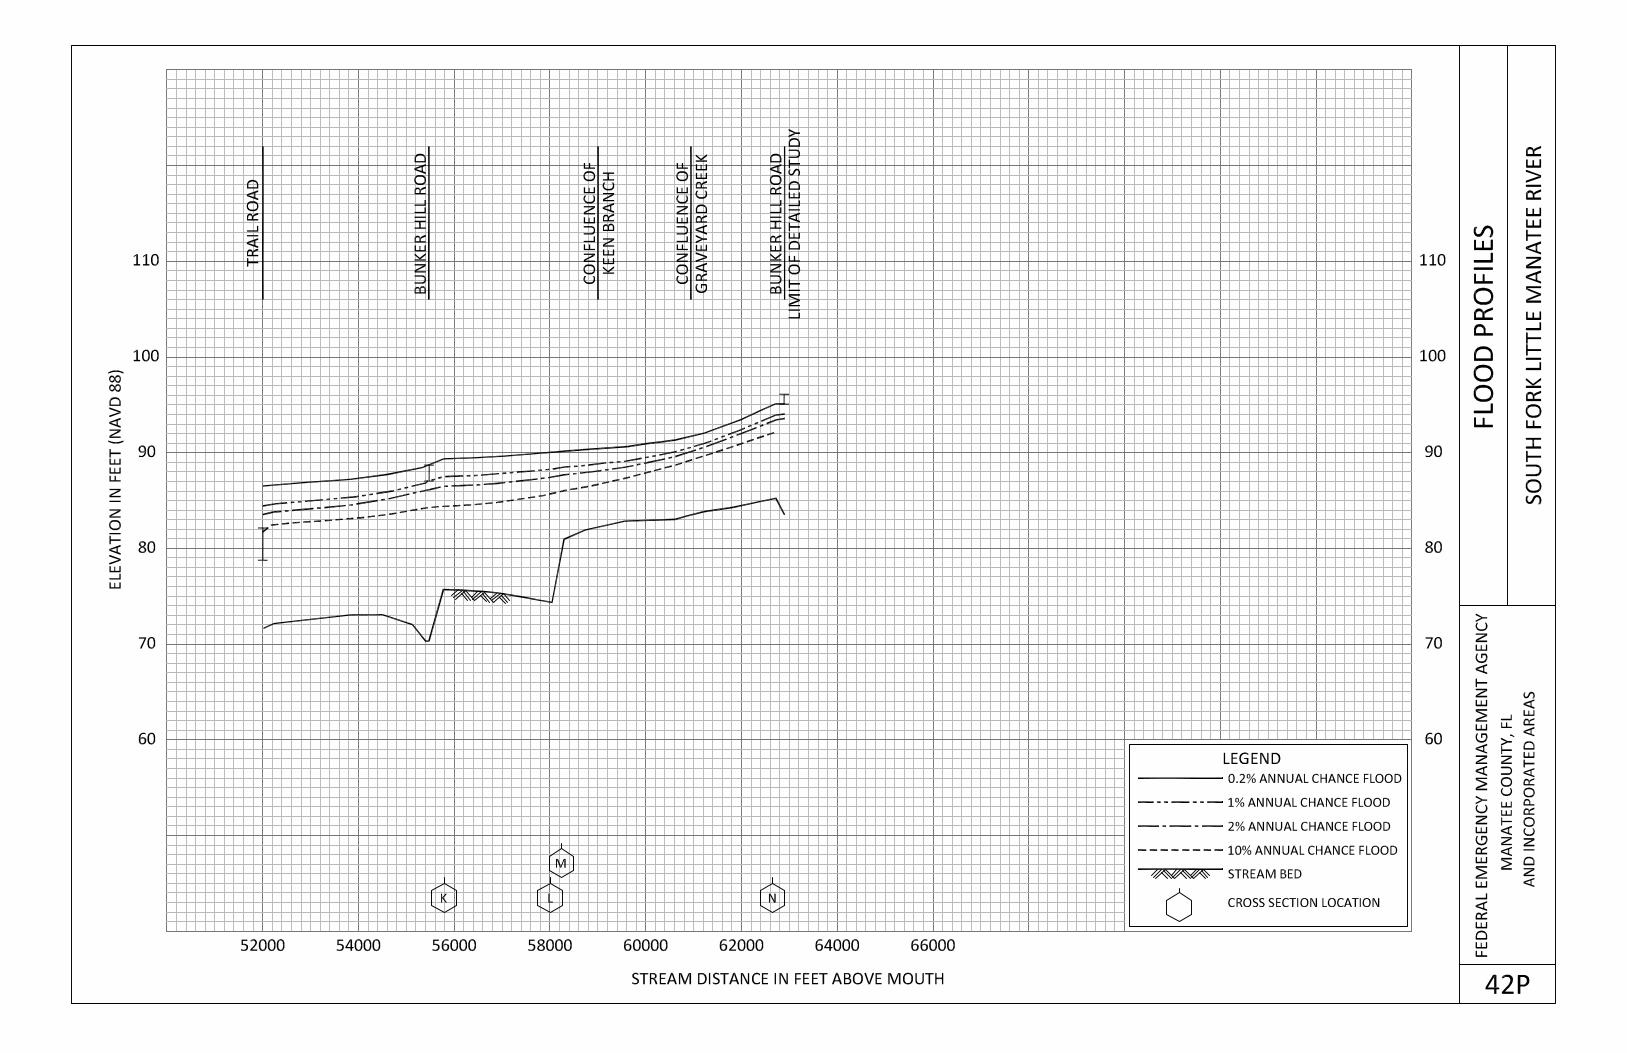
South Fork Little Manatee River From county boundary to Bunker Hill Road
Tampa Bay Entire length within the county
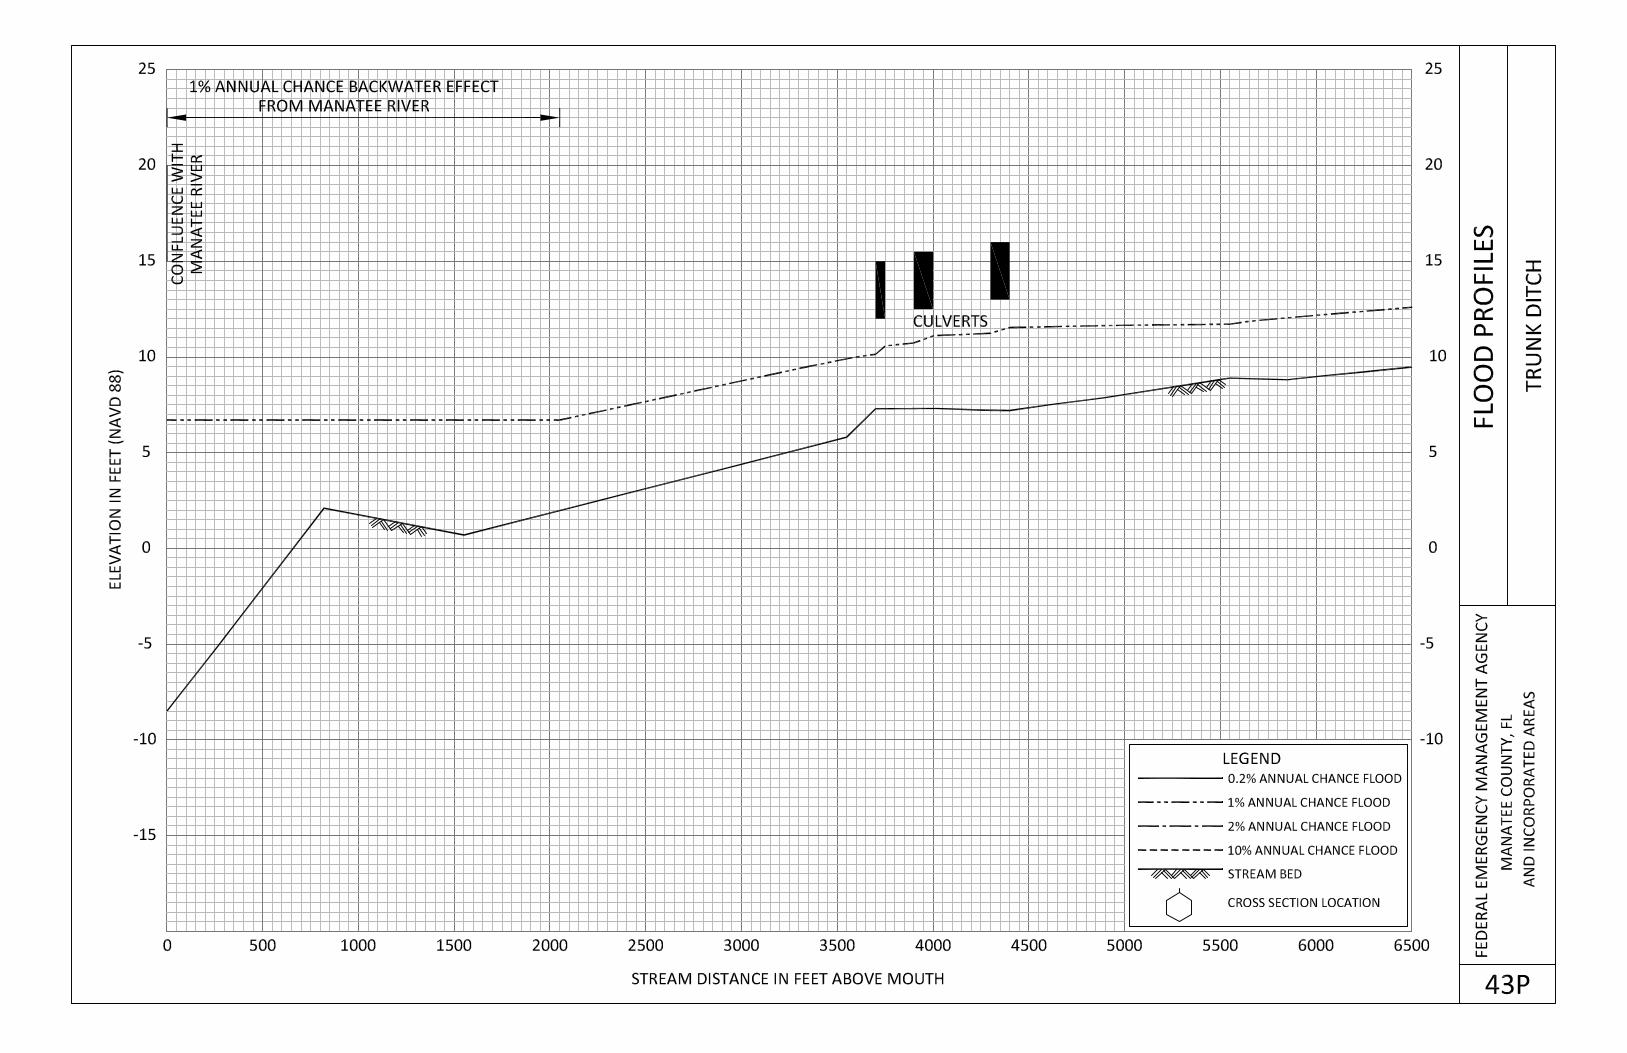
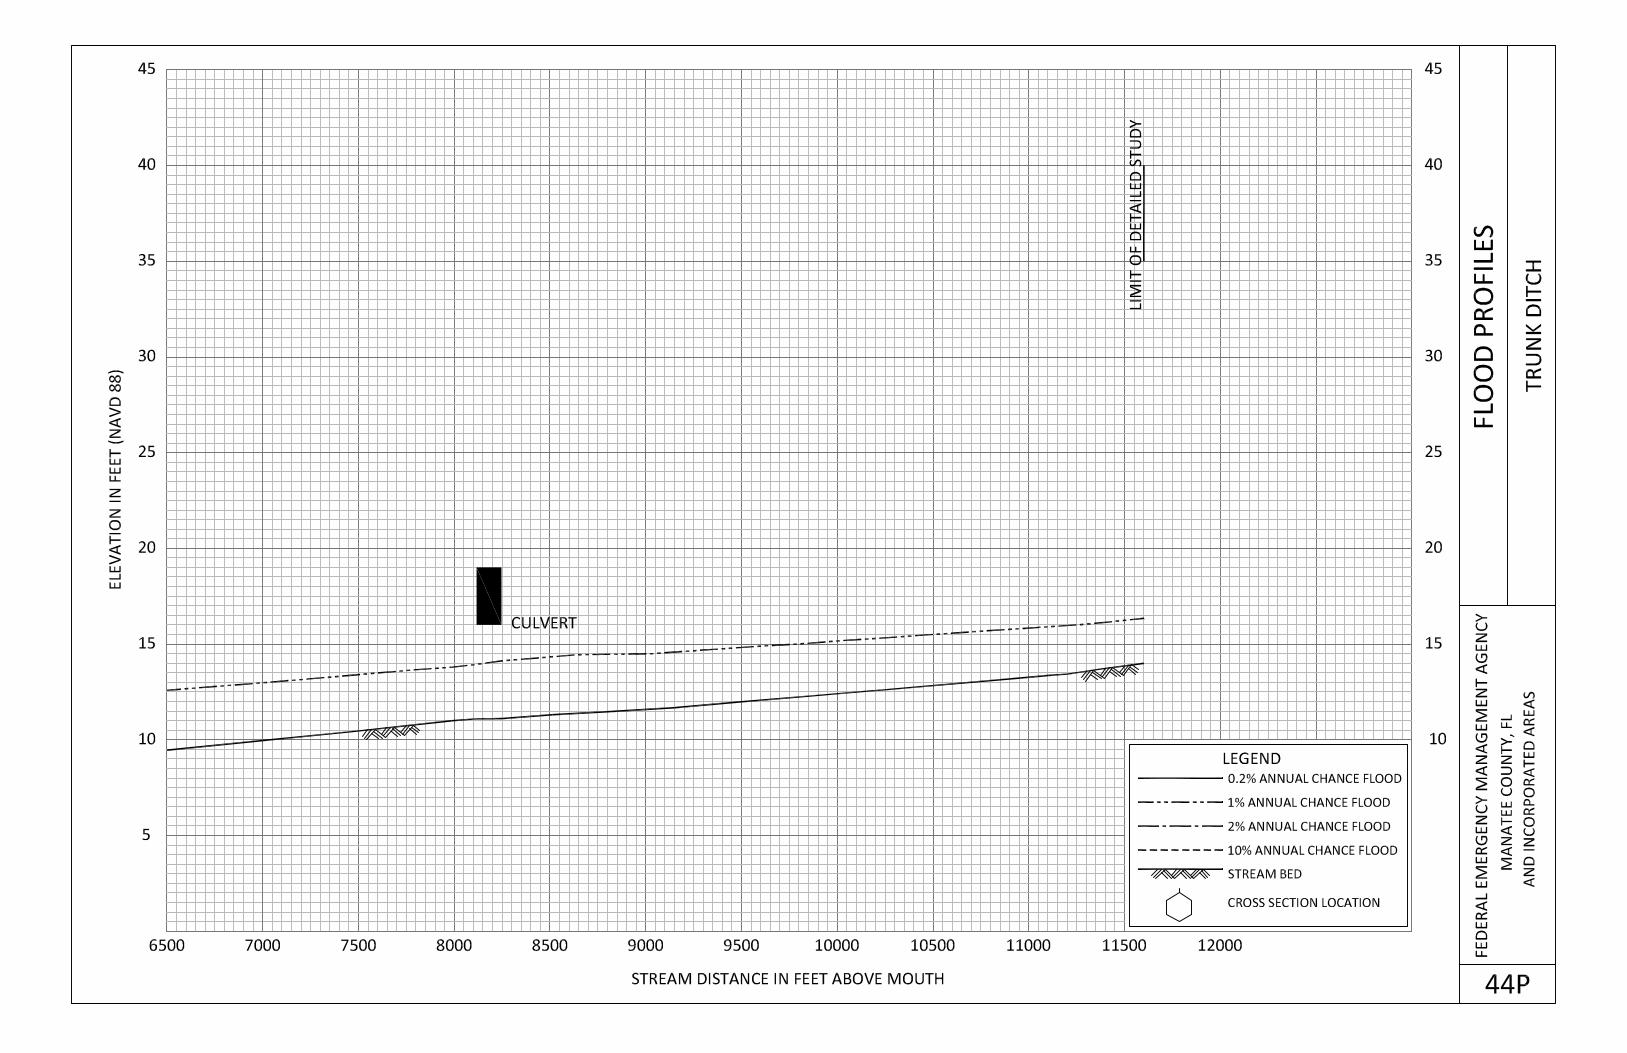
Trunk Ditch Confluence with Manatee River to State Road 64
Williams Creek From mouth at Braden River to Trail Road
Wolf Slough From mouth at Braden River to 13,100 feet
upstream of Braden River
Approximate analyses were used to study those areas having a low development potential or
minimal flood hazard.
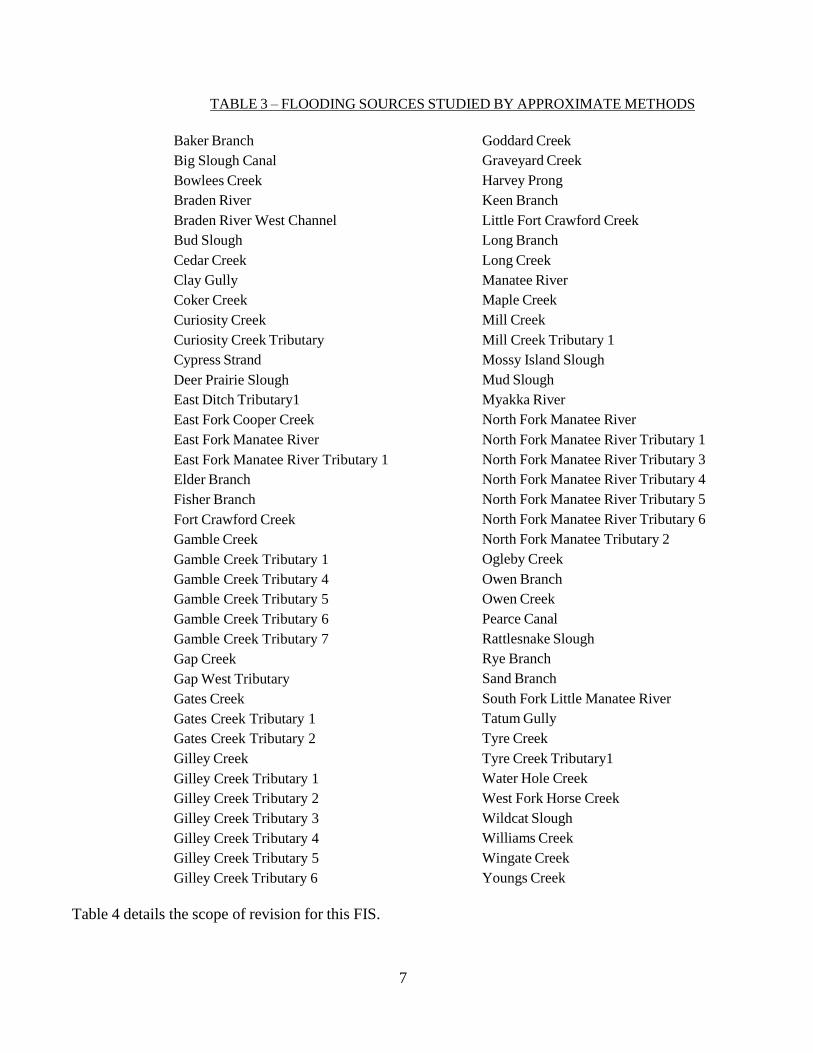
The flooding sources and their tributaries studied by approximate methods are listed in Table 3,
“Flooding Sources Studied by Approximate Methods.”
7
TABLE 3 – FLOODING SOURCES STUDIED BY APPROXIMATE METHODS
Baker Branch
Big Slough Canal
Bowlees Creek
Braden River
Braden River West Channel
Bud Slough
Cedar Creek
Clay Gully
Coker Creek
Curiosity Creek
Curiosity Creek Tributary
Cypress Strand
Deer Prairie Slough
East Ditch Tributary1
East Fork Cooper Creek
East Fork Manatee River
East Fork Manatee River Tributary 1
Elder Branch
Fisher Branch
Fort Crawford Creek
Gamble Creek
Gamble Creek Tributary 1
Gamble Creek Tributary 4
Gamble Creek Tributary 5
Gamble Creek Tributary 6
Gamble Creek Tributary 7
Gap Creek
Gap West Tributary
Gates Creek
Gates Creek Tributary 1
Gates Creek Tributary 2
Gilley Creek
Gilley Creek Tributary 1
Gilley Creek Tributary 2
Gilley Creek Tributary 3
Gilley Creek Tributary 4
Gilley Creek Tributary 5
Gilley Creek Tributary 6
Goddard Creek
Graveyard Creek
Harvey Prong
Keen Branch
Little Fort Crawford Creek
Long Branch
Long Creek
Manatee River
Maple Creek
Mill Creek
Mill Creek Tributary 1
Mossy Island Slough
Mud Slough
Myakka River
North Fork Manatee River
North Fork Manatee River Tributary 1
North Fork Manatee River Tributary 3
North Fork Manatee River Tributary 4
North Fork Manatee River Tributary 5
North Fork Manatee River Tributary 6
North Fork Manatee Tributary 2
Ogleby Creek
Owen Branch
Owen Creek
Pearce Canal
Rattlesnake Slough
Rye Branch
Sand Branch
South Fork Little Manatee River
Tatum Gully
Tyre Creek
Tyre Creek Tributary1
Water Hole Creek
West Fork Horse Creek
Wildcat Slough
Williams Creek
Wingate Creek
Youngs Creek
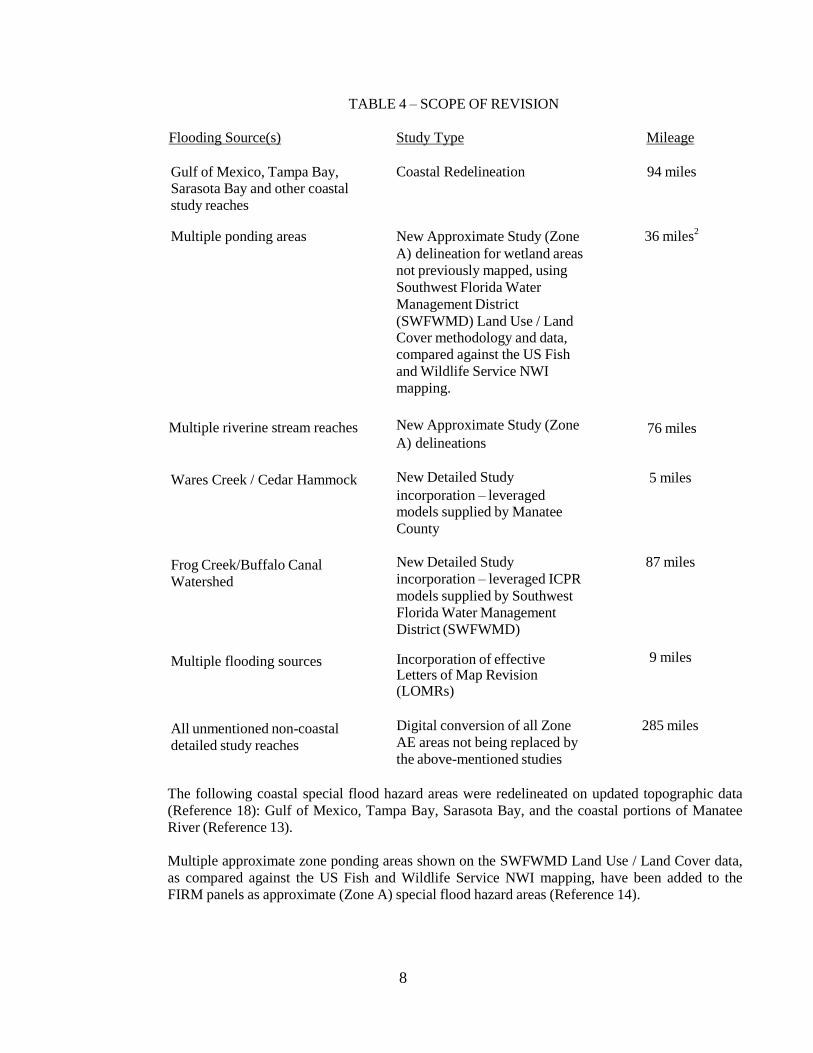
Table 4 details the scope of revision for this FIS.
8
TABLE 4 – SCOPE OF REVISION
Flooding Source(s) Study Type Mileage
Gulf of Mexico, Tampa Bay, Sarasota Bay and other coastal
study reaches
Coastal Redelineation 94 miles
Multiple ponding areas New Approximate Study (Zone
A) delineation for wetland areas
not previously mapped, using
Southwest Florida Water
Management District
(SWFWMD) Land Use / Land Cover methodology and data, compared against the US Fish
and Wildlife Service NWI
mapping.
36 miles2
Multiple riverine stream reaches New Approximate Study (Zone A) delineations
76 miles
Wares Creek / Cedar Hammock New Detailed Study incorporation – leveraged models supplied by Manatee
County
5 miles
Frog Creek/Buffalo Canal
Watershed
New Detailed Study
incorporation – leveraged ICPR
models supplied by Southwest
Florida Water Management
District (SWFWMD)
87 miles
Multiple flooding sources Incorporation of effective Letters of Map Revision (LOMRs)
9 miles
All unmentioned non-coastal
detailed study reaches
Digital conversion of all Zone
AE areas not being replaced by
the above-mentioned studies
285 miles
The following coastal special flood hazard areas were redelineated on updated topographic data
(Reference 18): Gulf of Mexico, Tampa Bay, Sarasota Bay, and the coastal portions of Manatee
River (Reference 13).
Multiple approximate zone ponding areas shown on the SWFWMD Land Use / Land Cover data,
as compared against the US Fish and Wildlife Service NWI mapping, have been added to the
FIRM panels as approximate (Zone A) special flood hazard areas (Reference 14).
9
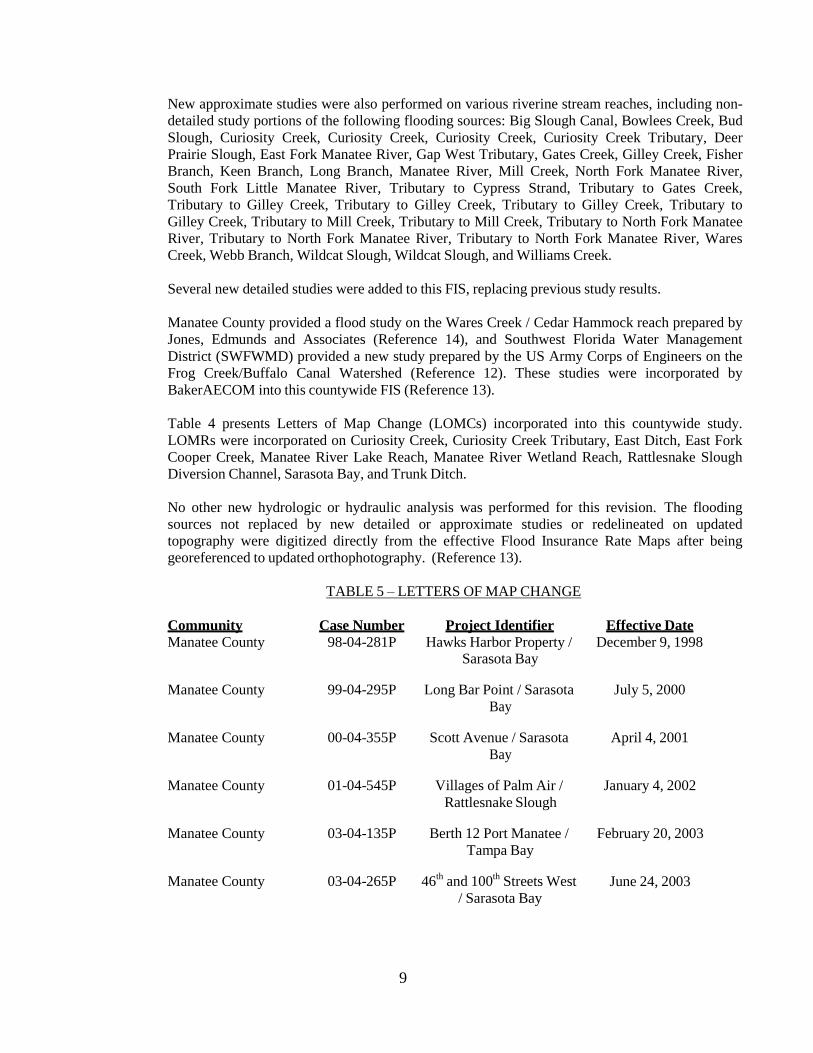
New approximate studies were also performed on various riverine stream reaches, including non-
detailed study portions of the following flooding sources: Big Slough Canal, Bowlees Creek, Bud
Slough, Curiosity Creek, Curiosity Creek, Curiosity Creek, Curiosity Creek Tributary, Deer
Prairie Slough, East Fork Manatee River, Gap West Tributary, Gates Creek, Gilley Creek, Fisher
Branch, Keen Branch, Long Branch, Manatee River, Mill Creek, North Fork Manatee River,
South Fork Little Manatee River, Tributary to Cypress Strand, Tributary to Gates Creek,
Tributary to Gilley Creek, Tributary to Gilley Creek, Tributary to Gilley Creek, Tributary to
Gilley Creek, Tributary to Mill Creek, Tributary to Mill Creek, Tributary to North Fork Manatee
River, Tributary to North Fork Manatee River, Tributary to North Fork Manatee River, Wares
Creek, Webb Branch, Wildcat Slough, Wildcat Slough, and Williams Creek.
Several new detailed studies were added to this FIS, replacing previous study results.
Manatee County provided a flood study on the Wares Creek / Cedar Hammock reach prepared by
Jones, Edmunds and Associates (Reference 14), and Southwest Florida Water Management
District (SWFWMD) provided a new study prepared by the US Army Corps of Engineers on the
Frog Creek/Buffalo Canal Watershed (Reference 12). These studies were incorporated by
BakerAECOM into this countywide FIS (Reference 13).
Table 4 presents Letters of Map Change (LOMCs) incorporated into this countywide study.
LOMRs were incorporated on Curiosity Creek, Curiosity Creek Tributary, East Ditch, East Fork
Cooper Creek, Manatee River Lake Reach, Manatee River Wetland Reach, Rattlesnake Slough
Diversion Channel, Sarasota Bay, and Trunk Ditch.
No other new hydrologic or hydraulic analysis was performed for this revision. The flooding
sources not replaced by new detailed or approximate studies or redelineated on updated
topography were digitized directly from the effective Flood Insurance Rate Maps after being
georeferenced to updated orthophotography. (Reference 13).
TABLE 5 – LETTERS OF MAP CHANGE
Community Case Number Project Identifier Effective Date
Manatee County 98-04-281P Hawks Harbor Property / Sarasota Bay
December 9, 1998
Manatee County 99-04-295P Long Bar Point / Sarasota
Bay
July 5, 2000
Manatee County 00-04-355P Scott Avenue / Sarasota
Bay
April 4, 2001
Manatee County 01-04-545P Villages of Palm Air /
Rattlesnake Slough
January 4, 2002
Manatee County 03-04-135P Berth 12 Port Manatee /
Tampa Bay
Manatee County 03-04-265P 46th
and 100th
Streets West
/ Sarasota Bay
February 20, 2003
June 24, 2003
10
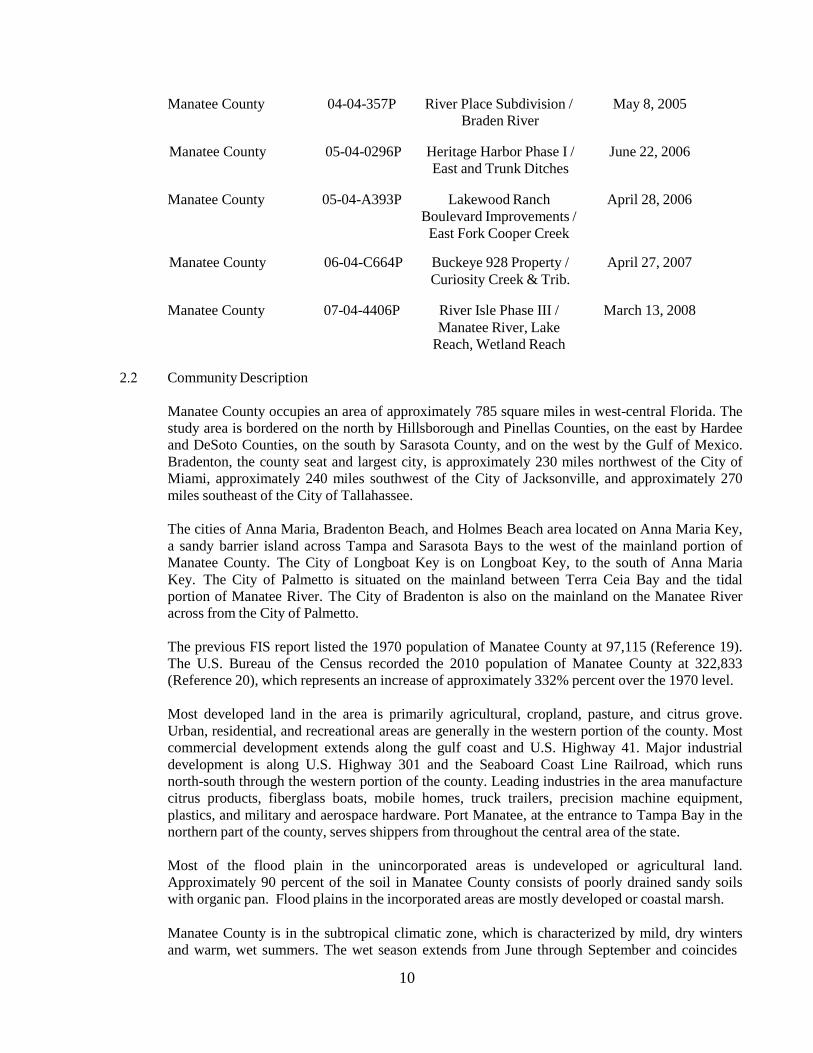
Manatee County 04-04-357P River Place Subdivision /
Braden River
May 8, 2005
Manatee County 05-04-0296P Heritage Harbor Phase I /
East and Trunk Ditches
June 22, 2006
Manatee County 05-04-A393P Lakewood Ranch
Boulevard Improvements /
East Fork Cooper Creek
April 28, 2006
Manatee County 06-04-C664P Buckeye 928 Property /
Curiosity Creek & Trib.
April 27, 2007
Manatee County 07-04-4406P River Isle Phase III /
Manatee River, Lake
Reach, Wetland Reach
March 13, 2008
2.2 Community Description
Manatee County occupies an area of approximately 785 square miles in west-central Florida. The
study area is bordered on the north by Hillsborough and Pinellas Counties, on the east by Hardee
and DeSoto Counties, on the south by Sarasota County, and on the west by the Gulf of Mexico.
Bradenton, the county seat and largest city, is approximately 230 miles northwest of the City of
Miami, approximately 240 miles southwest of the City of Jacksonville, and approximately 270
miles southeast of the City of Tallahassee.
The cities of Anna Maria, Bradenton Beach, and Holmes Beach area located on Anna Maria Key,
a sandy barrier island across Tampa and Sarasota Bays to the west of the mainland portion of
Manatee County. The City of Longboat Key is on Longboat Key, to the south of Anna Maria
Key. The City of Palmetto is situated on the mainland between Terra Ceia Bay and the tidal
portion of Manatee River. The City of Bradenton is also on the mainland on the Manatee River
across from the City of Palmetto.
The previous FIS report listed the 1970 population of Manatee County at 97,115 (Reference 19).
The U.S. Bureau of the Census recorded the 2010 population of Manatee County at 322,833
(Reference 20), which represents an increase of approximately 332% percent over the 1970 level.
Most developed land in the area is primarily agricultural, cropland, pasture, and citrus grove.
Urban, residential, and recreational areas are generally in the western portion of the county. Most
commercial development extends along the gulf coast and U.S. Highway 41. Major industrial
development is along U.S. Highway 301 and the Seaboard Coast Line Railroad, which runs
north-south through the western portion of the county. Leading industries in the area manufacture
citrus products, fiberglass boats, mobile homes, truck trailers, precision machine equipment,
plastics, and military and aerospace hardware. Port Manatee, at the entrance to Tampa Bay in the
northern part of the county, serves shippers from throughout the central area of the state.
Most of the flood plain in the unincorporated areas is undeveloped or agricultural land.
Approximately 90 percent of the soil in Manatee County consists of poorly drained sandy soils
with organic pan. Flood plains in the incorporated areas are mostly developed or coastal marsh.
Manatee County is in the subtropical climatic zone, which is characterized by mild, dry winters
and warm, wet summers. The wet season extends from June through September and coincides
11
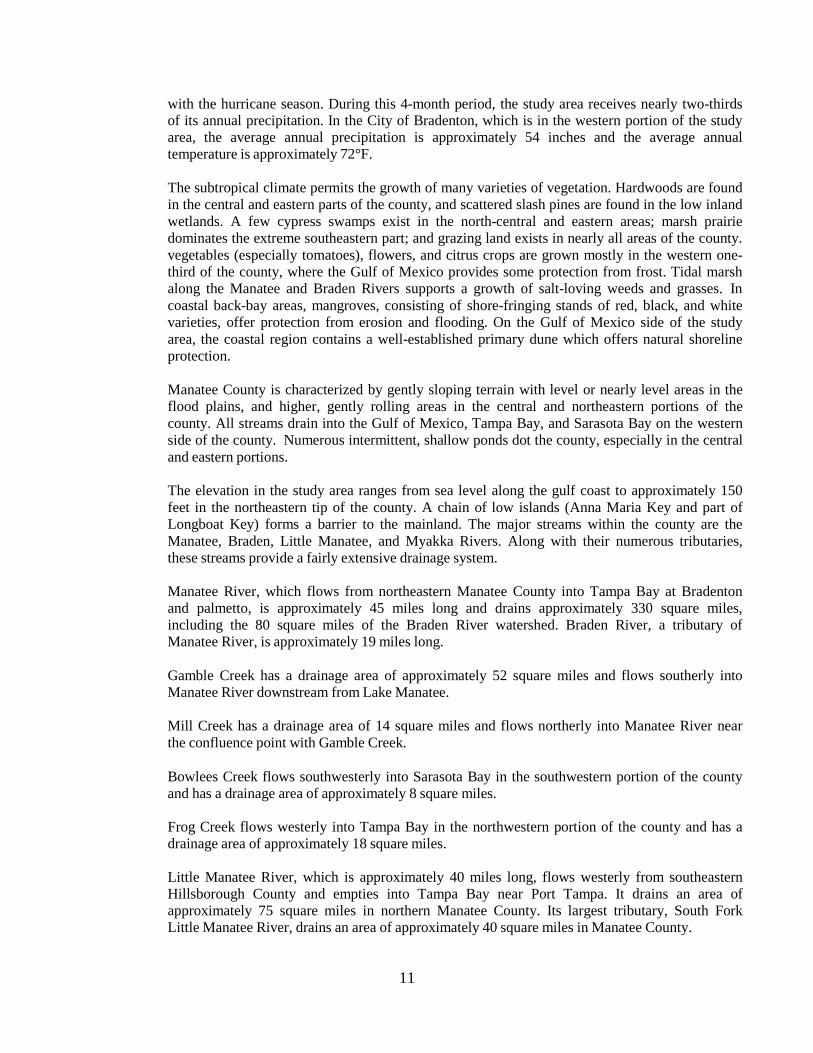
with the hurricane season. During this 4-month period, the study area receives nearly two-thirds of its annual precipitation. In the City of Bradenton, which is in the western portion of the study
area, the average annual precipitation is approximately 54 inches and the average annual
temperature is approximately 72°F.
The subtropical climate permits the growth of many varieties of vegetation. Hardwoods are found
in the central and eastern parts of the county, and scattered slash pines are found in the low inland
wetlands. A few cypress swamps exist in the north-central and eastern areas; marsh prairie
dominates the extreme southeastern part; and grazing land exists in nearly all areas of the county.
vegetables (especially tomatoes), flowers, and citrus crops are grown mostly in the western one-
third of the county, where the Gulf of Mexico provides some protection from frost. Tidal marsh
along the Manatee and Braden Rivers supports a growth of salt-loving weeds and grasses. In
coastal back-bay areas, mangroves, consisting of shore-fringing stands of red, black, and white
varieties, offer protection from erosion and flooding. On the Gulf of Mexico side of the study
area, the coastal region contains a well-established primary dune which offers natural shoreline
protection.
Manatee County is characterized by gently sloping terrain with level or nearly level areas in the
flood plains, and higher, gently rolling areas in the central and northeastern portions of the
county. All streams drain into the Gulf of Mexico, Tampa Bay, and Sarasota Bay on the western
side of the county. Numerous intermittent, shallow ponds dot the county, especially in the central
and eastern portions.
The elevation in the study area ranges from sea level along the gulf coast to approximately 150
feet in the northeastern tip of the county. A chain of low islands (Anna Maria Key and part of
Longboat Key) forms a barrier to the mainland. The major streams within the county are the
Manatee, Braden, Little Manatee, and Myakka Rivers. Along with their numerous tributaries,
these streams provide a fairly extensive drainage system.
Manatee River, which flows from northeastern Manatee County into Tampa Bay at Bradenton
and palmetto, is approximately 45 miles long and drains approximately 330 square miles,
including the 80 square miles of the Braden River watershed. Braden River, a tributary of
Manatee River, is approximately 19 miles long.
Gamble Creek has a drainage area of approximately 52 square miles and flows southerly into
Manatee River downstream from Lake Manatee.
Mill Creek has a drainage area of 14 square miles and flows northerly into Manatee River near
the confluence point with Gamble Creek.
Bowlees Creek flows southwesterly into Sarasota Bay in the southwestern portion of the county
and has a drainage area of approximately 8 square miles.
Frog Creek flows westerly into Tampa Bay in the northwestern portion of the county and has a
drainage area of approximately 18 square miles.
Little Manatee River, which is approximately 40 miles long, flows westerly from southeastern
Hillsborough County and empties into Tampa Bay near Port Tampa. It drains an area of
approximately 75 square miles in northern Manatee County. Its largest tributary, South Fork
Little Manatee River, drains an area of approximately 40 square miles in Manatee County.
12
Myakka River, in the southern part of Manatee County, flows generally southerly into Charlotte
Harbor and drains an area of approximately 235 square miles within Manatee County.
In addition, there is a network of canals and ditches to drain some of the low, flat areas.
2.3 Principal Flood Problems
Flooding in Manatee County results primarily from tidal surge and associated wave action
(caused by hurricanes and tropical storms in the coastal areas of the county and from overflow of
the streams (caused by rainfall runoff) in other areas.
Not all storms that pass close to the study area produce extremely high tides. Storms that produce
extreme conditions in one area may not necessarily produce critical conditions in other parts of
the study area. However, with the condition of high winds directed onshore, the tides produced
can inundate the low coastal islands and flood the coastal areas behind them for some distance
inland. Wave action that accompanies wind-generated tides can cause flooding, erosion, and
structural damage, particularly on the offshore islands. Manatee River is a broad estuary, and,
under certain conditions, tides generated at its mouth in Tampa Bay can intrude far upstream.
Rainfall, which usually accompanies hurricanes, can aggravate the tidal flood situation. Because
of the flatness of the terrain, many inland areas are characterized by shallow flooding during
heavy rain falls.
Myakka River is a coastal stream that drains approximately 174 square miles of predominantly
rural land in Manatee County. Urban and agricultural developments are increasing along its flood
plain. Low-lying areas near the Myakka River main stem are subject to frequent and severe
flooding. Flood-prone area identification is therefore essential to ensure orderly basin
development.
Storms passing Florida in the vicinity of Manatee County have produced severe floods as well as
structural damage. A brief description of several significant tropical storms provides historic
information to which coastal and riverine flood hazards and the projected flood depths can be
compared (References 21, 22, 23, 24, and 25).
October 21-31, 1921
This storm originated in the western Caribbean Sea and entered Florida north of the City of Tarpon Springs. Flooding conditions were prolonged because of the slow forward movement of
the storm. At Anna Maria Key and Cortez, the tide covered the area, and water was 4 to 5 feet
deep. High tides caused substantial property damage and agricultural losses in Manatee County.
September 11-22, 1926
This storm, one of the most destructive storms of this century in Florida, originated in the Atlantic
Ocean near the Cape Verde Islands and approached the coast of Florida on September 17. Wave
action caused erosion along the Manatee County coast and severe flooding in the Bradenton area.
Damage was estimated at $100 million statewide, including $3 million in the Bradenton,
Sarasota, and Fort Myers areas.
13
October 13-21, 1944
The hurricane originated in the western Caribbean Sea south of the Cayman Islands. It entered the
west coast of Florida near Sarasota and followed a northeasterly course. This large hurricane
caused extremely high tides south of Tampa and abnormally low tides from Tampa northward.
September 7, 1950
This small, but severe, hurricane originated over the western Caribbean Sea, passed northward
over Aruba and the Gulf of Mexico, then moved north-northwestward parallel to the Florida
coastline. Tides were estimated to have been between 6 and 8 feet along the central gulf coast.
Much of Anna Maria Island was flooded. The shoreline receded 15 to 20 feet in some areas,
cutting through the beach road on the island in several places.
September 10-11, 1960 – Hurricane Donna
Although precipitation from Hurricane Donna averaged 5 to 7 inches, a pre-storm rainfall of
approximately 10 inches in the previous 3 weeks had saturated the ground; consequently,
considerable flooding resulted. Storm tides generated by this storm also caused substantial
damage to the Manatee County coastal areas.
October 18, 1968
This storm originated in the Caribbean Sea and entered the Florida Straits. Tides of up to 5 feet above normal produced considerable damage, beach erosion and the lowering of beach profiles
throughout in Sarasota County and the Manatee County portion of the City of Longboat Key.
June 19, 1972 – Hurricane Agnes
Hurricane Agnes originated on the northeastern tip of the Yucatan Peninsula and traveled
westward. The storm was of large diameter, and, although the center of this storm passed
approximately ISO miles west of the Florida peninsula, it produced a high, damaging tidal surge.
Tides were approximately 3 to 4 feet above normal; coastal areas experienced erosion from wave
action and tidal damage to homes, seawalls, revetments, and roads. Damage in Manatee County
from this storm was estimated at $2 million.
2.4 Flood Protection Measures
There are no structural flood protection measures in the county. Manatee Utility System Dam was
designated for water supply, but its associated reservoir, Lake Manatee, is drawn down to provide
flood control storage when prolonged heavy rainfall is anticipated (Reference #). The spillway
crest of this dam was found to be higher than the 100-year flood but not as high as the 500-year
flood. No extensive community flood protection project exists in the tidal areas; however, flood
protection of structures is done on an individual basis and includes such measures as elevation of
dwellings, conservation of mangrove swamps and dunes, and construction of seawalls.
Manatee County has adopted flood plain management regulations in accordance with the regular
phase of the National Flood Insurance Program.
Refer to Section 3.2 of this report for detailed information about flood hazards behind levees.
14
3.0 ENGINEERING METHODS
For the flooding sources studied in detail in the county, standard hydrologic and hydraulic study methods
were used to determine the flood hazard data required for this study. Flood event of a magnitude which
are expected to be equaled or exceeded once on the average during any 10-, 50-, 100-, or 500-year period
(recurrence interval) have been selected as having special significance for floodplain management and for
flood insurance rates. These events, commonly termed the 10-, 50-, 100-, and 500-year floods, have a 10,
2, 1, and 0.2 percent chance, respectively, of being equaled or exceeded during any year. Although the
recurrence interval represents the long term average period between floods of a specific magnitude, rare
floods could occur at short intervals or even within the same year. The risk of experiencing a rare flood
increases when periods greater than 1 year are considered. For example, the risk of having a flood which
equals or exceeds the 1-percent-annual-chance flood (1-percent-chance of annual exceedence) in any 50-
year period is approximately 40 percent (4 in 10), and, for any 90-year period, the risk increases to
approximately 60 percent (6 in 10). The analyses reported herein reflect flooding potentials based on
conditions existing in the community at the time of completion of this study. Maps and flood elevations
will be amended periodically to reflect future changes.
3.1 Hydrologic Analyses
Hydrologic analyses were carried out to establish the peak discharge or elevation frequency
relationships for floods of the selected recurrence intervals for each flooding source studied in
detail affecting the county.
In addition to rainfall flooding, major consideration was given to coastal flooding associated with
hurricane-induced storm surge. The analysis of storm surge included its propagation inland,
incorporating the effects of natural and manmade flow paths.
Pre-countywide Analyses
The determination of coastal inundation caused by passage of a hurricane storm surge was
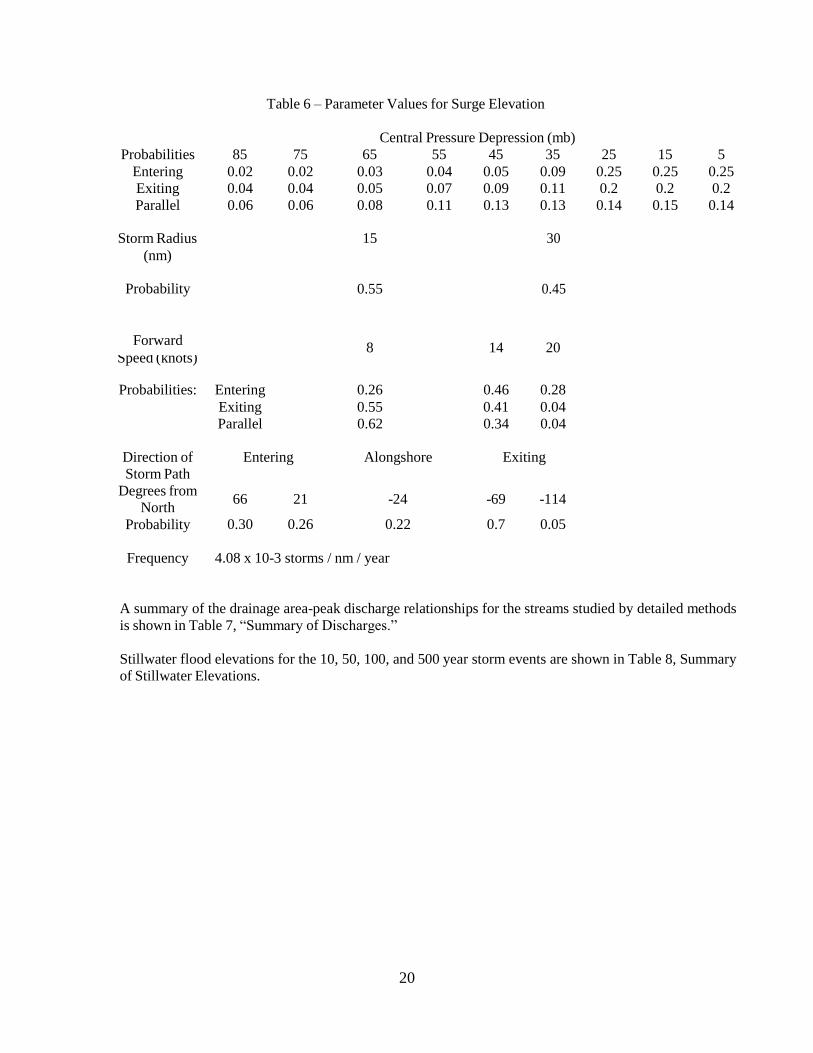
approached by the joint probability method (Reference 26). The storm populations were
described by probability distributions of five parameters that influence surge heights. These
parameters were: central pressure depression (which measures the intensity of the storm), radius
to maximum winds, forward speed of the storm, shoreline crossing point, and crossing angle.
These characteristics were described statistically based on an analysis of observed storms in the
vicinity of Manatee County. The primary sources of data for this were the National Climatic
Center (Reference 27): Cry (Reference 28): Ho, Schwerdt, and Goodyear (Reference 29): the
National Hurricane Research Project (Reference 30): and the Monthly Weather Review
(Reference 31). Digitized storm information for all storms from 1886 through 1977 was used to
correlate statistics (Reference 32). A summary of the parameters for surge elevation used for the
Manatee County and Incorporated Areas study is presented in Table 6.
For areas subject to flooding directly from the Gulf of Mexico, Tampa and Sarasota Bays, the
Federal Emergency Management Agency standard coastal surge model was used to simulate the
coastal surge generated by any chosen storm (that is, any combination of the five storm
parameters defined previously). By performing such simulations for a large number of storms,
each of known total probability, the frequency distribution of surge height can be established as a
function of coastal location. These distributions incorporate the large scale surge behavior, but do
not include an analysis of the added effects associated with much finer scale wave phenomena,
such as wave height, setup, or runup. The astronomic tide for the region is then statistically
combined with the computed storm surge to yield recurrence intervals of total water level
15
(Reference 33). The standard coastal surge model utilizes a grid pattern approximating the
geographical features of the study area and the adjoining areas. Surges were computed utilizing
grids of 5 nautical miles, 1 nautical mile, and 2000 feet, depending on the resolution required.
Underwater depths and land heights for the model grid systems were obtained from National
Oceanic and Atmospheric Administration Nautical Charts (Reference 34) and U.S. Geological
Survey topographic maps (Reference 35).
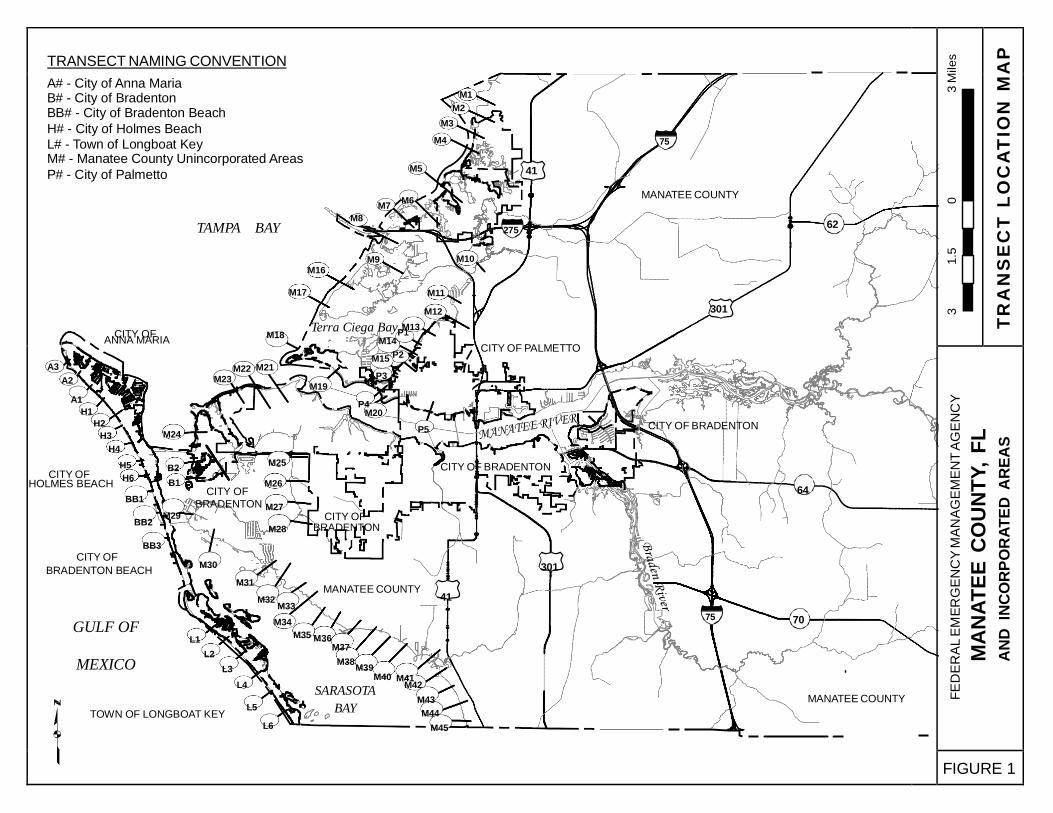
Wave heights were added to stillwater storm-surge elevations using methodology recommended
by the National Academy of Sciences (Reference 36). This methodology considers maximum
conditions associated with the 100-year flood, and uses transects that are oriented perpendicular
to the average mean sea level shoreline to deduce wave crest elevations. The transects used in this
study are located on the map presented in Figure 1, and were chosen based on topography,
vegetation, and cultural development.
TRANSECT NAMING CONVENTION
A# - City of Anna Maria B# - City of Bradenton M1
BB# - City of Bradenton Beach M2
H# - City of Holmes Beach M3
L# - Town of Longboat Key M4 75
M# - Manatee County Unincorporated Areas
P# - City of Palmetto M5 41
M6 MANATEE COUNTY
M7
M8
TAMPA BAY 27562
M9 M10 M16
M17 M11
M12 301
CITY OF Terra Ciega Bay M13
ANNA MARIA M18
M14 P1
CITY OF PALMETTO M15 P2
A3 M22 M21
A2 M23 P3 M19
A1 P4
H1 M20 H2
P5 CITY OF BRADENTON H3 M24
H4
H5 B2 M25 CITY OF BRADENTON
CITY OF HOLMES BEACH
H6 B1 M26
CITY OF 64 BB1
BRADENTON M27
BB2 M29 CITY OF
M28 BRADENTON
BB3
CITY OF
BRADENTON BEACH M30 301
M31 MANATEE COUNTY
M32 41 M33
GULF OF M34 75 70
L1 M35 M36
M37 L2
MEXICO L3 M38
M39 M40 M41
L4 SARASOTA
M42
M43 MANATEE COUNTY
TOWN OF LONGBOAT KEY L5 BAY M44
L6 M45
3
1.5
0
3
Mile
s
T R
A N
S E
C T
L
O C
AT
I O
N M
A P
FE
DE
RA
L E
ME
RG
EN
CY
MA
NA
GE
ME
NT
AG
EN
CY
MA
NA
TE
E C
OU
NT
Y,
FL
A
ND
IN
CO
RP
OR
AT
ED
AR
EA
S
FIGURE 1
17
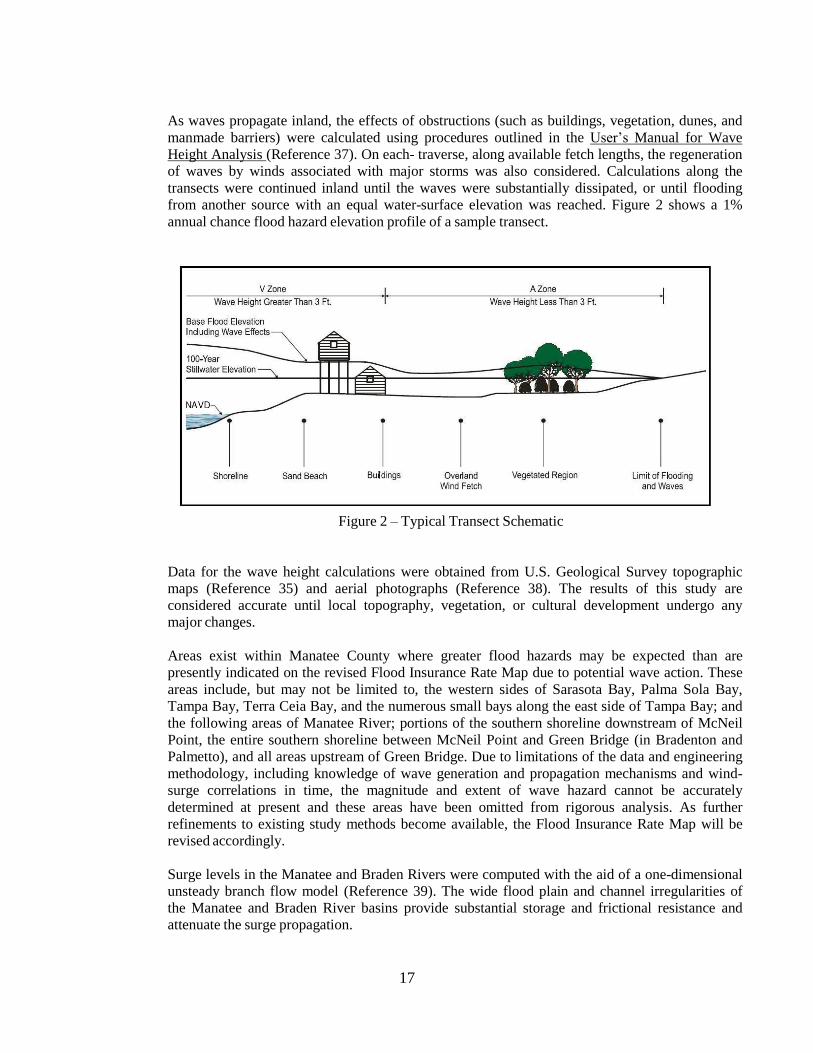
As waves propagate inland, the effects of obstructions (such as buildings, vegetation, dunes, and
manmade barriers) were calculated using procedures outlined in the User’s Manual for Wave
Height Analysis (Reference 37). On each- traverse, along available fetch lengths, the regeneration
of waves by winds associated with major storms was also considered. Calculations along the
transects were continued inland until the waves were substantially dissipated, or until flooding
from another source with an equal water-surface elevation was reached. Figure 2 shows a 1%
annual chance flood hazard elevation profile of a sample transect.
Figure 2 – Typical Transect Schematic
Data for the wave height calculations were obtained from U.S. Geological Survey topographic
maps (Reference 35) and aerial photographs (Reference 38). The results of this study are
considered accurate until local topography, vegetation, or cultural development undergo any
major changes.
Areas exist within Manatee County where greater flood hazards may be expected than are
presently indicated on the revised Flood Insurance Rate Map due to potential wave action. These
areas include, but may not be limited to, the western sides of Sarasota Bay, Palma Sola Bay,
Tampa Bay, Terra Ceia Bay, and the numerous small bays along the east side of Tampa Bay; and
the following areas of Manatee River; portions of the southern shoreline downstream of McNeil
Point, the entire southern shoreline between McNeil Point and Green Bridge (in Bradenton and
Palmetto), and all areas upstream of Green Bridge. Due to limitations of the data and engineering
methodology, including knowledge of wave generation and propagation mechanisms and wind-
surge correlations in time, the magnitude and extent of wave hazard cannot be accurately
determined at present and these areas have been omitted from rigorous analysis. As further
refinements to existing study methods become available, the Flood Insurance Rate Map will be
revised accordingly.
Surge levels in the Manatee and Braden Rivers were computed with the aid of a one-dimensional
unsteady branch flow model (Reference 39). The wide flood plain and channel irregularities of
the Manatee and Braden River basins provide substantial storage and frictional resistance and
attenuate the surge propagation.
18
Flood magnitudes and frequencies for areas affected by riverine flooding were estimated by
analyzing synthetic time series that were generated from precipitation data via rainfall-runoff
simulation models. These models were calibrated with existing stream gage data from the
Manatee and Braden River basins. Twenty-two years of data were obtained from U.S. Geological
Survey Gage No. 02300000, located on Manatee River near Bradenton.
Land use, soil types, and hydraulic structures were used to modify basin parameters that were
developed for the Manatee River Basin and were then transposed to other basins, which include
Braden River, Gamble Creek, and Mill Creek. The resulting annual peak time series was then
fitted to the log-Pearson Type III distribution following the guidelines contained in U.S. Water
Resources Council Bulletin 17 (Reference 40). Discharges for the 10- and 100-year floods on
Manatee River were taken from Floodplain Study for the Lower Manatee River, Manatee County,
Florida (Reference 41).
A relationship between peak flood discharge and drainage area was developed for the Manatee
River basin and adopted for use on Bowlees Creek by making an adjustment to include the effects
of urbanization (Reference 42). Because urbanization has a greater impact on small floods, the
10-year peak discharge for Bowlees Creek was found to be larger than the corresponding
discharge for Mill Creek, even though the Mill Creek drainage area is greater. Discharges for
Frog Creek were determined using a regional regression analysis adopted from a U.S. Geological
Survey study (Reference 43). The significant parameters were channel length, drainage area,
slope, and storage. Discharges for Little Manatee River were taken from a study by the Southwest
Florida Water Management District (Reference 44).
Rainfall-runoff simulation models were developed to generate hydrographs of selected
frequencies for inflow into Lake Manatee. These hydrographs were then routed through the
reservoir by the Storage Indication Method. The starting water-surface elevation in the reservoir
was 40 feet for the 10-, 50-, 100-, and 500-year floods. The 500-year flood results are essentially
identical to the Standard Project Flood estimated by the U.S. Army Corps of Engineers
(Reference 45).
Flood-frequency relations for natural conditions of the Myakka River were based on weighted
flood-frequency distributions determined for one long-term streamflow station near Sarasota
(drainage area = 235 square miles), one short-term streamflow station near Myakka City
(drainage area = 125 square miles), and two ungaged sites. One ungaged site is at state Road 780,
in Sarasota County, and is the outlet station for the drainage in Manatee County (drainage area =
174 square miles). The other ungaged site is at Blackburn Bridge in Sarasota County (drainage
area = 270 square miles).
One estimate of the flood-frequency distribution for each of the four sites was determined using
results of an areal flood-frequency analysis of long-term streamflow records for 20 stations in
west-central Florida.
Areal flood-frequency relations were developed in a multiple linear regression analysis of flood-
peak discharges for selected recurrence intervals (from log-Pearson Type III distributions) and
selected basin parameters. Basin parameters used include drainage area, stream length and slope,
and percentage of the basin area that is lakes and swamps. The average standard error of estimate
for areal flood-frequency relations is 25.8 percent and the average multiple correlation coefficient
is 0.98. Flood-frequency distributions were obtained for the two gaged and two ungaged sites on
Myakka River using the determined regression coefficients and measured basin parameter values.
19
A log-Pearson Type III distribution was used as a second estimate of flood frequency for the
long-term station, Myakka River near Sarasota. A log-Pearson Type III flood-frequency
distribution for the short-term station, Myakka River at Myakka City, was determined by
correlation with a nearby long-term station (No. 02300000) on Manatee River. This correlation
procedure is described by the U.S. Water Resources Council (Reference 40) as a two-station
comparison.
Regression flood-frequency distributions were weighted with log-Pearson Type III distributions
to obtain weighted flood-frequency distributions for the gaged sites. The weighting procedure
used is referred to as weighting of independent estimates by the U.S. Water Resources Council
(Reference 40).
Weighted flood-frequency distributions for the ungaged sites were based on weighted
distributions at the gaged sites. Ratios of regression distribution discharges to log-Pearson Type
III discharges for the Sarasota and Myakka City stations were plotted versus drainage area on
logarithmic paper. Ratios corresponding to the drainage areas of the ungaged sites were
determined from the plot. Regression distributions for the ungaged sites were then multiplied by
respective ratios to obtain weighted distributions.
Recurrence-interval discharges from weighted distributions for all four sites were plotted to form
the flood-frequency relations for natural conditions (Reference 46).
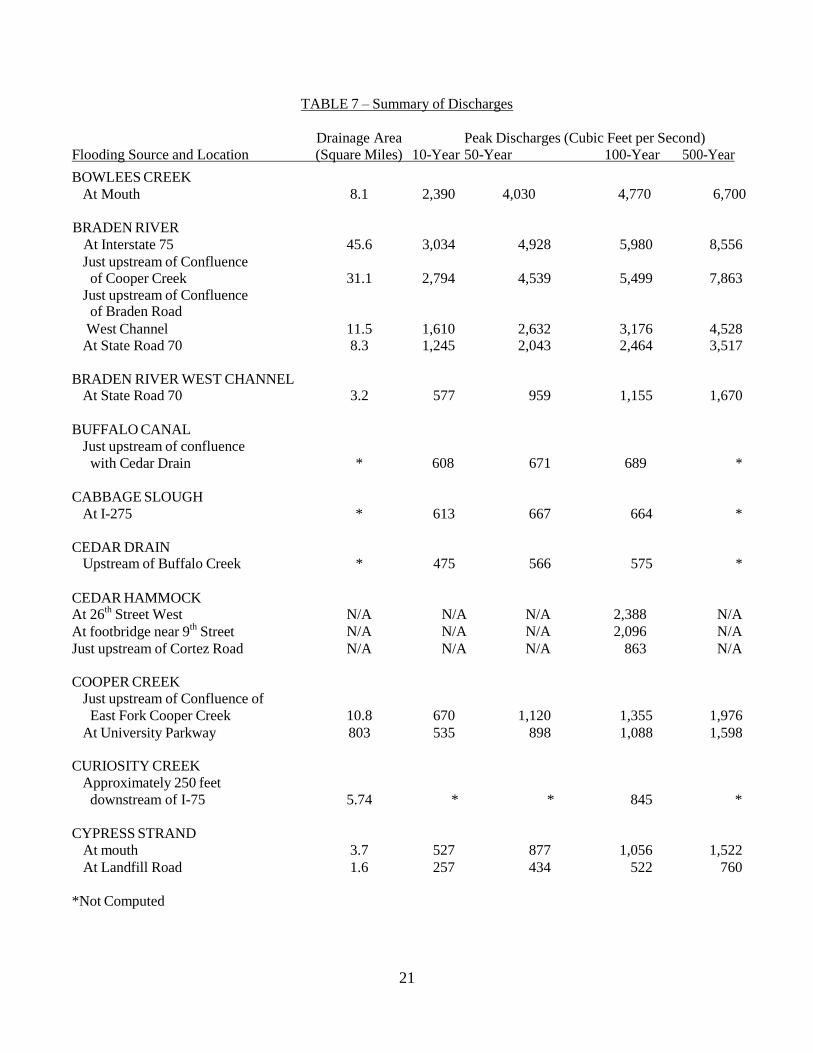
Peak discharge-drainage area relationships for Manatee River, Braden River, Gamble Creek, Mill
Creek, Bowlees Creek, Frog Creek, Little Manatee River, and Myakka River are shown in Table
6 Summary of Discharges.
For the 1992 FIS, drainage basin areas, slopes, and, lake areas were determined using topographic
maps (Reference 47); aerial photography (Reference 48); and stereo aerial photography
(Reference 49). Discharges were determined using USGS regional regression equations with
modifications for urbanization (References 50 and 51). The 1992 revision incorporated revised
flooding caused by the overflow of Cabbage Slough; Wade Canal; Frye Canal; Cooper Creek;
Frog Creek, upstream of U.S. Route 41; Buffalo Canal; Gamble Creek, upstream of Golf Course
Drive; Braden River, upstream of Interstate 75; Braden River West Channel; Wolf Slough; Mill
Creek, upstream of confluence of unnamed tributary; Rattlesnake Slough; Gap Creek; Williams
Creek; Cypress Strand; Gates Creek; East Fork Cooper Creek; Myakka River, upstream of State
Road 70; South Fork Little Manatee River; and Cedar Hammock Drainage Canal.
Flood levels resulting from coastal flooding (surge and waves) and from rainfall were determined
independently of each other and combined statistically. The computed elevations for the Gulf of
Mexico, Tampa Bay, Sarasota Bay, and Lake Manatee are shown in Table 7 Summary of
Elevations.
For each community within Manatee County that had a previously printed FIS report, the
unrevised hydrologic analyses described in those reports have been compiled and are summarized
below by city or town.
20
66 21 -24 -69 -114
0.30 0.26 0.22 0.7 0.05
Table 6 – Parameter Values for Surge Elevation
Central Pressure Depression (mb)
Probabilities 85 75 65 55 45 35 25 15 5
Entering 0.02 0.02 0.03 0.04 0.05 0.09 0.25 0.25 0.25
Exiting 0.04 0.04 0.05 0.07 0.09 0.11 0.2 0.2 0.2
Parallel 0.06 0.06 0.08 0.11 0.13 0.13 0.14 0.15 0.14
Storm Radius 15 30
(nm)
Probability 0.55 0.45
Forward 8 14 20
Speed (knots)
Probabilities: Entering 0.26 0.46 0.28
Exiting 0.55 0.41 0.04
Parallel 0.62 0.34 0.04
Direction of
Storm Path
Degrees from
North
Probability
Entering Alongshore Exiting
Frequency 4.08 x 10⁻³ storms / nm / year
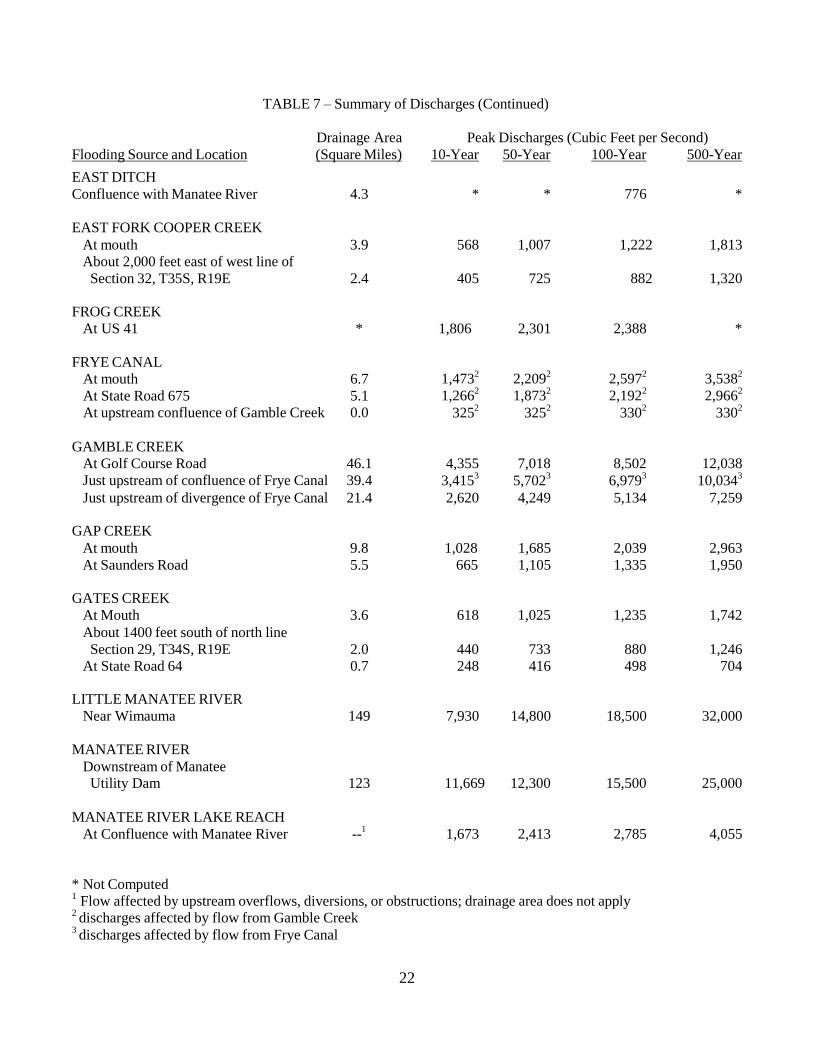
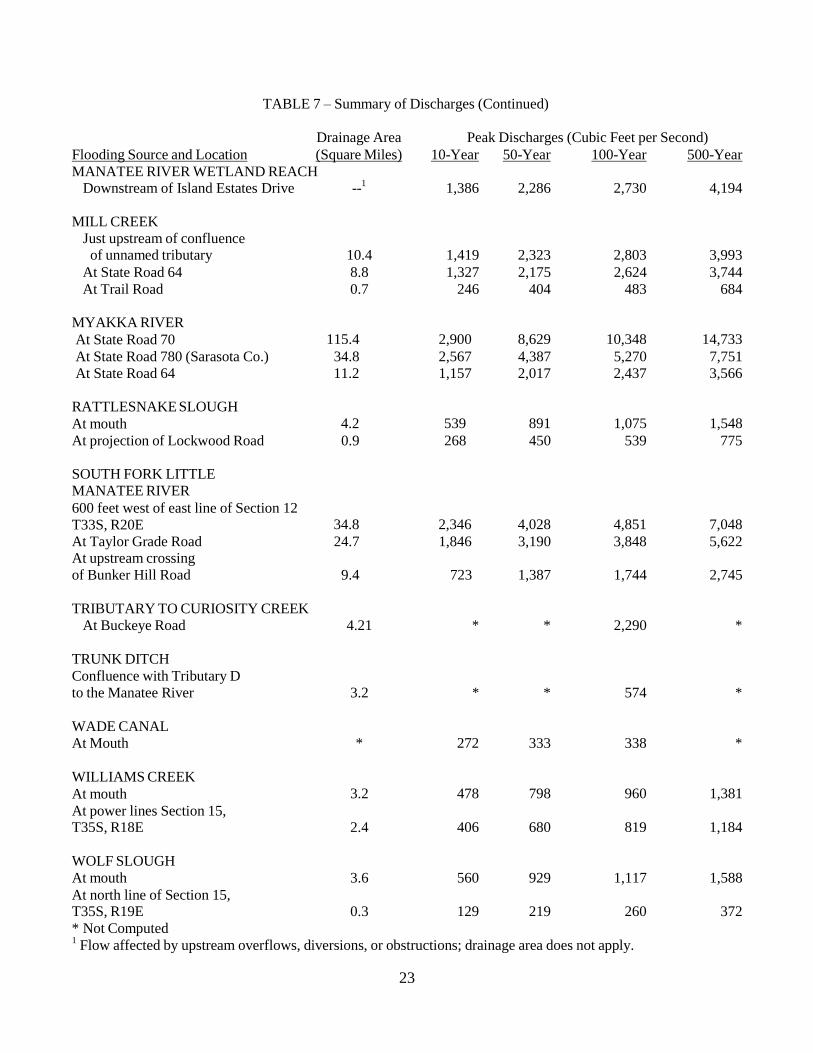
A summary of the drainage area-peak discharge relationships for the streams studied by detailed methods
is shown in Table 7, “Summary of Discharges.”
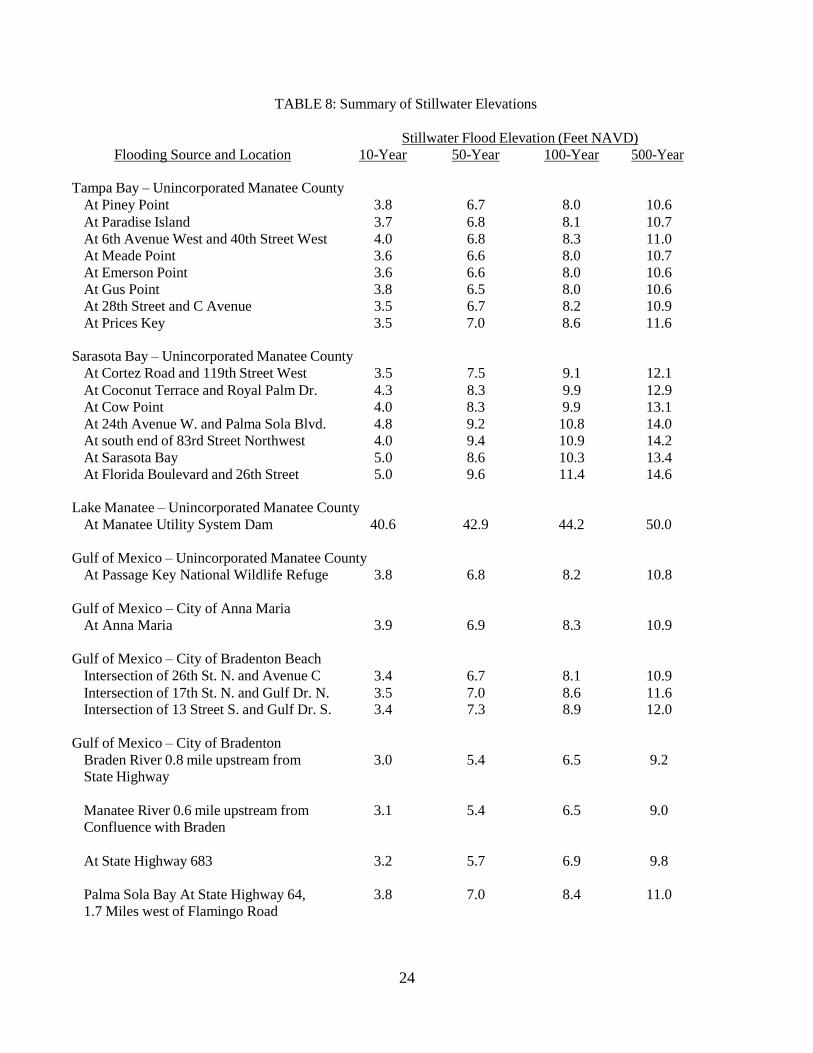
Stillwater flood elevations for the 10, 50, 100, and 500 year storm events are shown in Table 8, Summary
of Stillwater Elevations.
21
BRADEN RIVER
At Interstate 75 45.6 3,034 4,928 5,980 8,556
Just upstream of Confluence of Cooper Creek 31.1 2,794 4,539 5,499 7,863
Just upstream of Confluence of Braden Road
West Channel 11.5 1,610 2,632 3,176 4,528 At State Road 70 8.3 1,245 2,043 2,464 3,517
BRADEN RIVER WEST CHANNEL At State Road 70 3.2 577 959 1,155 1,670
BUFFALO CANAL
with Cedar Drain * 608 671 689 *
CABBAGE SLOUGH
At I-275 * 613 667 664 *
CEDAR DRAIN Upstream of Buffalo Creek * 475 566 575 *
CEDAR HAMMOCK At 26
th Street West N/A N/A N/A 2,388 N/A
At footbridge near 9th
Street N/A N/A N/A 2,096 N/A
Just upstream of Cortez Road N/A N/A N/A 863 N/A
COOPER CREEK
East Fork Cooper Creek 10.8 670 1,120 1,355 1,976
At University Parkway 803 535 898 1,088 1,598
At mouth 3.7 527 877 1,056 1,522
At Landfill Road 1.6 257 434 522 760
TABLE 7 – Summary of Discharges
Drainage Area Peak Discharges (Cubic Feet per Second)
Flooding Source and Location (Square Miles) 10-Year 50-Year 100-Year 500-Year
BOWLEES CREEK
At Mouth 8.1 2,390 4,030 4,770 6,700
Just upstream of confluence
Just upstream of Confluence of
CURIOSITY CREEK
Approximately 250 feet
downstream of I-75 5.74 * * 845 *
CYPRESS STRAND
*Not Computed
22
At mouth 6.7 1,4732
2,2092
2,5972
3,5382
At State Road 675 5.1 1,2662
1,8732
2,1922
2,9662
At upstream confluence of Gamble Creek 0.0 3252
3252
3302
3302
TABLE 7 – Summary of Discharges (Continued)
Drainage Area Peak Discharges (Cubic Feet per Second)
Flooding Source and Location (Square Miles) 10-Year 50-Year 100-Year 500-Year
EAST DITCH
Confluence with Manatee River 4.3 * * 776 *
EAST FORK COOPER CREEK
At mouth 3.9 568 1,007 1,222 1,813
About 2,000 feet east of west line of
Section 32, T35S, R19E 2.4 405 725 882 1,320
FROG CREEK
At US 41 * 1,806 2,301 2,388 *
FRYE CANAL
GAMBLE CREEK
At Golf Course Road 46.1 4,355 7,018 8,502 12,038
Just upstream of confluence of Frye Canal 39.4 3,4153
5,7023
6,9793
10,0343
Just upstream of divergence of Frye Canal 21.4 2,620 4,249 5,134 7,259
GAP CREEK
At mouth 9.8 1,028 1,685 2,039 2,963
At Saunders Road 5.5 665 1,105 1,335 1,950
GATES CREEK
At Mouth 3.6 618 1,025 1,235 1,742
About 1400 feet south of north line
Section 29, T34S, R19E 2.0 440 733 880 1,246
At State Road 64 0.7 248 416 498 704
LITTLE MANATEE RIVER
Near Wimauma 149 7,930 14,800 18,500 32,000
MANATEE RIVER
Downstream of Manatee Utility Dam 123 11,669 12,300 15,500 25,000
MANATEE RIVER LAKE REACH
At Confluence with Manatee River --1
1,673 2,413 2,785 4,055
* Not Computed1
Flow affected by upstream overflows, diversions, or obstructions; drainage area does not apply2 discharges affected by flow from Gamble Creek
3 discharges affected by flow from Frye Canal
23
of unnamed tributary 10.4 1,419 2,323 2,803 3,993
At State Road 64 8.8 1,327 2,175 2,624 3,744
At Trail Road 0.7 246 404 483 684
MYAKKA RIVER
At State Road 70 115.4 2,900 8,629 10,348 14,733
At State Road 780 (Sarasota Co.) 34.8 2,567 4,387 5,270 7,751
At State Road 64 11.2 1,157 2,017 2,437 3,566
RATTLESNAKE SLOUGH
At mouth 4.2 539 891 1,075 1,548
At projection of Lockwood Road 0.9 268 450 539 775
SOUTH FORK LITTLE
MANATEE RIVER
600 feet west of east line of Section 12
T33S, R20E 34.8 2,346 4,028 4,851 7,048
At Taylor Grade Road At upstream crossing
of Bunker Hill Road
24.7
9.4
1,846
723
3,190
1,387
3,848
1,744
5,622
2,745
TRIBUTARY TO CURIOSITY CREEK
At Buckeye Road 4.21 * * 2,290 *
TRUNK DITCH
Confluence with Tributary D
to the Manatee River 3.2 * * 574 *
WADE CANAL
At Mouth * 272 333 338 *
WILLIAMS CREEK
At mouth 3.2 478 798 960 1,381
At power lines Section 15, T35S, R18E 2.4 406 680 819 1,184
WOLF SLOUGH
At mouth 3.6 560 929 1,117 1,588
At north line of Section 15, T35S, R19E 0.3 129 219 260 372
TABLE 7 – Summary of Discharges (Continued)
Drainage Area Peak Discharges (Cubic Feet per Second)
Flooding Source and Location (Square Miles) 10-Year 50-Year 100-Year 500-Year
MANATEE RIVER WETLAND REACH Downstream of Island Estates Drive --
11,386 2,286 2,730 4,194
MILL CREEK
Just upstream of confluence
* Not Computed1
Flow affected by upstream overflows, diversions, or obstructions; drainage area does not apply.
24
TABLE 8: Summary of Stillwater Elevations
Stillwater Flood Elevation (Feet NAVD)
Flooding Source and Location 10-Year 50-Year 100-Year 500-Year
Tampa Bay – Unincorporated Manatee County
At Piney Point 3.8 6.7 8.0 10.6
At Paradise Island 3.7 6.8 8.1 10.7
At 6th Avenue West and 40th Street West 4.0 6.8 8.3 11.0
At Meade Point 3.6 6.6 8.0 10.7
At Emerson Point 3.6 6.6 8.0 10.6
At Gus Point 3.8 6.5 8.0 10.6
At 28th Street and C Avenue 3.5 6.7 8.2 10.9
At Prices Key 3.5 7.0 8.6 11.6
Sarasota Bay – Unincorporated Manatee County
At Cortez Road and 119th Street West 3.5 7.5 9.1 12.1
At Coconut Terrace and Royal Palm Dr. 4.3 8.3 9.9 12.9
At Cow Point 4.0 8.3 9.9 13.1
At 24th Avenue W. and Palma Sola Blvd. 4.8 9.2 10.8 14.0
At south end of 83rd Street Northwest 4.0 9.4 10.9 14.2
At Sarasota Bay 5.0 8.6 10.3 13.4
At Florida Boulevard and 26th Street 5.0 9.6 11.4 14.6
Lake Manatee – Unincorporated Manatee County
At Manatee Utility System Dam 40.6 42.9 44.2 50.0
Gulf of Mexico – Unincorporated Manatee County
At Passage Key National Wildlife Refuge 3.8 6.8 8.2 10.8
Gulf of Mexico – City of Anna Maria
At Anna Maria 3.9 6.9 8.3 10.9
Gulf of Mexico – City of Bradenton Beach
Intersection of 26th St. N. and Avenue C 3.4 6.7 8.1 10.9
Intersection of 17th St. N. and Gulf Dr. N. 3.5 7.0 8.6 11.6 Intersection of 13 Street S. and Gulf Dr. S. 3.4 7.3 8.9 12.0
Gulf of Mexico – City of Bradenton
Braden River 0.8 mile upstream from
State Highway
3.0 5.4 6.5 9.2
Manatee River 0.6 mile upstream from
Confluence with Braden
3.1 5.4 6.5 9.0
At State Highway 683 3.2 5.7 6.9 9.8
Palma Sola Bay At State Highway 64,
1.7 Miles west of Flamingo Road
3.8 7.0 8.4 11.0
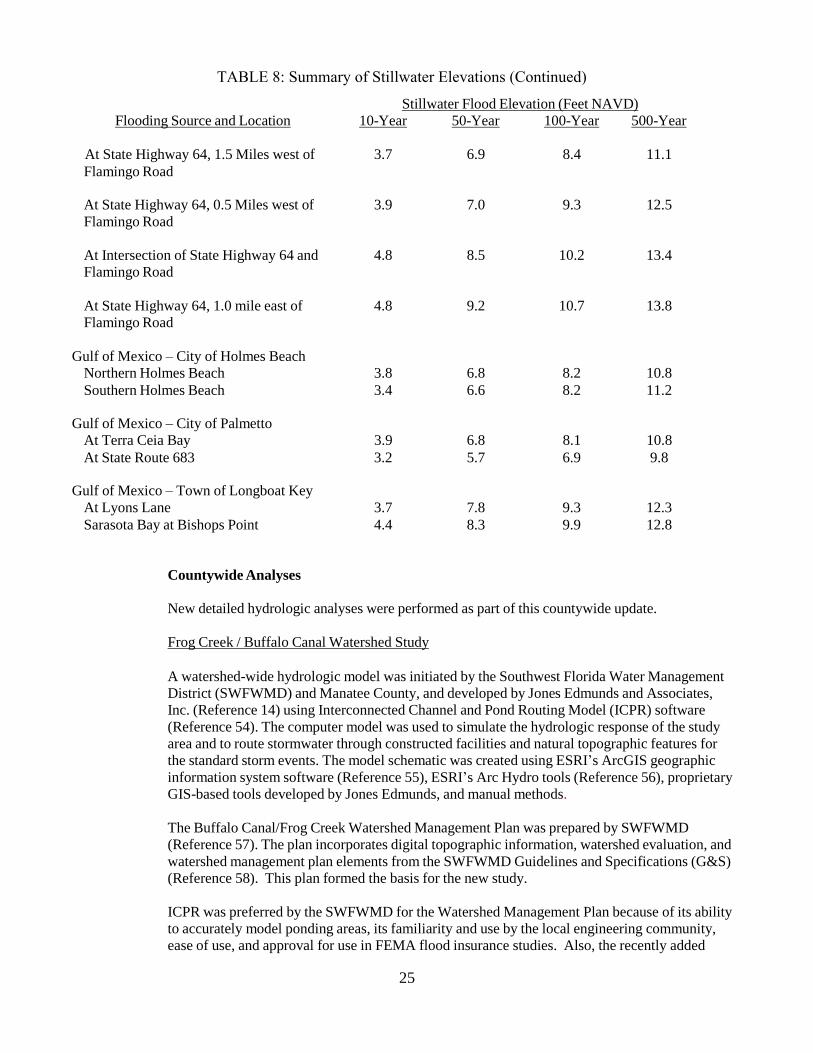
25
Stillwater Flood Elevation (Feet NAVD)
Flooding Source and Location
At State Highway 64, 1.5 Miles west of
10-Year
3.7
50-Year
6.9
100-Year
8.4
500-Year
11.1
Flamingo Road
At State Highway 64, 0.5 Miles west of
Flamingo Road
3.9 7.0 9.3 12.5
At Intersection of State Highway 64 and
Flamingo Road
4.8 8.5 10.2 13.4
At State Highway 64, 1.0 mile east of
Flamingo Road
4.8 9.2 10.7 13.8
Gulf of Mexico – City of Holmes Beach
Northern Holmes Beach 3.8 6.8 8.2 10.8
Southern Holmes Beach 3.4 6.6 8.2 11.2
Gulf of Mexico – City of Palmetto
At Terra Ceia Bay 3.9 6.8 8.1 10.8
At State Route 683 3.2 5.7 6.9 9.8
Gulf of Mexico – Town of Longboat Key
At Lyons Lane 3.7 7.8 9.3 12.3
Sarasota Bay at Bishops Point 4.4 8.3 9.9 12.8
Countywide Analyses
New detailed hydrologic analyses were performed as part of this countywide update.
Frog Creek / Buffalo Canal Watershed Study
A watershed-wide hydrologic model was initiated by the Southwest Florida Water Management
District (SWFWMD) and Manatee County, and developed by Jones Edmunds and Associates,
Inc. (Reference 14) using Interconnected Channel and Pond Routing Model (ICPR) software
(Reference 54). The computer model was used to simulate the hydrologic response of the study
area and to route stormwater through constructed facilities and natural topographic features for
the standard storm events. The model schematic was created using ESRI’s ArcGIS geographic
information system software (Reference 55), ESRI’s Arc Hydro tools (Reference 56), proprietary
GIS-based tools developed by Jones Edmunds, and manual methods.
The Buffalo Canal/Frog Creek Watershed Management Plan was prepared by SWFWMD
(Reference 57). The plan incorporates digital topographic information, watershed evaluation, and
watershed management plan elements from the SWFWMD Guidelines and Specifications (G&S)
(Reference 58). This plan formed the basis for the new study.
ICPR was preferred by the SWFWMD for the Watershed Management Plan because of its ability
to accurately model ponding areas, its familiarity and use by the local engineering community,
ease of use, and approval for use in FEMA flood insurance studies. Also, the recently added
TABLE 8: Summary of Stillwater Elevations (Continued)
26
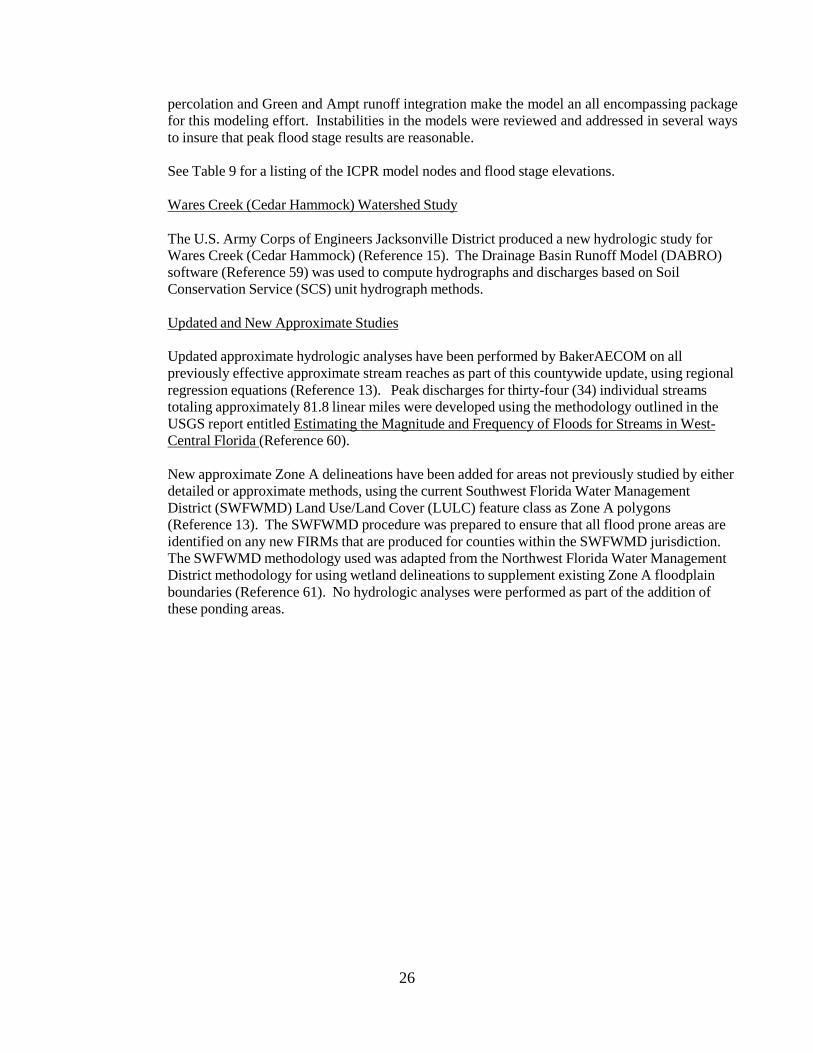
percolation and Green and Ampt runoff integration make the model an all encompassing package
for this modeling effort. Instabilities in the models were reviewed and addressed in several ways
to insure that peak flood stage results are reasonable.
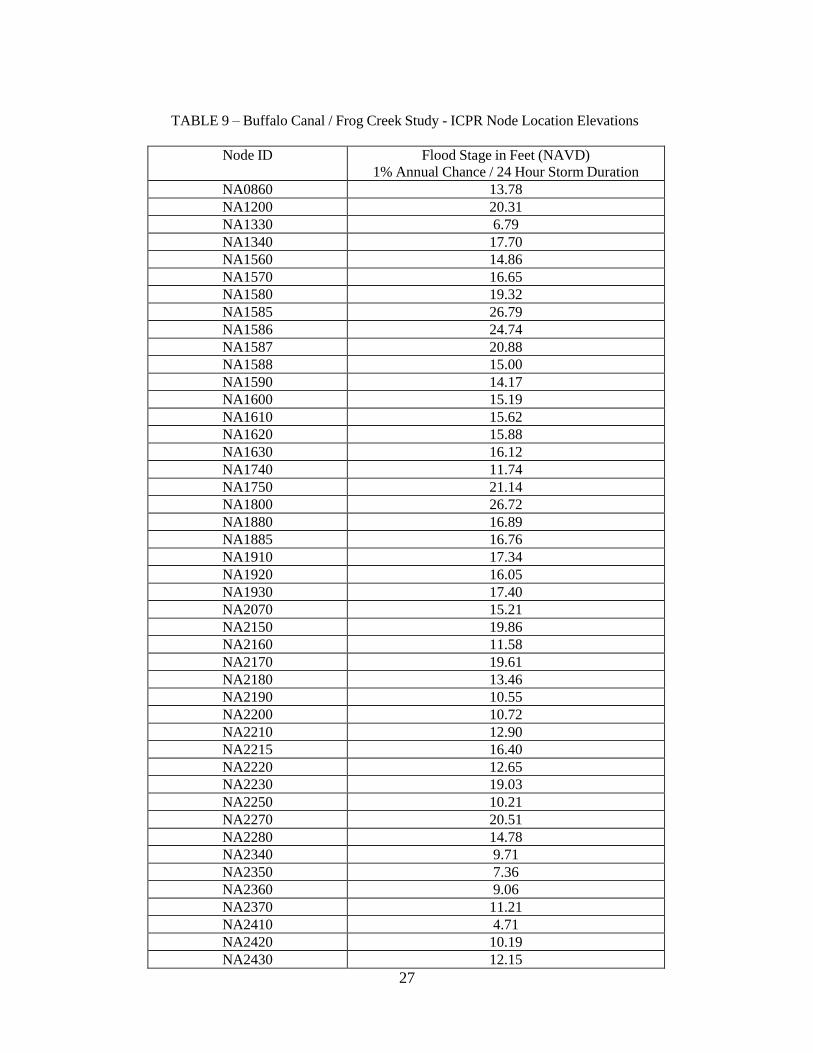
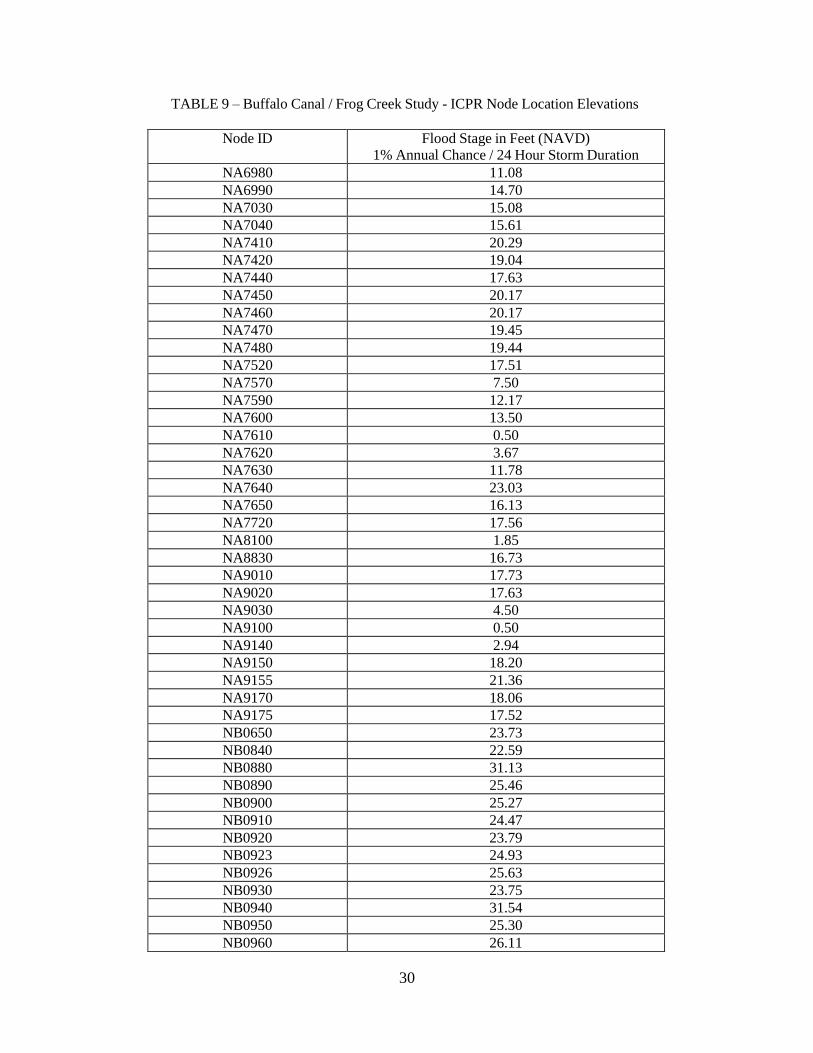
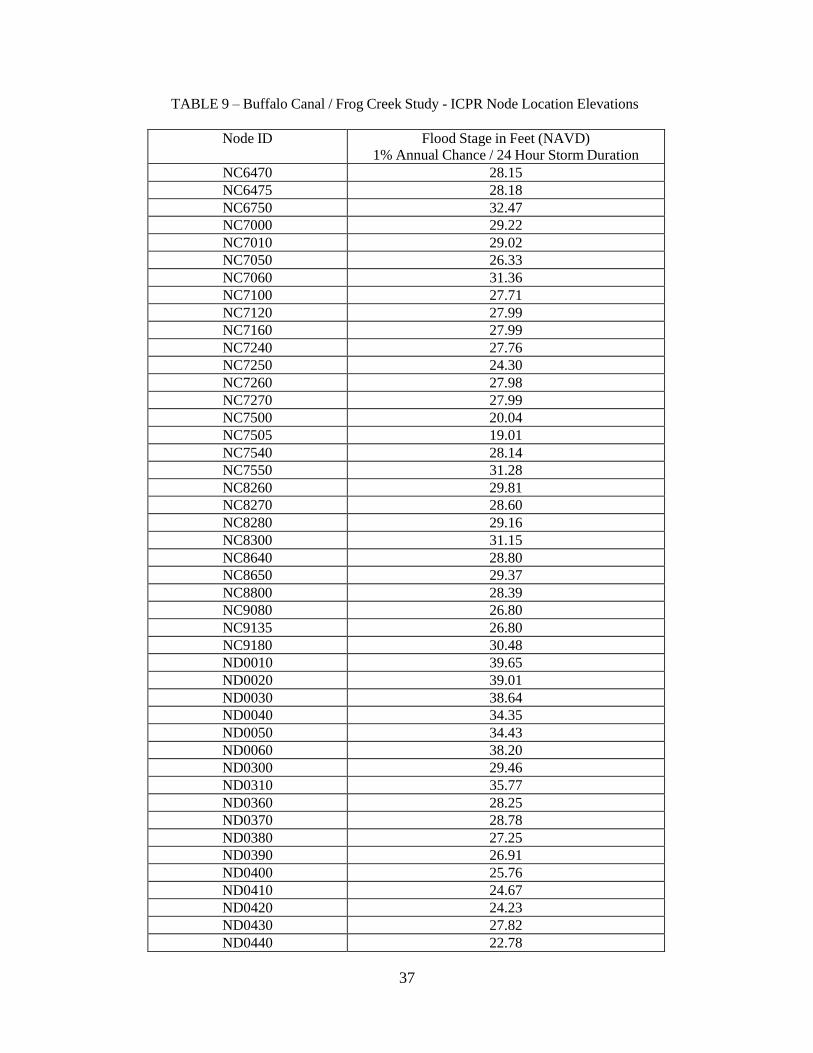
See Table 9 for a listing of the ICPR model nodes and flood stage elevations.
Wares Creek (Cedar Hammock) Watershed Study
The U.S. Army Corps of Engineers Jacksonville District produced a new hydrologic study for Wares Creek (Cedar Hammock) (Reference 15). The Drainage Basin Runoff Model (DABRO)
software (Reference 59) was used to compute hydrographs and discharges based on Soil
Conservation Service (SCS) unit hydrograph methods.
Updated and New Approximate Studies
Updated approximate hydrologic analyses have been performed by BakerAECOM on all
previously effective approximate stream reaches as part of this countywide update, using regional
regression equations (Reference 13). Peak discharges for thirty-four (34) individual streams
totaling approximately 81.8 linear miles were developed using the methodology outlined in the
USGS report entitled Estimating the Magnitude and Frequency of Floods for Streams in West-
Central Florida (Reference 60).
New approximate Zone A delineations have been added for areas not previously studied by either
detailed or approximate methods, using the current Southwest Florida Water Management
District (SWFWMD) Land Use/Land Cover (LULC) feature class as Zone A polygons
(Reference 13). The SWFWMD procedure was prepared to ensure that all flood prone areas are
identified on any new FIRMs that are produced for counties within the SWFWMD jurisdiction.
The SWFWMD methodology used was adapted from the Northwest Florida Water Management
District methodology for using wetland delineations to supplement existing Zone A floodplain
boundaries (Reference 61). No hydrologic analyses were performed as part of the addition of
these ponding areas.
27
TABLE 9 – Buffalo Canal / Frog Creek Study - ICPR Node Location Elevations
Node ID Flood Stage in Feet (NAVD)
1% Annual Chance / 24 Hour Storm Duration
NA0860 13.78
NA1200 20.31
NA1330 6.79
NA1340 17.70
NA1560 14.86
NA1570 16.65
NA1580 19.32
NA1585 26.79
NA1586 24.74
NA1587 20.88
NA1588 15.00
NA1590 14.17
NA1600 15.19
NA1610 15.62
NA1620 15.88
NA1630 16.12
NA1740 11.74
NA1750 21.14
NA1800 26.72
NA1880 16.89
NA1885 16.76
NA1910 17.34
NA1920 16.05
NA1930 17.40
NA2070 15.21
NA2150 19.86
NA2160 11.58
NA2170 19.61
NA2180 13.46
NA2190 10.55
NA2200 10.72
NA2210 12.90
NA2215 16.40
NA2220 12.65
NA2230 19.03
NA2250 10.21
NA2270 20.51
NA2280 14.78
NA2340 9.71
NA2350 7.36
NA2360 9.06
NA2370 11.21
NA2410 4.71
NA2420 10.19
NA2430 12.15

28
TABLE 9 – Buffalo Canal / Frog Creek Study - ICPR Node Location Elevations
Node ID Flood Stage in Feet (NAVD) 1% Annual Chance / 24 Hour Storm Duration
NA2435 12.75
NA2440 7.26
NA2450 4.61
NA2460 6.59
NA2470 5.98
NA2480 5.78
NA2490 6.05
NA2500 3.74
NA2510 6.98
NA2580 5.26
NA2590 4.13
NA2600 4.02
NA2610 3.54
NA2620 2.24
NA2630 0.72
NA2650 1.84
NA2655 3.32
NA2660 3.73
NA2670 1.91
NA2680 1.92
NA2690 2.04
NA2700 2.35
NA2710 2.35
NA2790 3.33
NA2800 0.66
NA2810 2.96
NA2820 11.70
NA2830 11.91
NA2930 11.47
NA2940 16.12
NA2950 17.37
NA2960 15.57
NA2970 15.80
NA2980 16.05
NA3140 0.50
NA3150 0.50
NA3160 2.02
NA3170 2.02
NA3210 19.63
NA3310 18.15
NA3370 12.07
NA3380 9.89
NA3390 11.53
NA3460 31.21
NA3610 19.40

29
TABLE 9 – Buffalo Canal / Frog Creek Study - ICPR Node Location Elevations
Node ID Flood Stage in Feet (NAVD) 1% Annual Chance / 24 Hour Storm Duration
NA3940 8.64
NA4265 14.43
NA4270 12.56
NA5430 0.50
NA5440 8.16
NA5450 0.50
NA5460 3.84
NA5470 3.51
NA5480 5.39
NA5490 0.50
NA5500 4.13
NA5510 4.50
NA5520 9.50
NA5530 10.74
NA5540 7.07
NA5550 9.43
NA5580 5.78
NA5590 5.78
NA5600 12.43
NA5790 14.12
NA5800 14.12
NA5810 17.16
NA5970 13.56
NA5980 14.50
NA5985 15.37
NA6090 19.35
NA6120 16.13
NA6180 14.82
NA6190 18.92
NA6200 17.60
NA6205 18.14
NA6210 11.61
NA6220 21.73
NA6250 13.41
NA6270 16.38
NA6280 11.58
NA6290 12.19
NA6300 15.18
NA6710 16.86
NA6860 13.39
NA6870 7.20
NA6960 13.07
NA6965 17.38
NA6970 11.75
NA6975 11.81
30
TABLE 9 – Buffalo Canal / Frog Creek Study - ICPR Node Location Elevations
Node ID Flood Stage in Feet (NAVD) 1% Annual Chance / 24 Hour Storm Duration
NA6980 11.08
NA6990 14.70
NA7030 15.08
NA7040 15.61
NA7410 20.29
NA7420 19.04
NA7440 17.63
NA7450 20.17
NA7460 20.17
NA7470 19.45
NA7480 19.44
NA7520 17.51
NA7570 7.50
NA7590 12.17
NA7600 13.50
NA7610 0.50
NA7620 3.67
NA7630 11.78
NA7640 23.03
NA7650 16.13
NA7720 17.56
NA8100 1.85
NA8830 16.73
NA9010 17.73
NA9020 17.63
NA9030 4.50
NA9100 0.50
NA9140 2.94
NA9150 18.20
NA9155 21.36
NA9170 18.06
NA9175 17.52
NB0650 23.73
NB0840 22.59
NB0880 31.13
NB0890 25.46
NB0900 25.27
NB0910 24.47
NB0920 23.79
NB0923 24.93
NB0926 25.63
NB0930 23.75
NB0940 31.54
NB0950 25.30
NB0960 26.11

31
TABLE 9 – Buffalo Canal / Frog Creek Study - ICPR Node Location Elevations
Node ID Flood Stage in Feet (NAVD) 1% Annual Chance / 24 Hour Storm Duration
NB0970 31.64
NB0980 33.29
NB0990 32.61
NB1000 29.00
NB1010 32.25
NB1020 25.75
NB1210 27.58
NB1220 35.00
NB1230 33.05
NB1240 29.40
NB1260 23.88
NB1270 23.51
NB1280 23.33
NB1290 22.78
NB1300 23.51
NB1310 29.51
NB1320 22.66
NB1350 22.44
NB1360 29.35
NB1370 22.63
NB1380 22.43
NB1400 22.41
NB1760 19.28
NB1770 23.34
NB1780 22.35
NB1790 22.32
NB1820 22.12
NB1890 27.53
NB1950 20.65
NB1960 15.68
NB1970 17.94
NB1980 24.02
NB1990 30.81
NB2000 26.05
NB2010 30.34
NB2020 26.64
NB2030 26.80
NB2040 23.28
NB2050 20.84
NB2060 20.15
NB2110 25.38
NB2235 20.90
NB2236 20.89
NB2237 21.12
NB2240 19.75

32
TABLE 9 – Buffalo Canal / Frog Creek Study - ICPR Node Location Elevations
Node ID Flood Stage in Feet (NAVD) 1% Annual Chance / 24 Hour Storm Duration
NB2260 10.09
NB2290 22.61
NB2300 12.03
NB2310 13.74
NB2320 14.76
NB2330 11.26
NB2530 33.46
NB2560 12.10
NB2570 14.69
NB2720 24.88
NB2730 24.08
NB2735 24.45
NB3040 22.25
NB3070 26.86
NB3180 22.12
NB3260 21.55
NB3320 30.44
NB3400 12.11
NB3490 22.41
NB3500 31.22
NB3510 31.14
NB3690 30.52
NB4060 17.96
NB4070 26.67
NB4080 20.09
NB4180 23.51
NB4400 26.55
NB5570 29.81
NB5610 18.33
NB5700 23.67
NB5720 24.73
NB5730 24.51
NB5740 27.00
NB5750 25.51
NB5760 28.10
NB5770 23.93
NB5780 22.48
NB5820 27.86
NB5830 30.76
NB5840 30.76
NB5850 30.16
NB5860 25.54
NB5870 24.70
NB5880 27.20
NB5890 25.79

33
TABLE 9 – Buffalo Canal / Frog Creek Study - ICPR Node Location Elevations
Node ID Flood Stage in Feet (NAVD) 1% Annual Chance / 24 Hour Storm Duration
NB5900 22.42
NB5910 22.41
NB5920 31.54
NB5930 28.30
NB5940 31.72
NB5950 28.50
NB5960 23.18
NB6310 30.47
NB6315 30.92
NB6320 18.35
NB6330 20.65
NB6340 18.61
NB6350 22.04
NB6360 22.03
NB6370 22.03
NB6380 21.07
NB6390 21.01
NB6400 25.70
NB6410 17.27
NB6420 30.80
NB6430 31.70
NB6440 30.92
NB6450 30.13
NB6630 22.38
NB6640 22.34
NB6650 27.38
NB6720 23.12
NB6730 24.73
NB6740 27.24
NB6820 23.57
NB6830 29.90
NB6840 27.51
NB6850 28.62
NB6880 30.22
NB6900 25.96
NB6910 23.44
NB6920 24.88
NB7290 22.41
NB7295 22.86
NB7300 24.87
NB7380 22.43
NB7390 22.53
NB7400 22.52
NB7405 24.03
NB7490 25.96

34
TABLE 9 – Buffalo Canal / Frog Creek Study - ICPR Node Location Elevations
Node ID Flood Stage in Feet (NAVD) 1% Annual Chance / 24 Hour Storm Duration
NB7580 22.68
NB7680 22.47
NB7700 25.38
NB7710 23.91
NB7810 18.78
NB7880 24.35
NB7885 23.33
NB8040 23.46
NB8090 22.24
NB8120 27.78
NB8150 25.53
NB8160 27.53
NB8170 31.13
NB8200 24.10
NB8210 22.07
NB8220 28.37
NB8230 24.13
NB8240 23.78
NB8310 21.13
NB8380 20.91
NB8500 24.33
NB8510 24.18
NB8520 25.60
NB8530 24.88
NB8540 24.14
NB8550 24.12
NB8560 24.04
NB8570 23.90
NB8580 25.97
NB8590 24.94
NB8600 24.33
NB8610 24.34
NB8620 26.47
NB8860 25.90
NB8870 25.77
NB8880 24.50
NB8890 23.04
NB9000 22.05
NB9120 31.63
NB9145 24.44
NC0350 31.06
NC0580 28.52
NC0790 29.27
NC0800 27.99
NC0810 28.03

35
TABLE 9 – Buffalo Canal / Frog Creek Study - ICPR Node Location Elevations
Node ID Flood Stage in Feet (NAVD) 1% Annual Chance / 24 Hour Storm Duration
NC1060 17.82
NC1410 28.55
NC1415 29.53
NC1430 28.63
NC1440 29.55
NC1450 29.94
NC1455 29.37
NC1460 28.11
NC1470 29.75
NC1475 29.93
NC1480 30.35
NC1490 30.58
NC1500 30.68
NC1510 27.57
NC1520 27.04
NC1530 27.84
NC1540 25.50
NC1550 26.74
NC1670 31.02
NC1675 31.59
NC1690 31.14
NC1700 28.31
NC1705 26.95
NC1710 16.86
NC2990 22.00
NC3000 16.84
NC3090 30.47
NC3100 29.23
NC3190 31.64
NC3270 32.67
NC3280 31.02
NC3290 32.91
NC3850 29.88
NC3950 29.70
NC4090 27.73
NC4290 28.43
NC4310 27.83
NC4350 31.06
NC4360 28.14
NC4410 26.18
NC4420 32.22
NC4470 27.93
NC4480 26.74
NC4720 22.90
NC4730 27.97

36
TABLE 9 – Buffalo Canal / Frog Creek Study - ICPR Node Location Elevations
Node ID Flood Stage in Feet (NAVD) 1% Annual Chance / 24 Hour Storm Duration
NC4740 28.02
NC4750 27.51
NC4760 27.48
NC4770 27.49
NC4774 28.28
NC4775 28.14
NC4780 28.14
NC4790 28.16
NC4800 27.27
NC4810 27.86
NC5050 27.99
NC5060 27.99
NC5070 28.10
NC5080 24.80
NC5090 28.95
NC5100 29.18
NC5110 28.60
NC5120 29.43
NC5130 28.04
NC5135 28.06
NC5140 30.88
NC5150 28.09
NC5160 28.09
NC5170 27.88
NC5180 29.31
NC5200 28.94
NC5210 27.02
NC5220 32.68
NC5270 30.60
NC5280 16.72
NC5285 21.79
NC5300 29.10
NC5310 26.09
NC5320 26.08
NC5330 28.25
NC5335 29.39
NC5336 28.44
NC5340 27.83
NC5345 27.84
NC5350 26.90
NC5640 28.21
NC5645 28.31
NC5650 28.16
NC5660 28.17
NC6460 28.41
37
TABLE 9 – Buffalo Canal / Frog Creek Study - ICPR Node Location Elevations
Node ID Flood Stage in Feet (NAVD) 1% Annual Chance / 24 Hour Storm Duration
NC6470 28.15
NC6475 28.18
NC6750 32.47
NC7000 29.22
NC7010 29.02
NC7050 26.33
NC7060 31.36
NC7100 27.71
NC7120 27.99
NC7160 27.99
NC7240 27.76
NC7250 24.30
NC7260 27.98
NC7270 27.99
NC7500 20.04
NC7505 19.01
NC7540 28.14
NC7550 31.28
NC8260 29.81
NC8270 28.60
NC8280 29.16
NC8300 31.15
NC8640 28.80
NC8650 29.37
NC8800 28.39
NC9080 26.80
NC9135 26.80
NC9180 30.48
ND0010 39.65
ND0020 39.01
ND0030 38.64
ND0040 34.35
ND0050 34.43
ND0060 38.20
ND0300 29.46
ND0310 35.77
ND0360 28.25
ND0370 28.78
ND0380 27.25
ND0390 26.91
ND0400 25.76
ND0410 24.67
ND0420 24.23
ND0430 27.82
ND0440 22.78
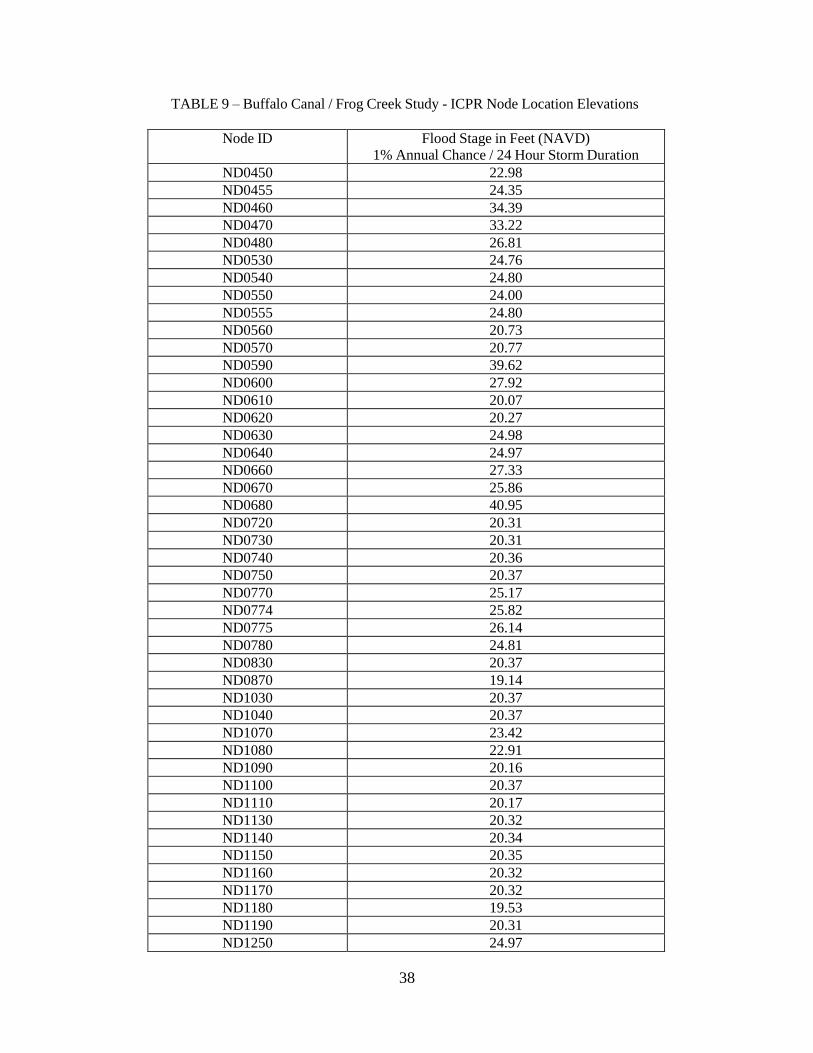
38
TABLE 9 – Buffalo Canal / Frog Creek Study - ICPR Node Location Elevations
Node ID Flood Stage in Feet (NAVD) 1% Annual Chance / 24 Hour Storm Duration
ND0450 22.98
ND0455 24.35
ND0460 34.39
ND0470 33.22
ND0480 26.81
ND0530 24.76
ND0540 24.80
ND0550 24.00
ND0555 24.80
ND0560 20.73
ND0570 20.77
ND0590 39.62
ND0600 27.92
ND0610 20.07
ND0620 20.27
ND0630 24.98
ND0640 24.97
ND0660 27.33
ND0670 25.86
ND0680 40.95
ND0720 20.31
ND0730 20.31
ND0740 20.36
ND0750 20.37
ND0770 25.17
ND0774 25.82
ND0775 26.14
ND0780 24.81
ND0830 20.37
ND0870 19.14
ND1030 20.37
ND1040 20.37
ND1070 23.42
ND1080 22.91
ND1090 20.16
ND1100 20.37
ND1110 20.17
ND1130 20.32
ND1140 20.34
ND1150 20.35
ND1160 20.32
ND1170 20.32
ND1180 19.53
ND1190 20.31
ND1250 24.97

39
TABLE 9 – Buffalo Canal / Frog Creek Study - ICPR Node Location Elevations
Node ID Flood Stage in Feet (NAVD) 1% Annual Chance / 24 Hour Storm Duration
ND1640 16.34
ND1650 16.49
ND1660 16.26
ND1680 20.93
ND1720 22.67
ND1730 22.44
ND1810 20.34
ND1830 22.44
ND1840 24.22
ND1850 22.46
ND1860 18.94
ND1865 19.04
ND1870 22.28
ND1940 20.31
ND2080 26.01
ND2090 24.59
ND2100 19.83
ND2115 20.25
ND2120 21.17
ND2130 20.34
ND2380 20.24
ND2520 21.74
ND2540 35.79
ND2550 34.69
ND2740 17.36
ND2750 17.99
ND2760 16.82
ND2900 26.30
ND2910 30.86
ND3010 20.33
ND3020 21.42
ND3030 38.67
ND3080 23.53
ND3110 25.41
ND3120 23.06
ND3130 19.94
ND3200 20.00
ND3220 20.35
ND3230 23.46
ND3240 29.27
ND3300 22.07
ND3330 22.85
ND3340 16.70
ND3350 17.77
ND3360 17.51

40
TABLE 9 – Buffalo Canal / Frog Creek Study - ICPR Node Location Elevations
Node ID Flood Stage in Feet (NAVD) 1% Annual Chance / 24 Hour Storm Duration
ND3410 37.89
ND3420 36.73
ND3430 32.73
ND3440 35.28
ND3450 31.20
ND3470 33.18
ND3480 20.27
ND3530 39.75
ND3540 38.06
ND3550 30.61
ND3560 27.45
ND3570 36.50
ND3580 29.89
ND3590 19.55
ND3620 23.38
ND3670 27.90
ND3680 27.83
ND3700 30.59
ND3710 34.63
ND3720 34.95
ND3730 34.35
ND3740 23.77
ND3750 20.37
ND3760 37.95
ND3770 23.22
ND3780 23.75
ND3790 21.18
ND3800 23.21
ND3810 20.37
ND3820 20.37
ND3830 27.81
ND3860 20.88
ND3870 21.00
ND3880 21.19
ND3890 20.37
ND3900 20.80
ND3910 21.20
ND3920 20.37
ND3960 17.81
ND3970 20.37
ND3980 21.20
ND3990 21.20
ND4000 21.27
ND4010 25.90
ND4020 23.78

41
TABLE 9 – Buffalo Canal / Frog Creek Study - ICPR Node Location Elevations
Node ID Flood Stage in Feet (NAVD) 1% Annual Chance / 24 Hour Storm Duration
ND4030 30.07
ND4050 31.88
ND4130 21.00
ND4140 20.90
ND4150 25.04
ND4160 22.94
ND4170 20.45
ND4220 22.64
ND4260 26.67
ND4370 22.01
ND4380 17.90
ND4390 21.89
ND4460 19.26
ND4490 26.67
ND4500 20.34
ND4510 20.32
ND4520 20.29
ND4530 20.29
ND4540 20.28
ND4550 20.29
ND4560 20.28
ND4570 20.22
ND4580 20.22
ND4590 20.08
ND4600 20.28
ND4610 20.28
ND4620 19.68
ND4640 21.40
ND4650 22.80
ND4660 19.80
ND4900 20.08
ND5000 27.20
ND5230 31.15
ND5240 30.27
ND5245 29.93
ND5250 26.43
ND5260 30.91
ND5290 16.71
ND5360 16.81
ND5370 17.01
ND5380 16.79
ND5390 22.94
ND5400 20.26
ND5410 19.55
ND5420 19.68

42
TABLE 9 – Buffalo Canal / Frog Creek Study - ICPR Node Location Elevations
Node ID Flood Stage in Feet (NAVD) 1% Annual Chance / 24 Hour Storm Duration
ND5620 23.71
ND5630 23.71
ND5680 24.15
ND5690 25.87
ND6070 16.55
ND6080 16.47
ND6100 16.26
ND6110 16.26
ND6130 17.96
ND6140 17.60
ND6150 17.09
ND6155 22.68
ND6160 16.69
ND6170 16.64
ND6560 18.14
ND6570 30.31
ND6575 35.02
ND6580 34.54
ND6590 19.31
ND6600 20.28
ND6605 20.45
ND6610 18.94
ND6620 19.48
ND6660 17.71
ND6670 17.69
ND6680 20.25
ND6690 26.23
ND6760 17.78
ND6770 19.98
ND6780 24.46
ND6790 23.13
ND6800 34.56
ND6890 39.97
ND6930 32.91
ND6940 31.71
ND6950 31.21
ND7280 19.28
ND7310 25.81
ND7330 20.51
ND7340 22.14
ND7345 22.46
ND7350 22.43
ND7360 22.15
ND7370 22.43
ND7430 21.03

43
TABLE 9 – Buffalo Canal / Frog Creek Study - ICPR Node Location Elevations
Node ID Flood Stage in Feet (NAVD) 1% Annual Chance / 24 Hour Storm Duration
ND7435 21.04
ND7690 23.71
ND7750 26.10
ND7760 28.27
ND7780 39.68
ND7790 39.65
ND7800 38.50
ND7820 22.00
ND7830 20.72
ND7840 20.34
ND7850 20.34
ND7860 17.54
ND7865 17.64
ND7870 17.69
ND7890 27.04
ND7900 26.81
ND7910 21.47
ND7920 22.48
ND8020 32.62
ND8030 36.40
ND8110 34.60
ND8250 20.37
ND8290 20.43
ND8320 20.32
ND8330 20.50
ND8340 20.31
ND8350 35.25
ND8360 34.55
ND8390 25.96
ND8400 20.37
ND8410 20.37
ND8420 20.37
ND8430 22.61
ND8440 20.33
ND8450 23.56
ND8460 25.18
ND8470 22.60
ND8480 20.31
ND8720 20.36
ND8730 23.18
ND8740 23.16
ND8750 20.27
ND8760 20.26
ND8780 30.87
ND8790 32.51

44
TABLE 9 – Buffalo Canal / Frog Creek Study - ICPR Node Location Elevations
Node ID Flood Stage in Feet (NAVD) 1% Annual Chance / 24 Hour Storm Duration
ND8795 32.42
ND9070 22.14
ND9105 23.11
ND9110 22.91
ND9115 23.94
ND9130 20.61
ND9160 25.83
ND9165 25.77
NE0070 36.75
NE0080 35.13
NE0090 34.92
NE0100 35.96
NE0110 35.71
NE0120 36.33
NE0125 36.28
NE0130 35.79
NE0135 35.70
NE0140 39.52
NE0150 39.58
NE0160 38.65
NE0170 26.87
NE0180 25.55
NE0190 25.28
NE0200 25.27
NE0210 25.03
NE0220 25.05
NE0230 25.20
NE0240 25.27
NE0245 26.23
NE0250 33.76
NE0260 32.53
NE0270 33.93
NE0280 34.15
NE0290 34.09
NE0295 36.64
NE0320 39.99
NE0325 39.10
NE0326 42.64
NE0330 33.21
NE0340 32.66
NE0490 35.19
NE0500 25.96
NE0510 25.03
NE0520 26.67
NE0690 24.77

45
TABLE 9 – Buffalo Canal / Frog Creek Study - ICPR Node Location Elevations
Node ID Flood Stage in Feet (NAVD) 1% Annual Chance / 24 Hour Storm Duration
NE0700 22.35
NE0710 32.68
NE0760 35.87
NE0763 35.22
NE0766 35.58
NE0820 21.59
NE0850 38.20
NE1050 25.34
NE1120 20.55
NE1390 42.20
NE1900 40.49
NE2140 36.63
NE2400 35.16
NE2770 26.55
NE2780 26.75
NE2840 26.83
NE2850 25.19
NE2860 32.03
NE2870 27.77
NE2875 27.96
NE2880 20.86
NE2890 27.74
NE2920 34.85
NE3050 32.38
NE3060 32.65
NE3065 33.11
NE3250 22.15
NE3520 24.61
NE3600 35.47
NE3605 35.48
NE3630 40.50
NE3640 35.89
NE3645 41.23
NE3650 35.68
NE3660 35.36
NE3840 30.78
NE4040 26.89
NE4100 37.51
NE4110 35.14
NE4120 41.34
NE4190 41.54
NE4200 39.44
NE4210 38.64
NE4230 27.50
NE4240 29.33
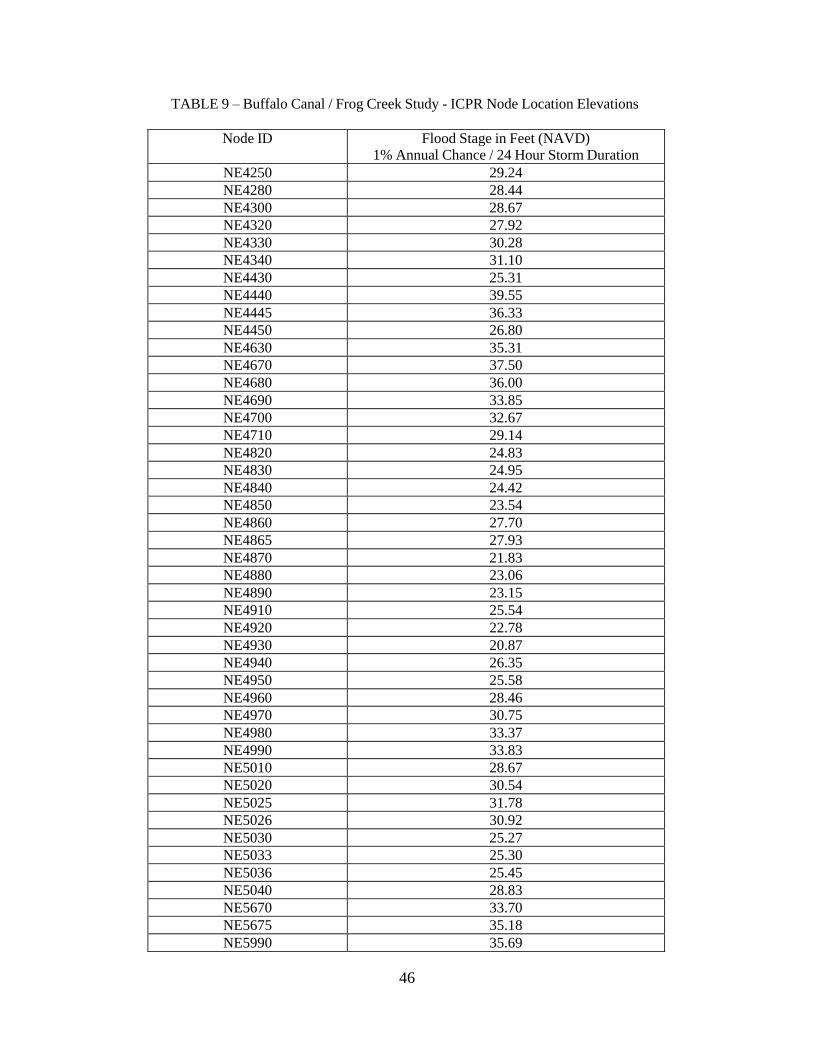
46
TABLE 9 – Buffalo Canal / Frog Creek Study - ICPR Node Location Elevations
Node ID Flood Stage in Feet (NAVD)
1% Annual Chance / 24 Hour Storm Duration
NE4250 29.24
NE4280 28.44
NE4300 28.67
NE4320 27.92
NE4330 30.28
NE4340 31.10
NE4430 25.31
NE4440 39.55
NE4445 36.33
NE4450 26.80
NE4630 35.31
NE4670 37.50
NE4680 36.00
NE4690 33.85
NE4700 32.67
NE4710 29.14
NE4820 24.83
NE4830 24.95
NE4840 24.42
NE4850 23.54
NE4860 27.70
NE4865 27.93
NE4870 21.83
NE4880 23.06
NE4890 23.15
NE4910 25.54
NE4920 22.78
NE4930 20.87
NE4940 26.35
NE4950 25.58
NE4960 28.46
NE4970 30.75
NE4980 33.37
NE4990 33.83
NE5010 28.67
NE5020 30.54
NE5025 31.78
NE5026 30.92
NE5030 25.27
NE5033 25.30
NE5036 25.45
NE5040 28.83
NE5670 33.70
NE5675 35.18
NE5990 35.69
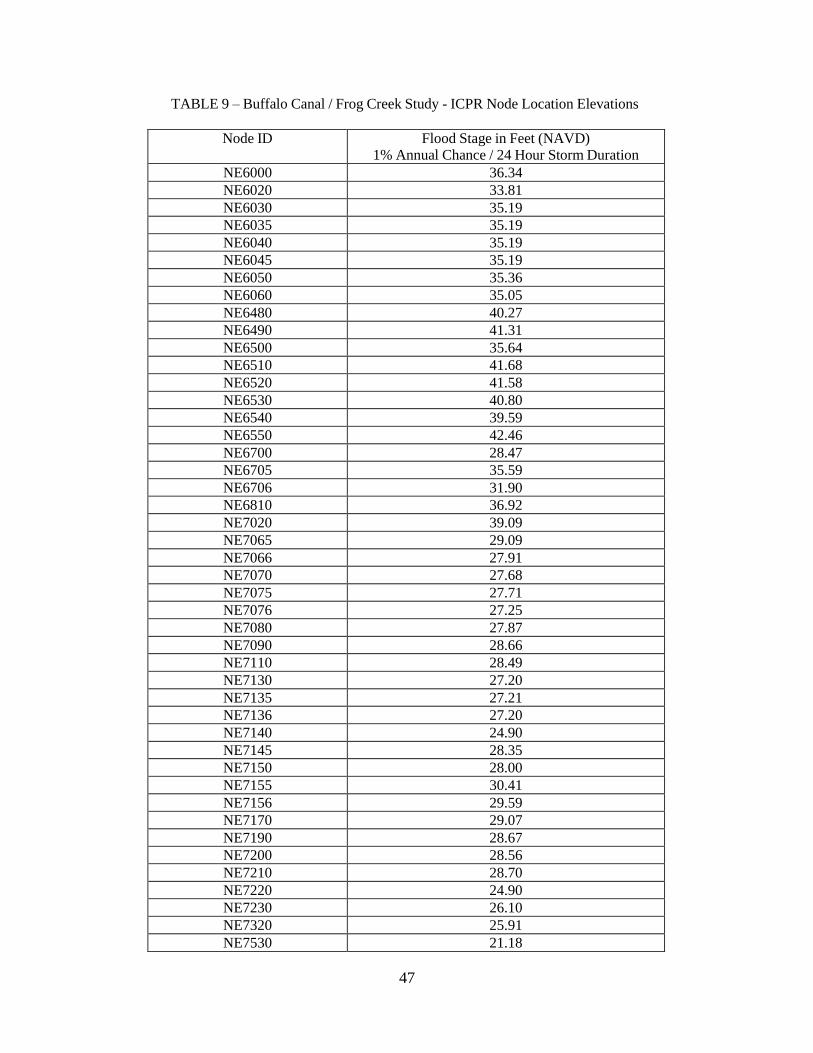
47
TABLE 9 – Buffalo Canal / Frog Creek Study - ICPR Node Location Elevations
Node ID Flood Stage in Feet (NAVD) 1% Annual Chance / 24 Hour Storm Duration
NE6000 36.34
NE6020 33.81
NE6030 35.19
NE6035 35.19
NE6040 35.19
NE6045 35.19
NE6050 35.36
NE6060 35.05
NE6480 40.27
NE6490 41.31
NE6500 35.64
NE6510 41.68
NE6520 41.58
NE6530 40.80
NE6540 39.59
NE6550 42.46
NE6700 28.47
NE6705 35.59
NE6706 31.90
NE6810 36.92
NE7020 39.09
NE7065 29.09
NE7066 27.91
NE7070 27.68
NE7075 27.71
NE7076 27.25
NE7080 27.87
NE7090 28.66
NE7110 28.49
NE7130 27.20
NE7135 27.21
NE7136 27.20
NE7140 24.90
NE7145 28.35
NE7150 28.00
NE7155 30.41
NE7156 29.59
NE7170 29.07
NE7190 28.67
NE7200 28.56
NE7210 28.70
NE7220 24.90
NE7230 26.10
NE7320 25.91
NE7530 21.18
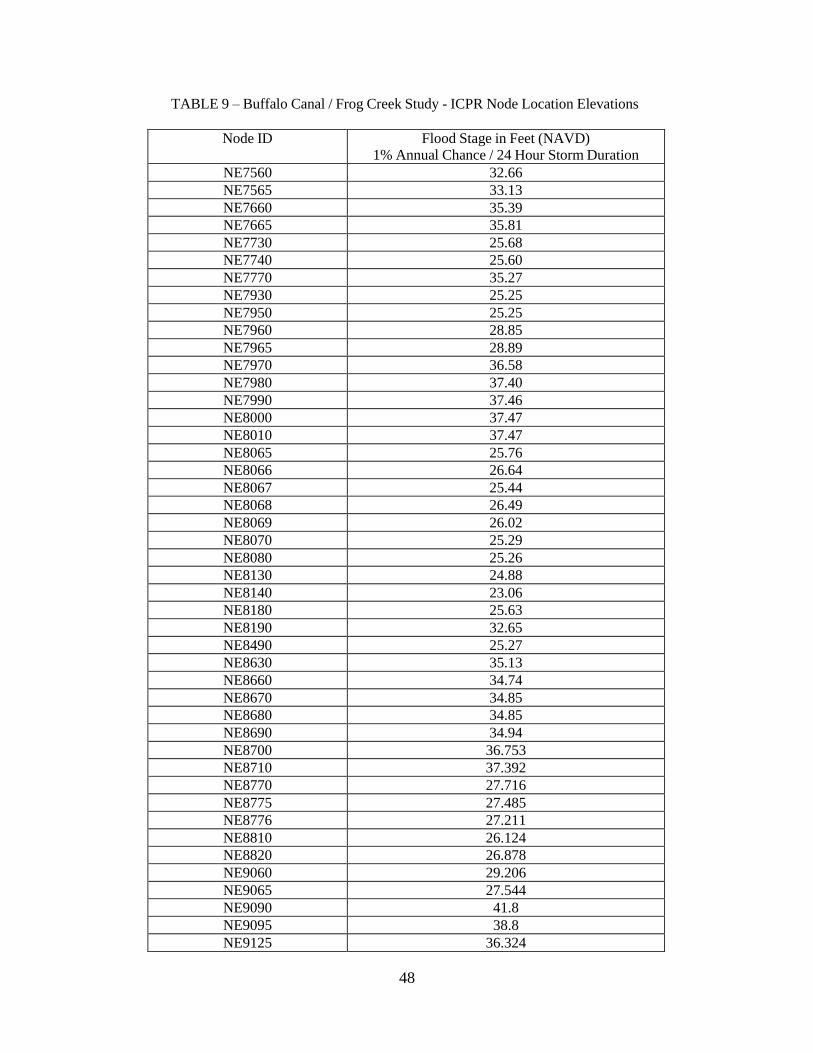
48
TABLE 9 – Buffalo Canal / Frog Creek Study - ICPR Node Location Elevations
Node ID Flood Stage in Feet (NAVD) 1% Annual Chance / 24 Hour Storm Duration
NE7560 32.66
NE7565 33.13
NE7660 35.39
NE7665 35.81
NE7730 25.68
NE7740 25.60
NE7770 35.27
NE7930 25.25
NE7950 25.25
NE7960 28.85
NE7965 28.89
NE7970 36.58
NE7980 37.40
NE7990 37.46
NE8000 37.47
NE8010 37.47
NE8065 25.76
NE8066 26.64
NE8067 25.44
NE8068 26.49
NE8069 26.02
NE8070 25.29
NE8080 25.26
NE8130 24.88
NE8140 23.06
NE8180 25.63
NE8190 32.65
NE8490 25.27
NE8630 35.13
NE8660 34.74
NE8670 34.85
NE8680 34.85
NE8690 34.94
NE8700 36.753
NE8710 37.392
NE8770 27.716
NE8775 27.485
NE8776 27.211
NE8810 26.124
NE8820 26.878
NE9060 29.206
NE9065 27.544
NE9090 41.8
NE9095 38.8
NE9125 36.324
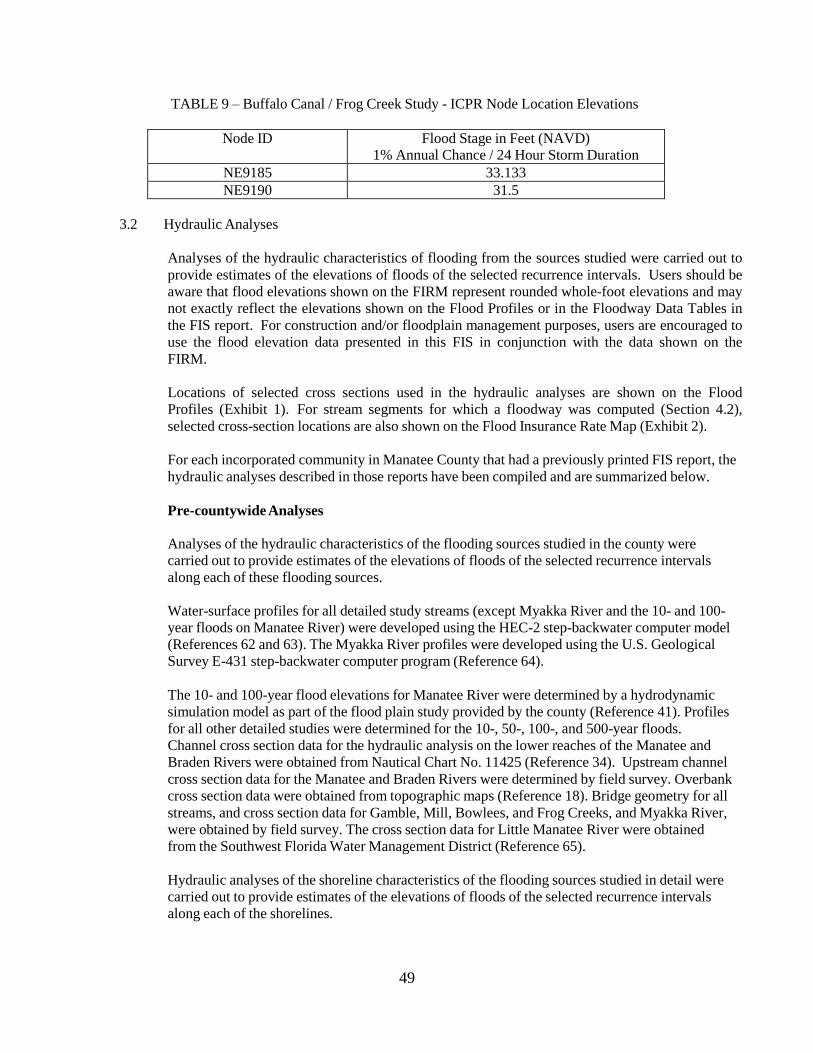
49
TABLE 9 – Buffalo Canal / Frog Creek Study - ICPR Node Location Elevations
Node ID Flood Stage in Feet (NAVD) 1% Annual Chance / 24 Hour Storm Duration
NE9185 33.133
NE9190 31.5
3.2 Hydraulic Analyses
Analyses of the hydraulic characteristics of flooding from the sources studied were carried out to
provide estimates of the elevations of floods of the selected recurrence intervals. Users should be
aware that flood elevations shown on the FIRM represent rounded whole-foot elevations and may
not exactly reflect the elevations shown on the Flood Profiles or in the Floodway Data Tables in
the FIS report. For construction and/or floodplain management purposes, users are encouraged to
use the flood elevation data presented in this FIS in conjunction with the data shown on the
FIRM.
Locations of selected cross sections used in the hydraulic analyses are shown on the Flood
Profiles (Exhibit 1). For stream segments for which a floodway was computed (Section 4.2),
selected cross-section locations are also shown on the Flood Insurance Rate Map (Exhibit 2).
For each incorporated community in Manatee County that had a previously printed FIS report, the
hydraulic analyses described in those reports have been compiled and are summarized below.
Pre-countywide Analyses
Analyses of the hydraulic characteristics of the flooding sources studied in the county were
carried out to provide estimates of the elevations of floods of the selected recurrence intervals
along each of these flooding sources.
Water-surface profiles for all detailed study streams (except Myakka River and the 10- and 100-
year floods on Manatee River) were developed using the HEC-2 step-backwater computer model
(References 62 and 63). The Myakka River profiles were developed using the U.S. Geological
Survey E-431 step-backwater computer program (Reference 64).
The 10- and 100-year flood elevations for Manatee River were determined by a hydrodynamic
simulation model as part of the flood plain study provided by the county (Reference 41). Profiles
for all other detailed studies were determined for the 10-, 50-, 100-, and 500-year floods.
Channel cross section data for the hydraulic analysis on the lower reaches of the Manatee and
Braden Rivers were obtained from Nautical Chart No. 11425 (Reference 34). Upstream channel
cross section data for the Manatee and Braden Rivers were determined by field survey. Overbank
cross section data were obtained from topographic maps (Reference 18). Bridge geometry for all
streams, and cross section data for Gamble, Mill, Bowlees, and Frog Creeks, and Myakka River,
were obtained by field survey. The cross section data for Little Manatee River were obtained
from the Southwest Florida Water Management District (Reference 65).
Hydraulic analyses of the shoreline characteristics of the flooding sources studied in detail were
carried out to provide estimates of the elevations of floods of the selected recurrence intervals
along each of the shorelines.
50
Locations of selected cross sections used in the hydraulic analyses are shown on the Flood Profiles (Exhibit 1). For stream segments for which a floodway is computed (Section 4.2),
selected cross section locations are also shown on the Flood Boundary and Floodway Map
(Exhibit 2).
Roughness coefficients (Manning's "n") were determined from aerial photographs (Reference 33)
and then further refined by calibrating the HEC-2 model against high-water marks. Manning's "n"
values ranged from 0.020 to 0.080 for the channel and from 0.080 to 0.250 for the overbanks.
Roughness coefficients for the Myakka and Manatee Rivers and were estimated for each subarea
of each channel cross section. Coefficients were varied with depth and represent average
roughness across the subarea. Aerial photographs, streamflow records, and field survey data were
used in estimating coefficients.
Starting water-surface elevations were determined from normal depth calculations for Gamble
and Mill Creeks and from mean high tide for all other streams.
The baseline used for horizontal control on portions of Braden River was obtained by field
survey.
Flood profiles were drawn showing computed water-surface elevations to an accuracy of 0.5 foot
for floods of the selected recurrence intervals (Exhibit 1).
Floods resulting from overland rainfall flow were determined, an estimate of rainfall excess was
made, and the areas where runoff would accumulate were determined. This type of flooding,
where the depth is less than 1 foot, is classified as shaded Zone X.
Water-surface elevations for areas of approximate study were determined using engineering
judgment and normal depth calculations.
The hydraulic analyses for this study were based on unobstructed flow. The flood elevations
shown on the profiles are, thus, considered valid only if hydraulic structures remain unobstructed,
operate properly, and do not fail.
1992 Effective FIS Revisions to Hydraulic Analyses
For the 1992 effective FIS study revisions, elevation and structural geometry data for bridges,
culverts, and dams were obtained from field surveys. Most cross sections were obtained from
field surveys. Other cross sections for portions of the Braden River, cabbage Slough, and Buffalo
canal were provided by the SWFWMD (Reference 52).
Revised roughness coefficients (Manning's "n" ) used in the 1992 hydraulic computations were
selected on the basis of field observations, aerial photos, and photographs of the streams and
flood plain areas. Channel "n" values ranged from 0.02 to 0.07, and overbank "n" values ranged
from 0.05 to 0.15.
Revised water-surface elevations of streams of the selected recurrence intervals were computed
using the HEC-2 step-backwater computer program (Reference 67). Starting water-surface
elevations for most streams were normal depth or mean high tide, whichever was greater. For
stream reaches which were extensions of previously determined profiles, the starting water-
surface elevations were set equal to the elevations determined for the existing profiles.
51
For each stream studied in detail in the 1992 revision, the 100- and 500-year flood plain
boundaries have been delineated using the flood elevations determined at each cross section.
Between cross sections, the boundaries were interpolated using topographic maps at a scale of 1:
24000 with a contour interval of 5 feet and aerial photography at a scale of 1: 2400 with a contour
interval of 1 foot (References 47 and 48).
Countywide Analyses
New detailed hydraulic analyses have been performed as part of this study.
Frog Creek / Buffalo Canal Watershed
A watershed-wide hydraulic model was initiated by the Southwest Florida Water Management
District (SWFWMD) and Manatee County, and developed by Jones Edmunds and Associates,
Inc. (Reference 14) using Interconnected Channel and Pond Routing Model (ICPR) software
(Reference 54). The computer model was used to simulate the hydrologic response of the study
area and to route stormwater through constructed facilities and natural topographic features for
the standard storm events. The model schematic was created using ESRI’s ArcGIS geographic
information system software (Reference 55), ESRI’s Arc Hydro tools (Reference 56), proprietary
GIS-based tools developed by Jones Edmunds, and manual methods.
The Buffalo Canal/Frog Creek Watershed Management Plan was prepared by SWFWMD
(Reference 57). The plan incorporates digital topographic information, watershed evaluation, and
watershed management plan elements from the SWFWMD Guidelines and Specifications (G&S)
(Reference 58). This plan formed the basis for the new study.
ICPR was preferred by the SWFWMD for the Watershed Management Plan because of its ability
to accurately model ponding areas, its familiarity and use by the local engineering community,
ease of use, and approval for use in FEMA flood insurance studies. Also, the recently added
percolation and Green and Ampt runoff integration make the model an all encompassing package
for this modeling effort. Instabilities in the models were reviewed and addressed in several ways
to insure that peak flood stage results are reasonable.
See Table 9 for a listing of the ICPR model nodes and flood stage elevations.
Wares Creek (Cedar Hammock) Watershed Study
The U.S. Army Corps of Engineers Jacksonville District produced a new hydraulic study for
Wares Creek (Cedar Hammock) (Reference 15). For the Wares Creek (Cedar Hammock)
watershed, hydraulic profiles were computed with the HEC-2 program.
Updated and New Approximate Studies
Updated approximate hydraulic analyses have been performed by BakerAECOM (Reference 13)
on all previously effective approximate stream reaches as part of this countywide update. Thirty-
four (34) individual streams totaling approximately 81.8 linear miles were modeled using HEC-
RAS (Reference 68) via automated methods with non-surveyed GIS-based terrain data.
For this study, new approximate Zone A delineations have been added for areas not previously
studied by either detailed or approximate methods, using the current Southwest Florida Water
Management District (SWFWMD) Land Use/Land Cover (LULC) feature class as Zone A
52
polygons. The SWFWMD methodology used was adapted from the Northwest Florida Water Management District methodology for using wetland delineations to supplement existing Zone A
floodplain boundaries (Reference 61). No hydraulic analyses were performed as part of the
addition of these special flood hazard areas.
Benchmarks
For FIRM panels dated July 16, 2004, or later, qualifying bench marks within a given jurisdiction
are cataloged by the National Geodetic Survey (NGS) and entered into the National Spatial
Reference System (NSRS). First or Second Order Vertical bench marks that have a vertical
stability classification of A, B, or C are shown and labeled on the FIRM with their 6-character
NSRS Permanent Identifier.
Bench marks cataloged by the NGS and entered into the NSRS vary widely in vertical stability
classification. NSRS vertical stability classifications are as follows:
Stability A: Monuments of the most reliable nature, expected to hold position/elevation well (e.g.,
mounted in bedrock)
Stability B: Monuments which generally hold their position/elevation well (e.g., concrete bridge
abutments)
Stability C: Monuments which may be affected by surface ground movements (e.g., concrete
mounted below frost line)
Stability D: Mark of questionable or unknown vertical stability (e.g., concrete monument above
frost line, or steel witness post).
In addition to NSRS bench marks, the FIRM may also show vertical control monument
established by a local jurisdiction; these monuments will be shown on the FIRM with the
appropriate designations. Local monuments will only be placed on the FIRM if the community
has requested that they be included, and if the monuments meet the aforementioned NSRS
inclusion criteria.
To obtain current elevation, description, and/or location information for bench marks shown on
the FIRM for this jurisdiction, please contact the Information Services Branch of the NGS at
(301) 713-3242, or visit their Web site, www.ngs.noaa.gov.
It is important to note that temporary vertical monuments are often established during the
preparation of a flood hazard analysis for the purposes of establishing local vertical control.
Although these monuments are not shown on the digital FIRM, they may be found in the
Technical Support Data Notebook associated with this FIS and FIRM. Interested individuals may
contact FEMA to access this data.
3.3 Vertical Datum
All FISs and FIRMs are referenced to a specific vertical datum. The vertical datum provides a
starting point against which flood, ground, and structure elevations can be referenced and
compared. Until recently, the standard vertical datum in use for newly created or revised FISs
and FIRMs was the National Geodetic Vertical Datum of 1929 (NGVD 29). With the finalization
53
of the North American Vertical Datum of 1988 (NAVD 88), many FIS reports and FIRMs are
being prepared using NAVD 88 as the referenced vertical datum.
For this countywide FIS, all flood elevations shown in the FIS report and on the FIRM are
referenced to NAVD 88. Structure and ground elevations in the community must, therefore, be
referenced to NAVD 88. It is important to note that adjacent communities may be referenced to
NGVD 29. This may result in differences in base flood elevations across corporate limits
between the communities.
As noted above, the elevations shown in the FIS report and on the FIRM for Manatee County are
referenced to NAVD 88. Ground, structure, and flood elevations may be compared and/or
referenced to NGVD 29 by applying a standard conversion factor. The conversion factor from
NGVD 29 to NAVD 88 for Manatee County is -0.98 feet. The locations used to establish the
conversion factor were USGS 7.5-minute topographic quadrangle corners that fell within the
County, as well as those that were within 2.5 miles outside the County. The bench marks are
referenced to NAVD 88.
The BFEs shown on the FIRM represent whole-foot rounded values. For example, a BFE of 12.4
will appear as 12 on the FIRM and 12.6 will appear as 13. Therefore, users that wish to convert
the elevations in this FIS to NGVD 29 should apply the conversion factor (+0.98 foot) to
elevations shown on the Flood Profiles and supporting data tables in this FIS report, which are
shown at a minimum to the nearest 0.1 foot.
NGVD – 0.98’ = NAVD
For more information on NAVD 88, see Converting the National Flood Insurance Program to the
North American Vertical Datum of 1988, FEMA Publication FIA-20/June 1992, or contact the
National Geodetic Survey at the following address:
NGS, Information Services
NOAA, N/NGS12
National Geodetic Survey
SSMC-3, #9202
1315 East-West Highway
Silver Spring, Maryland 20910
(301) 713-3242
http://www.ngs.noaa.gov/
4.0 FLOODPLAIN MANAGEMENT APPLICATIONS
The NFIP encourages State and local governments to adopt sound floodplain management programs.
Therefore, each Flood Insurance Study provides 1-percent-annual-chance flood elevations and
delineations of the 1- and 0.2-percent-annual chance floodplain boundaries and 1-percent-annual-chance
floodway to assist communities in developing floodplain management measures. This information is
presented on the FIRM and in many components of the FIS report, including Flood Profiles, and
Floodway Data tables. Users should reference the data presented in the FIS report as well as additional
information that may be available at the local community map repository before making flood elevation
and/or floodplain boundary determinations.
54
4.1 Floodplain Boundaries
In order to provide a national standard without regional discrimination, the 1 percent annual
chance (100-year) flood has been adopted by FEMA as the base flood for floodplain management
purposes. The 0.2 percent annual chance (500-year) flood is employed to indicate additional
areas of flood risk in the community. For the streams studied in detail, the 1- and 0.2-percent-
annual-chance floodplain boundaries have been delineated using the flood elevations determined
at each cross section. Between cross sections, the boundaries were interpolated using topographic
maps and verified using photogrammetrically-derived contours from aerial photography
(References 35, 38, 47, 48, 69, 70, 71, 72, 73, and 74). The 1- and 0.2-percent-annual-chance
floodplain boundaries for coastal areas were delineated using the same reference materials. For
information regarding scale and sources of these maps, see Table 10, “Sources of Original
Topographic Data.”
TABLE 10 – SOURCES OF ORIGINAL TOPOGRAPHIC DATA
LOCATION
Anna Maria, City of
SCALE
1:24,000
CONTOUR
INTERVAL
(Feet)
5
REFERENCE #’s
35, 72, 73
1:7,200,
1:10,800
* 38
Bradenton, City of 1:24,000 5 35
Bradenton Beach, City of 1:24,000 5 35
1:7,200,
1:10,800
* 38
Holmes Beach, City of 1:24,000 5 35
1:8,400 1 38
Longboat Key, Town of 1:24,000 5 35
1:2,400 1 74
1:7,200, 1:10,800,
1:21,600
* 38
Manatee County 1:24,000 5 35, 47
(Unincorporated Areas) 1:2,400 1 38, 48, 69, 70
1:12,000 2 71
Palmetto, City of 1:24,000 5 35
*Data Not Available.
1:7,200,
1:10,800
* 38
The 1- and 0.2-percent-annual-chance floodplain boundaries are shown on the Flood Insurance
Rate Map. On this map, the 1-percent-annual-chance floodplain boundary corresponds to the
boundary of the areas of special flood hazards (Zones A and AE), and the 0.2-percent-annual-
chance floodplain boundary corresponds to the boundary of areas of moderate flood hazards. In
cases where the 1- and 0.2-percent-annual-chance floodplain boundaries are close together, only
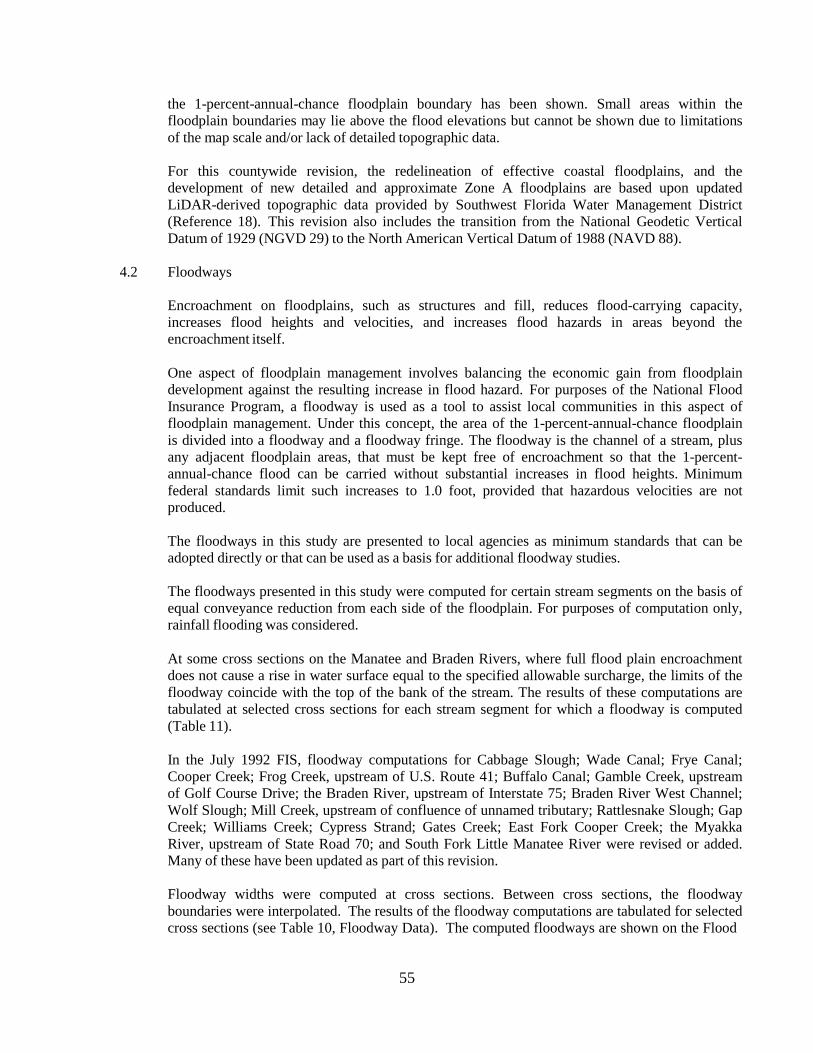
55
the 1-percent-annual-chance floodplain boundary has been shown. Small areas within the
floodplain boundaries may lie above the flood elevations but cannot be shown due to limitations
of the map scale and/or lack of detailed topographic data.
For this countywide revision, the redelineation of effective coastal floodplains, and the
development of new detailed and approximate Zone A floodplains are based upon updated
LiDAR-derived topographic data provided by Southwest Florida Water Management District
(Reference 18). This revision also includes the transition from the National Geodetic Vertical
Datum of 1929 (NGVD 29) to the North American Vertical Datum of 1988 (NAVD 88).
4.2 Floodways
Encroachment on floodplains, such as structures and fill, reduces flood-carrying capacity,
increases flood heights and velocities, and increases flood hazards in areas beyond the
encroachment itself.
One aspect of floodplain management involves balancing the economic gain from floodplain
development against the resulting increase in flood hazard. For purposes of the National Flood
Insurance Program, a floodway is used as a tool to assist local communities in this aspect of
floodplain management. Under this concept, the area of the 1-percent-annual-chance floodplain
is divided into a floodway and a floodway fringe. The floodway is the channel of a stream, plus
any adjacent floodplain areas, that must be kept free of encroachment so that the 1-percent-
annual-chance flood can be carried without substantial increases in flood heights. Minimum
federal standards limit such increases to 1.0 foot, provided that hazardous velocities are not
produced.
The floodways in this study are presented to local agencies as minimum standards that can be
adopted directly or that can be used as a basis for additional floodway studies.
The floodways presented in this study were computed for certain stream segments on the basis of
equal conveyance reduction from each side of the floodplain. For purposes of computation only,
rainfall flooding was considered.
At some cross sections on the Manatee and Braden Rivers, where full flood plain encroachment
does not cause a rise in water surface equal to the specified allowable surcharge, the limits of the
floodway coincide with the top of the bank of the stream. The results of these computations are
tabulated at selected cross sections for each stream segment for which a floodway is computed
(Table 11).
In the July 1992 FIS, floodway computations for Cabbage Slough; Wade Canal; Frye Canal;
Cooper Creek; Frog Creek, upstream of U.S. Route 41; Buffalo Canal; Gamble Creek, upstream
of Golf Course Drive; the Braden River, upstream of Interstate 75; Braden River West Channel;
Wolf Slough; Mill Creek, upstream of confluence of unnamed tributary; Rattlesnake Slough; Gap
Creek; Williams Creek; Cypress Strand; Gates Creek; East Fork Cooper Creek; the Myakka
River, upstream of State Road 70; and South Fork Little Manatee River were revised or added.
Many of these have been updated as part of this revision.
Floodway widths were computed at cross sections. Between cross sections, the floodway
boundaries were interpolated. The results of the floodway computations are tabulated for selected
cross sections (see Table 10, Floodway Data). The computed floodways are shown on the Flood
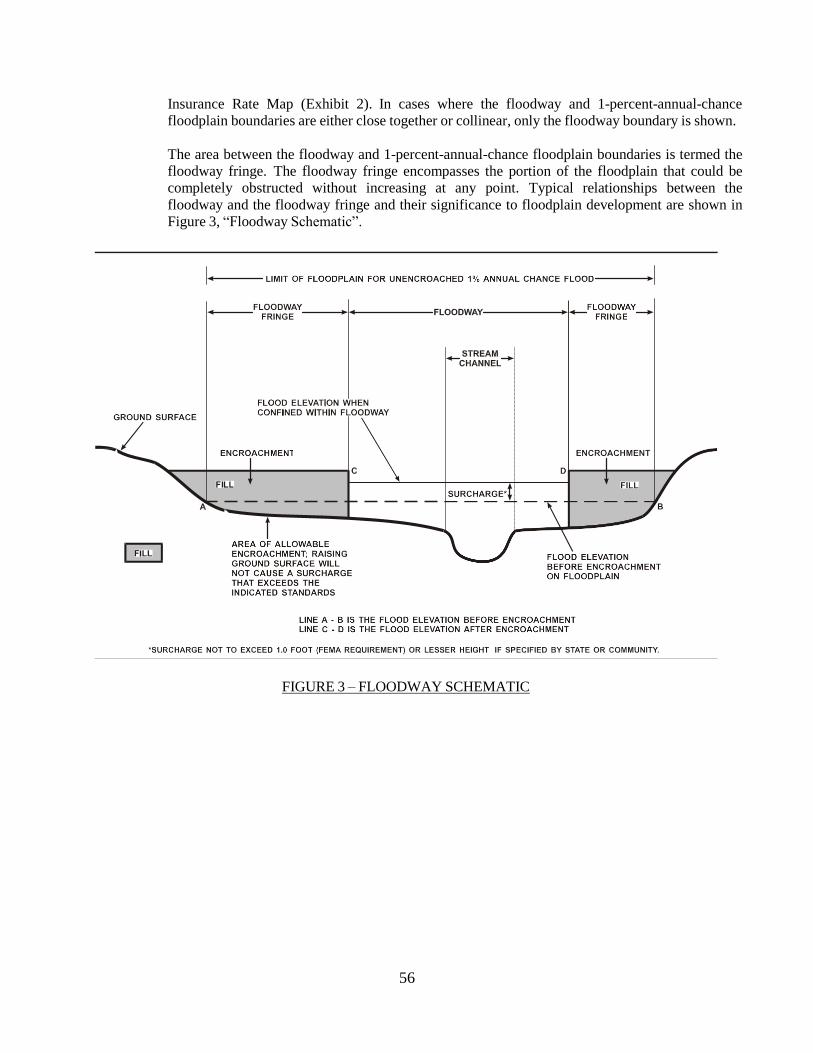
56
Insurance Rate Map (Exhibit 2). In cases where the floodway and 1-percent-annual-chance
floodplain boundaries are either close together or collinear, only the floodway boundary is shown.
The area between the floodway and 1-percent-annual-chance floodplain boundaries is termed the
floodway fringe. The floodway fringe encompasses the portion of the floodplain that could be
completely obstructed without increasing at any point. Typical relationships between the
floodway and the floodway fringe and their significance to floodplain development are shown in
Figure 3, “Floodway Schematic”.
FIGURE 3 – FLOODWAY SCHEMATIC
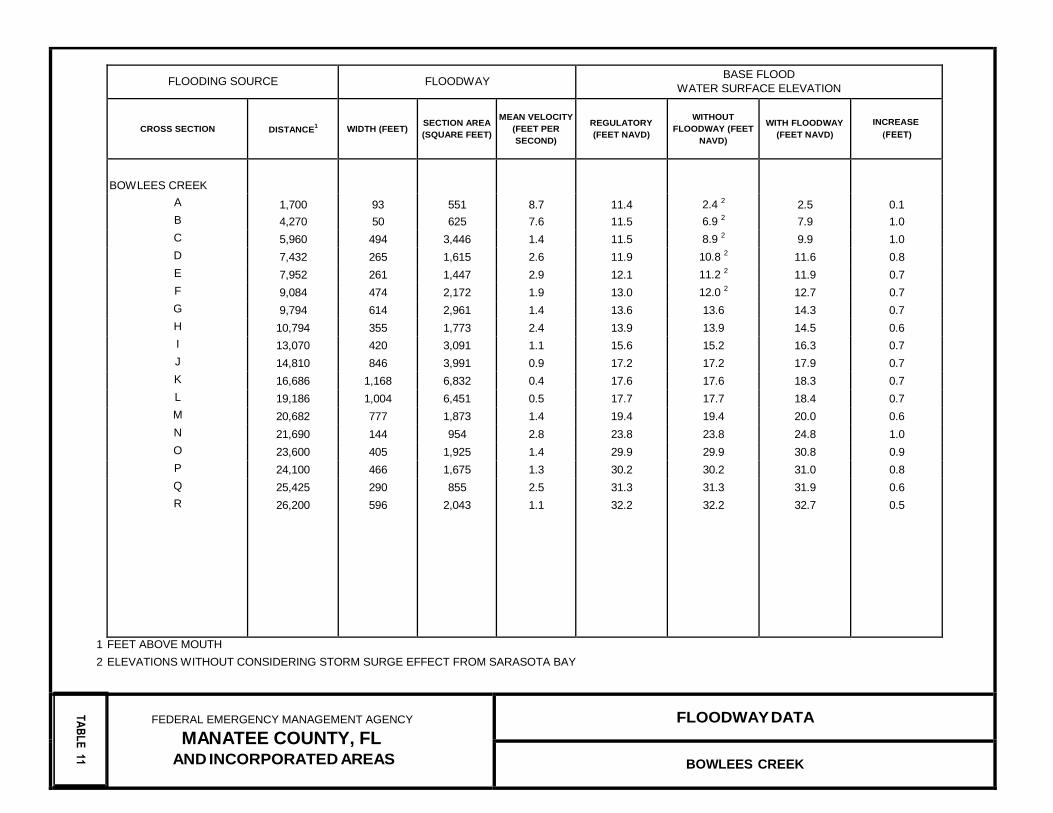
FLOODING SOURCE FLOODWAY BASE FLOOD
WATER SURFACE ELEVATION
CROSS SECTION DISTANCE1 WIDTH (FEET)
SECTION AREA
(SQUARE FEET)
MEAN VELOCITY
(FEET PER
SECOND)
REGULATORY
(FEET NAVD)
WITHOUT
FLOODWAY (FEET
NAVD)
WITH FLOODWAY
(FEET NAVD)
INCREASE
(FEET)
BOWLEES CREEK
1,700 93 551 8.7 11.4 2.4 2 2.5 0.1 A
B 4,270 50 625 7.6 11.5 6.9 2 7.9 1.0
C 5,960 494 3,446 1.4 11.5 8.9 2 9.9 1.0
D 7,432 265 1,615 2.6 11.9 10.8 2 11.6 0.8
E 7,952 261 1,447 2.9 12.1 11.2 2 11.9 0.7
F 9,084 474 2,172 1.9 13.0 12.0 2 12.7 0.7
G 9,794 614 2,961 1.4 13.6 13.6 14.3 0.7
H 10,794 355 1,773 2.4 13.9 13.9 14.5 0.6
I 13,070 420 3,091 1.1 15.6 15.2 16.3 0.7
J 14,810 846 3,991 0.9 17.2 17.2 17.9 0.7
K 16,686 1,168 6,832 0.4 17.6 17.6 18.3 0.7
L 19,186 1,004 6,451 0.5 17.7 17.7 18.4 0.7
M 20,682 777 1,873 1.4 19.4 19.4 20.0 0.6
N 21,690 144 954 2.8 23.8 23.8 24.8 1.0
O 23,600 405 1,925 1.4 29.9 29.9 30.8 0.9
P 24,100 466 1,675 1.3 30.2 30.2 31.0 0.8
Q 25,425 290 855 2.5 31.3 31.3 31.9 0.6
R 26,200 596 2,043 1.1 32.2 32.2 32.7 0.5
TA
BL
E 11
1 FEET ABOVE MOUTH
2 ELEVATIONS WITHOUT CONSIDERING STORM SURGE EFFECT FROM SARASOTA BAY
FEDERAL EMERGENCY MANAGEMENT AGENCY
MANATEE COUNTY, FL AND INCORPORATED AREAS
FLOODWAY DATA
BOWLEES CREEK
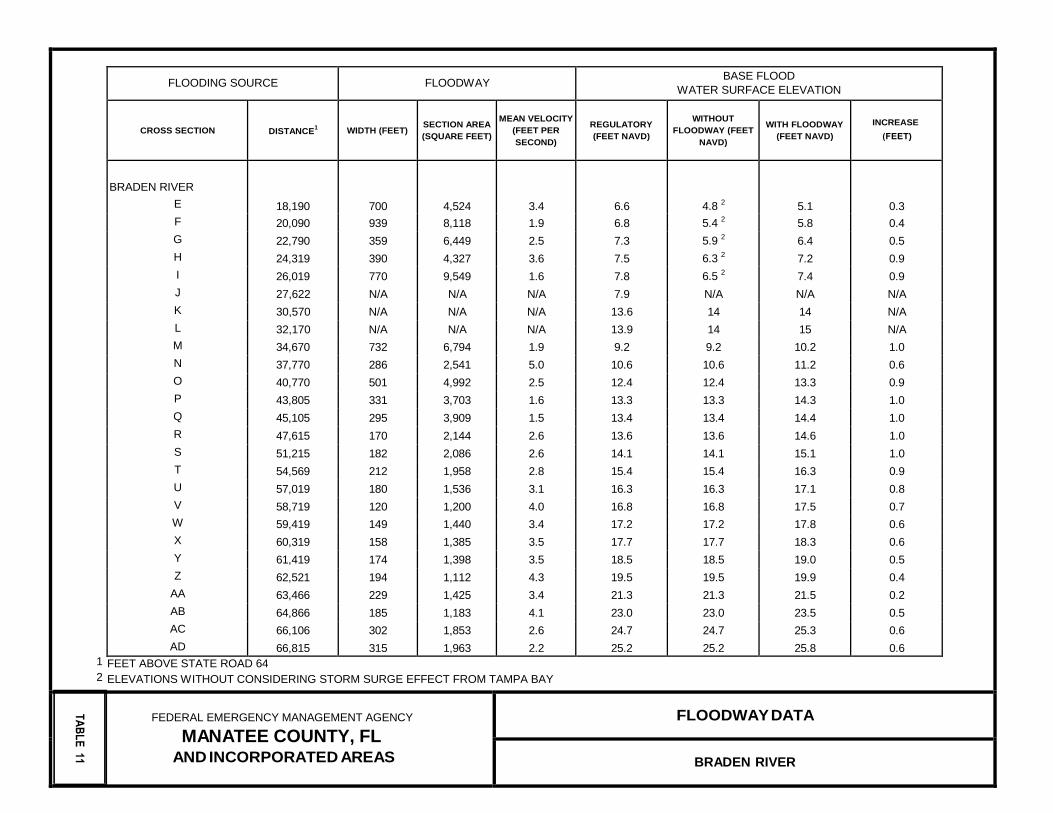
FLOODING SOURCE FLOODWAY BASE FLOOD
WATER SURFACE ELEVATION
CROSS SECTION DISTANCE1 WIDTH (FEET)
SECTION AREA
(SQUARE FEET)
MEAN VELOCITY
(FEET PER
SECOND)
REGULATORY
(FEET NAVD)
WITHOUT
FLOODWAY (FEET
NAVD)
WITH FLOODWAY
(FEET NAVD)
INCREASE
(FEET)
BRADEN RIVER
18,190 700 4,524 3.4 6.6 4.8 2 5.1 0.3 E
F 20,090 939 8,118 1.9 6.8 5.4 2 5.8 0.4
G 22,790 359 6,449 2.5 7.3 5.9 2 6.4 0.5
H 24,319 390 4,327 3.6 7.5 6.3 2 7.2 0.9
I 26,019 770 9,549 1.6 7.8 6.5 2 7.4 0.9
J 27,622 N/A N/A N/A 7.9 N/A N/A N/A
K 30,570 N/A N/A N/A 13.6 14 14 N/A
L 32,170 N/A N/A N/A 13.9 14 15 N/A
M 34,670 732 6,794 1.9 9.2 9.2 10.2 1.0
N 37,770 286 2,541 5.0 10.6 10.6 11.2 0.6
O 40,770 501 4,992 2.5 12.4 12.4 13.3 0.9
P 43,805 331 3,703 1.6 13.3 13.3 14.3 1.0
Q 45,105 295 3,909 1.5 13.4 13.4 14.4 1.0
R 47,615 170 2,144 2.6 13.6 13.6 14.6 1.0
S 51,215 182 2,086 2.6 14.1 14.1 15.1 1.0
T 54,569 212 1,958 2.8 15.4 15.4 16.3 0.9
U 57,019 180 1,536 3.1 16.3 16.3 17.1 0.8
V 58,719 120 1,200 4.0 16.8 16.8 17.5 0.7
W 59,419 149 1,440 3.4 17.2 17.2 17.8 0.6
X 60,319 158 1,385 3.5 17.7 17.7 18.3 0.6
Y 61,419 174 1,398 3.5 18.5 18.5 19.0 0.5
Z 62,521 194 1,112 4.3 19.5 19.5 19.9 0.4
AA 63,466 229 1,425 3.4 21.3 21.3 21.5 0.2
AB 64,866 185 1,183 4.1 23.0 23.0 23.5 0.5
AC 66,106 302 1,853 2.6 24.7 24.7 25.3 0.6
AD 66,815 315 1,963 2.2 25.2 25.2 25.8 0.6
TA
BL
E 11
1 FEET ABOVE STATE ROAD 64
2 ELEVATIONS WITHOUT CONSIDERING STORM SURGE EFFECT FROM TAMPA BAY
FEDERAL EMERGENCY MANAGEMENT AGENCY
MANATEE COUNTY, FL AND INCORPORATED AREAS
FLOODWAY DATA
BRADEN RIVER
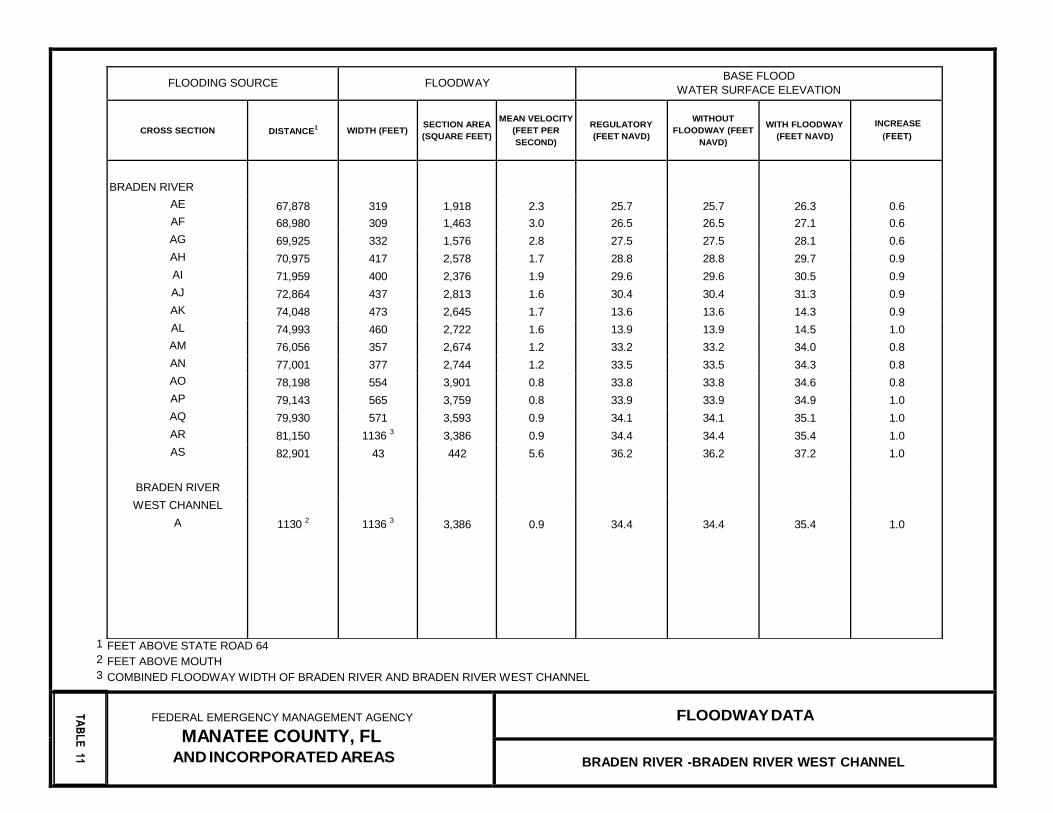
FLOODING SOURCE FLOODWAY BASE FLOOD
WATER SURFACE ELEVATION
CROSS SECTION DISTANCE1 WIDTH (FEET)
SECTION AREA
(SQUARE FEET)
MEAN VELOCITY
(FEET PER
SECOND)
REGULATORY
(FEET NAVD)
WITHOUT
FLOODWAY (FEET
NAVD)
WITH FLOODWAY
(FEET NAVD)
INCREASE
(FEET)
BRADEN RIVER
67,878 319 1,918 2.3 25.7 25.7 26.3 0.6 AE
AF 68,980 309 1,463 3.0 26.5 26.5 27.1 0.6
AG 69,925 332 1,576 2.8 27.5 27.5 28.1 0.6
AH 70,975 417 2,578 1.7 28.8 28.8 29.7 0.9
AI 71,959 400 2,376 1.9 29.6 29.6 30.5 0.9
AJ 72,864 437 2,813 1.6 30.4 30.4 31.3 0.9
AK 74,048 473 2,645 1.7 13.6 13.6 14.3 0.9
AL 74,993 460 2,722 1.6 13.9 13.9 14.5 1.0
AM 76,056 357 2,674 1.2 33.2 33.2 34.0 0.8
AN 77,001 377 2,744 1.2 33.5 33.5 34.3 0.8
AO 78,198 554 3,901 0.8 33.8 33.8 34.6 0.8
AP 79,143 565 3,759 0.8 33.9 33.9 34.9 1.0
AQ 79,930 571 3,593 0.9 34.1 34.1 35.1 1.0
AR 81,150 1136 3 3,386 0.9 34.4 34.4 35.4 1.0
AS 82,901 43 442 5.6 36.2 36.2 37.2 1.0
BRADEN RIVER
WEST CHANNEL
A 1130 2 1136 3 3,386 0.9 34.4 34.4 35.4 1.0
TA
BL
E 11
1 FEET ABOVE STATE ROAD 64
2 FEET ABOVE MOUTH
3 COMBINED FLOODWAY WIDTH OF BRADEN RIVER AND BRADEN RIVER WEST CHANNEL
FEDERAL EMERGENCY MANAGEMENT AGENCY
MANATEE COUNTY, FL AND INCORPORATED AREAS
FLOODWAY DATA
BRADEN RIVER -BRADEN RIVER WEST CHANNEL
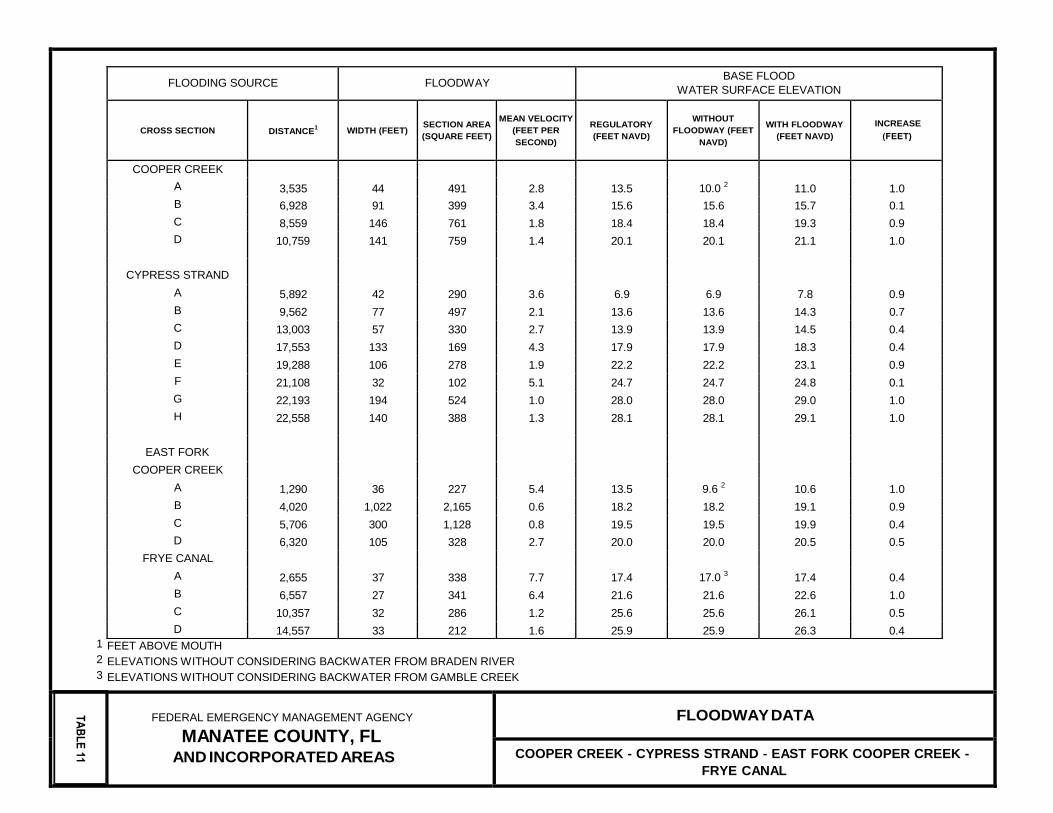
FLOODING SOURCE FLOODWAY BASE FLOOD
WATER SURFACE ELEVATION
CROSS SECTION DISTANCE1 WIDTH (FEET)
SECTION AREA
(SQUARE FEET)
MEAN VELOCITY
(FEET PER
SECOND)
REGULATORY
(FEET NAVD)
WITHOUT
FLOODWAY (FEET
NAVD)
WITH FLOODWAY
(FEET NAVD)
INCREASE
(FEET)
COOPER CREEK
3,535 44 491 2.8 13.5 10.0 2 11.0 1.0 A
B 6,928 91 399 3.4 15.6 15.6 15.7 0.1
C 8,559 146 761 1.8 18.4 18.4 19.3 0.9
D 10,759 141 759 1.4 20.1 20.1 21.1 1.0
CYPRESS STRAND
A 5,892 42 290 3.6 6.9 6.9 7.8 0.9
B 9,562 77 497 2.1 13.6 13.6 14.3 0.7
C 13,003 57 330 2.7 13.9 13.9 14.5 0.4
D 17,553 133 169 4.3 17.9 17.9 18.3 0.4
E 19,288 106 278 1.9 22.2 22.2 23.1 0.9
F 21,108 32 102 5.1 24.7 24.7 24.8 0.1
G 22,193 194 524 1.0 28.0 28.0 29.0 1.0
H 22,558 140 388 1.3 28.1 28.1 29.1 1.0
EAST FORK
COOPER CREEK
A 1,290 36 227 5.4 13.5 9.6 2 10.6 1.0
B 4,020 1,022 2,165 0.6 18.2 18.2 19.1 0.9
C 5,706 300 1,128 0.8 19.5 19.5 19.9 0.4
D 6,320 105 328 2.7 20.0 20.0 20.5 0.5
FRYE CANAL
A 2,655 37 338 7.7 17.4 17.0 3 17.4 0.4
B 6,557 27 341 6.4 21.6 21.6 22.6 1.0
C 10,357 32 286 1.2 25.6 25.6 26.1 0.5
D 14,557 33 212 1.6 25.9 25.9 26.3 0.4
TA
BL
E 11
1 FEET ABOVE MOUTH
2 ELEVATIONS WITHOUT CONSIDERING BACKWATER FROM BRADEN RIVER
3 ELEVATIONS WITHOUT CONSIDERING BACKWATER FROM GAMBLE CREEK
FEDERAL EMERGENCY MANAGEMENT AGENCY
MANATEE COUNTY, FL AND INCORPORATED AREAS
FLOODWAY DATA
COOPER CREEK - CYPRESS STRAND - EAST FORK COOPER CREEK -
FRYE CANAL
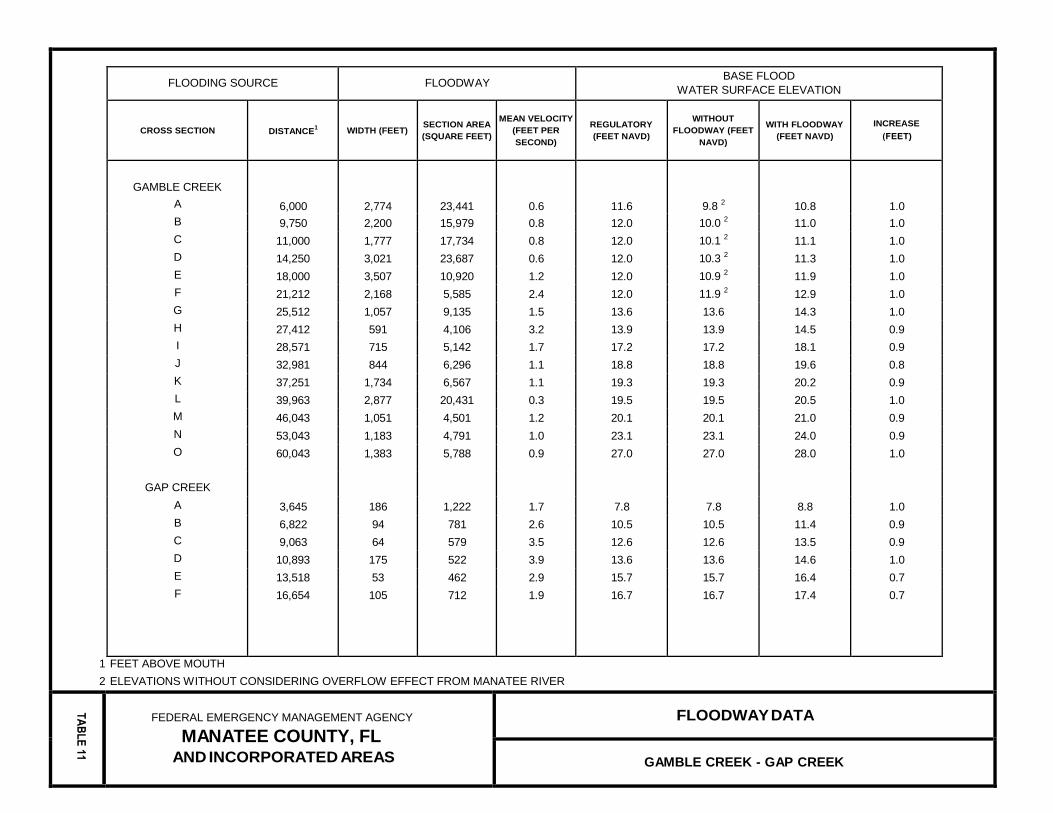
FLOODING SOURCE FLOODWAY BASE FLOOD
WATER SURFACE ELEVATION
CROSS SECTION DISTANCE1 WIDTH (FEET)
SECTION AREA
(SQUARE FEET)
MEAN VELOCITY
(FEET PER
SECOND)
REGULATORY
(FEET NAVD)
WITHOUT
FLOODWAY (FEET
NAVD)
WITH FLOODWAY
(FEET NAVD)
INCREASE
(FEET)
GAMBLE CREEK
6,000 2,774 23,441 0.6 11.6 9.8 2 10.8 1.0 A
B 9,750 2,200 15,979 0.8 12.0 10.0 2 11.0 1.0
C 11,000 1,777 17,734 0.8 12.0 10.1 2 11.1 1.0
D 14,250 3,021 23,687 0.6 12.0 10.3 2 11.3 1.0
E 18,000 3,507 10,920 1.2 12.0 10.9 2 11.9 1.0
F 21,212 2,168 5,585 2.4 12.0 11.9 2 12.9 1.0
G 25,512 1,057 9,135 1.5 13.6 13.6 14.3 1.0
H 27,412 591 4,106 3.2 13.9 13.9 14.5 0.9
I 28,571 715 5,142 1.7 17.2 17.2 18.1 0.9
J 32,981 844 6,296 1.1 18.8 18.8 19.6 0.8
K 37,251 1,734 6,567 1.1 19.3 19.3 20.2 0.9
L 39,963 2,877 20,431 0.3 19.5 19.5 20.5 1.0
M 46,043 1,051 4,501 1.2 20.1 20.1 21.0 0.9
N 53,043 1,183 4,791 1.0 23.1 23.1 24.0 0.9
O 60,043 1,383 5,788 0.9 27.0 27.0 28.0 1.0
GAP CREEK
A 3,645 186 1,222 1.7 7.8 7.8 8.8 1.0
B 6,822 94 781 2.6 10.5 10.5 11.4 0.9
C 9,063 64 579 3.5 12.6 12.6 13.5 0.9
D 10,893 175 522 3.9 13.6 13.6 14.6 1.0
E 13,518 53 462 2.9 15.7 15.7 16.4 0.7
F 16,654 105 712 1.9 16.7 16.7 17.4 0.7
1 FEET ABOVE MOUTH
2 ELEVATIONS WITHOUT CONSIDERING OVERFLOW EFFECT FROM MANATEE RIVER
FEDERAL EMERGENCY MANAGEMENT AGENCY
MANATEE COUNTY, FL AND INCORPORATED AREAS
FLOODWAY DATA
GAMBLE CREEK - GAP CREEK
TA
BL
E 11
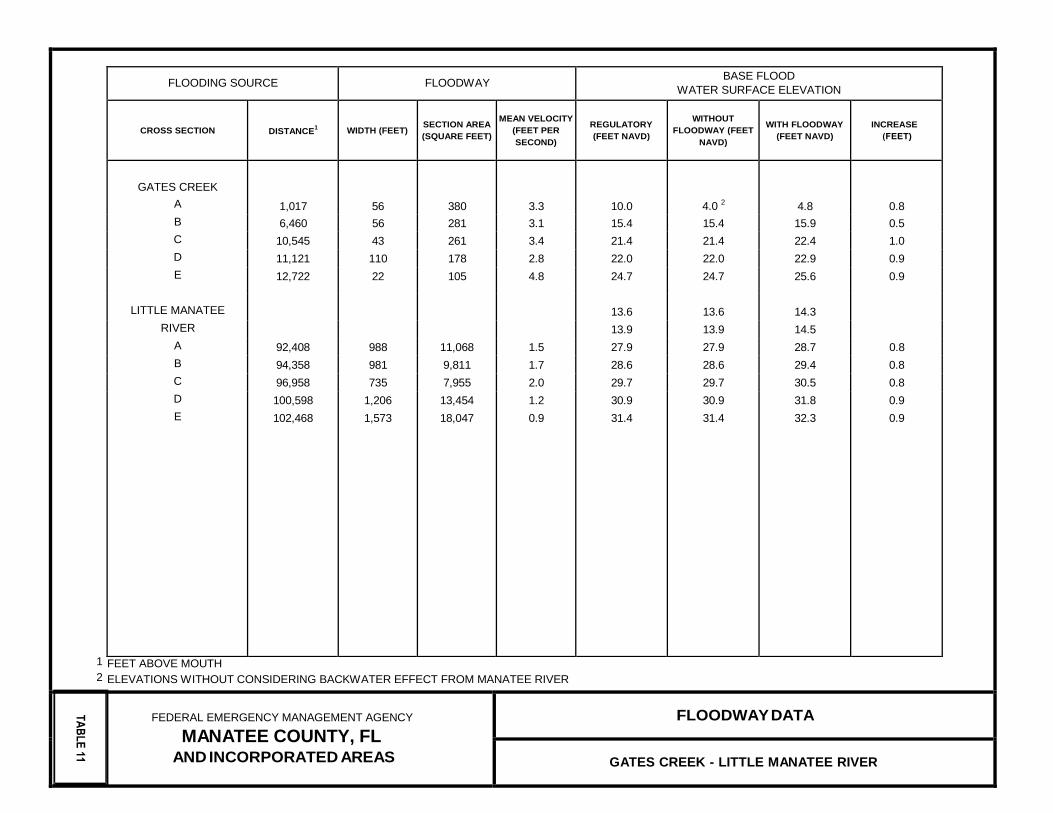
FLOODING SOURCE FLOODWAY BASE FLOOD
WATER SURFACE ELEVATION
CROSS SECTION DISTANCE1 WIDTH (FEET)
SECTION AREA
(SQUARE FEET)
MEAN VELOCITY
(FEET PER
SECOND)
REGULATORY
(FEET NAVD)
WITHOUT
FLOODWAY (FEET
NAVD)
WITH FLOODWAY
(FEET NAVD)
INCREASE
(FEET)
GATES CREEK
1,017 56 380 3.3 10.0 4.0 2 4.8 0.8 A
B 6,460 56 281 3.1 15.4 15.4 15.9 0.5
C 10,545 43 261 3.4 21.4 21.4 22.4 1.0
D 11,121 110 178 2.8 22.0 22.0 22.9 0.9
E 12,722 22 105 4.8 24.7 24.7 25.6 0.9
LITTLE MANATEE 13.6 13.6 14.3
RIVER 13.9 13.9 14.5
A 92,408 988 11,068 1.5 27.9 27.9 28.7 0.8
B 94,358 981 9,811 1.7 28.6 28.6 29.4 0.8
C 96,958 735 7,955 2.0 29.7 29.7 30.5 0.8
D 100,598 1,206 13,454 1.2 30.9 30.9 31.8 0.9
E 102,468 1,573 18,047 0.9 31.4 31.4 32.3 0.9
TA
BL
E 11
1 FEET ABOVE MOUTH
2 ELEVATIONS WITHOUT CONSIDERING BACKWATER EFFECT FROM MANATEE RIVER
FEDERAL EMERGENCY MANAGEMENT AGENCY
MANATEE COUNTY, FL AND INCORPORATED AREAS
FLOODWAY DATA
GATES CREEK - LITTLE MANATEE RIVER
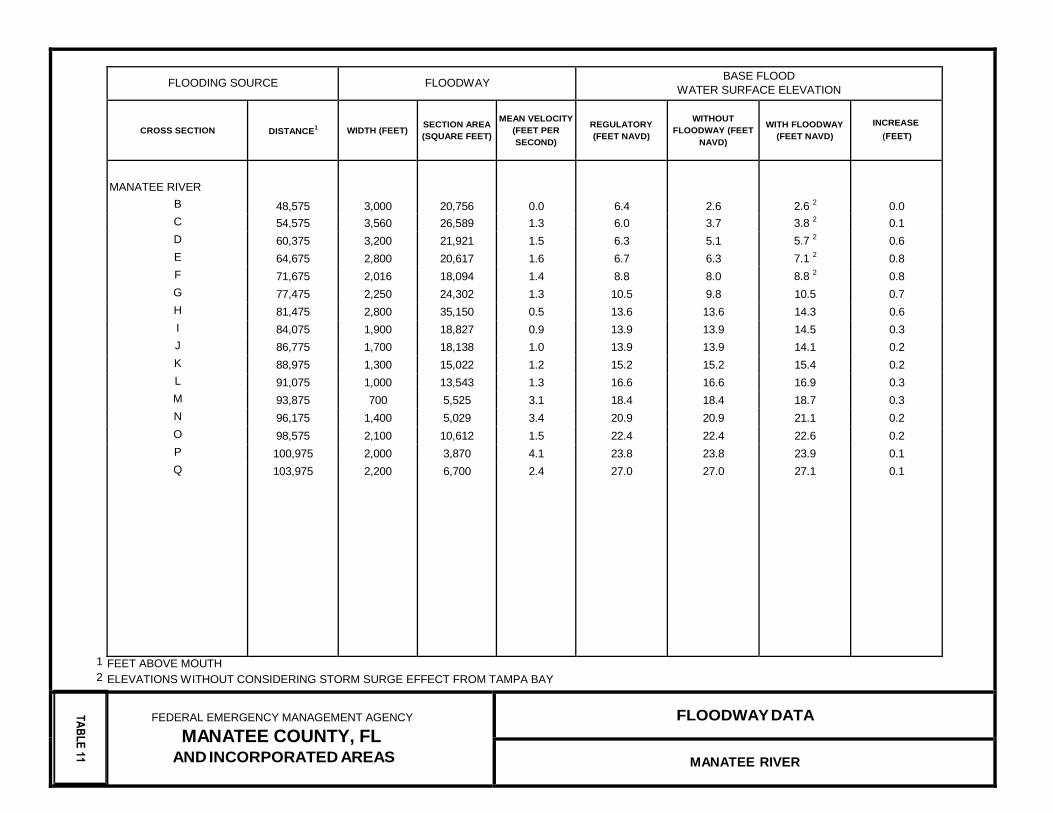
FLOODING SOURCE FLOODWAY BASE FLOOD
WATER SURFACE ELEVATION
CROSS SECTION DISTANCE1 WIDTH (FEET)
SECTION AREA
(SQUARE FEET)
MEAN VELOCITY
(FEET PER
SECOND)
REGULATORY
(FEET NAVD)
WITHOUT
FLOODWAY (FEET
NAVD)
WITH FLOODWAY
(FEET NAVD)
INCREASE
(FEET)
MANATEE RIVER
48,575 3,000 20,756 0.0 6.4 2.6 2.6 2 0.0 B
C 54,575 3,560 26,589 1.3 6.0 3.7 3.8 2 0.1
D 60,375 3,200 21,921 1.5 6.3 5.1 5.7 2 0.6
E 64,675 2,800 20,617 1.6 6.7 6.3 7.1 2 0.8
F 71,675 2,016 18,094 1.4 8.8 8.0 8.8 2 0.8
G 77,475 2,250 24,302 1.3 10.5 9.8 10.5 0.7
H 81,475 2,800 35,150 0.5 13.6 13.6 14.3 0.6
I 84,075 1,900 18,827 0.9 13.9 13.9 14.5 0.3
J 86,775 1,700 18,138 1.0 13.9 13.9 14.1 0.2
K 88,975 1,300 15,022 1.2 15.2 15.2 15.4 0.2
L 91,075 1,000 13,543 1.3 16.6 16.6 16.9 0.3
M 93,875 700 5,525 3.1 18.4 18.4 18.7 0.3
N 96,175 1,400 5,029 3.4 20.9 20.9 21.1 0.2
O 98,575 2,100 10,612 1.5 22.4 22.4 22.6 0.2
P 100,975 2,000 3,870 4.1 23.8 23.8 23.9 0.1
Q 103,975 2,200 6,700 2.4 27.0 27.0 27.1 0.1
TA
BL
E 11
1 FEET ABOVE MOUTH
2 ELEVATIONS WITHOUT CONSIDERING STORM SURGE EFFECT FROM TAMPA BAY
FEDERAL EMERGENCY MANAGEMENT AGENCY
MANATEE COUNTY, FL AND INCORPORATED AREAS
FLOODWAY DATA
MANATEE RIVER
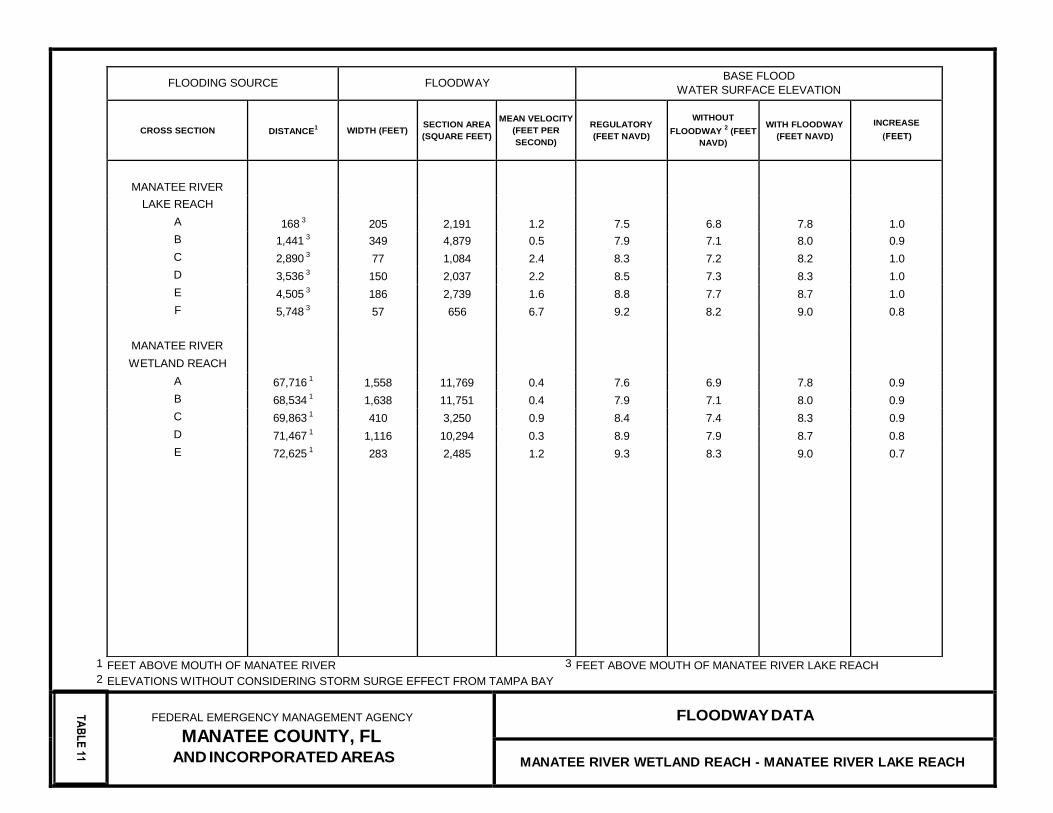
FLOODING SOURCE FLOODWAY BASE FLOOD
WATER SURFACE ELEVATION
CROSS SECTION DISTANCE1 WIDTH (FEET)
SECTION AREA
(SQUARE FEET)
MEAN VELOCITY
(FEET PER
SECOND)
REGULATORY
(FEET NAVD)
WITHOUT
FLOODWAY 2
(FEET
NAVD)
WITH FLOODWAY
(FEET NAVD)
INCREASE
(FEET)
MANATEE RIVER
168 3 205 2,191 1.2 7.5 6.8 7.8 1.0
LAKE REACH
A
B 1,441 3 349 4,879 0.5 7.9 7.1 8.0 0.9
C 2,890 3 77 1,084 2.4 8.3 7.2 8.2 1.0
D 3,536 3 150 2,037 2.2 8.5 7.3 8.3 1.0
E 4,505 3 186 2,739 1.6 8.8 7.7 8.7 1.0
F 5,748 3 57 656 6.7 9.2 8.2 9.0 0.8
MANATEE RIVER
WETLAND REACH
A 67,716 1 1,558 11,769 0.4 7.6 6.9 7.8 0.9
B 68,534 1 1,638 11,751 0.4 7.9 7.1 8.0 0.9
C 69,863 1 410 3,250 0.9 8.4 7.4 8.3 0.9
D 71,467 1 1,116 10,294 0.3 8.9 7.9 8.7 0.8
E 72,625 1 283 2,485 1.2 9.3 8.3 9.0 0.7
TA
BL
E 11
1 FEET ABOVE MOUTH OF MANATEE RIVER 3 FEET ABOVE MOUTH OF MANATEE RIVER LAKE REACH
2 ELEVATIONS WITHOUT CONSIDERING STORM SURGE EFFECT FROM TAMPA BAY
FEDERAL EMERGENCY MANAGEMENT AGENCY
MANATEE COUNTY, FL AND INCORPORATED AREAS
FLOODWAY DATA
MANATEE RIVER WETLAND REACH - MANATEE RIVER LAKE REACH
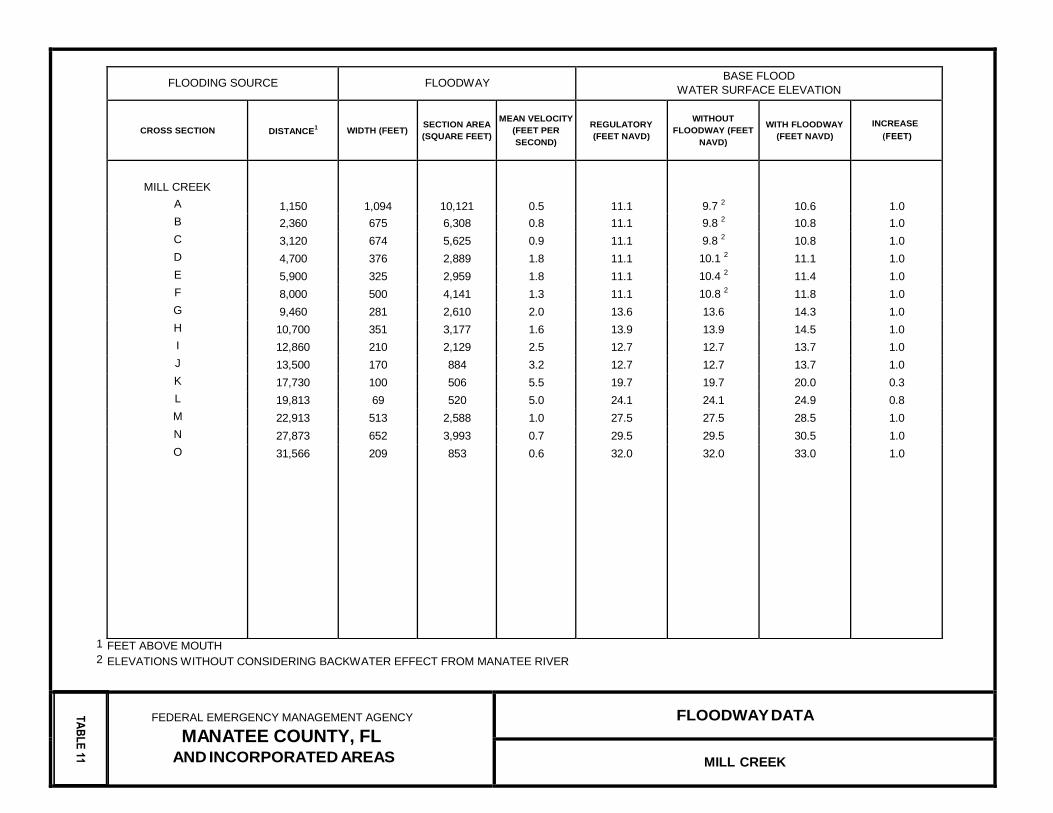
FLOODING SOURCE FLOODWAY BASE FLOOD
WATER SURFACE ELEVATION
CROSS SECTION DISTANCE1 WIDTH (FEET)
SECTION AREA
(SQUARE FEET)
MEAN VELOCITY
(FEET PER
SECOND)
REGULATORY
(FEET NAVD)
WITHOUT
FLOODWAY (FEET
NAVD)
WITH FLOODWAY
(FEET NAVD)
INCREASE
(FEET)
MILL CREEK
1,150 1,094 10,121 0.5 11.1 9.7 2 10.6 1.0 A
B 2,360 675 6,308 0.8 11.1 9.8 2 10.8 1.0
C 3,120 674 5,625 0.9 11.1 9.8 2 10.8 1.0
D 4,700 376 2,889 1.8 11.1 10.1 2 11.1 1.0
E 5,900 325 2,959 1.8 11.1 10.4 2 11.4 1.0
F 8,000 500 4,141 1.3 11.1 10.8 2 11.8 1.0
G 9,460 281 2,610 2.0 13.6 13.6 14.3 1.0
H 10,700 351 3,177 1.6 13.9 13.9 14.5 1.0
I 12,860 210 2,129 2.5 12.7 12.7 13.7 1.0
J 13,500 170 884 3.2 12.7 12.7 13.7 1.0
K 17,730 100 506 5.5 19.7 19.7 20.0 0.3
L 19,813 69 520 5.0 24.1 24.1 24.9 0.8
M 22,913 513 2,588 1.0 27.5 27.5 28.5 1.0
N 27,873 652 3,993 0.7 29.5 29.5 30.5 1.0
O 31,566 209 853 0.6 32.0 32.0 33.0 1.0
TA
BL
E 11
1 FEET ABOVE MOUTH
2 ELEVATIONS WITHOUT CONSIDERING BACKWATER EFFECT FROM MANATEE RIVER
FEDERAL EMERGENCY MANAGEMENT AGENCY
MANATEE COUNTY, FL AND INCORPORATED AREAS
FLOODWAY DATA
MILL CREEK
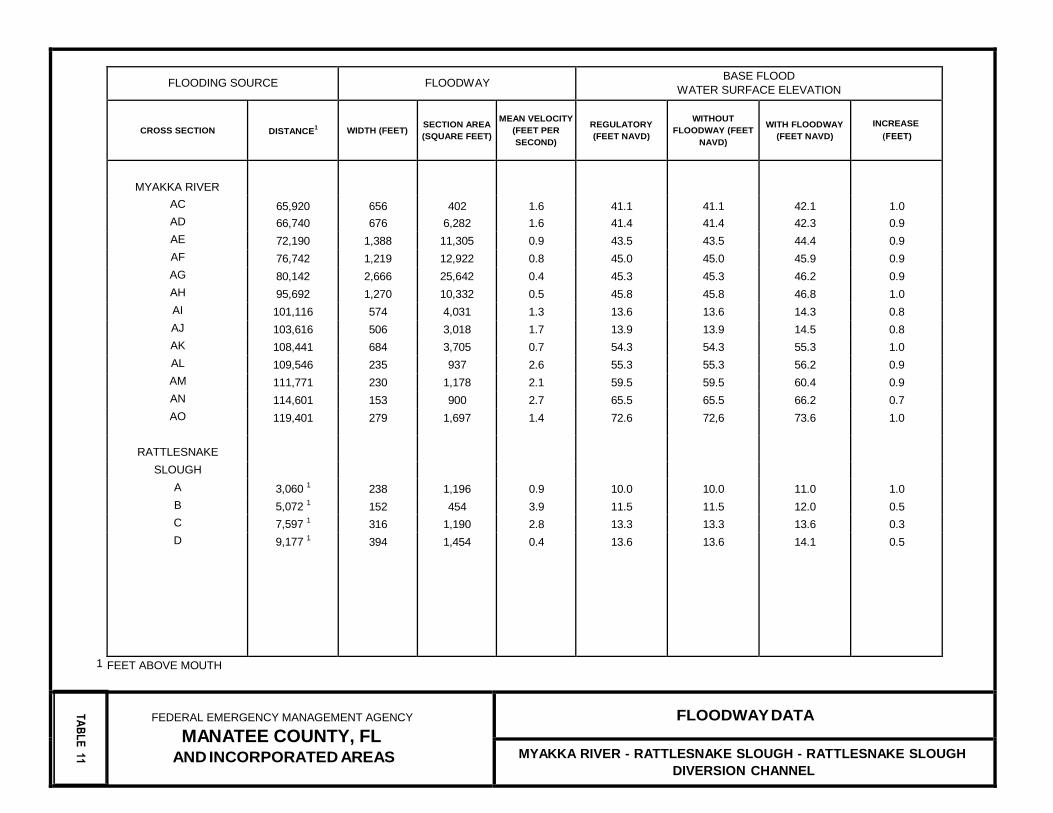
FLOODING SOURCE FLOODWAY BASE FLOOD
WATER SURFACE ELEVATION
CROSS SECTION DISTANCE1 WIDTH (FEET)
SECTION AREA
(SQUARE FEET)
MEAN VELOCITY
(FEET PER
SECOND)
REGULATORY
(FEET NAVD)
WITHOUT
FLOODWAY (FEET
NAVD)
WITH FLOODWAY
(FEET NAVD)
INCREASE
(FEET)
MYAKKA RIVER
65,920 656 402 1.6 41.1 41.1 42.1 1.0 AC
AD 66,740 676 6,282 1.6 41.4 41.4 42.3 0.9
AE 72,190 1,388 11,305 0.9 43.5 43.5 44.4 0.9
AF 76,742 1,219 12,922 0.8 45.0 45.0 45.9 0.9
AG 80,142 2,666 25,642 0.4 45.3 45.3 46.2 0.9
AH 95,692 1,270 10,332 0.5 45.8 45.8 46.8 1.0
AI 101,116 574 4,031 1.3 13.6 13.6 14.3 0.8
AJ 103,616 506 3,018 1.7 13.9 13.9 14.5 0.8
AK 108,441 684 3,705 0.7 54.3 54.3 55.3 1.0
AL 109,546 235 937 2.6 55.3 55.3 56.2 0.9
AM 111,771 230 1,178 2.1 59.5 59.5 60.4 0.9
AN 114,601 153 900 2.7 65.5 65.5 66.2 0.7
AO 119,401 279 1,697 1.4 72.6 72,6 73.6 1.0
RATTLESNAKE
SLOUGH
A 3,060 1 238 1,196 0.9 10.0 10.0 11.0 1.0
B 5,072 1 152 454 3.9 11.5 11.5 12.0 0.5
C 7,597 1 316 1,190 2.8 13.3 13.3 13.6 0.3
D 9,177 1 394 1,454 0.4 13.6 13.6 14.1 0.5
TA
BL
E 11
1 FEET ABOVE MOUTH
FEDERAL EMERGENCY MANAGEMENT AGENCY
MANATEE COUNTY, FL AND INCORPORATED AREAS
FLOODWAY DATA
MYAKKA RIVER - RATTLESNAKE SLOUGH - RATTLESNAKE SLOUGH
DIVERSION CHANNEL
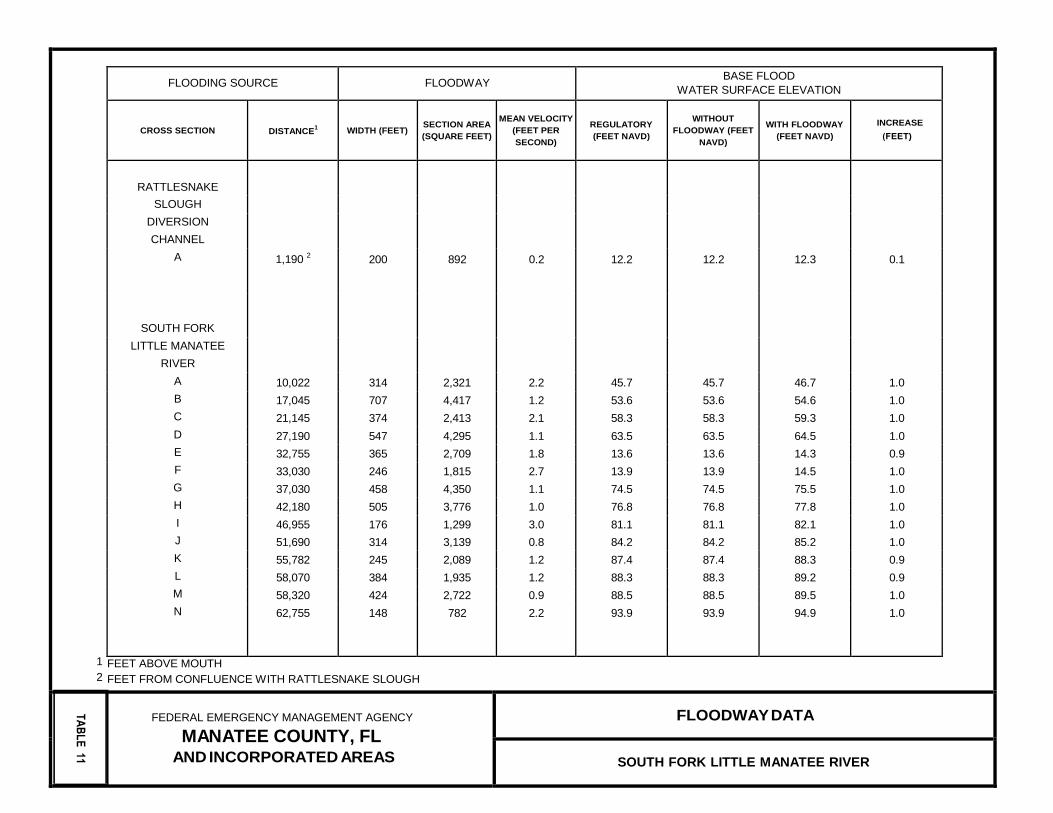
FLOODING SOURCE FLOODWAY BASE FLOOD
WATER SURFACE ELEVATION
CROSS SECTION DISTANCE1 WIDTH (FEET)
SECTION AREA
(SQUARE FEET)
MEAN VELOCITY
(FEET PER
SECOND)
REGULATORY
(FEET NAVD)
WITHOUT
FLOODWAY (FEET
NAVD)
WITH FLOODWAY
(FEET NAVD)
INCREASE
(FEET)
RATTLESNAKE
1,190 2 200 892 0.2 12.2 12.2 12.3 0.1
SLOUGH
DIVERSION
CHANNEL
A
SOUTH FORK
LITTLE MANATEE
RIVER
A 10,022 314 2,321 2.2 45.7 45.7 46.7 1.0
B 17,045 707 4,417 1.2 53.6 53.6 54.6 1.0
C 21,145 374 2,413 2.1 58.3 58.3 59.3 1.0
D 27,190 547 4,295 1.1 63.5 63.5 64.5 1.0
E 32,755 365 2,709 1.8 13.6 13.6 14.3 0.9
F 33,030 246 1,815 2.7 13.9 13.9 14.5 1.0
G 37,030 458 4,350 1.1 74.5 74.5 75.5 1.0
H 42,180 505 3,776 1.0 76.8 76.8 77.8 1.0
I 46,955 176 1,299 3.0 81.1 81.1 82.1 1.0
J 51,690 314 3,139 0.8 84.2 84.2 85.2 1.0
K 55,782 245 2,089 1.2 87.4 87.4 88.3 0.9
L 58,070 384 1,935 1.2 88.3 88.3 89.2 0.9
M 58,320 424 2,722 0.9 88.5 88.5 89.5 1.0
N 62,755 148 782 2.2 93.9 93.9 94.9 1.0
TA
BL
E 11
1 FEET ABOVE MOUTH
2 FEET FROM CONFLUENCE WITH RATTLESNAKE SLOUGH
FEDERAL EMERGENCY MANAGEMENT AGENCY
MANATEE COUNTY, FL AND INCORPORATED AREAS
FLOODWAY DATA
SOUTH FORK LITTLE MANATEE RIVER
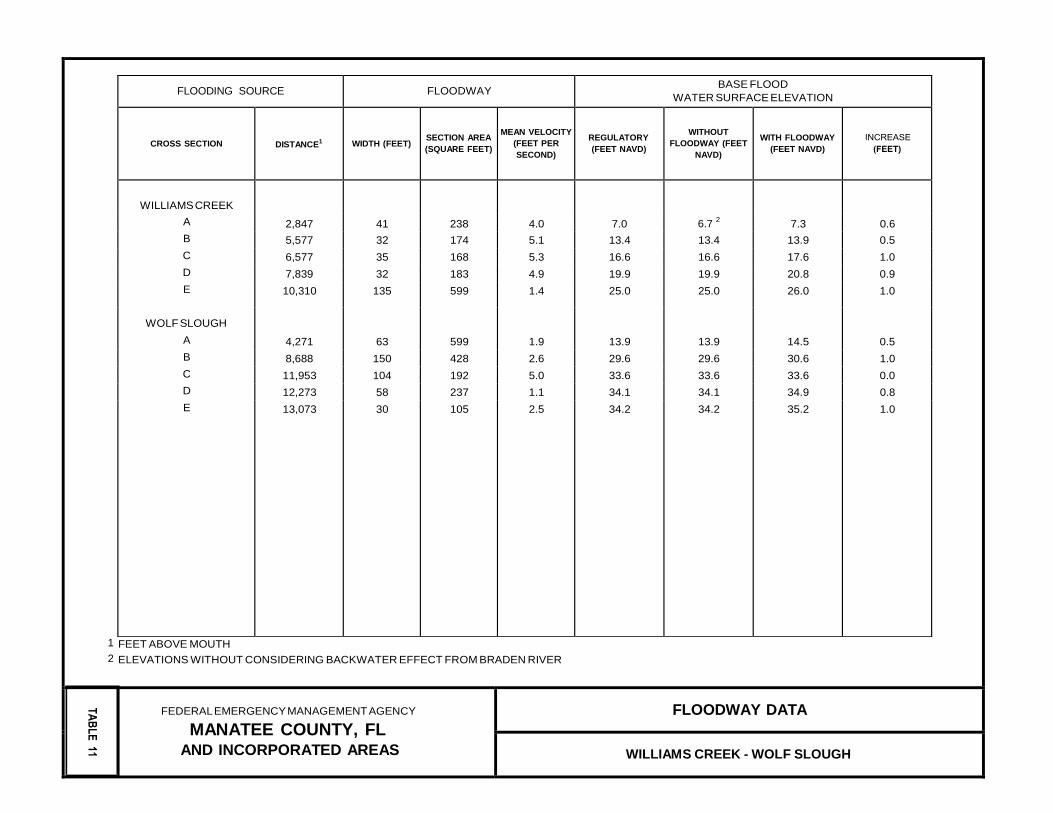
FLOODING SOURCE FLOODWAY BASE FLOOD
WATER SURFACE ELEVATION
CROSS SECTION DISTANCE1 WIDTH (FEET)
SECTION AREA
(SQUARE FEET)
MEAN VELOCITY
(FEET PER
SECOND)
REGULATORY
(FEET NAVD)
WITHOUT
FLOODWAY (FEET
NAVD)
WITH FLOODWAY
(FEET NAVD) (FEET)
WILLIAMS CREEK
2,847 41 238 4.0 7.0 6.7 2
7.3 0.6 A
B 5,577 32 174 5.1 13.4 13.4 13.9 0.5
C 6,577 35 168 5.3 16.6 16.6 17.6 1.0
D 7,839 32 183 4.9 19.9 19.9 20.8 0.9
E 10,310 135 599 1.4 25.0 25.0 26.0 1.0
WOLF SLOUGH
A 4,271 63 599 1.9 13.9 13.9 14.5 0.5
B 8,688 150 428 2.6 29.6 29.6 30.6 1.0
C 11,953 104 192 5.0 33.6 33.6 33.6 0.0
D 12,273 58 237 1.1 34.1 34.1 34.9 0.8
E 13,073 30 105 2.5 34.2 34.2 35.2 1.0
TA
BL
E 11
1 FEET ABOVE MOUTH
2 ELEVATIONS WITHOUT CONSIDERING BACKWATER EFFECT FROM BRADEN RIVER
FEDERAL EMERGENCY MANAGEMENT AGENCY
MANATEE COUNTY, FL AND INCORPORATED AREAS
FLOODWAY DATA
WILLIAMS CREEK - WOLF SLOUGH
INCREASE
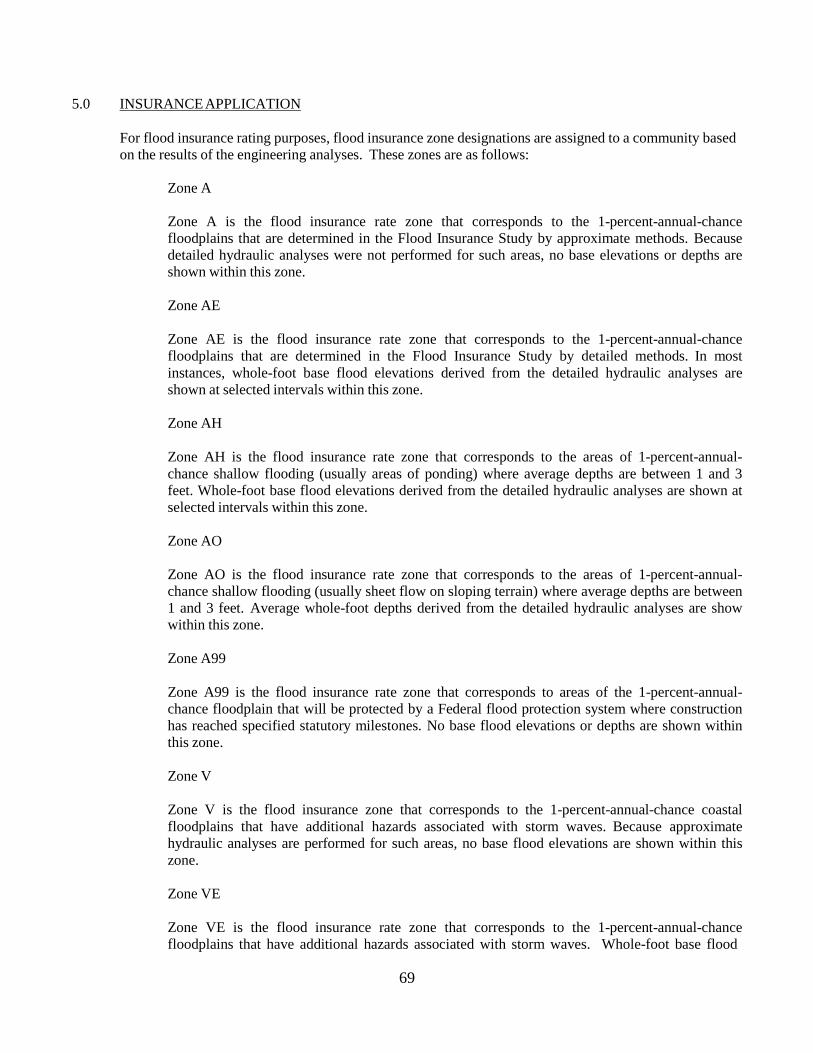
69
5.0 INSURANCE APPLICATION
For flood insurance rating purposes, flood insurance zone designations are assigned to a community based
on the results of the engineering analyses. These zones are as follows:
Zone A
Zone A is the flood insurance rate zone that corresponds to the 1-percent-annual-chance
floodplains that are determined in the Flood Insurance Study by approximate methods. Because
detailed hydraulic analyses were not performed for such areas, no base elevations or depths are
shown within this zone.
Zone AE
Zone AE is the flood insurance rate zone that corresponds to the 1-percent-annual-chance
floodplains that are determined in the Flood Insurance Study by detailed methods. In most
instances, whole-foot base flood elevations derived from the detailed hydraulic analyses are
shown at selected intervals within this zone.
Zone AH
Zone AH is the flood insurance rate zone that corresponds to the areas of 1-percent-annual-
chance shallow flooding (usually areas of ponding) where average depths are between 1 and 3
feet. Whole-foot base flood elevations derived from the detailed hydraulic analyses are shown at
selected intervals within this zone.
Zone AO
Zone AO is the flood insurance rate zone that corresponds to the areas of 1-percent-annual-
chance shallow flooding (usually sheet flow on sloping terrain) where average depths are between
1 and 3 feet. Average whole-foot depths derived from the detailed hydraulic analyses are show
within this zone.
Zone A99
Zone A99 is the flood insurance rate zone that corresponds to areas of the 1-percent-annual-
chance floodplain that will be protected by a Federal flood protection system where construction
has reached specified statutory milestones. No base flood elevations or depths are shown within
this zone.
Zone V
Zone V is the flood insurance zone that corresponds to the 1-percent-annual-chance coastal
floodplains that have additional hazards associated with storm waves. Because approximate
hydraulic analyses are performed for such areas, no base flood elevations are shown within this
zone.
Zone VE
Zone VE is the flood insurance rate zone that corresponds to the 1-percent-annual-chance
floodplains that have additional hazards associated with storm waves. Whole-foot base flood
70
elevations derived from the detailed hydraulic analyses are shown at selected intervals within this
zone.
Zone X
Zone X is the flood insurance rate zone that corresponds to the 0.2-percent-annual-chance
floodplain, areas within the 0.2-percent-annual-chance floodplain, and to areas of 1-percent-
annual-chance flooding where average depths are less than 1 foot, areas of 1-percent-annual-
chance flooding where the contributing drainage area is less than 1 square mile, and areas
protected from the 1-percent-annual-chance flood by levees. No base flood elevations or depths
are shown within this zone.
Zone D
Zone D is the flood insurance rate zone that corresponds to unstudied areas where flood hazards
are undetermined, but possible.
6.0 FLOOD INSURANCE RATE MAP
The Flood Insurance Rate Map is designed for flood insurance and floodplain management applications.
For flood insurance applications, the map designates flood insurance rate zones as described in Section
5.0 and, in the 1-percent-annual-chance floodplains that were studied by detailed methods, shows selected
whole-foot base flood elevations or average depths. Insurance agents use the zones and base flood elevations in conjunction with information on structures and their contents to assign premium rates for
flood insurance policies.
For floodplain management applications, the map shows by tints, screens, and symbols, the 1-percent-
annual-chance and 0.2-percent-annual-chance floodplains. Floodways and the locations of selected cross
sections used in the hydraulic analyses and floodway computations are shown where applicable.
The countywide FIRM presents flooding information for the entire geographic area of Manatee County.
Previously, FIRMs were prepared for each incorporated community and the unincorporated areas of the
County identified as flood-prone (References 1 through 7). This countywide FIRM also includes flood-
hazard information that was presented separately on Flood Boundary and Floodway Maps (FBFMs),
where applicable. Historical data relating to the maps prepared for each community are presented in
Table 11, “Community Map History.”
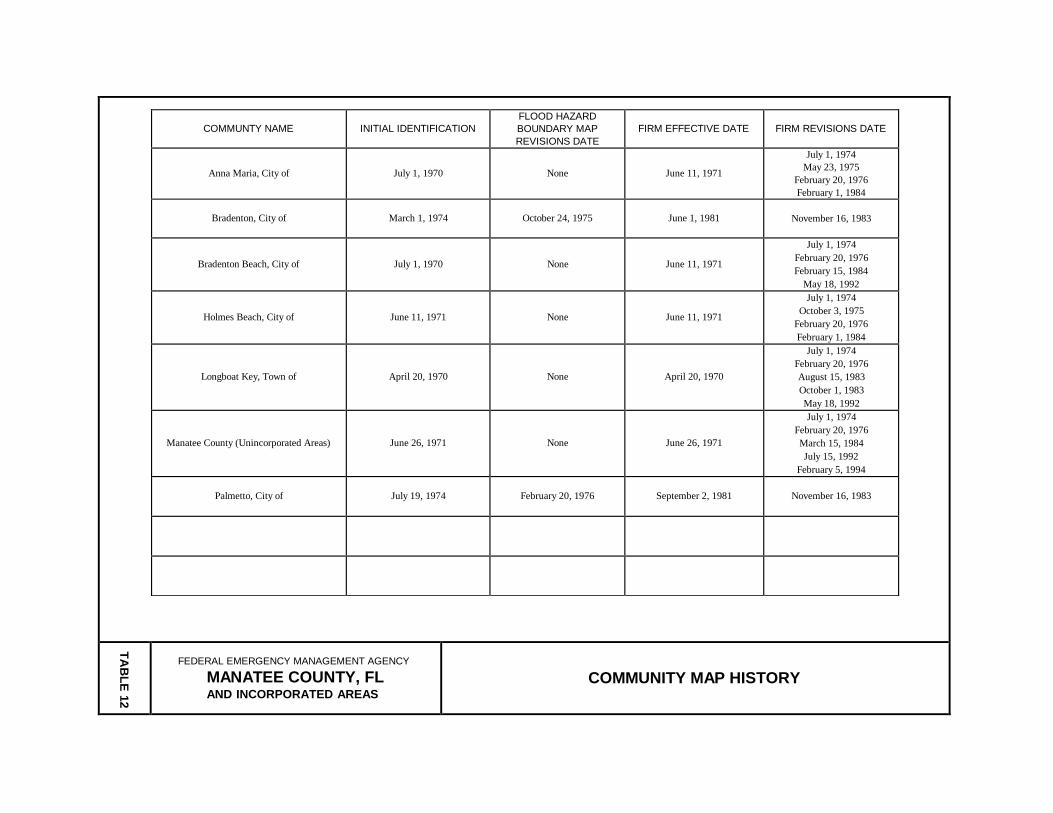
COMMUNTY NAME INITIAL IDENTIFICATION
FLOOD HAZARD
BOUNDARY MAP
REVISIONS DATE
FIRM EFFECTIVE DATE FIRM REVISIONS DATE
Anna Maria, City of July 1, 1970 None June 11, 1971
July 1, 1974
May 23, 1975
February 20, 1976
February 1, 1984
Bradenton, City of March 1, 1974 October 24, 1975 June 1, 1981 November 16, 1983
Bradenton Beach, City of July 1, 1970 None June 11, 1971
July 1, 1974
February 20, 1976
February 15, 1984
May 18, 1992
Holmes Beach, City of June 11, 1971 None June 11, 1971
July 1, 1974
October 3, 1975
February 20, 1976
February 1, 1984
Longboat Key, Town of April 20, 1970 None April 20, 1970
July 1, 1974
February 20, 1976
August 15, 1983
October 1, 1983
May 18, 1992
Manatee County (Unincorporated Areas) June 26, 1971 None June 26, 1971
July 1, 1974
February 20, 1976
March 15, 1984
July 15, 1992
February 5, 1994
Palmetto, City of July 19, 1974 February 20, 1976 September 2, 1981 November 16, 1983
TA
BL
E 1
2
FEDERAL EMERGENCY MANAGEMENT AGENCY
MANATEE COUNTY, FL AND INCORPORATED AREAS
COMMUNITY MAP HISTORY
72
7.0 OTHER STUDIES
Information pertaining to revised and unrevised flood hazards for each jurisdiction within
Manatee County, Florida, has been compiled into this FIS. Therefore, this FIS supersedes all
previously printed FIS reports, and FIRMs for all of the incorporated and unincorporated
jurisdictions within Manatee County, Florida (References 1, 2, 3, 4, 5, 6, and 7).
Flood Insurance Studies have previously been published for the adjacent jurisdictions of
DeSoto, Hardee, Hillsborough, Polk, and Sarasota County, Florida; (References 75, 76, 77
and 78).
A previous Flood Insurance Study for Manatee, Sarasota, and Charlotte Counties, Florida,
was prepared in 1973 (Reference 79). Other flood related studies that concentrate on portions
of the study area include a hydrobiological report that covers Little Manatee River
(Reference 65); a Water Resources Investigation by the U.S. Geological Survey on the
Myakka River basin (Reference 80); a U.S. Army Corps of Engineers, Jacksonville District,
survey report (Reference 81); and a Special Flood Hazard Information report (Reference #)
on the Manatee and Braden Rivers and their 100-year hurricane surge elevations for Tampa
Bay prepared in 1974 (Reference 82); and a report from the University of South Florida
prepared in 1972 (Reference 23) which presents the results of computer simulations of a
number of hurricanes which have affected the Tampa Bay region in the past.
The stillwater flood levels presented in this study are lower than those of the National
Oceanic and Atmospheric Administration on the open coast (Reference 38), especially at the
entrance to Tampa Bay. This difference is accounted for by differences in hydrodynamic
modeling techniques. Whereas the National Oceanic and Atmospheric Administration
assumed the existence of a straight shoreline not explicitly including the geometry of Tampa
Bay, this study adopted a detailed two-dimensional model in which the bay was treated as an
integral part. Within Sarasota Bay, between Cortez and Sarasota, the results of the stillwater
analysis of this study are closer to the National Oceanic and Atmospheric Administration
open coast stillwater values (Reference 79).
The U.S. Army Corps of Engineers 1974 study (Reference 82) predicted a 100-year
stillwater flood level that is higher than the stillwater results of this study. This difference is
the result of differences in the hydrodynamic model and in the statistical analysis.
The report from the University of South Florida (Reference 23) did not establish water levels
for specified return intervals but concentrated on four historical storms. The results for the
100-year surge level presented herein are in close agreement with the minimum building
levels suggested in the University of South Florida study in the area of Longboat Key and
regions just north of Sarasota.
This study is authoritative for the purposes of the National Flood Insurance Program data
presented herein either supersede or are compatible with all previous determinations.
8.0 LOCATION OF DATA
Information concerning the pertinent data used in preparation of this study can be obtained
by contacting Federal Insurance and Mitigation Division, FEMA Region IV, Koger Center –
Rutgers Building, 3003 Chamblee Tucker Road, Atlanta, GA 30341.
73
9.0 BIBLIOGRAPHY AND REFERENCES
1. Federal Emergency Management Agency, Federal Insurance Administration, Flood
Insurance Study, City of Anna Maria, Manatee County, Florida, Washington, D.C.,
August 1, 1983.
2. Federal Emergency Management Agency, Federal Insurance Administration, Flood
Insurance Study, City of Bradenton, Manatee County, Florida, Washington, D.C.,
May 16, 1983.
3. Federal Emergency Management Agency, Federal Insurance Administration, Flood
Insurance Study, City of Bradenton Beach, Manatee County, Florida, Washington,
D.C., August 15, 1983.
4. Federal Emergency Management Agency, Federal Insurance Administration, Flood
Insurance Study, City of Holmes Beach, Manatee County, Florida, Washington, D.C.,
August 1, 1983.
5. Federal Emergency Management Agency, Federal Insurance Administration, Flood
Insurance Study, Town of Longboat Key, Manatee and Sarasota Counties, Florida,
Washington, D.C., February 15, 1983.
6. Federal Emergency Management Agency, Flood Insurance Study, Manatee County,
Florida Unincorporated Areas, Washington, D.C., July 15, 1992.
7. Federal Emergency Management Agency, Federal Insurance Administration, Flood
Insurance Study, City of Palmetto, Manatee County, Florida, Washington, D.C., May
16, 1983.
8. Tetra Tech, Inc., Cities of Anna Maria, Brandenton Beach, Holmes Beach, and
Palmetto Flood Insurance Study for Federal Emergency Management Agency, under
Contract No. H-4510, April 1979.
9. Tetra Tech, Inc., City of Bradenton and Manatee County Unincorporated Areas Flood
Insurance Study for Federal Emergency Management Agency, under Contract No. H-
4510, March 1979.
10. Tetra Tech, Inc., Longboat Key Flood Insurance Study for Federal Emergency
Management Agency, under Contract No. H-4059, July 1978.
11. Engineering Methods & Application, Inc., Manatee County Flood Study for the
Federal Emergency Management Agency, Contract No. EMW-89-C-2823, May 4,
1992.
12. U.S. Army Corp of Engineers, Jacksonville District, Cedar Hammock, Manatee
County, Florida, Reconnaissance Report, March 1990.
13. BakerAECOM, Flood Insurance Study for Manatee County Florida, Alexandria
Virginia, September 2011.
74
14. Jones Edmunds & Associates, Inc., Watershed Evaluation Report Buffalo Canal /
Frog Creek Watershed Management Plan, Gainesville, Florida, October 2007.
15. Department of the Army, Army Corps of Engineers, Jacksonville, Cedar Hammock
(Wares Creek) Manatee County, Florida Section 205 Reconnaissance Report, March
1990.
16. Southwest Florida Water Management District and PhotoScience Inc., 2009 Digital
Orthophotos - Manatee County, Brooksville Florida, 2009.
17. Manatee County Department of Information Technology, Office of Geographic
Informations Systems, Vector GIS Base Layers, compiled between 2003 and 2009.
18. Southwest Florida Water Management District, 2007 Southwest Florida Water
Management District (SWFWMD) LiDAR: Hillsborough/Little Manatee Districts,
Charleston, SC, 2008.
19. U.S. Department of Commerce, Bureau of the Census, Final Report PC(l) - All, 1970
Census of Population, Number of Inhabitants, Florida, 1971.
20. US Census Bureau, 2010 Census, 2010 Census Demographic Profile, Online Linkage:
http://www.census.gov/popfinder/, Washington DC, October 01, 2011.
21. University of Florida, Coastal Engineering Laboratory, Storm Tides in Florida as
Related to Coastal Topography, Engineering Progress at the University of Florida,
vol. XVI, no. 1, Bulletin Series 109, P. Bruun, T. Chiu, F. Gerritsen, and W.H.
Morgan, January 1962.
22. U.S. Department of Commerce, National Oceanic and Atmospheric Administration,
National Weather Service, Technical Memorandum NWS Hydro-20, Storm Tide
Frequency Analysis for the Gulf Coast of Florida From Cape San Blas to St.
Petersburg Beach, F.P. Ho and R.J. Tracey, April 1975.
23. University of South Florida, Hurricanes, Melvin W. Anderson and Bernard E. Ross,
December 1972.
24. U.S. Department of the Army, Corps of Engineers, Jacksonville District, Survey
Report, Analysis of Hurricane Problems in Coastal Areas of Florida, September 29,
1961.
25. U.S. Department of the Army, Corps of Engineers, Jacksonville District, Appraisal
Report, Hurricanes Affecting the Florida Coast, July 1956.
26. U.S. Department of Commerce, Environmental Science Services Administration,
Technical Memorandum WBTM, Hydro 11, Joint Probability Method of Tide
Frequency Analysis, V.A. Myers, April 1970.
27. U.S. Department of Commerce, National Oceanic and Atmospheric Administration,
National Climatic Center, Tropical Cyclone Deck 993, 1975.
28. U.S. Department of Commerce, Weather Bureau, Technical Paper 55, Tropical
Cyclones of the North Atlantic Ocean 1871-1963, G.W. Cry, 1965.
75
29. U.S. Department of Commerce, National Oceanic and Atmospheric Administration,
National Weather Service, Technical Report NWS 15, Some Climatological
Characteristics of Hurricanes and Tropical Storms, Gulf and East Coasts of the U.S.,
F.P. Ho, R.W. Schwerdt, and H.V. Goodyear, May 1975.
30. U.S. Department of Commerce, National Hurricane Research Project, Report No. 5,
Survey of Meteorological Factors Pertinent to Reduction of Loss of Life and Property
in Hurricane Situations, March 1957.
31. U.S. Department of Commerce, National Oceanic and Atmospheric Administration,
National Weather Service, Monthly Weather Review, Abstracts of Previous Year
Hurricane Season 1964 to 1977.
32. U.S. Department of Commerce, National Oceanic and Atmospheric Administration,
National Weather Service, Tape of Digitized Storm Information From 1886 Through
1977, Asheville, North Carolina, December 1978.
33. Tetra Tech, Inc., Coastal Flooding Handbook, Parts I and II, May 1977.
34. U.S. Department of Commerce, National Oceanic and Atmospheric Administration,
National Ocean Survey, Nautical Charts, 1:960,000: Chart 11408 (September 1977);
Chart 11409 (February 1977); Chart 11401; Chart 11412 (April 1977); Chart 11413;
Chart 11414; Chart 11424 (February 1976); Chart 11425; Chart 11426 (July 1977).
35. U.S. Department of the Interior, Geological Survey, 7.5-Minute Series Topographic
Maps, Scale 1:24,000, Contour Interval 5 feet: Cockroach Bay, Florida (1956),
Photorevised (1969 and 1972); Ruskin, Florida (1956), Photorevised (1969);
Wimauma, Florida (1956), Photorevised (1969); Fort Lonesome, Florida (1952),
Photorevised (1972); Duette NE, Florida (1956), Photorevised (1972); Egmont Key,
Florida (1964), Photorevised (1969); Anna Maria, Florida (1964), Photorevised
(1969); Palmetto, Florida (1964), Photorevised (1969); Parrish, Florida (1973); Rye,Florida (1972); Keentown, Florida (1956), Photorevised (1972); Duette, Florida
(1956), Photorevised (1972); Bradenton Beach, Florida (1964), Photorevised (1969);
Bradenton, Florida (1964), Photorevised (1969); Lorraine, Florida (1973); Verna,
Florida (1973); Myakka City, Florida (1956), Photorevised (1972); Myakka Head,
Florida (1956); Sarasota, Florida (1973); Bee Ridge, Florida (1973); Old Myakka,
Florida (1973); Myakka City NW, Florida (1956); Edgeville, Florida (1956);
Murdock NW, Florida (1956), Photorevised (1972); Murdock NE, Florida (1956).
36. National Academy of Sciences, Methodology for Calculating Wave Action Effects
Associated with Storm Surges, 1977.
37. Federal Emergency Management Agency, Users Manual for Wave Height Analysis,
Revised April 1981.
38. Real Estate Data, Inc., Real Estate Atlas of Manatee County, Florida, Scales 1:7,200,
1:8,400, 1:10,800, 1:21,600, 1976 and 1979.
39. M.D. Teubner and B.J. Noye, Numerical Simulation of Fluid Motion, Edited by John
Noye, North Holland Press, 1978.
76
40. U.S. Water Resources Council, Bulletin 17, Guidelines for Determining Flood Flow
Frequency, March 1976 (Revised June 1977).
41. Reynolds, Smith and Hill, Inc., Floodplain Study for the Lower Manatee River,
Manatee County, Florida, March 1982.
42. U.S. Department of the Interior, Geological Survey, Water Resources Investigations
23-74, An Approach to Estimating Flood Frequency for Urban Areas in Oklahoma,
V.B. Sauer, July 1974.
43. U.S. Department of the Interior, Geological Survey, Flood Profiles for Cypress Creek,
West Central Florida, W.R. Murphy, 1978.
44. Southwest Florida Water Management District, Report on the Hydrobiologic
Assessment of the A1afia and Little Manatee Rivers, 1974.
45. U.S. Department of the Army, U.S. Army Corps of Engineers, Jacksonville District,
Phase I, Inspection Report, National Dam Safety Program, Lake Manatee Dam,
Manatee County, Florida, Inventory FL 280, February 1978.
46. U.S. Department of the Interior, Geological Survey, Magnitude and Frequency of
Flooding on the Myakka River, Southwest Florida, Tallahassee, Florida, 1978.
47. U.S. Geological Survey, 7.5-Minute Series Topographic Maps, Scale 1:24000,
Contour Interval 5 Feet: Bradenton, Florida, 1964, Photorevised 1969; Lorraine,
Florida, 1973; Palmetto, Florida, 1964, Photorevised 1969; Parrish, Florida, 1973;
Rye, Florida, 1972.
48. Southwest Florida Water Management District, Aerial Photography, scale 1”24000,
Contour Interval 1 Foot: Braden River Basin, July 1978, South Fork Little Manatee
River, December 1987; Upper Braden River Basin, November 1985; Parrish,
September 1986; Lake Manatee, April 1982; Palmetto/Lower Manatee River Basin,
April 1980.
49. Florida Department of Transportation, Stereo Aerial Photography, Scale 1:24000,
Contour Interval 1 Foot: April 1987.
50. U.S. Geological Survey, Techniques for Estimating Magnitude and Frequency of
Floods on Natural-Flow Streams in Florida, Water-Resource Investigations 82-4012,
1982.
51. , Flood Characteristics of Urban Watersheds in the United States, Water-
Supply Paper 2207, 1984.
52. Southwest Florida Water Management District, Floodplain Information on the Braden
River, Manasota Basin Board, Brooksville, Florida, September 1983.
53. U.S. Department of the Army, U.S. Army Corps of Engineers, Hydrologic
Engineering Center, HEC-2 Water Surface Profiles, Computer Program 723-X6-
L202A, Davis, California, September 1988.
77
54. Streamline Technologies, Interconnected Channel and Pond Routing Model (ICPR),
Version 3.10, Service Pack 4, Winter Springs, Florida, 2007.
55. Environmental Systems Research Institute (ESRI), ArcGIS, version 9.3, June 26,
2008.
56. Environmental Systems Research Institute (ESRI), Arc Hydro, 2002.
57. Southwest Florida Water Management District, Watershed Management Plan Buffalo
Canal / Frog Creek, Project L007, October 2010.
58. Southwest Florida Water Management District, Southwest Florida Water
Management District’s Watershed Management Program Guidelines and
Specifications, 2002.
59. Golding, B.C., DABRO-Drainage Basin Runoff Model-A Computer Program.
Hieldebran Software, Orlando, Florida, 1986.
60. U.S. Geological Survey, Scientific Investigations Report (SIR) 2005-5080 Estimating
the Magnitude and Frequency of Floods for Streams in West-Central Florida, 2001,
published 2005.
61. Northwest Florida Water Management District, Use of Wetland Designations as
Supplement to Existing Zone A Floodplain Boundaries, Online Linkage:
http://nwfwmdfloodmaps.com/pdf/3-Use_of_wetland_designations.pdf, undated.
62. U.S. Department of the Army, Corps of Engineers, Hydrologic Engineering Center,
Applications of the HEC-2 Bridge Routines, Davis, California, June 1974.
63. U.S. Department of the Army, Corps of Engineers, Hydrologic Engineering Center,
HEC-2 Water-Surface Profiles, Users Manual, Davis, California, November 1976.
64. U.S. Department of the Interior, Geological Survey, Computer Program E-431,
Computer Applications for Step-Backwater and Floodway Analyses, 1976.
65. Southwest Florida Water Management District, Report on the Hydro-biologic
Assessment of the Alafia and Little Manatee Rivers, 1974.
66. Southwest Florida Water Management District, Floodplain Information on the Braden
River, Manasota Basin Board, Brooksville, Florida, September 1983.
67. U.S. Army Corp of Engineers, Hydrologic Engineering Center, HEC-2 Water Surface
Profiles, Computer Program 723-X6-L202A, Davis, California, September 1988.
68. U.S. Army Corp of Engineers, Hydrologic Engineering Center, HEC-RAS River
Analysis System Software, Version 4.1, Davis California, January 2010.
69. Southwest Florida Water Management District, Aerial Photography with Contours,
Scale 1:2,400, Contour Interval 1 foot: Pa1metto Lower Manatee-Manasota Basin,
Manatee County, Florida, May 1980.