Embed Size (px)
Citation preview
Sediment-Water Exchange and Estuarine Mixing Fluxes of Mercury and Monomethyl Mercury in the San Francisco Bay Estuary
and Delta (Task 4B)
Final Report Submitted to the Calfed Bay-Delta Program as Part of the Calfed Mercury Project Entitled:
Assessment of Ecological and Human Health Impacts of
Mercury in the Bay-Delta Watershed
Submitted by:
Gary A. Gill, Key-Young Choe, Ron Lehman, and Seunghee Han
Laboratory for Oceanographic and Environmental Research Texas A&M University at Galveston
5007 Avenue U Galveston, TX 77551
[email protected] (e-mail)
409-740-4710 (voice)
Subcontract No. 22-1509-2298 (SJSU Foundation) Prime Contract: USBR No. 99FC200241
CALFED Tracking number 99-B06
This Document is Available from the Calfed Mercury Program Web Site:
http://loer.tamug.tamu.edu/calfed

EXECUTIVE SUMMARY
This report summarizes the project accomplishments of Texas A&M University at Galveston (TAMUG) as a participant in the Calfed Bay-Delta Mercury Project. The major objective of the Calfed Mercury Program is to reduce mercury concentrations in fish tissue to levels that do not pose a wildlife or human health threat. Specific bbjectives of TAMUG include: 1. Quantification of the Sediment-Water Exchange Flux of Total Mercury (THg),
Monomethylmercury (MMHg) and Inorganic Mercury (IHg) in the Estuarine and Delta Region of San Francisco Bay (Task 4B1)
2. Determination of the Transport and Flux of Mercury Species into (and out of) the
San Francisco Bay Estuarine System from Riverine Sources and Estuarine Flushing 3. Determination of the Temporal Variation of MMHg Production at Selected "Hot
Spots" in the Estuarine and Delta Region of San Francisco Bay. Five field sampling trips were conducted between May/June 2000 and October 2001. Nine locations were occupied for determinations of the sediment-water exchange flux of Hg and MMHg in the San Francisco Bay – Delta Region. Sampling consisted of benthic flux chamber deployments, collection of in situ intact cores for determination of sediment pore water concentration gradients, and high-resolution microelectrode profiling of oxygen and sulfide in sediments. Estuarine transect sampling was conducted twice, once during low riverine flow conditions (September 2000) and once during high flow conditions (March 2001). Samples were collected across the salinity gradient from the Golden Gate Bridge to the Delta. Major Findings (Working Hypotheses): • During low riverine flow conditions, the sediment-water exchange of Hg and MMHg
within the Delta rivals that of external riverine sources. During high riverine flow conditions external sources (primarily the Sacramento River and when flowing Prospect Slough) dominate the input of both Hg and MMHg into the Delta.
• Sediment-water exchange fluxes of both total Hg and MMHg appear to vary significantly throughout the Delta, both temporally and spatially.
• The Cosumnes River sediments appear to be a significant source of MMHg to the tributary.
• Diffusional flux estimates of MMHg and inorganic Hg appear to underestimate the sediment-water exchange flux for Hg as determined by Benthic Flux Chamber deployments. There are several possible reasons for this discrepancy that will require further investigation.
CCAALLFFEEDD MMeerrccuurryy PPrroojjeecctt –– TTAAMMUUGG FFiinnaall RReeppoorrtt ((TTaasskk 44BB)) Page 2
• Marshes bordering Frank’s Tract appear to be very important sites of MMHg production and are significant sources of MMHg to Frank’s Tract. Whether marshes are significant sources Delta wide remains to be determined.
• Both total Hg and MMHg exhibited non-conservative estuarine mixing profiles. There appears to be a mid estuary source for total Hg around a salinity of 12 ppt. MMHg is highest (~ 0.065 ng/L) in freshwater, drops to minimal values around 0.015 ng/L at mid salinities and appears to rise slightly to around 0.02 ng/L at the salt water end-member.
CCAALLFFEEDD MMeerrccuurryy PPrroojjeecctt –– TTAAMMUUGG FFiinnaall RReeppoorrtt ((TTaasskk 44BB)) Page 3
INTRODUCTION
The Calfed Mercury Project – Background and Objectives Background. About 90 percent of the mercury produced in the United States between 1850 and 1980 was mined in the Coast Range of California. There were 320 mercury mines including several of the world’s largest. Much of the mercury was transported across the Central Valley and lost in Sierra Nevada placer gold mining activities. As a result widespread contamination occurred in mountain waterways and downstream in valley rivers and in the Sacramento-San Joaquin Delta Estuary (Bay-Delta). Recent studies have determined that large amounts of mercury (350-750 kg) are still being transported annually into the Bay-Delta from both the Coast Range and from the Sierra Nevada (Foe and Croyle, 1998; Larry Walker and Associates, 1998; Roth et al., 1998). While not all sources of the mercury have yet been identified, Cache Creek in the Coast Range appears to be a major input. Health advisories have been posted in the Bay-Delta recommending no consumption of large striped bass and shark because of elevated concentrations of mercury and PCBs (San Francisco Regional Water Quality Control Board, 1995). More recent sampling has demonstrated high concentrations in several other species of piscivorous sport fish in Cache Creek and in the Bay-Delta suggesting that mercury contamination is more widespread than previously thought and that additional advisories may be warranted. Also, elevated concentrations of mercury in fish tissue may represent a hazard to piscivorous wildlife although much less is known about this. Objectives. The present mercury project is funded by CALFED, an ambitious long-term program to improve water management in the Bay-Delta Estuary. The program includes, in addition to water management, ecosystem restoration, levee stabilization and water quality components. The main goal of the mercury element of the water quality program is to reduce mercury concentrations in fish tissue to levels that do not pose a wildlife or human health threat. The Calfed Mercury Research Group consists of 15 pricncipal investigators from State and Federal Agencies, Universities, as well as private analytical laboratories, and non-profit agencies (see: http://loer.tamug.tamu.edu/calfed). The mercury research group is headed by Dr. Mark Stephenson of the California Department of Fish and Game. TAMUG Project Objectives Texas A&M University at Galveston was involved with 3 tasks as part of the overall Calfed Mercury Research Project. A description of the tasks is briefly outlined below. Sediment-Water Exchange Flux Measurements (Task 4B1). Quantification of the Sediment-Water Exchange Flux of Total Mercury (THg), Monomethylmercury (MMHg)
CCAALLFFEEDD MMeerrccuurryy PPrroojjeecctt –– TTAAMMUUGG FFiinnaall RReeppoorrtt ((TTaasskk 44BB)) Page 4
and Inorganic Mercury (IHg) in the Estuarine and Delta Region of San Francisco Bay (Task 4B1). Estuarine Water Column Transects (Tasks 4B1 and 4B2). Determination of the Transport and Flux of Mercury Species into (and out of) the San Francisco Bay Estuarine System from Riverine Sources and Estuarine Flushing. Temporal Variability of Mercury Methylation in Sediments (Task 4B3). Determination of the Temporal Variation of Methylmercury Production at Selected "Hot Spots" in the Estuarine and Delta Region of San Francisco Bay. Delta Sampling Locations and Field Sampling Program Sediment-Water Exchange Studies (Task 4B – 1). Nine locations were occupied during five separate field sampling efforts, between May/June 200 and October 2001 for determinations of the sediment-water exchange flux of Hg and MMHg in the San Francisco Bay – Delta Region (Table 1 and Figure 1). A sample collection matrix detailing the types of samples collected at each site during the field program is given in Table 1. The parameters for which samples were collected from the flux chamber deployments include mercury, monomethyl mercury, trace metals (e.g. iron and manganese), nutrients (nitrite, nitrate, phosphate), sulfate, and oxygen. Not all parameters were obtained in each individual chamber. Typically, two cores were collected from each site and the pore water was extruded for determinations of interstitial pore water gradients. Because of the small volumes obtained (typically 2-6 mL), individual cores are needed for mercury and monomethyl mercury measurements. Estuarine Transect Studies (Task 4B – 2). Two estuarine transects were undertaken in the San Francisco Bay estuary, one in September-October 2000 (during low flow) and another in March 2001 (during high flow). Surface water samples were collected at nineteen sites across a salinity gradient from the Golden Gate Bridge to the fresh water end-member(s) in the western Delta (Figure 2). Samples were collected for the determination of total Hg, filtered Hg (0.45 µm), total MMHg, filtered MMHg (0.45 µm), and ancillary parameters (e.g. TSS, salinity, nutrients, etc.) at all sites. At nine of the sites, samples were also collected for the determination of colloidal Hg and colloidal MMHg. Information on mercury phase speciation in the San Francisco Bay estuary is given in Appendix A and B. Special Investigations. In addition the normal sampling program, several special studies were conducted during the various field sampling events to investigate special aspects of Hg cycling in the Delta. These studies included: (1) A 24 hour flux chamber deployment was made in Frank’s Tract to investigate whether there is a diurnal cycle to the sediment-water exchange flux of Hg or MMHg in the Delta. (2) On two of the flux chamber deployment periods (Sept. 2000 and October 2001), chambers were deployed that had one side darkened to eliminate light penetration, while the other side was left uncovered to permit light to penetrate to the sediment surface. These deployments
CCAALLFFEEDD MMeerrccuurryy PPrroojjeecctt –– TTAAMMUUGG FFiinnaall RReeppoorrtt ((TTaasskk 44BB)) Page 5
were conducted to determine if photosynthetic benthic processes were actively influencing the sediment-water exchange flux of Hg or MMHg. (3) A core tube was specially modified to enable it to serve as a flux chamber and be deployed in the peat rich sediments present at the West Columbia site. This special deployment was designed to elucidate the importance of peat rich sediments with respect to methylmercury production and flux to overlying waters. (4) Surface water transect studies were conducted in Frank’s Tract to investigate the importance of nearshore marsh areas as habitats of particular importance to the production of MMHg. (5) Time series measurements of Hg and MMHg were conducted at the entrance to a marsh to monitor changes in mercury concentration associated with water entering and leaving the marsh during a tidal event. Participation in Intercalibration QA. TAMUG received and analyzed three sets of intercalibration samples for total Hg and/or monomethyl mercury as part of the Calfed QA requirements. The results of this effort will be reported by Frontier Geosciences.
RESULTS AND DISCUSSION
All data available to date are tabulated following this report. Figures and tables referred to in the text are collected at the end of this report. Additional information is also available in appendices attached to this report. Mercury in Pore Water Total Mercury Concentrations in Pore water. Illustrated in Figure 3 are the concentrations of total (dissolved) mercury observed in interstitial pore water from several sites obtained during five separate sampling periods. The majority of the sites had total Hg concentrations in pore water ranging between 1 and 8 ng/L (5 to 40 pM), only marginally elevated over overlying water column concentrations. The highest total mercury pore water concentrations were observed in the Cosumnes River (max = 28 ng/L @ 1.5 cm depth) and in Franks Tract (~ 45 ng/L at depths ≥1 cm) during the May/June 2000 sampling period. Most sites had higher Hg concentrations in May 2000 or May 2001 than in September 2000 or February 2001. Inter-site variation was greater in May 2000 or 2001 than in September 2000 and February 2001. In general, maximum total Hg concentrations were observed between 1 and 5 cm depth at all sites. The explanation for the elevated Hg concentrations in deep sediments of Franks Tract in May 2000 and White Slough in May 2001 is not clear. One possibility could be significant heterogeneity in the sediments rather than seasonal changes because such enhancements were not observed in other sampling events. Monomethyl Mercury Concentrations in Pore water. Illustrated in Figure 4 are the concentrations of (dissolved) MMHg observed in interstitial pore water from several sites obtained during five separate sampling periods. Most sampling sites had MeHg
CCAALLFFEEDD MMeerrccuurryy PPrroojjeecctt –– TTAAMMUUGG FFiinnaall RReeppoorrtt ((TTaasskk 44BB)) Page 6

concentrations ranging from 1 to 20 pM. The Cosumnes River, Franks Tract, Franks Tract marsh, and White Slough had higher MeHg concentrations than Little Holland, Prospect Slough, and Sherman Island. Significant seasonal variation was observed in MeHg concentrations at Cosumnes River and Franks Tract marsh sediments, where MeHg concentration measurements were conducted in February 2001. Significant seasonal variations in porewater MeHg concentrations were also observed by Bloom et al. (1999) in Lavaca Bay. They observed that a short, but very strong methylation period in early spring, followed by a slow year-long decrease. In this study, however, no MeHg concentration decrease was observed from May to September, but MeHg concentrations in September often exceeded those in May. Maximum MHg concentrations were found at depths between 1 and 2 cm in most cores. This distributional feature is consistent with those reported for other aquatic systems such as Lavaca Bay (Mason et al., 1998; Bloom et al., 1999), and the Florida Everglades (Gilmore et al., 1998). It has been widely recognized that MeHg production is mainly mediated by sulfate-reducing bacteria (Compeau and Bartha, 1985; Gilmour et. al., 1992), and temperature is an important parameter influencing Hg methylation rate (Gilmore et al., 1998). In this study area, the overlying water temperature during the day averaged ~ 22 °C in May and September and ~ 11 °C in February. Elevated MMHg concentrations observed near the sediment-water interface during warm periods appeared to result from enhanced Hg methylation rates. Methylation rates were not measured directly in this study. However, Gilmore et al. (1998) suggested that the in situ Hg methylation rate controls MMHg concentrations in porewaters in Florida Everglades sediments. Mercury Fluxes Determined From Pore Water Concentration Gradients. The pore water concentration gradients discussed above can be used to estimate the diffusion of inorganic Hg and MMHg from pore water to overlying sediments. The approach for the modeling of various Hg species from interstital pore water has been described in detail by Gill et al. (1999). Briefly, The diffusion of ions or molecules in interstitial pore fluids, in the absence of biological irrigation, can be modeled based on a modification of Fick’s First Law:
Flux (F) = - ⎟⎟⎟
⎠
⎞
⎜⎜⎜
⎝
⎛
2θϕ wD
xC
∂∂
Where:
θ - tortuosity (dimensionless) ϕ - sediment porosity Dw - diffusion coefficient (in absence of the sediment matrix)
Tortuosity is a parameter which is not readily measured, but fortunately a relationship between tortuosity and porosity has been proposed:
CCAALLFFEEDD MMeerrccuurryy PPrroojjeecctt –– TTAAMMUUGG FFiinnaall RReeppoorrtt ((TTaasskk 44BB)) Page 7

θ2 = 1 - ln (ϕ2) (Boudreau, 1996)
The diffusion coefficients used for the calculations are taken from Gill et al. (1999). The results obtained for the diffusion calculations are given in Table 2. For these calculations, the concentration gradient used is between overlying water and the first depth interval at which a pore water measurement was available. Also shown for selected sites (in parentheses) is the flux calculated using the concentration gradient for first two pore water depth intervals. In many cases the maximum pore water concentration is not the surface value and this gives a sense of the maximum flux possible based on concentration gradients present. For these calculations, it is also assumed that the mercury species fluxing out of sediments is neutrally charged monomethyl mercury chloride and that the inorganic form is mercury chloride (HgCl2). The fluxes given would be about a factor of 5 lower if these species are associated with macromolecular organic matter. There was a wide range (~ 900-fold) in the predicted MMHg diffusive fluxes for the sampling sites, ranging from a low of ~ 0.5 pmol/m2/day (0.1 ng/m2/day) at Little Holland and Honker Bay in May/June, at Frank’s Tract marsh in February 2001, and in White slough in October 2001, to a maximum of 440 pmol/m2/day (88 ng/m2/day) in Cosumnes River in September 2000. The highest MMHg fluxes were observed in Franks Tract, West Columbia Cut (in a peat core) and in the Cosumnes River. The Total Hg diffusive fluxes did not show quite as wide a range in fluxes (~200-fold), ranging from a minimum of 1.7 pmol/m2/day (0.34 ng/m2/day) at Frank’s Tract marsh in February 2001, to 350 pmol/m2/day (70 ng/m2/day) at the Consumnes River in May 2001. The Cosumnes River flux predictions are particularly interesting for the first two sampling periods (May and September 2000) – it appears that ~ half of the total Hg fluxing out of the system was monomethyl mercury! Benthic Flux Chamber Deployments Sediment-water exchange flux measurements determined from benthic flux chamber deployments are summarized in Table 2. Details on the operation of the benthic flux chambers are given in Gill et al. (1999). For the initial sampling in May/June 2000 fluxes were determined using transparent (light) chambers; for the September 2000 and October 2001 deployments, one side of the dual chamber deployments was darkened to investigate light/dark differences in exchange flux. These light/dark chamber results will be discussed separately in the section on special investigations. No flux chamber deployments were made at Cosumnes River in May or September 2000 because a suitable deployment site could not be identified. The flux chamber deployment at W. Columbia Cut in September was made using a large diameter core tube inserted directly into a peat on the side of shelf. No chamber deployments were
CCAALLFFEEDD MMeerrccuurryy PPrroojjeecctt –– TTAAMMUUGG FFiinnaall RReeppoorrtt ((TTaasskk 44BB)) Page 8
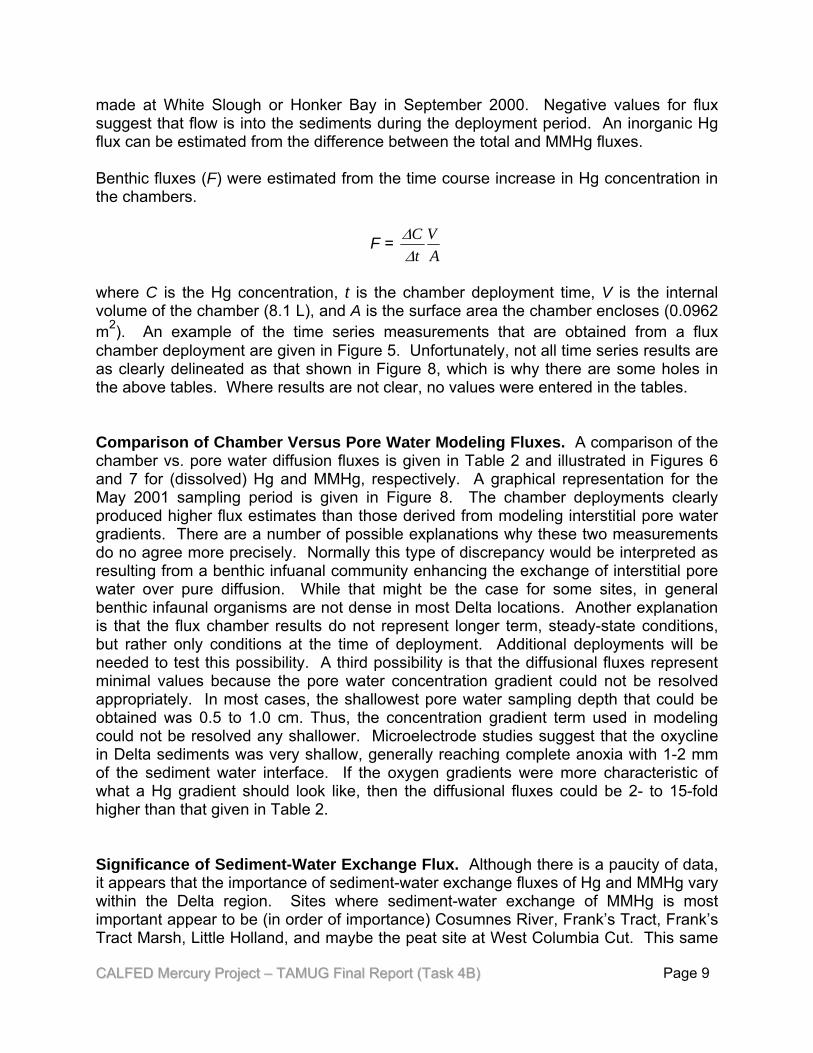
made at White Slough or Honker Bay in September 2000. Negative values for flux suggest that flow is into the sediments during the deployment period. An inorganic Hg flux can be estimated from the difference between the total and MMHg fluxes. Benthic fluxes (F) were estimated from the time course increase in Hg concentration in the chambers.
F = AV
tC
∆∆
where C is the Hg concentration, t is the chamber deployment time, V is the internal volume of the chamber (8.1 L), and A is the surface area the chamber encloses (0.0962 m2). An example of the time series measurements that are obtained from a flux chamber deployment are given in Figure 5. Unfortunately, not all time series results are as clearly delineated as that shown in Figure 8, which is why there are some holes in the above tables. Where results are not clear, no values were entered in the tables. Comparison of Chamber Versus Pore Water Modeling Fluxes. A comparison of the chamber vs. pore water diffusion fluxes is given in Table 2 and illustrated in Figures 6 and 7 for (dissolved) Hg and MMHg, respectively. A graphical representation for the May 2001 sampling period is given in Figure 8. The chamber deployments clearly produced higher flux estimates than those derived from modeling interstitial pore water gradients. There are a number of possible explanations why these two measurements do no agree more precisely. Normally this type of discrepancy would be interpreted as resulting from a benthic infuanal community enhancing the exchange of interstitial pore water over pure diffusion. While that might be the case for some sites, in general benthic infaunal organisms are not dense in most Delta locations. Another explanation is that the flux chamber results do not represent longer term, steady-state conditions, but rather only conditions at the time of deployment. Additional deployments will be needed to test this possibility. A third possibility is that the diffusional fluxes represent minimal values because the pore water concentration gradient could not be resolved appropriately. In most cases, the shallowest pore water sampling depth that could be obtained was 0.5 to 1.0 cm. Thus, the concentration gradient term used in modeling could not be resolved any shallower. Microelectrode studies suggest that the oxycline in Delta sediments was very shallow, generally reaching complete anoxia with 1-2 mm of the sediment water interface. If the oxygen gradients were more characteristic of what a Hg gradient should look like, then the diffusional fluxes could be 2- to 15-fold higher than that given in Table 2. Significance of Sediment-Water Exchange Flux. Although there is a paucity of data, it appears that the importance of sediment-water exchange fluxes of Hg and MMHg vary within the Delta region. Sites where sediment-water exchange of MMHg is most important appear to be (in order of importance) Cosumnes River, Frank’s Tract, Frank’s Tract Marsh, Little Holland, and maybe the peat site at West Columbia Cut. This same
CCAALLFFEEDD MMeerrccuurryy PPrroojjeecctt –– TTAAMMUUGG FFiinnaall RReeppoorrtt ((TTaasskk 44BB)) Page 9
general trend holds true for inorganic Hg1 flux as well, with the added exception of Sherman Island which had a very large chamber flux in May and October 2001. A very rough estimate of the input of total Hg and MMHg to the Bay Delta region is made in Table 3. These estimates are based on GIS-based estimates of the surface areas for several regions of the Delta and an estimate of the input flux for total Hg and MMHg and for these regions. Clearly, this is only a rough estimate that needs considerable refinement because of the paucity of data in particular, but it is nonetheless constructive for scaling purposes. For comparison, estimates of the input of total MMHg (i.e. dissolved + suspended particulate) into the Bay/Delta Region were made from data provided by Dr. C. Foe of the State Water Resources Control Board as part of the Calfed Mercury Project (Table 4). This assessment is based on 18 monthly sampling periods between March 2000 and September 2001. A rough estimate of the dissolved MMHg input can be made by assuming that half of the total input shown in Table 4 is dissolved. On average, ~ 3 g of dissolved MMHg/day enter the Delta from the Sacramento River, and ~ 5 g of dissolved MMHg/day enter from all sources. For MMHg, these external sources are roughly equivalent to the input from sediment-water exchange (i.e. ~ 6 g MMHg/day). During high flow conditions the riverine sources are about 6-fold higher than the benthic input and during low flow conditions the riverine dissolved MMHg sources are about one quarter that of the benthic input (~ 1.6 g MMHg/day).
Estuarine Transects The locations of the sampling stations occupied for the estuarine transects are given in Figure 2. Mercury measurements of unfiltered, filtered (0.45 µm) and ultra-filtered (1 KDa to 0.45 µm) samples for total and MMHg for the September/October 2000 and March 2001 estuarine transects are given in Figures 9 and 10, respectively . These data, along with other ancillary data and discussions are given in Appendix A and B. The timing of these estuarine transects was intended to capture a low flow estuarine condition (September/October 2000) and a high flow condition (March 2001). A summary of the Estuarine Mercury Fluxes for Total Hg and Monomethyl Mercury in San Francisco Bay Estuary derived from steady-state non-conservative estuarine mixing modeling is given in Figure 11. Total Hg. Surface water samples were collected from San Francisco Bay estuary in September – October 2000 (low flow) and March 2001 (high flow). Mercury (Hg) concentrations were measured in unfiltered, filter-passing (< 0.45 µm), colloidal (1 kDa – 0.45 µm) and (truly) dissolved (< 1 kDa) fractions. Particulate Hg was the dominant phase (88 ± 7 %, n = 29) in unfiltered water. Suspended particulate matter (SPM) explained most particulate Hg concentrations in the northern reach. A significant portion
1 Inorganic Hg is defined as the difference between a total Hg and a MMHg measurement.
CCAALLFFEEDD MMeerrccuurryy PPrroojjeecctt –– TTAAMMUUGG FFiinnaall RReeppoorrtt ((TTaasskk 44BB)) Page 10
of filter-passing Hg was associated with colloidal Hg, accounting for 38 ± 18 % (n = 9) in the fall and 57 ± 10 % (n = 12) in the spring. Seasonal variability of the filter-passing Hg concentration observed in the upper estuary was attributed to the temporal change in the riverine colloidal Hg. The strong correlation observed between Hg and organic carbon in the filter-passing fraction indicates that organic material is an important transport medium of Hg in San Francisco Bay. Assessment of various forms of the particle – water distribution coefficient revealed that Hg was preferentially associated with SPM during the low flow period, but that colloidal material played as important a role in Hg phase speciation as SPM during the high flow condition. A steady-state non-conservative estuarine mixing model suggested that the northern reach had an internal source of colloidal Hg in September – October, possibly from resuspended sediments, and a sink of colloidal Hg within the estuary in March 2001 (Figure 11). Monomethyl Mercury. The phase speciation and estuarine behavior of monomethyl mercury (MeHg) was determined in surface waters of San Francisco Bay estuary in September – October 2000 (low flow) and March 2001 (high flow). Colloidally associated MeHg was isolated using a cross-flow ultrafiltration technique with a nominal molecular weight cut-off of 1 kDa. Filter-passing MeHg was 57 ± 18 % of the MeHg in unfiltered water in the fall and 39 ± 12 % in the spring. The colloidal MeHg averaged 34 ± 11 % of the filter-passing MeHg in the fall and 56 ± 15 % in the spring. Significantly higher particle-water partitioning coefficients were observed between colloidal and dissolved MeHg (log KC = 5.6 ± 0.3, n = 21) compared to those between particulate and dissolved MeHg (log KP = 4.9 ± 0.5, n = 21), suggesting that MeHg is preferentially associated with colloidal material. Strong correlations of MeHg with organic carbon content in filter-passing, colloidal and (truly) dissolved fractions confirmed the importance of organic matter in the MeHg cycle. Both absolute and relative (as % of Hg) MeHg concentrations were highest in the river water end-member under both flow regimes, suggesting riverborne MeHg is the major source of MeHg introduced to the estuary. A non-conservative estuarine mixing model suggests that significant amounts of colloidal and (truly) dissolved MeHg are removed in the estuary under both flow regimes, standing in marked contrast to Hg which had a source within the estuary under the low flow condition (Figure 11). Special Studies Several special investigations were conducted during the course of the project to investigate unique ideas or concepts that were not part of the normal field sampling program. A description and the results of these studies follows. Light/Dark Chamber Studies. One special effort conducted during the September 2000 and October 2001 field efforts was to conduct flux chamber studies to test for changes in flux due to to light/dark cycles. This effort was conducted to determine if benthic photosynthetic organisms were regulating the exchange of interstitial pore waters on a diel basis (i.e. a light/dark cycle). Previous work by Gill et al (1999) showed that during daylight hour’s benthic photosynthesis could depress the redox
CCAALLFFEEDD MMeerrccuurryy PPrroojjeecctt –– TTAAMMUUGG FFiinnaall RReeppoorrtt ((TTaasskk 44BB)) Page 11

zone into the sediments, effectively acting as a barrier to the transport of redox sensitive components. During periods of dark, this zone could diminish or migrate into the water column, and substantial releases of mercury (principally monomethyl mercury) could result. One method in which light/dark studies were conducted is by deploying a dual chamber in which one of the chambers was darkened. Mixed results were obtained (see Table 2). In most cases, the flux observed in the dark chamber was different than that observed in the light chamber, but not necessarily in the direction predicted for photosynthetic influence. For example, in Frank’s Tract in September 2000, the total Hg flux was higher in the light chamber. In fact, in the dark chamber the total Hg flux reversed and went into the sediments! At Sherman Island, in September 2000, MMHg went into the sediments in the light chamber and a very small flux out occurred in the dark chamber. This pattern was reversed for MMHg at Sherman Island in October 2001. Collectively, these results suggest that benthic photosynthesis is probably not influencing sediment-water exchange ubiquitously at these sites. At Little Holland, the dark chamber flux of MMHg was higher than the light chamber flux and there may be a light/dark benthic cycle occurring at this site. Note that the total Hg flux at Little Holland was into the sediments and that this flux slowed in the darkened chamber. Twenty-Four Hour Flux Chamber Deployment. The other approach that was used to examine light/dark sediment-water exchange cycles was by conducting a 24 hour deployment using a light/dark chamber. The results from this deployment at Franks Tract are shown in Figure 12. There was very little difference between the light and dark chambers over the first ~10 hours of deployment. After that point, the MMHg flux into both chambers increased, with the light chamber having an enhanced flux over the dark chamber. Clearly, there is no evidence that light penetration is influencing flux, but there is an indication that oxygen levels are influencing flux. Note that the flux changed substantially when the oxygen levels in the chamber fell to minimal levels (~2 mg/L). This relationship is probably indicative of a vertical migration of the oxycline from deeper in the sediments to at or near the sediment-water interface. In general, the oxycline in the Delta is very shallow, within a few millimeters of the sediment-water interface (see for example Figure 16). Constituents which have elevated levels in low oxygen conditions (i.e. redox sensitive species such as Fe and Mn) are released to overlying waters when the oxygen in surficial sediments is consumed (Gill et al., 1999). Sediment-Water Exchange in Peat Rich Sediments. A core tube was specially modified to enable it to serve as a flux chamber and be deployed in the peat rich sediments present at the West Columbia site. This special deployment was designed to elucidate the importance of peat rich sediments with respect to methylmercury production and flux to overlying waters. Suprisingly, the peat appeared to be a sink for inorganic Hg2 (-1400 pmol/m2/day; -270 ng/m2/day) and a source of MMHg (62 2 Inorganic Hg is defined as the difference between a total Hg and a MMHg measurement.
CCAALLFFEEDD MMeerrccuurryy PPrroojjeecctt –– TTAAMMUUGG FFiinnaall RReeppoorrtt ((TTaasskk 44BB)) Page 12

pmol/m2/day; 12 ng/m2/day) (Table 2). In general, the flux rates observed in this peat rich environment are not markedly different from those observed at the other Delta sites. Frank’s Tract Surface Water Transect Studies. Surface water transect studies were conducted in Frank’s Tract moving from near shore to open water to investigate the importance of near shore marsh areas as habitats of particular importance to the production of MMHg. Unfiltered and filtered water samples were collected from the Franks Tract marsh site and three transect stations in Franks Tract (Figure 13). Total (unfiltered) Hg was elevated only in the open water of Franks Tract (station FT3) and was fairly constant in other stations. Filter- passing Hg did not show any clear evidence of a surface water concentration gradient between near shore and open waters within Franks Tract. However, MMHg revealed a significant surface water concentration gradient within Franks Tract. The highest total and filter-passing MMHg concentrations occurred at the marsh site. This result supports the hypothesis that sediment-water exchange of MMHg in near shore marsh environments influences water column MMHg concentrations in Frank’s Tract, and probably other similar habitats in the Delta as well. Marsh Habitat As Sites of Enhanced MMHg Production. Time series measurements of Hg and MMHg were conducted at the entrance to Frank’s Tract Marsh (Figure 13) in May 2001 to monitor changes in mercury concentration associated with water entering and leaving the marsh during a tidal event. Both Hg and MeHg concentrations in unfiltered and filtered surface waters changed with time as water flowed into and out of the marsh, driven by a tidal cycle (Figure 14). Mercury concentrations were lowest during high tide and highest between high and low tides when the water flow rate was maximum. This suggests that either the marsh or Franks Tract did not have an elevated Hg concentration and that resuspension or erosion of surface sediments could be a source of Hg in surface waters. In contrast, MMHg concentrations were highest during low tide and lowest during high tide. As the water level dropped from high tide to low tide, MMHg-enriched Franks Tract marsh water was exported through the inlet to Franks Tract, resulting in a maximum MMHg concentration during low tide. Conversely, as the water level rose from low tide to high tide, Franks Tract water with a low MMHg concentration flowed through the inlet, resulting in the lowest MeHg concentration occurring during high tide. This suggests not only that the benthic flux of MMHg is significant enough to influence the overlying water column concentrations, but also that the Franks Tract marsh site could be a major source of MMHg. Ancillary Parameters A number of ancillary parameters were collected as part of this investigation but will not be discussed here. Ancillary parameters measured as part of this study included suspended load, dissolved oxygen in chamber water, nutrients (Cl-, SO4
--, NO3- and
PO4-3) in chamber water, sediment porosity, and temperature. Some of these data are
given in the attached appendices. Sediment MMHg Concentrations. Sediment MMHg concentration data are presented
CCAALLFFEEDD MMeerrccuurryy PPrroojjeecctt –– TTAAMMUUGG FFiinnaall RReeppoorrtt ((TTaasskk 44BB)) Page 13
in Figure 15. The shape of the vertical profiles of MMHg, the concentration range, and seasonal changes in sediment MMHg concentrations reported here are similar to those observed in other Hg-impacted estuaries such as Lavaca Bay, TX (Bloom et al., 1999). The Franks Tract marsh site had the highest MMHg concentrations, ranging 13 to 30 pmol/g in February 2000 and 20 to 66 pmol/g in May 2001. In contrast, the lowest concentration was observed in Little Holland and Prospect Slough (ranging 0.7 – 2.5 pmol/g) where overlying water flow is strong and surface sediments are sandy. These sites did not show any significant seasonal variation. Cosumnes River, Franks Tract, Sherman Island and White Slough sites had medium concentrations ranging from ~ 2 to ~ 15 pmol/g. The spatial variability of sediment MMHg is similar to that of pore water MMHg, which was higher at the Cosumnes River and Franks Tract marsh, and lower at Little Holland, Prospect Slough, and Sherman Island. In most cases, a maximum MMHg concentration was observed in a surface (e.g., Cosumnes River and Prospect Slough) or near surface (~ 2 cm) sediment layer (e.g., Franks Tract sites, Sherman Island, and White Slough), followed by a rapid concentration decrease with increasing depth (Figure 15). At the Cosumnes River, White Slough and two sites in Franks Tract, maximum concentrations occurred in May 2000 and May 2001 were ~ 2 to 3-fold higher than those observed in other sampling periods. These results suggest that sediment MMHg concentrations are likely to be controlled by bacteria-mediated processes. Microelectrode Studies. Oxygen and sulfide microelectrodes were used to obtain profiles on millimeter scale resolution from small intact cores taken at several of the Delta sampling sites. An example of a microelectrode profile for Franks Tract is shown in Figure 16. All the other sites had similar results for dissolved oxygen. In all cases, the oxygen concentration fell to zero within a few millimeters of the sediment-water interface. The sulfide concentration profile typically showed detection level signals in the top few millimeters to 1 centimeter and slowly rose to a maximum at depths below 1 cm. Mercury In San Francisco Bay Estuary – A Historical Prespective Mercury contamination in the San Francisco Bay estuary and its tributaries has long been recognized as a serious concern (Rasmussen and Blethrow, 1990). Reliable estuarine transect measurements of mercury in San Francisco Bay were first obtained in the period between 1989 and 1992 as part of a program investigating a suite of trace element distributions in San Francisco Bay (Flegal et al., 1991). Early mercury measurements were conducted as part of this program at the University of California Santa Cruz using procedures described in Gill and Bruland (1990). This early data set combined with the work conducted in this current project can be used to evaluate whether there have been any decadal time frame changes in Hg concentration in the estuary. Illustrated in figure17 are total and filter-passing Hg concentrations measured in the river water end-member and the extreme South Bay. This simple comparison suggests that both total and filter-passing Hg concentrations have not changed significantly in the 12 year period between 1989 and 2001. Much of the variability over time may be due to river flow rate at the time of sampling.
CCAALLFFEEDD MMeerrccuurryy PPrroojjeecctt –– TTAAMMUUGG FFiinnaall RReeppoorrtt ((TTaasskk 44BB)) Page 14
Quality Assurance and Quality Control Efforts Texas A&M University at Galveston participated in the intercomparison exercises that were part of the CALFED mercury project. These results are summarized in the report by Frontier Geosciences and are briefly described below. Texas A&M University at Galveston also integrated normal QA/QC practices into the analytical work done for this project. These practices include: Matrix spike additions, replicate analyses, and analysis of certified reference samples. A brief description of these results are given below. Five Percent Sample Split Results. As part of the QA/QC requirements for this project, approximately 5% of the samples collected were to be sent to Frontier Geosciences for independent determinations. Samples of interstitial pore water could not be split for analysis because of minimal sample volumes. The results of the 5% split study are shown in Table 7. Analysis of Standard Reference Materials. The standard reference material DORM-2 (dog fish mussel) was used as an SRM for MMHg analyses. For total mercury analysis, the PACS-2 standard reference material was usually used as an SRM. Average MMHg recovery based on DORM-2 analysis was 97 ± 11% (Table 8). Matrix Spike Additions of MMHg to Aqueous and Sediment Samples. Matrix spike additions of monomethyl mercury added to aqueous and sediment samples are shown in Figure 18. For aqueous samples, 0.05 ng of (as MMHg) was spiked into 45 mL of aqueous sample. The average recovery was 90 ± 10 % (n = 196). For sediments, a typical matrix spike addition consisted of additions of 2 ng Hg of MMHg spiked into ~ 1g of wet sediment. The average recovery for sediment was 94 ± 15 % (n = 20). Replicate Measurements. Whenever possible, all samples were analyzed in duplicate or better. Interstitial porewater samples were run only once because of limited sample volume. The average RPD or relative standard deviation varied to some extent depending on sample volume distilled. For example, the average RPD was relatively high (20 ± 20 %, n = 82 pairs in 2001) for benthic chamber sample analysis when 30 – 35 mL of sample was used, and relatively low (11 ± 11 %, n = 55, in 2001) for water column sample analysis where 150 mL of sample was distilled. The average RPD for sediment MmHg measurements was 13 ± 12 % (n = 53)
CONCLUSIONS
Summarized below are some of the major findings of the project. • During low riverine flow conditions, the sediment-water exchange of Hg and MMHg
within the Delta rivals that of external riverine sources. During high riverine flow
CCAALLFFEEDD MMeerrccuurryy PPrroojjeecctt –– TTAAMMUUGG FFiinnaall RReeppoorrtt ((TTaasskk 44BB)) Page 15
conditions external sources (primarily the Sacramento River and when flowing Prospect Slough) dominate the input of both Hg and MMHg into the Delta.
• Sediment-water exchange fluxes of both total Hg and MMHg appear to vary significantly throughout the Delta, both temporally and spatially.
• The Cosumnes River sediments appear to be a significant source of MMHg to the tributary.
• Diffusional flux estimates of MMHg and inorganic Hg appear to underestimate the sediment-water exchange flux for Hg as determined by Benthic Flux Chamber deployments. There are several possible reasons for this discrepancy that will require further investigation.
• Marshs bordering Frank’s Tract appear to be very important sites of MMHg production and are significant sources of MMHg to Frank’s Tract. Whether marshes are significant sources Delta wide remains to be determined.
• Both total Hg and MMHg exhibited non-conservative estuarine mixing profiles. There appears to be a mid estuary source for total Hg around a salinity of 12 ppt. MMHg is highest (~ 0.065 ng/L) in freshwater, drops to minimal values around 0.015 ng/L at mid salinities and appears to rise slightly to around 0.02 ng/L at the salt water end-member.
ACKNOWLEDGEMENTS
It would not have been possible to conduct this project without the wonderful assistance and support we have gotten from our Moss Landing Marine Laboratory (MLML) colleagues. They provided the research boats, boat operators and SCUBA personnel for all the flux chamber deployments and sediment core collections conducted by TAMUG. This was no trivial effort and they deserve special acknowledgement, especially the efforts of Wes Heim and Dr. Kenneth Coale of MLML, and Dr. Mark Stephenson, Sean Mundell, Nisse Goldberg, Lisa Barrios, and John Haskins, of the California Department of Fish and Game.
CCAALLFFEEDD MMeerrccuurryy PPrroojjeecctt –– TTAAMMUUGG FFiinnaall RReeppoorrtt ((TTaasskk 44BB)) Page 16
REFERENCES
Alperin, M. J.; Albert, D. B.; Martens, 1994. C. S. Geochim. Cosmochim. Acta, 58: 4909-
4930. Bloom, N.S., Gill, G.A., Cappellino, S., Dobbs, C., Mcshea, L., Driscoll, C., Mason, R.,
Rudd, J., 1999. Speciation and cycling of mercury in Lavaca Bay, Texas, sediments. Environ. Sci. Technol. 33, 7-13.
Boudreau, B. P. (1996). The diffusive tortuosity of fine-grained unlithified sediments.
Geochim. Cosmochim. Acta, 60: 3139-3142. Compeau, G.C., Bartha, R., 1983. Effects of sea salt anions on the formation and
stability of methylmercury. Bull. Environ. Contam. Toxicol. 31, 486-493 Flegal, A. R., G. J. Smith, G. A. Gill, S. Sanudo-Wilhelmy and L. C. D. Anderson (1991).
Disolved trace element cycles in the San Francisco Bay estuary. Marine Chemistry, 36: 329-363.
Foe, C. and W. Croyle 1998. Mercury concentrations and loads from the Sacramento
River and from Cache Creek to the Sacramento-San Joaquin Delta Estuary. Central Valley Regional Water Quality Control Board Staff report. Sacramento Office.
Gill, G.A. and K.W. Bruland (1990). Mercury in surface freshwater systems in California
and other areas. Environ. Sci. Techn. 24: 1392-1400. Gill, G. A., N. S. Bloom, S. Cappellino, C. T. Driscoll, C. Dobbs, L. McShea, R. Mason,
and J. Rudd (1999). Sediment-Water Fluxes of Mercury in Lavaca Bay, Texas. Environmental Science and Technology, 33: 663-669.
Gilmore, C.C., Henry, E.A., Mitchell, R., 1992. Sulfate stimulation of mercury
methylation in freshwater sediments. Environ. Sci. Technol. 26, 2281-2287 Gilmore, C.C., Riedel, G.S., Ederington, M.C., Bell, J.T., Benoit, J.M., Gill, A.G., Stordal,
M.C., 1998. Methylmercury concentrations and production rates across a trophic gradient in the northern Everglades. Biogeochem. 40, 327-345.
Krabbenhoft, D. P., J. G. Wiener, W. G. Brumbaugh, M. L. Olson, J. F. DeWild, and T. J
Sabin. A national pilot study of mercury contamination of aquatic ecosystems along multiple gradients. In Press.
Larry Walker and Associates, 1997. Sacramento River mercury control planning
project. Prepared for the Sacramento Regional County Sanitation District.
CCAALLFFEEDD MMeerrccuurryy PPrroojjeecctt –– TTAAMMUUGG FFiinnaall RReeppoorrtt ((TTaasskk 44BB)) Page 17
Li, Y.H. and S. Gregory (1974). Diffusion of ions in se water and in deep-sea sediments. Geochim. Cosmochim. Acta, 38: 703-714.
Mason, R.P., Bloom, N., Cappellino, S., Gill, G., Benoit, J., Dobbs, C., 1998.
Investigation of porewater sampling methods for mercury and methylmercury. Environ. Sci. Technol. 32, 4031-4040.
Rasmussen, D. and H. Blethrow (1990). Toxic Substances Monitoring Program: Ten
Year Summary Report, 1978-1987. California Water Resources Control Board, Sacramento California.
Roth, D.A., H.E. Taylor, J.L. Domagalski, P.D. Dileanis, D.B. Peart, R.C. Antweiler, and
C.N. Alpers. (in review) Distribution of inorganic mercury in Sacramento River water and sediments (prepared for submission to Science of the Total Environment).
Schwarzenbach, R, P. M. Gschwend, and D. Imboden (1993). Environmental Organic
Chemistry. John Wiley and Sons, 681 p. San Francisco Bay Regional Water Quality Control Board, 1995. Contaminant levels in
fish tissue from San Francisco Bay. Staff report prepared jointly by the San Francisco Regional Board, the State Water Resources Control Board, and the Department of Fish and Game.
CCAALLFFEEDD MMeerrccuurryy PPrroojjeecctt –– TTAAMMUUGG FFiinnaall RReeppoorrtt ((TTaasskk 44BB)) Page 18
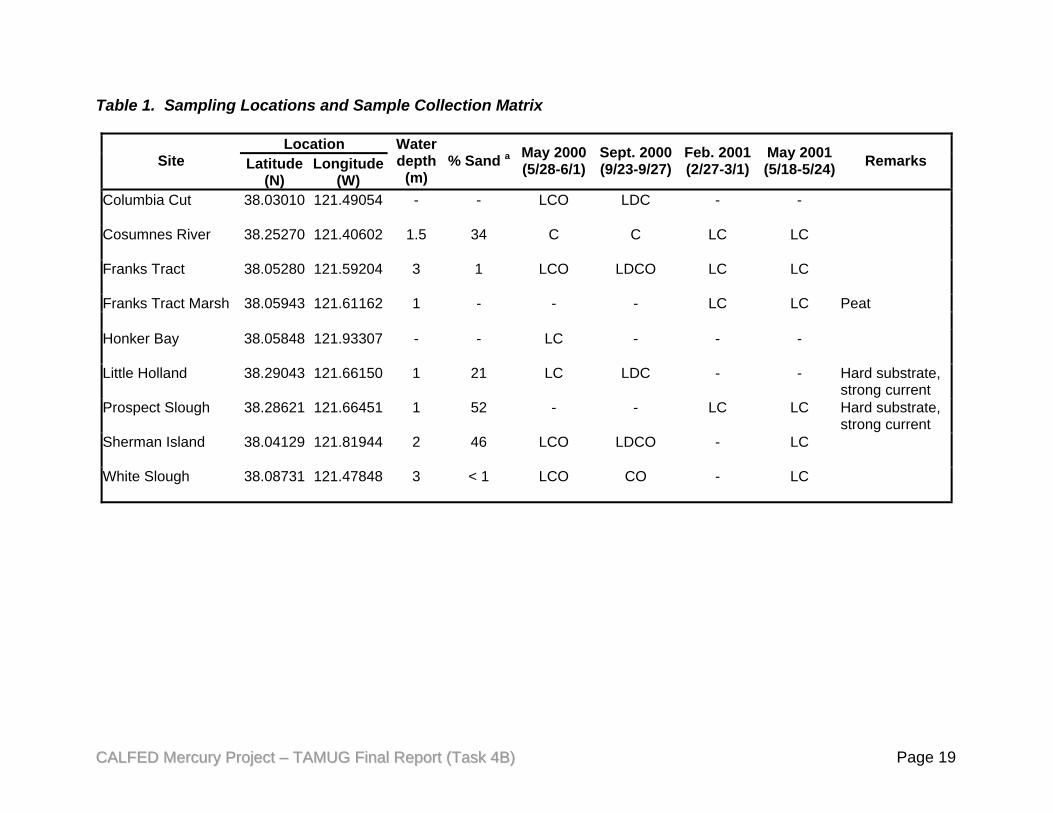
Table 1. Sampling Locations and Sample Collection Matrix
Location Site Latitude
(N) Longitude
(W)
Water depth
(m) % Sand a May 2000
(5/28-6/1) Sept. 2000(9/23-9/27)
Feb. 2001(2/27-3/1)
May 2001(5/18-5/24) Remarks
Columbia Cut
38.03010 121.49054 - - LCO LDC - -
Cosumnes River
38.25270 121.40602 1.5 34 C C LC LC
Franks Tract
38.05280 121.59204 3 1 LCO LDCO LC LC
Franks Tract Marsh 38.05943 121.61162 1 - - - LC LC Peat Honker Bay
38.05848 121.93307 - - LC - - -
Little Holland 38.29043 121.66150 1 21 LC LDC - - Hard substrate, strong current
Prospect Slough 38.28621 121.66451 1 52 - - LC LC Hard substrate, strong current
Sherman Island
38.04129 121.81944 2 46 LCO LDCO - LC
White Slough
38.08731 121.47848 3 < 1 LCO CO - LC
CCAALLFFEEDD MMeerrccuurryy PPrroojjeecctt –– TTAAMMUUGG FFiinnaall RReeppoorrtt ((TTaasskk 44BB)) Page 19
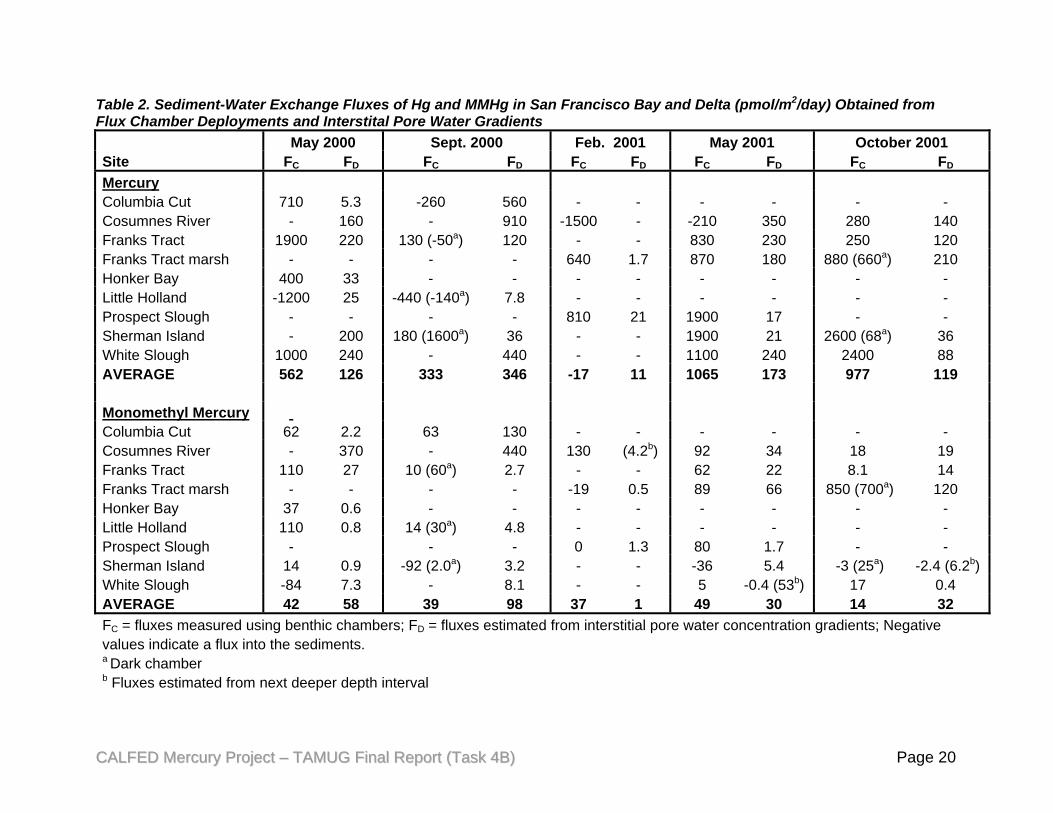
Table 2. Sediment-Water Exchange Fluxes of Hg and MMHg in San Francisco Bay and Delta (pmol/m2/day) Obtained from Flux Chamber Deployments and Interstital Pore Water Gradients May 2000 Sept. 2000 Feb. 2001 May 2001 October 2001 Site FC FD FC FD FC FD FC FD FC FD
Mercury Columbia Cut 710 5.3 -260 560 - - - - - -Cosumnes River - 160 - 910 -1500 - -210 350 280 140 Franks Tract 1900 220 130 (-50a) 120 - - 830 230 250 120Franks Tract marsh - - - - 640 1.7 870 180 880 (660a) 210Honker Bay 400 33 - - - - - - - -Little Holland -1200 25 -440 (-140a) 7.8 - - - - - -Prospect Slough - - - - 810 21 1900 17 - - Sherman Island - 200 180 (1600a) 36 - - 1900 21 2600 (68a) 36White Slough 1000 240 - 440 - - 1100 240 2400 88 AVERAGE 562 126 333 346 -17 11 1065 173 977 119 Monomethyl Mercury Columbia Cut 62 2.2 63 130 - - - - - - Cosumnes River - 370 - 440 130 (4.2b) 92 34 18 19Franks Tract 110 27 10 (60a) 2.7 - - 62 22 8.1 14Franks Tract marsh - - - - -19 0.5 89 66 850 (700a) 120 Honker Bay 37 0.6 - - - - - - - -Little Holland 110 0.8 14 (30a) 4.8 - - - - - -Prospect Slough - - - 0 1.3 80 1.7 - - Sherman Island 14 0.9 -92 (2.0a) 3.2 - - -36 5.4 -3 (25a) -2.4 (6.2b) White Slough -84 7.3 - 8.1 - - 5 -0.4 (53b) 17 0.4 AVERAGE 42 58 39 98 37 1 49 30 14 32FC = fluxes measured using benthic chambers; FD = fluxes estimated from interstitial pore water concentration gradients; Negative values indicate a flux into the sediments.
a Dark chamber b Fluxes estimated from next deeper depth interval
CCAALLFFEEDD MMeerrccuurryy PPrroojjeecctt –– TTAAMMUUGG FFiinnaall RReeppoorrtt ((TTaasskk 44BB)) Page 20
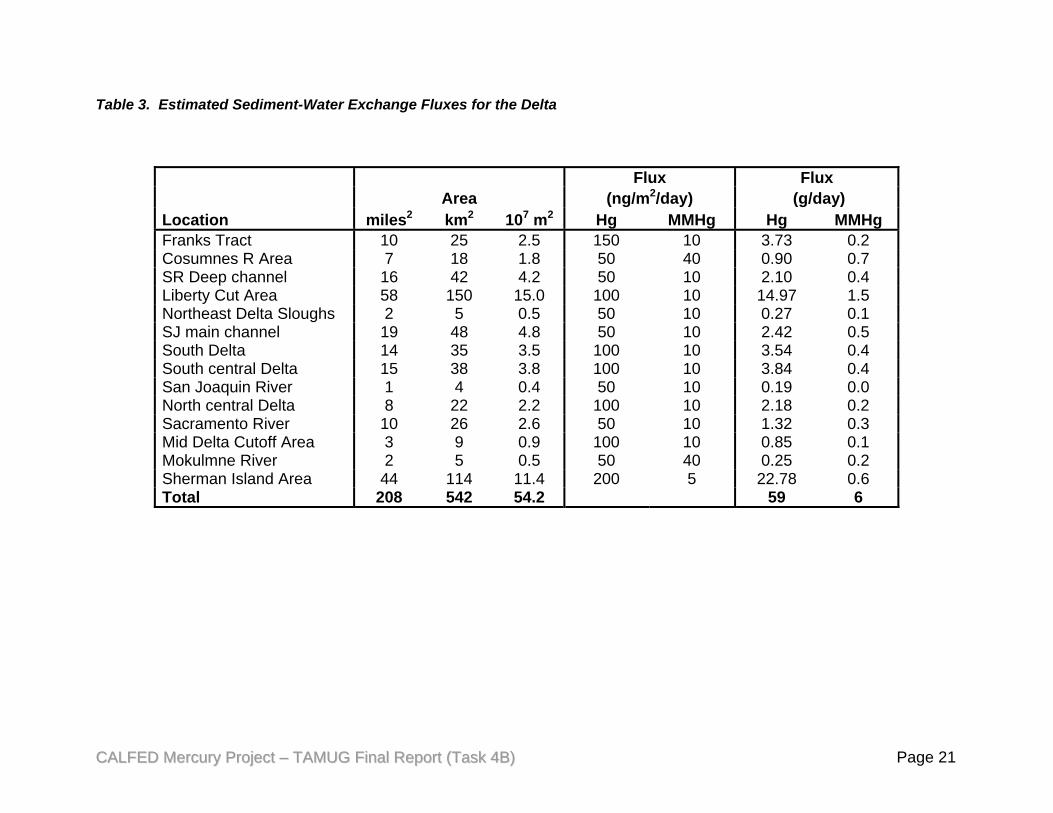
Table 3. Estimated Sediment-Water Exchange Fluxes for the Delta
Flux Flux Area (ng/m2/day) (g/day)Location miles2 km2 107 m2 Hg MMHg Hg MMHgFranks Tract 10 25 2.5 150 10 3.73 0.2 Cosumnes R Area 7 18 1.8 50 40 0.90 0.7 SR Deep channel 16 42 4.2 50 10 2.10 0.4 Liberty Cut Area 58 150 15.0 100 10 14.97 1.5 Northeast Delta Sloughs 2 5 0.5 50 10 0.27 0.1 SJ main channel 19 48 4.8 50 10 2.42 0.5 South Delta 14 35 3.5 100 10 3.54 0.4 South central Delta 15 38 3.8 100 10 3.84 0.4 San Joaquin River 1 4 0.4 50 10 0.19 0.0 North central Delta 8 22 2.2 100 10 2.18 0.2 Sacramento River 10 26 2.6 50 10 1.32 0.3 Mid Delta Cutoff Area 3 9 0.9 100 10 0.85 0.1 Mokulmne River 2 5 0.5 50 40 0.25 0.2 Sherman Island Area 44 114 11.4 200 5 22.78 0.6 Total 208 542 54.2 59 6
CCAALLFFEEDD MMeerrccuurryy PPrroojjeecctt –– TTAAMMUUGG FFiinnaall RReeppoorrtt ((TTaasskk 44BB)) Page 21
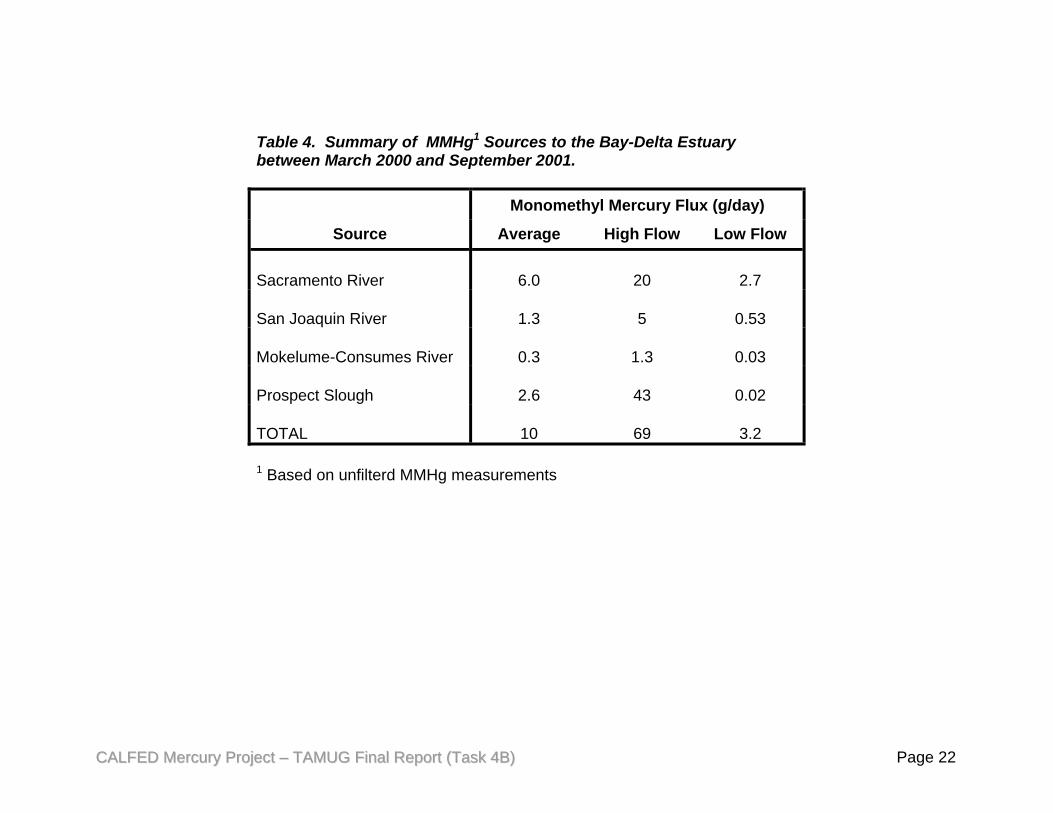
Table 4. Summary of MMHg1 Sources to the Bay-Delta Estuary between March 2000 and September 2001.
Monomethyl Mercury Flux (g/day)
Source Average High Flow Low Flow
Sacramento River 6.0 20 2.7
San Joaquin River 1.3 5 0.53
Mokelume-Consumes River 0.3 1.3 0.03
Prospect Slough 2.6 43 0.02
TOTAL 10 69 3.2
1 Based on unfilterd MMHg measurements
CCAALLFFEEDD MMeerrccuurryy PPrroojjeecctt –– TTAAMMUUGG FFiinnaall RReeppoorrtt ((TTaasskk 44BB)) Page 22
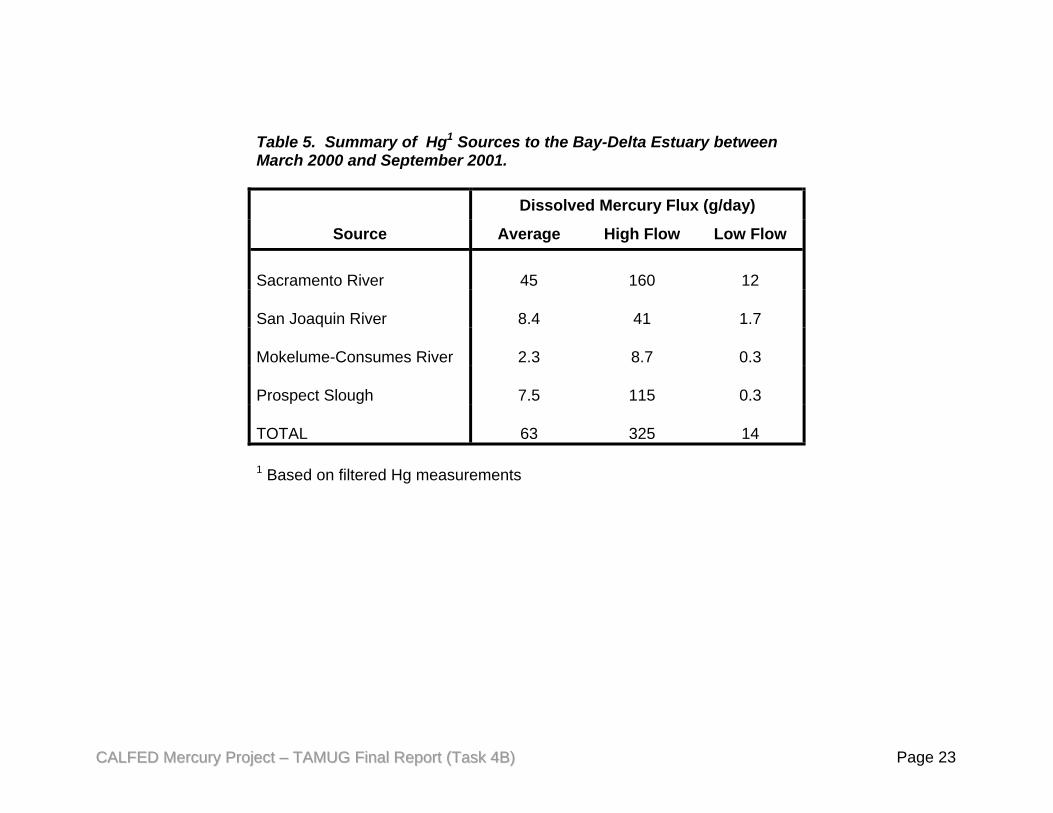
Table 5. Summary of Hg1 Sources to the Bay-Delta Estuary between March 2000 and September 2001.
Dissolved Mercury Flux (g/day)
Source Average High Flow Low Flow
Sacramento River 45 160 12
San Joaquin River 8.4 41 1.7
Mokelume-Consumes River 2.3 8.7 0.3
Prospect Slough 7.5 115 0.3
TOTAL 63 325 14
1 Based on filtered Hg measurements
CCAALLFFEEDD MMeerrccuurryy PPrroojjeecctt –– TTAAMMUUGG FFiinnaall RReeppoorrtt ((TTaasskk 44BB)) Page 23
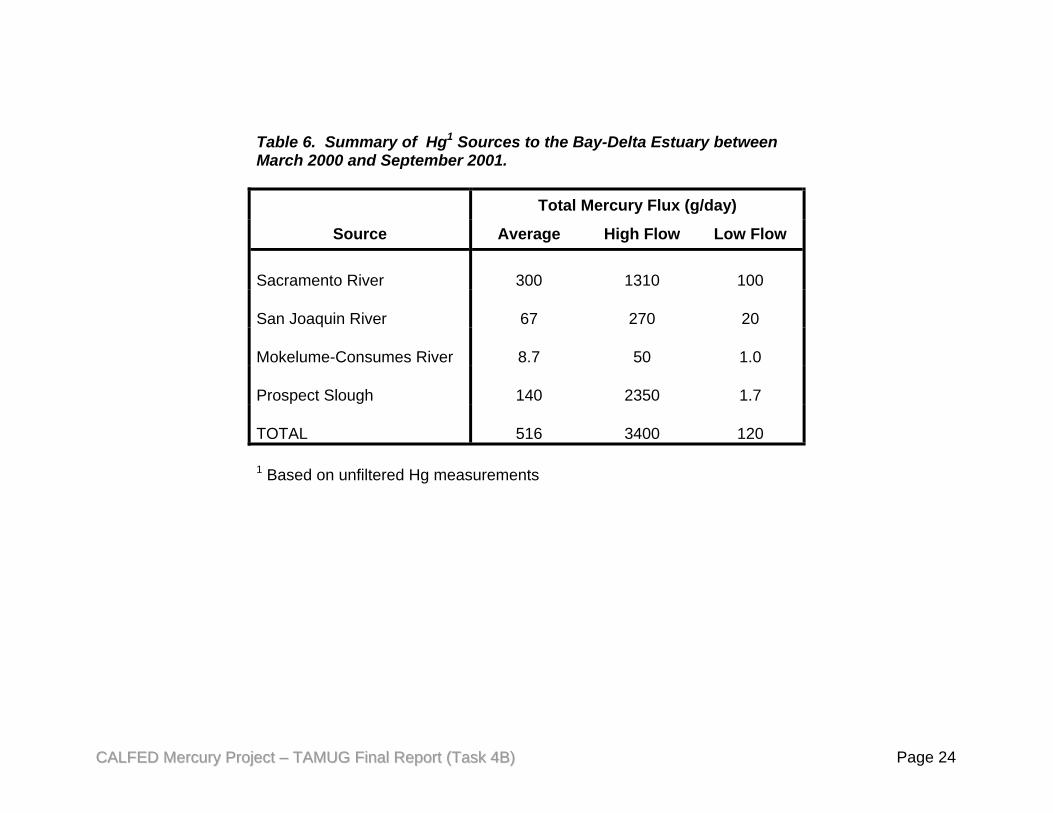
Table 6. Summary of Hg1 Sources to the Bay-Delta Estuary between March 2000 and September 2001.
Total Mercury Flux (g/day)
Source Average High Flow Low Flow
Sacramento River 300 1310 100
San Joaquin River 67 270 20
Mokelume-Consumes River 8.7 50 1.0
Prospect Slough 140 2350 1.7
TOTAL 516 3400 120
1 Based on unfiltered Hg measurements
CCAALLFFEEDD MMeerrccuurryy PPrroojjeecctt –– TTAAMMUUGG FFiinnaall RReeppoorrtt ((TTaasskk 44BB)) Page 24
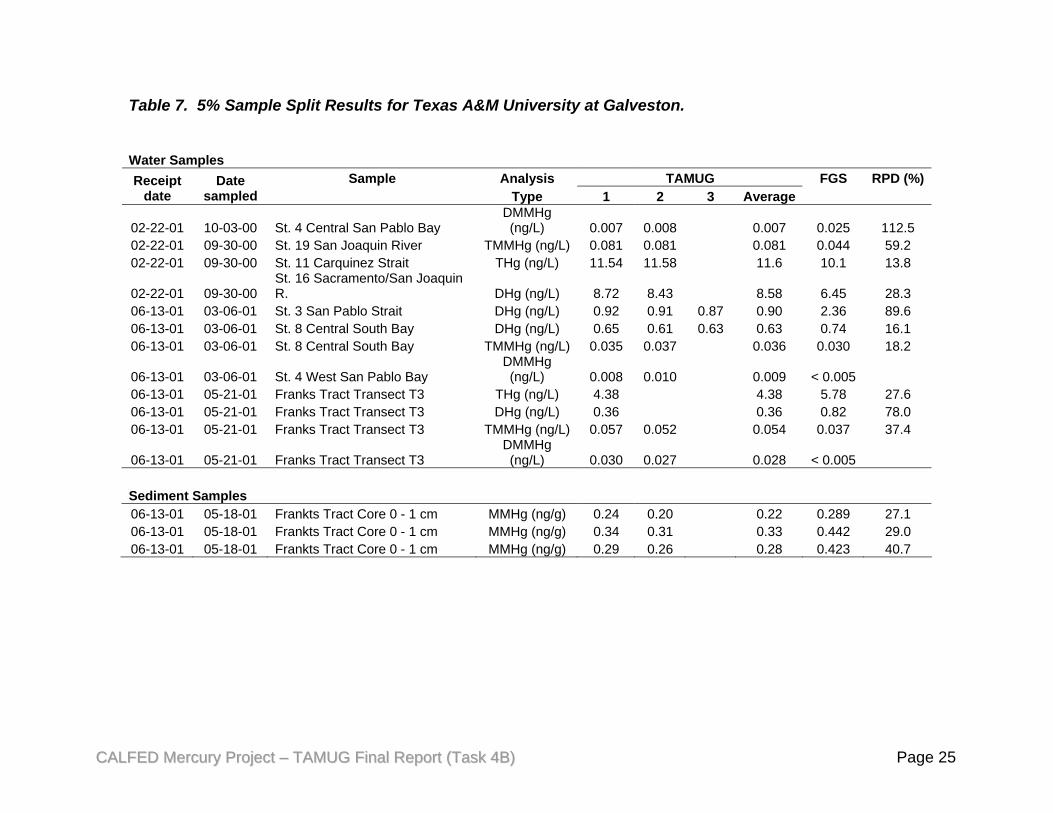
Table 7. 5% Sample Split Results for Texas A&M University at Galveston.
Water Samples
Sample Analysis TAMUG FGS RPD (%)Receipt date
Date sampled Type 1 2 3 Average
02-22-01 10-03-00 St. 4 Central San Pablo Bay DMMHg (ng/L) 0.007 0.008 0.007 0.025 112.5
02-22-01 09-30-00 St. 19 San Joaquin River TMMHg (ng/L) 0.081 0.081 0.081
0.044 59.2 02-22-01 09-30-00 St. 11 Carquinez Strait
THg (ng/L) 11.54 11.58 11.6 10.1 13.8
02-22-01 09-30-00St. 16 Sacramento/San Joaquin R. DHg (ng/L) 8.72 8.43 8.58 6.45 28.3
06-13-01 03-06-01 St. 3 San Pablo Strait DHg (ng/L) 0.92 0.91 0.87 0.90 2.36 89.606-13-01 03-06-01 St. 8 Central South Bay DHg (ng/L) 0.65 0.61 0.63 0.63 0.74 16.106-13-01 03-06-01 St. 8 Central South Bay TMMHg (ng/L) 0.035 0.037 0.036 0.030 18.2
06-13-01 03-06-01 St. 4 West San Pablo Bay DMMHg (ng/L) 0.008 0.010 0.009 < 0.005
06-13-01 05-21-01 Franks Tract Transect T3 THg (ng/L) 4.38 4.38 5.78 27.6 06-13-01 05-21-01 Franks Tract Transect T3 DHg (ng/L) 0.36 0.36 0.82 78.0 06-13-01 05-21-01 Franks Tract Transect T3 TMMHg (ng/L) 0.057 0.052 0.054 0.037 37.4
06-13-01 05-21-01 Franks Tract Transect T3
DMMHg (ng/L) 0.030 0.027
0.028 < 0.005
Sediment Samples 06-13-01 05-18-01 Frankts Tract Core 0 - 1 cm MMHg (ng/g) 0.24 0.20 0.22 0.289 27.1 06-13-01 05-18-01 Frankts Tract Core 0 - 1 cm MMHg (ng/g) 0.34 0.31 0.33 0.442 29.0 06-13-01 05-18-01 Frankts Tract Core 0 - 1 cm MMHg (ng/g) 0.29 0.26 0.28 0.423 40.7
CCAALLFFEEDD MMeerrccuurryy PPrroojjeecctt –– TTAAMMUUGG FFiinnaall RReeppoorrtt ((TTaasskk 44BB)) Page 25

Table 8. Determination of Monomethyl Mercury in the Standard Reference Material DORM-2 Replicate [MMHg] ng/g Number Determined Certified % Recovery
1 4812 4470 ± 370 108% 2 3836 4470 ± 370 86% 3 4189 4470 ± 370 94% 4 4599 4470 ± 370 103% 5 4833 4470 ± 370 108% 6 3582 4470 ± 370 80% 7 4475 4470 ± 370 100%
Average 4332 97%Std. Dev 484 11%
N 7 7
CCAALLFFEEDD MMeerrccuurryy PPrroojjeecctt –– TTAAMMUUGG FFiinnaall RReeppoorrtt ((TTaasskk 44BB)) Page 26

Figure 1. Field Sampling Locations of Sediment-Water Exchange Studies for the Calfed Mercury Project
CCAALLFFEEDD MMeerrccuurryy PPrroojjeecctt –– TTAAMMUUGG FFiinnaall RReeppoorrtt ((TTaasskk 44BB)) Page 27
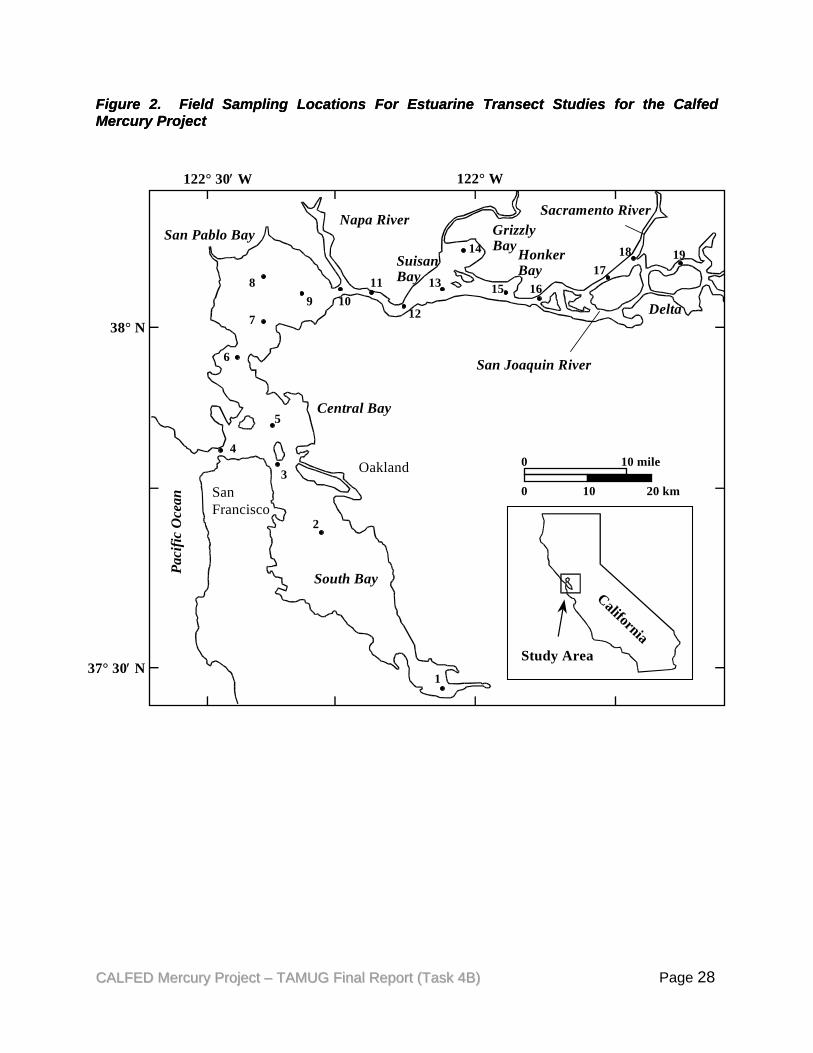
Figure 2. Field Sampling Locations For Estuarine Transect Studies for the Calfed Mercury Project Figure 2. Field Sampling Locations For Estuarine Transect Studies for the Calfed Mercury Project
San Francisco
Oakland
South Bay
San Pablo Bay
SuisanBay
GrizzlyBayHonker
Bay
Sacramento River
San Joaquin River
Napa River
1
4
3
2
5
6
7
89 10
11
12
15
14
13 1617
18 19
Paci
fic O
cean
0 10 20 km
0 10 mile
38° N
37° 30′ N
122° 30′ W 122° W
Central Bay
Delta
Study Area
California
CCAALLFFEEDD MMeerrccuurryy PPrroojjeecctt –– TTAAMMUUGG FFiinnaall RReeppoorrtt ((TTaasskk 44BB)) Page 28
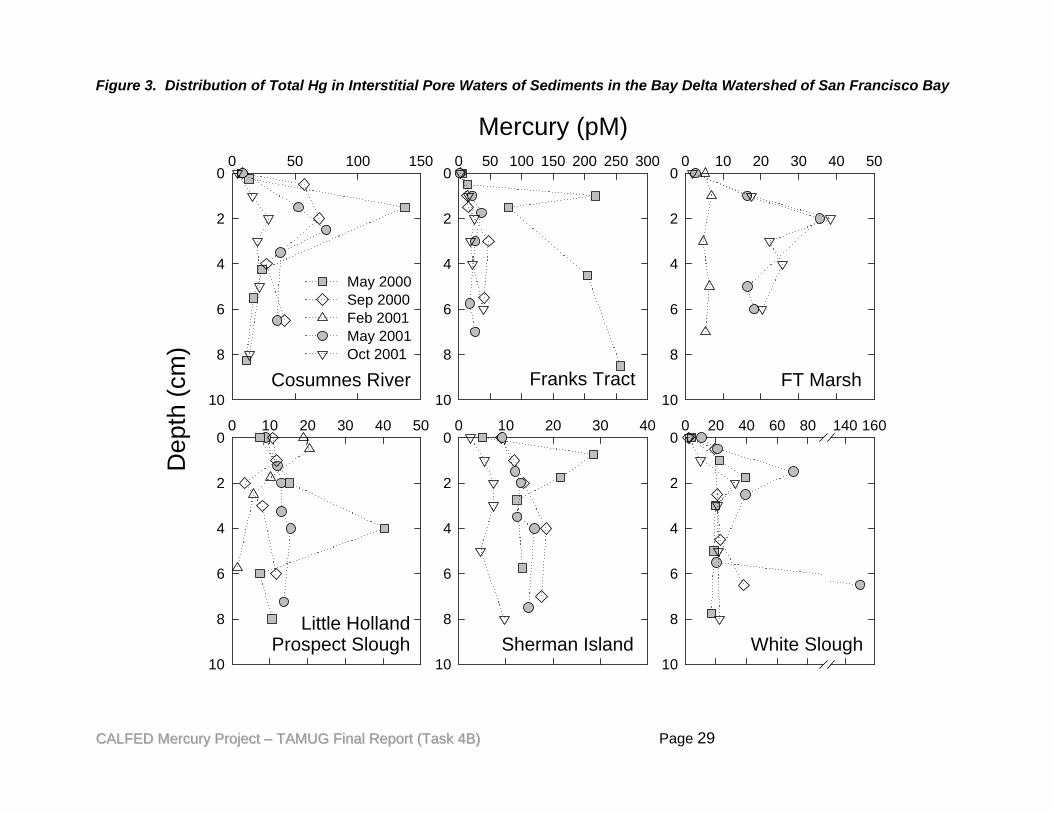
Figure 3. Distribution of Total Hg in Interstitial Pore Waters of Sediments in the Bay Delta Watershed of San Francisco Bay
Cosumnes River
0 50 100 150D
epth
(cm
)0
2
4
6
8
10
May 2000Sep 2000Feb 2001May 2001Oct 2001
Franks Tract
Mercury (pM)0 50 100 150 200 250 300
0
2
4
6
8
10FT Marsh
0 10 20 30 40 500
2
4
6
8
10
Little HollandProspect Slough
0 10 20 30 40 500
2
4
6
8
10Sherman Island
0 10 20 30 400
2
4
6
8
10White Slough
0 20 40 60 80 140 1600
2
4
6
8
10
CCAALLFFEEDD MMeerrccuurryy PPrroojjeecctt –– TTAAMMUUGG FFiinnaall RReeppoorrtt ((TTaasskk 44BB)) Page 29
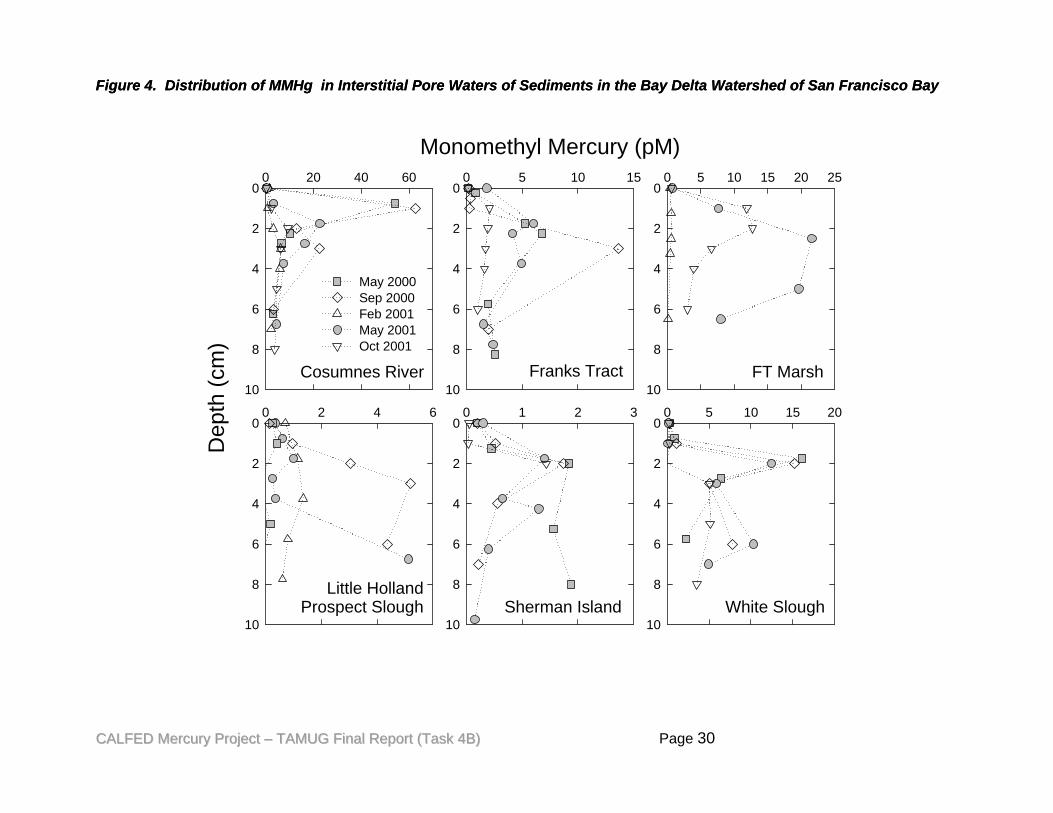
Figure 4. Distribution of MMHg in Interstitial Pore Waters of Sediments in the Bay Delta Watershed of San Francisco Bay Figure 4. Distribution of MMHg in Interstitial Pore Waters of Sediments in the Bay Delta Watershed of San Francisco Bay
Cosumnes River
0 20 40 60
Dep
th (c
m)
0
2
4
6
8
10
May 2000Sep 2000Feb 2001May 2001Oct 2001
Franks Tract
Monomethyl Mercury (pM)0 5 10 15
0
2
4
6
8
10FT Marsh
0 5 10 15 20 250
2
4
6
8
10
Little HollandProspect Slough
0 2 4 60
2
4
6
8
10Sherman Island
0 1 2 30
2
4
6
8
10White Slough
0 5 10 15 200
2
4
6
8
10
CCAALLFFEEDD MMeerrccuurryy PPrroojjeecctt –– TTAAMMUUGG FFiinnaall RReeppoorrtt ((TTaasskk 44BB)) Page 30
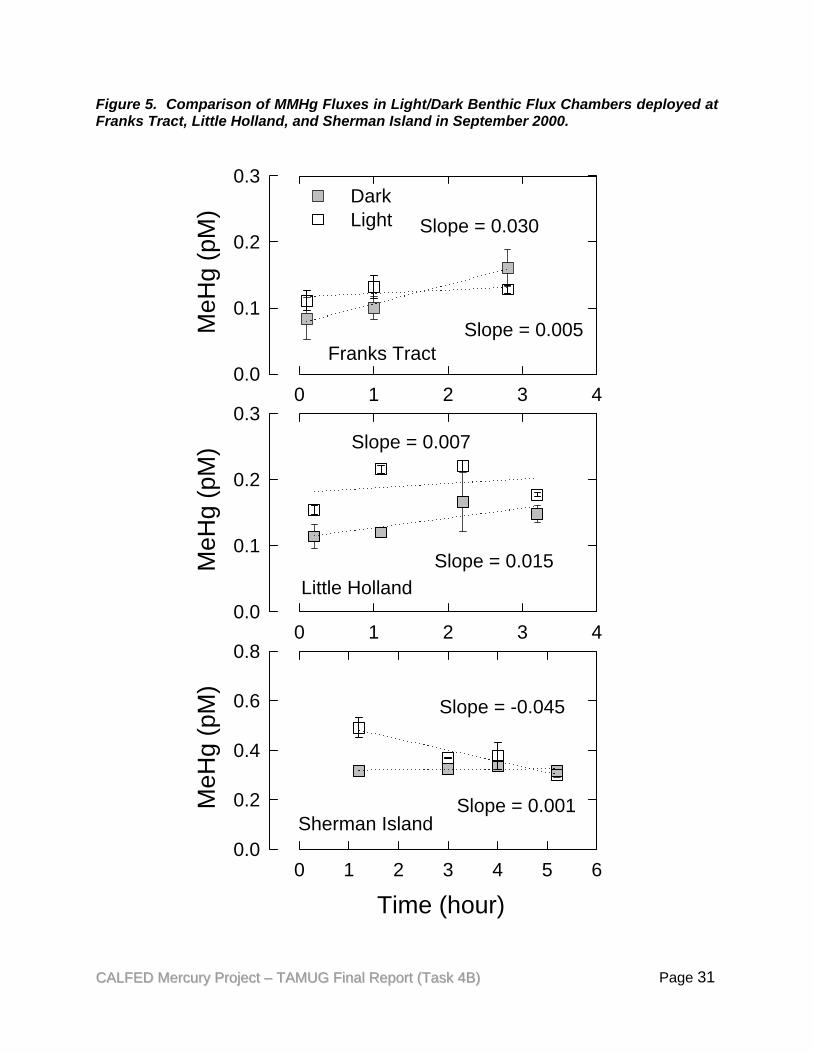
Figure 5. Comparison of MMHg Fluxes in Light/Dark Benthic Flux Chambers deployed at Franks Tract, Little Holland, and Sherman Island in September 2000.
Little Holland
0 1 2 3 4
MeH
g (p
M)
0.0
0.1
0.2
0.3
Sherman Island
Time (hour)0 1 2 3 4 5 6
MeH
g (p
M)
0.0
0.2
0.4
0.6
0.8
Franks Tract
0 1 2 3 4
MeH
g (p
M)
0.0
0.1
0.2
0.3DarkLight Slope = 0.030
Slope = 0.015
Slope = 0.007
Slope = -0.045
Slope = 0.005
Slope = 0.001
CCAALLFFEEDD MMeerrccuurryy PPrroojjeecctt –– TTAAMMUUGG FFiinnaall RReeppoorrtt ((TTaasskk 44BB)) Page 31
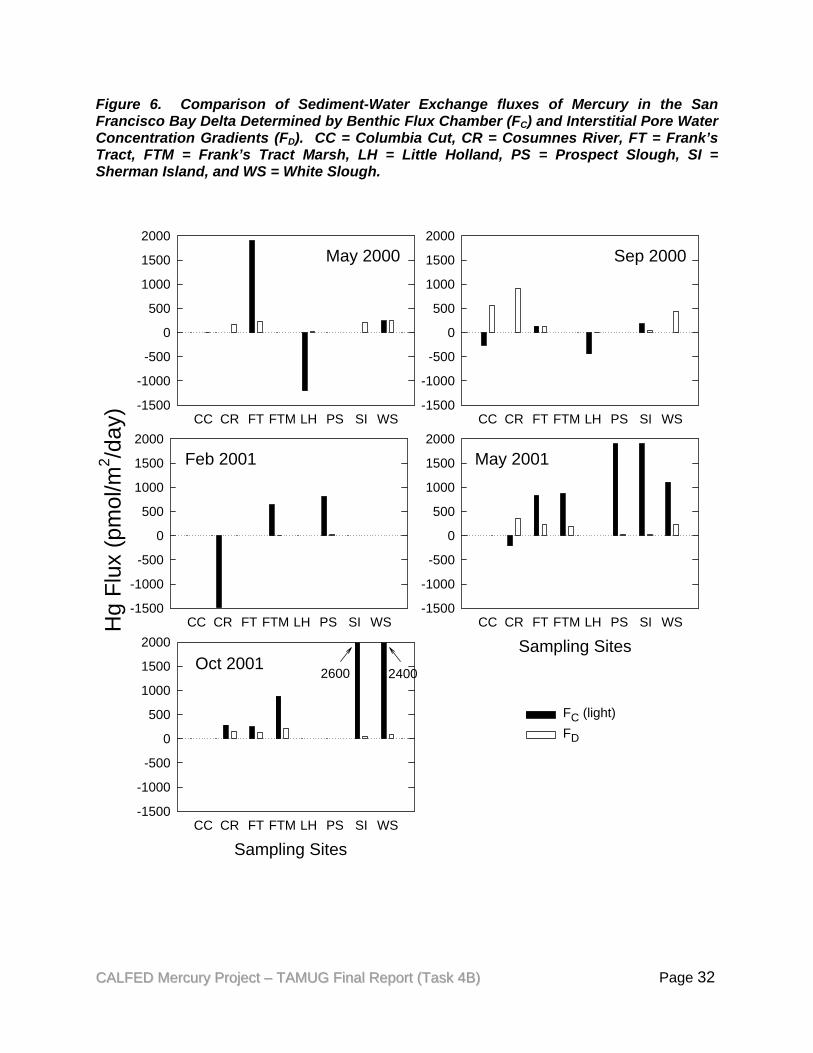
Figure 6. Comparison of Sediment-Water Exchange fluxes of Mercury in the San Francisco Bay Delta Determined by Benthic Flux Chamber (FC) and Interstitial Pore Water Concentration Gradients (FD). CC = Columbia Cut, CR = Cosumnes River, FT = Frank’s Tract, FTM = Frank’s Tract Marsh, LH = Little Holland, PS = Prospect Slough, SI = Sherman Island, and WS = White Slough.
May 2000
CC CR FT FTM LH PS SI WS-1500
-1000
-500
0
500
1000
1500
2000Sep 2000
CC CR FT FTM LH PS SI WS-1500
-1000
-500
0
500
1000
1500
2000
FC (light)FD
Feb 2001
CC CR FT FTM LH PS SI WSHg
Flux
(pm
ol/m
2 /day
)
-1500
-1000
-500
0
500
1000
1500
2000May 2001
Sampling SitesCC CR FT FTM LH PS SI WS
-1500
-1000
-500
0
500
1000
1500
2000
Sampling SitesCC CR FT FTM LH PS SI WS
-1500
-1000
-500
0
500
1000
1500
2000
2600 2400Oct 2001
CCAALLFFEEDD MMeerrccuurryy PPrroojjeecctt –– TTAAMMUUGG FFiinnaall RReeppoorrtt ((TTaasskk 44BB)) Page 32
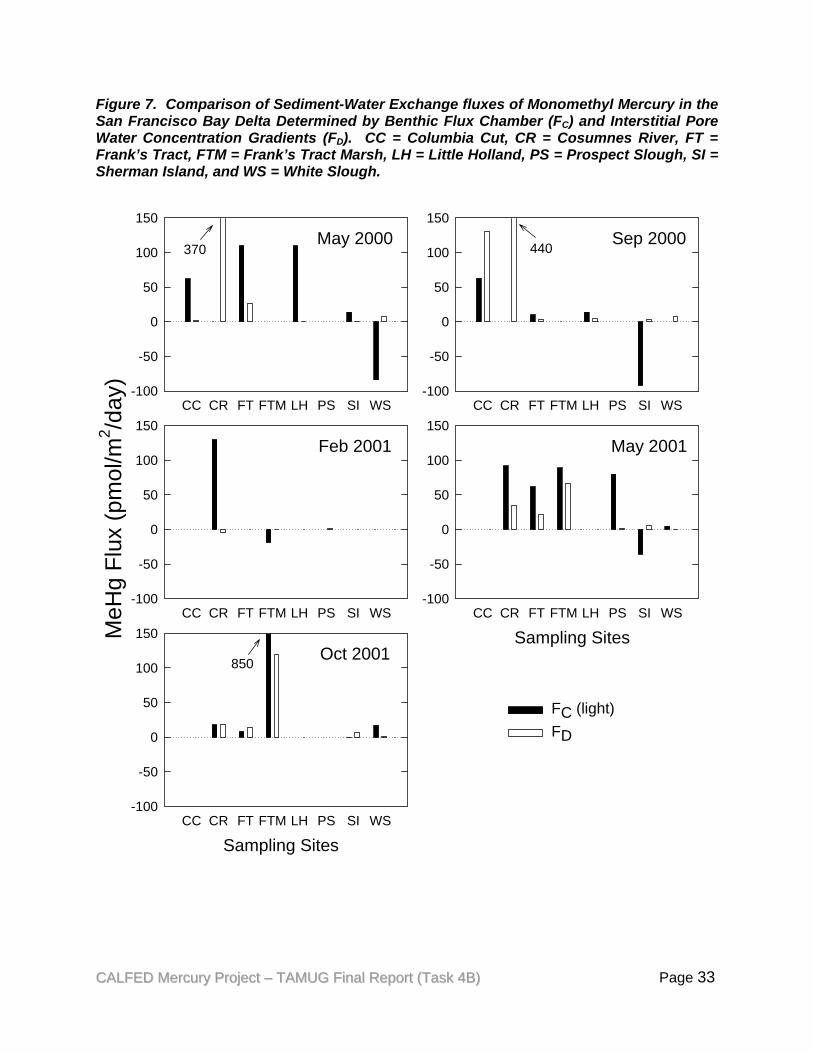
Figure 7. Comparison of Sediment-Water Exchange fluxes of Monomethyl Mercury in the San Francisco Bay Delta Determined by Benthic Flux Chamber (FC) and Interstitial Pore Water Concentration Gradients (FD). CC = Columbia Cut, CR = Cosumnes River, FT = Frank’s Tract, FTM = Frank’s Tract Marsh, LH = Little Holland, PS = Prospect Slough, SI = Sherman Island, and WS = White Slough.
May 2000
CC CR FT FTM LH PS SI WS-100
-50
0
50
100
150Sep 2000
CC CR FT FTM LH PS SI WS-100
-50
0
50
100
150
FC (light)FD
Feb 2001
CC CR FT FTM LH PS SI WS
MeH
g Fl
ux (p
mol
/m2 /d
ay)
-100
-50
0
50
100
150May 2001
Sampling SitesCC CR FT FTM LH PS SI WS
-100
-50
0
50
100
150
370 440
Oct 2001
Sampling SitesCC CR FT FTM LH PS SI WS
-100
-50
0
50
100
150
850
CCAALLFFEEDD MMeerrccuurryy PPrroojjeecctt –– TTAAMMUUGG FFiinnaall RReeppoorrtt ((TTaasskk 44BB)) Page 33
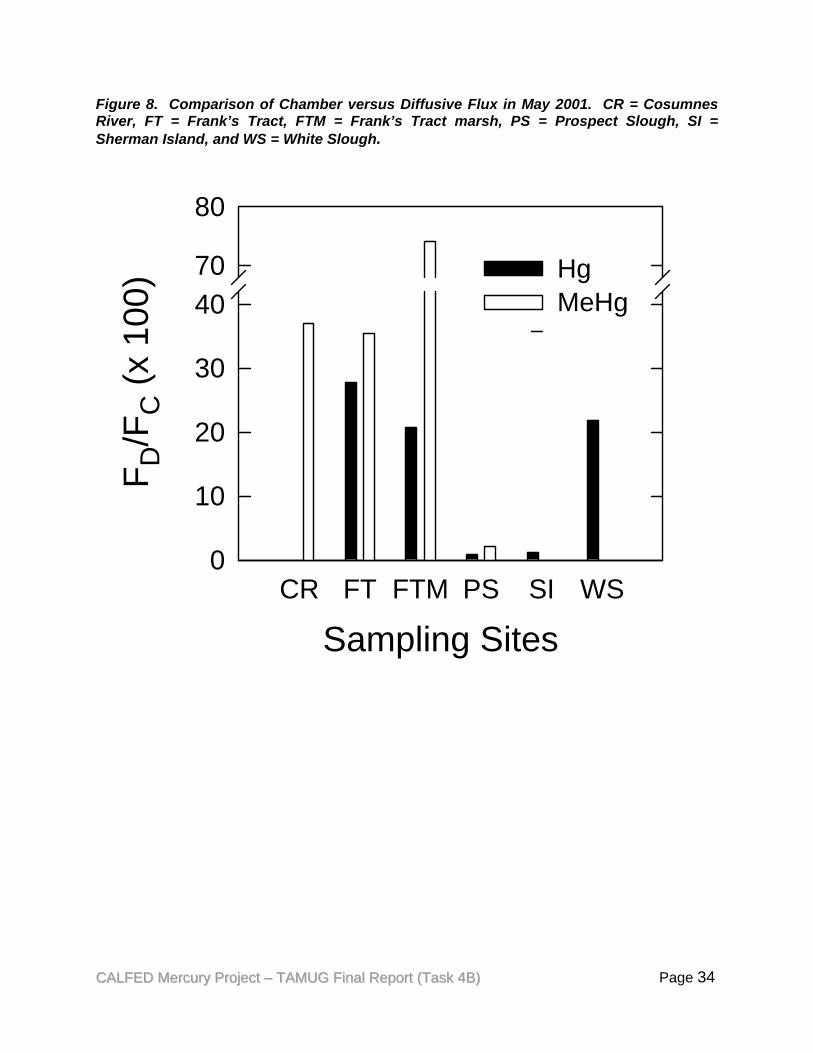
Figure 8. Comparison of Chamber versus Diffusive Flux in May 2001. CR = Cosumnes River, FT = Frank’s Tract, FTM = Frank’s Tract marsh, PS = Prospect Slough, SI = Sherman Island, and WS = White Slough.
Sampling SitesCR FT FTM PS SI WS
F D/F
C (x
100
)
0
10
20
30
4070
80
HgMeHg
CCAALLFFEEDD MMeerrccuurryy PPrroojjeecctt –– TTAAMMUUGG FFiinnaall RReeppoorrtt ((TTaasskk 44BB)) Page 34
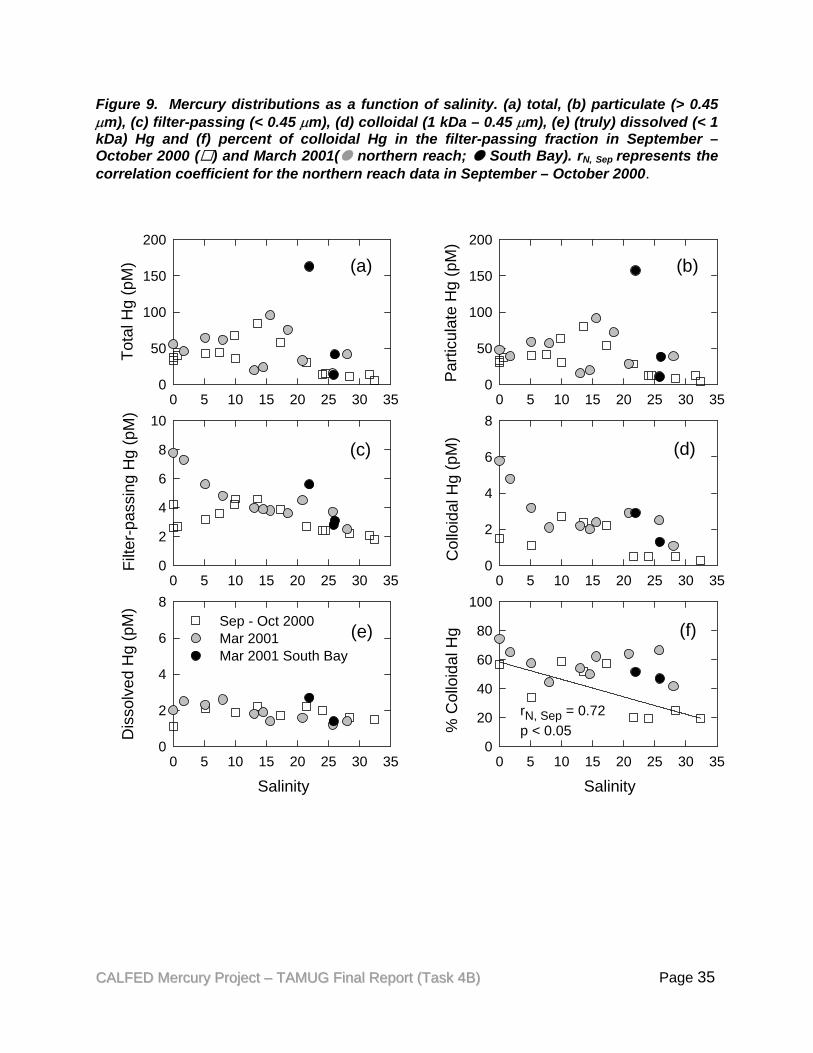
Figure 9. Mercury distributions as a function of salinity. (a) total, (b) particulate (> 0.45 µm), (c) filter-passing (< 0.45 µm), (d) colloidal (1 kDa – 0.45 µm), (e) (truly) dissolved (< 1 kDa) Hg and (f) percent of colloidal Hg in the filter-passing fraction in September – October 2000 ( ) and March 2001( northern reach; South Bay). rN, Sep represents the correlation coefficient for the northern reach data in September – October 2000.
(e)
Salinity0 5 10 15 20 25 30 35
Dis
solv
ed H
g (p
M)
0
2
4
6
8
(a)
0 5 10 15 20 25 30 35
Tota
l Hg
(pM
)
0
50
100
150
200
Sep - Oct 2000Mar 2001Mar 2001 South Bay
(c)
0 5 10 15 20 25 30 35
Filte
r-pas
sing
Hg
(pM
)
0
2
4
6
8
10
(d)
0 5 10 15 20 25 30 35
Col
loid
al H
g (p
M)
0
2
4
6
8
(f)
Salinity0 5 10 15 20 25 30 35
% C
ollo
idal
Hg
0
20
40
60
80
100
(b)
0 5 10 15 20 25 30 35
Par
ticul
ate
Hg
(pM
)
0
50
100
150
200
rN, Sep = 0.72p < 0.05
CCAALLFFEEDD MMeerrccuurryy PPrroojjeecctt –– TTAAMMUUGG FFiinnaall RReeppoorrtt ((TTaasskk 44BB)) Page 35

Figure 10. Monomethyl mercury distributions as a function of salinity. (a) total, (b) particulate (> 0.45 µm), (c) filter-passing (< 0.45 µm), (d) colloidal (1 kDa – 0.45 µm), (e) (truly) dissolved (< 1 kDa) Hg and (f) percent of colloidal MeHg in the filter-passing fraction in September – October 2000 ( ) and March 2001( northern reach; South Bay). rN, Sep and rN, Mar represent the correlation coefficients for the northern reach data in September – October 2000 and March 2001, respectively.
(e)
0 5 10 15 20 25 30 35
Col
l. M
eHg
(pM
)
0.0
0.1
0.2
0.3
(f)
Salinity0 5 10 15 20 25 30 35
Dis
s. M
eHg
(pM
)
0.0
0.1
0.2
0.3
(d)
0 5 10 15 20 25 30 35
Filt.
MeH
g (p
M)
0.0
0.1
0.2
0.3
0.4
0.5
(a)
0 5 10 15 20 25 30 35
Tota
l MeH
g (p
M)
0.0
0.2
0.4
0.6
0.8
1.0
Sep - Oct 2000Mar 2001Mar 2001 (South Bay)
(g)
Salinity0 5 10 15 20 25 30 35
% C
oll.
MeH
g
0
20
40
60
80
100rN, Mar = 0.65, p < 0.1
rN, Sep = 0.89, p < 0.002
(b)
0 5 10 15 20 25 30 35
Par
t. M
eHg
(pM
)
0.0
0.2
0.4
0.6
0.8
(c)
0 5 10 15 20 25 30 35Par
t. M
eHg
(nm
ol/k
g)
0
5
10
15
25
CCAALLFFEEDD MMeerrccuurryy PPrroojjeecctt –– TTAAMMUUGG FFiinnaall RReeppoorrtt ((TTaasskk 44BB)) Page 36
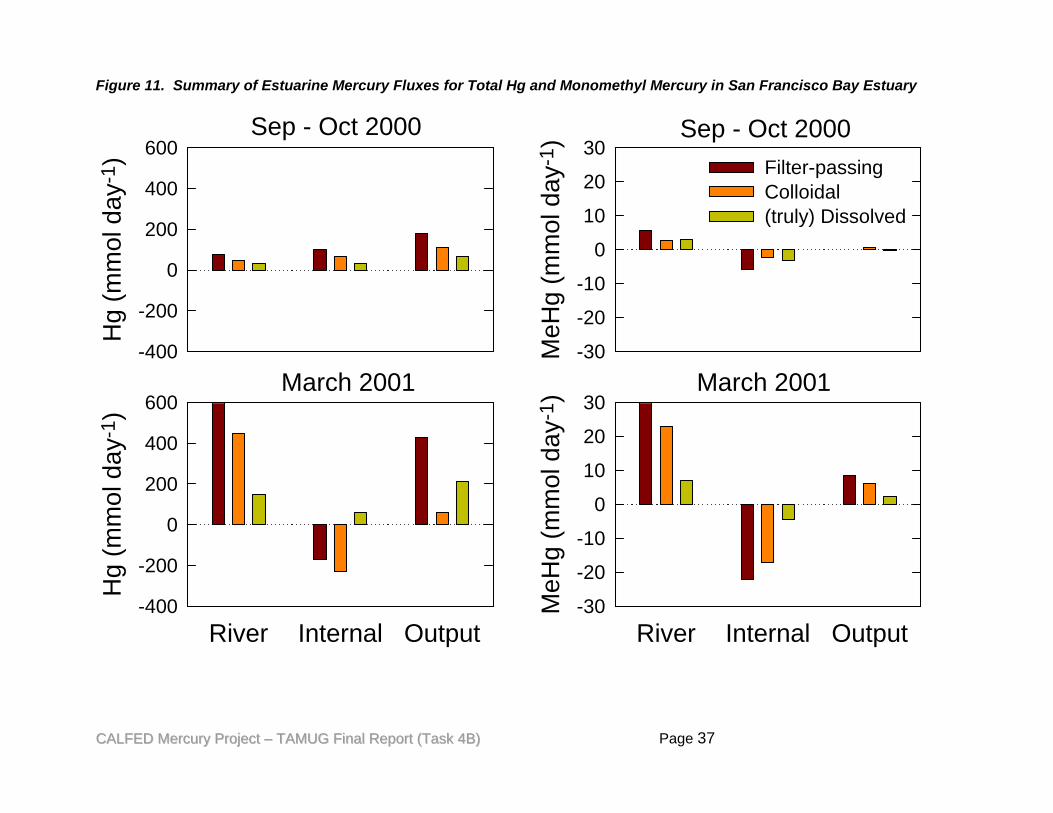
Figure 11. Summary of Estuarine Mercury Fluxes for Total Hg and Monomethyl Mercury in San Francisco Bay Estuary
Sep - Oct 2000
MeH
g (m
mol
day
-1)
-30
-20
-10
0
10
20
30Filter-passingColloidal(truly) Dissolved
March 2001
River Internal Output
MeH
g (m
mol
day
-1)
-30
-20
-10
0
10
20
30
Sep - Oct 2000H
g (m
mol
day
-1)
-400
-200
0
200
400
600
March 2001
River Internal Output
Hg
(mm
ol d
ay-1
)
-400
-200
0
200
400
600
CCAALLFFEEDD MMeerrccuurryy PPrroojjeecctt –– TTAAMMUUGG FFiinnaall RReeppoorrtt ((TTaasskk 44BB)) Page 37
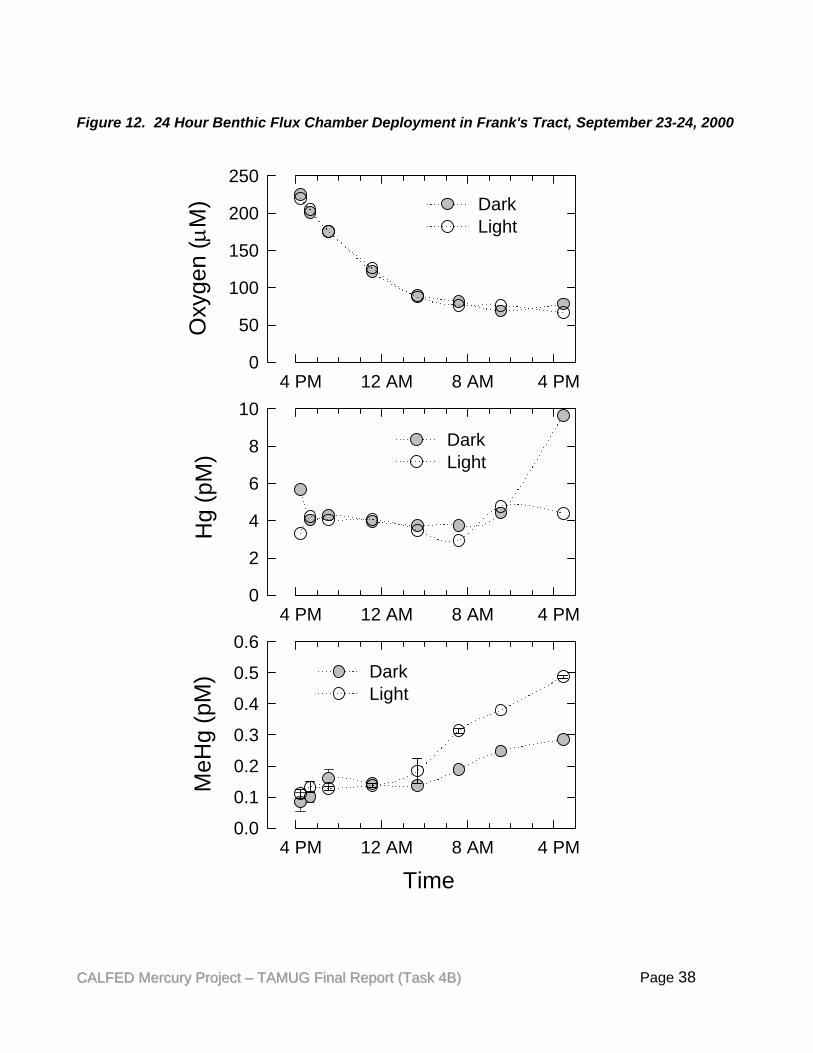
Figure 12. 24 Hour Benthic Flux Chamber Deployment in Frank's Tract, September 23-24, 2000
Time 4 PM 12 AM 8 AM 4 PM
MeH
g (p
M)
0.0
0.1
0.2
0.3
0.4
0.5
0.6DarkLight
4 PM 12 AM 8 AM 4 PM
Hg
(pM
)
0
2
4
6
8
10
DarkLight
4 PM 12 AM 8 AM 4 PM
Oxy
gen
(µM
)
0
50
100
150
200
250DarkLight
CCAALLFFEEDD MMeerrccuurryy PPrroojjeecctt –– TTAAMMUUGG FFiinnaall RReeppoorrtt ((TTaasskk 44BB)) Page 38

Figure 13. Mercury and MMHg concentrations in a surface water transect in Franks Tract on May 19, 2001. (UHg = unfiltered
Hg; FHg = filter-passing Hg; UMMHg = unfiltered monomethyl mercury; FMMHg = filter-passing monomethyl mercury).
Figure 13. Mercury and MMHg concentrations in a surface water transect in Franks Tract on May 19, 2001. (UHg = unfiltered
Hg; FHg = filter-passing Hg; UMMHg = unfiltered monomethyl mercury; FMMHg = filter-passing monomethyl mercury).
FTM
FT1FT2
FT3
FT
Franks TractBethel Island
San Joaquin River
Franks Tract transectMarsh FT1 FT2 FT3
Con
cent
ratio
n (p
M)
0
1
2
3
4
102030
UHgFHgUMMHgFMMHg
21.98.98.010.9
CCAALLFFEEDD MMeerrccuurryy PPrroojjeecctt –– TTAAMMUUGG FFiinnaall RReeppoorrtt ((TTaasskk 44BB)) Page 39
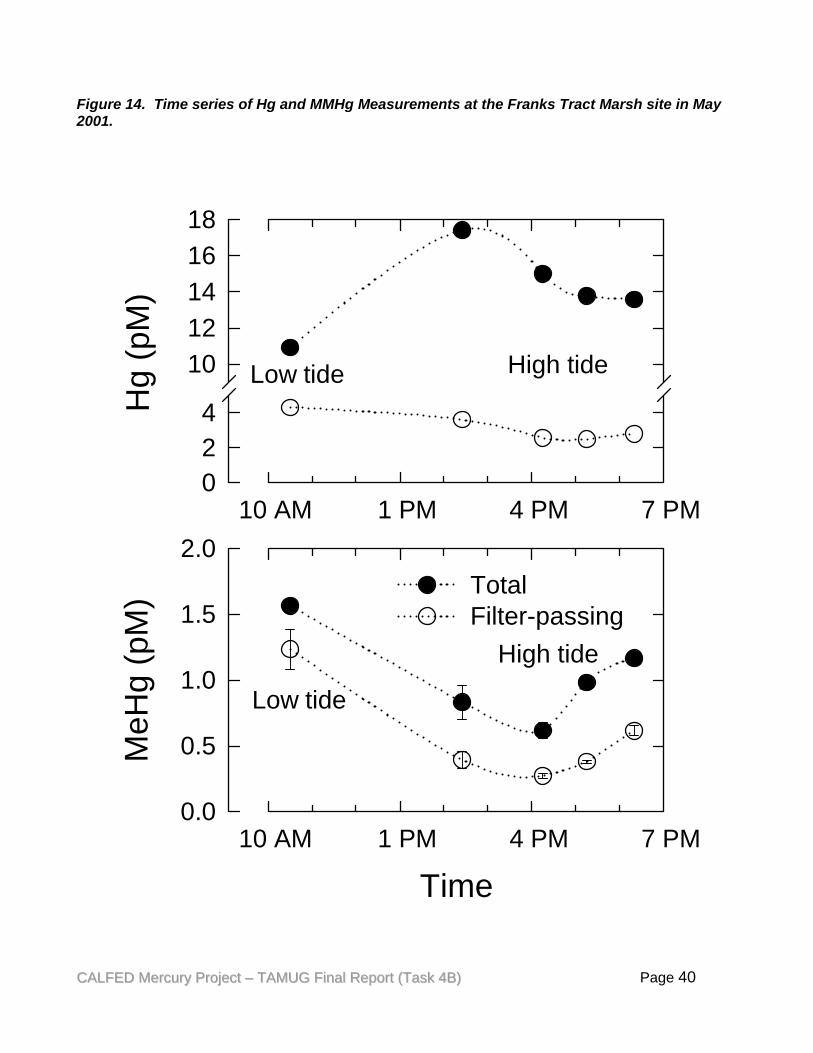
Figure 14. Time series of Hg and MMHg Measurements at the Franks Tract Marsh site in May 2001.
Time 10 AM 1 PM 4 PM 7 PM
MeH
g (p
M)
0.0
0.5
1.0
1.5
2.0TotalFilter-passing
High tide
Low tide
10 AM 1 PM 4 PM 7 PM
Hg
(pM
)
024
1012141618
Low tide High tide
CCAALLFFEEDD MMeerrccuurryy PPrroojjeecctt –– TTAAMMUUGG FFiinnaall RReeppoorrtt ((TTaasskk 44BB)) Page 40

Figure 15. . Depth profiles of Sediment MMHg Concentrations at Selected Sites in the San Francisco Bay and Delta Region. For the left bottom panel, Little Holland refers to the date sets for May and September of 2000 and Prospect Slough February and May of 2001.
Cosumnes River
0 2 4 6 8D
epth
(cm
)0
2
4
6
8
10
May 2000Sep 2000Feb 2001May 2001
Franks Tract
Monomethyl Mercury (pmol/g sed)0 5 10 15 20
0
2
4
6
8
10FT Marsh
0 20 40 60 800
2
4
6
8
10
Little HollandProspect Slough
0 1 2 30
2
4
6
8
10Sherman Island
0 2 4 60
2
4
6
8
10White Slough
0 5 10 15 200
2
4
6
8
10
CCAALLFFEEDD MMeerrccuurryy PPrroojjeecctt –– TTAAMMUUGG FFiinnaall RReeppoorrtt ((TTaasskk 44BB)) Page 41
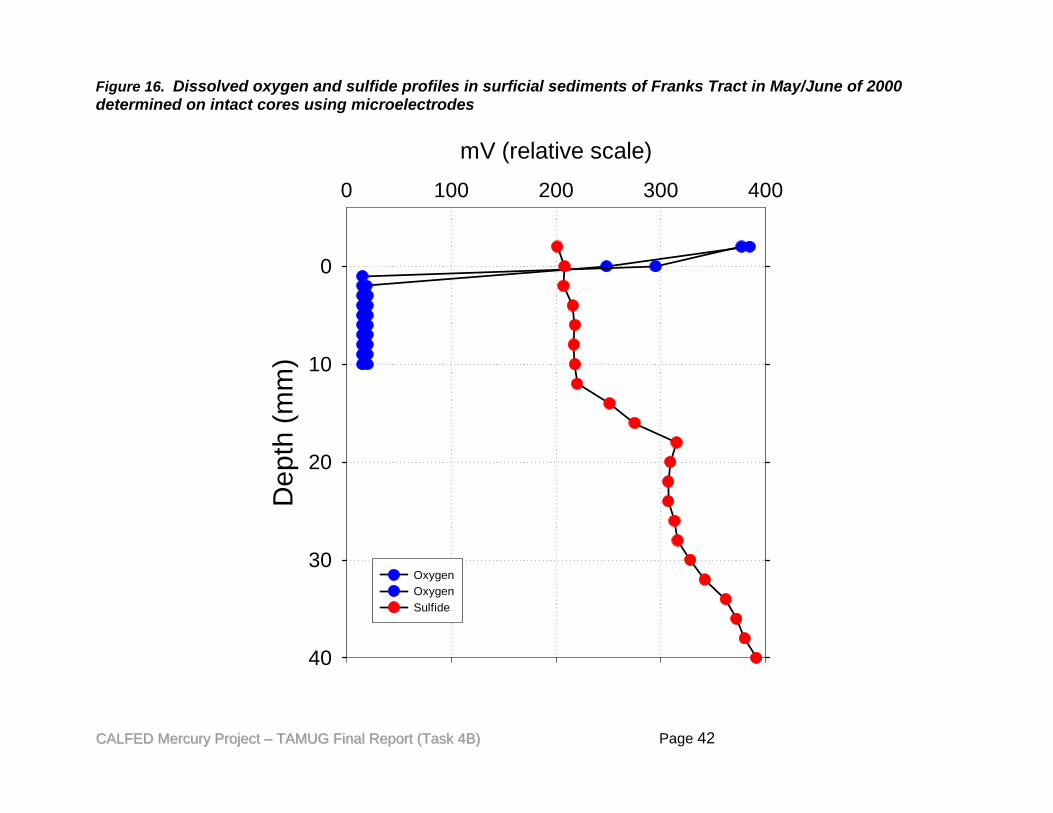
Figure 16. Dissolved oxygen and sulfide profiles in surficial sediments of Franks Tract in May/June of 2000 determined on intact cores using microelectrodes
mV (relative scale)0 100 200 300 400
Dep
th (m
m)
0
10
20
30
40
OxygenOxygenSulfide
CCAALLFFEEDD MMeerrccuurryy PPrroojjeecctt –– TTAAMMUUGG FFiinnaall RReeppoorrtt ((TTaasskk 44BB)) Page 42
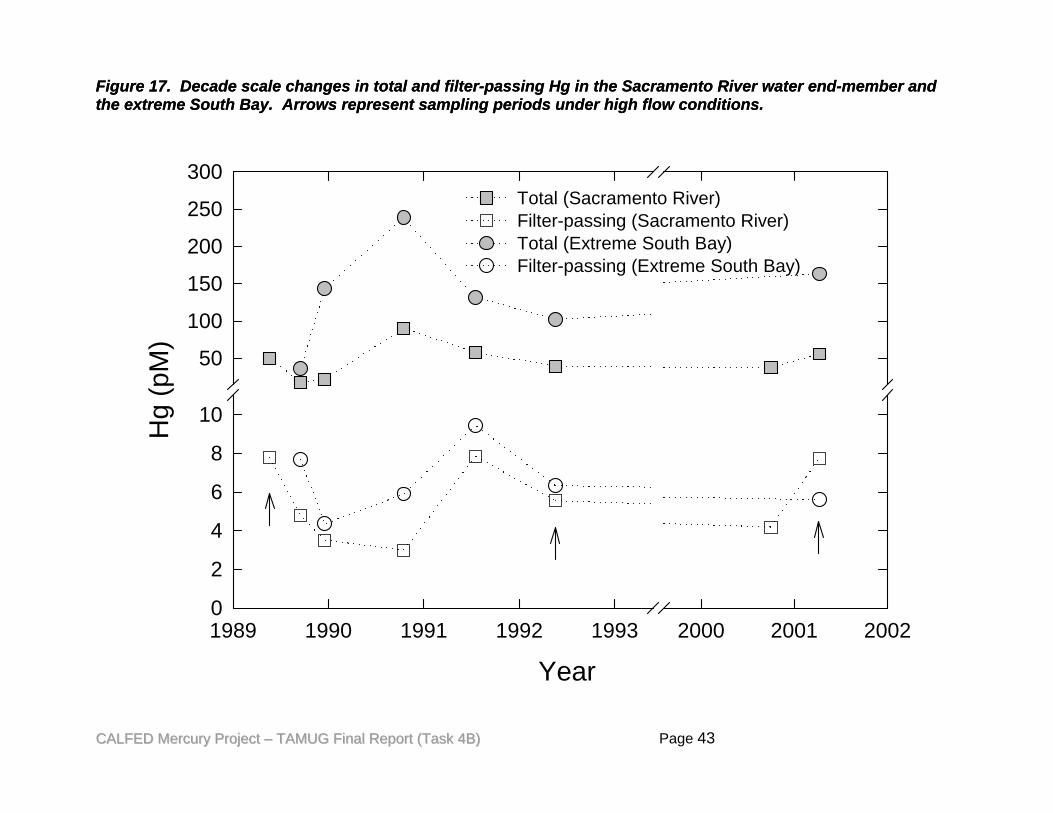
Figure 17. Decade scale changes in total and filter-passing Hg in the Sacramento River water end-member and the extreme South Bay. Arrows represent sampling periods under high flow conditions. Figure 17. Decade scale changes in total and filter-passing Hg in the Sacramento River water end-member and the extreme South Bay. Arrows represent sampling periods under high flow conditions.
Year
1989 1990 1991 1992 1993 2000 2001 2002
Hg
(pM
)
0
2
4
6
8
10
50
100
150
200
250
300Total (Sacramento River)Filter-passing (Sacramento River)Total (Extreme South Bay)Filter-passing (Extreme South Bay)
CCAALLFFEEDD MMeerrccuurryy PPrroojjeecctt –– TTAAMMUUGG FFiinnaall RReeppoorrtt ((TTaasskk 44BB)) Page 43
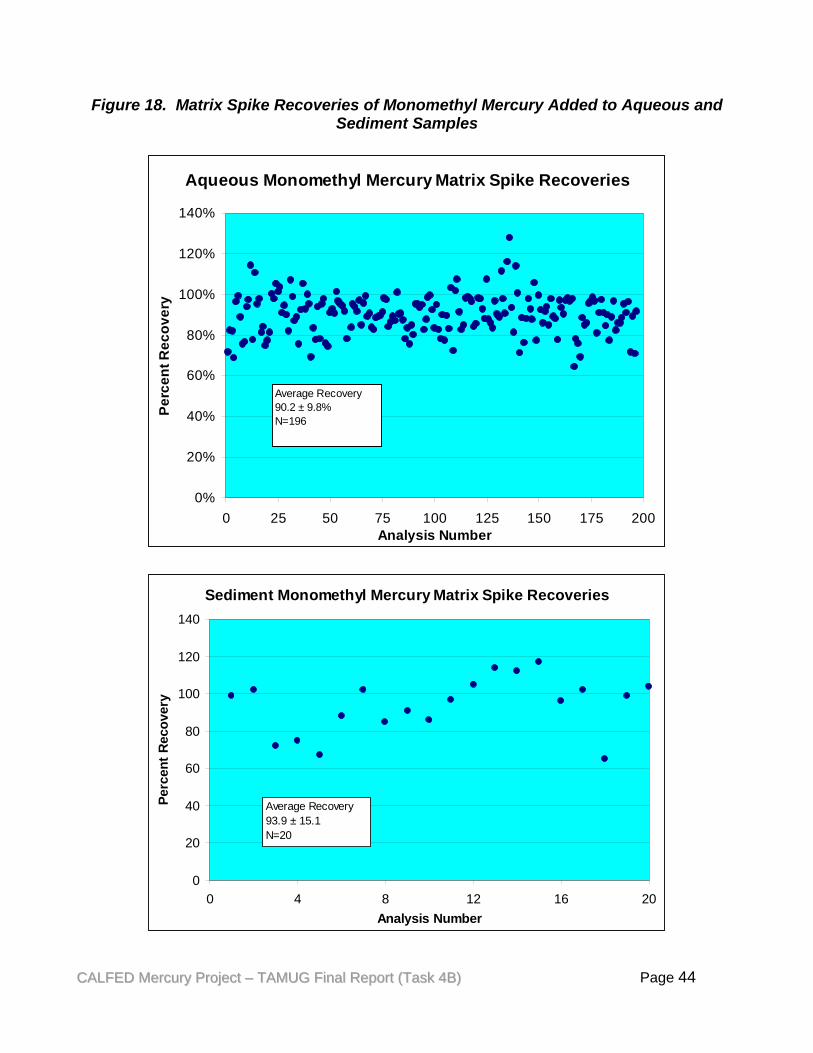
Figure 18. Matrix Spike Recoveries of Monomethyl Mercury Added to Aqueous and Sediment Samples
0%
20%
40%
60%
80%
100%
120%
140%
0 25 50 75 100 125 150 175 200Analysis Number
Perc
ent R
ecov
ery
Average Recovery90.2 ± 9.8%N=196
Aqueous Monomethyl Mercury Matrix Spike Recoveries
Sediment Monomethyl Mercury Matrix Spike Recoveries
0
20
40
60
80
100
120
140
0 4 8 12 16Analysis Number
Perc
ent R
ecov
ery
20
Average Recovery93.9 ± 15.1N=20
CCAALLFFEEDD MMeerrccuurryy PPrroojjeecctt –– TTAAMMUUGG FFiinnaall RReeppoorrtt ((TTaasskk 44BB)) Page 44