Embed Size (px)
Citation preview
AD
DTE
CH
AN
NU
AL R
EP
OR
T 07/08
Box 602, Gamla Brogatan 11, SE-101 32 Stockholm, Sweden. Tel: +46 (0)8 470 49 00, Fax: +46 (0)8 470 49 01 www.addtech.com. Company ID number: 556302–9726
ANNUAL REPORT
Interim Report Q11 April – 30 June 2008Published on 16 July 2008
Annual General Meeting 2008/2009Held on 25 August 2009
Interim Report Q21 April – 30 September 2008Published on 29 October 2008
Interim Report Q3 1 April – 31 December 2008Published on 9 February 2009
Year-end report 1 April 2008 – 31 March 2009Published on 11 May 2009
All financial information is published on Addtech’s website, www.addtech.com, as soon as announced. The annual report is distributed to shareholders who have ordered it via Addtech.
All amounts are expressed in millions of Swedish
kronor (MSEK) for the Group unless otherwise
stated.
This Annual Report is also available in Swedish
CALENDAR TABLE OF CONTENTSAddtech in brief 1
President’s statement 2
Business concept, goals and strategies 4
Business model that creates value 5
Market 6
Market-leading positions 8
Organisation and operating mobility 9
Acquisitions 12
Employees 14
Business school 16
Ethics and environment 18
Components 20
Energy & Equipment 24
Industrial Solutions 28
Life Science 32
Key financial ndicators 36
Multi-year summary 36
Quarterly data, annual data and definitions
37
Risk and sensitivity analysis 38
Table of contents 39
Administration report 40
Financial statements 46
Notes 54
Proposed allocation of earnings 79
Audit report 80
Invitation to the Annual General Meeting 81
Board of Directors 82
Group Management 83
The share 84
Addresses 86
“A value-adding technology trading company”
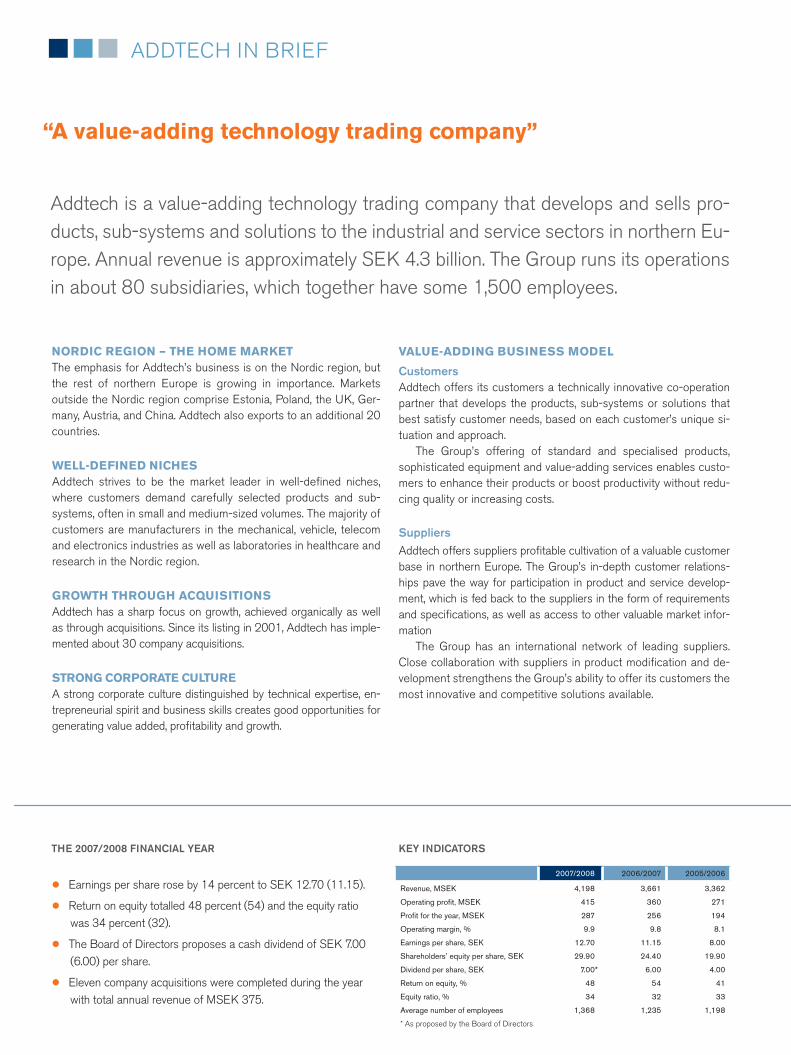
Addtech is a value-adding technology trading company that develops and sells pro-ducts, sub-systems and solutions to the industrial and service sectors in northern Eu-rope. Annual revenue is approximately SEK 4.3 billion. The Group runs its operations in about 80 subsidiaries, which together have some 1,500 employees.
VALUE-ADDING BUSINESS MODEL
CustomersAddtech offers its customers a technically innovative co-operation partner that develops the products, sub-systems or solutions that best satisfy customer needs, based on each customer’s unique si-tuation and approach. The Group’s offering of standard and specialised products, sophisticated equipment and value-adding services enables custo-mers to enhance their products or boost productivity without redu-cing quality or increasing costs.
SuppliersAddtech offers suppliers profi table cultivation of a valuable customer base in northern Europe. The Group’s in-depth customer relations-hips pave the way for participation in product and service develop-ment, which is fed back to the suppliers in the form of requirements and specifi cations, as well as access to other valuable market infor-mation The Group has an international network of leading suppliers. Close collaboration with suppliers in product modifi cation and de-velopment strengthens the Group’s ability to offer its customers the most innovative and competitive solutions available.
NORDIC REGION – THE HOME MARKETThe emphasis for Addtech’s business is on the Nordic region, but the rest of northern Europe is growing in importance. Markets outside the Nordic region comprise Estonia, Poland, the UK, Ger-many, Austria, and China. Addtech also exports to an additional 20 countries.
WELL-DEFINED NICHESAddtech strives to be the market leader in well-defi ned niches, where customers demand carefully selected products and sub-systems, often in small and medium-sized volumes. The majority of customers are manufacturers in the mechanical, vehicle, telecom and electronics industries as well as laboratories in healthcare and research in the Nordic region.
GROWTH THROUGH ACQUISITIONSAddtech has a sharp focus on growth, achieved organically as well as through acquisitions. Since its listing in 2001, Addtech has imple-mented about 30 company acquisitions.
STRONG CORPORATE CULTUREA strong corporate culture distinguished by technical expertise, en-trepreneurial spirit and business skills creates good opportunities for generating value added, profi tability and growth.
ADDTECH IN BRIEF
THE 2007/2008 FINANCIAL YEAR KEY INDICATORS
Earnings per share rose by 14 percent to SEK 12.70 (11.15).
Return on equity totalled 48 percent (54) and the equity ratio was 34 percent (32).
The Board of Directors proposes a cash dividend of SEK 7.00 (6.00) per share.
Eleven company acquisitions were completed during the year with total annual revenue of MSEK 375.
2007/2008 2006/2007 2005/2006
Revenue, MSEK 4,198 3,661 3,362
Operating profi t, MSEK 415 360 271
Profi t for the year, MSEK 287 256 194
Operating margin, % 9.9 9.8 8.1
Earnings per share, SEK 12.70 11.15 8.00
Shareholders’ equity per share, SEK 29.90 24.40 19.90
Dividend per share, SEK 7.00* 6.00 4.00
Return on equity, % 48 54 41
Equity ratio, % 34 32 33
Average number of employees 1,368 1,235 1,198
* As proposed by the Board of Directors
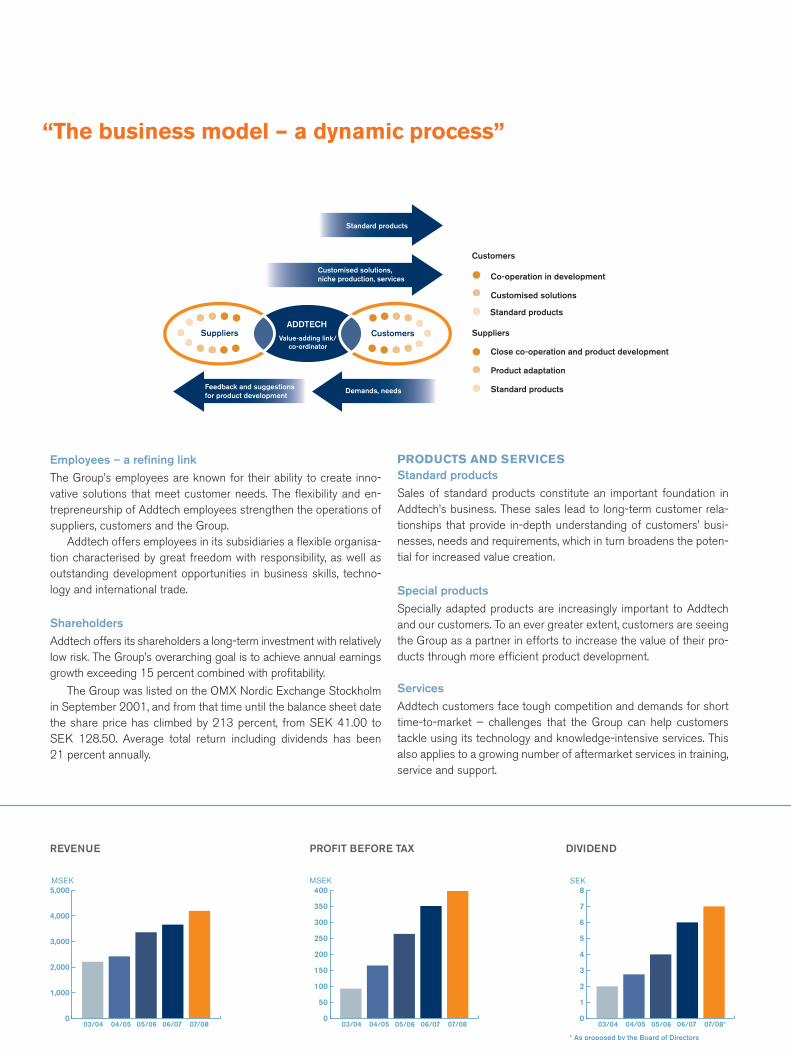
“The business model – a dynamic process”
REVENUE PROFIT BEFORE TAX DIVIDEND
MSEK
0
1,000
2,000
3,000
4,000
5,000
03/04 04/05 05/06 06/07 07/08
Employees – a refi ning linkThe Group’s employees are known for their ability to create inno-vative solutions that meet customer needs. The fl exibility and en-trepreneurship of Addtech employees strengthen the operations of suppliers, customers and the Group. Addtech offers employees in its subsidiaries a fl exible organisa-tion characterised by great freedom with responsibility, as well as outstanding development opportunities in business skills, techno-logy and international trade.
ShareholdersAddtech offers its shareholders a long-term investment with relatively low risk. The Group’s overarching goal is to achieve annual earnings growth exceeding 15 percent combined with profi tability.
The Group was listed on the OMX Nordic Exchange Stockholm in September 2001, and from that time until the balance sheet date the share price has climbed by 213 percent, from SEK 41.00 to SEK 128.50. Average total return including dividends has been 21 percent annually.
PRODUCTS AND SERVICESStandard productsSales of standard products constitute an important foundation in Addtech’s business. These sales lead to long-term customer rela-tionships that provide in-depth understanding of customers’ busi-nesses, needs and requirements, which in turn broadens the poten-tial for increased value creation.
Special productsSpecially adapted products are increasingly important to Addtech and our customers. To an ever greater extent, customers are seeing the Group as a partner in efforts to increase the value of their pro-ducts through more effi cient product development.
ServicesAddtech customers face tough competition and demands for short time-to-market – challenges that the Group can help customers tackle using its technology and knowledge-intensive services. This also applies to a growing number of aftermarket services in training, service and support.
MSEK
0
50
100
150
200
250
300
350
400
03/04 04/05 05/06 06/07 07/08
MSEK
0
1
2
3
4
5
6
7
8
03/04 04/05 05/06 06/07 07/08*
* As proposed by the Board of Directors
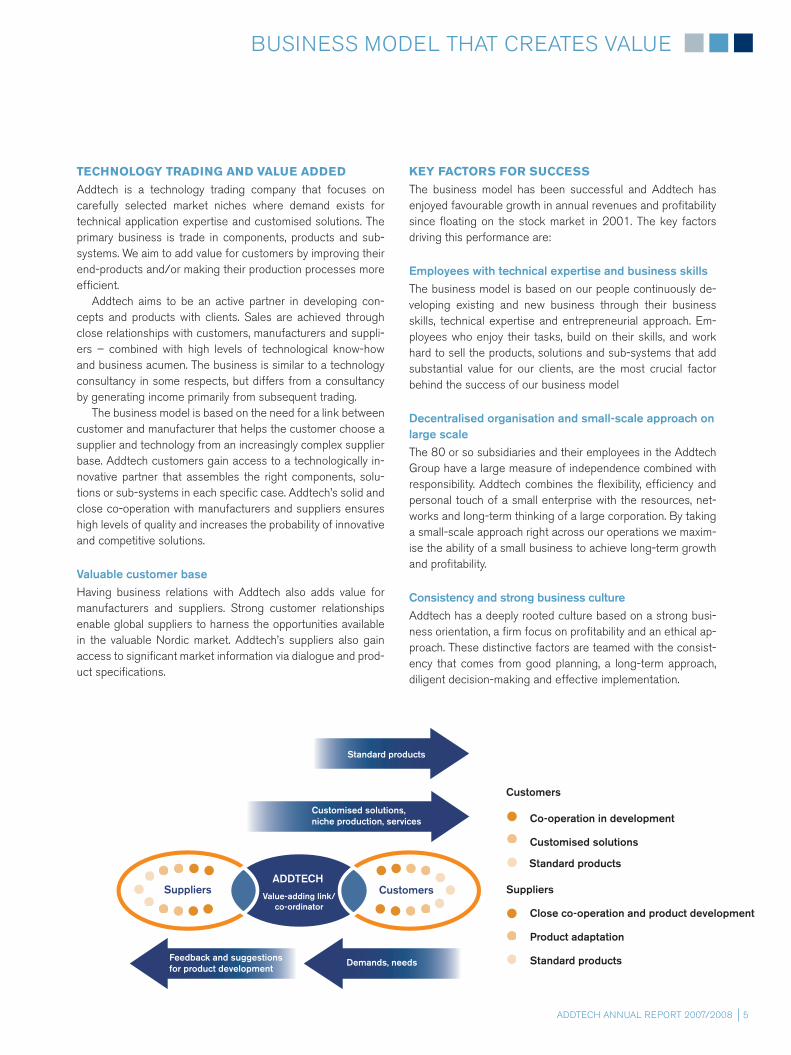
Standard products
Customised solutions,niche production, services
Feedback and suggestionsfor product development
Demands, needs
SuppliersADDTECH
CustomersValue-adding link/
co-ordinator
Customers
Co-operation in development
Customised solutions
Suppliers
Close co-operation and product development
Product adaptation
Standard products
Standard products
ADDTECH ANNUAL REPORT 2007/2008 89
ADDTECH LIFE SCIENCE Göran Brandt, Business Area Manager Box 26077, Sköldungagatan 7 SE-100 41 Stockholm, Sweden Telephone: +46-8-594 113 50Telefax: +46-8-411 36 20
DIAGNOSTICS
Bergman Diagnostika ASTove Nyhus, Managing Director Postboks 402, Slynga 2 NO-2001 Lillestrøm, Norway Telephone: +47-63-83 57 50Telefax: +47-63-83 57 40www.bergmandiag.no
Immunkemi F&D ABMonica Mattisson, Managing Director Veddesta Centrum SE-175 72 Järfälla, Sweden Telephone: +46-8-583 615 00Telefax: +46-8-583 615 01www.immunkemi.se
LabRobot Products ABPer-Ivar Fallenius, Managing Director Gärdesvägen 3 SE-444 31 Stenungsund, Sweden Telephone: +46- 303-846 73Telefax: +46- 303- 652 55www.labrobot.com
Triolab A/SFinn Andersen, Managing Director Vallensbækvej 35 DK-2605 Brøndby, Denmark Telephone: +45-43-96 00 12Telefax: +45-43-96 77 11www.triolab.dk
Triolab ABSven Erickson, Managing Director Box 2109, Åbäcksgatan 6 B SE-431 02 Mölndal, Sweden Telephone: +46-31-81 72 00Telefax: +46-31-81 72 19www.triolab.se
Triolab Oy Kai Rantanen, Managing Director Lemminkäinenvägen 20 B FI-20520 Åbo, Finland Telephone: +358-201-22 66 00Telefax: +358-201-22 66 01www.triolab.fi
ADDTECH LIFE SCIENCE
PROCESS TECHNOLOGY
Insatech A/SAlan Christoffersen, Managing Director Algade 133 DK-4760 Vordingborg, Denmark Telephone: +45-55-37 20 95Telefax: +45-55-37 70 18www.insatech.com
Kouvo Automation OySeppo Lappalainen, Managing Director Puhjontie 17 FI-45720 Kuusankoski, Finland Telephone: +358-5-363 16 55Telefax: +358-5-363 16 63www.kouvo.fi
OmniProcess ABRoland Levin, Managing Director Vretenvägen 12 SE-171 54 Solna, Sweden Telephone: +46-8-564 808 40Telefax: +46-8-564 808 50www.omniprocess.se
RESEARCH
Bergman ASRoger Kopperud, Managing Director Postboks 364, Slynga 2 NO-2001 Lillestrøm, Norway Telephone: +47-63-83 56 00Telefax: +47-63-83 56 10www.bergman.no
BergmanLabora ABPeter Simonsbacka, Managing Director Box 705, Karlsrovägen 2 D SE-182 17 Danderyd, Sweden Telephone: +46-8-625 18 50Telefax: +46-8-625 18 70www.bergmanlabora.se
Holm & Halby A/SMorten Dyrner, Managing Director Vallensbækvej 35 DK-2605 Brøndby, Denmark Telephone: +45-43-26 94 00Telefax: +45-43-26 94 10www.holmhalby.dk
Mikro Kemi ABKent Ersson, Managing Director Box 15018, Seminariegatan 29 SE-750 15 Uppsala, Sweden Telephone: +46-18-57 22 00Telefax: +46-18-57 22 22www.mikrokemi.se
PLD Finland OyTomi Virtanen, Managing Director PL 159, Sinikalliontie 9 FI-02631 Espoo, Finland Telephone: +358-20-741 02 70Telefax: +358-20-741 02 77www.pld.fi
OTHER COMPANIES
Addtech Business Support ABPeter Svensson, Managing Director Box 6068, Jägerhorns väg 8 SE-141 06 Kungens Kurva, Sweden Telephone: +46-8-680 77 66 Telefax: +46-8-680 77 61
Production: Oxenstierna & PartnersPhoto: Labe Allwin pages 3, 11, 13, 15, 17, 19, 21, 27
Print: Danagårds Grafi ska
“A value-adding technology trading company”
Addtech is a value-adding technology trading company that develops and sells pro-ducts, sub-systems and solutions to the industrial and service sectors in northern Eu-rope. Annual revenue is approximately SEK 4.3 billion. The Group runs its operations in about 80 subsidiaries, which together have some 1,500 employees.
VALUE-ADDING BUSINESS MODEL
CustomersAddtech offers its customers a technically innovative co-operation partner that develops the products, sub-systems or solutions that best satisfy customer needs, based on each customer’s unique si-tuation and approach. The Group’s offering of standard and specialised products, sophisticated equipment and value-adding services enables custo-mers to enhance their products or boost productivity without redu-cing quality or increasing costs.
SuppliersAddtech offers suppliers profi table cultivation of a valuable customer base in northern Europe. The Group’s in-depth customer relations-hips pave the way for participation in product and service develop-ment, which is fed back to the suppliers in the form of requirements and specifi cations, as well as access to other valuable market infor-mation The Group has an international network of leading suppliers. Close collaboration with suppliers in product modifi cation and de-velopment strengthens the Group’s ability to offer its customers the most innovative and competitive solutions available.
NORDIC REGION – THE HOME MARKETThe emphasis for Addtech’s business is on the Nordic region, but the rest of northern Europe is growing in importance. Markets outside the Nordic region comprise Estonia, Poland, the UK, Ger-many, Austria, and China. Addtech also exports to an additional 20 countries.
WELL-DEFINED NICHESAddtech strives to be the market leader in well-defi ned niches, where customers demand carefully selected products and sub-systems, often in small and medium-sized volumes. The majority of customers are manufacturers in the mechanical, vehicle, telecom and electronics industries as well as laboratories in healthcare and research in the Nordic region.
GROWTH THROUGH ACQUISITIONSAddtech has a sharp focus on growth, achieved organically as well as through acquisitions. Since its listing in 2001, Addtech has imple-mented about 30 company acquisitions.
STRONG CORPORATE CULTUREA strong corporate culture distinguished by technical expertise, en-trepreneurial spirit and business skills creates good opportunities for generating value added, profi tability and growth.
ADDTECH IN BRIEF
THE 2007/2008 FINANCIAL YEAR KEY INDICATORS
Earnings per share rose by 14 percent to SEK 12.70 (11.15).
Return on equity totalled 48 percent (54) and the equity ratio was 34 percent (32).
The Board of Directors proposes a cash dividend of SEK 7.00 (6.00) per share.
Eleven company acquisitions were completed during the year with total annual revenue of MSEK 375.
2007/2008 2006/2007 2005/2006
Revenue, MSEK 4,198 3,661 3,362
Operating profi t, MSEK 415 360 271
Profi t for the year, MSEK 287 256 194
Operating margin, % 9.9 9.8 8.1
Earnings per share, SEK 12.70 11.15 8.00
Shareholders’ equity per share, SEK 29.90 24.40 19.90
Dividend per share, SEK 7.00* 6.00 4.00
Return on equity, % 48 54 41
Equity ratio, % 34 32 33
Average number of employees 1,368 1,235 1,198
* As proposed by the Board of Directors
“The business model – a dynamic process”
REVENUE PROFIT BEFORE TAX DIVIDEND
MSEK
0
1,000
2,000
3,000
4,000
5,000
03/04 04/05 05/06 06/07 07/08
Employees – a refi ning linkThe Group’s employees are known for their ability to create inno-vative solutions that meet customer needs. The fl exibility and en-trepreneurship of Addtech employees strengthen the operations of suppliers, customers and the Group. Addtech offers employees in its subsidiaries a fl exible organisa-tion characterised by great freedom with responsibility, as well as outstanding development opportunities in business skills, techno-logy and international trade.
ShareholdersAddtech offers its shareholders a long-term investment with relatively low risk. The Group’s overarching goal is to achieve annual earnings growth exceeding 15 percent combined with profi tability.
The Group was listed on the OMX Nordic Exchange Stockholm in September 2001, and from that time until the balance sheet date the share price has climbed by 213 percent, from SEK 41.00 to SEK 128.50. Average total return including dividends has been 21 percent annually.
PRODUCTS AND SERVICESStandard productsSales of standard products constitute an important foundation in Addtech’s business. These sales lead to long-term customer rela-tionships that provide in-depth understanding of customers’ busi-nesses, needs and requirements, which in turn broadens the poten-tial for increased value creation.
Special productsSpecially adapted products are increasingly important to Addtech and our customers. To an ever greater extent, customers are seeing the Group as a partner in efforts to increase the value of their pro-ducts through more effi cient product development.
ServicesAddtech customers face tough competition and demands for short time-to-market – challenges that the Group can help customers tackle using its technology and knowledge-intensive services. This also applies to a growing number of aftermarket services in training, service and support.
MSEK
0
50
100
150
200
250
300
350
400
03/04 04/05 05/06 06/07 07/08
SEK
0
1
2
3
4
5
6
7
8
03/04 04/05 05/06 06/07 07/08*
* As proposed by the Board of Directors
Standard products
Customised solutions,niche production, services
Feedback and suggestionsfor product development
Demands, needs
SuppliersADDTECH
CustomersValue-adding link/
co-ordinator
Customers
Co-operation in development
Customised solutions
Suppliers
Close co-operation and product development
Product adaptation
Standard products
Standard products
ADDTECH ANNUAL REPORT 2007/2008 89
ADDTECH LIFE SCIENCE Göran Brandt, Business Area Manager Box 26077, Sköldungagatan 7 SE-100 41 Stockholm, Sweden Telephone: +46-8-594 113 50Telefax: +46-8-411 36 20
DIAGNOSTICS
Bergman Diagnostika ASTove Nyhus, Managing Director Postboks 402, Slynga 2 NO-2001 Lillestrøm, Norway Telephone: +47-63-83 57 50Telefax: +47-63-83 57 40www.bergmandiag.no
Immunkemi F&D ABMonica Mattisson, Managing Director Veddesta Centrum SE-175 72 Järfälla, Sweden Telephone: +46-8-583 615 00Telefax: +46-8-583 615 01www.immunkemi.se
LabRobot Products ABPer-Ivar Fallenius, Managing Director Gärdesvägen 3 SE-444 31 Stenungsund, Sweden Telephone: +46- 303-846 73Telefax: +46- 303- 652 55www.labrobot.com
Triolab A/SFinn Andersen, Managing Director Vallensbækvej 35 DK-2605 Brøndby, Denmark Telephone: +45-43-96 00 12Telefax: +45-43-96 77 11www.triolab.dk
Triolab ABSven Erickson, Managing Director Box 2109, Åbäcksgatan 6 B SE-431 02 Mölndal, Sweden Telephone: +46-31-81 72 00Telefax: +46-31-81 72 19www.triolab.se
Triolab Oy Kai Rantanen, Managing Director Lemminkäinenvägen 20 B FI-20520 Åbo, Finland Telephone: +358-201-22 66 00Telefax: +358-201-22 66 01www.triolab.fi
ADDTECH LIFE SCIENCE
PROCESS TECHNOLOGY
Insatech A/SAlan Christoffersen, Managing Director Algade 133 DK-4760 Vordingborg, Denmark Telephone: +45-55-37 20 95Telefax: +45-55-37 70 18www.insatech.com
Kouvo Automation OySeppo Lappalainen, Managing Director Puhjontie 17 FI-45720 Kuusankoski, Finland Telephone: +358-5-363 16 55Telefax: +358-5-363 16 63www.kouvo.fi
OmniProcess ABRoland Levin, Managing Director Vretenvägen 12 SE-171 54 Solna, Sweden Telephone: +46-8-564 808 40Telefax: +46-8-564 808 50www.omniprocess.se
RESEARCH
Bergman ASRoger Kopperud, Managing Director Postboks 364, Slynga 2 NO-2001 Lillestrøm, Norway Telephone: +47-63-83 56 00Telefax: +47-63-83 56 10www.bergman.no
BergmanLabora ABPeter Simonsbacka, Managing Director Box 705, Karlsrovägen 2 D SE-182 17 Danderyd, Sweden Telephone: +46-8-625 18 50Telefax: +46-8-625 18 70www.bergmanlabora.se
Holm & Halby A/SMorten Dyrner, Managing Director Vallensbækvej 35 DK-2605 Brøndby, Denmark Telephone: +45-43-26 94 00Telefax: +45-43-26 94 10www.holmhalby.dk
Mikro Kemi ABKent Ersson, Managing Director Box 15018, Seminariegatan 29 SE-750 15 Uppsala, Sweden Telephone: +46-18-57 22 00Telefax: +46-18-57 22 22www.mikrokemi.se
PLD Finland OyTomi Virtanen, Managing Director PL 159, Sinikalliontie 9 FI-02631 Espoo, Finland Telephone: +358-20-741 02 70Telefax: +358-20-741 02 77www.pld.fi
OTHER COMPANIES
Addtech Business Support ABPeter Svensson, Managing Director Box 6068, Jägerhorns väg 8 SE-141 06 Kungens Kurva, Sweden Telephone: +46-8-680 77 66 Telefax: +46-8-680 77 61
Production: Oxenstierna & PartnersPhoto: Labe Allwin pages 3, 11, 13, 15, 17, 19, 21, 27
Print: Danagårds Grafi ska

ADDTECH COMPONENTSAddtech Components markets and sells components and sub-sys-tems in mechanics, electro-mechanics and hydraulics to customers in the manufacturing industry.
ADDTECH ENERGY & EQUIPMENTAddtech Energy & Equipment markets and sells battery solutions, products for power transmission, and equipment and material for industrial production processes. Its customers are in the commercial vehicle industry, the energy and telecom sector, and in engineering.
“Proactive organisational structure”
Expenditure refers to the 2007/2008 financial year Amounts in MSEK
Revenue Operating profit Operating margin Number of employees 1)
ADDTECH COMPONENTS 1,095 105 9.6% 266
ADDTECH ENErgy & EQUIPMENT 839 82 9.8% 298
ADDTECH INDUSTrIAl SOlUTIONS 1,525 172 11.3% 511
ADDTECH lIfE SCIENCE 752 65 8.6% 256
group total 4,198 415 9.9% 1,368
1) refers to average number
REVENUE BY GEOGRAPHICAL MARKET REVENUE BY CUSTOMER SEGMENT REVENUE BY BUSINESS AREA
The group has changed its organisation, effective as of the start of the new financial year. The motive for the change is to reinforce the conditions for profitable growth.
The operations are organised in four business areas: Addtech Components, Addtech Energy & Equipment, Addtech Industrial Solutions and Addtech life Science.
ADDTECH INDUSTRIAL SOLUTIONSAddtech Industrial Solutions markets and sells machinery compo-nents, automation solutions, polymer products and customised pro-ducts in electro-mechanics and circuitry. Own-brand products are marketed and sold to local and global industrial customers.
ADDTECH LIFE SCIENCEAddtech life Science markets and sells instruments and con-sumables to laboratories in health care and research, diag-nostic equipment to the health care industry, and process and analytical equipment to industry.
Other 14%
Norway 8%
Finland 15%
Denmark 18%
Sweden 45% Other 12%
Forest &Process 8%
Electronics 7%
Medical technology 20%
Vehicle 15%
Mechanical industry 19%
Telecom 7%
Energy 12%
Life Science 18%
Industrial Solutions 36%
Components 26%
Energy & Equipment 20%

Addtech AnnuAl RepoRt 2007/20082
pResident’s stAtement
Addtech has taken several important steps forward over the least few years. since the group was formed and subsequently listed on the stock exchange in 2001 the organisation and its employees have established the Addtech name on the market, expanded the group significantly, developed many successful companies and increased profitability. everyone in the group can feel proud to have contributed to this progress. today Addtech is one of the nordic region’s leading technology trad-ing companies.
WINNING LONG-TERM STRATEGY
Addtech’s overarching, long-term strategy is to create market-leading positions in carefully selected and well defined niches with a high knowledge and technology content in which cus-tomers demand adapted products, solutions and subsystems.
We can see how our business model is becoming increas-ingly relevant. As the business sector becomes increasingly complex, many of our customers are focusing on their core activities to a greater degree. these means that Addtech’s companies must be able to meet customers’ need for flexible, adapted value-adding products and solutions – the core of our business concept.
in my opinion, Addtech’s strong growth is very much due to our group’s deeply rooted corporate culture and consistent actions. our culture includes key concepts like operating mobility, entrepreneurship, decen-tralised responsibility and a business culture that is permeated by business acumen combined with a strong focus on profit-ability. using this as a foundation, the group’s companies have managed to nurture long-term profitable business relationships with market-leading customers and suppliers. in some cases these relationships have lasted for decades. consistent actions include key concepts like good long-term planning, carefully planned decisions and efficient implementation. our corpo-rate culture combined with our consistent approach leads to a continuity that creates confidence in Addtech and ultimately results in long-term profitable growth.
FOCUS INCREASES POTENTIAL
in the beginning of the new financial year we created a clearer, better focused organisation. this reorganisation means that we have created business units under each business area consisting of Group companies with similar markets, opera-tions, goals and strategies.
this paves the way for more intense collaboration between companies in the same business unit. customers and suppli-ers benefit from improved focus and broader competence. We can now offer our customers total solutions to a greater de-gree, while international suppliers are offered an established, competent marketing and sales channel for the entire nordic market with almost 25 million inhabitants. Addtech’s focus on business units increases potential for profitable growth, both in existing operations and through acquisitions.
SUCCESSFUL ACQUISITION PROCESS
Acquisitions are one of Addtech’s most important growth strat-egies. through a large number of successful acquisitions we have acquired the experience necessary to identify attractive companies, carry out effec-tive acquisition processes and then successfully integrate the companies into the Group.
the latter is especially important, since the full value of these companies is only achieved when they are refined in our en-vironment. here we have found the right formula, as can be seen in the strong financial performance in our most recent acquisitions. the success of the acquisition process is linked to the skill of the Group’s companies, through their proximity to the market and international network, in identifying suitable companies for acquisition.
over the past year we carried out eleven carefully selected corporate acquisitions with aggregate revenue of mseK 375, which represents an increase in business volume of 10 per-cent. Addtech will continue to acquire companies in new, at-tractive customer segments and/or market niches in order to realise the strategies of our business units. in the long run, ac-
In the last financial year Addtech delivered its best annual results ever. Rev-enue and operating income both increased by 15 percent and totalled BSEK 4.2 and MSEK 415 respectively. In the beginning of the new financial year, our organisational structure was improved further to enhance the conditions for continued profitable growth.
“Customers and suppliers benefit from improved focus and broader competence.”

Addtech AnnuAl RepoRt 2007/2008 3
quisitions can lead to new successful business units, which has been the case when we have gradually laid the foundations for new business units through acquisitions in expansive areas like energy, medical technology and the processing industry.
CONFIDENT ABOUT THE FUTURE
the 2007/2008 fi nancial year was characterised by strong demand in both the private and public sectors. our business improved on a broad front with respect to products for export-oriented manufacturing fi rms as well as capital goods and consumables for end customers in the industrial and service sectors.
All business areas strengthened their positions during 2007/2008 and the future is looking bright as well. We will continue to develop our strong position on the nordic market and also complete our profi table expansion outside the nordic region within our strongest market niches. We are already well on our way out into europe. Addtech’s sales outside the nordic region increased by 26 percent to just under mseK 600 dur-ing the year.
i believe that we have a good balance between customer segments and geographical markets, strong positions in care-fully selected niches and healthy partnerships with leading international suppliers. our Group companies are competitive with their high knowledge and technology content and offer our customers a value-adding, long-term partnership.
All of this, combined with the fact that we have a top growth rate compared to comparable actors on the market, plus that Addtech has a strong balance sheet and a good cash fl ow, means that Addtech has the necessary “components” for con-tinued success.
i would like to fi nish as i started, by highlighting our Group’s over 1,500 employees, who preserve and refi ne our business-driven corporate culture. they are characterised by their tech-nical competence, entrepreneurial spirit, focus on profi tability and willingness to take their decentralised business respon-sibility. All of our employees made the last fi nancial year the best ever in the Group’s history, and i am convinced that we can work together to create continued profi table growth – in true Addtech spirit!
Johan sjöpresident and ceo
Addtech AnnuAl RepoRt 2007/20084
Business concept, GoAls And stRAteGies
BUSINESS CONCEPT
Addtech offers high-tech, customised components and systems to industrial companies and the service industry. the Group’s companies serve as a value-enhancing link between custom-ers and manufacturers or suppliers. Addtech adds value through close co-operation with customers, manufacturers and suppliers and the advanced technological know-how of its employees.
GOALS
Financial goalsAddtech’s overriding goal is to achieve growth combined with profitability. the objective is earnings growth of at least 15 percent per annum over the course of a business cycle. the target is for each individual unit to achieve a p/Wc ratio (operating profit as a percentage of working capital) of at least 45 percent. the p/Wc ratio encourages high operating profit and low levels of tied-up capital. When combined with the growth target of 15 percent, this provides good conditions for profitable growth.
Operating goalsAddtech aims to be a leading technology trading company in selected niches and to be regarded by customers and suppli-ers as their most competent long-term partner.
STRATEGIES FOR PROFITABLE GROWTH
profitable growth is achieved through continuous business and organisational development. Addtech has three core strategies for reaching its goals:
Market-leading positionsAddtech sets out to be a market leader and build positions in selected and well-defined niches with high knowledge and technology content and where customers demand carefully selected products, solutions and sub-systems often in small and medium volumes. market leadership is a critical factor for achieving stable growth and sustainable profitability.
Operating mobilityAddtech is noted for its flexible organisational structure with quick-thinking and innovative employees who recognise new business opportunities. the Group seeks to capitalise on the growth potential of its subsidiaries and product areas by divid-ing or merging businesses either in whole or in part. operating mobility involves having effective procedures in place for inte-grating new operations into the Group.
AcquisitionsAddtech works at all times to strengthen its operations through bolt-on acquisitions and by building and expanding its posi-tions in chosen niches. Acquisitions are also made in new nich-es where the Group sees opportunities to become a market leader. the ability to apply the Group business model is vital to success in all acquisitions.
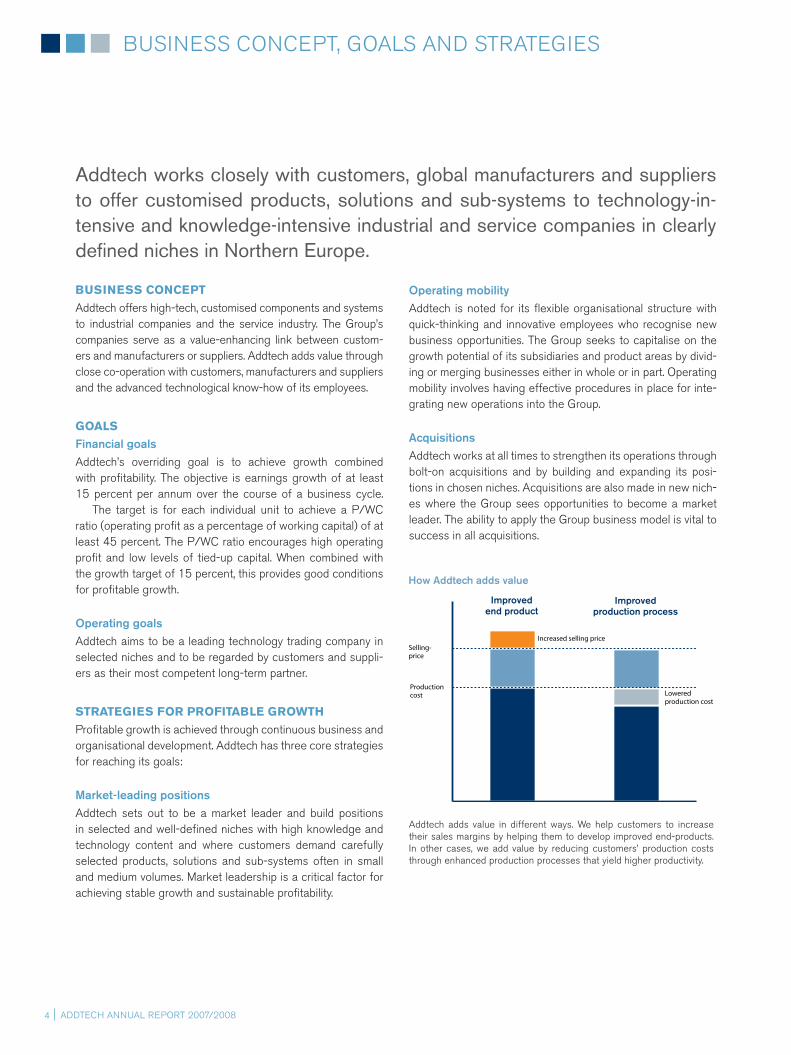
How Addtech adds value
Addtech adds value in different ways. We help customers to increase their sales margins by helping them to develop improved end-products. in other cases, we add value by reducing customers’ production costs through enhanced production processes that yield higher productivity.
Addtech works closely with customers, global manufacturers and suppliers to offer customised products, solutions and sub-systems to technology-in-tensive and knowledge-intensive industrial and service companies in clearly defined niches in Northern Europe.
Addtech AnnuAl RepoRt 2007/2008 5
Business model thAt cReAtes VAlue
TECHNOLOGY TRADING AND VALUE ADDED
Addtech is a technology trading company that focuses on carefully selected market niches where demand exists for technical application expertise and customised solutions. the primary business is trade in components, products and sub-systems. We aim to add value for customers by improving their end-products and/or making their production processes more effi cient.
Addtech aims to be an active partner in developing con-cepts and products with clients. sales are achieved through close relationships with customers, manufacturers and suppli-ers – combined with high levels of technological know-how and business acumen. the business is similar to a technology consultancy in some respects, but differs from a consultancy by generating income primarily from subsequent trading.
the business model is based on the need for a link between customer and manufacturer that helps the customer choose a supplier and technology from an increasingly complex supplier base. Addtech customers gain access to a technologically in-novative partner that assembles the right components, solu-tions or sub-systems in each specifi c case. Addtech’s solid and close co-operation with manufacturers and suppliers ensures high levels of quality and increases the probability of innovative and competitive solutions.
Valuable customer basehaving business relations with Addtech also adds value for manufacturers and suppliers. strong customer relationships enable global suppliers to harness the opportunities available in the valuable nordic market. Addtech’s suppliers also gain access to signifi cant market information via dialogue and prod-uct specifi cations.
KEY FACTORS FOR SUCCESS
the business model has been successful and Addtech has enjoyed favourable growth in annual revenues and profi tability since fl oating on the stock market in 2001. the key factors driving this performance are:
Employees with technical expertise and business skillsthe business model is based on our people continuously de-veloping existing and new business through their business skills, technical expertise and entrepreneurial approach. em-ployees who enjoy their tasks, build on their skills, and work hard to sell the products, solutions and sub-systems that add substantial value for our clients, are the most crucial factor behind the success of our business model
Decentralised organisation and small-scale approach on large scalethe 80 or so subsidiaries and their employees in the Addtech Group have a large measure of independence combined with responsibility. Addtech combines the fl exibility, effi ciency and personal touch of a small enterprise with the resources, net-works and long-term thinking of a large corporation. By taking a small-scale approach right across our operations we maxim-ise the ability of a small business to achieve long-term growth and profi tability.
Consistency and strong business cultureAddtech has a deeply rooted culture based on a strong busi-ness orientation, a fi rm focus on profi tability and an ethical ap-proach. these distinctive factors are teamed with the consist-ency that comes from good planning, a long-term approach, diligent decision-making and effective implementation.
Standard products
Customised solutions,niche production, services
Feedback and suggestionsfor product development
Demands, needs
SuppliersADDTECH
CustomersValue-adding link/
co-ordinator
Customers
Co-operation in development
Customised solutions
Suppliers
Close co-operation and product development
Product adaptation
Standard products
Standard products

Addtech AnnuAl RepoRt 2007/20086
mARKet
ADDTECH’S MARKET
Addtech operates in the international technology trading market, where players buy, adapt and sell technology-based products, sub-systems and solutions. the Group focuses on carefully se-lected niches with high technology and knowledge content. ex-pertise across many areas makes Addtech an important part-ner for industrial and technology-intensive service businesses in the private and public sectors in northern europe.
The north-European marketAddtech’s operational focus is on the nordic countries, although markets outside the region have grown in importance in recent years. outside the nordic region, Addtech has a presence in Austria, estonia, Germany, poland, the united Kingdom and china and exports products to a further 20 nations.
Market driversthe long-term growth and profitability of the technology trad-ing market depends on the size and diversity of the industrial and service sectors. northern europe’s relatively high payroll costs have spurred the development of knowledge-intensive, automated and specialised industrial and service sectors. this has resulted in differentiation of the value chain, increased trade and greater reliance on external suppliers for product development and component adjustment as well as for service and other aftermarket services.
Growth and profitabilityin the short term, growth and profitability are closely tied to the state of the economy in industry and the conditions prevailing in Addtech’s markets.
Addtech’s focus on infrastructure, the service sector and narrow market niches reduces sensitivity to economic volatil-ity. however, growth and profitability still depend entirely on the state of competition in our customers’ markets – and custom-ers’ ability to perform well domestically and/or internationally. it is therefore crucial when selecting customers that the invest-ments in niche markets offer long-term sustainability. Addtech evaluates its various markets on an ongoing basis to ensure they offer scope for reaching Group financial targets.
%
0
10
20
30
40
50
06/05 05/04 06/05 05/04 06/05 05/04 06/05 05/04 06/05 05/04
Sweden Denmark Finland Norway Other
2006/2007
2007/2008
REVENUE BY GEOGRAPHICAL MARKET
%
02468
1012141618202224
Vehicle
Mechanical industry
Telecom
Medical technology
Energy
Electronics
Forest & ProcessOther
2006/2007
2007/2008
REVENUE BY CUSTOMER SEGMENT
The technology trading market continued to grow in 2007/2008 as a result of further strong demand for products, solutions and sub-systems from in-dustrial and service companies in Northern Europe. Addtech strengthened its position in key market segments.
countries in europe where Addtech has Group companies
Addtech AnnuAl RepoRt 2007/2008 7
mARKet
CUSTOMERS
Addtech sells products and solutions to manufacturers and end users. our customers primarily work in mechanical engineer-ing, the vehicle industry, energy, forest products and process-ing, and telecom in northern europe; other main customers are medical and research laboratories in the nordic region.
Addtech’s sales to manufacturers – oem customers – com-prise the components and solutions used in the products that industry customers produce, often for the global market. the Group offers for example products for special vehicles or pro-duction machines for customers, with whom Addtech often work closely on the conceptual and product development. the results are incorporated into an end product and sold under multi-year supply contracts.
industrial and service companies are themselves end cus-tomers in the end user segment. here Addtech provide so-lutions that improve clients’ manufacturing processes. equip-ment, consumables and high standards of service are prime considerations in this area.
no single customer accounts for more than 3 percent of to-tal revenue, despite the fact that Addtech in many cases work on parallel – yet independent –projects for the same client. the 10 largest customers account for just over 10 percent of Addtech Group revenue.
SUPPLIERS AS PARTNERS
trading of components and sub-systems manufactured by glo-bal and market-leading suppliers accounts for some 75 per-cent of Addtech’s annual revenue. the Group has long-stand-ing and close relationships with these suppliers, and these links act as a source of valuable expertise in technology devel-opment, applications and products.
strong suppliers make Addtech an attractive and competi-tive partner. At the same time, technology trading companies are a cost-effective sales and marketing channel for suppliers on account of their local market knowledge, solid customer relationships, broad application expertise and understanding of how customers use the products.
Addtech subsidiaries work closely with a large number of carefully selected suppliers. more than 70 percent of Group purchasing is from non-nordic suppliers in europe, the united states and Asia. no single supplier accounts for more than 3 percent of total Group purchasing, which limits our reliance on individual suppliers.
COMPETITORS AND COMPETITION
the technology trading market is fiercely competitive when it comes to standard components. competition lessens as the amount of value-added in the component, solution or sub-sys-tem increases. lower levels of competition can also apply to low-volume products or where established processes and cus-tomer relationships are an important factor in the transaction.
Addtech’s 80 or so subsidiaries face widely varying degrees of competition and it is not possible to name any specific main competitor, because each unit operates in a unique market with high levels of specialisation. competitors include businesses with independent agency companies; technology trading firms like Addtech, such as indutrade, oem and elektronikgruppen; and suppliers that sell directly to the nordic market.
Increased market concentrationmany small technology trading businesses (known as agency companies) operate in the nordic region. however, the trend is towards increased concentration as large technology trading enterprises acquire these smaller, often family-owned, agency companies. the larger players are gaining market share due to their financial resources, strong marketing organisations and professional management – attributes that make them more competitive and profitable. this restructuring of the technol-ogy trading market is expected to continue as many agency companies are on the verge of generational shifts.
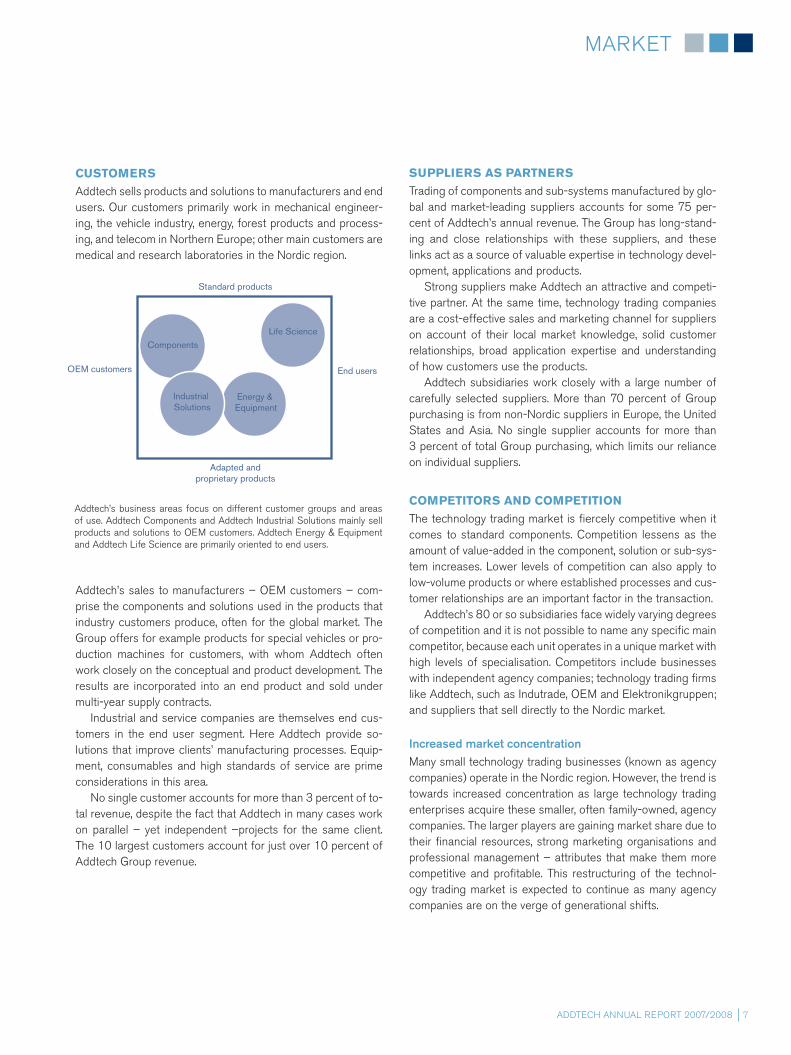
Addtech’s business areas focus on different customer groups and areas of use. Addtech components and Addtech industrial solutions mainly sell products and solutions to oem customers. Addtech energy & equipment and Addtech life science are primarily oriented to end users.
OEM customersSmall
volumeEnd users
Largevolume
AddtechTransmission
AddtechEquipment
AddtechLife Science
AddtechComponents
Life Science
Energy & Equipment
Components
Industrial Solutions
End users
Adapted and proprietary products
OEM customers
Standard products

Addtech AnnuAl RepoRt 2007/20088
mARKet-leAdinG positions
One of Addtech’s main strategies is to be a market leader in clearly defined niches. This entails every subsidiary always working towards being number one or number two in its chosen niche. Being a market leader is crucial to achieving sustainable growth and profitability.
CAREFULLY CHOSEN NICHES
Addtech continually evaluates all markets, product areas and customer segments to ensure its current or future market leadership. At product level, we recognise and encourage suc-cess that is consistent with the Group’s business concept and business model. narrower margins may sometimes result in subsidiaries withdrawing from deals or markets that do not of-fer sufficient profitability.
We operate in niches with high technology and knowledge content and often with low or medium trading volumes. this means that the customer is focused on a limited market or that Addtech’s service content or product quality are considered more important than product cost. customers must also be prepared to pay for the value added that we provide.
PROPRIETARY NICHE PRODUCTION
Around 15 percent of Addtech Group revenue is from proprietary production. producing our own niche products is es-sential for meeting customer demands and for effective adaptation of standard components to cus-tomer specifications. it is also crucial for producing prototypes and/or entire sub-systems.
manufacturing products or systems with proprietary design is a line of business that has evolved from Addtech’s success-ful development of sub-systems that over time have attained market-leading positions, for their own account under their own brand.
MARKET-LEADING SUPPLIERS
close contacts and a day-to-day exchange of skills with mar-ket-leading suppliers are another success factor that helps Addtech companies retain or attain market leadership. A sup-plier’s specialist skills and expertise are a key ingredient in what Addtech offers end customers. the stronger our suppli-ers, the better our product offering.
QUALITY
Quality plays a central role in our business activities and prod-uct offering and is critical in terms of attaining market-leading positions. it is a core element in what we offer, and we work constantly to ensure that our employees, products and proc-
esses deliver high quality. procedures in all areas – from purchasing and inventory management to product delivery – are con-tinuously improved to ensure that we create high-quality products and services. Group companies conform to the qual-ity standards applicable in their respective sectors. these standards are generally very
high in knowledge-intensive and technology-intensive indus-tries and in Addtech’s markets. several Addtech subsidiaries have environmental and/or quality certification. environmental certification is in accordance with iso 14001 or emAs (eco-management and Audit scheme) and quality certification is for example according to iso 9001. certification places high demands on rigorous operating systems and procedures and customers often require that our suppliers are iso-certified.
“adding value for both customers and suppliers”
Addtech subsidiaries operate in clearly defined niches in the technology trad-ing market, serving clients in the industrial and service sectors. the diagram shows one example of a defined market niche.
Technologycomponent
tradingmarket
Off-roadvehicles
Optionalequipment
Vehiclecomponents

Addtech AnnuAl RepoRt 2007/2008 9
oRGAnisAtion And opeRAtinG moBilitY
Addtech
Energy & Equipment Industrial Solutions Life ScienceComponents Business area
OPERATING MOBILITY – STRATEGIES AND SUCCESS FACTORS
Addtech aims to ensure operating mobility and a positive atti-tude to change among all employees and throughout the organ-isation and our business processes. this serves as a strategy and key success factor to help us achieve our goal of profitable growth.
operating mobility means that Addtech is unafraid of or-ganisational change. the Group sees changes in the organisa-tional structure as a powerful tool for achieving its full growth and earnings potential across the various business units, sub-sidiaries and product areas. in practical terms, it involves a con-stant process of creating the optimal organisational structure by merging or demerging within the Group businesses, either in whole or in part.
DECENTRALISED FREEDOM WITH RESPONSIBILITY
the Addtech Group consists of some 80 wholly owned operat-ing subsidiaries within a decentralised structure. subsidiaries operate with extensive freedom with responsibility. independ-ence is fundamental for retaining and recruiting business-minded people but must not be so extensive as to prevent the Group from exploiting the crossover in skills and knowledge between subsidiaries in the same market or technology area.
ORGANISATIONAL STRUCTURE FOR CONTINUED PROFITABLE GROWTH
Focus on business unitsBased on Addtech’s overall strategies and success factors, the Group restructured the organisation at the start of the 2008/2009 financial year to establish an improved platform for continued profitable growth.
subsidiaries with a similar customer base and/or prod-ucts and solutions were merged into business units within the four business areas. companies in the same business unit benefit from being part of a group of affiliated compa-nies with a shared vision and similar strategies, customers, products or solutions.
the new structure will provide added focus in the Group’s parts e.g. the business units and with that for the Group as a whole. this will pave the way for profitable growth, both in existing businesses and via acquisitions.
each business unit has a manager who often doubles as managing director of one of the constituent companies. the new structure offers extended internal career opportunities and will enhance the Group’s ability to retain and attract tal-ented people with entrepreneurial skills.
Within Addtech’s four business areas the subsidiaries are organised in busi-ness units linked to overall technology or market segments. the decentralised organisational model is dynamic and always ready to accept new companies that contribute to growth and development.
Operating mobility is an important Addtech strategy and a key success fac-tor. The business structure changes continuously as part of the Group’s drive to achieve profitable growth. The organisational changes introduced in spring 2008 were a natural step forward in sharpening the focus of Addtech sub-sidiaries on niche business.
Addtech AnnuAl RepoRt 2007/200810
Partial restructuring of business areasthe Group will continue to report performance based on four business areas, but in a couple of cases names have been changed to better reflect the nature of the business. Addtech’s business areas are now components, energy & equipment, industrial solutions and life science.
components and industrial solutions are the two business areas that have seen the greatest changes as a result of the reorganisation, with some subsidiaries having been moved to industrial solutions and others integrated with components.
components has been divided into country oriented business units: denmark, Finland, norway and sweden. the country oriented organisational structure reflects the fact that components’ agency companies are mostly country-based.
Positive change at all levelsthe organisational changes will lead to greater focus and higher efficiency in all parts of the Group. they create clearer lines of responsibility between Group management and the busi-ness area and business unit managements. they also provide for more effective management of subsidiaries at business unit level, bringing them closer to customers and suppliers.
The principal advantages at company level are:• Moreeffectivemanagementatbusinessunitlevelofplan-
ning, decision-making and monitoring of strategies, targets, growth and profitability.
• Increasedscopefororganicgrowthbasedoninternalcross-over of knowledge and expertise.
• Ability todevelopcooperationwith fellowsubsidiaries in thesame business unit, creating synergies without compromising the independence of the individual subsidiaries.
The reorganisation also has benefits for employees:• Extendedopportunitiesforcommittedpeoplewithbusiness
skills to develop within the Group.
• Greaterincentivesforentrepreneurstoselltheirbusinessesto Addtech and remain in charge as part of a larger but fo-cused business unit.
For Addtech as a whole, the focus on the organisation e.g. business units increases the Group’s ability to achieve profit-able growth through the mechanisms mentioned above and because we expect the new organisation to promote the emergence of new business units.
GOVERNANCE
each subsidiary is managed by a managing director who has responsibility for developing the company’s business within the financial frameworks that apply across the Group. subsidiaries are grouped in business units headed by managers who report to the Business Area managers. Business unit managers often also hold the position of subsidiary managing director, while a Business Area manager may also be in charge of a business unit. this structure ensures close contact with the operating side of the business.
Addtech’s key financial ratio is p/Wc. this stands for op-erating profit divided by working capital and is how Addtech measures profitability. As well as a measure of profitability, p/Wc may also be used as a barometer of performance at prod-uct, customer or market level.
At Addtech there is a healthy spirit of internal competi-tion among business units and subsidiaries. Addtech also benchmark performance between the Group’s various sub-sidiaries and business units. Business area and business unit managements are closely involved and play an active role at board level and in operational discussions.
THE COUNTRY-BASED ORGANISATIONAL MODEL WAS CHOSEN BECAUSE
COMPONENTS’ AGENCY COMPANIES ARE OFTEN BASED IN EACH INDIVIDUAL
COUNTRY.
Addtech AnnuAl RepoRt 2007/2008 11
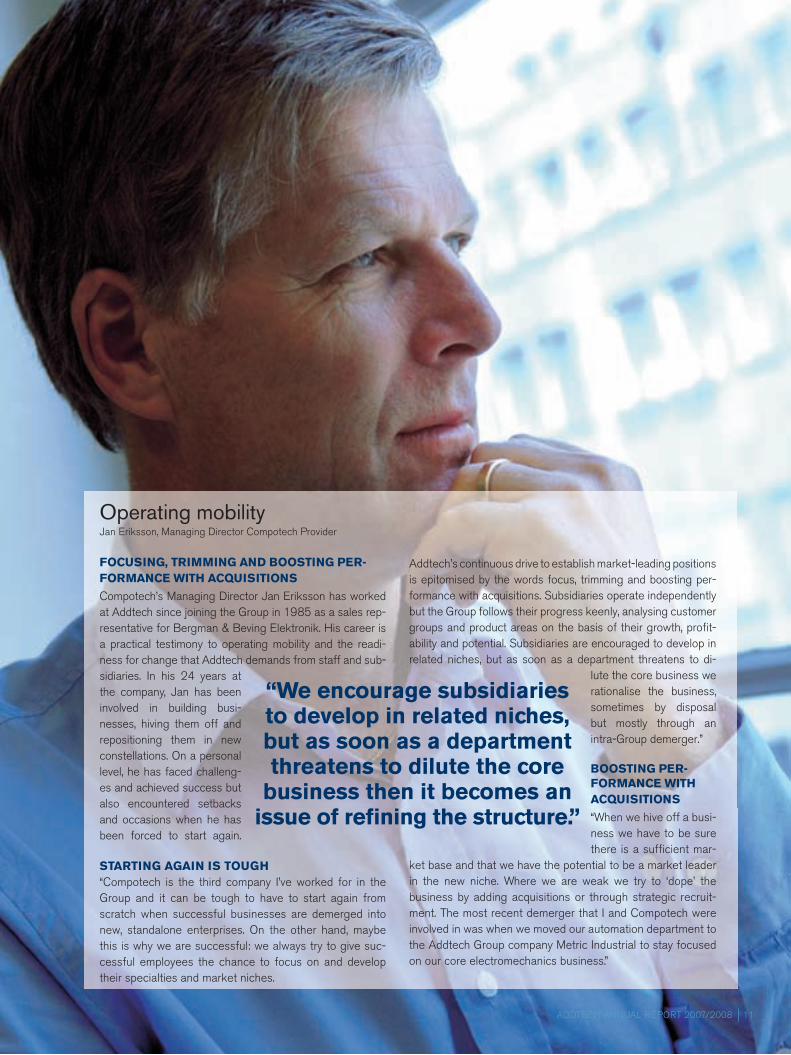
Addtech’s continuous drive to establish market-leading positions is epitomised by the words focus, trimming and boosting per-formance with acquisitions. subsidiaries operate independently but the Group follows their progress keenly, analysing customer groups and product areas on the basis of their growth, profi t-ability and potential. subsidiaries are encouraged to develop in related niches, but as soon as a department threatens to di-
lute the core business we rationalise the business, sometimes by disposal but mostly through an intra-Group demerger.”
BOOSTING PER-FORMANCE WITH ACQUISITIONS
“When we hive off a busi-ness we have to be sure there is a suffi cient mar-
ket base and that we have the potential to be a market leader in the new niche. Where we are weak we try to ‘dope’ the business by adding acquisitions or through strategic recruit-ment. the most recent demerger that i and compotech were involved in was when we moved our automation department to the Addtech Group company metric industrial to stay focused on our core electromechanics business.”
Operating mobilityJan eriksson, managing director compotech provider
FOCUSING, TRIMMING AND BOOSTING PER-FORMANCE WITH ACQUISITIONS
compotech’s managing director Jan eriksson has worked at Addtech since joining the Group in 1985 as a sales rep-resentative for Bergman & Beving elektronik. his career is a practical testimony to operating mobility and the readi-ness for change that Addtech demands from staff and sub-sidiaries. in his 24 years at the company, Jan has been involved in building busi-nesses, hiving them off and repositioning them in new constellations. on a personal level, he has faced challeng-es and achieved success but also encountered setbacks and occasions when he has been forced to start again.
STARTING AGAIN IS TOUGH“compotech is the third company i’ve worked for in the Group and it can be tough to have to start again from scratch when successful businesses are demerged into new, standalone enterprises. on the other hand, maybe this is why we are successful: we always try to give suc-cessful employees the chance to focus on and develop their specialties and market niches.
“We encourage subsidiaries to develop in related niches, but as soon as a department threatens to dilute the core
business then it becomes an issue of refi ning the structure.”
Addtech AnnuAl RepoRt 2007/200812
AcQuisitions
Acquisitions are a key strategy for profitable growth. Addtech acquires busi-nesses to strengthen its position in carefully selected and clearly defined nich-es. Our philosophy – freedom with responsibility and a small-scale approach on a large scale – attracts entrepreneurs to sell their businesses to Addtech.
Addtech’s third main strategy for profitable growth involves strengthening existing businesses through small bolt-on acqui-sitions. the Group also seeks to expand and add to its business-es by continuously acquiring companies in new niches where the Group has the potential to be a market leader.
ACQUISITIONS FOR DEVELOPMENT
Addtech acquires companies with a view to keeping and devel-oping them over the long term. A steady stream of new suppliers and companies is important for developing the Group’s business areas/units and market position. For their part, the companies we acquire gain a financially strong, well-established and com-mitted owner with clear performance and profitability targets.
the acquired companies also contribute to Addtech’s con-tinued development as a leading technology trading group by adding their professionalism and enriching the Group’s corpo-rate culture.
Extensive experience of acquisitionsAddtech is highly experienced in acquiring and developing companies, applying a clear and well-established process to identify, monitor and enter dialogue with potential candidates over long periods. When considering acquisitions, the candi-dates are evaluated based on a number of factors such as:
• Do thecompany’sproductsandservicesgeneratesignifi-cant value-added for the customer?
• Doesthecompanyhavestrongrelationshipswithitssuppliers?
• Aresalesmadethroughpersonalcultivationofcustomerre-lationships?
• Dotheservicesandproductshaveahighknowledgeandtechnology content?
• Isthecompanyamarketleader,ordoesithavethepotentialalong with existing Group companies to become one in a clearly defined niche?
• Would the acquisition strengthen Addtech’s platform forgrowth and profitability?
if a company that is well run and profitable meets these crite-ria, it has strong potential to progress as part of the Addtech
Group. When a company is aquired it is expected to contribute to Group profitability in both the short term and the long term and that the business has growth potential. Addtech subsidiar-ies are typically wholly owned.
ATTRACTIVE AND ENTREPRENEURIAL PLACE TO WORK
Amid the competition for acquisitions, Addtech is an attrac-tive owner for entrepreneurial family businesses. the owner encounters a buyer intent on developing the business over the long term while retaining its small-scale character and unique identity. many of the aquired companies feel part of a wider collective once they have been part of the Group for a period and gained access to Addtech’s internal networks.
Acquired companies usually continue under their existing name with like-minded colleagues, an approach that promotes a spirit of entrepreneurship and personal commitment to the busi-ness. Addtech is pleased when the former owner/s and senior managers remain operationally involved post-acquisition as this is beneficial in terms of retaining know-how within the Group and adds genuine entrepreneurs to the Addtech sphere.
Longer acquisition process reduces riskmost Addtech acquisitions are made after a period of contact with the company in question. the acquisition process builds confidence on both sides and minimises any risk of misunder-standing or false expectations.
EXPAND AND DEVELOP GRADUALLY
Addtech’s niche focus is highlighted by the Group’s structure of different business units in each business area. this makes it easier for entrepreneurs interested in selling their companies to Addtech to understand how their businesses – and they themselves – will fit into the Group.
Future acquisitions will primarily be in Addtech’s existing ar-eas of business, enabling the Group to grow in step with market changes. this approach shortens the time it takes the Group to establish a presence in interesting niches that offer growth po-tential. in the longer run, it also promotes the emergence of new business areas. Addtech has completed some 30 acquisitions since being listed on the stock market in 2001.
Vd hAR oRdet
Addtech AnnuAl RepoRt 2007/2008 13
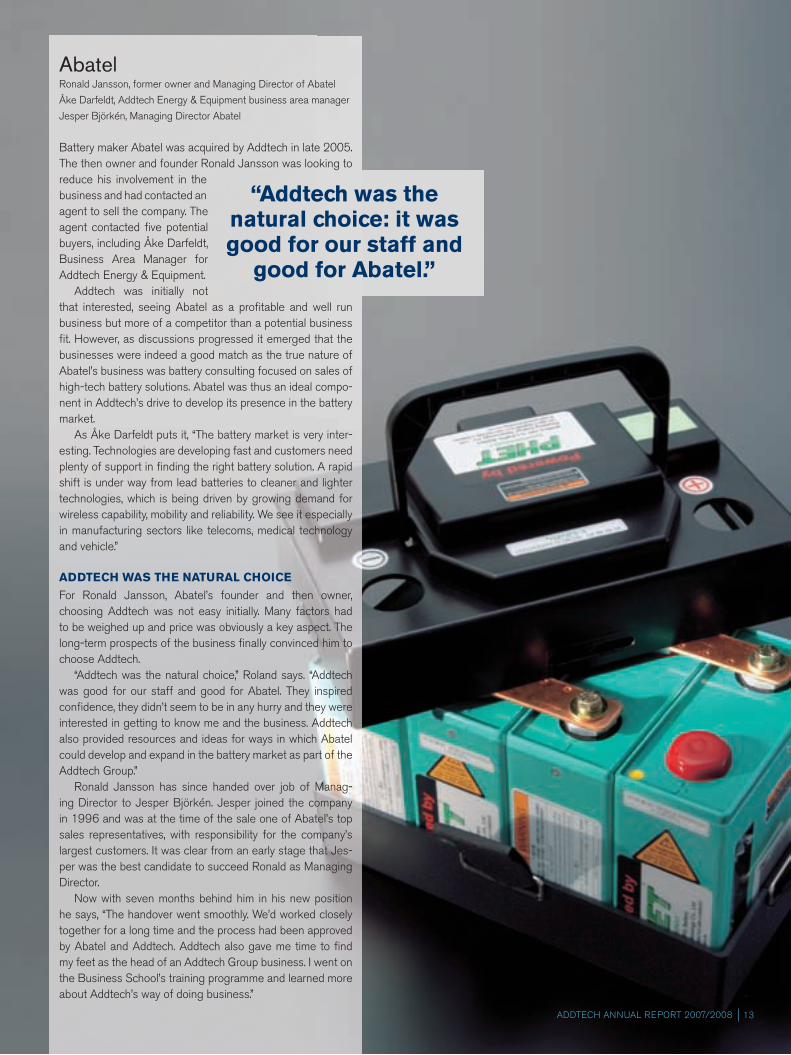
AbatelRonald Jansson, former owner and managing director of Abatel
Åke darfeldt, Addtech energy & equipment business area manager
Jesper Björkén, managing director Abatel
Battery maker Abatel was acquired by Addtech in late 2005. the then owner and founder Ronald Jansson was looking to reduce his involvement in the business and had contacted an agent to sell the company. the agent contacted fi ve potential buyers, including Åke darfeldt, Business Area manager for Addtech energy & equipment.
Addtech was initially not that interested, seeing Abatel as a profi table and well run business but more of a competitor than a potential business fi t. however, as discussions progressed it emerged that the businesses were indeed a good match as the true nature of Abatel’s business was battery consulting focused on sales of high-tech battery solutions. Abatel was thus an ideal compo-nent in Addtech’s drive to develop its presence in the battery market.
As Åke darfeldt puts it, “the battery market is very inter-esting. technologies are developing fast and customers need plenty of support in fi nding the right battery solution. A rapid shift is under way from lead batteries to cleaner and lighter technologies, which is being driven by growing demand for wireless capability, mobility and reliability. We see it especially in manufacturing sectors like telecoms, medical technology and vehicle.”
ADDTECH WAS THE NATURAL CHOICE
For Ronald Jansson, Abatel’s founder and then owner, choosing Addtech was not easy initially. many factors had to be weighed up and price was obviously a key aspect. the long-term prospects of the business fi nally convinced him to choose Addtech.
“Addtech was the natural choice,” Roland says. “Addtech was good for our staff and good for Abatel. they inspired confi dence, they didn’t seem to be in any hurry and they were interested in getting to know me and the business. Addtech also provided resources and ideas for ways in which Abatel could develop and expand in the battery market as part of the Addtech Group.”
Ronald Jansson has since handed over job of manag-ing director to Jesper Björkén. Jesper joined the company in 1996 and was at the time of the sale one of Abatel’s top sales representatives, with responsibility for the company’s largest customers. it was clear from an early stage that Jes-per was the best candidate to succeed Ronald as managing director.
now with seven months behind him in his new position he says, “the handover went smoothly. We’d worked closely together for a long time and the process had been approved by Abatel and Addtech. Addtech also gave me time to fi nd my feet as the head of an Addtech Group business. i went on the Business school’s training programme and learned more about Addtech’s way of doing business.”
“Addtech was the natural choice: it was good for our staff and
good for Abatel.”

Addtech AnnuAl RepoRt 2007/200814
emploYees
BROAD SCOPE FOR DEVELOPMENTAddtech aims to be an attractive employer that offers extensive opportunities for personal growth. Working at Addtech provides many options for combining technology with business while as-suming personal responsibility for projects. the Group’s position as an important player in many niches provides openings for development in many technology areas and the opportunity to work with demanding customers and leading global suppliers.
internal recruitment is Addtech’s most important tool for ensuring a supply of managers. external sourcing of candi-dates takes place alongside internal recruitment. Addtech’s many acquisitions also serve as a prime recruitment source in the form of skilled and highly motivated entrepreneurs who become part of the Group. With the right matching and sup-port, these people can make further progress in the Addtech organisation. most of the Group’s senior managers began their sales careers in one of the subsidiaries.
Business-driven cultureAddtech’s corporate culture and shared core values serve as a source of guidance for employees. the corporate culture is rooted in strong business skills and high levels of technical expertise, combined with individual freedom and a willingness to take personal responsibility.
the attitude and approach of Addtech employees are vital factors when customers and suppliers choose to do business with the group. Addtech’s employees are known for their ability to create innovative solutions that meet customer needs.
Business skills also include an ability to see to the individual company’s long-term profitability and growth based on doing business that brings benefits to all parties.
Decentralisation promotes entrepreneurshipthe Group’s decentralised organisational structure encourag-es high levels of entrepreneurship among Addtech employees. it is important to maintain a small-scale approach on a large scale across the Group.
Addtech subsidiaries have close relationships between man-agement and staff that are rarely possible in larger organisations. the subsidiaries also have close ties with customers and suppli-ers, which makes them more attuned to market demands.
Freedom with responsibility as a driving forceAt Addtech, operating powers and responsibilities rest with the subsidiaries – in close proximity to suppliers and customers – enabling the companies to adapt Addtech’s products and services to customer expectations and market changes. the fact is that freedom with responsibility is one of the Group’s key drivers.
the Group’s dynamic and flexible organisational structure provides a strong platform for Business unit managers and subsidiary managing directors to develop their respective businesses. the price of this freedom is that the parties in-volved must deliver what is required. As the favourable results show, the approach has proved successful.
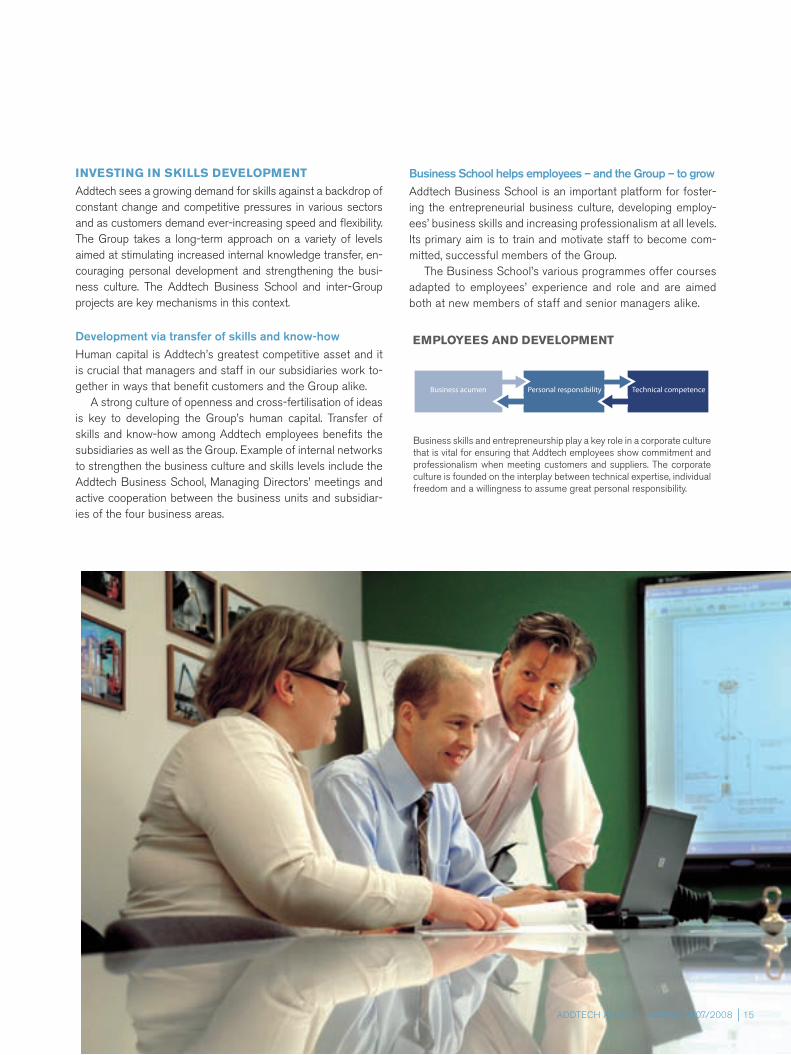
Addtech employees are part of a business-driven and entrepreneurial busi-ness culture with a capacity for developing technically innovative customer solutions. Being close to customers and suppliers enhances their ability to respond to new needs and demands.
Sales 34%
Management 4%
Administration 12%
Production 25%
Technical service,support, design 13%
Warehouse, purchasing 12%
EMPLOYEES
2007/2008 2006/2007 2005/2006
Average number of employees 1,368 1,235 1,198
– male 71% 71% 70%
– female 29% 29% 30%
Age distribution
up to 29 11% 10% 9%
30–49 60% 60% 61%
50 and older 29% 30% 30%
Average age 43 43 43
Personnel turnover
(adjusted for restructuring programmes and disposals)
13% 12% 12%
Average length of employment 10 years 10 years 10 years
WORK CATEGORIES IN THE GROUP
Addtech AnnuAl RepoRt 2007/2008 15
INVESTING IN SKILLS DEVELOPMENT
Addtech sees a growing demand for skills against a backdrop of constant change and competitive pressures in various sectors and as customers demand ever-increasing speed and flexibility. the Group takes a long-term approach on a variety of levels aimed at stimulating increased internal knowledge transfer, en-couraging personal development and strengthening the busi-ness culture. the Addtech Business school and inter-Group projects are key mechanisms in this context.
Development via transfer of skills and know-howhuman capital is Addtech’s greatest competitive asset and it is crucial that managers and staff in our subsidiaries work to-gether in ways that benefit customers and the Group alike.
A strong culture of openness and cross-fertilisation of ideas is key to developing the Group’s human capital. transfer of skills and know-how among Addtech employees benefits the subsidiaries as well as the Group. example of internal networks to strengthen the business culture and skills levels include the Addtech Business school, managing directors’ meetings and active cooperation between the business units and subsidiar-ies of the four business areas.
Business School helps employees – and the Group – to growAddtech Business school is an important platform for foster-ing the entrepreneurial business culture, developing employ-ees’ business skills and increasing professionalism at all levels. its primary aim is to train and motivate staff to become com-mitted, successful members of the Group.
the Business school’s various programmes offer courses adapted to employees’ experience and role and are aimed both at new members of staff and senior managers alike.
Kundanpassade lösningar
Agentur
Teknik och handelTeknik & handel
Teknik & handel
Ledning 3%
Administration 14%
Försäljning 38%
Teknisk service, support, konstruktion 8%
Produktion 23%
Lager, inköp 14%
Teknik och handel
Kundanpassade lösningar
Agentur
Egen produktion
Kundanpassade lösningar
Agentur
Standardprodukter
Kundanpassande lösningar, nischproduktion, tjänster
Återkoppling och förslagtill produktutveckling
Ledning 3%
Administration 14%
Försäljning 38%
Teknisk service, support, konstruktion 8%
Produktion 23%
Lager, inköp 14%
Krav, behov
LeverantörerADDTECH
Kunder
Wandfluh Distributör Scana
Wandfluh Aratron Scana
Addtech
Transmission Equipment Life ScienceComponents Affärsområde
Marknaden för handel med tekniska komponenter
Fordons-komponenter
Terräng-fordon
Tillvals-utrustning
Teknik & handel
Business acumen
Förädlingslänk/ koordinator
Kunder
Samarbete i utvecklingsarbetet
Kundanpassade lösningar
Leverantörer
Nära samarbete och produktutveckling
Produktanpassning
Standardprodukter
Standardprodukter
Technical competencePersonal responsibility
EMPLOYEES AND DEVELOPMENT
Business skills and entrepreneurship play a key role in a corporate culture that is vital for ensuring that Addtech employees show commitment and professionalism when meeting customers and suppliers. the corporate culture is founded on the interplay between technical expertise, individual freedom and a willingness to assume great personal responsibility.
Addtech AnnuAl RepoRt 2007/200816
Business school
FOUR COMPLEMENTARY COURSES
Addtech Business school aims to support managers and em-ployees in their professional and personal development. this is not simply about helping them to be more skilled and effective; it also involves raising their levels of commitment and con-fidence inside and outside the workplace. Addtech Business school teaches four courses:
• Vision and Business philosophy – for all Group employees and especially important for staff in newly acquired sub-sidiaries
• successful sales – for internal and external sales represent-atives with a minimum six months’ experience
• Business skills – for experienced sales representatives with a minimum two years’ experience and who have attended the successful sales course.
• managers at Addtech – for new managers with staff re-sponsibilities and managing directors of newly acquired subsidiaries
the successful sales course increases participants’ under-standing of financial contexts and how to generate profitability. it makes sales representatives more effective by giving them a clearer structure for their work, improved preparations and targets for customer contacts, stronger presentation tech-nique, and extended knowledge of business law and delivery conditions. participation by buyers from client companies adds a hands-on dimension that helps participants to understand important issues in terms of maintaining long-term business relationships.
Business skills is an advanced course for senior sales rep-resentatives in Addtech subsidiaries. it provides practical tools for more focused and profit-driven sales by exerting more effective influence over decision-making. For example, the course includes realistic negotiation training using video cam-eras and business case simulations.
the managers at Addtech course highlights Addtech’s ap-proach to management and leadership. discussions and train-ing in active employee management techniques cover areas such as recruitment, training, development opportunities, at-titudes, follow-up and incentives. the aim is for participants to gain a ‘driver’s licence’ for the manager’s role.
BUSINESS SCHOOL STRENGTHENED
during the year the Business school appointed patrik hahne, formerly managing director of tesch system, part of Addtech industrial solutions, as responsible for the Business school. patrik will drive the Business school forward within the scope of the remit set by Group management and with its support.
SUPPLIERS IMPORTANT FOR KNOWLEDGE TRANSFER
A significant interchange of knowledge takes place between Addtech and the suppliers. Key people at Addtech also regu-larly spend time with suppliers in europe, Asia and the united states. these relationships are important in maintaining high levels of technical expertise in the technology areas where Ad-dtech subsidiaries operate.
During the year the Business School extended its programme to strengthen employees’ skills and understanding of external business conditions as mar-ket complexity and competition grow. The strong international dimension to Addtech’s business operations is a key driver in this regard.
IN CLOSE TOUCH WITH THE MARKET
the Vision and Business philosophy course covers areas such as the business model, profit awareness, business philosophy and ethics. it also addresses the value of having a vision and goals for a company’s future development. seminars enable em-ployees to work together to understand how these concepts af-fect daily operations in each subsidiary and how to apply them.
Vision and Business PhilosophyBASIC TRAINING FOR ALL EMPLOYEES IN ALL COMPANIES
Successful sales
Business skills
Managers at Addtech

Addtech AnnuAl RepoRt 2007/2008 17
Addtechs Business Schoolpatrik hahne, responsible for the Addtech Business school
TRAINING THAT MEETS EVERYDAY CHALLENGES
patrik hahne, previously managing director of tesch sys-tem AB, part of Addtech industrial solutions, took up a new position within the Group at the start of the year. he is now responsible for the Addtech Business school, a business-critical part of the organisation in which patrik has been involved for the last few years.
the restructuring launched on 1 April 2008 is just one of the factors behind the creation of his new job and the re-modelling of Addtech’s internal training programmes, patrik hahne explains.
“in the last few years we’ve made changes at the Busi-ness school to enable us to be better at meeting the needs of our employees in their everyday work. the business world is getting ever more complex and so is our business – especially when it comes to key aspects like value added. many of our customers are focusing increasingly on their core businesses, which means our companies must be able to offer products and services that these customers need to buy from external partners.”
BOTH OLD AND NEW SKILLS IMPORTANT
one of the Business school’s other primary roles is to make sure that Addtech employees can move quickly enough and adapt to meet the new demands of sup-pliers and customers as the competition in their markets changes.
“our employees have always been good at technology and sales, but we also need to make sure we develop ‘new’ skills fast enough,” patrik says. “the Group is already well positioned in this regard. our 80 subsidiaries operate close to the market and are well acquainted with the progress lines of their customers and suppliers. our employees can adapt quickly to new ways of doing successful business. this is why it is important that the Business school strengthens, trains and develops this competitive advantage further.”
“The Group’s 80 subsidiaries operate close to the market and are well acquainted with
the progress lines of their customers and suppliers.”

Addtech AnnuAl RepoRt 2007/200818
ethics And enViRonment
ETHICAL PRACTICE IS GOOD FOR BUSINESS
the market sets increasingly high ethical and environment standards, making it important to manage the business in the interests of long-term sustainability. Addtech promotes an eth-ical approach based on transparency and accountability. this is reflected primarily at subsidiary level through internal rela-tions among employees and external contacts with customers and suppliers.
Places demands on suppliers and partnersobserving high ethical and environmental standards creates business advantages by strengthening the bond of trust be-tween the Group and its employees, investors and partners.
Addtech works continuously with its business partners to achieve positive change and encourages them to follow the ap-proach outlined in the Addtech "code of conduct".1 the code states that the Group will under no circumstances accept cor-ruption, bribes or other unfair, anti-competitive inducements. All sales and marketing of Group products and services must comply with applicable national laws and regulations. Group companies may not purchase products from suppliers that can-not, on request, provide written assurances that child labour is not permitted in their business and that they provide safe and healthy working conditions for their staff.
Group companies are responsible for ensuring that suppliers and sub-contractors comply with the Addtech’s “code of con-duct”, in areas where Addtech has influence.
Environmental accountabilityAddtech’s environmental policy expresses the Group’s desire to accept its share of responsibility for improving the environ-ment and for helping to achieve sustainable development.2
the principle of environmental awareness and conserva-tion of natural resources is an important consideration for the Group’s business activities. environmental management is within the framework of Addtech’s business concept and is well integrated in the Group’s operating activities.
By drawing on our employees’ skills and continually expand-ing our understanding of environmental impacts, we can
1 the Addtech code of conduct can be downloaded in pdF format from www.addtech.com.2 the Addtech environmental policy can be downloaded in pdF format from www.addtech.com.
achieve a holistic approach to environmental issues. environ-mental measures will be taken as long as they are economi-cally and technically feasible and justifiable on environmental grounds.
Responsibility for day-to-day environmental management rests with each Group subsidiary.
ENVIRONMENTAL MANAGEMENT IN THREE AREAS:
Productsenvironmental aspects are taken into consideration through the entire product cycle – from development and design to purchasing and recycling. it is important that Group subsidiar-ies meet all relevant requirements in their individual sectors. environmental management also gives rise to strategic busi-ness opportunities when subsidiaries create solutions that are environmentally beneficial for the customer’s business. Wind power is one specific area where several Group companies are active in this regard.
Addtech has extensive expertise in the environmental re-quirements applicable to different parts of the business. As a result, subsidiaries can quickly help customers with solutions for meeting new environmental requirements or identifying low environmental impact alternatives when choosing between materials with equivalent properties.
WasteWaste is an issue primarily for Addtech’s manufacturing com-panies, which manage disposal of all waste generated during development as well as recycling waste where possible. some subsidiaries offer products that they are required to take back and dispose of after use. All subsidiaries work to recycle re-turnable packaging and consumables.
Transporttransportation issues concern the entire value chain, from sup-plier to customer. Aspects such as price, delivery time and en-vironmental impact are taken into account when choosing the mode of transport. the overall assessment serves as the basis for the choice of carrier.
Ethical business practices and environmental management are part of Addtech’s business concept and are well integrated in the Group’s operating activities. They are good for business, with transparency and accountability strengthening the bond of trust between the Group and employees, investors and partners.

Addtech AnnuAl RepoRt 2007/2008 19
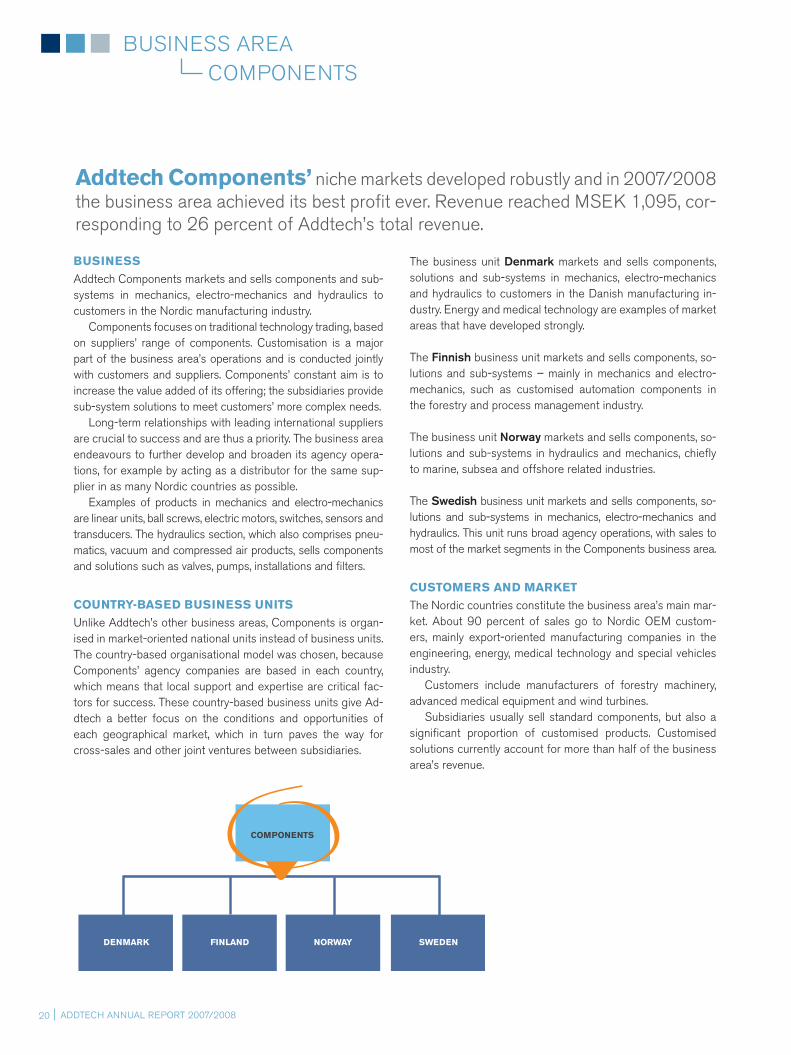
Addtech AnnuAl RepoRt 2007/200820
componentsBusiness AReA
BUSINESS
Addtech components markets and sells components and sub-systems in mechanics, electro-mechanics and hydraulics to customers in the nordic manufacturing industry.
components focuses on traditional technology trading, based on suppliers’ range of components. customisation is a major part of the business area’s operations and is conducted jointly with customers and suppliers. components’ constant aim is to increase the value added of its offering; the subsidiaries provide sub-system solutions to meet customers’ more complex needs.
long-term relationships with leading international suppliers are crucial to success and are thus a priority. the business area endeavours to further develop and broaden its agency opera-tions, for example by acting as a distributor for the same sup-plier in as many nordic countries as possible.
examples of products in mechanics and electro-mechanics are linear units, ball screws, electric motors, switches, sensors and transducers. the hydraulics section, which also comprises pneu-matics, vacuum and compressed air products, sells components and solutions such as valves, pumps, installations and filters.
COUNTRY-BASED BUSINESS UNITS
unlike Addtech’s other business areas, components is organ-ised in market-oriented national units instead of business units. the country-based organisational model was chosen, because components’ agency companies are based in each country, which means that local support and expertise are critical fac-tors for success. these country-based business units give Ad-dtech a better focus on the conditions and opportunities of each geographical market, which in turn paves the way for cross-sales and other joint ventures between subsidiaries.
Addtech Components’ niche markets developed robustly and in 2007/2008 the business area achieved its best profit ever. Revenue reached mseK 1,095, cor-responding to 26 percent of Addtech’s total revenue.
the business unit Denmark markets and sells components, solutions and sub-systems in mechanics, electro-mechanics and hydraulics to customers in the danish manufacturing in-dustry. energy and medical technology are examples of market areas that have developed strongly.
the Finnish business unit markets and sells components, so-lutions and sub-systems – mainly in mechanics and electro-mechanics, such as customised automation components in the forestry and process management industry.
the business unit Norway markets and sells components, so-lutions and sub-systems in hydraulics and mechanics, chiefly to marine, subsea and offshore related industries.
the Swedish business unit markets and sells components, so-lutions and sub-systems in mechanics, electro-mechanics and hydraulics. this unit runs broad agency operations, with sales to most of the market segments in the components business area.
CUSTOMERS AND MARKET
the nordic countries constitute the business area’s main mar-ket. About 90 percent of sales go to nordic oem custom-ers, mainly export-oriented manufacturing companies in the engineering, energy, medical technology and special vehicles industry.
customers include manufacturers of forestry machinery, advanced medical equipment and wind turbines.
subsidiaries usually sell standard components, but also a significant proportion of customised products. customised solutions currently account for more than half of the business area’s revenue.
COMPONENTS
NORWAY SWEDENDENMARK FINLAND

Vd hAR oRdet
Addtech AnnuAl RepoRt 2007/2008 21
Compotech henrik Blennow, sales engineer
FROM ORDER TO PROBLEM-SOLVINGcompotech trades electro-mechanical components and motors and belongs to Addtech’s original core business. compotechhas a strong focus on value-enhancing sales. For henrik Blennow,sales engineer at compotech for the last three years, this means visiting fellow subsidiaries to get to know their busi-nesses and expand his own knowledge. this type of network-ing can be very useful, he explains.
“i received an inquiry from design consultancy hotswap about a small electric motor. the easy response would have been just to send them what they ordered. But i went to see them instead to fi nd out how they planned to use the motor. When i was there i found that the design wasn’t really ready, so we started working together on a variety of potential inte-grated solutions. i realised immediately that there was scope for selling more Addtech products.”
the end customer, norwegian medical technology company laerdal medical, had commissioned hotswap to build an inter-active eye that could show symptoms, for instance by reacting to light and blinking, using a pre-programmed pattern. the eye can be used in laerdal’s patient simulators for medical train-ing, which in turn are used to diagnose medical conditions and trauma, including epilepsy.
BENEFITS OF SEEING THE BIG PICTURE
After meeting hotswap, henrik suggested that compotech should deliver the entire eye. Another few meetings were held, after which it was agreed that Addtech would supply two motors with adapted axles and an aperture from Addtech subsidiary tekno optik. henrik won the assignment because the fi nal de-sign of the eye was closer to a human eye and was capable of being used in laer-dal’s patient simulators.
“Because i knew the specialist areas of other Addtech companies i was lucky enough to be able to put together a much better solution – both for the customer and for Addtech. the laerdal patient simulator shows it can really be worth getting to grips with the customer’s problems and seeing the big picture, and that the expertise we have in the Addtech network is a very valuable resource.”
“Because I knew the specialist areas of other Addtech com-panies, I was lucky enough to
be able to put together a much better solution – both for the customer and for Addtech.”
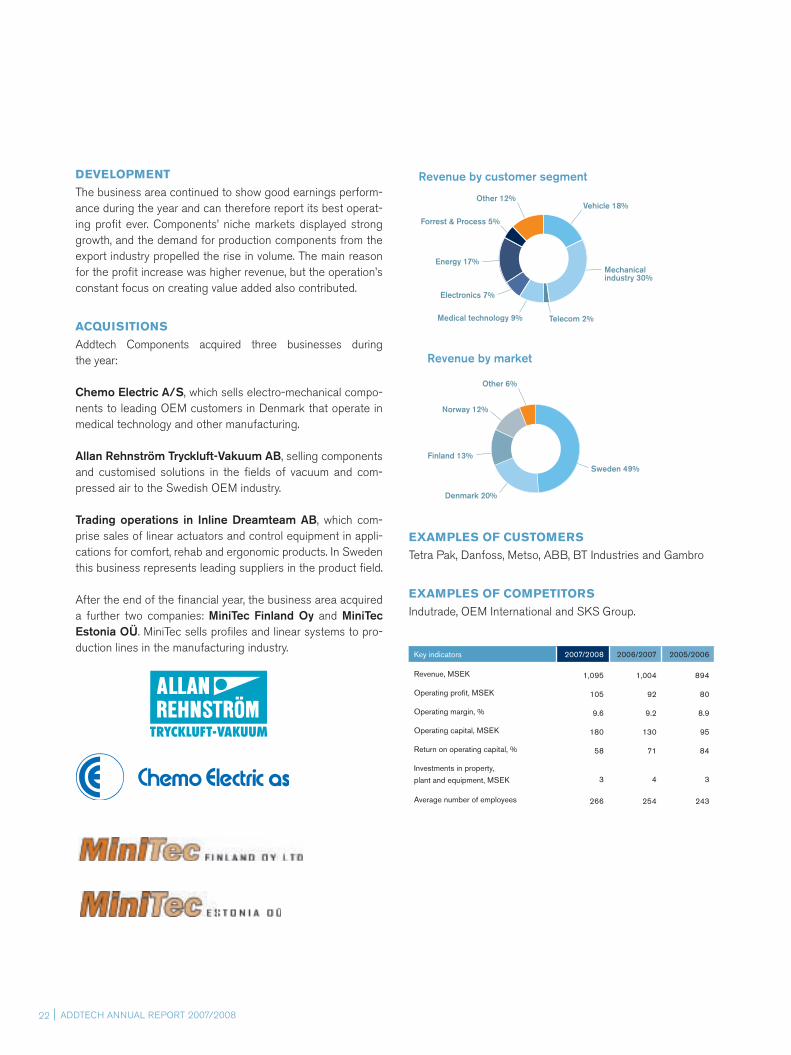
Addtech AnnuAl RepoRt 2007/200822
DEVELOPMENT
the business area continued to show good earnings perform-ance during the year and can therefore report its best operat-ing profit ever. components’ niche markets displayed strong growth, and the demand for production components from the export industry propelled the rise in volume. the main reason for the profit increase was higher revenue, but the operation’s constant focus on creating value added also contributed.
ACQUISITIONS
Addtech components acquired three businesses during the year:
Chemo Electric A/S, which sells electro-mechanical compo-nents to leading oem customers in denmark that operate in medical technology and other manufacturing.
Allan Rehnström Tryckluft-Vakuum AB, selling components and customised solutions in the fields of vacuum and com-pressed air to the swedish oem industry.
Trading operations in Inline Dreamteam AB, which com-prise sales of linear actuators and control equipment in appli-cations for comfort, rehab and ergonomic products. in sweden this business represents leading suppliers in the product field.
After the end of the financial year, the business area acquired a further two companies: MiniTec Finland Oy and MiniTec Estonia OÜ. minitec sells profiles and linear systems to pro-duction lines in the manufacturing industry.
Revenue by customer segment
Other 12%
Forrest & Process 5%
Energy 17%
Electronics 7%
Medical technology 9% Telecom 2%
Mechanical industry 30%
Vehicle 18%
Revenue by market
Other 6%
Norway 12%
Finland 13%
Denmark 20%
Sweden 49%
Key indicators 2007/2008 2006/2007 2005/2006
Revenue, MSEK 1,095 1,004 894
Operating profit, MSEK 105 92 80
Operating margin, % 9.6 9.2 8.9
Operating capital, MSEK 180 130 95
Return on operating capital, % 58 71 84
Investments in property,
plant and equipment, MSEK 3 4 3
Average number of employees 266 254 243
EXAMPLES OF CUSTOMERS
tetra pak, danfoss, metso, ABB, Bt industries and Gambro
EXAMPLES OF COMPETITORS
indutrade, oem international and sKs Group.

Vd hAR oRdet
“The advantage of our approach is that we identify and design creative solutions.”
Movetecmarkku suominen, managing director
TECHNICAL CONSULTANTS AND SALES PEOPLE
the Finnish company movetec customises and sells complete solutions for operation and control of electronic motors and mechanical components. it is a thriving business with a number of leading oem customers, including laserplus, a maker of laser cutting equipment as the one on the picture above.
“We have been able to grow due to hard work by our skilled and dedicated staff, and by adding new technologies, products and customers,” says movetec managing director and founder markku suominen. “Quality at the delivery point and in our products is a key concept for us and movetec has a good reputation in the industry. there’s a spirit of teamwork here that shows through when we look after customers and help them meet their challenges. We operate both as consultant and seller, with a strong emphasis on helping to fi nd solutions to customers’ problems.”
movetec has its own mechanics workshop where it custom-ises and works on components for use in customer-specifi c solutions. proximity to the workshop is crucial and adds value for customers.
“the advantage of our approach is that we identify and design creative solutions,” markku says. “once we’ve ‘sold’ the solu-tion to an industrial customer we may continue delivering it until production of the next generation starts. in the meantime, our sales representatives consult with the customer’s develop-ment department designing the next-generation solution.”
SYNERGIES ON OFFER
markku was recently appointed Business unit manager for Finland and given the job of developing the Finnish side of
the components business. Although the organisational structure is in its infancy, he can already see potential synergies.
“Addtech components’ Finnish subsidiaries sometimes have the same customers but we rarely com-pete against each other. i’m sure the
synergies will come if we increase the level of knowledge transfer. having a shared vision makes it easier to focus on the right markets and to see how best to strengthen the busi-ness through acquisitions.”
markku adds, “We see growth as an interesting challenge for the business unit.”
Addtech AnnuAl RepoRt 2007/2008 23
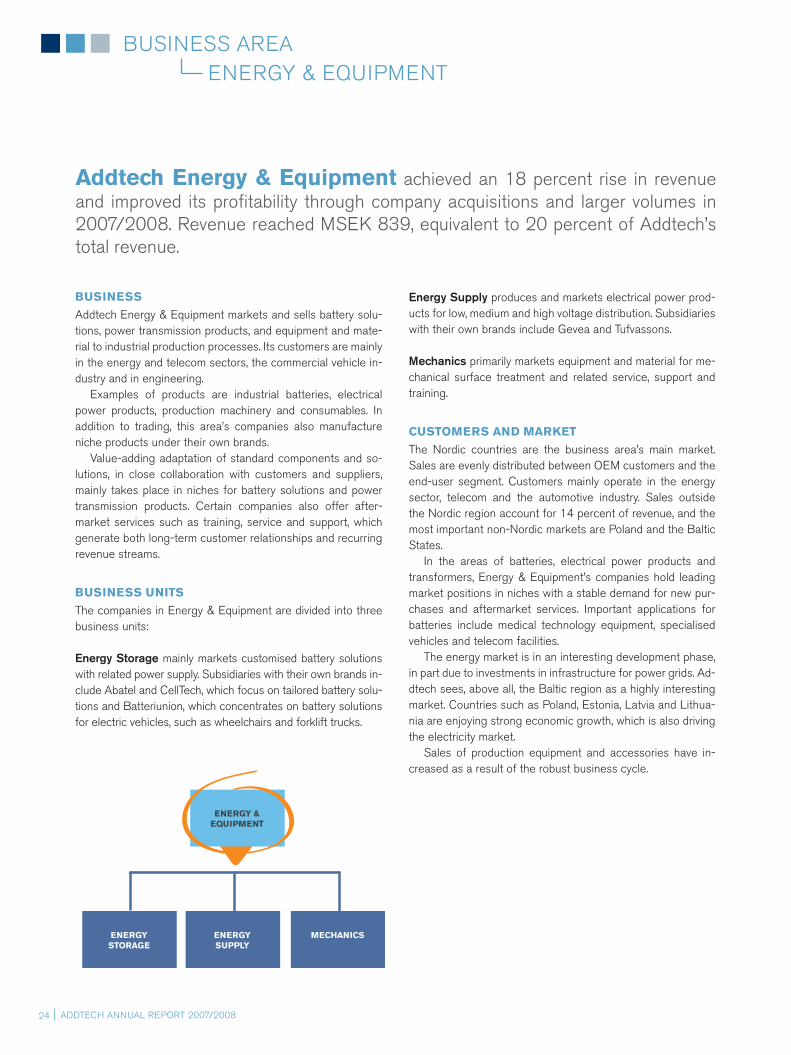
Addtech AnnuAl RepoRt 2007/200824
eneRGY & eQuipmentBusiness AReA
BUSINESS
Addtech energy & equipment markets and sells battery solu-tions, power transmission products, and equipment and mate-rial to industrial production processes. its customers are mainly in the energy and telecom sectors, the commercial vehicle in-dustry and in engineering.
examples of products are industrial batteries, electrical power products, production machinery and consumables. in addition to trading, this area’s companies also manufacture niche products under their own brands.
Value-adding adaptation of standard components and so-lutions, in close collaboration with customers and suppliers, mainly takes place in niches for battery solutions and power transmission products. certain companies also offer after-market services such as training, service and support, which generate both long-term customer relationships and recurring revenue streams.
BUSINESS UNITS
the companies in energy & equipment are divided into three business units:
Energy Storage mainly markets customised battery solutions with related power supply. subsidiaries with their own brands in-clude Abatel and celltech, which focus on tailored battery solu-tions and Batteriunion, which concentrates on battery solutions for electric vehicles, such as wheelchairs and forklift trucks.
Addtech Energy & Equipment achieved an 18 percent rise in revenue and improved its profitability through company acquisitions and larger volumes in 2007/2008. Revenue reached mseK 839, equivalent to 20 percent of Addtech’s total revenue.
Energy Supply produces and markets electrical power prod-ucts for low, medium and high voltage distribution. subsidiaries with their own brands include Gevea and tufvassons.
Mechanics primarily markets equipment and material for me-chanical surface treatment and related service, support and training.
CUSTOMERS AND MARKET
the nordic countries are the business area’s main market. sales are evenly distributed between oem customers and the end-user segment. customers mainly operate in the energy sector, telecom and the automotive industry. sales outside the nordic region account for 14 percent of revenue, and the most important non-nordic markets are poland and the Baltic states.
in the areas of batteries, electrical power products and transformers, energy & equipment’s companies hold leading market positions in niches with a stable demand for new pur-chases and aftermarket services. important applications for batteries include medical technology equipment, specialised vehicles and telecom facilities.
the energy market is in an interesting development phase, in part due to investments in infrastructure for power grids. Ad-dtech sees, above all, the Baltic region as a highly interesting market. countries such as poland, estonia, latvia and lithua-nia are enjoying strong economic growth, which is also driving the electricity market.
sales of production equipment and accessories have in-creased as a result of the robust business cycle.
ENERGY &EQUIPMENT
MECHANICSENERGY SUPPLY
ENERGY STORAGE
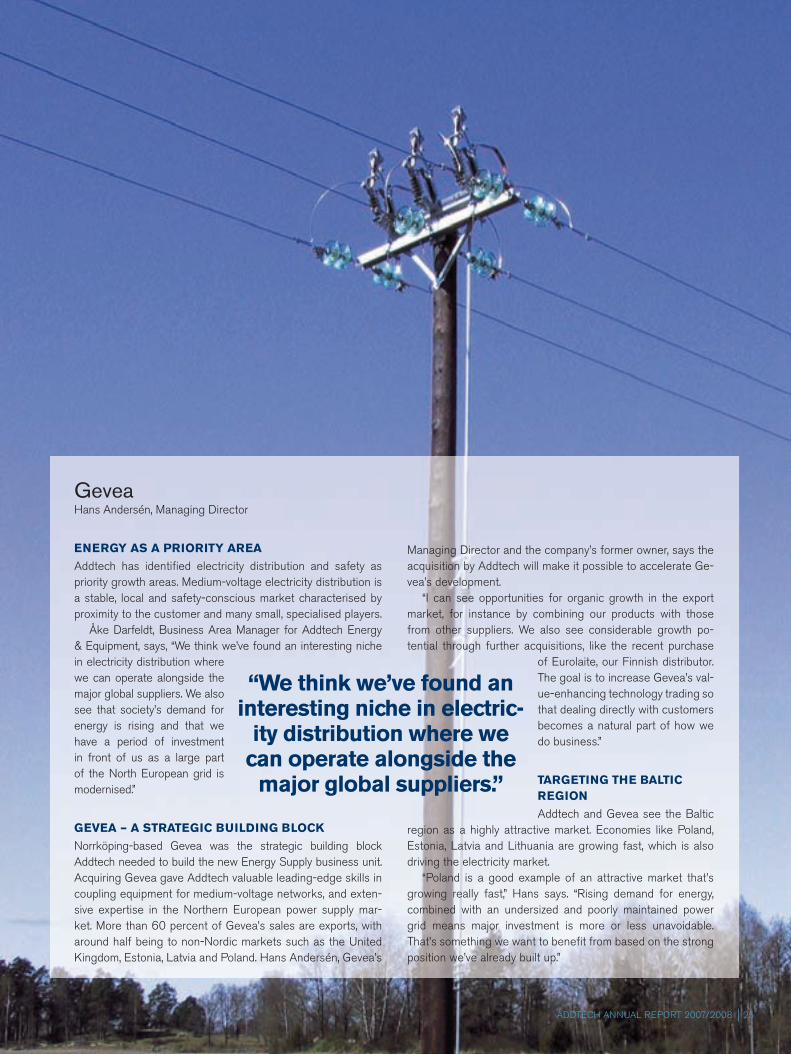
Vd hAR oRdet
Addtech AnnuAl RepoRt 2007/2008 25
Geveahans Andersén, managing director
ENERGY AS A PRIORITY AREA
Addtech has identifi ed electricity distribution and safety as priority growth areas. medium-voltage electricity distribution is a stable, local and safety-conscious market characterised by proximity to the customer and many small, specialised players.
Åke darfeldt, Business Area manager for Addtech energy & equipment, says, “We think we’ve found an interesting niche in electricity distribution where we can operate alongside the major global suppliers. We also see that society’s demand for energy is rising and that we have a period of investment in front of us as a large part of the north european grid is modernised.”
GEVEA – A STRATEGIC BUILDING BLOCK
norrköping-based Gevea was the strategic building block Addtech needed to build the new energy supply business unit. Acquiring Gevea gave Addtech valuable leading-edge skills in coupling equipment for medium-voltage networks, and exten-sive expertise in the northern european power supply mar-ket. more than 60 percent of Gevea’s sales are exports, with around half being to non-nordic markets such as the united Kingdom, estonia, latvia and poland. hans Andersén, Gevea’s
managing director and the company’s former owner, says the acquisition by Addtech will make it possible to accelerate Ge-vea’s development.
“i can see opportunities for organic growth in the export market, for instance by combining our products with those from other suppliers. We also see considerable growth po-tential through further acquisitions, like the recent purchase
of eurolaite, our Finnish distributor. the goal is to increase Gevea’s val-ue-enhancing technology trading so that dealing directly with customers becomes a natural part of how we do business.”
TARGETING THE BALTIC REGION
Addtech and Gevea see the Baltic region as a highly attractive market. economies like poland, estonia, latvia and lithuania are growing fast, which is also driving the electricity market.
“poland is a good example of an attractive market that’s growing really fast,” hans says. “Rising demand for energy, combined with an undersized and poorly maintained power grid means major investment is more or less unavoidable. that’s something we want to benefi t from based on the strong position we’ve already built up.”
“We think we’ve found an interesting niche in electric-
ity distribution where we can operate alongside the
major global suppliers.”
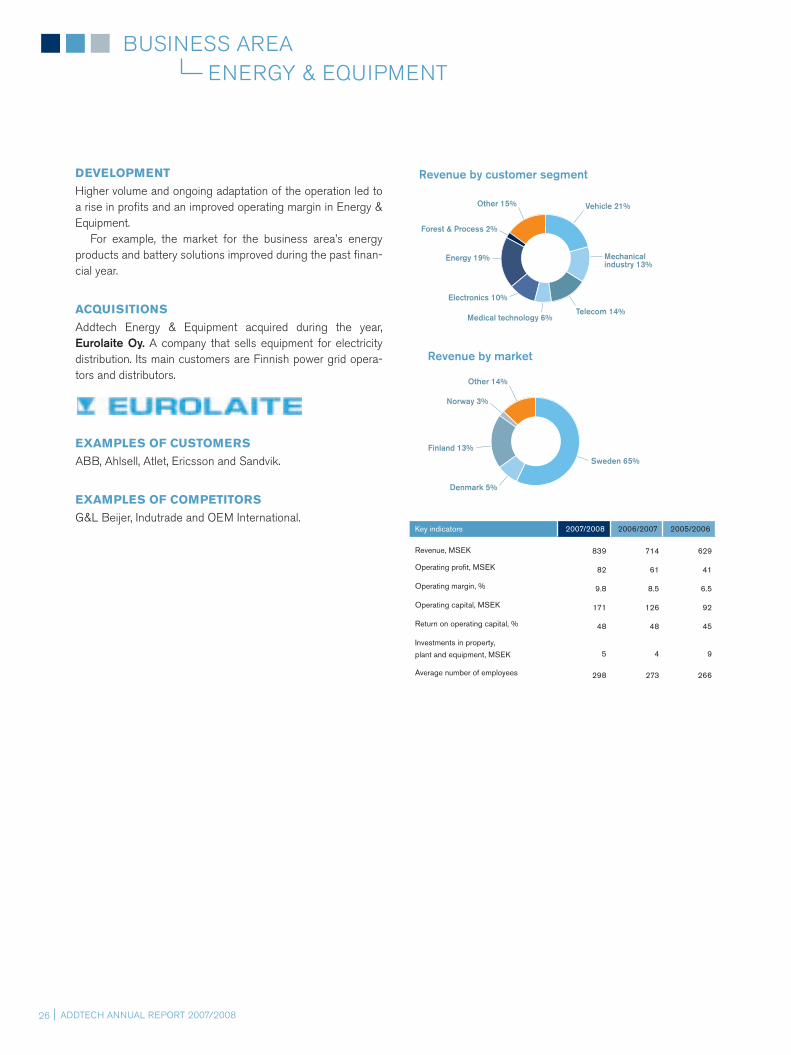
Addtech AnnuAl RepoRt 2007/200826
eneRGY & eQuipmentBusiness AReA
Revenue by customer segment
Other 15%
Forest & Process 2%
Energy 19%
Electronics 10%
Medical technology 6%Telecom 14%
Mechanical industry 13%
Vehicle 21%
Revenue by market
Other 14%
Norway 3%
Finland 13%
Denmark 5%
Sweden 65%
Key indicators 2007/2008 2006/2007 2005/2006
Revenue, MSEK 839 714 629
Operating profit, MSEK 82 61 41
Operating margin, % 9.8 8.5 6.5
Operating capital, MSEK 171 126 92
Return on operating capital, % 48 48 45
Investments in property,
plant and equipment, MSEK 5 4 9
Average number of employees 298 273 266
DEVELOPMENT
higher volume and ongoing adaptation of the operation led to a rise in profits and an improved operating margin in energy & equipment.
For example, the market for the business area’s energy products and battery solutions improved during the past finan-cial year.
ACQUISITIONS
Addtech energy & equipment acquired during the year, Eurolaite Oy. A company that sells equipment for electricity distribution. its main customers are Finnish power grid opera-tors and distributors.
EXAMPLES OF CUSTOMERS
ABB, Ahlsell, Atlet, ericsson and sandvik.
EXAMPLES OF COMPETITORS
G&l Beijer, indutrade and oem international.
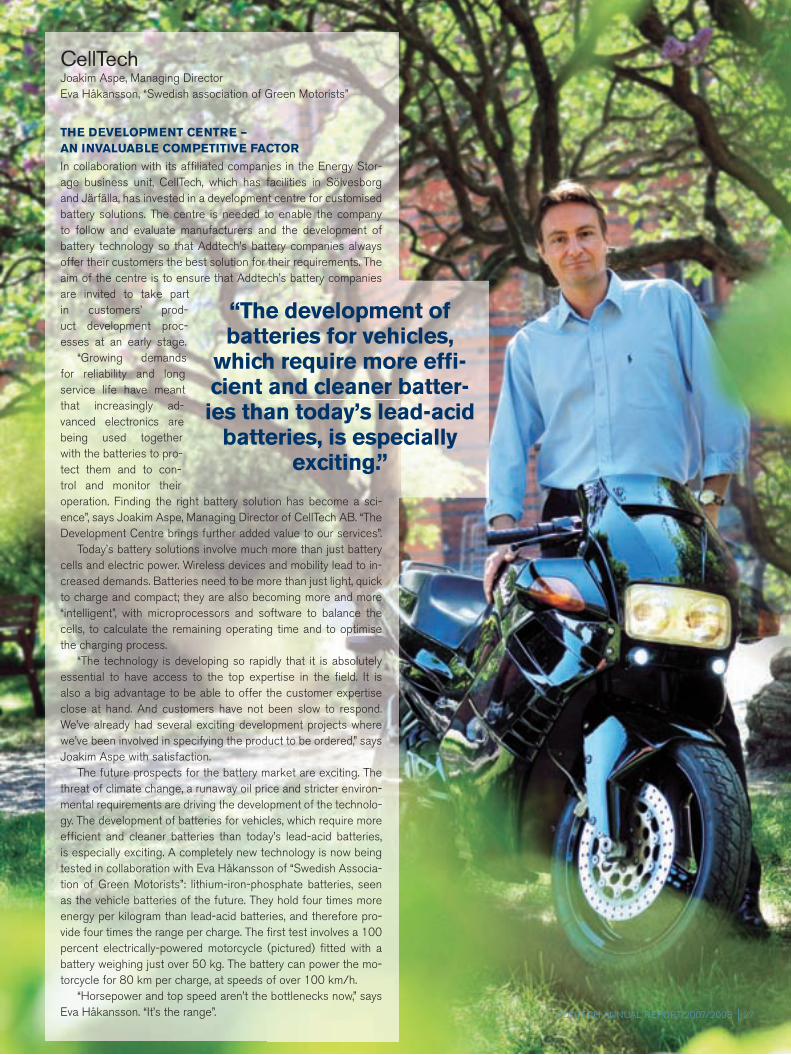
Addtech AnnuAl RepoRt 2007/2008 27
CellTechJoakim Aspe, managing directoreva håkansson, “swedish association of Green motorists”
THE DEVELOPMENT CENTRE – AN INVALUABLE COMPETITIVE FACTOR
in collaboration with its affi liated companies in the energy stor-age business unit, celltech, which has facilities in sölvesborg and Järfälla, has invested in a development centre for customised battery solutions. the centre is needed to enable the company to follow and evaluate manufacturers and the development of battery technology so that Addtech’s battery companies always offer their customers the best solution for their requirements. the aim of the centre is to ensure that Addtech’s battery companies are invited to take part in customers’ prod-uct development proc-esses at an early stage. “Growing demands for reliability and long service life have meant that increasingly ad-vanced electronics are being used together with the batteries to pro-tect them and to con-trol and monitor their operation. Finding the right battery solution has become a sci-ence”, says Joakim Aspe, managing director of celltech AB. “the development centre brings further added value to our services”. today’s battery solutions involve much more than just battery cells and electric power. Wireless devices and mobility lead to in-creased demands. Batteries need to be more than just light, quick to charge and compact; they are also becoming more and more “intelligent”, with microprocessors and software to balance the cells, to calculate the remaining operating time and to optimise the charging process. “the technology is developing so rapidly that it is absolutely essential to have access to the top expertise in the fi eld. it is also a big advantage to be able to offer the customer expertise close at hand. And customers have not been slow to respond. We’ve already had several exciting development projects where we’ve been involved in specifying the product to be ordered,” says Joakim Aspe with satisfaction. the future prospects for the battery market are exciting. the threat of climate change, a runaway oil price and stricter environ-mental requirements are driving the development of the technolo-gy. the development of batteries for vehicles, which require more effi cient and cleaner batteries than today’s lead-acid batteries, is especially exciting. A completely new technology is now being tested in collaboration with eva håkansson of “swedish Associa-tion of Green motorists”: lithium-iron-phosphate batteries, seen as the vehicle batteries of the future. they hold four times more energy per kilogram than lead-acid batteries, and therefore pro-vide four times the range per charge. the fi rst test involves a 100 percent electrically-powered motorcycle (pictured) fi tted with a battery weighing just over 50 kg. the battery can power the mo-torcycle for 80 km per charge, at speeds of over 100 km/h. “horsepower and top speed aren’t the bottlenecks now,” says eva håkansson. “it’s the range”.
“The development of batteries for vehicles,
which require more effi -cient and cleaner batter-ies than today’s lead-acid
batteries, is especially exciting.”

Addtech AnnuAl RepoRt 2007/200828
industRiAl solutionsBusiness AReA
BUSINESS
Addtech industrial solutions is the Group’s business area with the highest proportion of sales that comprise products devel-oped and manufactured in house – often marketed under own brands. the business area includes several companies that are very advanced in their creation of value that is both knowledge and technology intensive. industrial solutions thus trades in suppliers’ components and sub-systems as well as in in-house products and brands.
the companies in this business area conduct extensive marketing of their products and solutions internationally. the area’s offering includes gaskets, seals, vibration dampers, chains, electric motors, gear units, power and signal transmis-sion components, automation components, and measuring and testing systems.
BUSINESS UNITS
the companies in industrial solutions are divided into four business units.
Customised Solutions offers tailored solutions in electro-mechanical applications as well as products and solutions for power and signal transmission. items include hmi/mmi prod-ucts, such as joysticks and pedals for forest machinery and forklift trucks, and connecting devices and cabling for telecom. the companies in customised solutions market their products and solutions internationally.
Addtech Industrial Solutions developed well and reinforced its positions in each market niche in 2007/2008. Revenue in the business area totalled mseK 1,525, equivalent to 36 percent of Addtech’s revenue.
MI Group sells productivity-increasing automation compo-nents and electronic materials and testing systems to indus-trial manufacturing firms in the nordic countries.
Motion Technology produces and sells machinery compo-nents such as conveyor chains, roller bearings and wheels for industrial applications. the business unit markets its products internationally via its own subsidiaries. FB – in chain products – is one of its own brands.
Polymeric Solutions works with a combination of custom-ised solutions and in-house manufactured products in the fields of gaskets, seals and vibration dampers. the offering is marketed internationally. own brands include Addfric and Ad-dcoat in seals and gaskets.
CUSTOMERS AND MARKET
the companies in industrial solutions develop and market products manufactured in-house/own brands to industrial customers in several industries in the international market.
the focus of the business area’s agency activities includes solutions in automation, electronics, electro-mechanics and hydraulics for manufacturing industries in the nordic market.
About 27 percent of the business area’s revenue comes from markets outside the nordic countries – partly through sales from own subsidiaries in the united Kingdom, Germany, china and Austria, and partly through exports.
INDUSTRIAL SOLUTIONS
POLYMERIC SOLUTIONS
MOTION TECHNOLOGY
CUSTOMISEDSOLUTIONS
MI GROUP

Vd hAR oRdet
Addtech AnnuAl RepoRt 2007/2008 29
Metric Industrial Oypekka Jolanki, managing director
PAN-NORDIC PRESENCE
mi Group, a business unit that is part of Addtech industrial solu-tions, consists of 10 companies. in addition to four metric indus-trial companies, the business unit includes Amitra and matronic of Finland, esd-center, tecono and tekno optik of sweden and telein-strument of denmark.
pekka Jolanki, managing director of metric industrial oy, is also Busi-ness unit manager of mi Group in the nordic region.
INCREASING INDUSTRIAL CUSTOMERS’ PRODUCTIVITY
mi Group supplies high-tech, productivity-enhancing automa-tion solutions, systems, components and materials to industrial clients. pekka explains the core business:
“By reducing throughput time and increasing availability and quality we improve productivity for our industrial customers. this requires an understanding of the customer’s needs at an early stage of the project so we can supply the solution with the best and most cost-effective technology – whether we’re talking about customised system solutions or standard components.”
ADDING VALUE THROUGH SYSTEMS KNOW-HOW
this is where mi Group’s value added comes in:“mi Group adds value for industrial automation customers
primarily through our systems know-how,” pekka explains. “We supply complete applications and sub-systems on the basis of the different system components and software that we have put together and tested.” A good example of such a sub-system is metric industrial’s delivery of a client-specifi c machine vision hardware to a Finnish sup-plier of quality control inspection systems in the paper manufactur-ing industry (see picture). By using
web-cameras, a more effective control of the production proc-ess is made possible.
INDUSTRIAL AUTOMATION AS A GROWTH AREA
international demand is strong for quality nordic products offer-ing high levels of technology and know-how and manufactured by the types of company with which mi Group has partnerships. the robust state of the nordic engineering industry is leading to increased investment in automation technology. Approximately 90 percent of mi Group sales are to national and international industrial customers in the nordic region.
“By reducing through-put time and increasing availability and quality
we improve productivity for our industrial
customers.”

Addtech AnnuAl RepoRt 2007/200830
Revenue by customer segment
Other14%
Forest & Process 10%
Energy 9%
Electronics 9%
Medical technology 8%Telecom 11%
Mechanical industry 21%
Vehicle 18%
Revenue by market
Other 27%
Norway 3%
Finland 21%Denmark 16%
Sweden 33%
DEVELOPMENT
industrial solutions continued to expand well in all areas of technology, and was therefore able to strengthen its positions in its market niches during the past year.
the improvement in volume and profit can largely be attrib-uted to the continued stable business climate for replacement components as well as the increased demand for production components.
ACQUISITIONS
Addtech industrial solutions made three acquisitions during the year:
Amitra Oy, which sells material and equipment for environ-mental testing, emc protection and emc testing to industrial end users in electronics and other industrial sectors, chiefly in the Finnish market.
Codan Tech A/S, which produces and sells customer-specific moulded and extruded rubber parts – mainly to danish manu-facturing customers in the machinery, food, and medical tech-nology sectors.
Moving Hjulex AB, which sells wheels, castors, and gravity conveyors to oem customers and distributors, most of which are based in the nordic countries.
EXAMPLES OF CUSTOMERS
ABB, Bt industries, mAn B&W, Vestas Wind systems and the Volvo Group.
EXAMPLES OF COMPETITORS
Fr Ramström, oem international and indutrade.
Key indicators 2007/2008 2006/2007 2005/2006
Revenue, MSEK 1,525 1,238 1,168
Operating profit, MSEK 172 151 122
Operating margin, % 11.3 12.2 10.4
Operating capital, MSEK 384 287 211
Return on operating capital, % 45 52 58
Investments in property,
plant and equipment, MSEK 17 11 8
Average number of employees 511 427 435

Vd hAR oRdet
Addtech AnnuAl RepoRt 2007/2008 31
“Caldaro’s mix of cutting edge internal and external compe-tencies enables us to develop
value-enhancing solutions with the right ‘feel’, which is so important in MMI solutions.”
Caldarostefan Aase, managing director
WORLD-LEADING CUSTOMERS WITH HIGH DEMANDS
caldaro is part of the customised solutions business unit and a leading supplier of customised man-machine interface (mmi) control solutions primarily to demanding oem companies in the nordic region, the united Kingdom and Germany. caldaro is best known internationally for its tailor-made joysticks, han-dles and pedals, which are used by some of the world’s top construction equipment manufacturers.
“our basic approach is to create a solution that is as fl exible and competitive as possible,” says caldaros man-aging director stefan Aase, outlining how the company produces specially adapted handles for excavators. “this may involve using products we’ve already developed previous-ly, but mainly it’s about working closely with the customer to develop an optimal solution. our customers have clear require-ments and high levels of ambition. By combining this with our expertise we can design fl exible and competitive solutions.”
VALUE CREATION AS A SUCCESS FACTOR
caldaro’s network of external partners with leading positions in various specialist technology-related areas plays a key role in adding value for customers. mmi solutions for excavators are a prime example. the company can call on a wide-ranging internal and external competency mix when putting projects together: design engineers, industrial designers, test institutes, production engineers, quality engineers and toolmakers.
stefan explains that value creation is one of caldaro’s suc-cess factors.
“our fl exibility in terms of the market gives us competitive advantages. caldaro’s mix of cutting edge internal and exter-nal competencies enables us to develop value-enhancing solu-tions with the right ‘feel’, which is so important in mmi solutions. We’re also able to customise at relatively small volumes be-cause we’re so cost-effi cient, while at the same time creating a platform for long-term cooperation as our customers grow.”
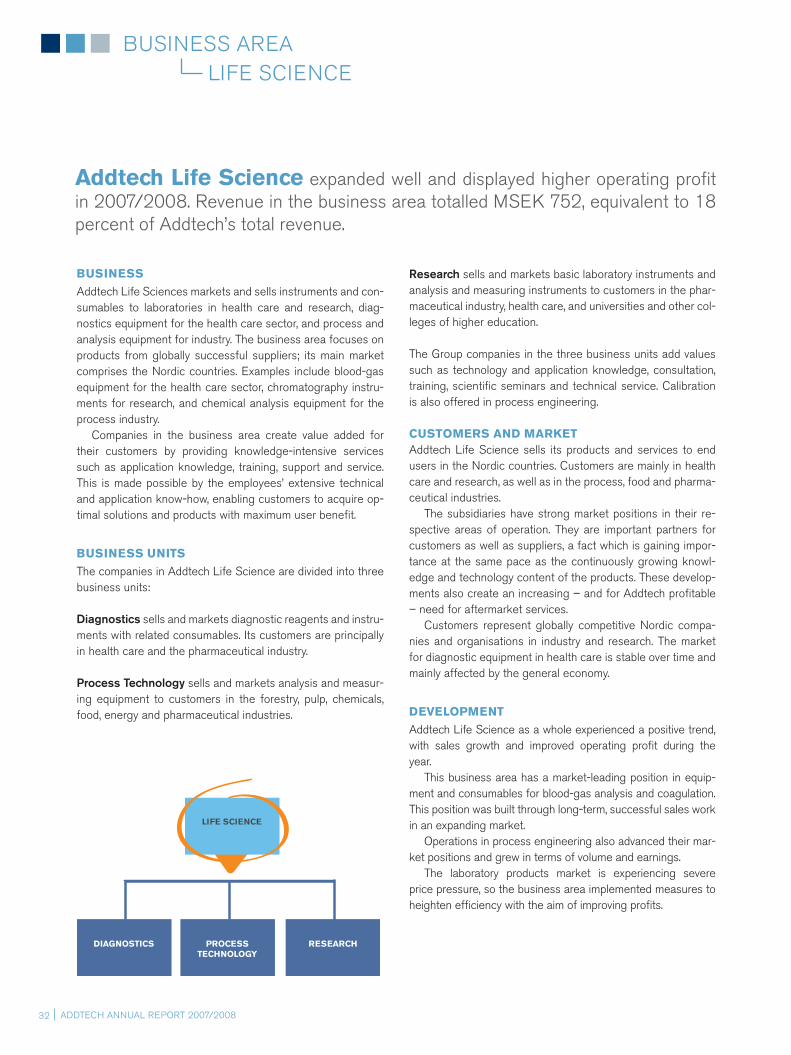
Addtech AnnuAl RepoRt 2007/200832
liFe scienceBusiness AReA
BUSINESS
Addtech life sciences markets and sells instruments and con-sumables to laboratories in health care and research, diag-nostics equipment for the health care sector, and process and analysis equipment for industry. the business area focuses on products from globally successful suppliers; its main market comprises the nordic countries. examples include blood-gas equipment for the health care sector, chromatography instru-ments for research, and chemical analysis equipment for the process industry.
companies in the business area create value added for their customers by providing knowledge-intensive services such as application knowledge, training, support and service. this is made possible by the employees’ extensive technical and application know-how, enabling customers to acquire op-timal solutions and products with maximum user benefit.
BUSINESS UNITS
the companies in Addtech life science are divided into three business units:
Diagnostics sells and markets diagnostic reagents and instru-ments with related consumables. its customers are principally in health care and the pharmaceutical industry.
Process Technology sells and markets analysis and measur-ing equipment to customers in the forestry, pulp, chemicals, food, energy and pharmaceutical industries.
Addtech Life Science expanded well and displayed higher operating profit in 2007/2008. Revenue in the business area totalled mseK 752, equivalent to 18 percent of Addtech’s total revenue.
Research sells and markets basic laboratory instruments and analysis and measuring instruments to customers in the phar-maceutical industry, health care, and universities and other col-leges of higher education.
the Group companies in the three business units add values such as technology and application knowledge, consultation, training, scientific seminars and technical service. calibration is also offered in process engineering.
CUST MERO S AND MARKETAddtech life science sells its products and services to end users in the nordic countries. customers are mainly in health care and research, as well as in the process, food and pharma-ceutical industries.
the subsidiaries have strong market positions in their re-spective areas of operation. they are important partners for customers as well as suppliers, a fact which is gaining impor-tance at the same pace as the continuously growing knowl-edge and technology content of the products. these develop-ments also create an increasing – and for Addtech profitable – need for aftermarket services.
customers represent globally competitive nordic compa-nies and organisations in industry and research. the market for diagnostic equipment in health care is stable over time and mainly affected by the general economy.
DEVELOPMENT
Addtech life science as a whole experienced a positive trend, with sales growth and improved operating profit during the year.
this business area has a market-leading position in equip-ment and consumables for blood-gas analysis and coagulation. this position was built through long-term, successful sales work in an expanding market.
operations in process engineering also advanced their mar-ket positions and grew in terms of volume and earnings.
the laboratory products market is experiencing severe price pressure, so the business area implemented measures to heighten efficiency with the aim of improving profits.
LIFE SCIENCE
PROCESS TECHNOLOGY
DIAGNOSTICS RESEARCH
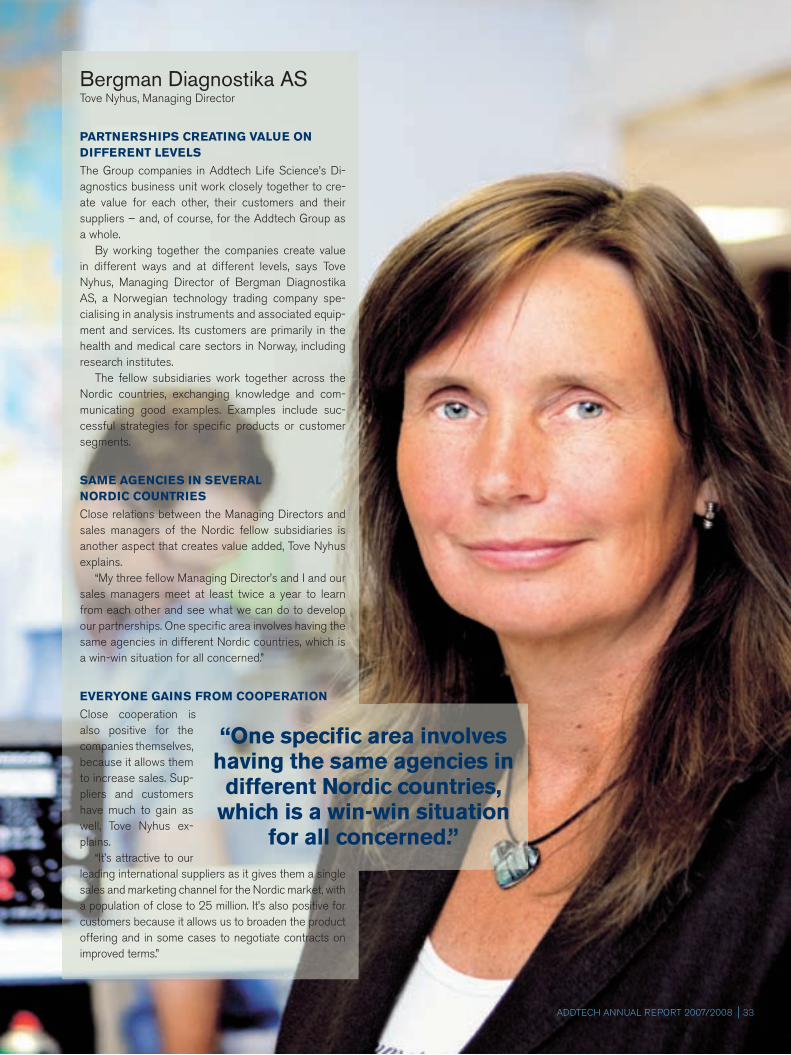
Addtech AnnuAl RepoRt 2007/2008 33
“One specifi c area involves having the same agencies in different Nordic countries,
which is a win-win situation for all concerned.”
Bergman Diagnostika AStove nyhus, managing director
PARTNERSHIPS CREATING VALUE ON DIFFERENT LEVELS
the Group companies in Addtech life science’s di-agnostics business unit work closely together to cre-ate value for each other, their customers and their suppliers – and, of course, for the Addtech Group as a whole.
By working together the companies create value in different ways and at different levels, says tove nyhus, managing director of Bergman diagnostika As, a norwegian technology trading company spe-cialising in analysis instruments and associated equip-ment and services. its customers are primarily in the health and medical care sectors in norway, including research institutes.
the fellow subsidiaries work together across the nordic countries, exchanging knowledge and com-municating good examples. examples include suc-cessful strategies for specifi c products or customer segments.
SAME AGENCIES IN SEVERAL NORDIC COUNTRIES
close relations between the managing directors and sales managers of the nordic fellow subsidiaries is another aspect that creates value added, tove nyhus explains.
“my three fellow managing director’s and i and our sales managers meet at least twice a year to learn from each other and see what we can do to develop our partnerships. one specifi c area involves having the same agencies in different nordic countries, which is a win-win situation for all concerned.”
EVERYONE GAINS FROM COOPERATION
close cooperation is also positive for the companies themselves, because it allows them to increase sales. sup-pliers and customers have much to gain as well, tove nyhus ex-plains.
“it’s attractive to our leading international suppliers as it gives them a single sales and marketing channel for the nordic market, with a population of close to 25 million. it’s also positive for customers because it allows us to broaden the product offering and in some cases to negotiate contracts on improved terms.”

Addtech AnnuAl RepoRt 2007/200834
Revenue by customer segment
Other 5%
Forest & Process 14%
Energy 3%
Medical technology 74%
Mechanical industry 4%
Revenue by market
Other 1%
Norway 21%
Finland 8%
Denmark 32%
Sweden 38%
Key indicators 2007/2008 2006/2007 2005/2006
Revenue, MSEK 752 720 675
Operating profit, MSEK 65 56 34
Operating margin, % 8.6 7.8 5.0
Operating capital, MSEK 218 186 173
Return on operating capital, % 30 30 20
Investments in property,
plant and equipment, MSEK 7 8 11
Average number of employees 256 249 239
ACQUISITIONS
Addtech life science acquired four businesses during the year.
LabRobot Products AB, develops and sells dilucup dilution cups used by microbiology laboratories in the food industry. its customers are principally in europe.
Kouvo Automation Oy sells equipment for measuring levels, flows and weights to the Finnish energy, chemicals, paper and pulp industries – as well as to Finnish manufacturers of instal-lations for such industries.
Immunkemi F&D AB delivers diagnostic and research rea-gents to hospital laboratories, universities and other higher education colleges, and pharmaceutical companies.
The business in S.E.G. Process sells equipment in the area of flow technology, focused on gases and small flows. its cus-tomers mainly comprise companies in the medical technology industry and engineering as well as universities and other col-leges of higher education in sweden.
EXAMPLES OF CUSTOMERS
AstraZeneca, Karolinska institutet, novo nordisk, sahlgrenska university hospital and lKAB.
EXAMPLES OF COMPETITORS
Roche, VWR international and endress+hauser

Vd hAR oRdet
Addtech AnnuAl RepoRt 2007/2008 35
Insatech A/SAlan christoffersen, managing director
MEASUREMENTS MUST NEVER LIE
insatech A/s is a leading danish supplier of analysis and measuring instruments to the processing industry. the compa-ny has a dAnAK-accredited laboratory that calibrates measur-ing instruments for pharmaceutical industry clients1.
calibration is about quality assur-ance and credibility. pharmaceutical company decision-makers must be able to rely on measuring results being correct. this requires reli-able measuring methods. decisions based on incorrect data can have disastrous results – for patients and companies alike.
QUALITY ASSURANCE IS A GIVEN
national and international authorities set high standards for the pharmaceutical industry. Quality assurance is a given in the pharmaceutical business, says Alan christoffersen, managing director of insatech A/s.
“An important element in quality assurance is regular cali-bration of measuring instruments by an accredited calibration
1 dAnAK is denmark’s national body for accreditation and is responsible for inspection issues according to the technical conformity Assessment Act. this means that they assess the compe-tence of companies that perform analysis, testing, calibration, certifi cation and inspection.
laboratory that provides traceability and can verify measure-ment certainty. our accreditation is a guarantee that our work is impartial, correct and based on internationally recognised standards.”2
ONE-STOP SHOP FOR CALIBRATION
insatech A/s has amassed an exten-sive knowledge pool through its long-standing experience of calibration. the company offers a wide range of services, ranging from traceability to electrolytic conductivity – which can involve measuring the purity of ultra-pure water or concentrations of chemi-cals in highly concentrated forms.
“We offer our clients a wide range of services,” Alan christoffersen says. “Apart from identifying which measuring in-struments require regular calibration, we draw up a long-term plan for when and how the different instruments should be in-spected. Fundamentally, what we do is to take overall respon-sibility for the calibration process. this gives our customers greater security, shorter lead-times and lower costs.”
2 insatech A/s is accredited according to the international iso 17025:2005 standard. the company fulfi ls dAnAK’s competence requirements for testing and calibration laboratories. the standard stipulates traceability to national and international norms through an unbroken chain and that the laboratory states its best measurement capability.
“For pharmaceutical companies, calibration
is about quality assurance and
credibility.”
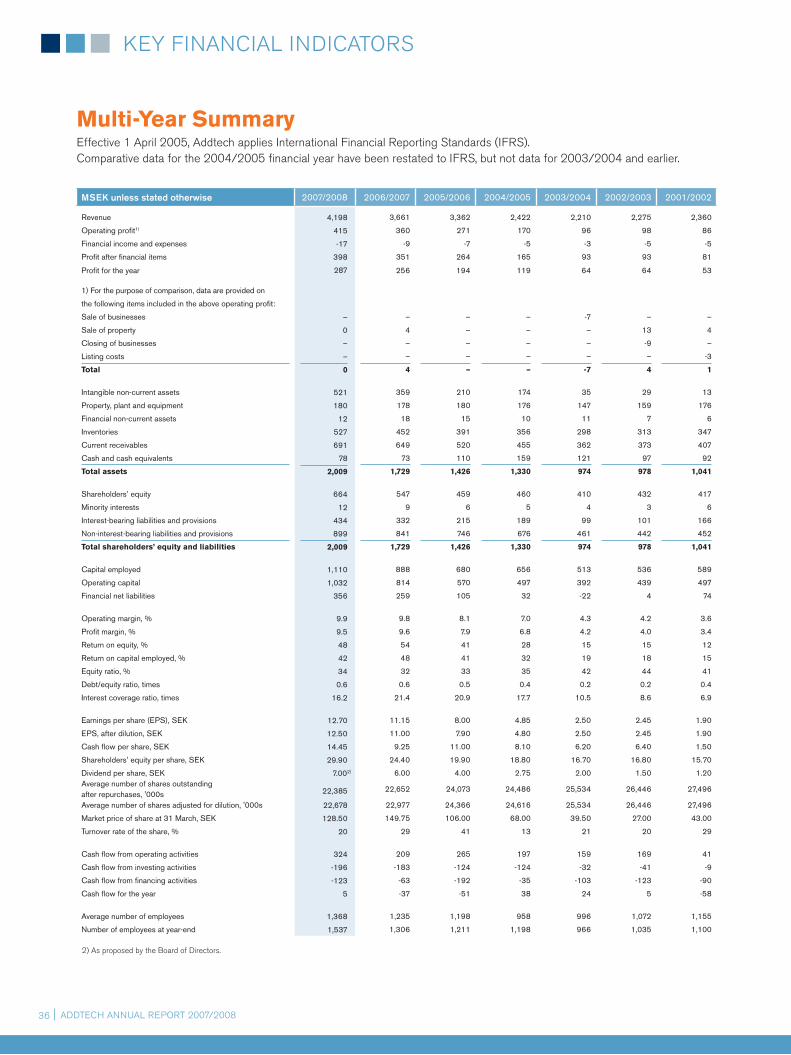
Addtech AnnuAl report 2007/200836
Key FInAncIAl IndIcAtorS
MSEK unless stated otherwise 2007/2008 2006/2007 2005/2006 2004/2005 2003/2004 2002/2003 2001/2002
Revenue 4,198 3,661 3,362 2,422 2,210 2,275 2,360
Operating profit1) 415 360 271 170 96 98 86
Financial income and expenses -17 -9 -7 -5 -3 -5 -5
Profit after financial items 398 351 264 165 93 93 81
Profit for the year 287 256 194 119 64 64 53
1) For the purpose of comparison, data are provided on
the following items included in the above operating profit:
Sale of businesses – – – – -7 – –
Sale of property 0 4 – – – 13 4
Closing of businesses – – – – – -9 –
Listing costs – – – – – – -3
Total 0 4 – – -7 4 1
Intangible non-current assets 521 359 210 174 35 29 13
Property, plant and equipment 180 178 180 176 147 159 176
Financial non-current assets 12 18 15 10 11 7 6
Inventories 527 452 391 356 298 313 347
Current receivables 691 649 520 455 362 373 407
Cash and cash equivalents 78 73 110 159 121 97 92
Total assets 2,009 1,729 1,426 1,330 974 978 1,041
Shareholders’ equity 664 547 459 460 410 432 417
Minority interests 12 9 6 5 4 3 6
Interest-bearing liabilities and provisions 434 332 215 189 99 101 166
Non-interest-bearing liabilities and provisions 899 841 746 676 461 442 452
Total shareholders’ equity and liabilities 2,009 1,729 1,426 1,330 974 978 1,041
Capital employed 1,110 888 680 656 513 536 589
Operating capital 1,032 814 570 497 392 439 497
Financial net liabilities 356 259 105 32 -22 4 74
Operating margin, % 9.9 9.8 8.1 7.0 4.3 4.2 3.6
Profit margin, % 9.5 9.6 7.9 6.8 4.2 4.0 3.4
Return on equity, % 48 54 41 28 15 15 12
Return on capital employed, % 42 48 41 32 19 18 15
Equity ratio, % 34 32 33 35 42 44 41
Debt/equity ratio, times 0.6 0.6 0.5 0.4 0.2 0.2 0.4
Interest coverage ratio, times 16.2 21.4 20.9 17.7 10.5 8.6 6.9
Earnings per share (EPS), SEK 12.70 11.15 8.00 4.85 2.50 2.45 1.90
EPS, after dilution, SEK 12.50 11.00 7.90 4.80 2.50 2.45 1.90
Cash flow per share, SEK 14.45 9.25 11.00 8.10 6.20 6.40 1.50
Shareholders’ equity per share, SEK 29.90 24.40 19.90 18.80 16.70 16.80 15.70
Dividend per share, SEK 7.002) 6.00 4.00 2.75 2.00 1.50 1.20Average number of shares outstanding after repurchases, '000s 22,385 22,652 24,073 24,486 25,534 26,446 27,496
Average number of shares adjusted for dilution, '000s 22,678 22,977 24,366 24,616 25,534 26,446 27,496
Market price of share at 31 March, SEK 128.50 149.75 106.00 68.00 39.50 27.00 43.00
Turnover rate of the share, % 20 29 41 13 21 20 29
Cash flow from operating activities 324 209 265 197 159 169 41
Cash flow from investing activities -196 -183 -124 -124 -32 -41 -9
Cash flow from financing activities -123 -63 -192 -35 -103 -123 -90
Cash flow for the year 5 -37 -51 38 24 5 -58
Average number of employees 1,368 1,235 1,198 958 996 1,072 1,155
Number of employees at year-end 1,537 1,306 1,211 1,198 966 1,035 1,100
2) As proposed by the Board of directors.
Multi-Year Summaryeffective 1 April 2005, Addtech applies International Financial reporting Standards (IFrS). comparative data for the 2004/2005 financial year have been restated to IFrS, but not data for 2003/2004 and earlier.

Addtech AnnuAl report 2007/2008 37
QuArterly dAtA, AnnuAl dAtA And deFInItIonS
Quarterly data 2007/2008 2006/2007
Revenue by business area (MSEK) Q 4 Q 3 Q 2 Q 1 Q 4 Q 3 Q 2 Q 1
Components 315 276 247 257 274 258 226 246
Energy and Equipment 205 237 192 205 203 190 161 160
Industrial Solutions 423 375 370 357 340 314 284 300
Life Science 215 203 150 184 202 183 156 179
Parent Company and Group items -3 -3 -3 -4 -4 -4 -6 -1
Addtech Group 1,155 1,088 956 999 1,015 941 821 884
Quarterly data 2007/2008 2006/2007
Profit by business area (MSEK) Q 4 Q 3 Q 2 Q 1 Q 4 Q 3 Q 2 Q 1
Components 41 21 20 23 32 21 19 20
Energy and Equipment 17 22 20 23 18 18 14 11
Industrial Solutions 47 36 49 40 47 34 35 35
Life Science 22 17 7 19 14 15 10 17
Parent Company and Group items -1 -2 -4 -2 6 -1 -3 -2
Operating profit 126 94 92 103 117 87 75 81
– as % of revenue 10.9 8.6 9.6 10.3 11.5 9.2 9.1 9.2
Financial income and expenses -6 -3 -5 -3 -1 -3 -3 -2
Profit after financial items 120 91 87 100 116 84 72 79
– as % of revenue 10.4 8.4 9.1 10.0 11.4 8.9 8.8 8.9
• Capital employed total assets, less non-interest-bearing liabilities and provisions.
• Cash flow per share cash flow from operating activities, divided by the average number of shares outstanding.
• Debt/equity ratio Interest-bearing liabilities and interest-bearing provisions in relation to shareholders’ equity.
• Earnings per share (EPS) profit for the year attributable to shareholders, in relation to the average number of shares outstanding.
• Earnings per share (EPS), after dilution profit for the year attributable to shareholders, in relation to the average number of shares outstanding, adjusted for additional number of shares as if all outstanding options were exercised by employees.
• Employee turnover number of employees who left the company during the year, in relation to average number of employees.
• Equity ratio Shareholders’ equity as a percentage of total assets.
• Financial net liabilities Interest-bearing liabilities and interest-bearing provisions, less cash and cash equivalents.
• Interest coverage ratio profit after net financial items, plus interest expense, plus/minus exchange differences in relation to interest expense plus/minus exchange differences.
• Operating capital capital employed, less cash and cash equivalents.
• Operating margin operating profit/loss as a percentage of revenue.
• Profit margin profit after net financial items as a percentage of revenue.
• Return on capital employed profit after net financial items, plus interest expense, plus/minus exchange differences, as a percentage of average capital employed.
• Return on equity profit after tax attributable to shareholders, as a percentage of the shareholders’ proportion of average equity.
• Return on operating capital operating profit as a percentage of average operating capital.
• Shareholders’ equity per share equity attributable to shareholders, divided by the number of shares outstanding at the balance sheet date.
• Shares outstanding total number of shares, less the number of shares repurchased by the company.
Revenue by business area 12 months ending
MSEK 31 Mar. 2008 31 Mar. 2007 31 Mar. 2006
Components 1,095 1,004 894
Energy and Equipment 839 714 629
Industrial Solutions 1,525 1,238 1,168
Life Science 752 720 675
Parent Company and Group items -13 -15 -4
Addtech Group 4,198 3,661 3,362
Profit by business area 12 months ending
MSEK 31 Mar. 2008 31 Mar. 2007 31 Mar. 2006
Components 105 92 80
Energy and Equipment 82 61 41
Industrial Solutions 172 151 122
Life Science 65 56 34
Parent Company and Group items -9 0 -6
Operating profit 415 360 271
– as % of revenue 9.9 9.8 8.1
Financial income and expenses -17 -9 -7
Profit after financial items 398 351 264
– as % of revenue 9.5 9.6 7.9

Addtech AnnuAl report 2007/200838
rISK And SenSItIvIty AnAlySIS
Addtech’s income and financial position, as well as its strate-gic position, are affected by a number of internal factors under Addtech’s control and by a number of external factors over which Addtech has limited influence. the most important risk factors for Addtech are the state of the economy, structural changes and the competitive situation.
STATE OF THE ECONOMY the markets in which Addtech is active largely follow overall in-dustry trends. through the business unit of Addtech life Science, trends in the national economy have assumed greater importance, as these trends influence operating and capital expenditure in health care and research. Addtech’s sensitivity to the economy is reduced by the Group’s focus on multiple niches and the Group’s some 80 subsidiaries diversified interests, as the dependence of customers’ businesses on the business cycle varies. Addtech’s significant sales of technical service, support and consumables to the aftermarket, as well as to laboratories and health care, further reduce the Group’s sensitivity to the economy as a whole.
STRUCTURAL CHANGES AMONG CUSTOMERSStructural changes among and consolidation by customers ac-centuate demands for added value in offerings from suppliers. to meet these demands, business units active in the market must have sufficient financial strength as well as significant service content and product offerings. In recent years, a clear trend has emerged in certain industries of outsourcing part of production to contract manufacturers. this involves risks as well as opportuni-ties for Addtech, because a contract manufacturer could choose other suppliers, or new business opportunities could materialise. the effects of increased internationalisation, by which produc-tion is relocated to different countries, have been limited, except in the early 2000s as telecommunications and electronics firms relocated. the Group’s exposure to a large number of industries and the fact that no single customer accounts for more than about three percent of consolidated revenue reduce the potential impact of individual companies deciding to relocate abroad. undeniable added value and the unique quality of Addtech’s offering to custo-mers generate opportunities to deliver outside the immediate geo-graphic area.
COMPETITIVE SITUATION change and consolidation within the value-added technology trading industry are constantly altering the competitive situation. economies of scale may pressure prices, but Addtech’s strategy includes achieving market-leading positions in specific niches, of-fering products and services for which price is not the sole deci-ding factor.
FUTURE LEVEL OF CAPITAL SPENDING during the past three years, capital spending on tangible and in-tangible non-current assets has totalled MSeK 125, mostly in It equipment, machinery and other equipment. during the same peri-
od, investment in corporate acquisitions totalled MSeK 415. over time, the key determinant of the future level of capital spending is the pace of corporate acquisitions.
SEASONAL VARIATIONS overall, Addtech’s business has limited vulnerability to seasonal variations. Business activities normally follow the seasonal pattern of manufacturing, which means lower sales during the summer months. Based on historical results, less than half of the reve-nue is generated in the first two quarters of Addtech’s financial year (April–September), more than half in the last two quarters (october– March). Major deviations from this pattern may occur if general business conditions change rapidly during the course of a year. In individual business areas, such as Addtech life Science, seasonal variations can be substantial.
CHANGES IN VOLUME OF SALES A small increase in volume in any business of the Group can be expected to improve operating profit in line with the gross margin in that business. however, once volume has increased a certain amount, a level is reached at which resources must be expanded. In that case, incremental effects tend to reduce the marginal inco-me from additional volumes to a level that eventually approaches the operating margin. When volumes decline, the short-term ne-gative effect on operating income may be greater than the analo-gous positive effect of greater volumes. Actions must be taken to deal with this negative effect so that, in the slightly longer term, it approaches the operating margin. It should also be noted that the Group’s different businesses operate under varying conditions with respect to gross margins and capacity utilisation, for instance. thus different operations have different abilities to cope with volume growth, depending on existing resources, or to reduce re-sources in the event of decreasing volumes. the effects reported should be seen as indications only and do not include any effects of offsetting actions the company would take in such eventualities.
Sensitivity analysis ChangeEffect on
operating profit
Income statement items
Sales volume +/-5% +20/-70 MSEK
Cost of sales +/-1% +/-28 MSEK
Payroll expenses +1% -8 MSEK
Overheads, not including payroll expenses +1% -5 MSEK
FINANCIAL RISKSFor a discussion of the Group’s financial risks, refer to note 3.

Addtech AnnuAl report 2007/2008 39
tABle oF contentS
Administration Report 40
Financial Statements 46
consolidated Income Statement 46
consolidated Balance Sheet 47
consolidated cash Flow Statement 48
consolidated Statement of changes in equity 49
parent company Income Statement 50
parent company Balance Sheet 51
parent company cash Flow Statement 52
parent company Statement of changes in equity 53
Notes 54
Proposed Allocation Of Earnings 79
Audit Report 80

Addtech AnnuAl report 2007/200840
AdMInIStrAtIon report
0
100
200
300
400
500
0
2
4
6
8
10MSEK
0
1,000
2,000
3,000
4,000
5,000
0
300
600
900
1,200
1,500
03/04 04/05 05/06 06/07 07/08
MSEK
03/04 04/05 05/06 06/07 07/08
Operating margin (%)
03/04 04/05 05/06 06/07 07/08
%Operating profit (MSEK)
REVENUE OPERATING PROFIT AND OPERATING MARGIN
AVERAGE NUMbER OF EMPLOYEES
the Board of directors and the president of Addtech AB (publ), company Id number 556302-9726, hereby submit their an-nual accounts and consolidated financial statements for the 2007/2008 financial year. the annual accounts and the audit report are on pages 40-80.
THE bUSINESSAddtech is a leading technology trading group that develops and sells components, systems and equipment in clearly de-fined niches to industrial companies and the service industry. customers are primarily manufacturers in the mechanical, en-ergy, vehicle, telecom and electronics industries and laborato-ries in the healthcare and research sector in the nordic region. Addtech provides customers with technological and economic value added. As of the start of the 2008/2009 financial year, the Group is organised in four business areas: Addtech com-ponents, Addtech energy & equipment, Addtech Industrial So-lutions and Addtech life Science. the business is conducted through subsidiaries in Sweden, Finland, denmark, norway, the united Kingdom, Austria, Germany, poland, estonia and china. Addtech’s class B share has been listed on the oMX nor-dic exchange Stockholm since September 2001 and is quoted on the Mid cap list.
REVENUE AND PROFITAddtech Group revenue increased to MSeK 4,198 (3,661) during the financial year. this represented a 15 percent rise, or 4 percent after adjustment for units acquired and disposed of and for foreign exchange differences arising on translation of non-Swedish units. Foreign exchange differences arising on translation of non-Swedish units contributed MSeK 25 to revenue and MSeK 2 to operating profit. demand was robust across all business areas during the year, leading to higher revenue. Along with a good contribution from acquired busi-nesses, this was the main reason for the increase in profit.
operating profit rose by 15 percent, to MSeK 415 (360), and profit after financial items increased by 13 percent, to MSeK 398 (351). the operating margin rose to 9.9 percent (9.8). net financial items were MSeK -17 (-9). profit after tax increased by 12 percent to MSeK 287 (256) and earnings per share (epS) were up 14 percent at SeK 12.70 (11.15). the effective tax rate was 28 percent (27).
bUSINESS AREAS – AS PER THE bUSINESS STRUCTURE FOR THE 2007/2008 FINANCIAL YEAR
ADDTECH COMPONENTS
revenue at Addtech components rose by 19 percent to MSeK 1,167 (979) and operating profit increased by 10 percent to MSeK 119 (108). demand for components was stable during the year and acquisitions led to a substantial rise in revenue. Sales of high-specification and value-added components and subsystems performed well. the product mix and businesses acquired reduced the operating margin somewhat during the latter part of the financial year.
ADDTECH TRANSMISSION
Addtech transmission’s revenue rose by 12 percent to MSeK 1,283 (1,144) and operating profit advanced by 17 percent to MSeK 148 (126). demand was strong in key product areas, which helped create further sales growth. combined with ef-fective cost control, the increase in revenue had a favourable impact on profit. Business conditions for replacement compo-nents for industrial maintenance and service remained stable during the year. demand for production components from sec-tors such as the wind power and offshore industries rose.
ADDTECH EqUIPMENT
Addtech equipment’s revenue rose by 22 percent to MSeK 1,000 (823) and operating profit increased by 31 percent to MSeK 92 (70). Growth for products and solutions for the energy sector and industrial production processes was stable
1 April 2007 – 31 March 2008
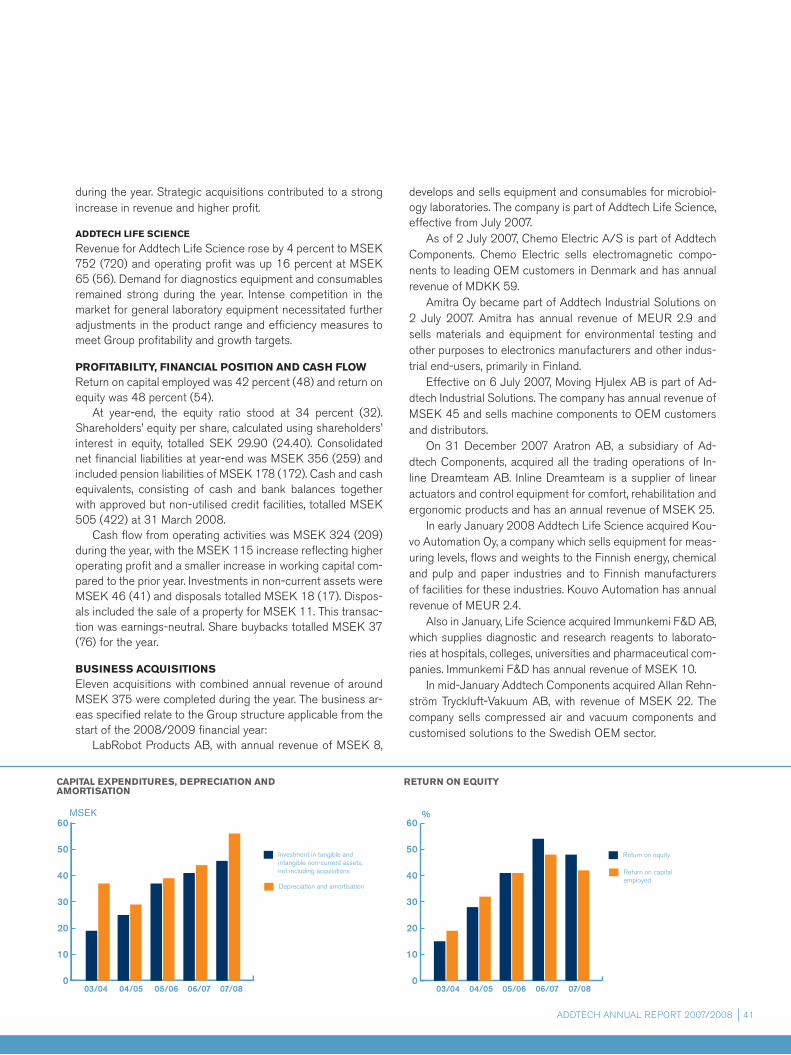
Addtech AnnuAl report 2007/2008 41
during the year. Strategic acquisitions contributed to a strong increase in revenue and higher profit.
ADDTECH LIFE SCIENCE
revenue for Addtech life Science rose by 4 percent to MSeK 752 (720) and operating profit was up 16 percent at MSeK 65 (56). demand for diagnostics equipment and consumables remained strong during the year. Intense competition in the market for general laboratory equipment necessitated further adjustments in the product range and efficiency measures to meet Group profitability and growth targets.
PROFITAbILITY, FINANCIAL POSITION AND CASH FLOWreturn on capital employed was 42 percent (48) and return on equity was 48 percent (54). At year-end, the equity ratio stood at 34 percent (32). Shareholders’ equity per share, calculated using shareholders’ interest in equity, totalled SeK 29.90 (24.40). consolidated net financial liabilities at year-end was MSeK 356 (259) and included pension liabilities of MSeK 178 (172). cash and cash equivalents, consisting of cash and bank balances together with approved but non-utilised credit facilities, totalled MSeK 505 (422) at 31 March 2008. cash flow from operating activities was MSeK 324 (209) during the year, with the MSeK 115 increase reflecting higher operating profit and a smaller increase in working capital com-pared to the prior year. Investments in non-current assets were MSeK 46 (41) and disposals totalled MSeK 18 (17). dispos-als included the sale of a property for MSeK 11. this transac-tion was earnings-neutral. Share buybacks totalled MSeK 37 (76) for the year.
bUSINESS ACqUISITIONS eleven acquisitions with combined annual revenue of around MSeK 375 were completed during the year. the business ar-eas specified relate to the Group structure applicable from the start of the 2008/2009 financial year: labrobot products AB, with annual revenue of MSeK 8,
develops and sells equipment and consumables for microbiol-ogy laboratories. the company is part of Addtech life Science, effective from July 2007. As of 2 July 2007, chemo electric A/S is part of Addtech components. chemo electric sells electromagnetic compo-nents to leading oeM customers in denmark and has annual revenue of MdKK 59. Amitra oy became part of Addtech Industrial Solutions on 2 July 2007. Amitra has annual revenue of Meur 2.9 and sells materials and equipment for environmental testing and other purposes to electronics manufacturers and other indus-trial end-users, primarily in Finland. effective on 6 July 2007, Moving hjulex AB is part of Ad-dtech Industrial Solutions. the company has annual revenue of MSeK 45 and sells machine components to oeM customers and distributors. on 31 december 2007 Aratron AB, a subsidiary of Ad-dtech components, acquired all the trading operations of In-line dreamteam AB. Inline dreamteam is a supplier of linear actuators and control equipment for comfort, rehabilitation and ergonomic products and has an annual revenue of MSeK 25. In early January 2008 Addtech life Science acquired Kou-vo Automation oy, a company which sells equipment for meas-uring levels, flows and weights to the Finnish energy, chemical and pulp and paper industries and to Finnish manufacturers of facilities for these industries. Kouvo Automation has annual revenue of Meur 2.4. Also in January, life Science acquired Immunkemi F&d AB, which supplies diagnostic and research reagents to laborato-ries at hospitals, colleges, universities and pharmaceutical com-panies. Immunkemi F&d has annual revenue of MSeK 10. In mid-January Addtech components acquired Allan rehn-ström tryckluft-vakuum AB, with revenue of MSeK 22. the company sells compressed air and vacuum components and customised solutions to the Swedish oeM sector.
MSEK
0
10
20
30
40
50
60
03/04 04/05 05/06 06/07 07/08
Depreciation and amortisation
Investment in tangible and intangible non-current assets, not including acquisitions
%
0
10
20
30
40
50
60
03/04 04/05 05/06 06/07 07/08
%
Return on equity
Return on capital employed
CAPITAL ExPENDITURES, DEPRECIATION AND AMORTISATION
RETURN ON EqUITY
MSEK
0
10
20
30
40
50
60
03/04 04/05 05/06 06/07 07/08
Depreciation and amortisation
Investment in tangible and intangible non-current assets, not including acquisitions
%
0
10
20
30
40
50
60
03/04 04/05 05/06 06/07 07/08
%
Return on equity
Return on capital employed

Addtech AnnuAl report 2007/200842
At the end of January, Addtech Industrial Solutions acquired codan tech A/S, a manufacturer and seller of customised rub-ber parts primarily to danish companies in the machinery, food processing and medical technology industries. codan tech has annual revenue of MdKK 85. on 1 February 2008, Addtech energy & equipment ac-quired eurolaite oy. With annual revenue of Meur 3, eurolaite sells electrical power distribution equipment, primarily to Finn-ish grid operators and power distributors. In March, the life Science business area completed an-other acquisition in the form of S.e.G. process, which special-ises in measurement and flow engineering. S.e.G. process has annual revenue of MSeK 10. the combined purchase cost of the companies acquired during the year was MSeK 213, of which MSeK 166 was allo-cated to goodwill and other intangible assets. the acquisitions had an effect of MSeK 148 on Addtech Group’s revenue, MSeK 11 on operating profit and MSeK 4 on profit after tax for the period. had the acquisitions been effective on 1 April 2007, the estimated effect would have been MSeK 375 on revenue, MSeK 20 on operating profit and MSeK 9 on profit after tax for the period.
EMPLOYEESAt the end of the financial year, the number of employees were 1,537, compared to 1,306 at the beginning of the period. Ac-quisitions completed during the financial year resulted in the addition of 210 employees. the average number of employees during the year was 1,368, compared to 1,235 in the preced-ing financial year.
RISKS AND UNCERTAINTIESAddtech’s profit and financial position, as well as its strategic position, are affected by various internal factors within Ad-dtech’s control and various external factors over which Ad-dtech has limited influence. Addtech’s primary risks relate to the state of the economy, structural change, competition and changes in foreign exchange rates. In addition, Addtech is affected by financial risks such as transaction exposure, translation exposure, financing risk, inter-est rate risk and credit and counterparty risk. See note 3 for a detailed description of how Addtech manages financial risks.
ENVIRONMENTGroup units make active efforts to reduce Addtech’s environ-mental impact. each company performs this work locally based on its specific circumstances. the Group has an environmental policy. Some 15 companies have earned ISo 14001 certifica-tion or equivalent standards. the Group conducts operations re-quiring a permit according to the Swedish environmental code in one subsidiary and operations requiring notification in one other subsidiary. together these businesses account for about 1 percent of consolidated revenue. no Group companies are involved in any environment-related disputes.
RESEARCH AND DEVELOPOMENT
the Addtech Group conducts very limited in-house research and development. Most r&d relevant to the Addtech product range is performed by suppliers, and continuous dialogue with and feedback to suppliers is part of the Group business model.
LEGISLATION AND ARTICLES OF ASSOCIATION
Addtech AB applies the Swedish companies Act and the rules pursuant to being listed on oMX nordic exchange Stockholm. Addtech AB also complies with its Articles of Association, which are available on the Addtech website. Addtech is at present not subject to the Swedish code of corporate Governance.
WORK OF THE bOARD AND GROUP GOVERNANCE
board structure
the Board of directors elected at the 2007 Annual General Meeting comprises: Anders Börjesson (chairman), eva elm-stedt, tom hedelius (vice chairman), urban Jansson and lars Spongberg. All Board directors are independent of the company and management. eva elmstedt, urban Jansson and lars Spongberg are also independent of the company’s major shareholders. roger Bergqvist left the Board of his own voli-tion in early 2008 in conjunction leaving his position as presi-dent of Addtech AB.
board work methods
the Board of directors annually approves written procedural rules governing its work and internal allocation of Board re-sponsibilities, including committees, decision-making proc-esses, meeting agendas and the work of the chairman. the Board has issued a directive to the president and a directive regarding financial reporting to the Board, and has also ap-proved various operating policies. the Board oversees the work of the president through continuous monitoring of the company’s performance and is also responsible for ensuring that the organisation, the man-agement and the guidelines for managing company affairs are appropriate and that there is effective internal control. the Board is also responsible for developing and monitoring the company’s strategies through plans and targets, decisions on acquisitions, disposals and major investments, and the appoint-ment and remuneration of Group management. the Board and the president are responsible for submitting the annual ac-counts to the Annual General Meeting.
board activities
the Board of directors’ procedural rules state that it must meet in conjunction with the finalisation of interim financial reports and in conjunction with an annual strategy meeting. It must also hold a statutory opening meeting once a year and
Addtech AnnuAl report 2007/2008 43
convene as and when required. the Board met on 12 occa-sions during the year and attendance was very high, with only two directors unable to attend in three different instances. the chief Financial officer serves as Board secretary. oth-er employees attend Board meetings as and when required and in relation to specific issues. during the year, the Board addressed a range of issues, including the Group’s strategic development, acquisitions, organisation and financial position.
Audit committee
the Board’s audit committee members are directors who are not company employees. during the year, the audit commit-tee’s affairs were integrated with the Board’s regular meetings. In conjunction with the approval of the 2007/2008 annual ac-counts at the May 2008 Board meeting, the Board held dis-cussions with the external auditors and received their report. At this meeting, the Board also discussed matters with the auditors without the president and other members of Group management being present.
Group management
the president heads the operations of the Group as per the requirements of the companies Act and the frameworks set by the Board. In consultation with the chairman, the president prepares requisite documentation for Board meetings, makes presentations and explains proposals submitted to the Board. the president is responsible for leading the work of Group management and for making decisions in consultation with other members of Group management. Group management has five members: Johan Sjö, Anders claeson, håkan Franzén, richard Gustavsson and Kennet Göransson. It holds regular operating reviews chaired by the president.
Auditors
the auditors work according to an audit plan that includes comments from the Board and report their findings to Group management and the Board. these reports are submitted dur-ing the audit process and in conjunction with approval of the annual accounts. the auditors also attend the Annual General Meeting, at which they present and comment on their work. during the financial year the auditors advised the Group on accounting and tax issues. the Board has guidelines stating which types of non-audit assignment that the company’s audi-tors may accept; the extent of these assignments is shown in note 7 on page 64. the 2005 Annual General Meeting elected KpMG to serve as auditor until the close of the 2009 Annual General Meeting. the principal auditor is George pettersson, who in 2001-2005 served as the company’s auditor with thomas thiel from KpMG.
Internal control
In accordance with the companies Act, the Board of directors is responsible for internal control. the Board is responsible for annually evaluating and ensuring the quality of the financial reports it receives and for stipulating the scope and format of these reports. the Board’s stipulations mean that the financial reporting must comply with applicable accounting rules and regulations and other requirements incumbent on listed com-panies. Addtech’s business structure is based on decentralised re-sponsibility for financial results and profitability. Internal control in a decentralised structure is founded on a firmly established process that sets targets and strategies for the various opera-tions. Internal directives and Board-approved policies provide the conditions for clear decision-making channels, powers and responsibilities. the finance policy, reporting manual, treasury manual and instructions for interim reporting are the Group’s primary financial documents. In addition, all Addtech operations must comply with the Group’s ethical Guidelines. Addtech has procedures for managing the risks that the Board and Group management deem pertinent to internal control of financial re-porting. examples of such procedures are transaction-related controls, authorisation and investment rules, clear payment procedures and analytical controls performed by the Group controller function. controllers at all levels of the Group play a key role in terms of their integrity, expertise and capacity to create the right environment for true and transparent financial reporting. Annual conferences are held to discuss current financial issues and ensure a healthy flow of knowledge and experi-ence within the Group. the monthly financial review performed via the internal reporting system and analysed and commented on by the Board serves as a key control process at Group level. the financial review includes an evaluation of results of opera-tions compared to relevant targets and previous performance, and a review of key indicators.
Election committee
the 2007 Annual General Meeting authorised the chairman to establish an election committee for upcoming elections to the Board, by appointing representatives from among the five shareholders who controlled the largest number of votes in the company at 31 december 2007, to serve with the chair-man. the following were appointed to sit on the committee: Arne lööw (nominated by the Fourth Swedish national pen-sion Fund), Marianne nilsson (nominated by Swedbank robur) tom hedelius and pär Stenberg and Anders Börjesson (chair-man of the Board). the election committee’s tasks include evaluating the com-position of the Board and its work, nominating a person to chair the Annual General Meeting, proposing the election of
Addtech AnnuAl report 2007/200844
the chairman of the Board and directors, proposing fees to be paid to Board of directors not employed by the company and, when applicable, propose a registered auditing firm, audit fees and establishing principles for the election of members to the election committee. the composition of the election committee was disclosed in the interim report published on 14 February 2008. Since being appointed, the election committee has held one meeting and its members have received no remuneration. the election committee has the option of enlisting assistance from external consultants, paid for by the company, insofar as it deems such assistance to be necessary. the election com-mittee did not use any external consultants during the year. the proposals of the election committee to the Annual General Meeting will be presented in the notice to attend and on the company’s website.
PRINCIPLES FOR REMUNERATION OF SENIOR MANAGEMENT
the Board intends to propose that the Annual General Meet-ing in August 2008 approves the same principles as in prior year. these relate to remuneration of the president and other members of Addtech Group management. Addtech seeks to offer a reasonable and competitive total benefits package capable of attracting and retaining skilled individuals. the size of the overall package varies in relation to the performance of the employee and the Group. It may comprise the different elements stated below. Basic salary is the main component of total remuneration. Basic salaries should be competitive and reflect the responsi-bilities of the position concerned. Fixed salaries are reviewed annually. variable remuneration is based on growth in Group profit and can be up to 40 percent of basic salary. the Board of directors will perform an annual review to determine whether to recommend a long-term incentive pro-gramme for adoption by the Annual General Meeting. In the event that it decides to propose such an incentive programme, the Board will examine whether the programme should include allocations of Addtech shares. retirement pension and sickness and healthcare benefits should be structured in accordance with applicable rules and market norms. defined-contribution pensions should be pro-vided where possible. other benefits may be agreed with individual or all mem-bers of Group management. they are structured to reflect market norms and may account only for a minor portion of an individual’s remuneration package.
A notice period of six months applies to termination of employ-ment by a member of Group management. A notice period of 12 months applies in the event of termination by the company. A member of Group management whose contract is termi-nated by the company is entitled to severance pay of up to 12 months’ salary, in addition to salary and other employment benefits. no severance pay is payable if the employee initiates termination. the Board of directors is entitled to waive the above stated principals in individual cases where special conditions apply. the remuneration committee has responsibility for pre-paring and submitting a proposal for the remuneration of the president to the Board. the committee sets the remuneration of other members of Group management based on the presi-dent’s recommendations. the remuneration committee informs the Board of its decisions. See note 6.
PARENT COMPANY
operations of the parent company, Addtech AB, include Group management, Group reporting and financial management. parent company revenue totalled MSeK 33 (29) and profit after financial items was MSeK 324 (447). profit after financial items includes a share of MSeK 325 (450) net in Group companies. net investments in non-current assets were MSeK 2 (0). the parent company’s net financial liability was MSeK 39 at the end of the period, compared to MSeK 130 at the start of the financial year.
SHARE CAPITAL AND SHAREHOLDER STRUCTURE
At 31 March 2008 parent company share capital was as shown below. each share had a quotient value of SeK 2.15.
Share class Number of shares
Number of votes
Percentage of equity capital
Percentage of votes
A 10 votes 1,103,814 11,038,140 4.7 32.9
B 1 vote 22,529,018 22,529,018 95.3 67.1
Total 23,632,832 33,567,158 100.0 100.0
class A shares can be transferred into class B shares if re-quested by the holder. the number of shareholders was 3,609 at 31 March 2008 (including Addtech AB as owner of own shares). two share-holders each control 10 percent or more of the votes: Anders Börjesson (with family interests) controls shares correspond-ing to 12.2 percent of the votes and tom hedelius (with family interests) controls shares corresponding to 11.6 percent of the votes.

Addtech AnnuAl report 2007/2008 45
chapter 6, Section 2a of the Swedish Annual Accounts Act requires listed companies to disclose specific circumstances that may affect the prospects for acquiring the company via a public share offer. no such circumstances exist in respect of Addtech AB.
SHARE bUYbACKS AND INCENTIVE PROGRAMMES
the Annual General Meeting in August 2007 authorised the Board of directors to buy back up to 10 percent of all shares in the company up to the 2008 Annual General Meeting. A total of 300,000 shares were repurchased during the finan-cial year at an average price of SeK 122 per share. At 31 March 2008, the company held a total of 1,425,000 of its own (treasury) shares, acquired at an average price of SeK 96. these shares correspond to 6.0 percent of the number of shares issued and 4.2 percent of the votes. of the total shares repurchased, 420,000 secure the company’s undertakings to holders of personnel options. during the year the company held an average of 1,248,093 treasury shares (1,791,458). the Board of directors will recommend that the Annual General Meeting in 2008 approves the renewal of the buy-back mandate. the mandate would empower the Board to acquire company shares during the period until the next An-nual General Meeting, provided that the number of shares held by the company does not exceed 10 percent of all shares at any time. All share repurchases would be via the stock market. the proposed mandate would also allow the Board to use re-purchased shares for acquisitions or to sell them outside the stock market to finance acquisitions. the Board will also recommend that the Annual General Meeting authorises a reduction in the share capital of SeK 1,935,000 through the cancellation, without repayment, of 900,000 shares held by Addtech. In december 2001, a decision was made to award 56 members of senior management a total of 700,000 personnel options. An extraordinary General Meeting on 17 december 2001 approved the transfer of up to 700,000 class B shares to enable the options to be exercised in the future. the exercise price of SeK 44.80 is equivalent to 110 percent of the aver-age market price of the Addtech share from 3 to 7 december 2001. An extraordinary Generall Meeting in november 2004 approved an extension of the exercise period for the options to 18 February 2010. A total of 74,000 options for the acquisi-tion of 74,000 shares were exercised in the 2007/2008 finan-cial year. In total 280,000 options have been exercised. upon full exercise of the options, the number of shares outstanding will increase by 420,000, equivalent to 1.9 percent of the total
number of shares outstanding and 1.3 percent of the votes.
EVENTS AFTER THE bALANCE SHEET DATE
At the start of the 2008/2009 financial year Addtech intro-duced organisational changes aimed at further strengthen-ing the Group’s prospects for long-term profitable growth. the Group is now organised in four business areas: Addtech components, Addtech energy & equipment, Addtech Industrial Solutions and Addtech life Science. on 30 April Addtech acquired Minitec Finland oy and Minitec estonia oÜ. the companies, which joined the com-ponents business area and have combined revenue of Meur 1.6, sell profiles and linear systems for production lines and processing workstations - mainly to the Finnish engineering industry. on 21 May Addtech acquired emcomp holding AB, which via subsidiaries sells customised components and subsys-tems for power transmission, radio, fibre optics and displays. emcomp, with revenue of around MSeK 72, is part of the Industrial Solutions business area.
FUTURE PROSPECTS
the market remained robust in 2007/2008. Addtech has a strong financial position and excellent opportunities for future growth. the Group’s goal is to deliver annual profit growth of at least 15 percent over a business cycle, combined with profit-ability. See page 79 for the proposed dividend and allocation of earnings.

Addtech AnnuAl report 2007/200846
FInAncIAl StAteMentS
Consolidated Income Statement
MSEK Note 2007/2008 2006/2007
Revenue 4, 5 4,198 3,661
Cost of sales2) -2,832 -2,483
Gross profit 1,366 1,178
Selling expenses2) -647 -554
Administrative expenses2) -300 -278
Other operating income 9 26 32
Other operating expenses 9 -30 -18
Operating profit 3-10, 16 415 360
Financial income 11 9 8
Financial expenses 11 -26 -17
Net financial items -17 -9
Profit before tax 398 351
Income tax expense 13 -111 -95
PROFIT FOR THE YEAR 287 256
Attributable to:
Equity holders of the Parent Company 284 253
Minority interest 3 3
Earnings per share (EPS), (SEK) 31 12.70 11.15
EPS, after dilution (SEK) 31 12.50 11.00
Dividend per share (SEK) 7.001) 6.00
Average number of shares outstanding after repurchases ('000s) 22,385 22,652
Number of shares outstanding at end of period after repurchases ('000s) 22,208 22,434
1) As proposed by the Board of directors.2) the distribution of cost of sales and selling and administrative expenses was partially revised. the previous year’s figures were adjusted to comply with this.
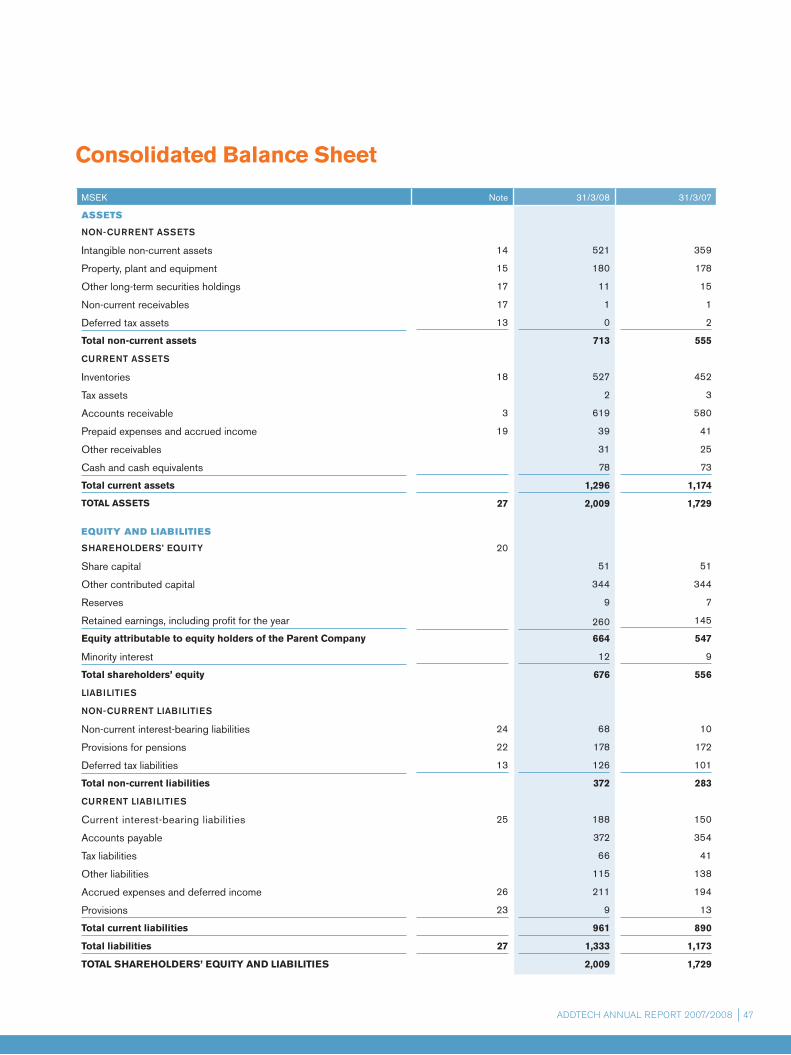
Addtech AnnuAl report 2007/2008 47
Consolidated balance Sheet
MSEK Note 31/3/08 31/3/07
Assets
NON-CuRRENt ASSEtS
Intangible non-current assets 14 521 359
Property, plant and equipment 15 180 178
Other long-term securities holdings 17 11 15
Non-current receivables 17 1 1
Deferred tax assets 13 0 2
Total non-current assets 713 555
CuRRENt ASSEtS
Inventories 18 527 452
Tax assets 2 3
Accounts receivable 3 619 580
Prepaid expenses and accrued income 19 39 41
Other receivables 31 25
Cash and cash equivalents 78 73
Total current assets 1,296 1,174
TOTAL ASSETS 27 2,009 1,729
equity And liAbilities
ShAREhOlDERS’ EquIty 20
Share capital 51 51
Other contributed capital 344 344
Reserves 9 7
Retained earnings, including profit for the year 260 145
Equity attributable to equity holders of the Parent Company 664 547
Minority interest 12 9
Total shareholders’ equity 676 556
lIAbIlItIES
NON-CuRRENt lIAbIlItIES
Non-current interest-bearing liabilities 24 68 10
Provisions for pensions 22 178 172
Deferred tax liabilities 13 126 101
Total non-current liabilities 372 283
CuRRENt lIAbIlItIES
Current interest-bearing liabilities 25 188 150
Accounts payable 372 354
Tax liabilities 66 41
Other liabilities 115 138
Accrued expenses and deferred income 26 211 194
Provisions 23 9 13
Total current liabilities 961 890
Total liabilities 27 1,333 1,173
TOTAL SHAREHOLDERS’ EqUITY AND LIAbILITIES 2,009 1,729

Addtech AnnuAl report 2007/200848
Consolidated Cash Flow Statement
MSEK Note 2007/2008 2006/2007
OPERAtINg ACtIvItIES
Profit after financial items 398 351
Adjustment for items not included in cash flow 29 58 37
Income tax paid -86 -97
Cash flow from operating activities before changes in working capital 370 291
Cash flow from changes in working capital:
Changes in inventories -25 -24
Changes in operating receivables 11 -80
Changes in operating liabilities -32 22
Cash flow from operating activities 324 209
INvEStINg ACtIvItIES
Acquisition of property, plant and equipment -32 -27
Disposal of property, plant and equipment 17 16
Acquisition of intangible non-current assets -14 -14
Acquisition of subsidiaries, net liquidity effect 29 -168 -160
Disposal of subsidiaries, net liquidity effect 29 – 1
Disposal of financial non-current assets 1 1
Cash flow from investing activities -196 -183
FINANCINg ACtIvItIES
Repurchase of own shares -37 -76
Options exercised by employees 3 4
Borrowings 61 115
Repayment of loans -15 -15
Other financing 0 1
Dividend paid to equity holders of the Parent Company -135 -92
Dividend paid to minority interest 0 0
Cash flow from financing activities -123 -63
Cash flow for the year 5 -37
Cash and cash equivalents at beginning of year 73 110
Exchange differences on cash and cash equivalents 0 0
Cash and cash equivalents at year-end 78 73

Addtech AnnuAl report 2007/2008 49
Consolidated Statement of Changes in Equity
MSEK Share capital
Other contributed
capital Reserves
Retained earnings
including net profit for the
year TotalMinority interest Total equity
EqUITY, OPENING bALANCE 1/4/2007 51 344 7 145 547 9 556
Effect of hedge accounting as per IAS 39 – – -2 – -2 – -2
Year’s change in translation reserve – – 4 – 4 0 4
Profit for the year – – – 284 284 3 287
Net changes recognised directly in equity, excl. transactions with equity holders
– – 2 284 286 3 289
Dividend – – – -135 -135 0 -135
Options exercised by employees – – – 3 3 – 3
Repurchase of own shares – – – -37 -37 – -37
EqUITY, CLOSING bALANCE 31/3/2008 51 344 9 260 664 12 676
MSEK Share capital
Other contributed
capital Reserves
Retained earnings
including net profit for the
year TotalMinority interest Total equity
EqUITY, OPENING bALANCE 1/4/2006 51 344 8 56 459 6 465
Effect of hedge accounting as per IAS 39 – – 1 – 1 – 1
Year’s change in translation reserve – – -2 – -2 0 -2
Profit for the year – – – 253 253 3 256
Net changes recognised directly in equity, excl. transactions with equity holders
– – -1 253 252 3 255
Dividend – – – -92 -92 0 -92
Bonus issue 3 – – -3 0 – 0
Cancellation of repurchased shares -3 – – 3 0 – 0
Options exercised by employees – – – 4 4 – 4
Repurchase of own shares – – – -76 -76 – -76
EqUITY, CLOSING bALANCE 31/3/2007 51 344 7 145 547 9 556
For comments on shareholders’ equity, refer to note 20.

Addtech AnnuAl report 2007/200850
Parent Company Income Statement
MSEK Note 2007/2008 2006/2007
Revenue 33 29
Administrative expenses -34 -37
Other operating income 9 0 4
Other operating expenses 9 -3 0
Operating loss 6–9, 16 -4 -4
Profit from shares in Group companies 11 325 450
Interest income and similar items 11 23 12
Interest expense and similar items 11 -20 -11
Profit after financial items 324 447
Year-end appropriations 12 -50 -47
Profit before tax 274 400
Income tax expense 13 -51 -36
Profit for the year 223 364

Addtech AnnuAl report 2007/2008 51
Parent Company balance Sheet
MSEK Note 31/3/08 31/3/07
Assets
NON-CuRRENt ASSEtS
Intangible non-current assets 14 2 0
Property, plant and equipment 15 1 0
Financial non-current assets
Shares in Group companies 17 1,016 1,006
Receivables from Group companies 17 381 209
Other non-current securities holdings 17 5 9
Other non-current receivables 0 0
Total financial non-current assets 1,402 1,224
Total non-current assets 1,405 1,224
CuRRENt ASSEtS
Receivables from Group companies 308 286
Prepaid expenses and accrued income 19 3 5
Total current receivables 311 291
Cash and cash equivalents 33 25
Total current assets 344 316
TOTAL ASSETS 27 1,749 1,540
equity And liAbilities
ShAREhOlDERS’ EquIty 20
Restricted equity
Share capital 51 51
Legal reserve 16 16
Unrestricted equity
Retained earnings 679 477
Profit for the year 223 364
TOTAL SHAREHOLDERS’ EqUITY 969 908
uNtAxED RESERvES 21 174 124
PROvISIONS
Provisions for pensions and similar obligations 22, 28 9 9
lIAbIlItIES
Liabilities to credit institutions 24 57 –
Liabilities to Group companies 24 10 70
Total non-current liabilities 27 67 70
Liabilities to credit institutions 25 169 146
Accounts payable 0 1
Liabilities to Group companies 294 238
Tax liabilities 47 17
Other liabilities 3 8
Accrued expenses and deferred income 26 17 19
Total current liabilities 27 530 429
TOTAL SHAREHOLDERS’ EqUITY AND LIAbILITIES 1,749 1,540
Pledged assets 28 0 0
Contingent liabilities 28 157 150
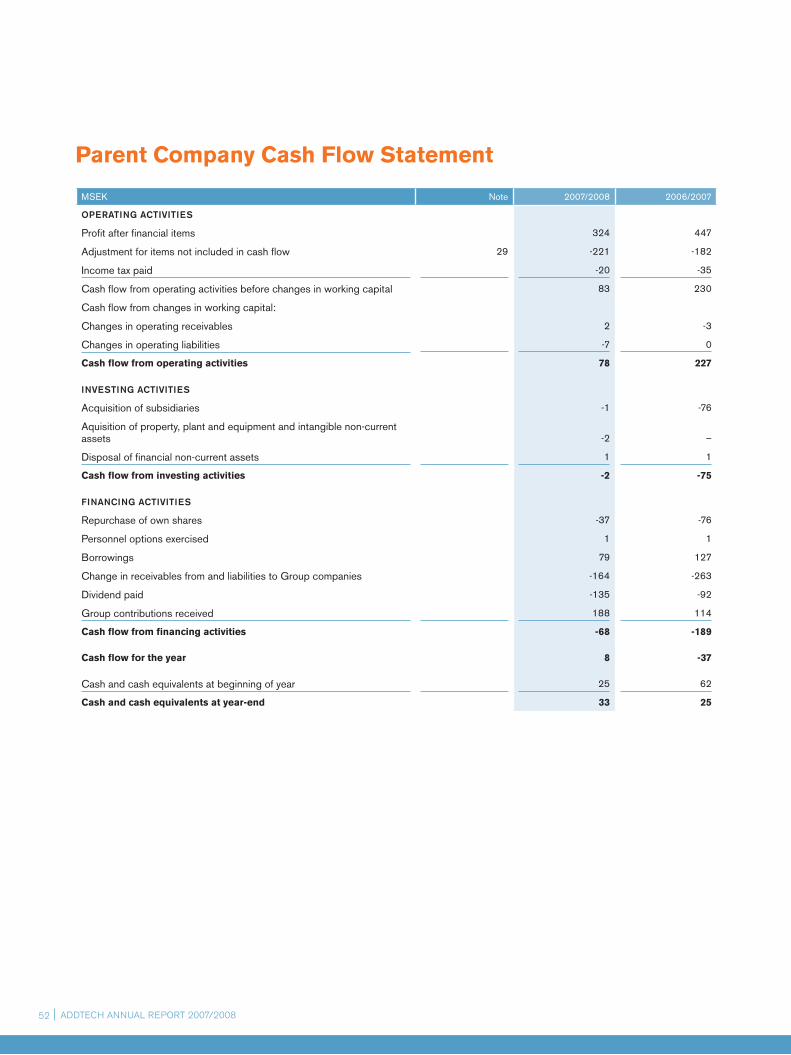
Addtech AnnuAl report 2007/200852
Parent Company Cash Flow Statement
MSEK Note 2007/2008 2006/2007
OPERAtINg ACtIvItIES
Profit after financial items 324 447
Adjustment for items not included in cash flow 29 -221 -182
Income tax paid -20 -35
Cash flow from operating activities before changes in working capital 83 230
Cash flow from changes in working capital:
Changes in operating receivables 2 -3
Changes in operating liabilities -7 0
Cash flow from operating activities 78 227
INvEStINg ACtIvItIES
Acquisition of subsidiaries -1 -76
Aquisition of property, plant and equipment and intangible non-current assets
-2
–
Disposal of financial non-current assets 1 1
Cash flow from investing activities -2 -75
FINANCINg ACtIvItIES
Repurchase of own shares -37 -76
Personnel options exercised 1 1
Borrowings 79 127
Change in receivables from and liabilities to Group companies -164 -263
Dividend paid -135 -92
Group contributions received 188 114
Cash flow from financing activities -68 -189
Cash flow for the year 8 -37
Cash and cash equivalents at beginning of year 25 62
Cash and cash equivalents at year-end 33 25
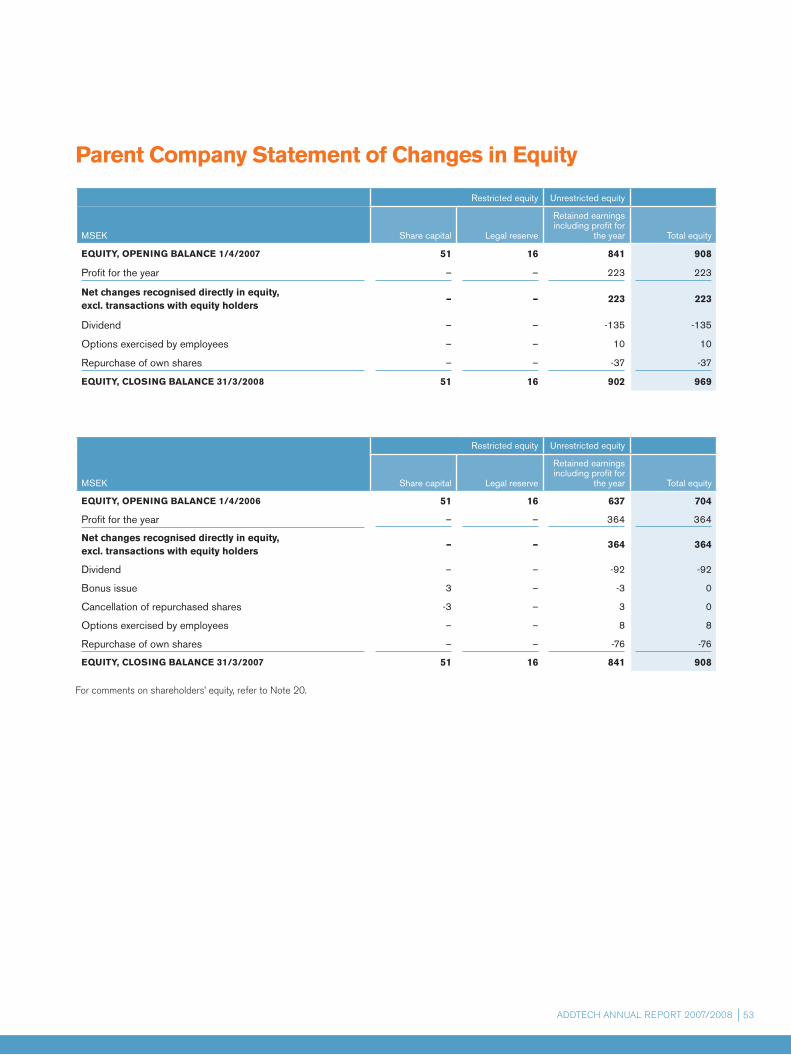
Addtech AnnuAl report 2007/2008 53
Parent Company Statement of Changes in Equity
Restricted equity Unrestricted equity
MSEK Share capital Legal reserve
Retained earnings including profit for
the year Total equity
EqUITY, OPENING bALANCE 1/4/2006 51 16 637 704
Profit for the year – – 364 364
Net changes recognised directly in equity, excl. transactions with equity holders
– – 364 364
Dividend – – -92 -92
Bonus issue 3 – -3 0
Cancellation of repurchased shares -3 – 3 0
Options exercised by employees – – 8 8
Repurchase of own shares – – -76 -76
EqUITY, CLOSING bALANCE 31/3/2007 51 16 841 908
For comments on shareholders’ equity, refer to note 20.
Restricted equity Unrestricted equity
MSEK Share capital Legal reserve
Retained earnings including profit for
the year Total equity
EqUITY, OPENING bALANCE 1/4/2007 51 16 841 908
Profit for the year – – 223 223
Net changes recognised directly in equity, excl. transactions with equity holders
– – 223 223
Dividend – – -135 -135
Options exercised by employees – – 10 10
Repurchase of own shares – – -37 -37
EqUITY, CLOSING bALANCE 31/3/2008 51 16 902 969

Addtech AnnuAl report 2007/200854
noteS
Note 1 Accounting and valuation policies
general accounting policiesthe annual report was prepared as per eu-approved International Financial reporting Standards (IFrS) issued by the International Accounting Standards Board (IASB) and interpretation statements from the International Financial reporting Interpretations commit-tee (IFrIc). recommendation rr 30:06 Supplementary Accounting Standards for Groups, of the Swedish Financial reporting Board (formerly the Swedish Financial Accounting Standards council) was also applied. As per its listing agreement with the oMX nordic exchange Stockholm, the Group also provides information about outstanding incentive programmes and benefits for members of senior management. the parent company’s and the Group’s accounting policies are consistent with each other, except in the case of reporting pensions, untaxed reserves and year-end appropria-tions. See also “Accounting policies of the parent company”. the parent company’s annual report and the consolidated financial statements were approved for issue by the Board of directors on 16 June 2008. the parent company’s and the Group’s consolidated income statements and balance sheets will be submitted for adop-tion to the Annual General Meeting on 25 August 2008.
Presentation of the Annual Report the financial reports are stated in million Swedish kronor (MSeK) unless otherwise stated. the parent company’s functional currency is Swedish kronor, which also constitutes the functional currency for the parent company and the Group. Assets and liabilities are recognised at historical acquisition cost, except for certain financial assets and liabilities that are reported at fair value. Assets held for sale are recognised at the lower of the previous carrying amount and fair value, less selling expenses. preparing financial reports according to IFrS requires that management make judg-ments, estimates and assumptions that affect the application of the accounting policies and the amounts recognised for assets, liabilities, revenues and costs. these estimates and as-sumptions are based on historical experience and numerous other factors deemed reasonable under the circumstances at the time. estimates and assumptions are reviewed periodically. the annual report was prepared as per IAS 1 presentation of Financial Statements, such that separate income statements and balance sheets, and statements of changes in shareholders’ equity and cash flow, are prepared and notes are provided that detail disclo-sures and the accounting policies applied. Assets are divided into current assets and non-current assets. An asset is considered to be current if it is expected to be realised within 12 months of the balance sheet date or within the company’s operating cycle. “operating cycle” refers to the time elapsed, from the start of production, until the company receives payment for goods or services delivered. the Group’s operating cycle is judged to be less than one year. If an asset does not fulfil the current asset requirement, it is classified as a non-current asset. receivables and liabilities, as well as revenue and costs, are only offset if required or if expressly permitted under IFrS. In note 27, assets are divided into those with amounts expected to be recovered within 12 months of the balance sheet date and those after 12 months. liabilities are divided into current liabilities and non-current liabilities. current liabilities are liabilities that are to be paid within 12 months of the balance sheet date or, in the case of operational liabilities only, are expected to be paid within the operating cycle. As this takes into account the operating cycle, no non-interest-bearing liabilities, such as accounts pay-able and accrued personnel costs, are recognised as non-current liabilities. note 27 details the amounts of liabilities to be paid within 12 months of the balance sheet date and those payable after 12 months. Early application of IFRSs and interpretations issued or revised during Ad-dtech’s 2007/2008 financial yearno newly issued IFrSs or interpretations were applied early.
New or revised IFRSs that will be adopted during the next periodduring the 2007/2008 financial year, IFrS 7 replaced the disclosure requirements in IAS 32 concerning financial instruments. Along with related amendments in IAS 1, this entailed additional disclosure requirements regarding the Group’s financial instruments and capital. no material effects on results of operations or financial position occurred upon applica-tion of the new or revised IFrSs and interpretations.
Amendment to the Swedish Annual Accounts Actchanges to chapters 5 and 7 of the Annual Accounts Act mean, among other things, that data about salaries and other remuneration, pensions and similar benefits, must be disclosed for each of the Board directors and the president of the parent company. Information about salaries and other remuneration, pensions and similar benefits to Board of directors, presi-dents and people in equivalent positions must be provided. this applies to all companies in
the Group. In this respect, members of Addtech’s senior management include the Board of directors, president and Group management of Addtech AB, and the Board of directors, Managing directors and vice Managing directors of the subsidiaries.
Consolidated financial statements the consolidated financial statements comply with IAS 27 consolidated and Separate Financial Statements and IFrS 3, Business combinations and include the financial state-ments for the parent company and those companies in which the parent company has a direct or indirect controlling influence. Such influence exists when the parent company, directly or indirectly, is entitled to govern a company’s financial and operative strategies to obtain economic benefits. normally this means that the parent company holds more than 50 percent of the voting rights. Shareholdings in Group companies were eliminated based on the purchase method; in brief, this means that identifiable assets, liabilities and contingent liabilities in the company acquired are valued and reported in the consolidated financial statements as if they had been acquired directly by purchase and not indirectly by acquisition of the company’s shares. the valuation is based on fair values. If the value of the net assets is less than the acquisition price, consolidated goodwill arises. If the opposite occurs, the difference is recognised directly in the income statement. Goodwill is determined in local currency and is recognised at acquisition cost, less any impairment losses. consolidated equity includes the parent com-pany’s equity and the part of subsidiaries’ equity that was earned after the time of acquisition. companies acquired or disposed of are consolidated or deconsolidated, respectively, from the date of acquisition or disposal. Intra-Group receivables and liabilities and transactions between companies in the Group, as well as related unrealised gains, are eliminated in their entirety. unrealised losses are eliminated in the same way as unrealised gains, except in the case of impairment.
Exchange rate effects Translation of the financial reports of foreign Group companies Assets and liabilities in foreign operations, including goodwill and other Group surpluses and deficits, are converted to Swedish kronor using the exchange rate prevailing at the balance sheet date. revenue and costs in foreign businesses are converted to Swedish kronor using the average rate, which is an approximation of the rates prevailing at the time of each trans-action. translation differences that arise in converting the currency of figures for foreign op-erations are charged directly to equity as a foreign currency translation reserve. this reserve contains translation differences accumulated from 1 April 2004, when IFrS were adopted.
Transactions denominated in foreign currencies A transaction denominated in a foreign currency is converted to the functional currency at the rate of exchange at the transaction date. Monetary assets and liabilities in foreign currency are converted to the functional currency using the rate prevailing at the balance sheet date. non-monetary assets and liabilities recognised at historical acquisition cost are recalculated using the exchange rate at the time of the transaction. exchange differences that arise in conversion are recognised in the income statement. exchange differences on operating receivables and operating liabilities are included in operating profit or loss, while exchange differences on financial receivables and liabilities are recognised among financial items. the Group uses forward exchange contracts to a certain extent to reduce its expo-sure to exchange rate fluctuations. Forward exchange contracts are carried at fair value at the balance sheet date.
Financial assets and liabilities, recognition and derecognitionFinancial instruments recognised among assets in the balance sheet include cash and cash equivalents, loan receivables, accounts receivable, financial investments and derivatives. the liabilities include accounts payable, loan liabilities and derivatives. A financial asset or financial liability is recognised in the balance sheet when the company becomes a party to the terms and conditions of the instrument. Accounts receivable are entered in the balance sheet when an invoice has been sent. A liability is entered when the counterparty has com-pleted its undertaking and a contractual obligation to pay exists, even if no invoice has yet been received. A financial asset (or part thereof) is removed from the balance sheet when the rights in the contract are realised or expire or the company loses control over them. A financial liability (or part thereof) is removed from the balance sheet when the obligation in the contract is fulfilled or in some other way ceases to exist. A financial asset and a financial liability are only offset and recognised at the net amount in the balance sheet when the company is legally entitled to offset their amounts and the company intends to settle the items with a net amount or simultaneously realise the asset and settle the liability.
Financial assets and liabilities, valuation and classificationFinancial instruments are valued and recognised in the Group as per IAS 39. A financial instrument that is not a derivative is initially recognised at acquisition cost, equivalent to the instrument’s fair value plus transaction costs; this applies to all financial instruments except those in the category of financial assets, which are recognised at fair value in the income statement. When first recognised, a financial instrument is classified based on the purpose for which the instrument was acquired. the classification determines how the financial instrument is valued after initial reporting, as described below.
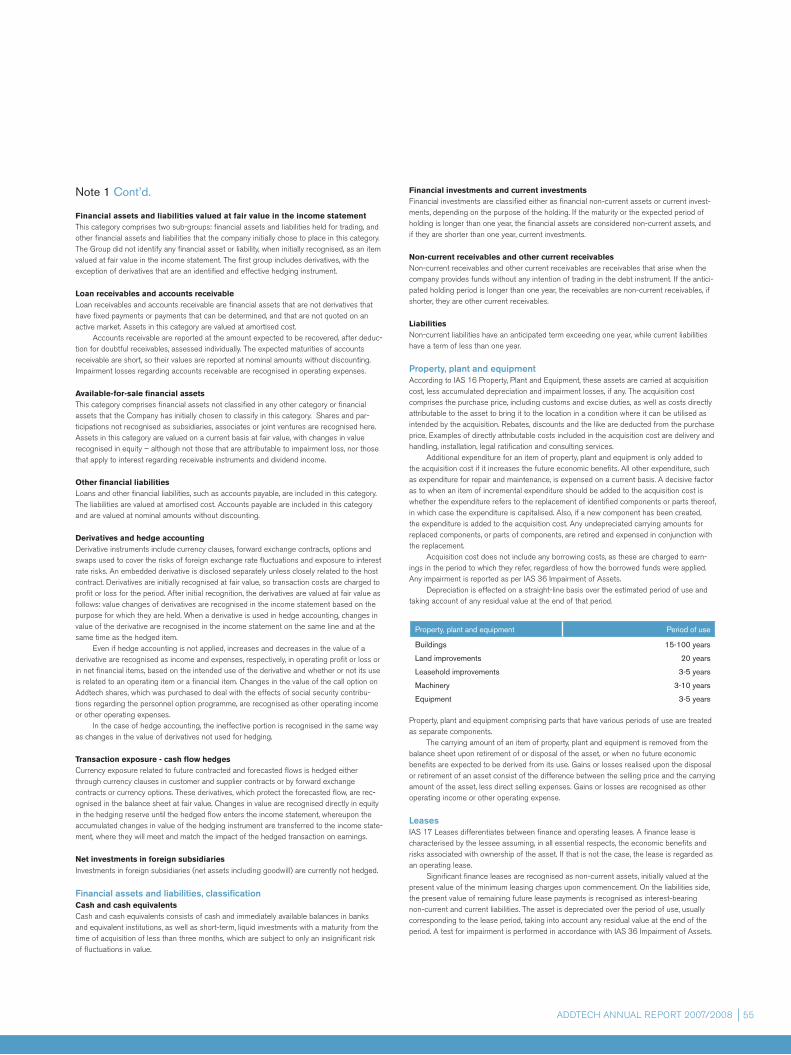
Addtech AnnuAl report 2007/2008 55
Note 1 Cont’d.
Financial assets and liabilities valued at fair value in the income statementthis category comprises two sub-groups: financial assets and liabilities held for trading, and other financial assets and liabilities that the company initially chose to place in this category. the Group did not identify any financial asset or liability, when initially recognised, as an item valued at fair value in the income statement. the first group includes derivatives, with the exception of derivatives that are an identified and effective hedging instrument.
Loan receivables and accounts receivableloan receivables and accounts receivable are financial assets that are not derivatives that have fixed payments or payments that can be determined, and that are not quoted on an active market. Assets in this category are valued at amortised cost. Accounts receivable are reported at the amount expected to be recovered, after deduc-tion for doubtful receivables, assessed individually. the expected maturities of accounts receivable are short, so their values are reported at nominal amounts without discounting. Impairment losses regarding accounts receivable are recognised in operating expenses.
Available-for-sale financial assetsthis category comprises financial assets not classified in any other category or financial assets that the company has initially chosen to classify in this category. Shares and par-ticipations not recognised as subsidiaries, associates or joint ventures are recognised here. Assets in this category are valued on a current basis at fair value, with changes in value recognised in equity – although not those that are attributable to impairment loss, nor those that apply to interest regarding receivable instruments and dividend income.
Other financial liabilitiesloans and other financial liabilities, such as accounts payable, are included in this category. the liabilities are valued at amortised cost. Accounts payable are included in this category and are valued at nominal amounts without discounting.
Derivatives and hedge accountingderivative instruments include currency clauses, forward exchange contracts, options and swaps used to cover the risks of foreign exchange rate fluctuations and exposure to interest rate risks. An embedded derivative is disclosed separately unless closely related to the host contract. derivatives are initially recognised at fair value, so transaction costs are charged to profit or loss for the period. After initial recognition, the derivatives are valued at fair value as follows: value changes of derivatives are recognised in the income statement based on the purpose for which they are held. When a derivative is used in hedge accounting, changes in value of the derivative are recognised in the income statement on the same line and at the same time as the hedged item. even if hedge accounting is not applied, increases and decreases in the value of a derivative are recognised as income and expenses, respectively, in operating profit or loss or in net financial items, based on the intended use of the derivative and whether or not its use is related to an operating item or a financial item. changes in the value of the call option on Addtech shares, which was purchased to deal with the effects of social security contribu-tions regarding the personnel option programme, are recognised as other operating income or other operating expenses. In the case of hedge accounting, the ineffective portion is recognised in the same way as changes in the value of derivatives not used for hedging.
Transaction exposure - cash flow hedgescurrency exposure related to future contracted and forecasted flows is hedged either through currency clauses in customer and supplier contracts or by forward exchange contracts or currency options. these derivatives, which protect the forecasted flow, are rec-ognised in the balance sheet at fair value. changes in value are recognised directly in equity in the hedging reserve until the hedged flow enters the income statement, whereupon the accumulated changes in value of the hedging instrument are transferred to the income state-ment, where they will meet and match the impact of the hedged transaction on earnings.
Net investments in foreign subsidiariesInvestments in foreign subsidiaries (net assets including goodwill) are currently not hedged.
Financial assets and liabilities, classificationCash and cash equivalentscash and cash equivalents consists of cash and immediately available balances in banks and equivalent institutions, as well as short-term, liquid investments with a maturity from the time of acquisition of less than three months, which are subject to only an insignificant risk of fluctuations in value.
Financial investments and current investmentsFinancial investments are classified either as financial non-current assets or current invest-ments, depending on the purpose of the holding. If the maturity or the expected period of holding is longer than one year, the financial assets are considered non-current assets, and if they are shorter than one year, current investments.
Non-current receivables and other current receivablesnon-current receivables and other current receivables are receivables that arise when the company provides funds without any intention of trading in the debt instrument. If the antici-pated holding period is longer than one year, the receivables are non-current receivables, if shorter, they are other current receivables.
Liabilitiesnon-current liabilities have an anticipated term exceeding one year, while current liabilities have a term of less than one year.
Property, plant and equipment According to IAS 16 property, plant and equipment, these assets are carried at acquisition cost, less accumulated depreciation and impairment losses, if any. the acquisition cost comprises the purchase price, including customs and excise duties, as well as costs directly attributable to the asset to bring it to the location in a condition where it can be utilised as intended by the acquisition. rebates, discounts and the like are deducted from the purchase price. examples of directly attributable costs included in the acquisition cost are delivery and handling, installation, legal ratification and consulting services. Additional expenditure for an item of property, plant and equipment is only added to the acquisition cost if it increases the future economic benefits. All other expenditure, such as expenditure for repair and maintenance, is expensed on a current basis. A decisive factor as to when an item of incremental expenditure should be added to the acquisition cost is whether the expenditure refers to the replacement of identified components or parts thereof, in which case the expenditure is capitalised. Also, if a new component has been created, the expenditure is added to the acquisition cost. Any undepreciated carrying amounts for replaced components, or parts of components, are retired and expensed in conjunction with the replacement. Acquisition cost does not include any borrowing costs, as these are charged to earn-ings in the period to which they refer, regardless of how the borrowed funds were applied. Any impairment is reported as per IAS 36 Impairment of Assets. depreciation is effected on a straight-line basis over the estimated period of use and taking account of any residual value at the end of that period.
Property, plant and equipment Period of use
Buildings 15-100 years
Land improvements 20 years
Leasehold improvements 3-5 years
Machinery 3-10 years
Equipment 3-5 years
property, plant and equipment comprising parts that have various periods of use are treated as separate components. the carrying amount of an item of property, plant and equipment is removed from the balance sheet upon retirement of or disposal of the asset, or when no future economic benefits are expected to be derived from its use. Gains or losses realised upon the disposal or retirement of an asset consist of the difference between the selling price and the carrying amount of the asset, less direct selling expenses. Gains or losses are recognised as other operating income or other operating expense.
leases IAS 17 leases differentiates between finance and operating leases. A finance lease is characterised by the lessee assuming, in all essential respects, the economic benefits and risks associated with ownership of the asset. If that is not the case, the lease is regarded as an operating lease. Significant finance leases are recognised as non-current assets, initially valued at the present value of the minimum leasing charges upon commencement. on the liabilities side, the present value of remaining future lease payments is recognised as interest-bearing non-current and current liabilities. the asset is depreciated over the period of use, usually corresponding to the lease period, taking into account any residual value at the end of the period. A test for impairment is performed in accordance with IAS 36 Impairment of Assets.

Addtech AnnuAl report 2007/200856 Addtech AnnuAl report 2007/200856
Note 1 Cont’d.
lease payments are divided into interest and amortisation of the liability. other lease obligations are reported as per rules for operating leases, such that leasing charges are expensed as an operating expense on a straight-line basis during the lease period.
Intangible non-current assets Intangible non-current assets are recognised in accordance with IAS 38 Intangible Assets at acquisition cost, less accumulated amortisation, and are divided between goodwill and other intangible non-current assets. Any impairment of intangible assets is recognised as per IAS 36 Impairment of Assets. An intangible asset is an identifiable non-monetary asset, without physical substance, that is used for marketing, producing or supplying goods or services, or for rental and administration. to be recognised as an asset, it must be probable that the future economic benefits attributable to the asset will benefit the company and that the acquisition cost can be calculated reliably. Additional expenditure for an intangible asset is only added to the acquisition cost if it increases future economic benefits beyond the original assessment and if the expenditure can be calculated reliably. All other expenditure is expensed as it is incurred. Goodwill represents the difference between the acquisition cost, in connection with a corporate acquisition, and the fair value of acquired assets, assumed liabilities and contin-gent liabilities. In the case of acquisitions occurring before 1 April 2004, goodwill has been recognised, after testing for impairment, at acquisition cost corresponding to carrying amount as applied in previous accounting policies. the classification and accounting treatment of corporate acquisitions that occurred before 1 April 2004 were not reassessed based on IFrS 3 when the Group’s opening balance as of 1 April 2004 was calculated in accordance with IFrS. Goodwill and intangible non-current assets with indefinable periods of use are valued at acquisition cost, less any accumulated impairment losses. Goodwill and intangible non-current assets with indefinable periods of use are allocated among cash-generating units and are not amortised but are tested for impairment on an annual basis. Intangible assets aside from goodwill are recognised at their original acquisition costs, less accumulated amortisation and impairments losses. Amortisation is charged on a straight-line basis and is based on the period of use of the assets, which is reviewed on an annual basis. periods of use are based on historical experience of use of similar assets, areas of application and other specific features of the asset. Amortisation is included in cost of sales, selling expenses or administrative expenses, depending on where in the business the assets are used. development expenses, in which the results of research or other knowledge are applied to achieve new or improved products or processes, are reported as an asset in the balance sheet if the product is technically and commercially viable and the company has suf-ficient resources to complete development and subsequently use or sell the intangible asset. other development expenditure is expensed as it is incurred. expenditure for internally generated goodwill and trademarks is recognised in the income statement as an expense as it is incurred.
Intangible non-current assets Period of use
Capitalised development projects 3 years
Software for IT operations 3-5 years
Trademarks indeterminable
Supplier relationships 10-33 years
Technology 5-15 years
Customer relationships 5-10 years
Goodwill, trademarks and other intangible assets with an indefinable period of use are tested for impairment on an annual basis or as soon as there are indications that the asset in question has diminished in value.
Impairment lossesProperty, plant and equipment, intangible assets and shares in subsidiaries and associatesthe carrying amounts of the Group’s assets are checked at each balance sheet date to ascertain whether there are any indications of impairment. If such indication exists, impair-ment is determined after calculating the recoverable amount of the asset, which is the higher of an asset’s net realisable value and its value in use. Impairment loss is recognised if the recoverable amount is less than the carrying amount. the value in use is calculated as the present value of future payments that the company is expected to receive by using the
asset. the estimated residual value at the end of the period of use is included in the value in use. If the recoverable amount of an individual asset cannot be determined, the recoverable amount is instead set at the recoverable amount for the cash-generating unit to which the asset belongs. A cash-generating unit is the smallest group of assets that give rise to con-tinuous payment surpluses independent of other assets or groups of assets. Group goodwill is attributable to the cash-generating unit to which the goodwill is linked. Impairment losses are reversed when the impairment, wholly or partly, no longer exists. however, this does not apply to goodwill and intangible non-current assets with indefinable periods of use. For goodwill and other intangible assets with indefinable periods of use and for intangible assets not yet ready for use, the recoverable amount is calculated annually.
Financial assetsWhen accounts are prepared for reporting, the company assesses whether there is objec-tive evidence that any financial asset or group of assets is impaired. the recoverable amount of loan receivables and accounts receivable recognised at amortised cost is calculated as the present value of future cash flows discounted by the effective interest rate prevailing when the asset was first recognised. Assets with short maturities are not discounted. An impairment loss is charged to the income statement.
InventoriesInventories are carried at the lower of acquisition cost and net realisable value, which takes the risk of obsolescence into account. the acquisition cost is calculated using the first-in, first-out (FIFo) principle or weighted average prices. In the case of finished and semi-finished goods manufactured in-house, the acquisition cost comprises direct manufacturing costs and a reasonable portion of indirect manufactur-ing costs. normal capacity utilisation is assumed in the valuation.
Shareholders’ equityWhen own shares are repurchased, the entire purchase price reduces shareholders’ equity. proceeds from the disposal of equity instruments are recognised as an increase in share-holders’ equity. Any transaction costs are recognised in equity.
Employee benefitsemployee benefits are recognised in the consolidated financial statements as per IAS 19 employee Benefits.
Employee benefits after termination of employment, pension obligationsthe recommendation differentiates between defined-contribution pension plans and de-fined-benefit pension plans. In defined-contribution plans, the company pays stipulated fees to a separate legal entity and has no obligation to pay additional fees. costs are charged to the Group’s profit or loss at the rate at which the benefits are earned. In defined-benefit pension plans, benefits are paid to employees and former employees based on salary at the time of retirement and the number of years of service. the Group bears the risk for payment of promised benefits. the Group’s net obligation to defined-benefit plans is calculated individually for each plan by estimating future benefits that employees have earned through employment in current and previous periods. these benefits are discounted to a present value, less any unreported costs related to service in previous periods and the fair value of any plan assets. defined-benefit pension plans are both funded and unfunded. When the plans are funded, assets have been separated into plan assets. these plan assets may only be used to pay benefits as per the pension agreements. the net value of the estimated present value of the obligations and the fair value of the plan assets is recognised in the balance sheet, either as a provision or as a non-current financial receivable. When a surplus in a plan cannot be fully utilised, only the portion of the surplus that the company can recover through reduced future fees or repayments is recognised. A surplus in one plan is only offset by a deficit in another plan if the company is entitled to utilise a surplus in one plan to settle a deficit in another plan, or if the obligations are intended to be settled on a net basis. the pension cost and pension obligation for defined-benefit pension plans are calcu-lated using the projected unit credit Method. this method distributes the cost of pensions at the rate at which employees perform services for the company that increase their right to future benefits. the intention is that expected future pension payouts shall be expensed in a manner that provides an even expense over the employee’s period of employment. Anticipated future salary increases and anticipated inflation are taken into consideration in the calculation. the company’s obligation is calculated annually by independent actuaries. the discount rate used is equivalent to the interest rate on first-class corporate bonds or, alternatively, government bonds with a maturity equivalent to the average maturity of the obligations and the currency.
Addtech AnnuAl report 2007/2008 57Addtech AnnuAl report 2007/2008 57
Note 1 Cont’d.
Actuarial gains and losses may arise when establishing the obligation’s present value and fair value on plan assets. these may arise either because the actual outcome differs from previously made assumptions, or because assumptions were changed. to avoid major changes in pension costs between years, changes within certain limits (the “corridor”) are disregarded in the income statement and balance sheet. With the corridor, actuarial gains and losses affect consolidated profit/loss only to the extent they exceed the higher of 10% of the present value of the pension obligation and 10% of the fair value of the plan assets. the portion of the accumulated actuarial gains and losses, at the end of the previous year, that exceeds 10% of the larger of the present value of the obligations and fair value of the plan assets is recognised in profit/loss during the expected average remaining service period of those employees covered by the plan. the reported return on plan assets refers to the estimated return at the start of the year and therefore normally differs from the actual return during the year. the difference is an actuarial gain or loss. A portion of the Group’s defined-benefit pension obligations has been financed by pre-miums to Alecta. the required information cannot be obtained from Alecta, so these pension obligations are reported as a defined-contribution pension plan. When the cost of a pension for a legal entity is determined differently than for the Group, a provision or claim for taxes on pension costs is recognised, such as a special employer’s contribution for Swedish companies based on this difference. the present value of the provi-sion or claim is not calculated.
benefits upon termination of employmentA cost for benefits in conjunction with termination of employment is only recognised if the company is obliged by a formal, detailed plan to terminate employment prior to the normal date.
Short-term benefitsShort-term benefits to employees are calculated without discounting and recognised as an expense when the related services are performed. A provision for the expected costs of bonus disbursements is recognised when the Group has a valid legal or informal obligation to make such payments as a result of services received from employees and where the obligation can be calculated reliably.
Share-based payment In december 2001, the Board of directors awarded personnel options to a number of senior managers in the Group. In accordance with transitional provisions in IFrS 1, Addtech’s personnel option programme is not reported as per IFrS 2 except for options newly awarded during the 2005/2006 financial year. In the case of the newly awarded options, the programme is expensed on a current basis until the vesting period has ended. the options were valued at fair value, using the Black-Scholes model, at the time they were awarded.
Provisions, contingent liabilities and contingent assetsA provision is recognised in the balance sheet when the company has a formal or informal obligation as a consequence of a transpired event, and where it is probable that an outflow of resources will be required to settle the obligation, and an accurate estimate of the amount can be made. If the effect is significant, the present value of the provision is calculated. provisions are entered for future costs resulting from warranty undertakings. the calculation is based on expenditure during the financial year for similar undertakings or the estimated costs for each undertaking. provisions for restructuring costs are recognised when a detailed restructuring plan has been adopted and the restructuring has either begun or been announced publicly. contingent liabilities are recognised when possible undertakings exist that stem from events that have occurred, and where the existence of the undertaking is confirmed only by the occurrence or non-occurrence of one or more uncertain future events that are not entirely within the company’s control. other obligations are also recognised as contingent liabilities if they result from events that have occurred but are not recognised as a liability or provision because it is unlikely that an outflow of resources will be required to settle the undertaking or because the size of the undertaking cannot be determined with sufficient accuracy.
Revenue recognitionSales revenue and revenue from projects in progress are recognised as per IAS 18 revenue. the fair value of what has been obtained, or what will be obtained, is recognised as sales revenue. thus, the company recognises revenue at the amount of the invoice if the company receives cash compensation in conjunction with delivery. deductions are made for value-added tax, returns, discounts and price reductions. revenue from sales of goods is recognised when certain requirements have been met. these requirements are that material risks and benefits associated with ownership of the goods have been transferred to the pur-chaser, that the selling company does not retain any interest in ongoing administration nor does it exert any real control over the goods sold, that the revenue can be calculated reliably, that it is likely that the economic benefits that the company will obtain from the transaction will accrue to the company, and that the expenses that have arisen or are expected to arise as a result of the transaction can be calculated reliably.
revenue from projects in progress is recognised gradually as projects are completed. the degree of completion is determined on the basis of accumulated project expenses at the end of the period as a proportion of estimated total project expenses. If future costs to complete a project are estimated to exceed remaining revenue, a provision is made to cover estimated losses. rental income is recognised on a straight-line basis in the income statement based on the terms of the lease.
Financial income and expensesInterest income on receivables and interest expense on liabilities are computed using the effective interest rate method. the effective rate is the interest rate that makes the present value of all future receipts and payments during the period of fixed interest equal to the car-rying amount of the receivable or liability. Issue costs and similar direct transaction costs to raise loans are charged to profit/loss in the period to which they are attributable, regardless of how the borrowed funds were used. the Group does not capitalise interest in the acquisi-tion cost of assets. on an accrual basis, interest income includes any rebates, premiums and other differences between the original value of the receivable and the amount received upon maturity. Interest and dividends are recognised as revenue when it is probable that the economic benefits associated with the transaction will accrue to the company and that the income can be calculated reliably. Interest income is recognised applying the interest rate that generates an even return on the asset in question. dividend income is recognised when the shareholder’s right to receive dividend is deemed certain.
Income taxesIncome tax is recognised as per IAS 12 Income taxes. It is reported in the income state-ment, except when the underlying transaction is recognised directly in equity, in which case the associated tax effect is also reported in equity. current tax refers to tax that is to be paid or refunded for the current year. this also includes adjustments of current tax attributable to prior periods. deferred tax is computed according to the balance sheet method based on temporary differences between carrying amounts and tax bases of assets and liabilities. the amounts are computed depending on how the temporary differences are expected to be settled and by applying the tax rates and tax rules in effect or announced as of the balance sheet date. temporary differences are not taken into account for Group goodwill, nor in differences attrib-utable to participations in subsidiaries or associates owned by Group companies outside Swe-den that are not expected to be taxed in the foreseeable future. In the consolidated financial statements, untaxed reserves are allocated to deferred tax liability and shareholders’ equity. deferred tax assets related to deductible temporary differences and tax loss carry-forwards are only recognised to the extent it is likely they will reduce tax payments in the future.
Segment reportingthe Group’s operations are described as per IAS 14 Segment reporting - business seg-ments and geographical segments. consequently, operations are divided into primary and secondary segments. Assets and liabilities as well as revenue and costs are attributed to the segment where they are used, earned and consumed, respectively. the division into primary segments is based on the business area organisation, by which the Group’s operations are managed and followed up. these are Addtech compo-nents, Addtech energy & equipment, Addtech Industrial Solutions and Addtech life Science. operations that do not belong to these business areas are included under the heading parent company and Group items. the division into secondary segments is based on the countries in which the Group con-ducts business. these countries are Sweden, Finland, denmark, norway and other countries.
Earnings per shareAddtech reports earnings per share (epS) in direct relation to the income statement. calculation of epS is based on profit or loss for the year in the Group attributable to equity holders of the parent company and on the weighted average number of shares outstanding during the year. to calculate epS after dilution, the average number of shares is adjusted to take into account effects from diluting potential common shares that result from options awarded to employees during reported periods.
Cash flow statementIn preparing the cash flow statement, the indirect method as per IAS 7 Statement of cash Flows was applied. In addition to flows of cash and bank funds, current investments matur-ing in less than three months from the acquisition date that can be converted into bank deposits at an amount known beforehand are classified as cash and cash equivalents.
Events after the balance sheet dateevents that occurred after the balance sheet date but whose circumstances were identifi-able at the balance sheet date are taken into account in the financial statements. If signifi-cant events occur after the balance sheet date but do not affect the recognised results of operations or financial position, the event will be reported under a separate heading in the administration report and in a note.

Addtech AnnuAl report 2007/200858 Addtech AnnuAl report 2007/200858
Note 1 Cont’d.
Related party disclosuresInformation about transactions and agreements with closely related companies and natural persons is reported in accordance with IAS 24 related party disclosures. In the consoli-dated financial statements, intra-group transactions fall outside the reporting requirement.
Changes in accounting policiesWhen there is a change in accounting policy, comparative figures are restated, unless otherwise prescribed by IAS 8 Accounting policies, changes in Accounting estimates and errors. If a change in accounting policy affects shareholders’ equity, the effect is recognised on a separate line in the statement of changes in equity.
government grantsGovernment grants refers to support from the government in the form of transfers of resources to a company in exchange for the company fulfilling (in the past or future) certain conditions regarding its operations. the Group is active in areas where government grants are insignificant in scope.
Personnel informationthe Swedish Annual Accounts Act requires more information than stipulated in IFrS, includ-ing information about absence due to illness among employees and the gender distribution among members of the Board of directors and senior management. data on gender distribution refer to the situation at the balance sheet date. here, “members of the Board of directors” are directors, elected by a general meeting of share-holders, in the parent company and directors in business area parent companies reporting directly to the parent company. “Members of senior management” are people in Group management, presidents and executive vice presidents in Group companies.
Accounting policies of the Parent Companythe parent company applies the same accounting policies as the Group does, except where the Swedish Annual Accounts Act and the Swedish Act on Safeguarding pension obliga-tions prescribe different procedures for the parent company. the parent company prepared its annual accounts in accordance with the Swedish Annual Accounts Act (1995:1554) and standard rr 32:06 Accounting for legal entities, of the Swedish Financial reporting Board (formerly the Swedish Financial Accounting Standards council). rr 32:06 prescribes that, in the annual accounts for its legal entity, the parent company must apply all eu-approved IFrS and standard interpretations to the greatest extent possible within the scope of the Annual Accounts Act and taking account of the relationship between reporting and taxation. the recommendation spells out which exceptions from and additions to IFrS must be made. Shares in Group companies are recognised in the parent company using the cost method. dividends received are reported as revenue on condition that they originated in funds earned after the acquisition. the parent company complies with the Swedish Act on Safeguarding pension obligations, and not with IAS 19, when calculating defined-benefit pension plans. the most significant differences to the rules in IAS 19 are how the discount rate is determined, that the defined-benefit obligation is calculated based on current salaries without assuming future salary increases and that all actuarial gains and losses are recognised in the income statement as they occur. the parent company reports untaxed reserves including deferred tax liabilities, rather than distributing them between deferred tax liabilities and equity as is done for the Group. Group contributions and shareholder contributions are reported in the parent company as per statement urA 7 Group contributions and shareholder contributions from the Swedish Financial Accounting Standard council’s task group of what was the Swedish Financial Accounting Standards council and is now the Swedish Financial reporting Board. Shareholder contributions are recognised directly in the shareholders’ equity of the recipient and are capitalised in the contributor’s shares and participations, insofar as no impairment is required. Group contributions are reported based on economic reality. Group contributions comparable to dividends are recognised as dividends. consequently Group contributions received and their current tax effects are recognised in the income statement. Group contributions paid and their current tax effect are recognised directly in retained earnings. In the parent company, Group contributions received are recognised that are comparable to dividends in net financial items. Item 70, on financial guarantee contracts, in recommendation rr 32:06 of the Swedish Financial reporting Board was applied, so IAS 39 rules for recognising and valuing financial guarantee contracts benefiting subsidiaries were not applied.
Note 2 Critical estimates and assumptions
the carrying amounts of certain assets and liabilities are based in part on estimates and assumptions. this applies particularly to impairment testing of goodwill (note 14) and to defined-benefit pension obligations (note 22). Assumptions and estimates are continually evaluated and are based on historical experience and expectations regarding future events deemed reasonable under prevailing circumstances. tests are performed each year to determine if goodwill is impaired. the recoverable amount of cash-generating units has been determined by calculating values in use. For these calculations, certain estimates must be made. A large part of the Group’s pension obligations for salaried employees are on a defined-benefit basis and are covered by group policies with Alecta. currently it is impos-sible to obtain data from Alecta on the Group’s share of obligations and plan assets, so the pension plan with Alecta must be recognised as a defined-contribution plan. the consolida-tion ratio reported by Alecta does not indicate any deficit, but it is not possible to obtain detailed information from Alecta about the size of the pension obligation. the present value of pension obligations recognised as defined-benefit plans depends on multiple factors determined on an actuarial basis using a number of assumptions. the assumptions used to determine the present value of the obligation include the discount rate and salary rises. each change in these assumptions will affect the carrying amount of pen-sion obligations. See also note 22.
Note 3 Financial risks and risk management
goals and policy for risk managementAddtech strives for structured and efficient management of the financial risks that arise in op-erations, which is manifest in the financial policy adopted by the Board of directors. this policy spells out goals and guidelines for how to manage risks and lays a framework for how to limit such risks. the financial policy expresses the goal of limiting or eliminating financial risks. the policy defines and identifies the financial risks that arise at Addtech and how responsibility for managing these risks is distributed in the organisation. the financial risks defined in the finan-cial policy are transaction exposure, translation exposure, financing risk, interest rate risk and credit and counterparty risk. operational risks, that is, risks related to operating activities, are managed by each subsidiary’s management according to principles approved by the Group’s Board of directors and senior management. risks such as translation exposure, financing risk and interest rate risk are managed by the parent company, Addtech AB.
Currency riskscurrency risk is defined as the risk of a negative effect on earnings resulting from changes in foreign exchange rates. For Addtech, currency risk arises because of future payments in foreign currency (“transaction exposure”) and because the Group’s equity includes net assets in foreign subsidiaries (“translation exposure”).
transaction exposurethe Group’s currency flows are mainly attributable to imports from europe, Asia and north America. during the year, the Group’s payment flows in foreign currencies were distributed as follows:
Currency flows, gross 2007/2008 Currency flows, net
Inflows Outflows 2007/2008 2006/2007
EUR 765 1,070 -305 -285
USD 140 265 -125 -95
JPY 80 140 -60 -55
CHF 15 55 -40 -35
GBP 50 80 -30 -15
the effects of exchange rate fluctuations are eliminated by buying and selling in the same currency, through currency clauses in customer contracts and, to a limited degree, by for-ward purchases or sales of foreign currency. currency clauses are a common method in the industry for handling uncertainty associated with future cash flows. A currency clause means that compensation will be paid for any changes in the exchange rate that exceed a certain predefined level during the contract period. If these thresholds are not reached, for example when the exchange rate changes by less than two percentage points, no compensation is paid. the currency clauses adjust the exchange rate change between the time the order is placed and the invoice date. currency clauses are symmetrical, which means that compen-sation is charged or credited when the exchange rate rises or declines, respectively, beyond the predefined thresholds.

Addtech AnnuAl report 2007/2008 59Addtech AnnuAl report 2007/2008 59
Note 3 Cont’d.
of Group revenue, currency clauses apply to about 20 percent and sales in the purchasing currency represent about 40 percent In certain transactions, there is a direct link between the customer’s order and the associated purchase order, which is a good basis for effective currency risk management. however, in many cases the dates of the orders do not coincide, which may reduce the effectiveness of these measures. the fair value of forward exchange contracts was calculated using forward rates prevailing at the end of the accounting period and the average remaining term. the extent of outstanding forward exchange contracts was limited at the end of the financial year. the Group has net exposure in several currencies. If each separate currency pair changes by 5 percent the aggregate effect on profits would total about MSeK 20, all things being equal. Inflows and outflows in the same currency mean that the Group*s exposure is relatively limited. All currency flows in the parent company are mainly in Swedish kronor, SeK.
translation exposurethe translation exposure of the Addtech Group is currently not hedged. the Group’s equity is divided into foreign currencies as follows:
Nominal amount, MSEK
Sensitivity analysis, +/– 5% in exchange rate has this
effect on Group equity
EUR 144.1 7.2
DKK 138.8 6.9
NOK 52.2 2.6
PLZ 22.7 1.1
GBP 11.2 0.6
CNY 5.3 0.3
When translating the income statement of units with a functional currency other than SeK, a translation effect arises in changed exchange rates. In a change of 1 percentage point in the exchange rates, with the present distribution between the Group’s different functional currencies, the effect on revenue amounts to MSeK +/- 20 (20) and MSeK +/- 2 (2) on operating profit.
the exchange rates used in the financial statements are shown in the following table:
Exchange rate Average rate Closing day rate
2007/2008 2006/2007 31/3/08 31/3/07
DKK 100 124.89 123.55 125.95 125.20
EUR 1 9.31 9.21 9.39 9.33
NOK 100 116.86 114.10 116.55 114.95
GBP 1 13.20 13.59 11.83 13.72
PLZ 1 2.51 2.36 2.66 2.41
USD 1 6.58 7.18 5.95 7.00
JPY 1000 57.68 61.49 59.80 59.35
CHF 1 5.68 5.80 5.98 5.75
CNY 100 88.09 – 85.00 –
Financing risk Financing risk is defined as the risk that the Group’s need for loans cannot be met. to ensure available financing in the future, the company must secure, in the form of available liquid funds or binding credit facilities (“letters of credit”), access to an amount that is 20 percent higher than the estimated capital requirement for the next 12 months. At 31 March 2008, the Group’s contractually agreed unutilised credit facilities (“letters of credit”), in addi-tion to contractual bank overdraft facilities (see note 25), totalled MSeK 143 (130). the parent company is responsible for the Group’s long-term financing as well as its supply of liquidity. the Group’s non-current and current interest-bearing liabilities are shown in notes 24 and 25. From time to time, Addtech uses currency swaps to manage surpluses and deficits in different currencies. this allows the Group to reduce its financing costs and the company’s liquid funds to be used in an efficient manner. the fair value of such currency swaps was calculated using forward rates at the end of the accounting period and the average remaining term. the real value is marginal.
Interest rate riskInterest rate risk is defined as the risk of negative effects on profit/loss due to changes in general interest rates. Addtech’s main exposure to interest rate risk is in its debt portfolio. disregarding the pension liability, interest-bearing external debt totals MSeK 256 (160). Addtech’s assets are relatively short-term. All investments are to mature in less than six months. At 31 March 2008 there were no current investments. to achieve favourable matching of interest-rate risk, Addtech’s financial policy prescribes that a maximum of 50 percent of the debt portfolio, not including the pension liability, may have a period of fixed interest exceeding one year. At the end of the year the average interest rate was 3.15 percent (2.71) for interest-bearing assets in the Group. the corresponding rate for the parent company was 5.35 percent (4.45). the average rate of interest for all of the Group’s interest-bearing liabilities (not including pension liabilities) was 4.83 percent (3.87) at the end of the financial year. the corresponding rate for the parent company was 4.20 percent (3.34). regarding the present financial net debt, a 1 percentage point change in the interest rate has an impact of MSeK +/- 4 on the Group’s net financial terms.
Credit and counterparty risks credit risk is defined as the risk that Addtech’s counterparties fail to fulfil their contractual obligations. Addtech is exposed to credit risk in its financial dealings, that is, in investing its surplus liquidity and executing forward exchange transactions, and in its commercial opera-tions in connection with accounts receivable and advance payments to suppliers. Addtech’s finance department is responsible for evaluating and managing financial credit risk. the finance policy prescribes that surplus liquidity only be invested with coun-terparties that have a very high credit rating. As in prior years, in 2007/2008 surplus funds were not invested with any counterparties other than Swedish banks, aside from the Group’s normal bank contacts. to utilise its subsidiaries’ detailed knowledge of Addtech’s customers and suppliers, Addtech has each company evaluate credit risk in commercial transactions. new customers are assessed before credit is granted, and credit limits set are strictly enforced. Short credit periods are strived for, and the lack of strong concentration of business in individual custom-ers and specific sectors helps minimise risks. no individual customer accounts for more than 3 percent of total credit exposure during a one-year period. the corresponding percentage for the 10 largest customers is less than 12 percent exposure per customer segment and geographical market is shown on page 6. Bad debt losses totalled MSeK 2.8 (2.5) during the year, equal to 0.1 percent (0.1) of revenue.
Accounts receivable
31/3/08 31/3/07
Carrying amount 618.5 580.0
Impairment losses 3.8 2.5
Acquisition cost 622.3 582.5
Change in impaired accounts receivable
2007/2008 2006/2007
Amount at start of year -2.5 -2.2
Corporate acquisitions -0.5 -0.5
Year's impairment loss/reversal of impairment loss
-1.1 0.2
Settled impairment losses 0.3 0.0
Exchange differences 0.0 0.0
Total -3.8 -2.5
time analysis of accounts receivable that are overdue but not impaired:
31/3/08 31/3/07
< = 30 days 74.3 75.3
31-60 days 12.6 13.0
> 60 days 15.5 14.6
Total 102.4 102.9

Addtech AnnuAl report 2007/200860 Addtech AnnuAl report 2007/200860
Note 3 Cont’d.
valuation of financial assets and liabilities at fair valueFor listed securities, fair value is determined on the basis of the asset’s listed price at the balance sheet date without additions regarding transaction costs at the acquisition date. For foreign exchange contracts, calculation of fair value is based on listed prices. current and non-current liabilities are carried at amortised cost. the difference between carrying amount and fair value is marginal for these items. Fair value and carrying amount are recognised in the balance sheet as shown in the next table:
MSEK 31/3/08
Financial assets valued at fair value
in the income statement
Derivatives used in hedge accounting
Accounts receivable and
loan receivablesAvailable-for-sale
financial assets Other liabilitiesTotal carrying
amount Fair value
Held for trading
Non-current investments 51) – – 64) – 11 11
Non-current receivables – – 1 – – 1 1
Accounts receivable – – 619 – – 619 619
Other receivables2) 0 2 – – – 2 2
Total 5 2 620 6 – 633 633
Non-current interest-bearing liabilities
– – – – 68 68 68
Current interest-bearing liabilities – – – – 188 188 188
Accounts payable – – – – 372 372 372
Other liabilities3) – 3 – – 12 15 15
Total – 3 – – 640 643 643
MSEK 31/3/07
Financial assets valued at fair value
via the income statement
Derivatives used in hedge accounting
Accounts receivable and
loan receivablesAvailable-for-sale
financial assets Other liabilitiesTotal carrying
amount Fair value
Held for trading
Non-current investments 91) – – 64) – 15 15
Non-current receivables – – 1 – – 1 1
Accounts receivable – – 580 – – 580 580
Other receivables2) 0 3 – – – 3 3
Total 9 3 581 6 – 599 599
Non-current interest-bearing liabilities
– – – – 10 10 10
Current interest-bearing liabilities – – – – 150 150 150
Accounts payable – – – – 354 354 354
Other liabilities3) – 1 – – 23 24 24
Total – 1 – – 537 538 538
1) refers to a share option in the parent company (see note 17). 3) part of other liabilities in the consolidated balance sheet.2) part of other receivables in the consolidated balance sheet. 4) valued at amortised cost.the Group has no financial liabilities valued at fair value in the income statement.
Net gain/net loss per valuation category, MSEK 2007/2008 2006/2007
Assets and liabilities valued at fair value via the income statement1)
-3 4
Derivatives -1 1
Accounts receivable and loan receivables -3 -2
Available-for-sale financial assets 0 0
Other liabilities -20 -13
Total -27 -10
1) refers to a change in value of a share option in the parent company (see note 17).
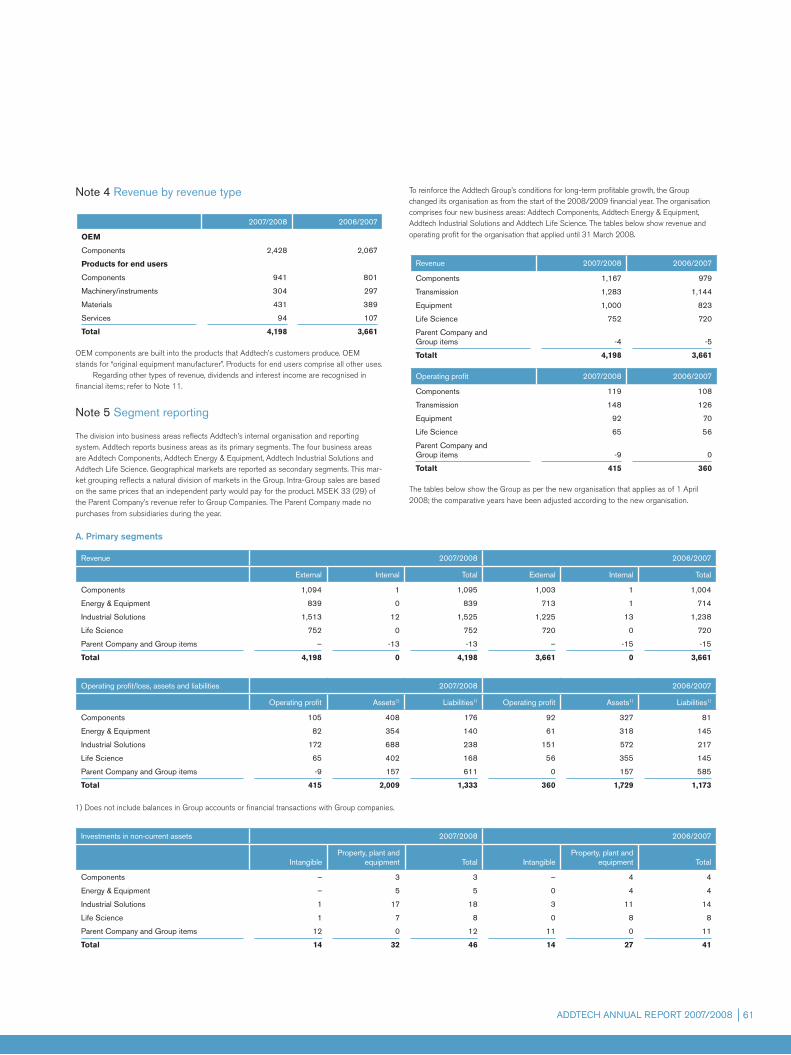
Addtech AnnuAl report 2007/2008 61Addtech AnnuAl report 2007/2008 61
Note 4 Revenue by revenue type
2007/2008 2006/2007
OEM
Components 2,428 2,067
Products for end users
Components 941 801
Machinery/instruments 304 297
Materials 431 389
Services 94 107
Total 4,198 3,661
oeM components are built into the products that Addtech’s customers produce. oeM stands for “original equipment manufacturer”. products for end users comprise all other uses. regarding other types of revenue, dividends and interest income are recognised in financial items; refer to note 11.
Note 5 Segment reporting
the division into business areas reflects Addtech’s internal organisation and reporting system. Addtech reports business areas as its primary segments. the four business areas are Addtech components, Addtech energy & equipment, Addtech Industrial Solutions and Addtech life Science. Geographical markets are reported as secondary segments. this mar-ket grouping reflects a natural division of markets in the Group. Intra-Group sales are based on the same prices that an independent party would pay for the product. MSeK 33 (29) of the parent company’s revenue refer to Group companies. the parent company made no purchases from subsidiaries during the year.
A. Primary segments
to reinforce the Addtech Group’s conditions for long-term profitable growth, the Group changed its organisation as from the start of the 2008/2009 financial year. the organisation comprises four new business areas: Addtech components, Addtech energy & equipment, Addtech Industrial Solutions and Addtech life Science. the tables below show revenue and operating profit for the organisation that applied until 31 March 2008.
Revenue 2007/2008 2006/2007
Components 1,167 979
Transmission 1,283 1,144
Equipment 1,000 823
Life Science 752 720
Parent Company and Group items -4 -5
Totalt 4,198 3,661
Operating profit 2007/2008 2006/2007
Components 119 108
Transmission 148 126
Equipment 92 70
Life Science 65 56
Parent Company and Group items -9 0
Totalt 415 360
the tables below show the Group as per the new organisation that applies as of 1 April 2008; the comparative years have been adjusted according to the new organisation.
Revenue 2007/2008 2006/2007
External Internal Total External Internal Total
Components 1,094 1 1,095 1,003 1 1,004
Energy & Equipment 839 0 839 713 1 714
Industrial Solutions 1,513 12 1,525 1,225 13 1,238
Life Science 752 0 752 720 0 720
Parent Company and Group items – -13 -13 – -15 -15
Total 4,198 0 4,198 3,661 0 3,661
Operating profit/loss, assets and liabilities 2007/2008 2006/2007
Operating profit Assets1) Liabilities1) Operating profit Assets1) Liabilities1)
Components 105 408 176 92 327 81
Energy & Equipment 82 354 140 61 318 145
Industrial Solutions 172 688 238 151 572 217
Life Science 65 402 168 56 355 145
Parent Company and Group items -9 157 611 0 157 585
Total 415 2,009 1,333 360 1,729 1,173
1) does not include balances in Group accounts or financial transactions with Group companies.
Investments in non-current assets 2007/2008 2006/2007
IntangibleProperty, plant and
equipment Total IntangibleProperty, plant and
equipment Total
Components – 3 3 – 4 4
Energy & Equipment – 5 5 0 4 4
Industrial Solutions 1 17 18 3 11 14
Life Science 1 7 8 0 8 8
Parent Company and Group items 12 0 12 11 0 11
Total 14 32 46 14 27 41

Addtech AnnuAl report 2007/200862 Addtech AnnuAl report 2007/200862
Note 5 Cont’d.
Depreciation/Amortisation of non-current assets 2007/2008 2006/2007
IntangibleProperty, plant and
equipment Total IntangibleProperty, plant and
equipment Total
Components 3 4 7 1 4 5
Energy & Equipment 4 5 9 2 5 7
Industrial Solutions 6 11 17 3 10 13
Life Science 5 9 14 3 8 11
Parent Company and Group items 6 3 9 5 3 8
Total 24 32 56 14 30 44
Significant income statement items, other than depreciation and amortisation, not giving rise to payments in 2007/2008
Addtech Components
Addtech Energy & Equipment
Addtech Industrial solutions
Addtech Life Science
Parent Comapny and Group items Total
Capital gains 0 0 1 1 1 3
Change in pension liability -1 -1 -3 -1 0 -6
Other items 1 0 0 2 -2 1
Total 0 -1 -2 2 -1 -2
b. Secondary segments
By geographical market 2007/2008 2006/2007
Revenue, external Assets1) Revenue, external Assets1)
Sweden 1,873 1,014 1,711 868
Denmark 749 387 648 249
Finland 634 321 521 189
Norway 347 122 309 105
Other countries 595 75 472 64
Parent Company, Group items and unallocated assets – 90 – 254
Total 4,198 2,009 3,661 1,729
1) does not include Group account balances. external revenues are based on the customers’ location. the carrying amounts of assets are based on where the assets are located.
Investments in non-current assets 2007/2008 2006/2007
IntangibleProperty, plant and
equipment Total IntangibleProperty, plant and
equipment Total
Sweden 13 10 23 13 17 30
Denmark 1 13 14 1 7 8
Finland 0 5 5 0 1 1
Norway – 1 1 – 0 0
Other countries – 3 3 0 2 2
Total 14 32 46 14 27 41
Note 6 Employees and personnel costs
Average number of employees 2007/2008 2006/2007
Men Women Total Men Women Total
Sweden
Parent Company 6 4 10 5 4 9
Other companies 448 179 627 403 172 575
Finland 180 80 260 160 67 227
Denmark 182 102 284 170 88 258
Norway 61 16 77 54 14 68
Other countries 91 19 110 80 18 98
Total 968 400 1,368 872 363 1,235
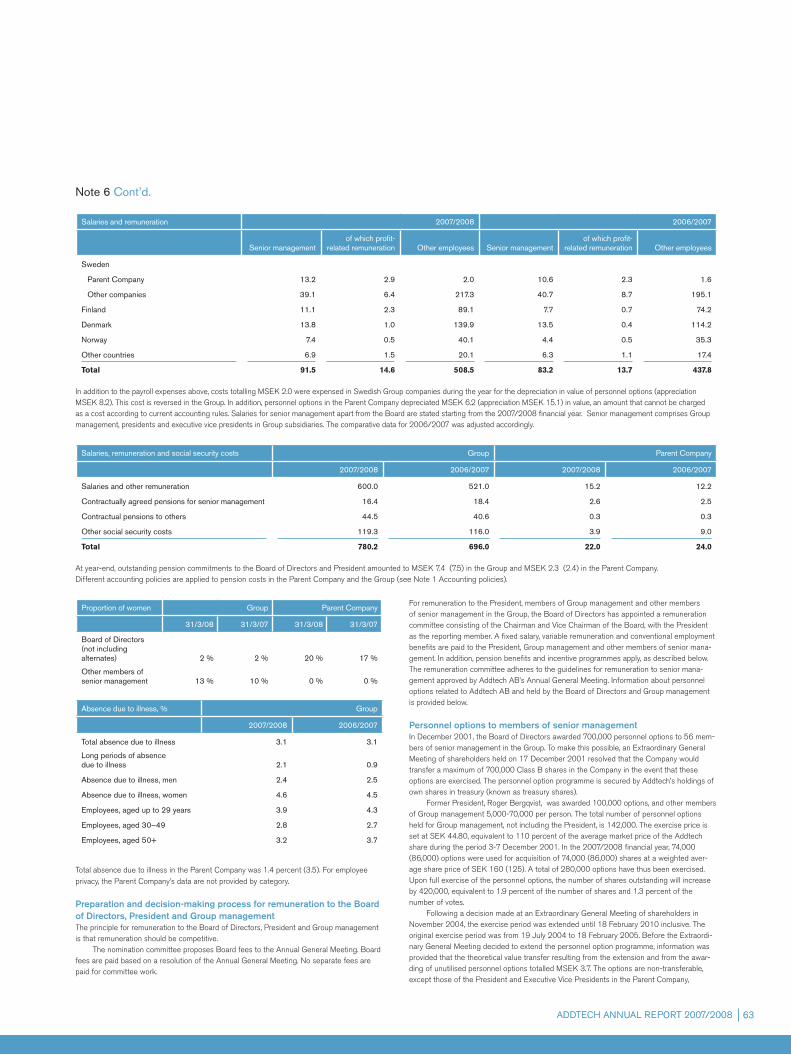
Addtech AnnuAl report 2007/2008 63Addtech AnnuAl report 2007/2008 63
Note 6 Cont’d.
Salaries and remuneration 2007/2008 2006/2007
Senior managementof which profit-
related remuneration Other employees Senior managementof which profit-
related remuneration Other employees
Sweden
Parent Company 13.2 2.9 2.0 10.6 2.3 1.6
Other companies 39.1 6.4 217.3 40.7 8.7 195.1
Finland 11.1 2.3 89.1 7.7 0.7 74.2
Denmark 13.8 1.0 139.9 13.5 0.4 114.2
Norway 7.4 0.5 40.1 4.4 0.5 35.3
Other countries 6.9 1.5 20.1 6.3 1.1 17.4
Total 91.5 14.6 508.5 83.2 13.7 437.8
In addition to the payroll expenses above, costs totalling MSeK 2.0 were expensed in Swedish Group companies during the year for the depreciation in value of personnel options (appreciation MSeK 8.2). this cost is reversed in the Group. In addition, personnel options in the parent company depreciated MSeK 6.2 (appreciation MSeK 15.1) in value, an amount that cannot be charged as a cost according to current accounting rules. Salaries for senior management apart from the Board are stated starting from the 2007/2008 financial year. Senior management comprises Group management, presidents and executive vice presidents in Group subsidiaries. the comparative data for 2006/2007 was adjusted accordingly.
Salaries, remuneration and social security costs Group Parent Company
2007/2008 2006/2007 2007/2008 2006/2007
Salaries and other remuneration 600.0 521.0 15.2 12.2
Contractually agreed pensions for senior management 16.4 18.4 2.6 2.5
Contractual pensions to others 44.5 40.6 0.3 0.3
Other social security costs 119.3 116.0 3.9 9.0
Total 780.2 696.0 22.0 24.0
At year-end, outstanding pension commitments to the Board of directors and president amounted to MSeK 7.4 (7.5) in the Group and MSeK 2.3 (2.4) in the parent company.different accounting policies are applied to pension costs in the parent company and the Group (see note 1 Accounting policies).
Proportion of women Group Parent Company
31/3/08 31/3/07 31/3/08 31/3/07
Board of Directors (not including alternates) 2 % 2 % 20 % 17 %
Other members of senior management 13 % 10 % 0 % 0 %
Absence due to illness, % Group
2007/2008 2006/2007
Total absence due to illness 3.1 3.1
Long periods of absence due to illness 2.1 0.9
Absence due to illness, men 2.4 2.5
Absence due to illness, women 4.6 4.5
Employees, aged up to 29 years 3.9 4.3
Employees, aged 30–49 2.8 2.7
Employees, aged 50+ 3.2 3.7
total absence due to illness in the parent company was 1.4 percent (3.5). For employee privacy, the parent company’s data are not provided by category.
Preparation and decision-making process for remuneration to the board of Directors, President and group managementthe principle for remuneration to the Board of directors, president and Group management is that remuneration should be competitive. the nomination committee proposes Board fees to the Annual General Meeting. Board fees are paid based on a resolution of the Annual General Meeting. no separate fees are paid for committee work.
For remuneration to the president, members of Group management and other members of senior management in the Group, the Board of directors has appointed a remuneration committee consisting of the chairman and vice chairman of the Board, with the president as the reporting member. A fixed salary, variable remuneration and conventional employment benefits are paid to the president, Group management and other members of senior mana-gement. In addition, pension benefits and incentive programmes apply, as described below. the remuneration committee adheres to the guidelines for remuneration to senior mana-gement approved by Addtech AB’s Annual General Meeting. Information about personnel options related to Addtech AB and held by the Board of directors and Group management is provided below.
Personnel options to members of senior managementIn december 2001, the Board of directors awarded 700,000 personnel options to 56 mem-bers of senior management in the Group. to make this possible, an extraordinary General Meeting of shareholders held on 17 december 2001 resolved that the company would transfer a maximum of 700,000 class B shares in the company in the event that these options are exercised. the personnel option programme is secured by Addtech’s holdings of own shares in treasury (known as treasury shares). Former president, roger Bergqvist, was awarded 100,000 options, and other members of Group management 5,000-70,000 per person. the total number of personnel options held for Group management, not including the president, is 142,000. the exercise price is set at SeK 44.80, equivalent to 110 percent of the average market price of the Addtech share during the period 3-7 december 2001. In the 2007/2008 financial year, 74,000 (86,000) options were used for acquisition of 74,000 (86,000) shares at a weighted aver-age share price of SeK 160 (125). A total of 280,000 options have thus been exercised. upon full exercise of the personnel options, the number of shares outstanding will increase by 420,000, equivalent to 1.9 percent of the number of shares and 1.3 percent of the number of votes. Following a decision made at an extraordinary General Meeting of shareholders in november 2004, the exercise period was extended until 18 February 2010 inclusive. the original exercise period was from 19 July 2004 to 18 February 2005. Before the extraordi-nary General Meeting decided to extend the personnel option programme, information was provided that the theoretical value transfer resulting from the extension and from the awar-ding of unutilised personnel options totalled MSeK 3.7. the options are non-transferable, except those of the president and executive vice presidents in the parent company,

Addtech AnnuAl report 2007/200864 Addtech AnnuAl report 2007/200864
Note 6 Cont’d.
whose options can be transferred if approved by Addtech’s Board of directors. the options can only be exercised if the holder is still employed by the company; hence the options are not defined as securities. For this reason and others, the options have been awarded free of charge. the social security contributions incurred if the personnel options are exercised are expensed on a current basis in line with the market price of the share. the accumulated reserve for social security contributions stands at MSeK 10.8 (15.2), representing a MSeK 4.4 decrease (5.2 increase) in the reserve since the start of the financial year. In the interest of reducing the effect of social security contributions for personnel options, and essentially eliminating this effect starting in the 2006/2007 financial year, in the preceding financial year Addtech purchased a financial derivative contract with a maturity corresponding to the remaining maturity of the personnel option programme.
board of Directorsthe Board fees of SeK 1,475,000 (1,300,000) set by the Annual General Meeting are distributed as per the Annual General Meeting’s decision, among those Board directors who are not employed by the parent company.
Parent Company’s PresidentJohan Sjö, current president of the parent company, received a fixed salary of SeK 726,000 (-) and variable remuneration of SeK 153,000 (-) for the time he worked as president. roger Bergqvist, previous president of the parent company, received a fixed salary of SeK 1,537,000 (2,011,000) and variable remuneration of SeK 533,000 (706,000) for the time he worked as president. variable remuneration was expensed during the 2007/2008 financial year and paid during 2008/2009. taxable benefits for the current president amounting to SeK 24,000 (-) and for the previous president totalling SeK 96,000 (116,000) are additional. From age 65, the president is covered by a defined-contribution pension, the size of which depends on the outcome of pension insurance agreements. during 2007/2008, pension premiums, the size of which is determined annually by the remuneration committee, were paid and amounted to SeK 157,000 for the current president and SeK 750,000 (1,000,000) for the previous president. the variable remuneration is not pensionable income. In conjunction with his recruitment, the Board of directors offered Johan Sjö, the presi-dent, a long-term incentive programme (ltI), which entitles the president to receive, annually over a five-year period, the equivalent of 20 percent of invested amounts in Addtech shares, up to SeK 3,000,000. As a result, Johan Sjö received a total of SeK 300,000 during the financial year, of which SeK 150,000 is included in his fixed salary during his time as presi-
Remuneration and other benefits during the year
Basic salary/Board fee
Variable remu-neration
Long-term incentive program Other benefits Pension costs
Financial instruments
Personnel options
Other remu-neration Total
Chairman of the Board 0.5 – – – – – – – 0.5
Other members of the Board 1.0 – – – – – – – 1.0
President1) 2.1 0.7 0.2 0.1 0.9 – – – 4.0
Other members of senior man-agement (4.5 persons)1) 6.4 2.2 0.1 0.4 1.7 – – – 10.8
Total 10.0 2.9 0.3 0.5 2.6 – – – 16.3
1) refers to roger Bergqvist for 1 April 2007 to 31 december 2007 inclusive, and Johan Sjö for 1 January 2008 to 31 March 2008 inclusive. For the period from 1 January 2008 until and in-cluding 31 March 2008, roger Bergqvist is included in the group other members of senior management. Johan Sjö is included in the group other members of senior management for 1 october 2007 to 31 december 2007, that is prior to his taking the position as president.
dent and SeK 150,000 as fixed salary from 1 october 2007 to 31 december 2007. the ltI remuneration is not pensionable income. variable remuneration, based on Group earnings and up to 30 percent of fixed salary, may be payable. In addition, a further premium of 20 percent may be payable of the variable remuneration received – which was used to acquire shares in Addtech AB. the period of notice is 12 months when the company terminates the employment contract and six months when the president does so. In the case of termination on the initiative of the company, the president is entitled to a severance payment equivalent to one year’s salary in addition to salary during the period of notice. no post-employment remuneration is payable if the employee terminates the employment contract.
Compensation and other benefits for President Johan Sjöthe president is paid a basic salary of SeK 2,040,000. other taxable benefits of approxametely SeK 150,000 are additional. the company pays for a defined-contribution pension solution of SeK 600,000. variable compensation, severance and period of notice are according to the principles stated above. In addition, Johan Sjö has been allotted a long-term bond-related incentive -program according to the above. the information refers to a 12-month-period.
Other members of group managementother members of Group management were paid a total of SeK 6,528,000 (4,943,000) in fixed salaries and SeK 2,173,000 (1,635,000) in variable remuneration. this variable remu-neration was expensed during the 2007/2008 financial year and is paid during 2008/2009. taxable benefits of SeK 441,000 (382,000) are additional. persons in Group management are covered from age 65 by pension entitlements based on individual agreements. existing pension solutions comprise both defined-contribution solutions, where the amount of pension depends on the outcome of pension insurance agreements, and defined-benefit solutions. the cost of the defined-benefit pensions and the defined-contribution schemes is basically equivalent to the Itp plan (pension agreement for private-sector salaried employees). during 2007/2008, a total of SeK 1,723,000 (1,486,000) in pension premiums were paid for the group ”other members of group management”. variable remuneration is pensionable. variable remuneration, based on Group earnings and up to 30 percent of fixed salary, may be payable. In addition, a further premium of 20 percent may be payable of the variable remuneration received - which was used to acquire shares in Addtech AB. the period of notice is 12 months when the company terminates the employment contract and six months when the employee does so. remuneration upon termination of employment equivalent to no more than one year’s salary is payable. no post-employment remuneration is payable if the employee terminates the employment contract.
Board fees for 2007/2008, SEK '000s
Name Position Fee
Anders Börjesson Board Chairman 450
Tom Hedelius Vice chairman 350
Roger Bergqvist Board member –
Eva Elmstedt Board member 225
Urban Jansson Board member 225
Lars Spongberg Board member 225
Total 1,475
roger Bergqvist left the Board on 31 december 2007, when he left his position as ceo and president of Addtech AB.
Note 7 Remuneration to auditors
Group Parent Company
2007/2008 2006/2007 2007/2008 2006/2007
Audit assignments:
KPMG 5.6 4.7 0.6 0.6
Other audit firms 0.4 0.2 – –
Total remuneration for audit assignments 6.0 4.9 0.6 0.6
Other assignments:
KPMG 1.2 1.6 0.5 0.7
Other audit firms 0.1 0.1 – –
Total remuneration for other assignments 1.3 1.7 0.5 0.7
Total remuneration to auditors 7.3 6.6 1.1 1.3

Addtech AnnuAl report 2007/2008 65Addtech AnnuAl report 2007/2008 65
Note 8 Depreciation and amortisation
Depreciation and amorti-sation, by function Group Parent Company
2007/2008 2006/2007 2007/2008 2006/2007
Cost of sales -12.7 -11.5 – –
Selling expenses -25.3 -16.0 – –
Administrative expenses -16.5 -15.0 -0.5 -0.6
Other operating expenses -1.4 -1.3 – –
Total -55.9 -43.8 -0.5 -0.6
Depreciation and amorti-sation, by type of asset Group Parent Company
2007/2008 2006/2007 2007/2008 2006/2007
Intangible assets -24.1 -13.8 -0.3 -0.3
Buildings and land -3.2 -3.4 – –
Leasehold improvements -1.8 -1.7 – –
Machinery -7.7 -6.0 – –
Equipment -19.1 -18.9 -0.2 -0.3
Total -55.9 -43.8 -0.5 -0.6
Note 9 Other operating income and expenses
Group
2007/2008 2006/2007
Other operating income
Rental income 2.0 2.4
Gain on sale of operations and non-current assets 1.2 6.5
Change in value of share option and derivatives – 5.5
Exchange gains 20.4 13.5
Other 2.9 4.2
Total 26.5 32.1
Other operating expenses
Property costs -3.8 -2.3
Loss on sale of operations and non-current assets -0.1 -1.0
Change in value of share option and derivatives -3.7 –
Exchange losses -21.8 -13.1
Other -0.9 -1.1
Total -30.3 -17.5
capital gains and losses for 2006/2007 include MSeK 3.6 net on the sale of property. the change in value of the share option represents the social security contributions attributable to the personnel option programme (see also, in note 1 Accounting policies, the section Financial assets and liabilities, valuation and classification, derivatives and hedge accounting).
Parent Company
2007/2008 2006/2007
Other operating income
Capital gains on the sale of non-current assets 0,0 0.2
Change in value of share option – 4.3
Total 0.0 4.5
Other operating expenses
Capital losses on the sale of non-current assets 0.0 0.0
Change in value of share option -2.5 –
Total -2.5 0.0
Note 10 Operating expenses
Group
2007/2008 2006/2007
Personnel costs 810.1 719.3
Depreciation and amortisation 55.9 43.8
Impairment of inventories 10.0 16.6
Impairment of doubtful accounts receivable 2.8 2.5
Note 11 Financial income and expenses
Group
2007/2008 2006/2007
Interest income on bank balances 4.7 3.8
Dividends 0.0 0.0
Exchange rate changes 3.3 2.4
Changes in value from revaluation of financial assets/liabilities 0.1 –
Other financial income 1.2 1.5
Financial income 9.3 7.7
Interest expense on financial liabilities valued at amortised cost -20.5 -12.6
Exchange rate changes -4.0 -2.9
Changes in value from revaluation of financial assets/liabilities 0.0 0.0
Other financial expenses -1.7 -1.7
Financial expenses -26.2 -17.2
Net financial items -16.9 -9.5
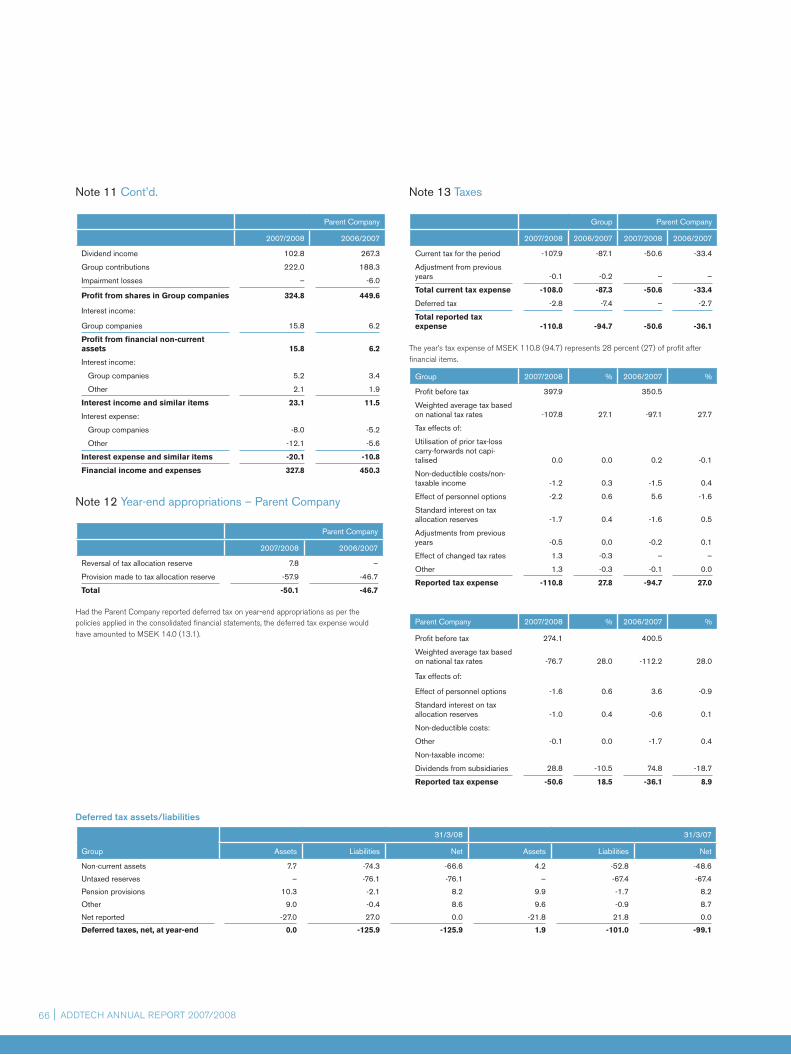
Addtech AnnuAl report 2007/200866
Note 11 Cont’d.
Parent Company
2007/2008 2006/2007
Dividend income 102.8 267.3
Group contributions 222.0 188.3
Impairment losses – -6.0
Profit from shares in Group companies 324.8 449.6
Interest income:
Group companies 15.8 6.2
Profit from financial non-current assets 15.8 6.2
Interest income:
Group companies 5.2 3.4
Other 2.1 1.9
Interest income and similar items 23.1 11.5
Interest expense:
Group companies -8.0 -5.2
Other -12.1 -5.6
Interest expense and similar items -20.1 -10.8
Financial income and expenses 327.8 450.3
Note 12 Year-end appropriations – Parent Company
Parent Company
2007/2008 2006/2007
Reversal of tax allocation reserve 7.8 –
Provision made to tax allocation reserve -57.9 -46.7
Total -50.1 -46.7
had the parent company reported deferred tax on year-end appropriations as per the policies applied in the consolidated financial statements, the deferred tax expense would have amounted to MSeK 14.0 (13.1).
Note 13 Taxes
Group Parent Company
2007/2008 2006/2007 2007/2008 2006/2007
Current tax for the period -107.9 -87.1 -50.6 -33.4
Adjustment from previous years -0.1 -0.2 – –
Total current tax expense -108.0 -87.3 -50.6 -33.4
Deferred tax -2.8 -7.4 – -2.7
Total reported tax expense -110.8 -94.7 -50.6 -36.1
the year’s tax expense of MSeK 110.8 (94.7) represents 28 percent (27) of profit after financial items.
Group 2007/2008 % 2006/2007 %
Profit before tax 397.9 350.5
Weighted average tax based on national tax rates -107.8 27.1 -97.1 27.7
Tax effects of:
Utilisation of prior tax-loss carry-forwards not capi-talised 0.0 0.0 0.2 -0.1
Non-deductible costs/non-taxable income -1.2 0.3 -1.5 0.4
Effect of personnel options -2.2 0.6 5.6 -1.6
Standard interest on tax allocation reserves -1.7 0.4 -1.6 0.5
Adjustments from previous years -0.5 0.0 -0.2 0.1
Effect of changed tax rates 1.3 -0.3 – –
Other 1.3 -0.3 -0.1 0.0
Reported tax expense -110.8 27.8 -94.7 27.0
Parent Company 2007/2008 % 2006/2007 %
Profit before tax 274.1 400.5
Weighted average tax based on national tax rates -76.7 28.0 -112.2 28.0
Tax effects of:
Effect of personnel options -1.6 0.6 3.6 -0.9
Standard interest on tax allocation reserves -1.0 0.4 -0.6 0.1
Non-deductible costs:
Other -0.1 0.0 -1.7 0.4
Non-taxable income:
Dividends from subsidiaries 28.8 -10.5 74.8 -18.7
Reported tax expense -50.6 18.5 -36.1 8.9
Deferred tax assets/liabilities
Group
31/3/08 31/3/07
Assets Liabilities Net Assets Liabilities Net
Non-current assets 7.7 -74.3 -66.6 4.2 -52.8 -48.6
Untaxed reserves – -76.1 -76.1 – -67.4 -67.4
Pension provisions 10.3 -2.1 8.2 9.9 -1.7 8.2
Other 9.0 -0.4 8.6 9.6 -0.9 8.7
Net reported -27.0 27.0 0.0 -21.8 21.8 0.0
Deferred taxes, net, at year-end 0.0 -125.9 -125.9 1.9 -101.0 -99.1

Addtech AnnuAl report 2007/2008 67
Note 14 Intangible non-current assets
2007/2008
Intangible assets acquired
Intangible assets devel-
oped in the Group
Goodwill
Supplier relationships,
customer rela-tionships and
technology TrademarksCapitalised
R&D expenses
Leases (rental) and similar
rights Software Software Total
Accumulated acquisition cost
Opening balance 219.8 119.3 9.1 6.3 0.2 34.4 2.6 391.7
Corporate acquisitions 67.0 105.7 0.3 – – – – 173.0
Investments – – 0.1 1.0 – 11.3 1.1 13.5
Reclassification – – – -1.1 – -2.5 – -3.6
Exchange differences for the year 0.1 0.3 – 0.1 – 0.0 – 0.5
Closing balance 286.9 225.3 9.5 6.3 0.2 43.2 3.7 575.1
Accumulated amortisation according to plan
Opening balance – -9.7 – -4.4 0.0 -17.8 -0.7 -32.6
Corporate acquisitions – – -0.1 – – – – -0.1
Amortisation – -15.6 0.0 -0.2 – -8.1 -0.2 -24.1
Reclassification – – – 0.2 – 2.5 – 2.7
Exchange differences for the year – -0.1 – – – -0.1 – -0.2
Closing balance – -25.4 -0.1 -4.4 0.0 -23.5 -0.9 -54.3
Net book value at year-end 286.9 199.9 9.4 1.9 0.2 19.7 2.8 520.8
Net book value at start of year 219.8 109.6 9.1 1.9 0.2 16.6 1.9 359.1
Note 13 Cont’d
2007/2008 2006/2007
Group
Amount at start of
year
Recog-nised in
the income statement
Acquisi-tions and disposals
Charged to share-holders’
equity
Translation differ-ences
Amount at end of
year
Amount at start of
yearReclas-
sification
Recog-nised in
the income statement
Acquisi-tions and disposals
Charged to share-holders’
equity
Translation differ-ences
Amount at end of
year
Non-current assets -48.6 6.8 -24.8 – 0.0 -66.6 -22.0 -2.7 -3.1 -20.8 – 0.0 -48.6
Untaxed reserves -67.4 -8.6 -0.1 – 0.0 -76.1 -66.7 – 3.0 -3.7 – 0.0 -67.4
Pension provisions 8.2 0.0 – – 0.0 8.2 9.5 – -1.3 – – 0.0 8.2
Other 8.7 -1.0 0.1 0.8 0.0 8.6 8.0 2.7 -6.0 4.6 -0.6 0.0 8.7
Deferred taxes, net -99.1 -2.8 -24.8 0.8 0.0 -125.9 -71.2 0.0 -7.4 -19.9 -0.6 0.0 -99.1
Parent Company
2007/2008 2006/2007
Amount at start of year
Recognised in the
income statement
Acquisi-tions and disposals
Charged to sharehold-ers’ equity
Amount at end of year
Amount at start of year
Recognised in the
income statement
Acquisi-tions and disposals
Charged to sharehold-ers’ equity
Amount at end of year
Personnel options – – – – – 2.7 -2.7 – – –
Deferred taxes, net – – – – – 2.7 -2.7 – – –
there are no non capitalised tax-loss carry-forwards in the Group.
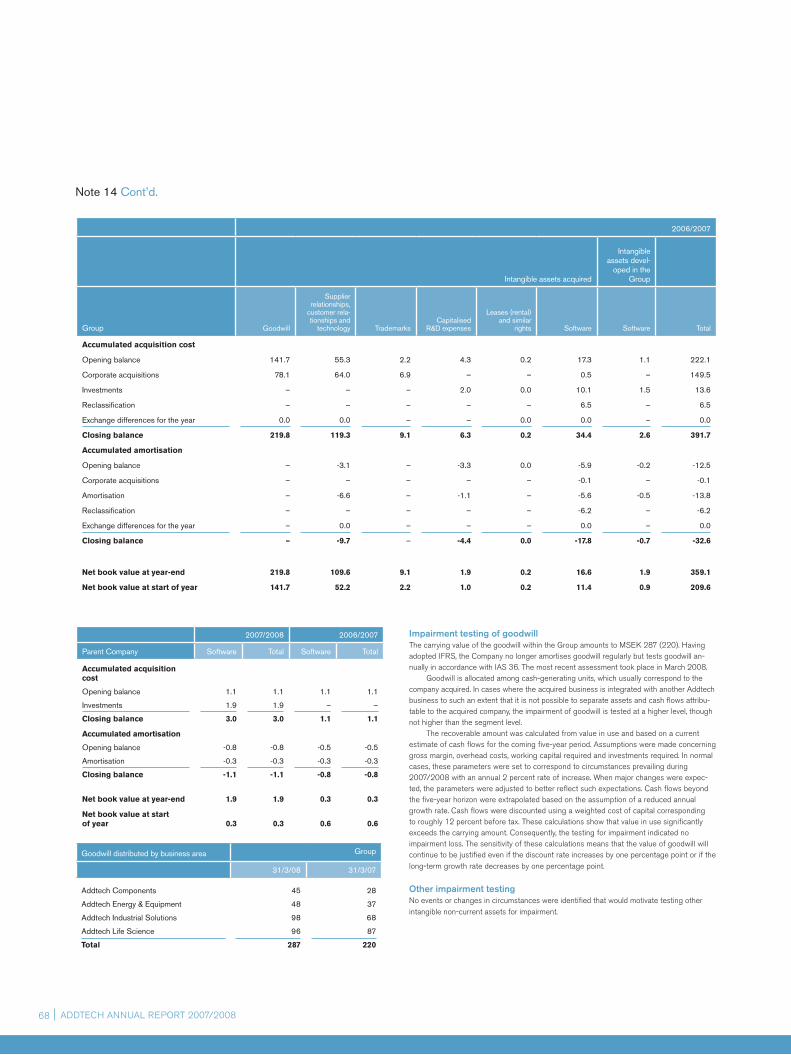
Addtech AnnuAl report 2007/200868
Note 14 Cont’d.
2006/2007
Intangible assets acquired
Intangible assets devel-
oped in the Group
Group Goodwill
Supplier relationships,
customer rela-tionships and
technology TrademarksCapitalised
R&D expenses
Leases (rental) and similar
rights Software Software Total
Accumulated acquisition cost
Opening balance 141.7 55.3 2.2 4.3 0.2 17.3 1.1 222.1
Corporate acquisitions 78.1 64.0 6.9 – – 0.5 – 149.5
Investments – – – 2.0 0.0 10.1 1.5 13.6
Reclassification – – – – – 6.5 – 6.5
Exchange differences for the year 0.0 0.0 – – 0.0 0.0 – 0.0
Closing balance 219.8 119.3 9.1 6.3 0.2 34.4 2.6 391.7
Accumulated amortisation
Opening balance – -3.1 – -3.3 0.0 -5.9 -0.2 -12.5
Corporate acquisitions – – – – – -0.1 – -0.1
Amortisation – -6.6 – -1.1 – -5.6 -0.5 -13.8
Reclassification – – – – – -6.2 – -6.2
Exchange differences for the year – 0.0 – – – 0.0 – 0.0
Closing balance – -9.7 – -4.4 0.0 -17.8 -0.7 -32.6
Net book value at year-end 219.8 109.6 9.1 1.9 0.2 16.6 1.9 359.1
Net book value at start of year 141.7 52.2 2.2 1.0 0.2 11.4 0.9 209.6
2007/2008 2006/2007
Parent Company Software Total Software Total
Accumulated acquisition cost
Opening balance 1.1 1.1 1.1 1.1
Investments 1.9 1.9 – –
Closing balance 3.0 3.0 1.1 1.1
Accumulated amortisation
Opening balance -0.8 -0.8 -0.5 -0.5
Amortisation -0.3 -0.3 -0.3 -0.3
Closing balance -1.1 -1.1 -0.8 -0.8
Net book value at year-end 1.9 1.9 0.3 0.3
Net book value at start of year 0.3 0.3 0.6 0.6
Goodwill distributed by business area Group
31/3/08 31/3/07
Addtech Components 45 28
Addtech Energy & Equipment 48 37
Addtech Industrial Solutions 98 68
Addtech Life Science 96 87
Total 287 220
Impairment testing of goodwillthe carrying value of the goodwill within the Group amounts to MSeK 287 (220). having adopted IFrS, the company no longer amortises goodwill regularly but tests goodwill an-nually in accordance with IAS 36. the most recent assessment took place in March 2008. Goodwill is allocated among cash-generating units, which usually correspond to the company acquired. In cases where the acquired business is integrated with another Addtech business to such an extent that it is not possible to separate assets and cash flows attribu-table to the acquired company, the impairment of goodwill is tested at a higher level, though not higher than the segment level. the recoverable amount was calculated from value in use and based on a current estimate of cash flows for the coming five-year period. Assumptions were made concerning gross margin, overhead costs, working capital required and investments required. In normal cases, these parameters were set to correspond to circumstances prevailing during 2007/2008 with an annual 2 percent rate of increase. When major changes were expec-ted, the parameters were adjusted to better reflect such expectations. cash flows beyond the five-year horizon were extrapolated based on the assumption of a reduced annual growth rate. cash flows were discounted using a weighted cost of capital corresponding to roughly 12 percent before tax. these calculations show that value in use significantly exceeds the carrying amount. consequently, the testing for impairment indicated no impairment loss. the sensitivity of these calculations means that the value of goodwill will continue to be justified even if the discount rate increases by one percentage point or if the long-term growth rate decreases by one percentage point.
Other impairment testingno events or changes in circumstances were identified that would motivate testing other intangible non-current assets for impairment.
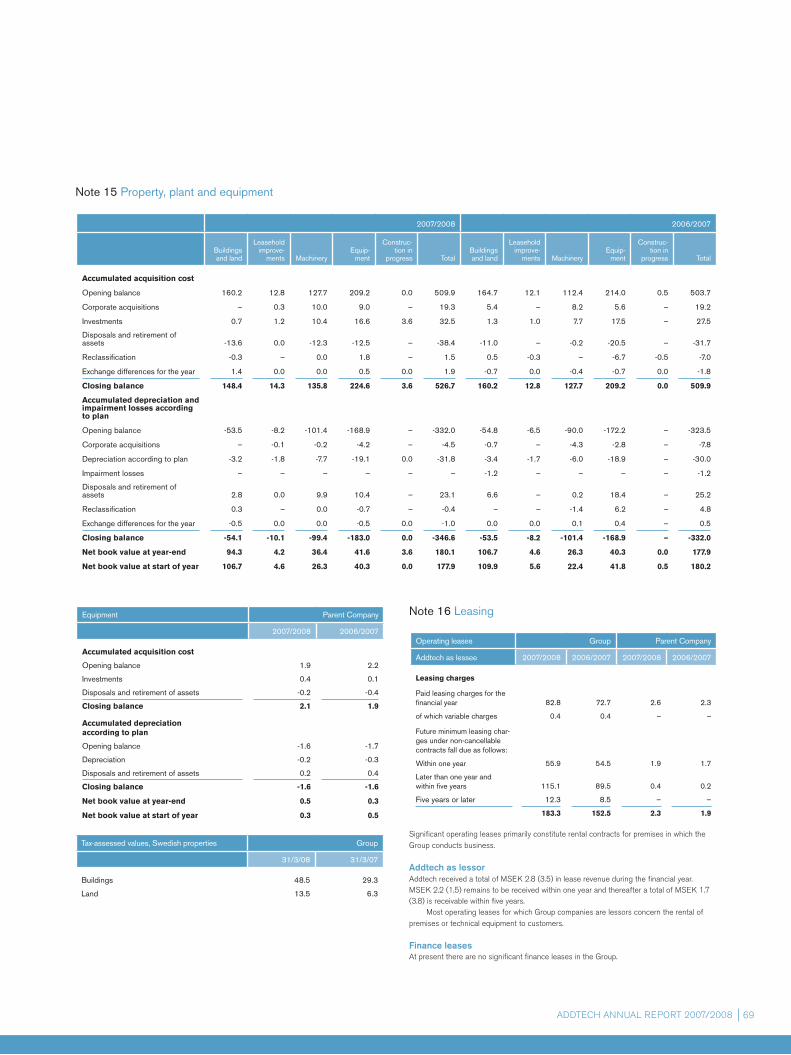
Addtech AnnuAl report 2007/2008 69
Note 15 Property, plant and equipment
2007/2008 2006/2007
Buildings and land
Leasehold improve-
ments MachineryEquip-
ment
Construc-tion in
progress TotalBuildings and land
Leasehold improve-
ments MachineryEquip-
ment
Construc-tion in
progress Total
Accumulated acquisition cost
Opening balance 160.2 12.8 127.7 209.2 0.0 509.9 164.7 12.1 112.4 214.0 0.5 503.7
Corporate acquisitions – 0.3 10.0 9.0 – 19.3 5.4 – 8.2 5.6 – 19.2
Investments 0.7 1.2 10.4 16.6 3.6 32.5 1.3 1.0 7.7 17.5 – 27.5
Disposals and retirement of assets -13.6 0.0 -12.3 -12.5 – -38.4 -11.0 – -0.2 -20.5 – -31.7
Reclassification -0.3 – 0.0 1.8 – 1.5 0.5 -0.3 – -6.7 -0.5 -7.0
Exchange differences for the year 1.4 0.0 0.0 0.5 0.0 1.9 -0.7 0.0 -0.4 -0.7 0.0 -1.8
Closing balance 148.4 14.3 135.8 224.6 3.6 526.7 160.2 12.8 127.7 209.2 0.0 509.9
Accumulated depreciation and impairment losses according to plan
Opening balance -53.5 -8.2 -101.4 -168.9 – -332.0 -54.8 -6.5 -90.0 -172.2 – -323.5
Corporate acquisitions – -0.1 -0.2 -4.2 – -4.5 -0.7 – -4.3 -2.8 – -7.8
Depreciation according to plan -3.2 -1.8 -7.7 -19.1 0.0 -31.8 -3.4 -1.7 -6.0 -18.9 – -30.0
Impairment losses – – – – – – -1.2 – – – – -1.2
Disposals and retirement of assets 2.8 0.0 9.9 10.4 – 23.1 6.6 – 0.2 18.4 – 25.2
Reclassification 0.3 – 0.0 -0.7 – -0.4 – – -1.4 6.2 – 4.8
Exchange differences for the year -0.5 0.0 0.0 -0.5 0.0 -1.0 0.0 0.0 0.1 0.4 – 0.5
Closing balance -54.1 -10.1 -99.4 -183.0 0.0 -346.6 -53.5 -8.2 -101.4 -168.9 – -332.0
Net book value at year-end 94.3 4.2 36.4 41.6 3.6 180.1 106.7 4.6 26.3 40.3 0.0 177.9
Net book value at start of year 106.7 4.6 26.3 40.3 0.0 177.9 109.9 5.6 22.4 41.8 0.5 180.2
Equipment Parent Company
2007/2008 2006/2007
Accumulated acquisition cost
Opening balance 1.9 2.2
Investments 0.4 0.1
Disposals and retirement of assets -0.2 -0.4
Closing balance 2.1 1.9
Accumulated depreciation according to plan
Opening balance -1.6 -1.7
Depreciation -0.2 -0.3
Disposals and retirement of assets 0.2 0.4
Closing balance -1.6 -1.6
Net book value at year-end 0.5 0.3
Net book value at start of year 0.3 0.5
Tax-assessed values, Swedish properties Group
31/3/08 31/3/07
Buildings 48.5 29.3
Land 13.5 6.3
Note 16 Leasing
Operating leases Group Parent Company
Addtech as lessee 2007/2008 2006/2007 2007/2008 2006/2007
Leasing charges
Paid leasing charges for the financial year 82.8 72.7 2.6 2.3
of which variable charges 0.4 0.4 – –
Future minimum leasing char-ges under non-cancellable contracts fall due as follows:
Within one year 55.9 54.5 1.9 1.7
Later than one year and within five years 115.1 89.5 0.4 0.2
Five years or later 12.3 8.5 – –
183.3 152.5 2.3 1.9
Significant operating leases primarily constitute rental contracts for premises in which the Group conducts business.
Addtech as lessorAddtech received a total of MSeK 2.8 (3.5) in lease revenue during the financial year. MSeK 2.2 (1.5) remains to be received within one year and thereafter a total of MSeK 1.7 (3.8) is receivable within five years. Most operating leases for which Group companies are lessors concern the rental of premises or technical equipment to customers.
Finance leasesAt present there are no significant finance leases in the Group.
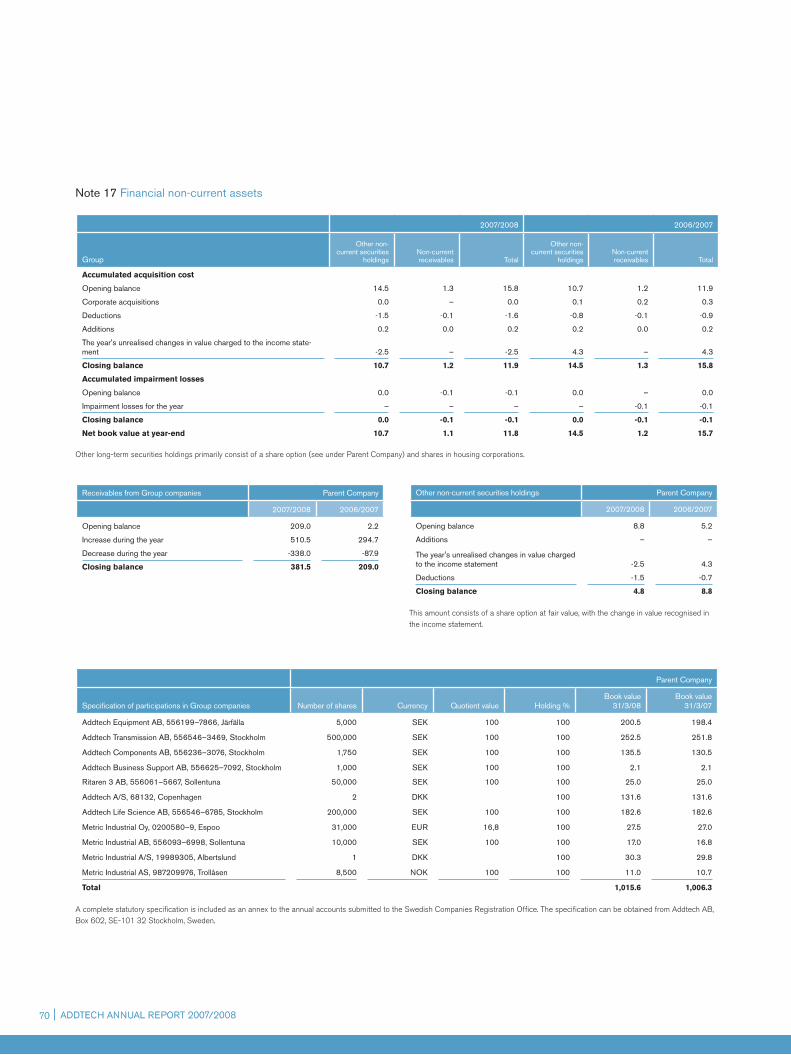
Addtech AnnuAl report 2007/200870 Addtech AnnuAl report 2007/200870
Note 17 Financial non-current assets
2007/2008 2006/2007
Group
Other non-current securities
holdingsNon-current receivables Total
Other non-current securities
holdingsNon-current receivables Total
Accumulated acquisition cost
Opening balance 14.5 1.3 15.8 10.7 1.2 11.9
Corporate acquisitions 0.0 – 0.0 0.1 0.2 0.3
Deductions -1.5 -0.1 -1.6 -0.8 -0.1 -0.9
Additions 0.2 0.0 0.2 0.2 0.0 0.2
The year's unrealised changes in value charged to the income state-ment -2.5 – -2.5 4.3 – 4.3
Closing balance 10.7 1.2 11.9 14.5 1.3 15.8
Accumulated impairment losses
Opening balance 0.0 -0.1 -0.1 0.0 – 0.0
Impairment losses for the year – – – – -0.1 -0.1
Closing balance 0.0 -0.1 -0.1 0.0 -0.1 -0.1
Net book value at year-end 10.7 1.1 11.8 14.5 1.2 15.7
other long-term securities holdings primarily consist of a share option (see under parent company) and shares in housing corporations.
Receivables from Group companies Parent Company
2007/2008 2006/2007
Opening balance 209.0 2.2
Increase during the year 510.5 294.7
Decrease during the year -338.0 -87.9
Closing balance 381.5 209.0
Other non-current securities holdings Parent Company
2007/2008 2006/2007
Opening balance 8.8 5.2
Additions – –
The year's unrealised changes in value charged to the income statement -2.5 4.3
Deductions -1.5 -0.7
Closing balance 4.8 8.8
this amount consists of a share option at fair value, with the change in value recognised in the income statement.
Parent Company
Specification of participations in Group companies Number of shares Currency Quotient value Holding %Book value
31/3/08Book value
31/3/07
Addtech Equipment AB, 556199–7866, Järfälla 5,000 SEK 100 100 200.5 198.4
Addtech Transmission AB, 556546–3469, Stockholm 500,000 SEK 100 100 252.5 251.8
Addtech Components AB, 556236–3076, Stockholm 1,750 SEK 100 100 135.5 130.5
Addtech Business Support AB, 556625–7092, Stockholm 1,000 SEK 100 100 2.1 2.1
Ritaren 3 AB, 556061–5667, Sollentuna 50,000 SEK 100 100 25.0 25.0
Addtech A/S, 68132, Copenhagen 2 DKK 100 131.6 131.6
Addtech Life Science AB, 556546–6785, Stockholm 200,000 SEK 100 100 182.6 182.6
Metric Industrial Oy, 0200580–9, Espoo 31,000 EUR 16,8 100 27.5 27.0
Metric Industrial AB, 556093–6998, Sollentuna 10,000 SEK 100 100 17.0 16.8
Metric Industrial A/S, 19989305, Albertslund 1 DKK 100 30.3 29.8
Metric Industrial AS, 987209976, Trollåsen 8,500 NOK 100 100 11.0 10.7
Total 1,015.6 1,006.3
A complete statutory specification is included as an annex to the annual accounts submitted to the Swedish companies registration office. the specification can be obtained from Addtech AB, Box 602, Se-101 32 Stockholm, Sweden.

Addtech AnnuAl report 2007/2008 71Addtech AnnuAl report 2007/2008 71
Note 20 Shareholders’ equity
gROuP
Other contributed capital refers to equity contributed by shareholders.
Reserves Group
2007/2008 2006/2007
Foreign currency translation reserve
Opening translation reserve 6.9 8.4
Translation differences for the year 4.4 -1.5
Closing translation reserve 11.3 6.9
Hedging reserve
Opening hedging reserve 0.6 -0.4
Revaluations recognised directly in equity -2.1 1.0
Recognised in the income statement upon disposal -0.6 0.3
Recognised in the income statement upon impairment (other operating income/expenses) – –
Taxes attributable to the year’s revaluations 0.3 -0.3
Closing hedging reserve -1.8 0.6
Total reserves 9.5 7.5
Foreign currency translation reservethe translation reserve includes all exchange differences that arise when financial reports of foreign operations prepared in a currency other than the Group’s currency are translated into the currency of the Group’s financial reports. the parent company and Group present their financial reports in Swedish kronor, SeK.
hedging reservethe hedging reserve includes the effective portion of the accumulated net change in fair value for a cash-flow hedge attributable to hedge transactions that have not yet occurred.
Retained earnings, including profit for the yearretained earnings including profit for the year include earnings in the parent company and its subsidiaries. prior provisions to the legal reserve are included in this equity item.
Repurchased sharesrepurchased shares includes the acquisition cost of own shares held in treasury (known as treasury shares) by the parent company. At the balance sheet date, the Group’s holding of treasury shares was 1,425,000 (1,199,000).
Dividend After the balance sheet date, the Board of directors proposed a dividend of SeK 7.00 per share. the dividend is subject to approval by the Annual General Meeting on 25 August 2008.
PARENt COMPANy
Restricted reservesrestricted reserves are funds that cannot be paid out as dividends.
legal reservethe purpose of the legal reserve is to save a portion of net profit that will not be used to cover a loss carried forward.
Retained earningsretained earnings comprise the previous year’s unrestricted equity, less any provision to the legal reserve and less any dividend paid. together with profit for the year and any fair value reserve, retained earnings constitute the sum of unrestricted equity, that is, the amount available to be paid as dividends to shareholders.
Shares in Group companies Parent Company
2007/2008 2006/2007
Accumulated acquisition cost
Opening balance 1,292.3 1,201.1
Shareholder contributions 7.8 6.9
Investments – 84.3
Adjustment of additional purchase price 1.5 –
Closing balance 1,301.6 1,292.3
Accumulated impairment losses
Opening balance -286.0 -280.0
Impairment losses for the year – -6.0
Closing balance -286.0 -286.0
Net book value at year-end 1,015.6 1,006.3
Net book value at start of year 1,006.3 921.1
Note 18 Inventories
Group
31/3/08 31/3/07
Raw materials and consumables 43.3 38.2
Work in progress 19.5 20.0
Finished goods 464.7 393.7
Total 527.5 451.9
the cost of sales for the Group includes a MSeK 10.0 (16.6) impairment loss on inventories. no significant reversals of prior impairment losses were made during 2007/2008 or 2006/2007.
Note 19 Prepaid expenses and accrued income
Group Parent Company
31/3/08 31/3/07 31/3/08 31/3/07
Rent 10.0 10.7 0.5 0.5
Insurance premiums 4.7 5.9 1.3 3.2
Pension costs 2.7 1.5 0.6 0.2
Leasing charges 3.0 2.5 0.0 0.0
Other prepaid expenses 16.0 17.5 0.7 1.1
Other accrued income 2.8 2.9 0.3 0.2
Total 39.2 41.0 3.4 5.2
Note 17 Cont’d.

Addtech AnnuAl report 2007/200872 Addtech AnnuAl report 2007/200872
Note 20 Cont’d.
Number of sharesthe number of shares at 31 March 2008 consisted of (a) 1,103,814 class A shares, entitling the holders to 10 votes per share, and (b) 22,529,018 class B shares, entitling the holders to 1 vote per share. the quotient value of the share is SeK 2.15 . the company has repurchased 1,425,000 class B shares, 300,000 of which during the 2007/2008 financial year, within the framework of the company’s ongoing repurchase programme. After subtrac-ting repurchased shares, the number of class B shares outstanding is 21,104,018 net.
Number of shares outstanding Class A shares Class B shares All share classes
At start of year 1,103,814 21,330,018 22,433,832
Repurchase of own shares – -300,000 -300,000
Personnel options exercised – 74,000 74,000
At year-end 1,103,814 21,104,018 22,207,832
Note 21 Untaxed reserves
Parent Company
31/3/08 31/3/07
Tax allocation reserve, allocation for tax assessment 2003 – 7.8
Tax allocation reserve, allocation for tax assessment 2004 9.5 9.5
Tax allocation reserve, allocation for tax assessment 2005 15.5 15.5
Tax allocation reserve, allocation for tax assessment 2006 18.5 18.5
Tax allocation reserve, allocation for tax assessment 2007 26.2 26.2
Tax allocation reserve, allocation for tax assessment 2008 46.7 46.7
Tax allocation reserve, allocation for tax assessment 2009 57.9 –
Closing balance 174.3 124.2
MSeK 48.8 of the parent company’s total untaxed reserves of MSeK 174.3 represent deferred tax included in the deferred tax line item in the consolidated balance sheet.
Note 22 Provisions for pensions and similar obligations
Addtech has defined-benefit pension plans in Sweden and norway. In these plans, a pension is determined mainly by the salary received at the time of retirement. the plans cover many employees, but defined-contribution plans also apply. Subsidiaries in other countries in the Group mainly have defined-contribution pension plans. the parent company’s data on pensions are reported in accordance with the Swedish Act on Safeguarding pension obligations.
Defined-benefit pension plansthese pension plans primarily comprise retirement pensions. each employer generally has an obligation to pay a lifelong pension. vesting is based on the number of years of employ-ment. the employee must subscribe to the plan for a certain number of years to be fully entitled to retirement benefits. each year increases the employee’s entitlement to retirement benefits, which is reported as pension earned during the period and as an increase in pen-sion obligations. In norway there are funded pension plans. these pension obligations are secured by plan assets. Addtech applies the “corridor” method. corridor rules stipulate that part of the actuarial gains and losses be recognised in the income statement and balance sheet in the next period if they exceed the higher of:– 10 percent of the present value of the pension obligation and– 10 percent of the fair value of the plan assets.
At the end of the year the actuarial losses equalled about 9 percent of the present value of pension obligations. obligations for retirement pensions and family pensions for salaried employees in Swe-den are secured by insurance in Alecta. According to statement urA 42 of the emerging Issues task Force of the Swedish Financial reporting Board (formerly the Swedish Financial Accounting Standards council), this is a defined-benefit plan covering several employers. For the 2007/2008 financial year, the company has not had access to information enabling it to report this plan as a defined-benefit plan. the pension plan according to Itp, secured by insurance in Alecta, is therefore reported as a defined-contribution plan. the year’s fees for pension insurance with Alecta totalled MSeK 10.7 (11.5).
Defined-contribution pension plansthese plans are mainly retirement pension plans, disability pensions and family pensions. premiums are paid on an ongoing basis during the year by each Group company to separate legal entities, such as insurance companies. the size of the premium is based on the salary. the pension cost for the period is included in the income statement.
Pension liability as per balance sheet Group Parent Company
31/3/08 31/3/07 31/3/08 31/3/07
Pension liability PRI 170.3 162.9 8.6 8.7
Other pension obligations 7.8 9.4 0.0 0.1
Total 178.1 172.3 8.6 8.8
Reconciliation of net amount for pensions in the balance sheet Group Parent Company
2007/2008 2006/2007 2007/2008 2006/2007
Net amount in the balance sheet, 1 April 172.2 163.0 8.7 8.8
Cost of defined-benefit plans 12.6 15.4 0.6 0.5
Payment of pension benefits -3.6 -3.0 -0.7 -0.6
Funds contributed by employer -3.0 -2.2 – –
Exchange differences 0.2 -0.2 – –
Other -0.3 -0.8 – –
Net amount in balance sheet 178.1 172.2 8.6 8.7
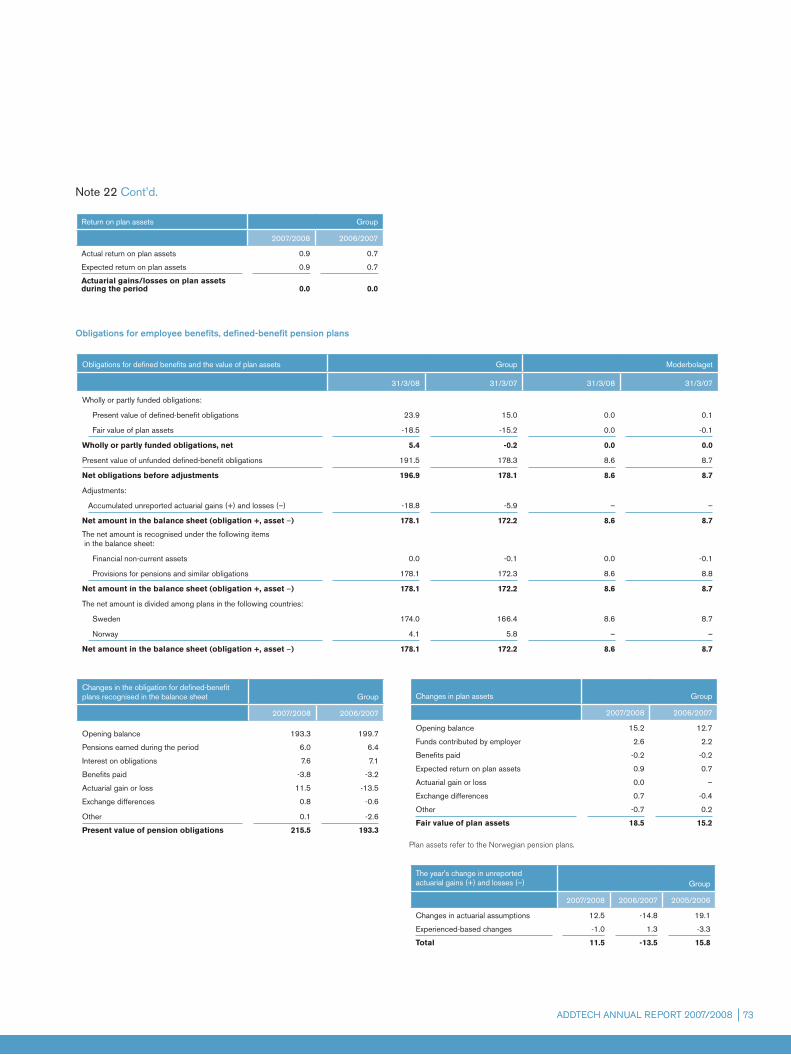
Addtech AnnuAl report 2007/2008 73Addtech AnnuAl report 2007/2008 73
Note 22 Cont’d.
Return on plan assets Group
2007/2008 2006/2007
Actual return on plan assets 0.9 0.7
Expected return on plan assets 0.9 0.7
Actuarial gains/losses on plan assets during the period 0.0 0.0
Obligations for employee benefits, defined-benefit pension plans
Obligations for defined benefits and the value of plan assets Group Moderbolaget
31/3/08 31/3/07 31/3/08 31/3/07
Wholly or partly funded obligations:
Present value of defined-benefit obligations 23.9 15.0 0.0 0.1
Fair value of plan assets -18.5 -15.2 0.0 -0.1
Wholly or partly funded obligations, net 5.4 -0.2 0.0 0.0
Present value of unfunded defined-benefit obligations 191.5 178.3 8.6 8.7
Net obligations before adjustments 196.9 178.1 8.6 8.7
Adjustments:
Accumulated unreported actuarial gains (+) and losses (–) -18.8 -5.9 – –
Net amount in the balance sheet (obligation +, asset –) 178.1 172.2 8.6 8.7
The net amount is recognised under the following items in the balance sheet:
Financial non-current assets 0.0 -0.1 0.0 -0.1
Provisions for pensions and similar obligations 178.1 172.3 8.6 8.8
Net amount in the balance sheet (obligation +, asset –) 178.1 172.2 8.6 8.7
The net amount is divided among plans in the following countries:
Sweden 174.0 166.4 8.6 8.7
Norway 4.1 5.8 – –
Net amount in the balance sheet (obligation +, asset –) 178.1 172.2 8.6 8.7
Changes in the obligation for defined-benefit plans recognised in the balance sheet Group
2007/2008 2006/2007
Opening balance 193.3 199.7
Pensions earned during the period 6.0 6.4
Interest on obligations 7.6 7.1
Benefits paid -3.8 -3.2
Actuarial gain or loss 11.5 -13.5
Exchange differences 0.8 -0.6
Other 0.1 -2.6
Present value of pension obligations 215.5 193.3
Changes in plan assets Group
2007/2008 2006/2007
Opening balance 15.2 12.7
Funds contributed by employer 2.6 2.2
Benefits paid -0.2 -0.2
Expected return on plan assets 0.9 0.7
Actuarial gain or loss 0.0 –
Exchange differences 0.7 -0.4
Other -0.7 0.2
Fair value of plan assets 18.5 15.2
plan assets refer to the norwegian pension plans.
The year's change in unreported actuarial gains (+) and losses (–) Group
2007/2008 2006/2007 2005/2006
Changes in actuarial assumptions 12.5 -14.8 19.1
Experienced-based changes -1.0 1.3 -3.3
Total 11.5 -13.5 15.8

Addtech AnnuAl report 2007/200874 Addtech AnnuAl report 2007/200874
Note 22 Cont’d.
Pension costs Group Parent Company
2007/2008 2006/2007 2007/2008 2006/2007
Defined-benefit pension plans
Cost for pensions earned during the year 6.0 6.5 – –
Interest expense 7.6 7.1 0.4 0.4
Expected return on plan assets -0.9 -0.7 – –
Recognised actuarial gains (–) and losses (+) -0.1 2.5 – –
Total cost of defined-benefit plans 12.6 15.4 0.4 0.4
Total cost of defined-contribution plans 55.0 50.0 2.9 2.8
Social security costs on pension costs 10.5 8.7 0.8 0.7
Total cost of benefits after termination of employment 78.1 74.1 4.1 3.9
Allocation of pension costs in the income statement Group
2007/2008 2006/2007
Cost of sales 12.4 11.0
Selling and administrative expenses 59.0 56.7
Net financial items 6.7 6.4
Total pension costs 78.1 74.1
Actuarial assumptions 2007/2008 2006/2007
Sweden Norway Sweden Norway
The following material actuarial assumptions were applied in calculating obligations:
Discount rate, 1 April 3.90% 4.75% 3.60% 4.10%
Discount rate, 31 March 4.20% 4.50% 3.90% 4.75%
Expected return on plan assets – 5.50% – 5.75%
Future salary increases 3.50% 4.50% 3.50% 4.00%
Future increases in pensions (change in income base amount) 3.00% – 3.00% –
Employee turnover 5.00% 2.00-5.00% 5.00% 2.00-5.00%
Expected “G-regulation” – 4.25% – 4.00%
Mortality table dus 07 K2005 p94 K63
Future increases in pensions are based on inflation assumptions. remaining period of employment (mortality) is based on statistical tables developed by Finansinspektionen (Sweden’s Financial Supervisory Authority) and the Insurance Society, in Sweden dus 07 and in norway K2005. the expected increase in government contributions “G-regulation” is used for calculations in norway in the same manner as the “base amount” is used in Sweden.
Note 23 Provisions
Group 2007/2008 Premises Personnel Warranties Other Total
Carrying amount at start of period 3.6 2.9 5.0 1.6 13.1
Provisions made during the period 0.7 0.8 0.1 – 1.6
Utilised during the period -1.1 -1.4 -0.4 -1.0 -3.9
Unutilised amounts reversed – -0.7 – -0.6 -1.3
Carrying amount at end of period 3.2 1.6 4.7 0.0 9.5
Premisesthe provision for premises refers to premises that the Group has vacated and cannot sublet or use during the remainder of the lease.
Personnelthe provision refers to personnel costs, including estimated remuneration upon termination of employment in connection with changes in operations. A provision is made when there is an ap-proved restructuring plan and the restructuring has been announced.
Warrantiesthe provision is calculated based on historical data for warranties associated with products and services.
Otherthis includes provisions not classified under premises, personnel or warranties, such as equipment that cannot be used due to changes in operations.All provisions are classified as current provisions and are expected to result in an outflow of resources within 12 months of the balance sheet date.

Addtech AnnuAl report 2007/2008 75Addtech AnnuAl report 2007/2008 75
Note 24 Non-current interest-bearing liabilities
Group Moderbolaget
31/3/08 31/3/07 31/3/08 31/3/07
Liabilities to credit institutions:
Maturing within 2 years 38.8 1.0 37.8 –
Maturing within 3 years 18.9 0.7 18.9 –
Maturing within 4 years – 0.4 – –
Non-current liabilities to credit institutions 57.7 2.1 56.7 –
Other interest-bearing liabilities 10.8 7.7 – –
Total 68.5 9.8 56.7 –
the Addtech Group’s non-current liabilities to credit institutions are divided among curren-cies as follows:
Currency 31/3/08 31/3/07
Local currency MSEK
Local currency MSEK
EUR 0.1 1.0 0.2 1.8
DKK 45.0 56.7 0.3 0.3
Total 57.7 2.1
the loan in eur carry variable interest. At 31 March 2008 the interest rate averaged 5.00 percent.the loan in dKK carries a fixed rate. At 31 March 2008 the interest rate averaged 4.78 percent.
Parent Company
31/3/08 31/3/07
Liabilities to Group companies 9.9 70.3
Total 9.9 70.3
the parent company’s liabilities to Group companies have no fixed maturity dates.
Note 25 Current interest-bearing liabilities
Group Parent Company
31/3/08 31/3/07 31/3/08 31/3/07
bank overdraft facility
Approved credit limit 333.6 246.3 332.7 244.7
Unutilised portion -284.3 -219.9 -284.2 -218.8
Credit amount utilised 49.3 26.4 48.5 25.9
Other liabilities to credit institutions 121.2 120.0 120.0 120.0
Other interest-bearing liabilities 17.3 3.1 – –
Total 187.8 149.5 168.5 145.9
the Addtech Group’s current liabilities to credit institutions are divided among currencies as follows:
Currency 31/3/08 31/3/07
Local currency MSEK
Local currency MSEK
SEK 120.0 120.0 120.0 120.0
EUR 0.1 0.8 0.0 0.0
DKK 0.3 0.4 0.0 0.0
Total 121.2 120.0
of the loans in Swedish kronor MSeK 100 are at 31 March 2008 subject to a variable rate of 4.96 percent and MSeK 20 carry variable rate of 4.65 percent the variable interest rate that applied to the loans in eur and dKK was 7.0 percent and 5.13 percent respectively at 31 March 2008.
Note 26 Accrued expenses and deferred income
Group Parent Company
31/3/08 31/3/07 31/3/08 31/3/07
Rental revenue 0.3 0.5 – –
Other deferred income 2.3 3.9 – –
Salaries and holiday pay 110.3 97.9 4.4 4.1
Social security contribu-tions and pensions 68.4 65.5 10.3 11.9
Other accrued expenses 29.3 26.1 2.0 3.0
Total 210.6 193.9 16.7 19.0
other accrued expenses mainly comprise overhead accruals.
Note 27 Anticipated recovery periods for assets, provisions and liabilities
Amounts expected to be recovered 2007/2008
GroupWithin 12
monthsAfter 12 months Total
Non-current assets
Intangible non-current assets1) 30.0 490.8 520.8
Property, plant and equipment1) 32.0 148.1 180.1
Financial non-current assets – 11.8 11.8
Current assets
Inventories 527.5 – 527.5
Tax assets 2.4 – 2.4
Accounts receivable 618.5 – 618.5
Prepaid expenses and accrued income 39.2 – 39.2
Other receivables 31.5 – 31.5
Cash and cash equivalents 77.5 – 77.5
Total assets 1,358.6 650.7 2,009.3
1) Anticipated depreciation/amortisation is recognised as an amount expected to be recovered within 12 months.
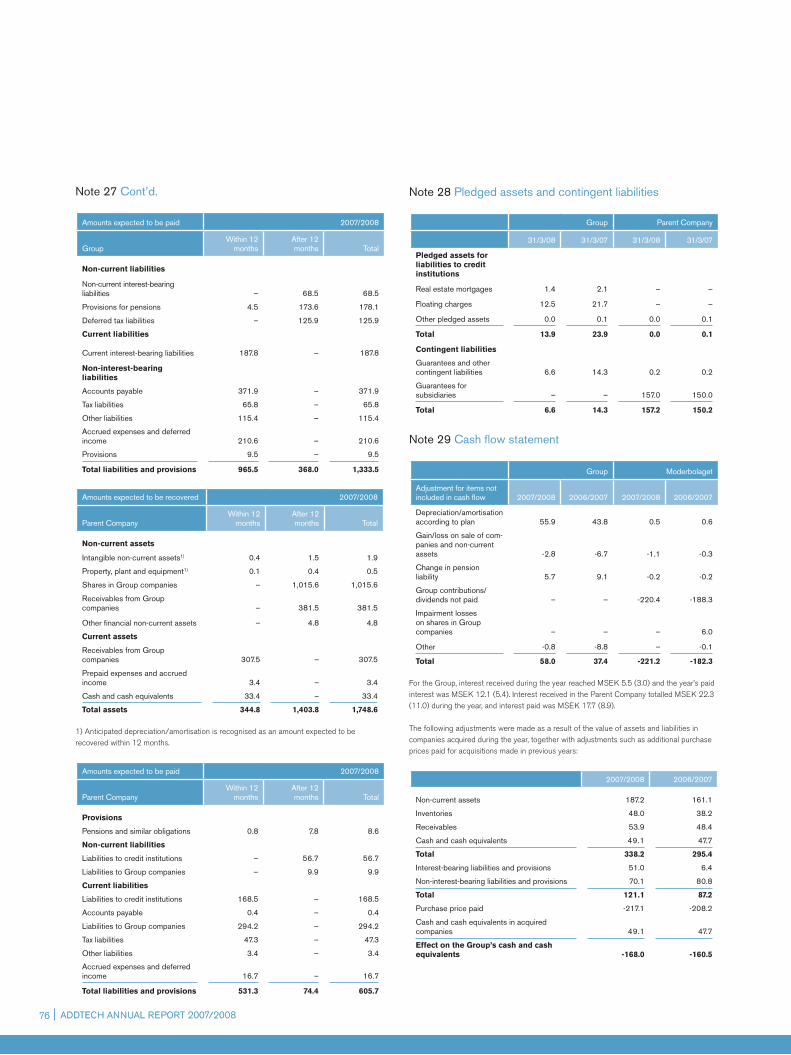
Addtech AnnuAl report 2007/200876 Addtech AnnuAl report 2007/200876
Note 27 Cont’d.
Amounts expected to be paid 2007/2008
GroupWithin 12
monthsAfter 12 months Total
Non-current liabilities
Non-current interest-bearing liabilities – 68.5 68.5
Provisions for pensions 4.5 173.6 178.1
Deferred tax liabilities – 125.9 125.9
Current liabilities
Current interest-bearing liabilities 187.8 – 187.8
Non-interest-bearing liabilities
Accounts payable 371.9 – 371.9
Tax liabilities 65.8 – 65.8
Other liabilities 115.4 – 115.4
Accrued expenses and deferred income 210.6 – 210.6
Provisions 9.5 – 9.5
Total liabilities and provisions 965.5 368.0 1,333.5
Amounts expected to be recovered 2007/2008
Parent CompanyWithin 12
monthsAfter 12 months Total
Non-current assets
Intangible non-current assets1) 0.4 1.5 1.9
Property, plant and equipment1) 0.1 0.4 0.5
Shares in Group companies – 1,015.6 1,015.6
Receivables from Group companies – 381.5 381.5
Other financial non-current assets – 4.8 4.8
Current assets
Receivables from Group companies 307.5 – 307.5
Prepaid expenses and accrued income 3.4 – 3.4
Cash and cash equivalents 33.4 – 33.4
Total assets 344.8 1,403.8 1,748.6
1) Anticipated depreciation/amortisation is recognised as an amount expected to be recovered within 12 months.
Amounts expected to be paid 2007/2008
Parent CompanyWithin 12
monthsAfter 12 months Total
Provisions
Pensions and similar obligations 0.8 7.8 8.6
Non-current liabilities
Liabilities to credit institutions – 56.7 56.7
Liabilities to Group companies – 9.9 9.9
Current liabilities
Liabilities to credit institutions 168.5 – 168.5
Accounts payable 0.4 – 0.4
Liabilities to Group companies 294.2 – 294.2
Tax liabilities 47.3 – 47.3
Other liabilities 3.4 – 3.4
Accrued expenses and deferred income 16.7 – 16.7
Total liabilities and provisions 531.3 74.4 605.7
Note 28 Pledged assets and contingent liabilities
Group Parent Company
31/3/08 31/3/07 31/3/08 31/3/07
Pledged assets for liabilities to credit institutions
Real estate mortgages 1.4 2.1 – –
Floating charges 12.5 21.7 – –
Other pledged assets 0.0 0.1 0.0 0.1
Total 13.9 23.9 0.0 0.1
Contingent liabilities
Guarantees and other contingent liabilities 6.6 14.3 0.2 0.2
Guarantees for subsidiaries – – 157.0 150.0
Total 6.6 14.3 157.2 150.2
Note 29 Cash flow statement
Group Moderbolaget
Adjustment for items not included in cash flow 2007/2008 2006/2007 2007/2008 2006/2007
Depreciation/amortisation according to plan 55.9 43.8 0.5 0.6
Gain/loss on sale of com-panies and non-current assets -2.8 -6.7 -1.1 -0.3
Change in pension liability 5.7 9.1 -0.2 -0.2
Group contributions/dividends not paid – – -220.4 -188.3
Impairment losses on shares in Group companies – – – 6.0
Other -0.8 -8.8 – -0.1
Total 58.0 37.4 -221.2 -182.3
For the Group, interest received during the year reached MSeK 5.5 (3.0) and the year’s paid interest was MSeK 12.1 (5.4). Interest received in the parent company totalled MSeK 22.3 (11.0) during the year, and interest paid was MSeK 17.7 (8.9). the following adjustments were made as a result of the value of assets and liabilities in companies acquired during the year, together with adjustments such as additional purchase prices paid for acquisitions made in previous years:
2007/2008 2006/2007
Non-current assets 187.2 161.1
Inventories 48.0 38.2
Receivables 53.9 48.4
Cash and cash equivalents 49.1 47.7
Total 338.2 295.4
Interest-bearing liabilities and provisions 51.0 6.4
Non-interest-bearing liabilities and provisions 70.1 80.8
Total 121.1 87.2
Purchase price paid -217.1 -208.2
Cash and cash equivalents in acquired companies 49.1 47.7
Effect on the Group’s cash and cash equivalents -168.0 -160.5

Addtech AnnuAl report 2007/2008 77Addtech AnnuAl report 2007/2008 77
Note 29 Cont’d.
Acquisition of businesses during the year
Company CountryAcquisition
dateOwner-ship, %
Acquisition price
LabRobot Products AB Sweden 2/7/07 100% 19.7
Chemo Electric A/S Denmark 2/7/07 100% 37.6
Amitra Oy Finland 2/7/07 100% 22.3
Moving Hjulex AB Sweden 6/7/07 100% 32.5
Inline Dreamteam (net assets) Sweden 31/12/07 100% 4.8
Immunkemi F&D AB Sweden 4/1/08 100% 20.6
Allan Rehnström Tryckluft-Vakuum AB
Sweden 10/1/08 100% 9.3
Kouvo Automation Oy Finland 14/1/08 100% 21.6
Codan Tech A/S och Codan Tech Qingdao Rubber & Plastic Parts Co., Ltd.
Denmark and China
25/1/08 100% 9.0
Eurolaite Oy Finland 1/2/08 100% 32.0
S.E.G. Process (net assets) Sweden 3/3/08 100% 3.9
213.3All businesses acquired during the year were added to the consolidated financial statements using the acquisition method.
due to disposal of the subsidiary tubex hydraul AB in 2005/2006, receivables were adjusted by MSeK -1.0, and the purchase price paid in was adjusted by MSeK 1.0 when preparing the cash flow statement for 2006/2007.
Cash and cash equivalentscash and cash equivalents in the cash flow statement consist of cash at bank and in hand. the same definition applied to determine cash and cash equivalents in the balance sheet was applied in the cash flow statement.
Note 30 Corporate acquisitions
Acquisitions in 2007/2008In total, 11 acquisitions took place during the financial year, with a combined annual turnover of MSeK 375. Assets and liabilities related to the acquisitions amounts to:
Carrying amount at time
of acquisitionAdjustment to
fair value Fair value
Supplier relationships, customer relationships and technology 0.0 105.3 105.3
Trademarks 0.3 0.0 0.3
Property, plant and equipment 14.8 – 14.8
Financial non-current assets 0.1 – 0.1
Inventories 48.0 – 48.0
Current receivables 59.8 – 59.8
Cash and cash equivalents 49.1 – 49.1
Deferred tax liability 2.3 -27.0 -24.7
Non-current liabilities -6.2 – -6.2
Current liabilities -91.0 -2.4 -93.4
Net assets acquired 77.2 75.9 153.1
Goodwill 60.2
Purchase price 213.3
Less: cash and cash equivalents in acquired businesses -49.1
Less: purchase price not yet paid -22.9
Effect on the Group’s cash and cash equivalents 141.3
1) the purchase price is stated including MSeK 2.8 in acquisition expenses.
the total purchase price for these acquisitions is MSeK 213, of which MSeK 166 was allo-cated to goodwill and other intangible assets. together, these acquisitions had an impact of MSeK 148 on the Addtech Group’s revenue, MSeK 11 on operating profit/loss, and MSeK 4 on profit after tax for the period. had the acquisitions been completed at 1 April 2007, their impact would have been an estimated MSeK 375 on the Group’s revenue, about MSeK 20 on operating profit and some MSeK 9 on profit after tax for the period. the values allocated to intangible non-current assets, such as supplier relationships, customer relationships, technology and trademarks, were assessed at the discounted value of future cash flows. thus an assessment was made of which types of assets in each unit acquired can be assumed to be significant to the companies’ future capacity to generate a return on the purchase price. the period of amortisation/depreciation is based on an assessment of the annual loss of part of the revenues attributable to each asset. Supplier relationships are amortised over a period of 25-33 years; customer relationships and tech-nology are amortised and depreciated over 5-15 years. trademarks are not amortised but are tested annually for impairment as per IAS 36. the goodwill resulting from these acquisitions is attributable to expectations that the Group’s position in the markets in question for each acquisition will grow stronger and to the knowledge accumulated in the companies acquired.
Note 31 Earnings per share (EPS) before and after dilution
2007/2008 2006/2007
EPS, before dilution (SEK) 12.70 11.15
EPS, after dilution (SEK) 12.50 11.00
See the definitions on page 37 for the method of calculation. the numerators and denominators used to calculate the above earnings per share (epS) are derived as stated below.
EPS before dilutionthe calculation of epS for 2007/2008 is based on profit for the year attributable to the common equity holders of the parent company (holders of class A common shares), total-ling MSeK 284 (253), and a weighted average number of shares outstanding (‘000s) during 2007/2008 amounting to 22,385 (22,652). the two components were calculated in the following manner:
2007/2008 2006/2007
Profit for the year attributable to the Parent Company’s ordinary equity holders, before dilution (MSEK) 284 253
Weighted average number of common shares outstanding, before dilution
In thousands of shares 2007/2008 2006/2007
Total number of common shares 1 April 22,434 23,048
Effect of shares held in treasury (known as treasury shares) -49 -396
Weighted average number of common shares during the year, before dilution 22,385 22,652
EPS after dilutionthe calculation of epS after dilution for 2007/2008 is based on earnings attributable to the common equity holders of the parent company, totalling MSeK 284 (253), and a weighted average number of shares outstanding (‘000s) during 2007/2008 of 22,678 (22,977). the two components were calculated in the following manner:
2007/2008 2006/2007
Profit for the year attributable to the Parent Company’s ordinary equity holders, after dilution (MSEK) 284 253

Addtech AnnuAl report 2007/200878 Addtech AnnuAl report 2007/200878
Note 31 Cont’d.
Weighted average number of common shares outstanding, after dilution
In thousands of shares 2007/2008 2006/2007
Weighted average number of common shares during the year, before dilution 22,385 22,652
Effect of share options issued 293 325
Weighted average number of common shares during the year, after dilution 22,678 22,977
Note 32 Supplementary information
Addtech AB, corporate Id number 556302-9726, is the parent company of the Group.the company has its registered office in Stockholm, Stockholm county, and by Swedish law is a limited liability company.
head office address:Addtech ABBox 602Se–101 32 Stockholm, Swedentelephone +46–8–470 49 00fax +46–8–470 49 01website: www.addtech.com
Note 33 Related party disclosures
For the Addtech Group, related parties mainly comprise senior management. Information about personnel costs is provided in note 6 employees and personnel costs.
Note 34 Events after the balance sheet date
to reinforce the Addtech Group’s conditions for long-term profitable growth, the Group changed its organisation as from the start of the new financial year. the operations are organised in four business areas: Addtech components, Addtech energy & equipment, Addtech Industrial Solutions and Addtech life Science. on 30 April, Addtech acquired Minitec Finland oy and Minitec estonia oÜ, which are now part of the components business area. With annual revenue of Meur 1.6, the compa-nies sell profile and linear systems for production lines and processing stations – mainly to the Finnish engineering industry. the Addtech Group’s Industrial Solutions business area signed an agreement on 21 May to acquire all shares in emcomp holding AB. via subsidiaries, emcomp sells customised components and sub-systems in power transmission, radio, fibre optics, displays and other areas. emcomp has annual revenue of MSeK 72.

Addtech AnnuAl report 2007/2008 79
propoSed AllocAtIon oF eArnInGS
DIVIDENDthe Board of directors proposes a dividend of SeK 7.00 per share (6.00), amounting to a total distribution of MSeK 155 (135). Addtech’s dividend policy is to pay more than 50 per-cent of average Group profit after tax over a business cycle as a dividend. the proposed dividend represents a payout ratio of 55 percent (54).
PROPOSED ALLOCATION OF EARNINGSthe following amounts are available for distribution by the An-nual General Meeting of Addtech AB: retained earnings MSeK 679 profit for the year MSeK 223 MSEK 902
the Board of directors and the president propose that the funds available for distribution be allocated as follows: A dividend paid to shareholders of SeK 7.00 per share* MSeK 155 to be carried forward MSeK 747 MSEK 902
* Based on the number of shares outstanding at 1 June 2008. the final dividend payout may
change if the number of shares repurchased under the buyback programme changes prior to
the proposed dividend record date of 28 August 2008.
the Board of directors deems the proposed dividend to be justifiable in the context of the demands on Group equity made by Addtech’s operations, size and risks and the Group’s need for a strong balance sheet, liquidity and overall financial posi-tion. At the balance sheet date, equity in the parent company included MSeK 3 (5) relating to financial assets and liabilities valued at fair value in accordance with chapter 4, Section 14a of the Swedish Annual Accounts Act. the Board of directors and the president deems the con-solidated financial statements and annual accounts to be pre-pared in accordance with IFrS, as adopted by the eu, and with generally accepted accounting principles, and that they provide a true and fair overview of the financial position and re-sults of operations of the Group and the parent company. the administration report for the Group and the parent company gives a true and fair overview of the Group’s and the parent company’s operating activities, financial position and results of operations and describes significant risks and uncertainties to which the parent company and the companies that comprise the Group are exposed. the results of operations and financial position of the Group and the parent company are shown in the income statements, balance sheets, cash flow statements and notes to the financial statements.
Stockholm, 16 June 2008
Anders Börjesson chAIrMAn oF the BoArd
tom hedeliusdeputy chAIrMAn
eva elmstedtdIrector
urban Jansson dIrector
lars Spongberg dIrector
Johan SjöpreSIdent
Our audit report was submitted on 16 June 2008
KpMG Bohlins AB
George pettersson AuthorISed puBlIc AccountAnt
Addtech AnnuAl report 2007/200880
AudIt report
To the Annual General Meeting of the shareholders of Addtech Ab (publ)Corporate ID number 556302-9726
We have audited the annual accounts, the consolidated accounts, the accounting records and the administration of the board of directors and president of Addtech AB for the financial year from 1 April 2007 to 31 March 2008. the annual accounts of the company are included in the printed version of this document on pages 40-79. the board of directors and the president are responsible for these accounts and the administration of the company as well as for the application of the Annual Accounts Act when preparing the annual accounts and the application of International Financial reporting Standards IFrSs, as adopted by the eu, and the Annual Accounts Act when preparing the consolidated accounts. our responsibility is to express an opinion on the annual accounts, the consolidated accounts and the administration based on our audit. We conducted the audit in accordance with generally accepted auditing standards in Sweden. those standards require that we plan and perform the audit to obtain reasonable assurance that the annual accounts and the consolidated accounts are free of ma-terial misstatement. An audit includes examining, on a test basis, evidence supporting the amounts and disclosures in the accounts. An audit also includes assessing the accounting policies used and their application by the board of directors and the president and significant estimates made by the board of directors and the president when preparing the annual accounts and the consolidated accounts, as well as evaluating the overall presentation of information in the annual accounts and the consolidated accounts. As a basis for our opinion concerning discharge from liability, we examined significant decisions, actions taken and circumstances of the company in order to be able to determine the liability, if any, to the company of any board member or the president. We also examined whether any board member or the president has, in any other way, acted in contravention of the companies Act, the Annual Accounts Act or the Articles of Association. We believe that our audit provides a reasonable basis for our opinion set out below. the annual accounts have been prepared in accordance with the Annual Accounts Act and give a true and fair view of the company’s financial position and results of operations in accordance with generally accepted accounting principles in Sweden. the consolidated accounts have been prepared in accordance with International Financial reporting Standards IFrSs as adopted by the eu and the Annual Accounts Act and give a true and fair view of the Group’s financial position and results of operations. the statutory administration report is consistent with the other parts of the annual accounts and the consolidated accounts. We recommend to the annual meeting of shareholders that the income statements and balance sheets of the parent company and the Group be adopted, that the profit of the parent company be dealt with in accordance with the proposal in the statutory admi-nistration report and that the members of the board of directors and the president be discharged from liability for the financial year.
Stockholm, 16 June 2008
KpMG Bohlins AB
George petterssonAuthorISed puBlIc AccountAnt

Addtech AnnuAl report 2007/2008 81
InvItAtIon to the AnnuAl GenerAl MeetInG
WELCOME TO THE ANNUAL GENERAL MEETING
the Annual General Meeting of Addtech AB (publ) will be held at 4:00 pm on 25 August 2008 at the IvA conference centre, Grev turegatan 16, Stockholm.
NOTICE OF PARTICIPATION
Shareholders who wish to participate in the Annual GeneralMeeting must•beenteredintheshareholders’registermaintainedbyVPC
AB no later than tuesday, 19 August 2008,•notifytheCompany’sheadoffice:bymailatAddtechAB(publ),
Box 602, Se –101 32 Stockholm, Sweden, or by telephone at +46–8–470 4908, or by telefax at +46–8–470 4901, or by e-mail to [email protected], or by using the application form on the company’s website at www.addtech.com. notifi-cation must be received by 3:00 pm on thursday, 21 August 2008. Such notice must contain the shareholder’s name, personal identification number (company number), address, telephone number and the number of shares represented.
Shareholders whose shares are registered under a trustee must temporarily register their shares in their own name in or-der to exercise their voting rights at the Annual General Mee-ting. Such changes in registration must be completed no later than tuesday,19 August 2008. If a shareholder intends to participate through a proxy, the proxy notice must be sent to the company well before the An-nual General Meeting. A representative of a legal entity must send in a certified copy of the registration certificate or com-parable documents for authorisation.
PAYMENT OF DIVIDEND
the dividend resolution adopted by the Annual General Meeting will specify the date on which shareholders must be recorded in the share register maintained by vpc AB to be entitled to receive the dividend. the Board of directors has proposed thursday, 28 August 2008, as the record date. provided the Annual General Meeting adopts the proposal, the dividend is expected to be paid by vpc AB on tuesday, 2 September 2008, to shareholders of record at the record date.
CHANGE OF ADDRESS OR bANK ACCOUNT
Shareholders who have changed their name, address or account number should inform their trustee or account operator (bank) of any such change as soon as possible. A special form for this purpose is available at all branch offices of Swedish banks.
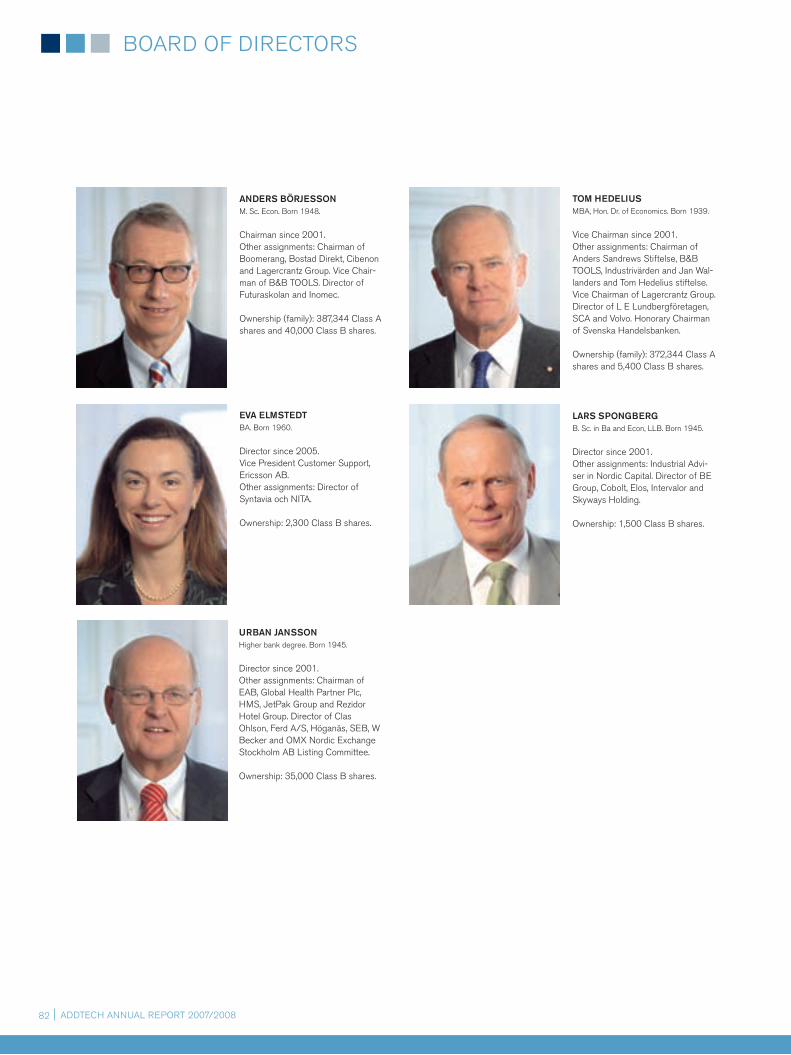
Addtech AnnuAl report 2007/200882
BoArd oF dIrectorS
ANDERS böRJESSONM. Sc. econ. Born 1948.
chairman since 2001.other assignments: chairman ofBoomerang, Bostad direkt, cibenon and lagercrantz Group. vice chair-man of B&B toolS. director of Futuraskolan and Inomec.
ownership (family): 387,344 class Ashares and 40,000 class B shares.
tOM hEDElIuS MBA, hon. dr. of economics. Born 1939.
vice chairman since 2001.other assignments: chairman ofAnders Sandrews Stiftelse, B&BtoolS, Industrivärden and Jan Wal-landers and tom hedelius stiftelse.vice chairman of lagercrantz Group.director of l e lundbergföretagen,ScA and volvo. honorary chairman of Svenska handelsbanken.
ownership (family): 372,344 class Ashares and 5,400 class B shares.
lARS SPONgbERgB. Sc. in Ba and econ, llB. Born 1945.
director since 2001.other assignments: Industrial Advi-ser in nordic capital. director of Be Group, cobolt, elos, Intervalor and Skyways holding.
ownership: 1,500 class B shares.
uRbAN JANSSON higher bank degree. Born 1945.
director since 2001.other assignments: chairman of eAB, Global health partner plc, hMS, Jetpak Group and rezidor hotel Group. director of clas ohlson, Ferd A/S, höganäs, SeB, W Becker and oMX nordic exchange Stockholm AB listing committee.
ownership: 35,000 class B shares.
EvA ElMStEDt BA. Born 1960.
director since 2005.vice president customer Support, ericsson AB.other assignments: director of Syntavia och nItA.
ownership: 2,300 class B shares.
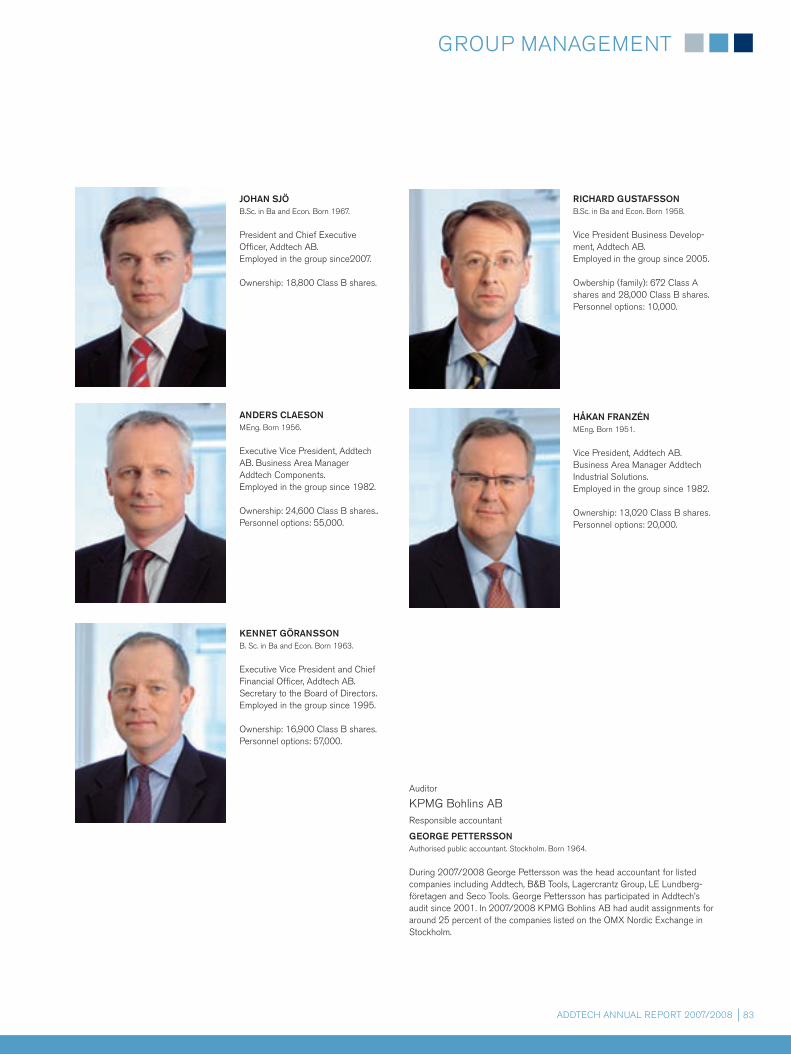
Addtech AnnuAl report 2007/2008 83
Group MAnAGeMent
KENNEt göRANSSON B. Sc. in Ba and econ. Born 1963.
executive vice president and chief Financial officer, Addtech AB.Secretary to the Board of directors.employed in the group since 1995.
ownership: 16,900 class B shares.personnel options: 57,000.
ANDERS ClAESON Meng. Born 1956.
executive vice president, Addtech AB. Business Area Manager Addtech components. employed in the group since 1982.
ownership: 24,600 class B shares.. personnel options: 55,000.
RIChARD guStAFSSONB.Sc. in Ba and econ. Born 1958.
vice president Business develop-ment, Addtech AB.employed in the group since 2005.
owbership (family): 672 class A shares and 28,000 class B shares. personnel options: 10,000.
JOhAN SJö B.Sc. in Ba and econ. Born 1967.
president and chief executive officer, Addtech AB. employed in the group since2007.
ownership: 18,800 class B shares.
håKAN FRANzéN Meng. Born 1951.
vice president, Addtech AB. Business Area Manager Addtech Industrial Solutions. employed in the group since 1982.
ownership: 13,020 class B shares.personnel options: 20,000.
Auditor
KpMG Bohlins ABresponsible accountant
gEORgE PEttERSSON Authorised public accountant. Stockholm. Born 1964.
during 2007/2008 George pettersson was the head accountant for listed companies including Addtech, B&B tools, lagercrantz Group, le lundberg-företagen and Seco tools. George pettersson has participated in Addtech’s audit since 2001. In 2007/2008 KpMG Bohlins AB had audit assignments for around 25 percent of the companies listed on the oMX nordic exchange in Stockholm.
Addtech AnnuAl report 2007/200884
the ShAre
MARKET PERFORMANCE OF THE SHARE AND TURNOVERthe highest price paid during the year was SeK 185.00 on 17 and 18 July 2007. the lowest price paid was SeK 109.00 on 22 January 2008. the last market price before financial year-end was SeK 128.50, on 28 March 2008. the Addtech share decreased in value during the financial year by 14 percent (+41). the Stockholm nordic exchange oMXpI index declined by -21 percent (+17) during the corresponding period, and oMX Industrials declined -13 percent (+27). during the period from 1 April 2007 to 31 March 2008, 4.4 million shares (6.5 million) changed hands at an aggregate value of MSeK 642 (774). relative to the average number of shares outstanding, this is equivalent to a turnover rate of 20 percent (29). Broken down by trading day, a total of just over 18,000 (26,000) Addtech shares per day were traded at an average value of about SeK 2,599,000 (3,121,000).
SHARE CAPITALthe share capital in Addtech on 31 March 2008 was SeK 50,810,589 and is divided into 1,103,814 class A shares and 22,529,018 class B shares. the quotient value of each share is SeK 2.15. each class A share entitles its holder to 10 vo-tes, and each class B share entitles its holder to one vote. All shares entitle their holders to the same right to dividends. only the class B share is listed on the Stockholm oMX nordic exchange.
REPURCHASE AND CANCELLATION OF SHARES the Annual General Meeting in August 2007 autho-rised the Board of directors to repurchase a maxi-mum of 10 percent of all shares in the company during the time until the next Annual General Meeting. A total of 300,000 shares were repurchased during the finan-cial year at an average price of SeK 122 per share. the total number of shares held in treasury as of 31 March 2008 was 1,425,000, with an average price of SeK 96. Shares held in treasury are equivalent to 6.0 percent of the number of shares outstanding and 4.2 percent of the votes. the average num-ber of shares held in treasury during the year was 1,248,093 (1,791,458).
INCENTIVE PROGRAM In december 2001, 56 members of senior management were awarded a total of 700,000 personell options. to make this pos-sible, an extraordinary General Meeting of shareholders held 17 december 2001 resolved a transfer of up to 700,000 class B shares in the company in connection with the possible redemp-tion of these options. the exercise price has been set at SeK 44.80, which is equivalent to 110 percent of the average mar-
ket price of the Addtech share during the period 3 december through 7 december 2001. Following a resolution by an extra-ordinary General Meeting of shareholders held in november 2004, the redemption period for the options was extended to end 18 February 2010. A total of 74,000 options were exercised during the year to acquire 74,000 shares. A total of 280,000 options have thus been exercised. upon full exercise of the personnel options, the number of shares outstanding will increase by 420,000, equivalent to 1.9 percent of the total num-ber of shares outstanding and 1.3 percent of the voting stock. the obligation to holders of personnel options is secured by 420,000 of the company’s shares held in treasury, which were acquired during 2001 at an average price of SeK 34.80.
DIVIDEND POLICYthe ambition of the Board of directors is a payout ratio exceeding 50 percent of consolidated net income averaged over a complete business cycle. Since the listing of the Addtech share in Septem-ber 2001 the yearly dividend growth reached 34 percent.
PROPOSALS TO THE ANNUAL GENERAL MEETING 2008 1) Dividend the Board of directors proposes a dividend of SeK 7.00 per share (6.00), which is equivalent to a dividend share of 55 percent (54).
2) Extension of repurchase mandate the Board of directors has decided to propose to the Annual General Meeting that the mandate to repurchase own shares be extended. the proposed mandate would give the Board of directors the right to purchases of own shares limited so that the company’s holding at no time may exceed 10 percent of the total number of shares outstanding. repurchases shall be made via the Stockholm nordic exchange. the mandate is proposed to include the possibility to use shares held in treasury for acqui-sitions, or to sell repurchased shares in ways other than through the stock exchange to finance acquisitions.
3) Cancellation of sharesthe Board of directors has further decided to propose to the Annual General Meeting the share capital to be reduced with SeK 1,935,000. to put the proposal into effect 900,000 of shares held in treasury are to be withdrawn without reimbur-sement.
ANALYSTS WHO FOLLOW ADDTECH christian hellman, Kaupthinghenrik Alveskog, redeye researchJohan Isaksson, remium lars hallström, handelsbanken capital Markets Stefan Mattsson, SeB enskilda
the Addtech share is listed on the Stockholm oMX nordic exchange. Since the lis-ting in September 2001 the total return yearly reached an average of 21 percent.

Addtech AnnuAl report 2007/2008 85
ShARE PRICE ADDtECh b
500
1,000
1,500
2,000
2,500
2001 2003 2004 2005 2006 2007 2008
20
50
100
150
200
250
Number of shares traded(000s)(incl. subsequent reg.)
B-shareB-share incl. dividendOMX Stockholm_PI
Addtech
© NASDAQOMX2002
ShARE CAPItAl tREND
Class A Class B
EventChange in
numberNumber of
sharesPercentage
of capitalNumber of
votesPercentage
of votesChange in
numberNumber of
sharesPercentage
of capitalNumber of
votesPercentage
of votes
At time of listing 1,840,286 7% 18,402,860 41% 26,023,946 93% 26,023,946 59%
2001/2002
Conversion of Class A shares to
Class B shares -726,808 1,113,478 4% 11,134,780 29% 726,808 26,750,754 96% 26,750,754 71%
2002/2003
Conversion of Class A shares to
Class B shares -6,976 1,106,502 4% 11,065,020 29% 6,976 26,757,730 96% 26,757,730 71%
2003/2004
Cancellation of Class B shares 1,106,502 4% 11,065,020 30% -1,350,000 24,407,730 96% 25,407,730 70%
2004/2005
Cancellation of Class B shares 1,106,502 4% 11,065,020 31% -1,181,400 24,226,330 96% 24,226,330 69%
Conversion of Class A shares to
Class B shares -2,688 1,103,814 4% 11,038,140 31% 2,688 24,229,018 96% 24,229,018 69%
2006/2007
Cancellation of Class B shares 1,103,814 5% 11,038,140 33% -1,700,000 22,529,018 95% 22,529,018 67%
Total number of shares 23,632,832
Total number of votes 33,567,158
SIzE ClASSES
Number of sharesPercentage of
share capitalNumber of
shareholders
Percentage of number of share-
holders
1–500 2% 2,362 66%
501–1,000 2% 549 15%
1,001–5,000 5% 502 14%
5,001– 10,000 3% 71 2%
10,001–20,000 3% 40 1%
20,001– 85% 84 2%
Total 100% 3,608 100%
hOlDINgS by CAtEgORy
Number of shareholders Proportion of capital
Swedish owners 3,453 82%
Foreign owners 155 18%
Total 3,608 100%
Legal entities 396 70%
Natural persons 3,212 30%
Total 3,608 100%
2007/2008 2006/2007 2005/2006
Earnings per share (EPS), SEK 12.70 11.15 8.00
Shareholders’ equity per share, SEK 29.90 24.40 19.90
Price/earnings ratio 10 13 13
Dividend per share, SEK 7.001) 6.00 4.00
Payout ratio, % 55 54 50
Dividend yield, % 5.4 4.0 3.8
Most recent price paid, SEK 128.50 149.75 106.00
Price/equity ratio 4.3 6.1 5.3
Market capitalisation, MSEK 2,854 3,359 2,443
Average number of shares outstanding 22,384,739 22,651,785 24,072,627
Number of shares outstanding at end of year 22,207,8322) 22,433,832 23,047,832
Number of shareholders at end of year 3,608 3,932 3,717
KEy FINANCIAl INDICAtORS
ADDtECh´S lARgESt ShAREhOlDERS 2008-03-31
ShareholdersClass A Shares
Class B Shares
Proportion of Capital
As pro-portion of
votes
Anders Börjesson (family) 387,344 40,000 1.9% 12.2%
Tom Hedelius (family) 372,344 5,400 1.7% 11.6%
Pär Stenberg 219,152 869,222 4.9% 9.5%
Swedbank Robur Fonder 2,936,222 13.2% 9.1%
Fjärde AP-fonden 2,147,975 9.7% 6.7%
Brita Säve 30,000 973,982 4.5% 4.0%
Odin Fonder 1,068,884 4.8% 3.3%
Livförsäkringsbolaget Skandia 950,800 4.3% 3.0%
SEB Investment Management 905,200 4.1% 2.8%
Lannebo Fonder 882,300 4.0% 2.7%
AMF Pensionförsäkrings AB 800,000 3.6% 2.5%
Sandrew AB 600,000 2.7% 1.9%
Aktia Sparbank 490,000 2.2% 1.5%
Nordea Bank Finland ABP 372,450 1.7% 1.2%
Fidelity Low- Priced Stock FD. 330,000 1.5% 1.0%
Banque de Luxembourg 330,000 1.5% 1.0%
Total held by 16 largest
shareholders 1,008,840 13,702,435 66.3% 74.0%
1) As proposed by the Board of directors. 2) the difference between the total number of shares and shares outstanding is the shares repurchased by Addtech (1,425,000 class B shares as of 31 March 2008). 3) Shares held in treasury by Addtech AB are not included in the calculation of percentage of votes and capital..
Addtech AnnuAl report 2007/200886
AddreSSeS
ADDTECH COMPONENTS
FINLAND
MiniTec Estonia OÜJarno ruohonen, Managing director paldiski mnt. 21 ee-76606 Keila, estoniatelephone: +372-6-77 05 62telefax: +372-6-77 05 63www.minitec.ee
MiniTec Finland OyJarno ruohonen, Managing director urheilutie 4 FI-25130 Muurla, Finlandtelephone: +358-2-728 2500 telefax: +358-2-728 2511 www.minitec.fi
Movetec OyMarkku Suominen, Managing director hannuksentie 1 FI-02270 espoo, Finland telephone: +358-9-525 92 30telefax: +358-9-525 923 33www.movetec.fi
Stig Wahlström Oylauri lindström, Managing director hannuksentie 1 FI-02270 espoo, Finland telephone: +358-9-502 44 00telefax: +358-9-452 27 35www.swoy.fi
NORWAY
Aratron ASStein Kuvaas, Managing director postboks 214, holmlia no-1204 oslo, norway telephone: +47-23-19 16 60telefax: +47-23-19 16 61www.aratron.no
Fb Kjeder ASStein Kuvaas, Managing directorBjørnerudveien 17 no-1266 oslo, norway telephone: +47-23-19 16 50telefax: +47-23-19 16 51www.fbkjeder.no
Kurt Wiig ASKurt Wiig, Managing director Skvadronveien 25 no-4050 Sola, norway telephone: +47-51-71 99 00telefax: +47-51-71 99 01www.kurtwiig.no
SWEDEN
Allan Rehnström Tryckluft-Vakuum AbAnders nilson, Managing director Box 644, rälsgatan 6A Se-801 27 Gävle, Sweden telephone: +46-26-10 01 00telefax: +46-26-10 99 87www.rehnstrom.se
Aratron Abpatrik Klerck, Managing directorBox 20087, Kratsbodavägen 50 Se-161 02 Bromma, Sweden telephone: +46-8-404 16 00telefax: +46-8-98 42 81www.aratron.se
Compotech Provider AbJan eriksson, Managing directorBox 21029, hälsingegatan 43 Se-100 31 Stockholm, Sweden telephone: +46-8-441 58 00telefax: +46-8-441 58 29www.compotech.se
R&K Tech AbJohan de Geer, Managing director Box 7086, polygonvägen 65 Se-187 12 täby, Sweden telephone: +46-8-544 405 60telefax: +46-8-732 74 40www.rk.se
Stig Wahlström AbBo nyberg, Managing director Box 64, Mårbackagatan 27 Se-123 22 Farsta, Sweden telephone: +46-8-683 33 00telefax: +46-8-605 81 74www.wahlstrom.se
Tube Control Abpeter Johansson, Managing director Box 292, Storsätragränd 10 Se-127 25 Skärholmen, Sweden telephone: +46-8-555 921 00telefax: +46-8-555 921 50www.tubecontrol.com
Vactek Abper rundbom, Managing director hälsingegatan 43 Se-113 31 Stockholm, Sweden telephone: +46-8-35 27 25telefax: +46-8-92 96 79www.vactek.se
ADDTECH Ab (publ)Johan Sjö, presidentBox 602, Gamla Brogatan 11Se-101 32 Stockholm, Swedentelephone: +46-8-470 49 00telefax: +46-8-470 49 01www.addtech.com
ADDTECH COMPONENTSAnders claeson, Business Area Manager Box 23087, S:t eriksgatan 117 Se-104 35 Stockholm, Swedentelephone: +46-8-545 414 00 telefax: +46-8-545 414 01
DENMARK
bondy A/Sleif Johansson, Managing director hassellunden 14 dK- 2765 Smørum, denmark telephone: +45-70-15 14 14telefax: +45-44-64 14 16www.bondy.dk
Chemo Electric A/Sleif nielsen, Managing directorhammerholmen 20 c-d dK-2650 hvidovre, denmarktelephone: +45-36-77 30 44telefax: +45-36-77 30 88www.chemoelectric.dk
Eltech Components A/Shenrik Möller, Managing director hassellunden 14-16 dK-2765 Smørum, denmark telephone: +45-70-10 14 10telefax: +45-43-20 07 77www.eltech.dk
LMT Transmission A/SKjeld Ahrendsen, Managing director Grundtvigs Allé 168 dK-6400 Sønderborg, denmark telephone: +45-74-43 18 80telefax: +45-74-43 18 81www.lmttransmission.dk
Vactek A/Srainer Wagner, Managing director Frydenborgsvej 27 e dK-3400 hillerød, denmark telephone: +45-48-24 44 33telefax: +45-48-24 44 37www.vactek.dk

Addtech AnnuAl report 2007/2008 87
ADDTECH ENERGY & EqUIPMENT
Insmat Akkuvoima Oypeter Andersson, Managing directorhöyläämötie 11 A, pl 52FI-00381 helsinki, Finlandtelephone. +358-207-99 96 40telefax: +358-207-99 96 41www.insmatakkuvoima.fi
Nordic battery Power AbJohan Westin, Managing director Marieholmsgatan 2 Se-415 02 Göteborg, Sweden telephone: +46-31-21 20 00telefax: +46-31-21 20 66www.nordicbattery.se
Nordic batteryJohan Westin, Managing director postboks 204, holmliaBjørnerudveien 17 no-1204 oslo, norway telephone: +47-22-76 38 80telefax: +47-22-61 91 95www.nordicbattery.no
ENERGY SUPPLY
beving Elektronik AbKarl Zellner, Managing director Box 93, Storsätragränd 10 Se-127 22 Skärholmen, Sweden telephone: +46-8-680 11 99telefax: +46-8-680 11 88www.bevingelektronik.se
breve-Tufvassons Co LtdZbigniew Wandzel, Managing director ul. postepowa 25/27 pl-93 347 lodz, poland telephone: +48-42-640 15 39telefax: +48-42-640 15 41www.breve.pl
Eurolaite Oyhannu hämäläinen, Managing directorKarvaamokuja 3 A FI-00380 helsinki, Finland telephone: +358-20-155 74 44telefax: +358-20-155 74 45www.eurolaite.fi
Ab Geveahans Andersén, Managing director Box 12043, vagngatan 9 Se-600 12 norrköping, Sweden telephone: +46-11-18 48 00telefax: +46-11-18 23 50www.gevea.se
Tufvassons Transformator AbGörgen hultgren, Managing director Box 501, porfyrvägen 4 Se-193 28 Sigtuna, Sweden telephone: +46-8-594 809 00telefax: +46-8-592 527 68www.tufvassons.se
MECHANICS
Alvetec Kontest AbJürgen Sedlacek, Managing director Fakturavägen 6 Se-175 62 Järfälla, Sweden telephone: +46-8-626 40 50telefax: +46-8-754 88 67www.alveteckontest.se
blästerpodukter i Köping Ablars Jansson, Managing director Box 64, Glasgatan 21 Se-731 22 Köping, Sweden telephone: +46-221-76 08 80telefax: +46-221-76 08 81www.blasterprodukter.se
KMC Ytbehandling AbMikael Boberg, Managing director Fakturavägen 6 Se-175 62 Järfälla, Sweden telephone: +46-8-445 84 40telefax: +46-8-445 84 49www.kmc.se
ADDTECH ENERGY & EqUIPMENTÅke darfeldt, Business Area ManagerFakturavägen 6 Se-175 62 Järfälla, Sweden telephone: +46-8-445 76 60telefax: +46-8-445 84 45
ENERGY STORAGE
Abatel AbJesper Björkén, Managing director Box 8078, domherrevägen 11b Se-192 08 Sollentuna, Sweden telephone: +46-8-444 59 60telefax: +46-8-96 67 00www.abatel.com
batteriunion i Järfälla AbBo Fagerström, Managing director Äggelundavägen 2 Se-175 62 Järfälla, Sweden telephone: +46-8-795 28 50telefax: +46-8-795 28 69www.batteriunion.se
bTC Industribatterier Abcarl Johan Sabelsjö, Managing director Box 576, Grustagsvägen 1 Se-572 26 oskarshamn, Sweden telephone: +46-491-844 55telefax: +46-491-76 64 10www.btc.nu
CellTech - Harring A/SMichael Ankjaer, Managing director rugmarken 9A+B dK-3520 Farum, denmark telephone: +45-70-25 22 01telefax: +45-70-25 22 02www.celltech.dk
CT CellTech Energy Systems AbJoakim Aspe, Managing director tredenborgsvägen 16 Se-294 35 Sölvesborg, Sweden telephone: +46-456-234 56telefax: +46-456-153 77www.celltech.se
Insmat Oyhannu hietala, Managing director p.o. Box 52, höyläämötie 11 A FI-00381 helsinki, Finland telephone: +358-207-98 15 60telefax: +358-207-98 15 61www.insmat.fi

Addtech AnnuAl report 2007/200888
ADDTECH INDUSTRIAL SOLUTIONS håkan Franzén, Business Area Manager Box 23087, S:t eriksgatan 117Se-104 35 Stockholm, Sweden telephone: +46-8-470 49 00telefax: +46-8-470 49 01
CUSTOMISED SOLUTIONS
Adiator Abrickard rockhammar, Managing directorBox 23056, hälsingegatan 40 Se-104 35 Stockholm, Sweden telephone: +46-8-729 17 00telefax: +46-8-729 17 17www.adiator.se
Adigo Drives AbJosef Benedek, Managing director Box 8, neongatan 8 Se-431 21 Mölndal, Sweden telephone: +46-31-67 23 40telefax: +46-31-67 23 50www.adigodrives.se
Caldaro Ab Stefan Aase, Managing director Box 30049, Warfvinges väg 23 Se-104 25 Stockholm, Sweden telephone: +46-8-736 12 70telefax: +46-8-736 12 90www.caldaro.com
Carbex AbStefan Ströberg, Managing director Box 115, Kvarnbacksvägen 12 Se-592 22 vadstena, Sweden telephone: +46-143-294 40telefax: +46-143-135 80www.carbex.se
Columbia Elektronik AbMats Klarholm, Managing director Box 5, Sjöviksvägen 53 Se-618 21 Kolmården, Sweden telephone: +46-11-39 80 05telefax: +46-11-39 76 41www.columbia.se
Emcomp International Abper lundblad, Managing directorBox 7, hemvägen 12Se-710 41, Fellingsbro, Swedentelephone: +46-581-62 15 50telefax: +46-581-62 15 60www.emcomp.se
Emcomp Scandinavia AbMagnus Wahlström, Managing directorKarlavägen 44Se-172 76, Sundbyberg, Swedentelephone: +46-8-564 899 00telefax: +46-8-564 899 19www.emcomp.se
Tesch System AbJoakim edberg, Managing director Box 21196, hälsingegatan 43 Se-100 31 Stockholm, Sweden telephone: +46-8-441 56 00telefax: +46-8-441 56 19www.tesch.se
MI GROUP
Amitra OyKeijo hokkanen, Managing directorAniankatu 1FI-152 10 lahti, Finlandtelephone: +358-3-87 61 00telefax: +358-3-751 02 53www.amitra.fi
ESD-Center Abrichard nordén, Managing director Sjöängsvägen 5 Se-192 72 Sollentuna, Sweden telephone: +46-40-36 32 40telefax: +46-40-15 16 83www.esd-center.se
Matronic Oytuomo luukkainen, Managing director louhostie 1 FI-04300 tuusula, Finland telephone: +358-9-274 79 10telefax: +358-9-274 791 20www.matronic.fi
Metric Industrial Abrickard nordén, Managing director Sjöängsvägen 5 Se-192 72 Sollentuna, Sweden telephone: +46-8-626 48 40telefax: +46-8-626 57 10www.metric.se
Metric Industrial A/Spekka Jolanki, Managing director hassellunden 16 dK-2765 Smørum, denmark telephone: +45-70-30 03 10telefax: +45-43-71 64 33www.metric.dk
Metric Industrial Oypekka Jolanki, Managing director pl 14, piispantilankuja 4 FI-02241 espoo, Finland telephone: +358-9-476 1600telefax: +358-9-476 16 700www.metric.fi
Metric Industrial ASroger Wahlgren, Managing director pB 777 Bedriftssenteret trollåsveien 8 no-1414 trollåsen, norwaytelephone: +47-400 040 54telefax: +47-400 040 53www.metricindustrial.no
Tecono AbAnders eriksson, Managing director Sjöängsvägen 5 Se-192 72 Sollentuna, Sweden telephone: +46-40-36 32 40telephone: +46-8-626 42 50telefax: +46-8-626 68 40www.tecono.se
Tekno Optik Abrichard Joelsson, Managing director Box 114, Storsätragränd 10 Se-127 22 Skärholmen, Sweden telephone: +46-8-680 11 30telefax: +46-8-680 11 60www.teknooptik.se
Teleinstrument A/SBo lindby, Managing director Fabrikvej 11 dK-8700 horsens, denmark telephone: +45-76-25 18 18telefax: +45-75-61 56 58www.teleinstrument.dk
MOTION TECHNOLOGY
Fb Chain Ltdphil taylor, Managing director Jubilee road, letchworth GB-hertfordshire SG6 1nF, united Kingdomtelephone: +44-146-267 08 44telefax: +44-146-248 07 45www.fbchain.com
Fb Kedjor Abroger holm, Managing director Box 304, Kungsgatan 68 Se-631 04 eskilstuna, Sweden telephone: +46-16-15 33 00telefax: +46-16-14 27 57www.fbkedjor.se
Fb Ketjutekniikka Oylauri pörsti, Managing directorFI-27710 Köyliö, Finland telephone: +358-2-54 01 11telefax: +358-2-540 11 00www.fbketjutekniikka.fi
Fb Ketten GmbH Matthias Berls, Managing director Auf’m Brinke 16 de-59872 Meschede, Germany telephone: +49-291-95 26 60telefax: +49-291-952 66 20www.fb-ketten.com
Fb Ketten Handels GmbHthomas Wagner, Managing director Gewerbepark Süd 5 At-6330 Kufstein, Austriatelephone: +43-53-726 146 66telefax: +43-53-726 146 620www.fb-ketten.com
Kraftmek Oyhans Söderström, Managing director pB 36, hitsaajankatu 9b FI-00811 helsinki, Finland telephone: +358-10-755 01telefax: +358-9-755 52 85www.kraftmek.com
Moving Hjulex AbJörgen Svensson, Managing director Jitegatan 10 Se-265 38 Åstorp, Sweden telephone: +46-42-567 00telefax: +46-42-567 10www.movinghjulex.se
Teknikprodukter, betech Seals Abtommy Marklund, Managing director Box 173, tallvägen 5 Se-564 24 Bankeryd, Sweden telephone: +46-36-37 62 00telefax: +46-36-37 22 93www.teknikprodukter.se
POLYMERIC SOLUTIONS
betech Seals A/Sclaus nielsen, Managing director vesterlundvej 4 dK-2730 herlev, denmark telephone: +45-44-85 81 00telefax: +45-44-92 78 00www.betechseals.dk
Codan Tech A/Shenrik platz, Managing director valdemarshaab 1 dK-4600 Køge, denmark telephone: +45-56-64 64 65telefax: +45-56-64 64 85www.codantech.dk
Codan Tech qingdao Rubber & Plastic Parts CO., ltd peng hui, Managing director Jinling Industrial Zone Jihongtan town chengyang district cn-Qingdao city Shandong, china telephone: +86-532-879 097 57 telefax: +86-532-879 090 92 www.codantech.com
ADDTECH INDUSTRIAL SOLUTIONS

“A value-adding technology trading company”
Addtech is a value-adding technology trading company that develops and sells pro-ducts, sub-systems and solutions to the industrial and service sectors in northern Eu-rope. Annual revenue is approximately SEK 4.3 billion. The Group runs its operations in about 80 subsidiaries, which together have some 1,500 employees.
VALUE-ADDING BUSINESS MODEL
CustomersAddtech offers its customers a technically innovative co-operation partner that develops the products, sub-systems or solutions that best satisfy customer needs, based on each customer’s unique si-tuation and approach. The Group’s offering of standard and specialised products, sophisticated equipment and value-adding services enables custo-mers to enhance their products or boost productivity without redu-cing quality or increasing costs.
SuppliersAddtech offers suppliers profi table cultivation of a valuable customer base in northern Europe. The Group’s in-depth customer relations-hips pave the way for participation in product and service develop-ment, which is fed back to the suppliers in the form of requirements and specifi cations, as well as access to other valuable market infor-mation The Group has an international network of leading suppliers. Close collaboration with suppliers in product modifi cation and de-velopment strengthens the Group’s ability to offer its customers the most innovative and competitive solutions available.
NORDIC REGION – THE HOME MARKETThe emphasis for Addtech’s business is on the Nordic region, but the rest of northern Europe is growing in importance. Markets outside the Nordic region comprise Estonia, Poland, the UK, Ger-many, Austria, and China. Addtech also exports to an additional 20 countries.
WELL-DEFINED NICHESAddtech strives to be the market leader in well-defi ned niches, where customers demand carefully selected products and sub-systems, often in small and medium-sized volumes. The majority of customers are manufacturers in the mechanical, vehicle, telecom and electronics industries as well as laboratories in healthcare and research in the Nordic region.
GROWTH THROUGH ACQUISITIONSAddtech has a sharp focus on growth, achieved organically as well as through acquisitions. Since its listing in 2001, Addtech has imple-mented about 30 company acquisitions.
STRONG CORPORATE CULTUREA strong corporate culture distinguished by technical expertise, en-trepreneurial spirit and business skills creates good opportunities for generating value added, profi tability and growth.
ADDTECH IN BRIEF
THE 2007/2008 FINANCIAL YEAR KEY INDICATORS
Earnings per share rose by 14 percent to SEK 12.70 (11.15).
Return on equity totalled 48 percent (54) and the equity ratio was 34 percent (32).
The Board of Directors proposes a cash dividend of SEK 7.00 (6.00) per share.
Eleven company acquisitions were completed during the year with total annual revenue of MSEK 375.
2007/2008 2006/2007 2005/2006
Revenue, MSEK 4,198 3,661 3,362
Operating profi t, MSEK 415 360 271
Profi t for the year, MSEK 287 256 194
Operating margin, % 9.9 9.8 8.1
Earnings per share, SEK 12.70 11.15 8.00
Shareholders’ equity per share, SEK 29.90 24.40 19.90
Dividend per share, SEK 7.00* 6.00 4.00
Return on equity, % 48 54 41
Equity ratio, % 34 32 33
Average number of employees 1,368 1,235 1,198
* As proposed by the Board of Directors
“The business model – a dynamic process”
REVENUE PROFIT BEFORE TAX DIVIDEND
MSEK
0
1,000
2,000
3,000
4,000
5,000
03/04 04/05 05/06 06/07 07/08
Employees – a refi ning linkThe Group’s employees are known for their ability to create inno-vative solutions that meet customer needs. The fl exibility and en-trepreneurship of Addtech employees strengthen the operations of suppliers, customers and the Group. Addtech offers employees in its subsidiaries a fl exible organisa-tion characterised by great freedom with responsibility, as well as outstanding development opportunities in business skills, techno-logy and international trade.
ShareholdersAddtech offers its shareholders a long-term investment with relatively low risk. The Group’s overarching goal is to achieve annual earnings growth exceeding 15 percent combined with profi tability.
The Group was listed on the OMX Nordic Exchange Stockholm in September 2001, and from that time until the balance sheet date the share price has climbed by 213 percent, from SEK 41.00 to SEK 128.50. Average total return including dividends has been 21 percent annually.
PRODUCTS AND SERVICESStandard productsSales of standard products constitute an important foundation in Addtech’s business. These sales lead to long-term customer rela-tionships that provide in-depth understanding of customers’ busi-nesses, needs and requirements, which in turn broadens the poten-tial for increased value creation.
Special productsSpecially adapted products are increasingly important to Addtech and our customers. To an ever greater extent, customers are seeing the Group as a partner in efforts to increase the value of their pro-ducts through more effi cient product development.
ServicesAddtech customers face tough competition and demands for short time-to-market – challenges that the Group can help customers tackle using its technology and knowledge-intensive services. This also applies to a growing number of aftermarket services in training, service and support.
MSEK
0
50
100
150
200
250
300
350
400
03/04 04/05 05/06 06/07 07/08
MSEK
0
1
2
3
4
5
6
7
8
03/04 04/05 05/06 06/07 07/08*
* As proposed by the Board of Directors
Standard products
Customised solutions,niche production, services
Feedback and suggestionsfor product development
Demands, needs
SuppliersADDTECH
CustomersValue-adding link/
co-ordinator
Customers
Co-operation in development
Customised solutions
Suppliers
Close co-operation and product development
Product adaptation
Standard products
Standard products
ADDTECH ANNUAL REPORT 2007/2008 89
ADDTECH LIFE SCIENCE Göran Brandt, Business Area Manager Box 26077, Sköldungagatan 7 SE-100 41 Stockholm, Sweden Telephone: +46-8-594 113 50Telefax: +46-8-411 36 20
DIAGNOSTICS
Bergman Diagnostika ASTove Nyhus, Managing Director Postboks 402, Slynga 2 NO-2001 Lillestrøm, Norway Telephone: +47-63-83 57 50Telefax: +47-63-83 57 40www.bergmandiag.no
Immunkemi F&D ABMonica Mattisson, Managing Director Veddesta Centrum SE-175 72 Järfälla, Sweden Telephone: +46-8-583 615 00Telefax: +46-8-583 615 01www.immunkemi.se
LabRobot Products ABPer-Ivar Fallenius, Managing Director Gärdesvägen 3 SE-444 31 Stenungsund, Sweden Telephone: +46- 303-846 73Telefax: +46- 303- 652 55www.labrobot.com
Triolab A/SFinn Andersen, Managing Director Vallensbækvej 35 DK-2605 Brøndby, Denmark Telephone: +45-43-96 00 12Telefax: +45-43-96 77 11www.triolab.dk
Triolab ABSven Erickson, Managing Director Box 2109, Åbäcksgatan 6 B SE-431 02 Mölndal, Sweden Telephone: +46-31-81 72 00Telefax: +46-31-81 72 19www.triolab.se
Triolab Oy Kai Rantanen, Managing Director Lemminkäinenvägen 20 B FI-20520 Åbo, Finland Telephone: +358-201-22 66 00Telefax: +358-201-22 66 01www.triolab.fi
ADDTECH LIFE SCIENCE
PROCESS TECHNOLOGY
Insatech A/SAlan Christoffersen, Managing Director Algade 133 DK-4760 Vordingborg, Denmark Telephone: +45-55-37 20 95Telefax: +45-55-37 70 18www.insatech.com
Kouvo Automation OySeppo Lappalainen, Managing Director Puhjontie 17 FI-45720 Kuusankoski, Finland Telephone: +358-5-363 16 55Telefax: +358-5-363 16 63www.kouvo.fi
OmniProcess ABRoland Levin, Managing Director Vretenvägen 12 SE-171 54 Solna, Sweden Telephone: +46-8-564 808 40Telefax: +46-8-564 808 50www.omniprocess.se
RESEARCH
Bergman ASRoger Kopperud, Managing Director Postboks 364, Slynga 2 NO-2001 Lillestrøm, Norway Telephone: +47-63-83 56 00Telefax: +47-63-83 56 10www.bergman.no
BergmanLabora ABPeter Simonsbacka, Managing Director Box 705, Karlsrovägen 2 D SE-182 17 Danderyd, Sweden Telephone: +46-8-625 18 50Telefax: +46-8-625 18 70www.bergmanlabora.se
Holm & Halby A/SMorten Dyrner, Managing Director Vallensbækvej 35 DK-2605 Brøndby, Denmark Telephone: +45-43-26 94 00Telefax: +45-43-26 94 10www.holmhalby.dk
Mikro Kemi ABKent Ersson, Managing Director Box 15018, Seminariegatan 29 SE-750 15 Uppsala, Sweden Telephone: +46-18-57 22 00Telefax: +46-18-57 22 22www.mikrokemi.se
PLD Finland OyTomi Virtanen, Managing Director PL 159, Sinikalliontie 9 FI-02631 Espoo, Finland Telephone: +358-20-741 02 70Telefax: +358-20-741 02 77www.pld.fi
OTHER COMPANIES
Addtech Business Support ABPeter Svensson, Managing Director Box 6068, Jägerhorns väg 8 SE-141 06 Kungens Kurva, Sweden Telephone: +46-8-680 77 66 Telefax: +46-8-680 77 61
Production: Oxenstierna & PartnersPhoto: Labe Allwin pages 3, 11, 13, 15, 17, 19, 21, 27
Print: Danagårds Grafi ska

AD
DTE
CH
AN
NU
AL R
EP
OR
T 07/08
Box 602, Gamla Brogatan 11, SE-101 32 Stockholm, Sweden. Tel: +46 (0)8 470 49 00, Fax: +46 (0)8 470 49 01 www.addtech.com. Company ID number: 556302–9726
ANNUAL REPORT
Interim Report Q11 April – 30 June 2008Published on 16 July 2008
Annual General Meeting 2008/2009Held on 25 August 2009
Interim Report Q21 April – 30 September 2008Published on 29 October 2008
Interim Report Q3 1 April – 31 December 2008Published on 9 February 2009
Year-end report 1 April 2008 – 31 March 2009Published on 11 May 2009
All financial information is published on Addtech’s website, www.addtech.com, as soon as announced. The annual report is distributed to shareholders who have ordered it via Addtech.
All amounts are expressed in millions of Swedish
kronor (MSEK) for the Group unless otherwise
stated.
This Annual Report is also available in Swedish
CALENDAR TABLE OF CONTENTSAddtech in brief 1
President’s statement 2
Business concept, goals and strategies 4
Business model that creates value 5
Market 6
Market-leading positions 8
Organisation and operating mobility 9
Acquisitions 12
Employees 14
Business school 16
Ethics and environment 18
Components 20
Energy & Equipment 24
Industrial Solutions 28
Life Science 32
Key financial ndicators 36
Multi-year summary 36
Quarterly data, annual data and definitions
37
Risk and sensitivity analysis 38
Table of contents 39
Administration report 40
Financial statements 46
Notes 54
Proposed allocation of earnings 79
Audit report 80
Invitation to the Annual General Meeting 81
Board of Directors 82
Group Management 83
The share 84
Addresses 86