Embed Size (px)
Citation preview
0, g
Caldon Experiencein
Nuclear FeedwaterFlow Measurement
MLI62Rev.2 1/05 Couni on CaldonML 162 Rov. 2 1/05 Count on Caldon

LEEM STORYThe LEFM Story is an advanced technology story. Originally developed to measure watervelocities over missile hatches on the George Washington Class Nuclear Submarine, the LEFMwas later applied to accurate flow measurement challenges in rivers, open channels, large pipesin hydroelectric generating facilities, high temperature reactor coolant systems, and feedwatersystems in nuclear power plants.
The LEFM was first applied in a commercial power plant in 1974 wvhere it was used to measureReactor Coolant Flow in the Prairie Island Unit 2 Nuclear Plant. This version of the LEFM wascalled a Chordal System because it made velocity measurements at four "chords" of the circularcross section of the pipe. The results were used to determine Reactor Coolant Pump curves thatare still used today.
The LEFM Chordal Technology was applied to measure feedwater flow in 1977. Venturifouling had been identified as a significant bias source resulting in decreased power output innuclear plants. LEFM technology was used to correct biases caused by venturi fouling andrecover lost MW. Ultrasonic feedwater temperature measurement capability to within:F* 10Fwas soon added to the LEFM.
Caldon purchased the LEFM technology from Westinghouse in 1989 in an asset transfertransaction. A completely new electronic platform, taking advantage of the latestmicroprocessor technology was introduced by Caldon in 1990. This electronic unit was calledthe LEFM 8300 and its increased flexibility allowed Caldon engineers to use LEFM technologyin new ways and in new applications.
The first radical new application was the LEFM External Feedwater Flow and TemperatureSystem. The External LEFM has the advantage of being installed on existing pipes withoutshutting down the plant. The LEFM External System was introduced in 1991 for MW recovery.its feedwater mass flowrate accuracy is ± 1% and measures temperature typically within 1 .5'F.The chief uncertainty for the LEFM External System is the knowledge of the hydraulic velocityprofile. This uncertainty is bounded through extensive parametric site specific model testing.
Mil-Spec External Flowrneter
Another variant of the LEFM External technology was ruggedized to become the world's onlyMIL-SPEC ultrasonic flowmeter. This product is used on the latest generation Seawoif andVirginia Class submarines for the U.S. Navy in the Trim and Drain System. This model, calledthe LEFM 8400M, meets stringent requirements for shock, vibration, EMI/RFI, salt spray, andtemperature.
RCS Flow and Temperature
A version of the LEFM External technology was applied to RCS temperature and flowmeasurement in 1995. Pilot measurements were made at the R.E. Ginna Plant and Watts BarPlant during hot functional testing.
ML 162 Rev. 2 1/05 Count on Caldon I

cGZ7Q I ==Q 0
Appendix K Uprates
Caldon introduced the concept of Appendix K uprates to the NRC and utility customers in1994. Appendix K uprates take advantage of the increased accuracy of the LEFM Chordaltechnology to increase licensed power and improve safety at the same time. The LEFM,/'Topical Report ER-80P was submitted to the NRC for review in 1997 and approved for 1%Uprates in 1999. Comanche Peak Unit 2, the lead plant for Appendix K Uprates increasedpower in October 1999. In January of 2001, based on the new Appendix K Ruling of June of2000, Watts Bar was approved for a 1.4% Appendix K Uprate using the LEFM,/.
Caldon introduced the even more accurate LEFM CheckPlus System in 2001. The majorimprovements in the LEFM CheckPlus are more accurate measurement of velocity profiles andreduced sensitivity to changes in velocity profiles. Redundancy is another important feature ofthe LEFM CheckPlus System. The LEFM CheckPlus System was approved by the NRC foruprates up to 1.7% in December 2001.
New Developmnents
New applications for the LEFM technology include high temperature gas and steam flow.Development work is proceeding at Cal don to achieve the same high accuracies in toughapplications that Caldon is known for.
MLI62Rev.2 ~1/O5 Cow,! on Ca/don 2ML 162 Rev. 2 1/05 Count on Caldon 2
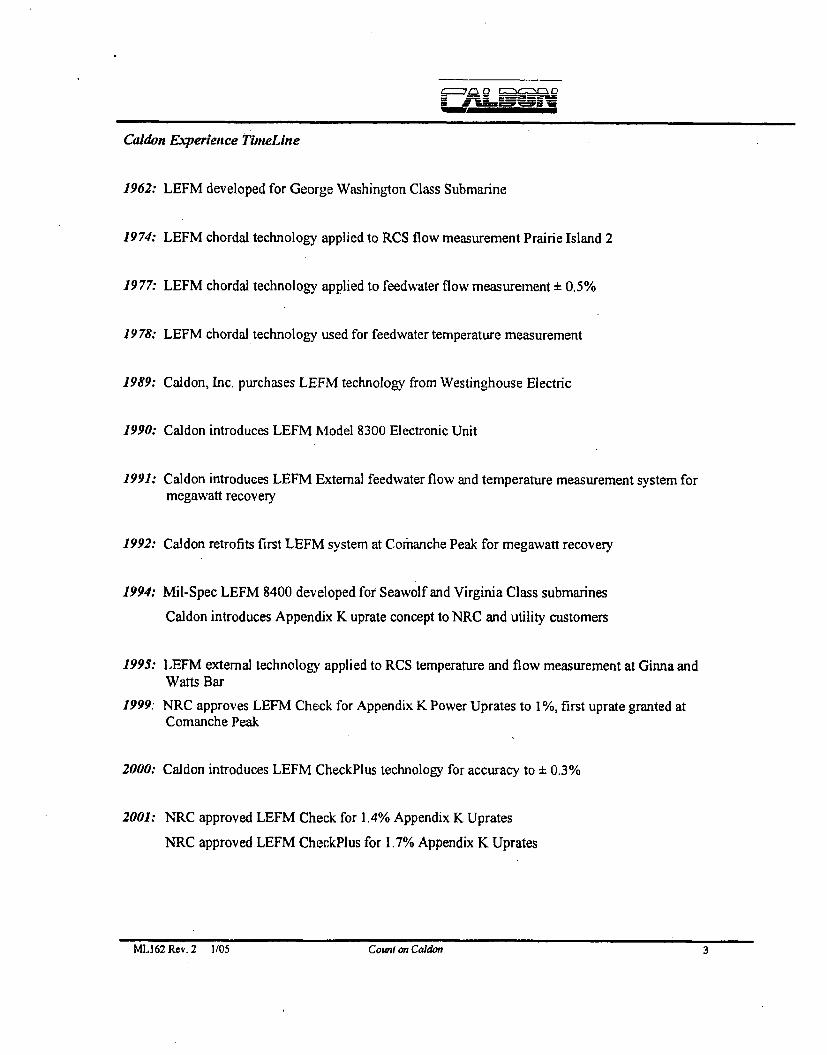
Caldon Experience TimeLine
1962: LEFM developed for George Washington Class Submarine
1974: LEFM chordal technology applied to RCS flow measurement Prairie Island 2
1977: LEFM chordal technology applied to feedwater flow measurement ± 0.5%
19 78: LEFM chordal technology used for feedwater temperature measurement
1989: Caldon, Inc. purchases LEFM technology from Westinghouse Electric
1990: Caldon introduces LEFM Model 8300 Electronic Unit
1991: Caldon introduces LEFM External feedwvater flow and temperature measurement system formegawatt recovery
1992: Caldon retrofits first LEFM system at Coffnanche Peak for megawatt recovery
1994: Mul-Spec LEEM 8400 developed for Seawoif and Virginia Class submarines
Caldon introduces Appendix K uprate concept to NRC and utility customers
1995: LEFM external technology applied to RCS temperature and flow measurement at Ginna andWatts Bar
1999. NRC approves LEFM Check for Appendix K Power Uprates to 1 %, first uprate granted at
Comanche Peak
2000: Caldon introduces LEFM CheckPlus technology for accuracy to ± 0.3%
2001: NRC approved LEFM Check for 1.4% Appendix K Uprates
NRC approved LEFM CheckPlus for 1.7% Appendix K Uprates
MLI62Rev.2 1/05 Count on Caldon 3ML162 Rev. 2 1105 Count on Caldon 3
r ES 0
LEFM FACTS AND DATA
LEFM Syst emtsfor MWVReco very
LEFM Systems are used for on-line calibration of installed differential pressure instrumentation.Differential Pressure type instruments are subject to drift, bypass, and fouling which often changesover time. This creates the need to calibrate differential pressure type measurements on-line tomaximize MW production. A few cases of biases caused by different effects are provided forreference in the section called "Changes in nozzle bias".
Caldon is the world leader in MW Recovery Systems.
External LEFM Systems have:
* Been used to quantifly biases in differential pressure type devices in 53 nuclear plants
" Been permanently installed in 33 nuclear plants for on-line calibration of pl ant venturis
" Identified 435 MW for recovery
Figure 1 lists the Peak NMW recovered in permanent installations and Figure 2 lists the MW forrecovery that have been identified in test installations of External Systems.
MLI62Rev.2 1/05 Cowit on Caldon 4ML162Rev.2 1/05 Count on Caldon 4
G-in0 C=:= 03I -i~:
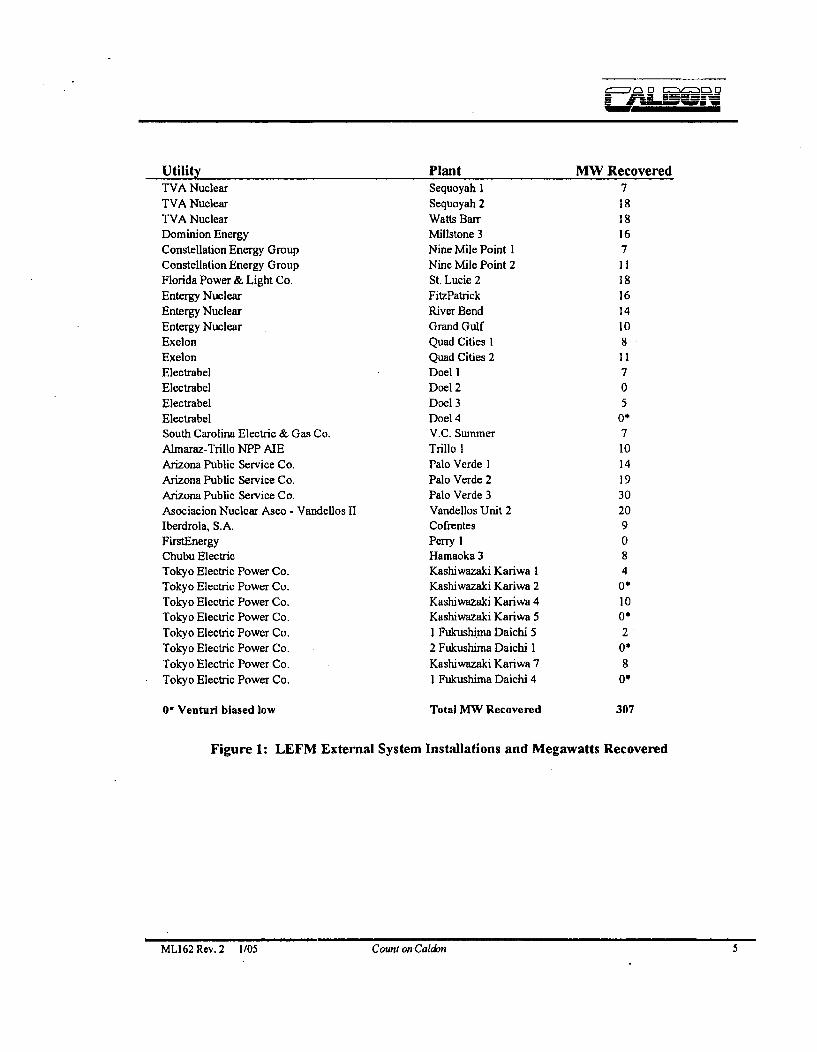
utilityTVA NuclearTVA NuclearTVA NuclearDominion EnergyConstellation Energy GroupConstellation Energy GroupFlorida Power & Light Co.Entergy NuclearEntergy NuclearEntergy NuclearExelonExelonElectrabelElectrabelElectrabelElectrabelSouth Carolina Electric & Gas Co.Almnaraz-Tiillo NPP AIEArizona Public Service Co.Arizona Public Service Co.Arizona Public Service Co.Asociacion Nuclear Asco - Vandellos HlIberdrola, S.A.FirstEnergyChubu ElectricTokyo Electric Power Co.Tokyo Electric Power Co.Tokyo Electric Power Co.Tokyo Electric Power Co.Tokyo Electric Power Co.Tokyo Electric Power Co.Tokyo Electric Power Co.Tokyo Electric Power Co.
PlantSequoyah 1Sequoyah 2Watts BarrMfillstone 3Nine Mfile Point INine Mfile Point 2St. Lucie 2FitzPatrickRiver BendGrand GulfQuad Cities IQuad Cities 2Doel IDoel 2Doel 3Doel 4V.C. SummerTrillo IPalo Verde IPalo Verde 2Palo Verde 3Vandellos Unit 2CofrentesPerry IHamaoka 3Kashiwazaki Kariwa IKashiwazaki Kariwa 2Kashiwazaki Kariwa 4Kashiwazaki Kariwa 51 Fukushinia Daichi 52 Fukushinia Daichi IKashiwazaki Kariwa 71 Fukushima Daichi 4
MW Recovered718181671118161410811705
710141930209084
10
2Os
800
01 Venturi biased low Total MW Recovered 307
Figure 1: LEFM External System Installations and Megawatts Recovered
ML162 Rev. 2 1/05 Count onCaldon 5ML162 Rev. 2 1105 Count on Caldon 5

'M 0 LU:: 0
utility
Progress EnergyEntergy Nuclear
Entergy NuclearOmaha Public Power District
Florida Power & Light Co.
Exelon
ExelonConstellation Energy Group
ElectrabelElectrabelElectrabelFirstEnergyDominion EnergyDominion EnergyNebraska Public Power DistrictAlmaraz-Trillo NPP AIE
Florida Power & Light Co.Asociacion Nuclear Asco - Vandellos II, A.I.E.
Asociacion Nuclear Asco - Vandellos II, A.1.E.Progress Energy
PlantShearon HarrisWaterford
ANO IFort CalhounTurkey Point 4
Dresden 3ClintonCalvert Cliffs 2Tihange ITihange 2
Tihange 3Davis BesseNorth Anna 2North Anna]I
CooperAlmaraz Unit ISt. Lucie Unit IASCO IASCO 2Brunswick
MW Identified2.7714
37
1501474
4
3194000*
0*0*0*
0* Venturi biased low Total NM Identiried 128
Figure 2: LEFM External System Flow Test and Lost Megawatts Identified
LEFM Chordal Systems have also been used for MW Recovery
LEFM Chordal Systems have:
" Been installed in 32 nuclear power plants
* Been used to recover 61 MW through on-line calibration of plant differential pressureinstruments.
Figure 3 lists the MW recovered by site through calibration of the differential pressure instruments.
ML162Rev.2 1/05 Cowil on Cakkn 6ML162 Rcv. 2 1105 Couni on Caldon 6

i=7Q0 EZ1ZZilZ1 0
utility
Entergy Nuclear
Entergy Nuclear
FPL Energy
Nuclear Management Company, LLC
Nuclear Management Company, LLC
Rochester Gas and Electric Corp.
TXU Energy
TXU Energy
Public Service Enterprise Group, Inc.
Public Service Enterprise Group, Inc.
Nuclear Management Company, LLC
TVA Nuclear
FirstEnergy
FirstEnergy
PPL
PPL
Tberdrola, S.A.
Asociacion Nuclear Asco - Vandelios II, A.I.E.
TVA Nuclear
TVA Nuclear
Entergy Nuclear
Entergy Nuclear
Indiana Michigan Power Co.
Indiana Michigan Power Co.
Asociacion Nuclear Asco - Vandel~os 11, A.I.E:
Entergy Nuclear
Exelon
Exelon
Progress Energy
FirstEnergy
Shikoku Electric Power Co., Inc.
Asociacion Nuclear Asco - Vandellos HI, A.I.E.
Dominion Energy
0* Venturi biased low
N/IA - M W aiready recovered by Exderna1 LEFM System
Plant
Indian Point 2
Indian Point. 3
Seabrook
Point Beach I
Point Beach 2
Ginna
Comanche Peak I
Comanche Peak 2
Salem 1
Salem 2
Prairie Island 2
Watts Bar
Beaver Valley I
Beaver Valley 2
Susquehana I
Susquehana 2
Cofrentes
Vandellos 2
Sequoyahl
Sequoyah 2
Grand Gulf
Waterford
DC Cook 1
DC Cook 2
Asco I
River Bend
Peach Bottom 2
Peach Bottom 3
Robinson
Davis Besse
Ikata 2
Asco 2
Millstone 3
Total MW Identified
MW Identified5
10
5
0*
0*
0*
0*
0*
3
7
N/A0*
N/A
N/A
N/A
4
7
0*
N/A0*
0
01
0*
0*
N/A
61
Figure 3: LEFM Chordal System Installation and Megawatts Recovered
MLI62Rev.2 1/05 Count on Caldon 7MLIURev.2 1/05 Count on Caldon 7
~Lz 0 ~ 0= ~
LEFM Systems for Appen dix K Uprates
Caldon pioneered efforts to gain approval for the Appendix K Uprate'Concept, and today is theleading supplier of Appendix K Uprate Systems. The LEFMI/ System is a chordal type design andhas been approved for uprates up to 1.4% based on accuracies better than 0.5%. The LEFMCheckPlus System is accurate to better than 0.3% and has been approved for uprates up to 1.7%.
LEFM,/ and LEFM CheckPlus Systems have:
* Been purchased for 34 plants
* Uprated 25 plants by 368 MW
Figure 4 shows the status as of January 1, 2005 for Appendix K power uprates.
ML162 Rev. 2 1105 Count on Caldon 8

g __, Q = Q 0
utilityTXU Energy
TXU Energy
TVA NuclearFirstEnergyFirstEnergyPPLPPL
Entergy NuclearFirstEnergy
TVA NuclearTVA NuclearEntergy NuclearIberdrola, S.A,Asociacion Nuclear Asco - Vandellos II, A.IE.Asociacion Nuclear Asco - Vandellos 11, ALIE.Asociacion Nuclear Asco - Vandellos 11, A.LE.Nuclear Management Company, LLCNuclear Management Company, LLCEntergy NuclearEntergy NuclearProgress EnergyIndiana Michigan Power Co.Indiana Michigan Power Co.ExelonExelonEntergy NuclearDominion EnergyShikoku Electric Power Co., Inc.Progress Energy
Progress EnergyProgress EnergyProgress EnergyShikoku Electric Power Co., Inc.Shikoku Electric Power Co., Inc.
PlantComanche Peak IComanche Peak 2Watts BarBeaver Valley 1Beaver Valley 2Susquehana ISusquehana 2
Grand GulfDavis BesseSequoyah ISequoyah 2Waterford
CofrentesVandellos 2Asco IAsco 2Point Beach IPoint Beach 2Indian Point 3River BendRobinsonDC Cook IDC Cook 2Peach Bottom 2
Peach Bottom 3Indian Point 2
Millstone 3Ikata 2Crystal River
Shearon HarrisBrunswick IBrunswick 2Ikata 1Ikata 3
SystemLEFM,/
LEFM,/LEFMV'LEFM/(LEFM./+LEFM,(LEFM%4/
LEFM./ +
LEFMV +
LEFM,(LEFMI/LEFM. +
LEFM/( +LEFMV +LEFM./ +
LEFMv/+LEFM/(LEFM.ILEFM\4/LEFM./+LEFMv( +
LEFM/1+LEFM./ +LEFMV +
LEFMI/ +LEFMV
LEFM/ +
LEFM/( +
LEFM,/ +
LEFM./ +LEFM,/ +
LEFM. +
LEFM..( +
LEFMV +
MIW Uprated16
16161112151520
16
1616
181514147
7
1413121718181814
N/
N/A
N/A
% Uprate1.40%
1.40%1.40%1.40%1.40%1.40%1.40%
1.65%1.60%1.30%1.30%1.50%1.70%1.40%1.40%1.40%1.40%
1.40%1.40%1.60%1.64%1.66%1.66%1.70%1.70%1.40%1.70%
N/A
1.64%
1.64%1.64%1.64%
N/A
NIA
Total MW Uprated 368
*Instal~led but have not yet rece'ved SER (approval for uprate)*Received SER by have not yet inistaUed the system*Purchased the system but have not installed or received SER
-Orders e-pected
N/A Not using for MUR
Figure 4: LEFM/( and LEFM CheckPlus System Installations and Megawatts Uprated
ML162 Rev. 2 1105 Count on Caldon 9

=--lo [==17- 0
LEFM EXTERNAL VS. PLANT DIFFERENTIAL DEVICE DATA
The LEFM External meter has been used in 53 nuclear plants worldwide. Figure 5 shows the resultsin the form of a histogram. These results are a snapshot. It is well known that venturi biasesresulting from fouling and bypass flow are dynamic. Caldon has published reports (ER-262) andpapers documenting that external systems are subject to dynamic biases owing to changes in velocityprofiles. While these changes can be bounded within -± 1% through rigorous parametric hydraulicmodeling, they can lead to additional dynamic differences.
20 ,
12
.510
Z
4
2
0-4 -3.5 -3 -2.5 -2 .1.5
Nozzl less fttn LEFM
1 1.5 2 2.5 3 3.5 4 4.5
Nozzle mome than LEFM
.1 -0.5 0 0.5
(% FouUng)
Lctoswith header LEFM Systems assign equal difference values to all nozzles.
Figure 5: Comparison of Nozzle and LEFM External Flow Indications
MLA62Rev.2 1/05 Count on Caldon I0ML162 Rev. 2 1/05 Count on Caldon 10
~227/2 ~ ~ 0U
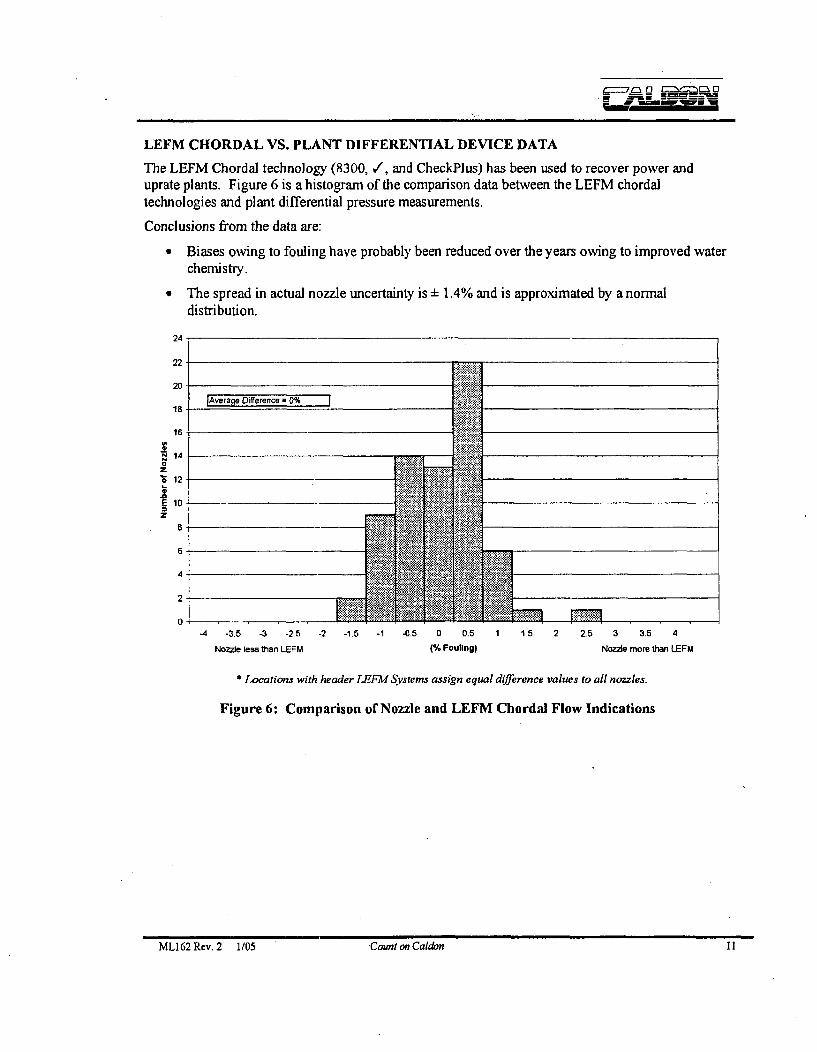
LEFM CHORDAL VS. PLANT DIFFERENTIAL DEVICE DATA
The LEFM Chordal technology (8300, /, and CheckPius) has been used to recover power anduprate plants. Figure 6 is a histogram of the comparison data between the LEFM chordaltechnologies and plant differential pressure measurements.
Conclusions from the data are:
* Biases owing to fouling have probably been reduced over the years owing to improved waterchemistry.
* The spread in actual nozzle uncertainty is ± 1.4% and is approximated by a normaldistribution.
24 ,
22
20 I Averapa Difference *0
16
S14
'5 12
E 10
6
4
2
0 RM-4 -3.5 -3 -2.5 -2 -1.5
Nozzle less than LEFM
-1 -0.5 0 0.5
(% Fouling)
1 1.5 2 2.5 3 3.5 4
Nozzle more than LEFM
*Locations with header LEFM Systems assign equal difference values to all nozzles.
Figure 6: Comparison of Nozzle and LEFM Chordal Flow Indications
ML162Rcv.2 1/05 on Caldon 11ML162Rev.2 1105 Count on Caldon 11
CHANGES IN NOZZLE BIASES
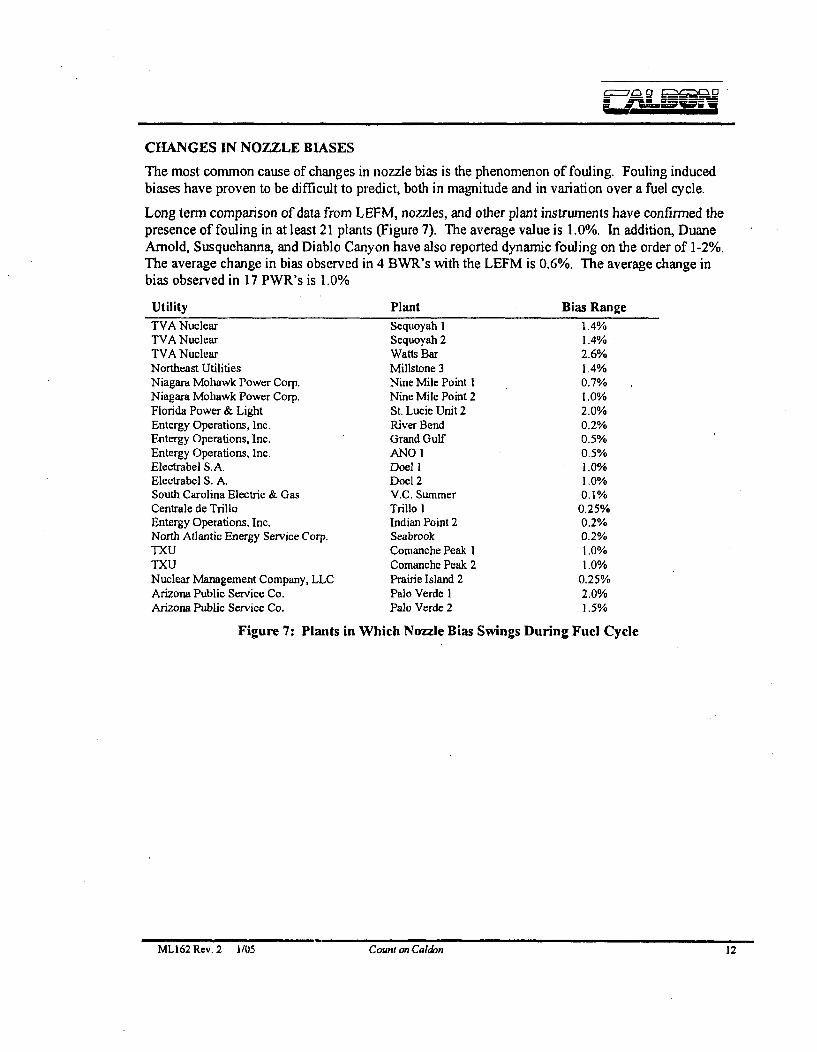
The most common cause of changes in nozzle bias is the phenomenon of fouling. Fouling inducedbiases have proven to be difficult to predict, both in magnitude and in variation over a fuel cycle.
Long term comparison of data from LEFM, nozzles, and other plant instruments have confirmed thepresence of fouling in at least 21 plants (Figure 7). The average value is 1.0%. In addition, DuaneArnold, Susquehanna, and Diablo Canyon have also reported dynamic fouling on the order of 1-2%.The average change in bias observed in 4 BW;R's with the LEFM is 0.6%. The average change inbias observed in 17 PWR's is 1.0%
UtilityTVA NuclearTVA NuclearTVA NuclearNortheast UtilitiesNiagara Mohawk Power Corp.Niagara Mohawk Power Corp.Florida Power & LightEntergy Operations, Inc.Entergy Operations, Inc.Entergy Operations, Inc.Electrabel S.A.Electrabel S. A.South Carolina Electric & GasCentrale de TrilloEntergy Operations. Inc.North Atlantic Energy Service Corp.TXUTXUNuclear Management Company, LLCArizona Public Service Co.Arizona Public Service Co.
PlantSequoyah ISequoyah 2Watts BarMillstone 3Nine Mile Point INine Mile Point 2St. Lucie Unit 2River BendGrand GulfANO IDoe] IDoel 2V.C. SummerTrillo IIndian Point 2SeabrookComanche Peak 1Comanche Peak 2Prairie I sl and 2Palo Verde IPalo Verde 2
Bias Range1.4%1.4%2.6%1.4%0.7%1.0%2.0%0.2%0.5%0.5%1.0%1.0%0.1%0.25%0.2%0.2%1.0%1.0%
0.25%2.0%1.5%
Figure 7: Plants in Which Nozzle Bias Swrings During Fuel Cycle
ML162Rev.2 1/05 Count on Ca/don 12ML162Rev.2 1/05 Count on Caldon 12
__ 0l pm~z1 0
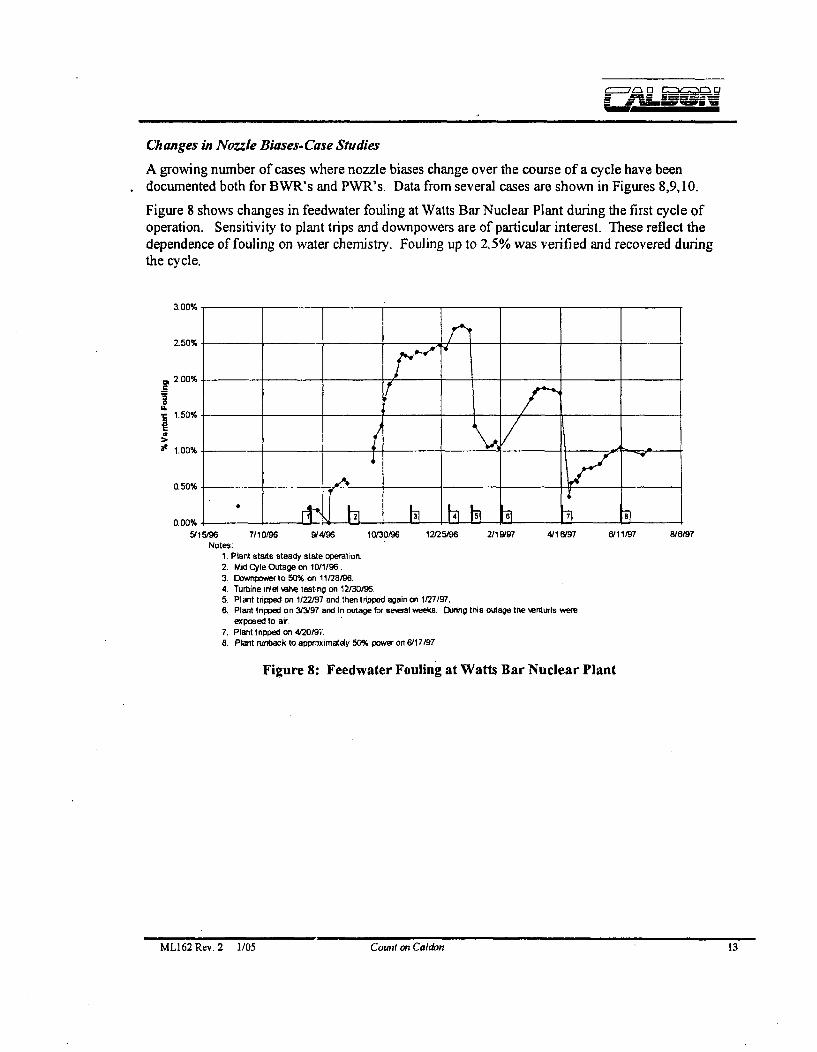
Changes in Nozzle Biases- Case Studies
A growing number of cases where nozzle biases change over the course of a cycle have beendocumented both for BWVR's and PW~R's. Data from several cases are shown in Figures 8,9, 10.
Figure 8 shows changes in feedwater fouling at Watts Bar Nuclear Plant during the first cycle ofoperation. Sensitivity to plant trips and downpowers are of particular interest. T1hese reflect thedependence of fouling on water chemistry. Fouling up to 2.5% was verified and recovered duringthe cycle.
/"*'I
C,
I.;1U7-
2.00%-_____
1.50% 1
1.00%-____
n ______ ______ _____ ______ _____
5/15/96 7/10/96 9/4/96 10130/96 12/2519 2/1 9W9 4/16/97 6/11/97 8/Notes:
1. Plant starts steady state operationt2. Mid Cyle Outage on 10/1/96.3. Downpower to 50% on 11/28/96.4. Turbine inlet vele testing on 12/30/96.5. Plant tripped on 1/22/97 and then tripped again on 1/27/97.6. Plant tripped on 3/3/97 and in outage for se~eral weeks. D(hang this ouage the venturis were
exposed to air.7. Plant tripped on 4(20/97.8. Phan runback to appromatmany 50% power on 6/17/97.
'6197
Figure 8: Feedwater Fouling at Watts Bar Nuclear Plant
ML162Rev.2 1/05 Counf on Caldon 13MLIURev.2 1/05 Cowit on Caldon 13
Q- 0n 9 0M
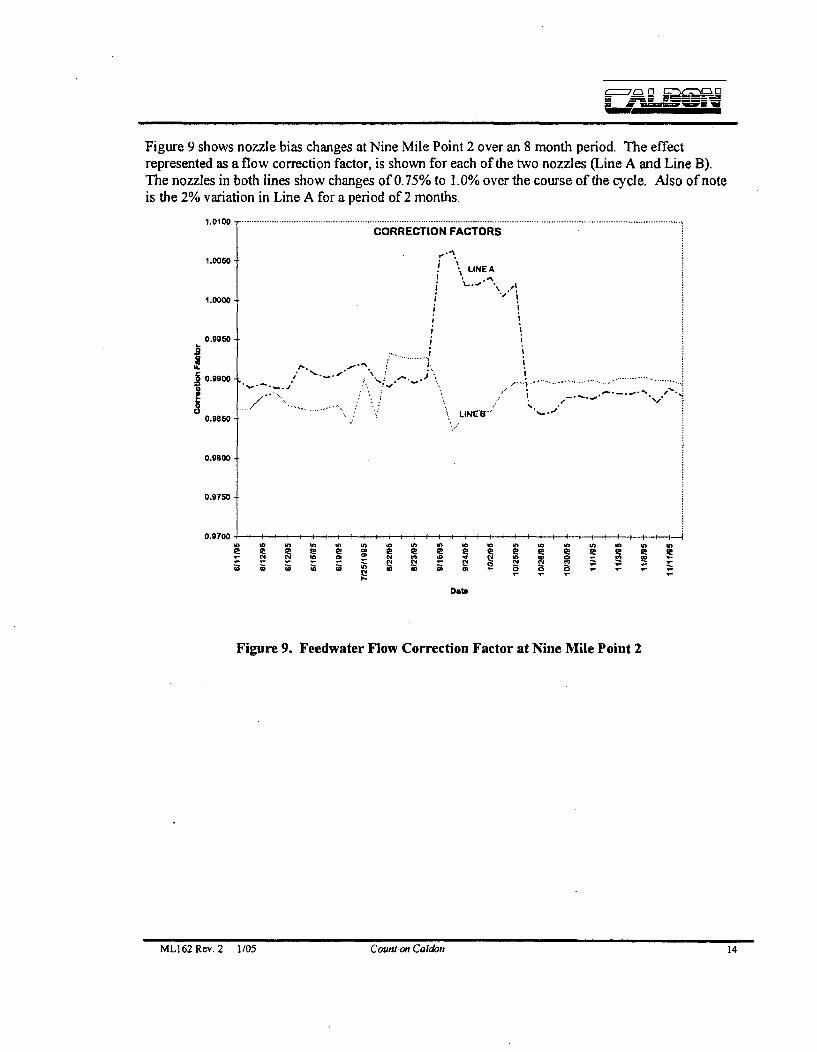
Figure 9 shows nozzle bias changes at Nine Mile Point 2 over an 8 month period. The effectrepresented as a flow correction factor, is shown for each of the two nozzles (Line A and Line B).The nozzles in both lines show changes of 0.75% to 1.0% over the course of the cycle. Also of noteis the 2% variation in Line A for a period of 2 months.
1 . 1 0 ... .... . .. . .. . . .. . .. . .. .. ... . .. .. ... .. . .. .. . . . .. . .. . .. .. .. . .. ..... .. . .. .. . .... .. . . .. . ... . . .. . .
CORRECTION FACTORS
1.0080 - !\LINE A
1.D000 -
0.9960
0.9900 ......
0.980D
0.9780
0.9700 1 1.. . , . i 1 1 :1
~ 2 2 2 2 2 2 2 2 e
Dato
Figure 9. Feedwater Flow Correction Factor at Nine Mile Point 2
MLI62Rev.2 1/05 Cowul cm Caldon 14ML162 Rev. 2 1/05 Couni on Culdon 14

In at least one case, at Millstone 3, the development of nozzle fouling was observed during powerascension (Figure 10).
A small zero offset bias in the DP transmitters is apparent at low flow conditions. A significantchange in the nozzle bias occurs between 34Q0 and 400TF as Ph conditions for fouling becomefavorable. A rapid acceleration in fouling occurs between 400'F and the 437*F full powertemperature.
Over 1.2% fouling occurred during this power ascension, before full power was reach ed. Foulingwhich occurs during power ascension is nearly impossible to detect by trending other plantindicators. Because of the absolute accuracy and repeatability of the LEFM however, it can bemeasured accurately as shown here.
Fouling at Millstone Unit 3 During Power Ascension In August I1Og
SiU=SiSi
St
... ... .. .. .. . .. . ............. . .... ... ... . ... ... .....T. ...gt. ....i.. .. .. .. ..n..9~~~~~~Tt Filmust~ ennen%,
fentd We talaf~t lsre Yf
Figure 10. Effect of Fouling and De-fouling of the
Feed Flow-Measurement-Nozzles on Plant Output
ML~162Rcv.2 1/05 Count on Caldon 15MLIURev.2 1/05 Count on Caldon 15
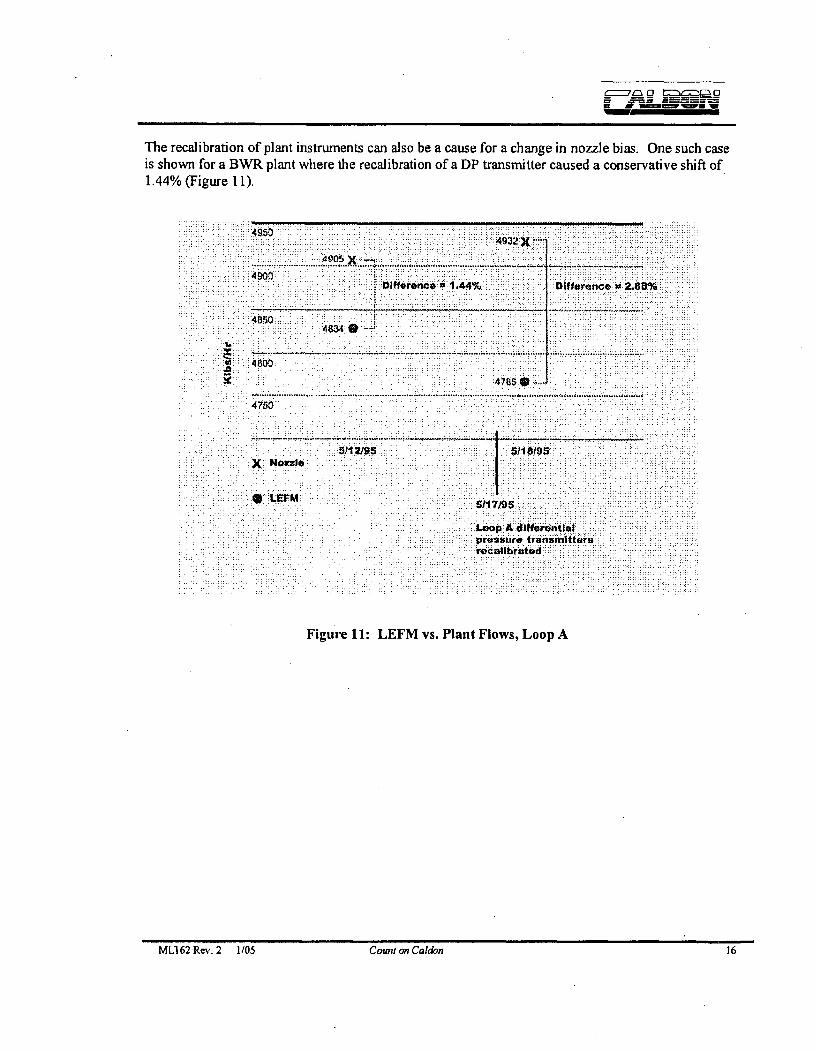
The recalibration of plant instruments can also be a cause for a change in nozzle bias. One such caseis shown for a BWR plant where the recalibration of a DP transmitter caused a conservative shift of1.44% (Figure 11).
49504932 X
Difference 1.44%Difrne 28'Y
4834 a
4800
4785 0
4756:..
.1 2 9 .... ... ....
* LEFM5117195
LoopA ~ifforerntialproustire transmitters
Figure 11: LEFM vs. Plant Flows, Loop A
MU 62 Rev. 2 1/05 Coin?! on Caldon 16MLI 62 Rev. 2 1/05 Count on Caldon 16
G=L2 Q 9QL:Q12 Q
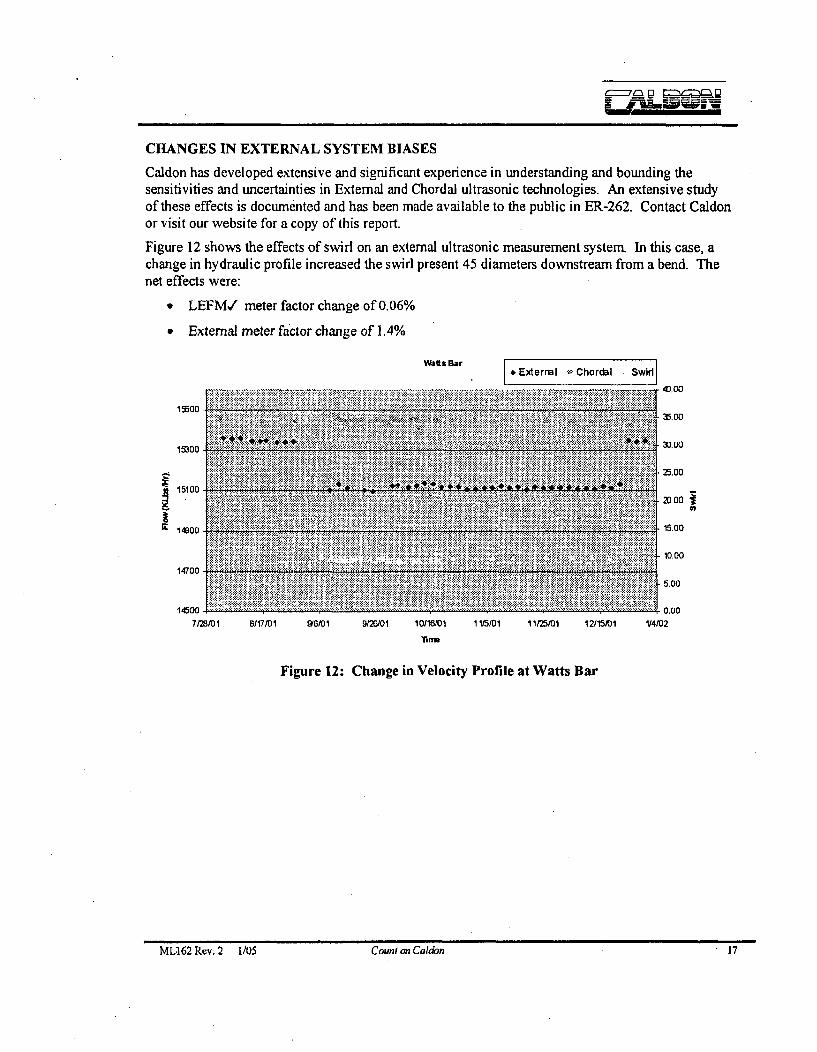
CHANGES IN EXTERNAL SYSTEM BIASES
Caldon has developed extensive and significant experience in understanding and bounding thesensitivities and uncertainties in External and Chordal ultrasonic technologies. An extensive studyof these effects is documented and has been made available to the public in ER-262. Contact Caldonor visit our website for a copy of this report.
Figure 12 shows the effects of swirl on an external ultrasonic measurement system. In this case, achange in hydraulic profile increased the swirl present 45 diameters downstream from a bend. Thenet effects were:
" LEFMV meter factor change of 0.06%
" External meter factor change of 1.4%
WaftalBarI*External A Chordal SwirlI
10.00
W.001!500
15300
15100
LL14900
14700
25.00
20.00
15.00
10.00
5.00
14500 $--'
7/2B/010.00
11/5/01 11/28/01 12/15/01 1/4/028117/01 96101 9/2&/01 10/16/01
Timr
Figure 12: Change in Velocity Profile at Watts Bar
MLl62Rcv.2 1/05 Count on Ca/don 17ML162 Rev. 2 U05 Count on Caldon 17
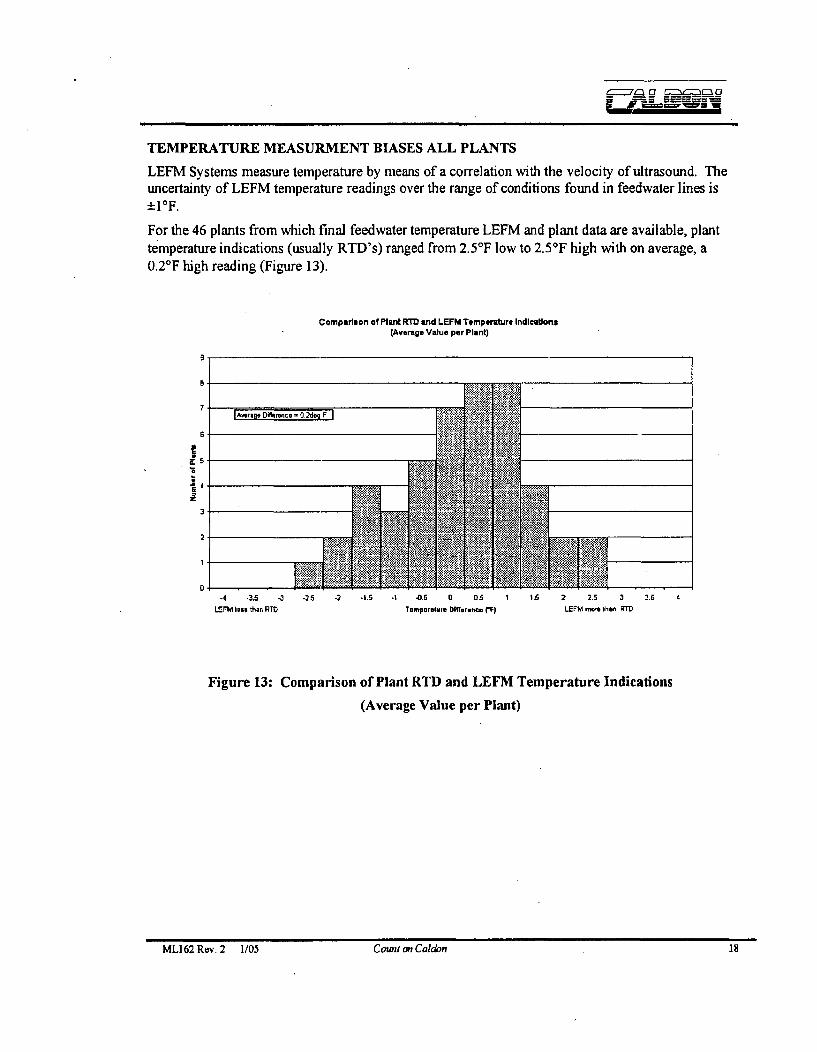
TEMPERATURE MEASURMENT BIASES ALL PLANTS
LEFM Systems measure temperature by means of a correlation with the velocity of ultrasound. Theuncertainty of LEFM temperature readings over the range of conditions found in feedwater lines is±10F.
For the 46 plants from which final feedwater temperature LEFM and plant data are available, planttemperature indications (usually RTD's) ranged from 2.57F low to 2.51F high with on average, a0.2'F high reading (Figure 13).
comparison of Plant RMD and LEFM Temperature Indications(Average Value per Plant)
7
6
3-
2
IAweage Dillerenice = 0.24og F
-4 -3.6 -3 -2.5 -2 .1.5 .1 -0.5 0 0.5LEFM less than RiD Iap.,po.,elu Olfemrvr F
1.6 2 2.5 3 3.6 4LEFM mar. than RTD
Figure 13: Comparison of Plant RTD and LEFM Temperature Indications
(Average Value per Plant)
ML162Rev.2 1/05 Count on CaldonML162Rev.2 1105 Count on Caldon

C--7a0 =4= 0
LABORATORY TESTING
LEFM Flow Measurement Systems have been extensively tested at Alden Research Laboratories(ARL). The results are traceable to NIST Standards. Over 10,000 tests have been conducted withover 500 different piping configurations.
A typical result of this testing is shown below (Figurel4). The data are for three LEFM's removedfrom a nuclear power plant, tested at ARL, and reinstalled. The LEFM readings were within 0.06%of the ARL weigh tank readings.
18000
16000
14000
12000
10000
ROOD
6000
4000
2000 4r-
2000 4000 6000 8000 10000 12000 1400D 16000
ARL ]Row
Figure 14: LEFM Performance vs. ARL Weigh Tank
ML162Rcv.2 I/OS Count on Caldon 19ML162Rcv.2 1/05 Cotmi on Caldm 19
M ElC EI 3 0no ____ ___ __W
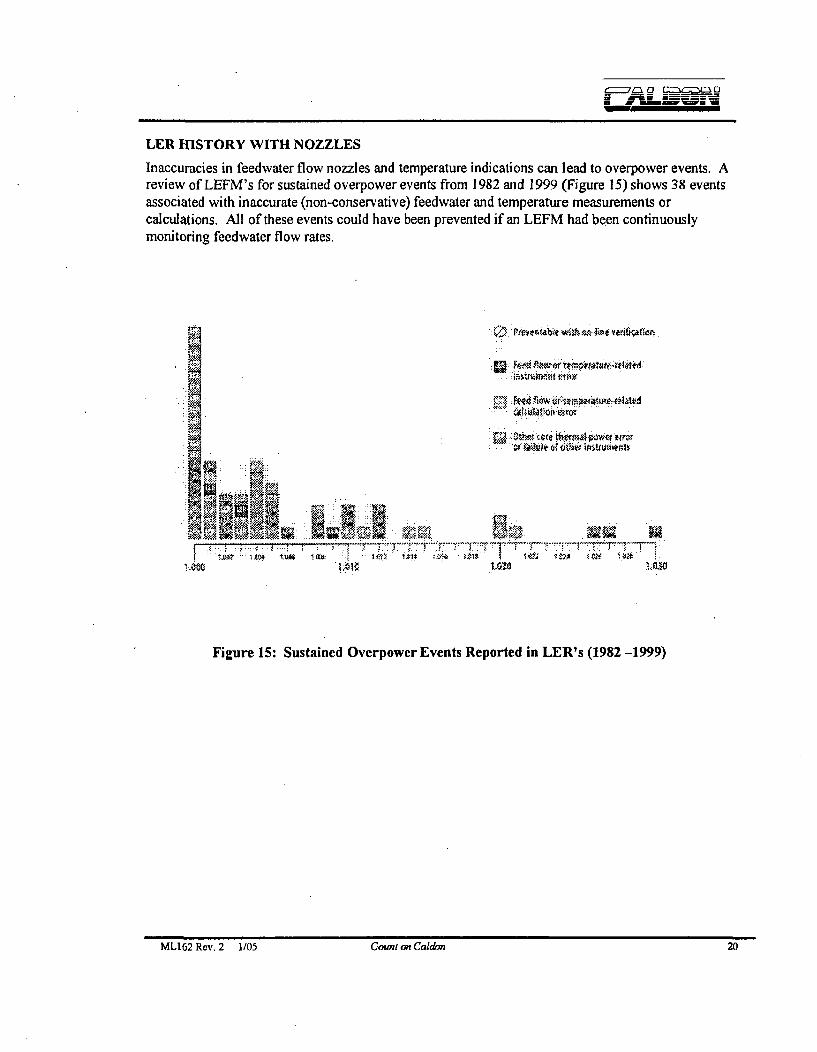
LER RISTORY WITH NOZZLES
Inaccuracies in feedwater flow nozzles and temperature indications can lead to overpower events. Areview of LEFM's for sustained overpower events from 1982 and 1999 (Figure 15) shows 38 eventsassociated with inaccurate (non-conservative) feedwater and temperature measurements orcalculations. All of these events could have been prevented if an LEFM had been continuouslymonitoring feedwater flow rates.
0 o~ tk *;Ab tb $, .1 'Me d o
rtrvm r.T
1 ~ r Oid
,~.
~
~ri4* iI3r~ Wý
Figure 15: Sustained Overpower Events Reported in LER's (1982 -1999)
ML162Rev.2 1/05 Count i~m Caldon 20ML162 Rev. 2 1/05 Count on Caldon 20
~wu. ===0
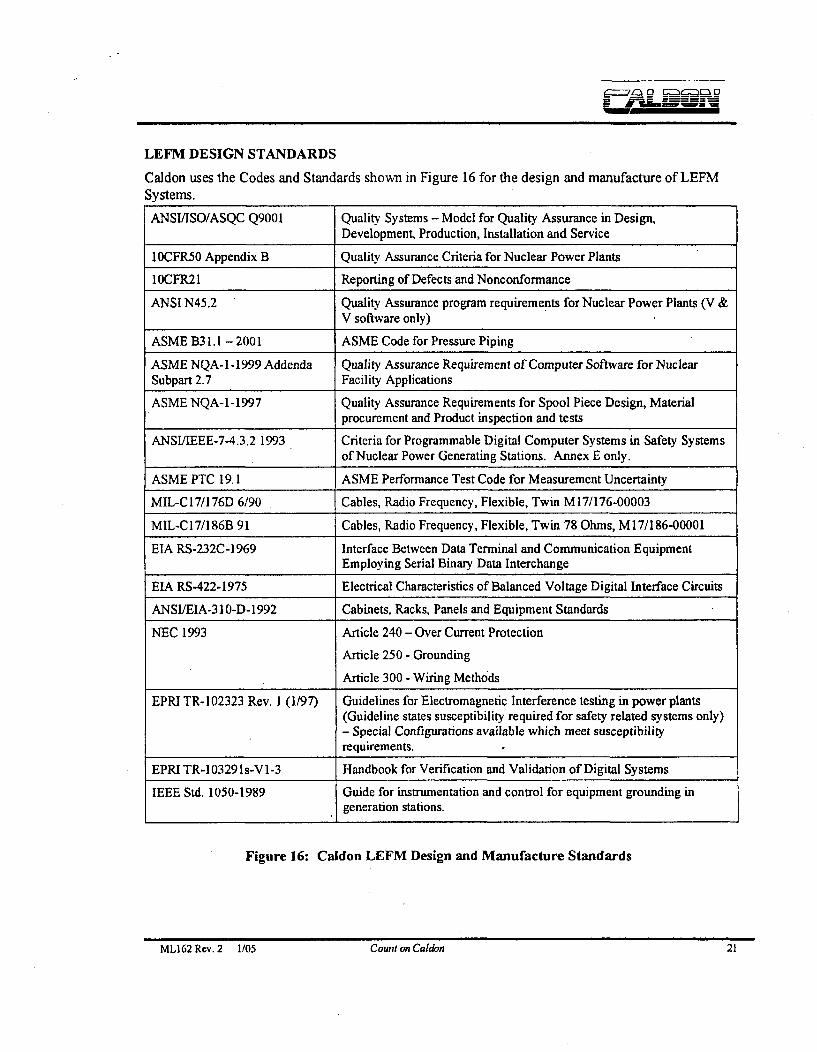
LEFM DESIGN STANDARDS
Caldon uses the Codes and Standards shown in Figure 16 for the design and manufacture of LEFMSystems. ____________________________
ANSI/JSO/ASQC Q9001 Quality Systems - Model for Quality Assurance in Design,Development, Production, Installation and Service
10CFR50 Appendix B Quality Assurance Criteria for Nuclear Power Plants
10CFR21 Reporting of Defects and Nonconformance
ANSI N45.2 Quality Assurance program requirements for Nuclear Power Plants (V &V software only)
ASME B3 1.1 - 2001 ASME Code for Pressure Piping
ASME NQA- I -1999 Addenda Quality Assurance Requirement of Computer Software for NuclearSubpart 2.7 Facility Applications
ASME NQA-1-1997 Quality Assurance Requirements for Spool Piece Design, Materialprocurement and Product inspection and tests .
AINSIIIEEE-7-4.3.2 1993 Criteria for Programmable Digital Computer Systems in Safety Systems
ASME PTC 19.1 ASME Performance Test Code for Measurement Uncertainty
MIL-C17/176D 6/90 Cables, Radio Frequency, Flexible, Twin M17/176-00003
MIL-Cl7/186B 91 Cables, Radio Frequency, Flexible, Twin 78 Ohms, M 17/186-00001
EJA RS-232C-1969 Interface Between Data Terminal and Communication Equipment______________________Employing Serial Binary Data Interchange
EIA R.S-422-1975 Electrical Characteristics of Balanced Voltage Digital Interface Circuits
ANSIIEIA-310-D-1992 Cabinets, Racks, Panels and Equipment Standards
NEC 1993 Article 240 - Over Current Protection
Article 250 - Grounding
Article 300 - Wiring Methods
EPRI TR-102323 Rev. 1 (1/97) Guidelines for Electromagnetic Interference testing in power plants(Guideline states susceptibility required for safety related systems only)- Special Configurations available which meet susceptibilityrequirements.
EPRI TR-1 03 29 1s-V 1-3 Handbook for Verification and Validation of Digital Systems
IEEE Std. 1050-1989 Guide for instrumentation and control for equipment grounding in
generation stations.
Figure 16: Caldon LEFM Design and Manufacture Standards
ML162 Rev. 2 1/05 Count on Caldon 21
SERVICES
Caldon's experience in Nuclear Power Plants has led to the development of a wide range of servicesand documentation.
Support Services
Caldon provides a full range of services to support customers.
" A group of service engineer specialists to install, test, commission, and repair LEFMSystems
* Classroom hands-on training of customer personnel
" Stock supply of emergency spare parts
* A monitoring program permits each LEFM System to be regularly checked for accuracy offlow measurement and component degradation
Design Basis Document
* A comprehensive "Design Basis Document", including a bottom-up analysis of uncertainties,is provided for each system installed to recover megawatts
* The profile factor used to calibrate LEFM Systems is determined from flow data taken atAlden Research Laboratories under conditions replicating plant piping.
ML162Rev.2 1/05 Count on Caldon 22ML162 Rev. 2 1/05 Count on Caldon 22