Embed Size (px)
Citation preview

GENERIC PIT INLET CAPACITY RELATIONSHIPS
Version 2, July 2005
This spreadsheet determines relationships that apply to pits in general, rather than particular types.
The relationships are based on theoretical relationships such as the geometry of flow cross-sections and weir and orifice equations.Their source is Hydraulic Engineering Circular 22 of the US Federal Highway Administration, (2nd Edition, 2003), which is available from www.fhwa.dot.gov/bridge/hyd.htm.
The material also includes comparisons between these "generic" relationships and specific relationships for particular types of pits, in the 'Checks' worksheet. You should review these to understand the suitability of the method to your needs.
Step by step instructions for using the spreadsheet macros are given with the sheets.To see the full 18 cell width of the spreadsheet, you may need a higher screen resolution.
This version differs from Version 1 in two main respects:(a) The macros for sag inlets and on-grade inlets have been consolidated into a single macro. Grate only and Kerb Inlet only pits can be modelled by giving zero dimensions for the other type of pit.(b) Checks have been added to prevent relationships 'curling over' and giving decreasing capacities as approach flows or ponding depths increase. In some cases this will result in capacities of grated inlets becoming constant as flows increase.(c) An error in adjusting for the gutter face slope in on-grade pits in gutters has been corrected. This had a small effect.(d) Allowance has been made for different gutter crossfalls in normal gutters and at a pit. Formerly these were treated as being the same.(e) Changes have been made to selection procedures for sag combination inlets, with the choice being between weir and orifice flows.
The Visual Basic macros are present in this sheet, but access is password-protected. If you need to know their contentscontact Geoffrey O'Loughlin on 0438 280 477 or [email protected].
Disclaimer
by Anstad Pty Ltd on the basis that the user will check the validity of the results obtained and methods used.The results of checks made by the developer are included in the 'Checks' worksheet, and further tests can be made by varying the program inputs.
Anstad Pty Ltd does not accept liability for loss or damage of any kind claimed to arise either directly or indirectly from use of this spreadsheet.
Its purpose is to define suitable relationships to be applied in the DRAINS program (see www.watercom.com.au).
This spreadsheet and the Visual Basic macros included are supplied to users of the DRAINS program

The relationships are based on theoretical relationships such as the geometry of flow cross-sections and weir and orifice equations.Their source is Hydraulic Engineering Circular 22 of the US Federal Highway Administration, (2nd Edition, 2003),
The material also includes comparisons between these "generic" relationships and specific relationships for particular types of pits, in the 'Checks' worksheet. You should review these to understand the suitability of the method to your needs.
(a) The macros for sag inlets and on-grade inlets have been consolidated into a single macro. Grate only and Kerb Inlet only pits can
(b) Checks have been added to prevent relationships 'curling over' and giving decreasing capacities as approach flows or ponding depths increase.
(c) An error in adjusting for the gutter face slope in on-grade pits in gutters has been corrected. This had a small effect.(d) Allowance has been made for different gutter crossfalls in normal gutters and at a pit. Formerly these were treated as being the same.(e) Changes have been made to selection procedures for sag combination inlets, with the choice being between weir and orifice flows.
The Visual Basic macros are present in this sheet, but access is password-protected. If you need to know their contents
by Anstad Pty Ltd on the basis that the user will check the validity of the results obtained and methods used.The results of checks made by the developer are included in the 'Checks' worksheet, and further tests
Anstad Pty Ltd does not accept liability for loss or damage of any kind claimed to arise either directly or
program (see www.watercom.com.au).

SAG PIT INLETS IN STREET GUTTERS AND IN SWALES
HEC22 covers these in Section 4.4.5, dealing with grate inlets, kerb inlets, slotted inlets and combination (grate + kerb inlet) inlets. In Section 4 it also deals with grated inlets in ditches or swales in the medians or verges of highways.
The grated inlets it specifies are those tested in the Bicycle-Safe Inlets study from the 1980s, which are described in Section 4.4.3.
Note - The Visual Basic macros select data from specific cells - do not add or delete rows or columns in this sheet.
Grated Inlets
Kerb Inlets
Combination (Kerb Inlet + Grate) Inlets
The directions in Section 4.4.5.4 of HEC22 are followed, though there is some ambiguity. Equation 4-28 was not applied.
The orifice capacity is the combination of both grate and kerb inlet flows, as in Equation 4-35.The selected inflow is the lesser of these, unless the depth of ponding is less than 1.4 times the slot height of the kerb inlet.(However, it is very unlikely that the orifice inlet capacity would be less than the kerb inlet capacity in this range.)
1. Inputs - Enter appropriate values in the green cells and press the Calculate button.
Length of Kerb Opening (m) 1 Length of Grate, L (m)Inlet Slot Height (m) 0.1 Width of Grate, W (m)
80 Perimeter of Grate (m) (see HEC22 Figure 4-18)
Grate Opening Ratio (%)Gutter Crossfall at Inlet (%)
2. Captured flowrates are given in the following table for the set of flowrates entered in the first column, which can be varied.
Eqn. 4-30 Eqn. 4-26 Eqn. 4-31 Eqn. 4-27 SelectedDepth of Kerb Inlet Grate Total Kerb Inlet Grate Total TotalPonding Weir Weir Weir Orifice Orifice Orifice Inletat Kerb Capacity* Capacity Capacity Capacity Capacity Capacity Capacity
(m)
For Grate Only Capacities enter zero Kerb Inlet Length in the Combination Inlet calculations located below.
For Kerb Inlet Only Capacities enter zero grate dimensions in the Combination Inlet calculations located below.
It is assumed that the weir capacity will be that of the grate, plus that of the part of the kerb inlet opening that is
Angle of Opening (90o vertical, 0o horizontal)
Area of Grate Opening (m2)
(m3/s) (m3/s) (m3/s) (m3/s) (m3/s) (m3/s) (m3/s)
0 0.1 0.2 0.3 0.4 0.5 0.6 0.7
0
0.1
0.2
0.3
0.4
0.5
0.6
0.7
0.8
Total Weir Capac ity Total Orifice Capac ity
Selec ted Capac ity
Ponding Depth (m )
Inle
t c
ap
ac
ity
(m
3/s
)

0 0 0 0 0 0 0 00.01 0.0016 0 0.0016 0 0 0 0.00160.02 0.004525 0 0.004525 0 0 0 0.0045250.03 0.008314 0 0.008314 0 0 0 0.0083140.04 0.0128 0 0.0128 0 0 0 0.01280.05 0.017889 0 0.017889 0.008175 0 0.008175 0.0178890.06 0.023515 0 0.023515 0.030768 0 0.030768 0.0235150.07 0.029632 0 0.029632 0.042738 0 0.042738 0.0296320.08 0.036204 0 0.036204 0.052023 0 0.052023 0.0362040.09 0.0432 0 0.0432 0.059885 0 0.059885 0.0432
0.1 0.050596 0 0.050596 0.066829 0 0.066829 0.0505960.12 0.066511 0 0.066511 0.078903 0 0.078903 0.0665110.14 0.083813 0 0.083813 0.089361 0 0.089361 0.0838130.16 0.1024 0 0.1024 0.098717 0 0.098717 0.0987170.18 0.122188 0 0.122188 0.10726 0 0.10726 0.10726
0.2 0.143108 0 0.143108 0.115172 0 0.115172 0.1151720.25 0.2 0 0.2 0.132905 0 0.132905 0.132905 * Use of Equation 4-28 was explored, but it was not adopted
0.3 0.262907 0 0.262907 0.148536 0 0.148536 0.148536 because it operates over an ill-defined range and can cause0.35 0.3313 0 0.3313 0.162672 0 0.162672 0.162672 the combined capacity to decrease as depth increases.
0.4 0.404772 0 0.404772 0.175674 0 0.175674 0.175674 The standard Equation 4-30 for weir calculations is used.0.45 0.482991 0 0.482991 0.187778 0 0.187778 0.187778
0.5 0.565685 0 0.565685 0.199148 0 0.199148 0.1991480.55 0.652625 0 0.652625 0.209902 0 0.209902 0.209902
0.6 0.743613 0 0.743613 0.220132 0 0.220132 0.220132
Slotted Inlets
The relationships used come from Section 4.4.5.3 of HEC22.These calculations are straightforward and are made by simple spreadsheet equations instead of a Visual Basic macro.
1. Inputs - Enter appropriate values in the green cells and the cells below will change.
Length of Slot (m) 3.66Width of Slot (m) 0.045
2. Captured flowrates are given in the following table for the flowrates entered in the first column, which can be varied.
Depth of Eqn. 4-32 Eqn. 4-33 (Minimum)Ponding Weir Orifice Inletover Slot Capacity Capacity Capacity
(m)
0 0 0 00.005 0.001812 0.041247 0.001812
0.01 0.005124 0.058333 0.0051240.015 0.009413 0.071443 0.009413
0.02 0.014493 0.082495 0.014493
(m3/s) (m3/s) (m3/s)
0 0.5 1 1.5 2 2.5
0
2
4
6
8
10
12
14
16
Weir Capac ity Orifice Capac ity Inlet Capac ity
Ponding Depth (m )
Inle
t C
ap
ac
ity
(m3/
s)
0 0.1 0.2 0.3 0.4 0.5 0.6 0.7
0
0.1
0.2
0.3
0.4
0.5
0.6
0.7
0.8
Total Weir Capac ity Total Orifice Capac ity
Selec ted Capac ity
Ponding Depth (m )
Inle
t c
ap
ac
ity
(m
3/s
)

0.03 0.026625 0.101035 0.0266250.04 0.040992 0.116665 0.0409920.05 0.057288 0.130436 0.057288
0.075 0.105245 0.159751 0.1052450.1 0.162035 0.184464 0.162035
0.125 0.226451 0.206237 0.2062370.15 0.297677 0.225921 0.225921
0.175 0.375117 0.244023 0.2440230.2 0.458304 0.260871 0.260871
0.25 0.6405 0.291663 0.2916630.3 0.841959 0.319501 0.319501
0.35 1.06099 0.345101 0.3451010.4 1.296281 0.368928 0.368928 "Typical" weir factors of 1.4 and orifice coefficients of 0.8 are used
0.45 1.546778 0.391307 0.391307 - see Section 4.4.5.3 of HEC22.0.5 1.811608 0.412474 0.412474
0.55 2.090033 0.432606 0.4326060.6 2.38142 0.451843 0.451843
1 5.124 0.583326 0.5833262 14.49286 0.824948 0.824948
0 0.5 1 1.5 2 2.5
0
2
4
6
8
10
12
14
16
Weir Capac ity Orifice Capac ity Inlet Capac ity
Ponding Depth (m )
Inle
t C
ap
ac
ity
(m3/
s)

HEC22 covers these in Section 4.4.5, dealing with grate inlets, kerb inlets, slotted inlets and combination (grate + kerb inlet) inlets.
The grated inlets it specifies are those tested in the Bicycle-Safe Inlets study from the 1980s, which are described in Section 4.4.3.
Note - The Visual Basic macros select data from specific cells - do not add or delete rows or columns in this sheet.
The directions in Section 4.4.5.4 of HEC22 are followed, though there is some ambiguity. Equation 4-28 was not applied.
The selected inflow is the lesser of these, unless the depth of ponding is less than 1.4 times the slot height of the kerb inlet.(However, it is very unlikely that the orifice inlet capacity would be less than the kerb inlet capacity in this range.)
0 Grate Opening Ratios0 1 - Reticuline - 60% of total grate area
0 (L+2W for grate against kerb, 2L+2W for
grate in swale or unobstructed area 3 - P-50x100 - 80% of total area
90 see values to right and 'Grate Types' sheet
3 (0% for flat base of swale) 5 - Curved Vane - 35% of total area
6 - P-30 - 60% of total area
0 (calculated from above information 7 - P-50 - 90% of total area
- can be overwritten) These are from Chart 9 in HEC22.
See the 'Grate Types' sheet for pictures of these grates.)
3. Inlet Capacity Relation
2. Captured flowrates are given in the following table for the set of flowrates entered in the first column, which can be varied. (coloured cells) can be copied and
Depth of InletPonding Capacity
(m)
enter zero Kerb Inlet Length in the Combination Inlet calculations located below.
enter zero grate dimensions in the Combination Inlet calculations located below.
It is assumed that the weir capacity will be that of the grate, plus that of the part of the kerb inlet opening that is not adjacent to the grate.
2 - 30o-85 Tilt Bar - 34% of total area
4 - 45o-85 Tilt Bar - 34% of total area
transferred to DRAINS
(m3/s)
0 0.1 0.2 0.3 0.4 0.5 0.6 0.7
0
0.1
0.2
0.3
0.4
0.5
0.6
0.7
0.8
Total Weir Capac ity Total Orifice Capac ity
Selec ted Capac ity
Ponding Depth (m )
Inle
t c
ap
ac
ity
(m
3/s
)

0 00.01 0.00160.02 0.0045250.03 0.0083140.04 0.01280.05 0.0178890.06 0.0235150.07 0.0296320.08 0.0362040.09 0.0432
0.1 0.0505960.12 0.0665110.14 0.0838130.16 0.0987170.18 0.10726
0.2 0.115172 * Use of Equation 4-28 was explored, but it was not adopted 0.25 0.132905 because it operates over an ill-defined range and can cause 0.3 0.148536 the combined capacity to decrease as depth increases. 0.35 0.162672 The standard Equation 4-30 for weir calculations is used. 0.4 0.175674
0.45 0.1877780.5 0.199148
0.55 0.2099020.6 0.220132
These calculations are straightforward and are made by simple spreadsheet equations instead of a Visual Basic macro.
3. Inlet Capacity Relation (coloured cells)
2. Captured flowrates are given in the following table for the flowrates entered in the first column, which can be varied. can be copied and
Depth of InletPonding Capacity
(m)
0 00.005 0.001812
0.01 0.0051240.015 0.009413
0.02 0.014493
transferred to DRAINS
(m3/s)
0 0.5 1 1.5 2 2.5
0
2
4
6
8
10
12
14
16
Weir Capac ity Orifice Capac ity Inlet Capac ity
Ponding Depth (m )
Inle
t C
ap
ac
ity
(m3/
s)
0 0.1 0.2 0.3 0.4 0.5 0.6 0.7
0
0.1
0.2
0.3
0.4
0.5
0.6
0.7
0.8
Total Weir Capac ity Total Orifice Capac ity
Selec ted Capac ity
Ponding Depth (m )
Inle
t c
ap
ac
ity
(m
3/s
)

0.03 0.0266250.04 0.0409920.05 0.057288
0.075 0.1052450.1 0.162035
0.125 0.2062370.15 0.225921
0.175 0.2440230.2 0.260871
0.25 0.2916630.3 0.319501
0.35 0.345101"Typical" weir factors of 1.4 and orifice coefficients of 0.8 are used 0.4 0.368928
0.45 0.3913070.5 0.412474
0.55 0.4326060.6 0.451843
1 0.5833262 0.824948
0 0.5 1 1.5 2 2.5
0
2
4
6
8
10
12
14
16
Weir Capac ity Orifice Capac ity Inlet Capac ity
Ponding Depth (m )
Inle
t C
ap
ac
ity
(m3/
s)
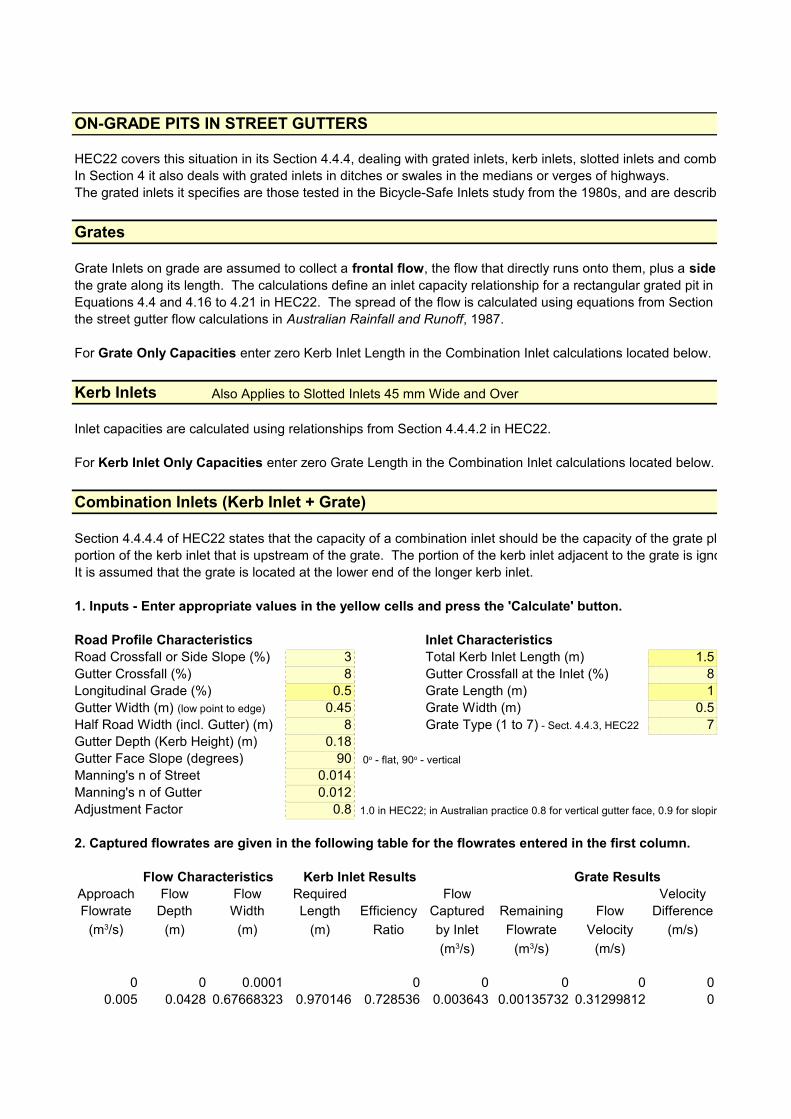
ON-GRADE PITS IN STREET GUTTERS
HEC22 covers this situation in its Section 4.4.4, dealing with grated inlets, kerb inlets, slotted inlets and combination (grate + kerb inlet) inlets. In Section 4 it also deals with grated inlets in ditches or swales in the medians or verges of highways.The grated inlets it specifies are those tested in the Bicycle-Safe Inlets study from the 1980s, and are described in Section 4.4.3.
Grates
the grate along its length. The calculations define an inlet capacity relationship for a rectangular grated pit in a street gutter, using Equations 4.4 and 4.16 to 4.21 in HEC22. The spread of the flow is calculated using equations from Section 4.3.2, which are equivalent to
Kerb Inlets Also Applies to Slotted Inlets 45 mm Wide and Over
Inlet capacities are calculated using relationships from Section 4.4.4.2 in HEC22.
Combination Inlets (Kerb Inlet + Grate)
Section 4.4.4.4 of HEC22 states that the capacity of a combination inlet should be the capacity of the grate plus the capacity of theportion of the kerb inlet that is upstream of the grate. The portion of the kerb inlet adjacent to the grate is ignored.It is assumed that the grate is located at the lower end of the longer kerb inlet.
1. Inputs - Enter appropriate values in the yellow cells and press the 'Calculate' button.
Road Profile Characteristics Inlet CharacteristicsRoad Crossfall or Side Slope (%) 3 Total Kerb Inlet Length (m) 1.5Gutter Crossfall (%) 8 Gutter Crossfall at the Inlet (%) 8Longitudinal Grade (%) 0.5 Grate Length (m) 1
0.45 Grate Width (m) 0.5Half Road Width (incl. Gutter) (m) 8 7Gutter Depth (Kerb Height) (m) 0.18Gutter Face Slope (degrees) 90Manning's n of Street 0.014Manning's n of Gutter 0.012Adjustment Factor 0.8 1.0 in HEC22; in Australian practice 0.8 for vertical gutter face, 0.9 for sloping face
2. Captured flowrates are given in the following table for the flowrates entered in the first column.
Flow Characteristics Kerb Inlet Results Grate ResultsApproach Flow Flow Required Flow VelocityFlowrate Depth Width Length Efficiency Captured Remaining Flow Difference
(m) (m) (m) Ratio by Inlet Flowrate Velocity (m/s)
(m/s)
0 0 0.0001 0 0 0 0 00.005 0.0428 0.67668323 0.970146 0.728536 0.003643 0.00135732 0.31299812 0
Grate Inlets on grade are assumed to collect a frontal flow, the flow that directly runs onto them, plus a side flow
the street gutter flow calculations in Australian Rainfall and Runoff, 1987.
For Grate Only Capacities enter zero Kerb Inlet Length in the Combination Inlet calculations located below.
For Kerb Inlet Only Capacities enter zero Grate Length in the Combination Inlet calculations located below.
Gutter Width (m) (low point to edge)
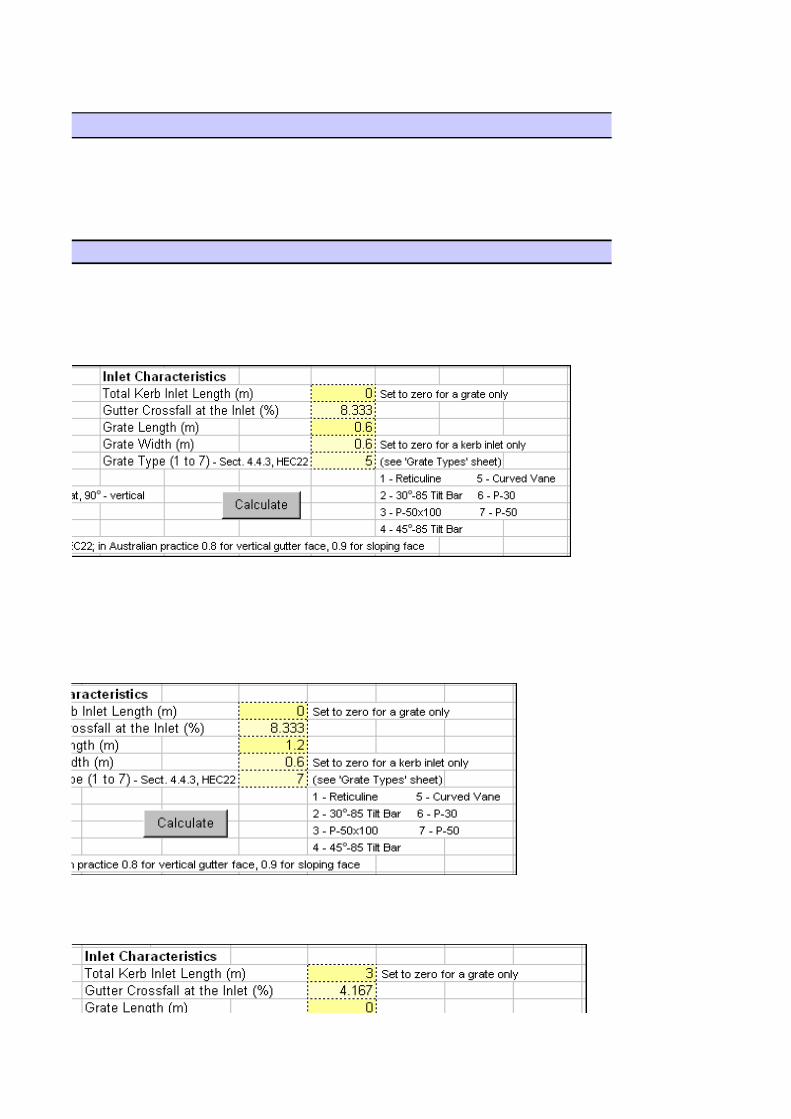
Grate Type (1 to 7) - Sect. 4.4.3, HEC22
0o - flat, 90o - vertical
(m3/s)
(m3/s) (m3/s)

0.01 0.054294 1.0598101 1.368534 0.55888 0.005589 0.0044112 0.41183466 00.015 0.062012 1.31707344 1.698824 0.46606 0.006991 0.0080091 0.44399568 0
0.02 0.068049 1.51830718 1.987017 0.40652 0.00813 0.01186959 0.4668507 00.03 0.077508 1.83359122 2.483121 0.332836 0.009985 0.02001491 0.50458437 00.04 0.085001 2.08336845 2.909237 0.287835 0.011513 0.02848661 0.53565031 00.05 0.091325 2.29415099 3.288417 0.256865 0.012843 0.03715673 0.56219417 00.06 0.096857 2.4785634 3.633245 0.233946 0.014037 0.04596324 0.58545816 00.07 0.101812 2.64372617 3.9515 0.216133 0.015129 0.05487072 0.60623515 00.08 0.106323 2.79409841 4.248393 0.201791 0.016143 0.06385674 0.62505895 00.09 0.11048 2.93268058 4.527621 0.189932 0.017094 0.0729061 0.64230555 0
0.1 0.114348 3.06159983 4.79192 0.179921 0.017992 0.0820079 0.65824956 00.125 0.123031 3.35104615 5.40003 0.160454 0.020057 0.10494328 0.69365698 0
0.15 0.130657 3.60522344 5.949413 0.146161 0.021924 0.12807589 0.72427613 00.175 0.137505 3.83348916 6.453865 0.135107 0.023644 0.15135627 0.75139439 0
0.2 0.143752 4.04174391 6.922499 0.126236 0.025247 0.17475277 0.77581793 00.25 0.154892 4.41305583 7.776216 0.112748 0.028187 0.22181305 0.81862855 0
0.3 0.164689 4.73964399 8.544561 0.102855 0.030856 0.26914353 0.85553086 00.35 0.173498 5.03326034 9.247964 0.095206 0.033322 0.31667777 0.88813537 0
0.4 0.181541 5.30136888 9.899845 0.089068 0.035627 0.36437295 0.91745549 00.45 0.188971 5.54902244 10.50957 0.084001 0.037801 0.4121994 0.94417048 0
0.5 0.195895 5.7798317 11.08399 0.079729 0.039864 0.46013569 0.96876556 00.6 0.208531 6.2010475 12.14649 0.072872 0.043723 0.55627678 1.01293433 00.7 0.2199 6.57999016 13.11689 0.067565 0.047295 0.65270454 1.05192029 00.8 0.230285 6.92617549 14.0145 0.063301 0.05064 0.7493596 1.08695436 00.9 0.239882 7.24607571 14.85274 0.059777 0.053799 0.84620058 1.11886108 0
1 0.24883 7.54432018 15.64136 0.056802 0.056802 0.94319758 1.14822388 01.1 0.25723 7.82434875 16.38777 0.054247 0.059672 1.04032789 1.17547107 01.2 0.265164 8.08881473 17.09768 0.052022 0.062426 1.13757391 1.20092738 01.3 0.27271 8.34034087 17.77585 0.05006 0.065078 1.23492226 1.2253902 01.4 0.279937 8.58123232 18.42619 0.048312 0.067637 1.33236262 1.25020766 01.5 0.286892 8.81306103 19.0518 0.046743 0.070114 1.42988574 1.27508986 01.6 0.29361 9.03699499 19.65522 0.045323 0.072516 1.52748381 1.29982412 01.7 0.300119 9.25395655 20.23856 0.044029 0.07485 1.62515011 1.32428885 01.8 0.306441 9.4646859 20.80362 0.042845 0.077121 1.72287874 1.34841228 01.9 0.312594 9.66979268 21.35194 0.041755 0.079335 1.82066491 1.37215436 0
2 0.318594 9.86978986 21.88484 0.040748 0.081496 1.9185041 1.39549518 02.25 0.333004 10.3501209 23.15697 0.038529 0.08669 2.16330966 1.45205438 0
2.5 0.346691 10.806383 24.35442 0.03665 0.091626 2.40837401 1.50611162 0

HEC22 covers this situation in its Section 4.4.4, dealing with grated inlets, kerb inlets, slotted inlets and combination (grate + kerb inlet) inlets.
The grated inlets it specifies are those tested in the Bicycle-Safe Inlets study from the 1980s, and are described in Section 4.4.3.
the grate along its length. The calculations define an inlet capacity relationship for a rectangular grated pit in a street gutter, using Equations 4.4 and 4.16 to 4.21 in HEC22. The spread of the flow is calculated using equations from Section 4.3.2, which are equivalent to
Section 4.4.4.4 of HEC22 states that the capacity of a combination inlet should be the capacity of the grate plus the capacity of theportion of the kerb inlet that is upstream of the grate. The portion of the kerb inlet adjacent to the grate is ignored.
Set to zero for a grate only
Set to zero for a kerb inlet only
1 - Reticuline 5 - Curved Vane
3 - P-50x100 7 - P-50
1.0 in HEC22; in Australian practice 0.8 for vertical gutter face, 0.9 for sloping face
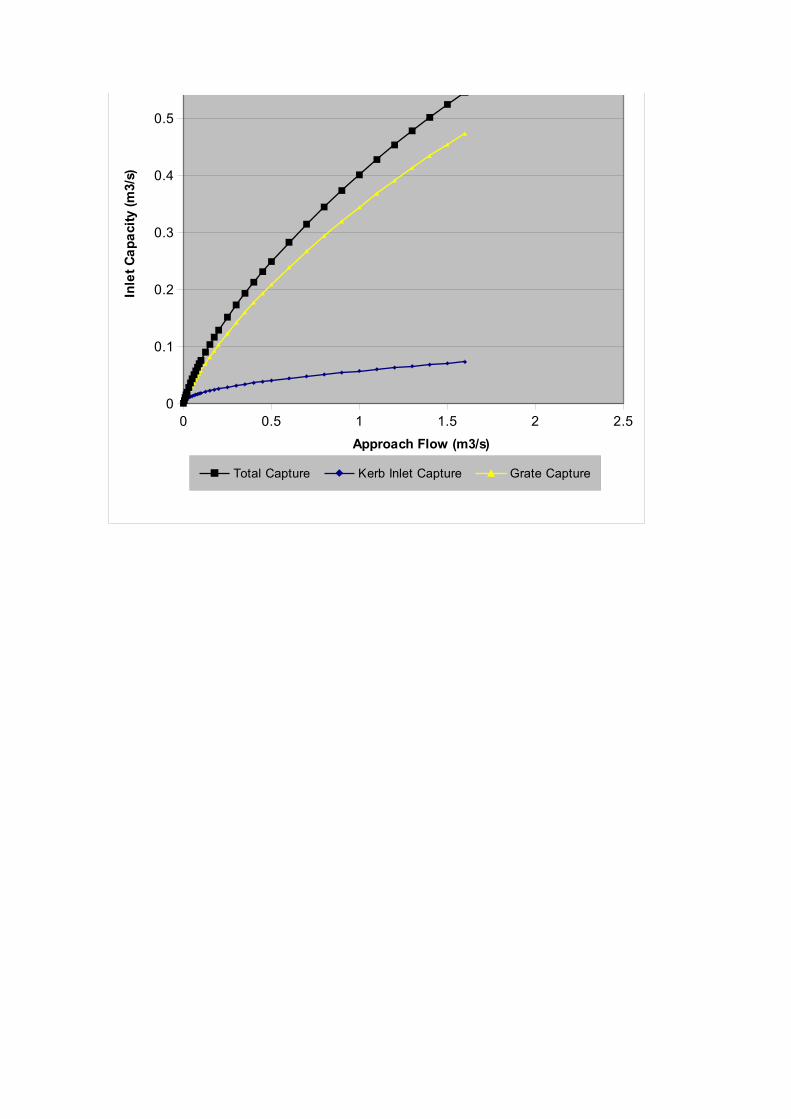
3. Inlet Capacity Relation can be copied and
TotalFrontal Captured Captured Captured Flow Total FlowFlow Frontal Side Flow Captured Captured Approach Total Flow
Ratio Flow Ratio Flow Ratio Ratio by Grate Flowrate Captured
0 0 0 0 0 0.000000 0.000 0.0001 1 0.745655 1 0.0013573 0.005000 0.005 0.005
, the flow that directly runs onto them, plus a side flow that is captured by
enter zero Grate Length in the Combination Inlet calculations located below.
(see 'Grate Types' sheet)
2 - 30o-85 Tilt Bar 6 - P-30
4 - 45o-85 Tilt Bar
transferred to DRAINS
(m3/s)
(m3/s) (m3/s) (m3/s) (m3/s)

0.997014 1 0.641438 0.998929 0.0044065 0.009995 0.010 0.0100.940653 1 0.60975 0.97684 0.0078236 0.014815 0.015 0.0150.870136 1 0.58805 0.946503 0.0112346 0.019365 0.020 0.019
0.75764 1 0.553792 0.891857 0.0178504 0.027836 0.030 0.0280.679214 1 0.527089 0.848297 0.0241651 0.035678 0.040 0.036
0.62192 1 0.505351 0.812983 0.0302078 0.043051 0.050 0.0430.577956 1 0.487107 0.783537 0.0360139 0.050051 0.060 0.0500.542903 1 0.471443 0.758398 0.0416138 0.056743 0.070 0.0570.514119 1 0.457752 0.736532 0.0470326 0.063176 0.080 0.0630.489934 1 0.445619 0.717229 0.0522904 0.069384 0.090 0.0690.469234 1 0.434744 0.699981 0.057404 0.075396 0.100 0.0750.428208 1 0.411727 0.66363 0.0696435 0.089700 0.125 0.090
0.39738 1 0.393033 0.634229 0.0812295 0.103154 0.150 0.1030.37309 1 0.377365 0.609664 0.0922765 0.115920 0.175 0.116
0.353287 1 0.363936 0.588649 0.102868 0.128115 0.200 0.1280.32259 1 0.341862 0.554171 0.1229224 0.151109 0.250 0.151
0.299577 1 0.324236 0.52668 0.1417524 0.172609 0.300 0.1730.281459 1 0.309663 0.503965 0.1595945 0.192917 0.350 0.1930.266692 1 0.297306 0.484709 0.1766149 0.212242 0.400 0.212
0.25434 1 0.286627 0.468066 0.1929366 0.230737 0.450 0.2310.243798 1 0.277256 0.45346 0.2086532 0.248517 0.500 0.2490.226624 1 0.261466 0.428836 0.2385513 0.282275 0.600 0.2820.213093 1 0.248553 0.408681 0.2667482 0.314044 0.700 0.3140.202055 1 0.237703 0.391729 0.293546 0.344186 0.800 0.3440.192815 1 0.228396 0.377173 0.3191641 0.372963 0.900 0.3730.184924 1 0.220283 0.364471 0.3437684 0.400571 1.000 0.4010.178076 1 0.213118 0.353243 0.3674881 0.427160 1.100 0.4270.172055 1 0.206722 0.34321 0.3904262 0.452852 1.200 0.4530.166702 1 0.200833 0.334055 0.4125324 0.477610 1.300 0.4780.161884 1 0.195103 0.325402 0.4335541 0.501191 1.400 0.5010.157505 1 0.189592 0.317236 0.4536108 0.523725 1.500 0.5240.153496 1 0.184336 0.309537 0.4728123 0.545329 1.600 0.5450.149801 1 0.179343 0.302278 0.4912474 0.566097320.146379 1 0.17461 0.29543 0.50899 0.586111210.143195 1 0.170128 0.288962 0.5261027 0.605437780.140221 1 0.165885 0.282845 0.5426389 0.62413480.133556 1 0.156224 0.268916 0.5817477 0.668438080.127784 1 0.147746 0.256651 0.6181116 0.70973755

3. Inlet Capacity Relation can be copied and
transferred to DRAINS
0 0.5 1 1.5 2 2.50
0.1
0.2
0.3
0.4
0.5
0.6
Total Capture Kerb Inlet Capture Grate Capture
Approach Flow (m3/s)
Inle
t C
ap
aci
ty (
m3/
s)
0 0.5 1 1.5 2 2.50
0.1
0.2
0.3
0.4
0.5
0.6
Total Capture Kerb Inlet Capture Grate Capture
Approach Flow (m3/s)
Inle
t C
ap
aci
ty (
m3/
s)

ON-GRADE GRATES IN SWALES OR DITCHES
This sheet uses a method taken from Section 4.4.7 of HEC22, which deals with median, embankment and bridge inlets.
Grated sag inlets operate the same way as on streets, although there will probably be a greater perimeter length
It is assumed that the swale is trapezoidal, including rectangular and triangular channels, though the method can be adapted to other shapes.
1. Inputs - Enter appropriate values in the blue cells, and press the 'Calculate' button.
Channel Base Width (m) 1.2 Width of grate (m)Channel Side Slope (1:?) V:H 6 Length of grate (m)Channel Depth (m) 1 Grate Type (1 to 7) - Sect. 4.4.3, HEC22Manning's n of Channel 0.03Longitudinal Grade (%) 2
Inward Slope of Base (%) 1(used when base width exceeds grate width)
2. Captured flowrates are given in the following table for the flowrates entered in the first column.
Approach Flow Flow Flow Captured Total FlowFlowrate Depth Width Velocity Flow Captured
(m) (m) (m) Ratio
0 0 0 0 0 00.005 0.014594 1.375132 0.266082 0.619733 0.003099
0.01 0.021903 1.46284 0.342905 0.56265 0.0056270.015 0.027638 1.53166 0.397359 0.531347 0.00797
0.02 0.032636 1.591627 0.439047 0.510242 0.0102050.03 0.041164 1.693967 0.503664 0.481166 0.0144350.04 0.04845 1.781401 0.553828 0.460762 0.018430.05 0.054916 1.858987 0.595287 0.444954 0.0222480.06 0.060784 1.929408 0.630855 0.432009 0.0259210.07 0.066192 1.9943 0.662139 0.421028 0.0294720.08 0.071229 2.054748 0.690153 0.411485 0.0329190.09 0.07596 2.111523 0.71558 0.403041 0.036274
0.1 0.080433 2.165193 0.738903 0.395468 0.0395470.125 0.0907 2.288405 0.79014 0.379371 0.047421
0.15 0.099948 2.399378 0.83391 0.366176 0.0549260.175 0.108414 2.500973 0.872299 0.355005 0.062126
0.2 0.116257 2.595086 0.906606 0.345331 0.0690660.25 0.130487 2.765848 0.966196 0.329202 0.082301
0.3 0.138285 2.859423 0.997581 0.321045 0.0898930.35 0.154842 3.058105 1.061677 0.305089 0.106781
because the grate is not located against a kerb. Use the 'Sag Inlets' worksheet to calculate sag relationships.
(m3/s) (m3/s)
0 0.5 1 1.5 2 2.5 3 3.5 4 4.5 5
0
0.1
0.2
0.3
0.4
0.5
0.6
0.7
0.8
Total Flow Captured
Approach Flow (m3/s)
Inle
t c
ap
ac
ity
(m
3/s
)

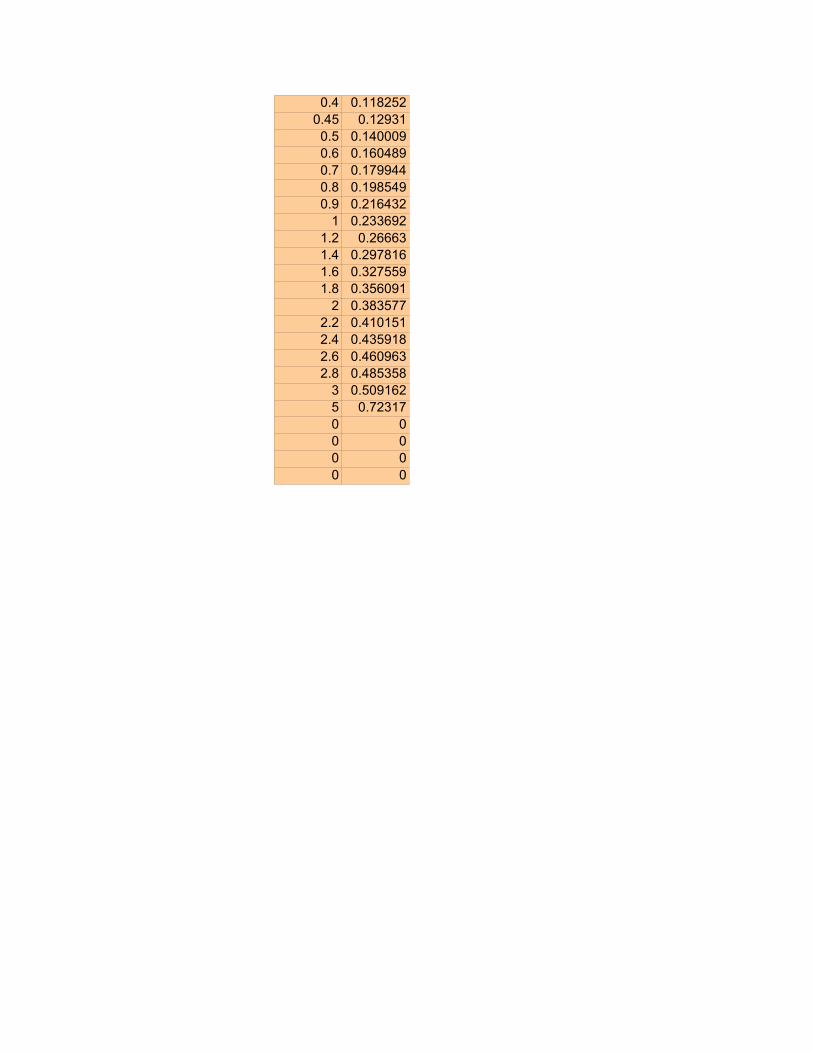
0.4 0.165558 3.186691 1.101549 0.29563 0.1182520.45 0.17554 3.306486 1.137699 0.287357 0.12931
0.5 0.184911 3.418928 1.170838 0.280019 0.1400090.6 0.202156 3.625873 1.230038 0.267482 0.1604890.7 0.217811 3.81373 1.281999 0.257063 0.1799440.8 0.232212 3.986549 1.328483 0.248186 0.1985490.9 0.245595 4.147144 1.370663 0.24048 0.216432
1 0.25813 4.297558 1.40936 0.233692 0.2336921.2 0.281138 4.573662 1.478562 0.222191 0.266631.4 0.301966 4.82359 1.539376 0.212726 0.2978161.6 0.32109 5.053083 1.593781 0.204725 0.3275591.8 0.338822 5.265862 1.643254 0.197828 0.356091
2 0.355404 5.464853 1.688677 0.191789 0.3835772.2 0.371015 5.652175 1.730746 0.186432 0.4101512.4 0.385789 5.829465 1.769985 0.181632 0.4359182.6 0.399835 5.998016 1.8068 0.177294 0.4609632.8 0.413239 6.158873 1.841514 0.173342 0.485358
3 0.426074 6.312891 1.874385 0.169721 0.5091625 0.532651 7.591814 2.135397 0.144634 0.72317

This sheet uses a method taken from Section 4.4.7 of HEC22, which deals with median, embankment and bridge inlets.
Grated sag inlets operate the same way as on streets, although there will probably be a greater perimeter length
It is assumed that the swale is trapezoidal, including rectangular and triangular channels, though the method can be adapted to other shapes.
0.60.6
7 1 - Reticuline
3 - P-50x100
5 - Curved Vane
6 - P-30
7 - P-50 3. Inlet Capacity Relation (coloured cells) can be copied and
2. Captured flowrates are given in the following table for the flowrates entered in the first column.
Approach Total FlowFlowrate Captured
0 00.005 0.003099
0.01 0.0056270.015 0.00797
0.02 0.0102050.03 0.0144350.04 0.018430.05 0.0222480.06 0.0259210.07 0.0294720.08 0.0329190.09 0.0362740.1 0.039547
0.125 0.0474210.15 0.054926
0.175 0.0621260.2 0.069066
0.25 0.0823010.3 0.089893
0.35 0.106781
Use the 'Sag Inlets' worksheet to calculate sag relationships.
Grate Types (see 'Grate Types' sheet)
2 - 30o-85 Tilt Bar
4 - 45o-85 Tilt Bar
transferred to DRAINS
(m3/s) (m3/s)
0 0.5 1 1.5 2 2.5 3 3.5 4 4.5 5
0
0.1
0.2
0.3
0.4
0.5
0.6
0.7
0.8
Total Flow Captured
Approach Flow (m3/s)
Inle
t c
ap
ac
ity
(m
3/s
)
0.4 0.1182520.45 0.129310.5 0.1400090.6 0.1604890.7 0.1799440.8 0.1985490.9 0.216432
1 0.2336921.2 0.266631.4 0.2978161.6 0.3275591.8 0.356091
2 0.3835772.2 0.4101512.4 0.4359182.6 0.4609632.8 0.485358
3 0.5091625 0.723170 00 00 00 0


Grate Types
The limited range of grates available are shown below. See HEC22 for more details.
Reticuline P-50 and P-50 x 100
Curved Vane P-30
US FHWA Splash-Over Velocities for Grates
This plot below shows the curve fits made to Figure 5 in Appendix A of Hydraulic Engineering Circular 22.The power relationships shown are used in calculations for on-grade grated inlets.Since they tend to "curl over", giving reducing capacities for increasing flowrates at higher approach flows,values become constant at the highest calculated capacity.
Length of1 2 3 4 5 6 7
0 0.00 0.00 0.00 0.00 0.00 0.00 0.000.125 0.31 0.42 0.52 0.60 0.69 0.91 1.13
0.25 0.62 0.72 0.81 0.91 1.06 1.25 1.600.375 0.90 0.97 1.05 1.16 1.35 1.54 1.96
0.5 1.11 1.19 1.25 1.37 1.60 1.79 2.240.625 1.32 1.40 1.47 1.55 1.84 1.99 2.49
0.75 1.54 1.62 1.64 1.76 2.06 2.20 2.740.875 1.75 1.82 1.82 1.94 2.25 2.35 2.96
1 1.94 2.00 2.00 2.08 2.45 2.54 3.19
45o Tilt Bar
30o Tilt Bar
Splash Over Velocity (m/s) for Pit Type:Grate (m)
0 2 4 6 8 10 120
2
4
6
8
10
12
Length of Grate (m)
Sp
lash
Ov
er
Ve
loci
ty (
m/s
)
`

1.125 2.20 2.16 2.25 2.62 2.68 3.361.25 2.41 2.30 2.42 2.78 2.84 3.58
1.375 2.61 2.42 2.50 2.93 2.96 3.79
Fitting 1.9953 2.0204 1.9845 2.0870 2.4379 2.5261 3.1844Factors 0.8696 0.7540 0.6465 0.6004 0.6041 0.4976 0.4997
1 - Reticuline
3 - P-50x100
5 - Curved Vane6 - P-307 - P-50
Grate Types (see above)
2 - 30o-85 Tilt Bar
4 - 45o-85 Tilt Bar0 2 4 6 8 10 12
0
2
4
6
8
10
12
Length of Grate (m)
Sp
lash
Ov
er
Ve
loci
ty (
m/s
)
`
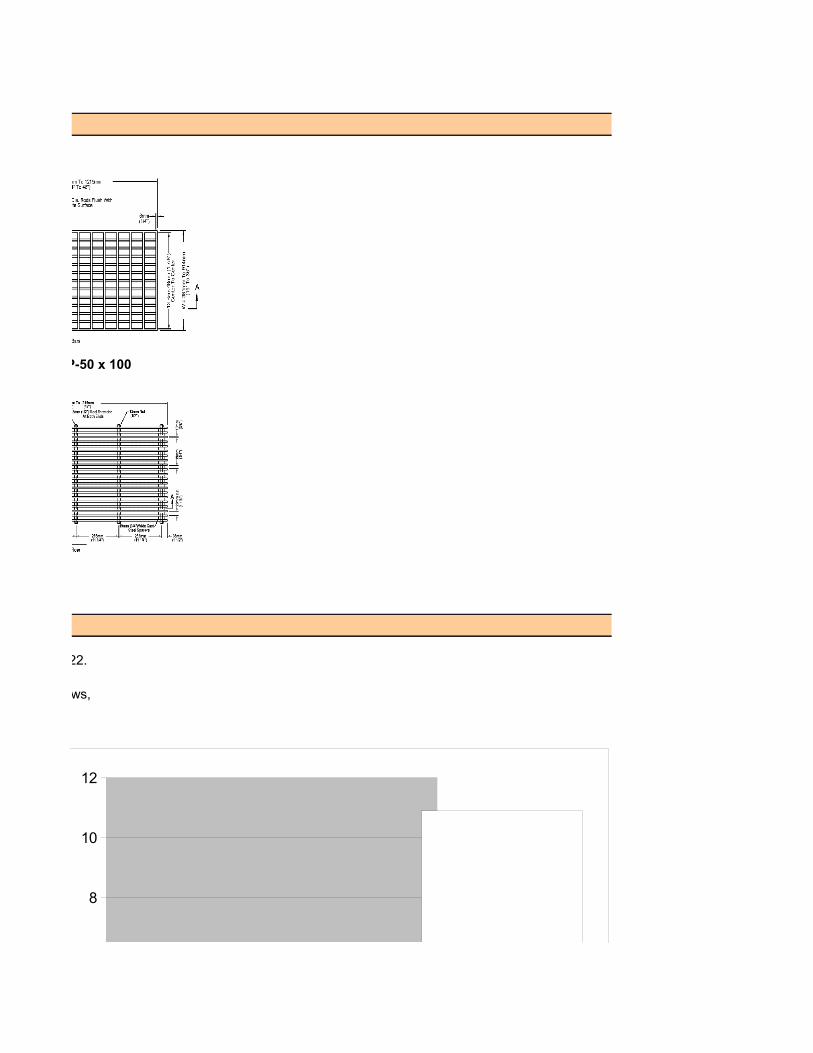
P-50 and P-50 x 100
This plot below shows the curve fits made to Figure 5 in Appendix A of Hydraulic Engineering Circular 22.
Since they tend to "curl over", giving reducing capacities for increasing flowrates at higher approach flows,
0 2 4 6 8 10 120
2
4
6
8
10
12
Length of Grate (m)
Sp
lash
Ov
er
Ve
loci
ty (
m/s
)
`

0 2 4 6 8 10 120
2
4
6
8
10
12
Length of Grate (m)
Sp
lash
Ov
er
Ve
loci
ty (
m/s
)
`

CHECKS ON RESULTS This section provides checks and comparisons so that potential users can assess the suitability of this macrofor use in their design and analysis work.
Users are encouraged to carry out their own tests by varying the inputs into the various calculation procedures (on the yellow cells).
Part 1. Examples from HEC 22
This section compares results from the examples in HEC22 with those calculated in the macros.
This is for an on-grade grate inlet on road section with gutter width = 0.6 m, longitudinal grade = 1%, crossfall = 2%, n = 0.016 and gutter depression = 50 mm
The differences appear to be due to roundoff errors in charts in the HEC22 calculations. Our computer-based results should be more accurate.
For the road cross-section in Example 4-2, with a total flow width of 3 m, road crossfall of 0.025, longitudinal slope of 0.04 and n = 0.016,
The equivalent flowrates from trial and error calculations in the 'On-Grade Inlets in Streets' worksheet are:
The capacities calculated here are slightly below those obtained in the HEC22 manual. This probably relatesto the way that cross-sectional flow capacities are calculated. These calculations are based on the procedures
This example considers a kerb inlet on a road with a 1% longitudinal grade, road and gutter crossfalls of 2% and a Manning's n of 0.016.
Example 4-2 (page 4-13 - note that page numbers are from the PDF version)
The gutter cross-slope is assumed to be 0.05/0.6 = 0.083333 or 8.333%. The flowrate corresponding to a spread of 2.5 m is estimated to be
In HEC22, the spread at a flowrate of 0.12 m3/s is calculated as 3.5 m.
The first part of the on-grade pit spreadsheet is used to find the flowrate corresponding at a spread of 2.5 m as
The calculated flow width at a flowrate of 0.12 m3/s given by the macro is 3.51 m, so agreement is good.
Example 4-7 (page 4-45)
For the road cross-section in Example 4-2, the capacity of a curved vane grate, 0.6 m x 0.6 m is to be found when approach flow is 0.06 m
The example gives a velocity = 0.785 m/s, frontal flow portion = 0.70, frontal flow efficiency = 1.0, side flow efficiency =
For the flowrate of 0.06 m3/s, the 'On-Grade in Street' worksheet gives the following values that differ slightly from those in HEC22:
Velocity = 0.788 m/s, Frontal flow portion = 0.66, frontal flow efficiency = 1.0, side flow efficiency = 0.10
Example 4-8 (page 4-46)
the flowrate is determined to be 0.19 m3/s, and the inlet capacities of the following grates are estimated:
(a) P-50 Type, 0.6 x 0.6 m - 0.091 m3/s
(b) reticuline grate, 0.6 x 0.6 m - 0.082 m3/s
(c) grates (a) and (b) with a length of 1.2 m - both have 0.103 m3/s capacity.
Flowrate = 0.188 m3/s
(a) P-50 Type, 0.6 x 0.6 m - 0.088 m3/s
(b) reticuline grate, 0.6 x 0.6 m - 0.078 m3/s
(c) grates (a) and (b) with a length of 1.2 m - both have 0.100 m3/s capacity.
set out in Australian Rainfall and Runoff, 1987, while HEC22 uses a slightly simpler procedure.
Example 4-9a (page 4-49)

100% capture is calculated to occur for a length of 4.1 m.
A combination inlet system is on a road with a 2% crossfall, a 6.2% gutter crossfall, a longitudinal slope of 1% and a roughness of 0.016.The gutter is 0.6 m wide. The grate is 0.6 m x 0.6 m curved vane grate and the kerb inlet is 3 m long.
The width of a grate in a sag is 0.6 m, and a 50% blocking factor is applied. The allowable depth at kerb is 0.15 m.
and then applies a complex procedure to allow for 50% coverage of the grate.
This adjusts for the average ponding depth over the sloping face of the grate.
An undepressed kerb inlet in a sag with a length of 2.5 m and a slot height of 0.13 m is on a road with a 2% crossfall..
derived from Equation 4-30.
derived from Equation 4-28.
For an approach flowrate of 0.05 m3/s the inlet capacity of a 3 m long kerb inlet is found to be 0.031 m3
For this same flowrate, the capacity of a 3 m kerb inlet with a depression 0.6 m wide and 0.025 m deep is found to be
The macro here gives flowrates of 0.031 m3/s for the first configuration.
For the depressed gutter at the inlet having a crossfall of 0.025/0.6 = 0.0417 or 4.167%, the estimated inlet capacity from the macro is
Example 4-9b (page 4-52)
For the same road system as in Example 4-7, the minimum length of kerb opening needed to capture 100% of a flow of 0.064 mwas found to be 3.81 m.
The macro gives 99% capture at a length of 3.81 m. However, the answer is in an insensitive range.
Example 4-10 (page 4-55)
With an approach flow of 0.050 m3/s, the combined inlet capacity is found to be 0.049 m3/s.
The macro for combination inlets defines a capacity of 0.0497 m3/s.
Example 4-11 (page 4-60)
A flow along a road with a 5% crossfall and a Manning's n of 0.016 is 0.19 m3/s, based on an allowable width of 3 m.
The HEC22 procedures specify a grate perimeter of 2.31 m, without allowing for blockage,
The sag inlet macro gives a capacity of 0.205 m3/s at a gutter depth of 0.15 m for an unblocked pit with a perimeter of
Example 4-12 (page 4-64)
For a ponding area width of 2.5 m, corresponding to a depth of 0.05 m, the inlet capacity is calculated as
If the gutter is depressed by 0.025 m, and the gutter is 0.6 m wide, the inlet capacity will be 0.048 m3/s,

using Equation 4.30 only. It is difficult to determine the exact ranges over which Equation 4-28 works, andthe datum for the depths. The macro only uses Equation 4-30 with depth measured at the kerb face.
A length of 3.66 m is selected.
A combination pit has a 0.6 m x 1.2 m P-50 grate and a kerb opening 1.2 m long with a slot 0.1 m high.
The calculation in HEC22 determines that for a perimeter of 2.4 m, the average depth of ponding will be 0.11 m,
Agreement can be regarded as satisfactory.
A median ditch has a base width of 1.2 m and a Manning's roughness of 0.03. Sideslopes are 1:6 V:H and the longitudinal grade is 2%.
and 0.12 m3/s will bypass the pit.
This is similar to the previous example.A median ditch has a base width of 0.6 m and a Manning's roughness of 0.03. Sideslopes are 1:6 V:H and the longitudinal grade is 3%.
Part 2. Comparisons with Laboratory-Derived Relationships for Australian Pits
This section compares relationships obtained from laboratory testing for commonly-used Australian pits with relationships obtained from the Visual Basic macros (coloured green). The numbers used in the macros are shown along with plots of relationships.
The fits obtained are quite variable. Some are good, or acceptable, while others are bad.They show that the HEC22 procedures should be used with care, and with reference to any available information.However, it must be recognised that in many cases, in many cases the HEC22 procedures will be the only avaialable information source.
NSW RTA (DMR) SA1 1 m Long Inlets - Kerb Inlets and Combination (Kerb Inlet + Grate) Inlets
The spreadsheet calculations give a capacity of 0.045 m3/s in the first situation, and the same value of
Example 4-13 (page 4-66)
A 45 mm wide slotted inlet is to limit a 0.14 m3/s flow so that the flow depth at the kerb is limited to 0.09 m.
The sag macro for a 3.66 m long slotted inlet of this length gives an inlet capacity of 0.138 m3/s when the depth of ponding is 0.09 m.
Example 4-14 (page 4-67)
The road and gutter have a 3% crossfall. The flowrate arriving at this pit is 0.15 m3/s.
and the depth at the kerb will be 0.119 m. The corresponding width of ponding will be 3.97 m.If the grate is completely blocked, all flow will be through the kerb inlet and the depth at the kerb will be
The macro gives a depth of 0.121 m for an inflow of 0.15 m3/s. This should be more accurate than the answer in HEC22.If the grate is clogged, and is assumed to have zero dimensions, the depth corresponding to the required inflow is
Example 4-17 (page 4-87)
A flow of 0.28 m3/s is to be intercepted by a 0.6 x 0.6 m P-50 grate. HEC22 indicates that nominally 0.10 m
The Visual Basic macro for inlets in a swale calculates a capture rate of 0.090 m3/s, which should be more accurate than the HEC22 result.
Example 4-18 (page 4-88)
A flow of 0.28 m3/s is to be intercepted by a 0.6 x 0.6 m P-50 grate. HEC22 indicates that 0.16 m3/s will be intercepted and 0.12 m
The Visual Basic macro for inlets in a swale calculates a capture rate of 0.163 m3/s.

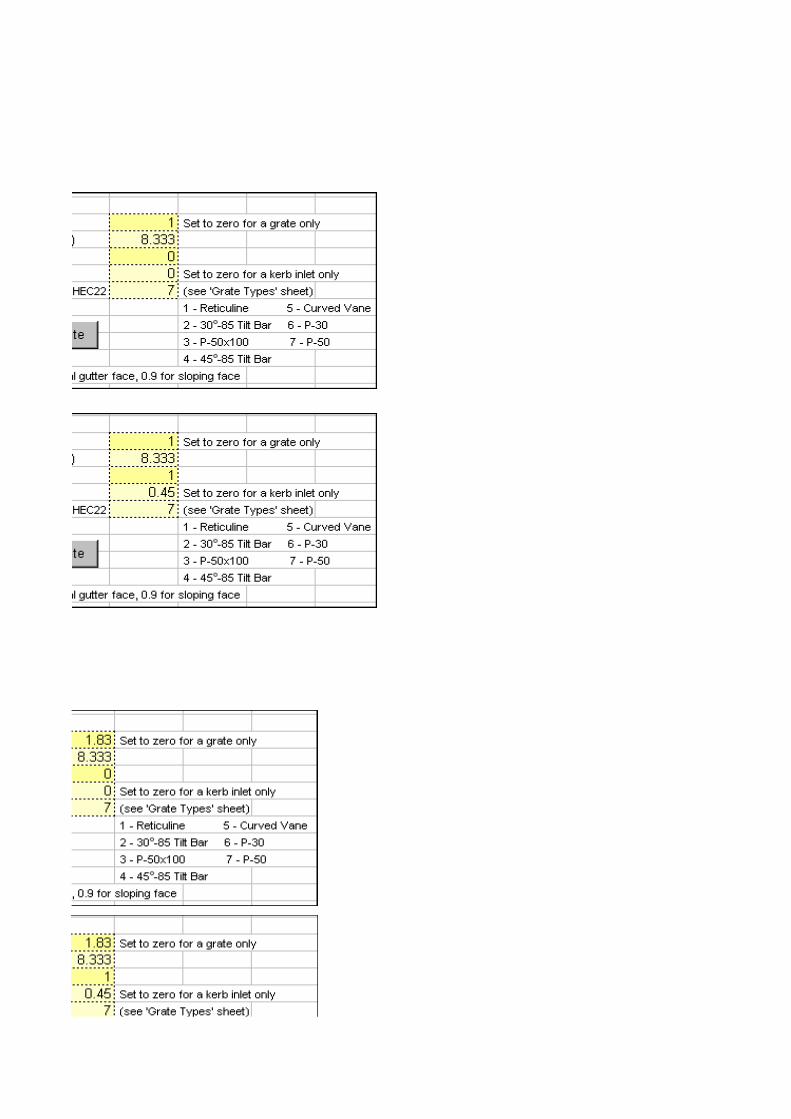
NSW RTA (DMR) SA2 1 m Extended Inlets (1.83 m Long Kerb Inlet and 0.9 m Grates)

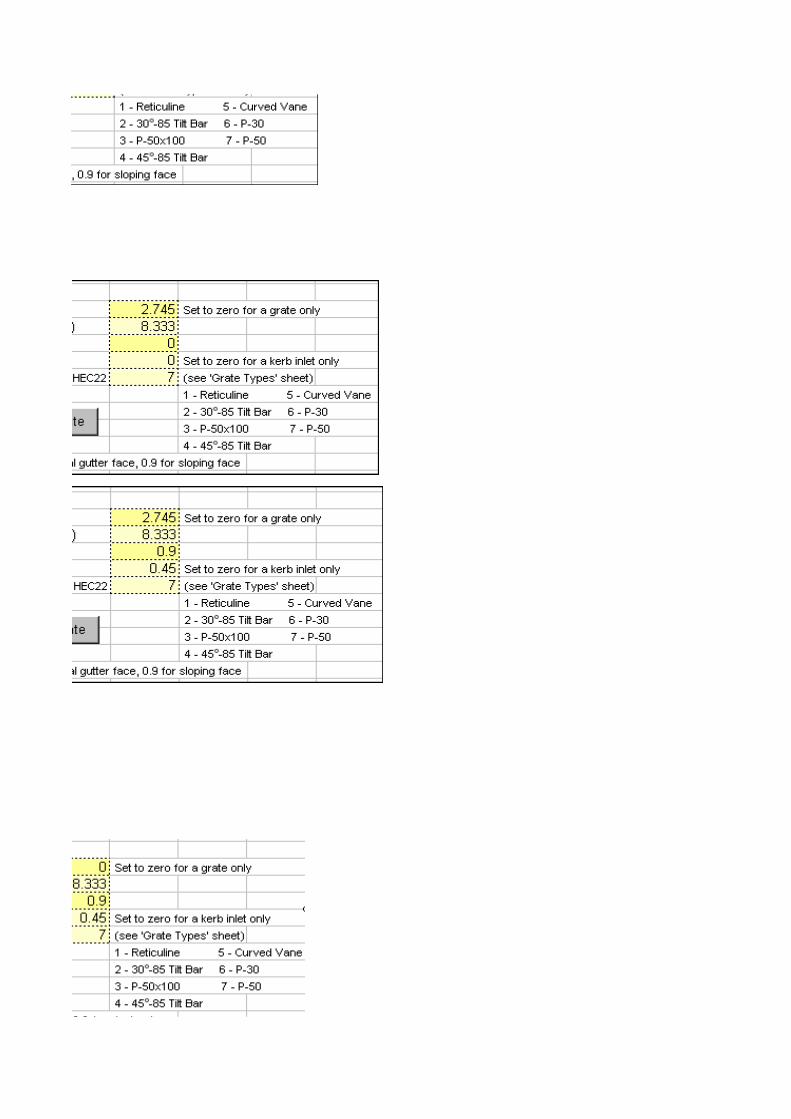
NSW RTA (DMR) SA3 2 m Extended Inlets (2.45 m Long Kerb Inlet and 0.9 m Grates)
NSW Department of Housing RM.7 (Grated) Pit On-Grade

NSW Department of Housing RM.10 (Combination) Pit On-Grade
Since the manual's relationships apply for all grades, they are compared with HEC22 results at 1% and 2%.
Above this flow, the HEC22 procedures give higher inflows than thevalues from the manual.
The effect of longitudinal grade is relatively small.
Victorian VicRoads Side Entry PitsAssuming 3% Road Crossfall
There is good agreement for approach flows below 0.15 m

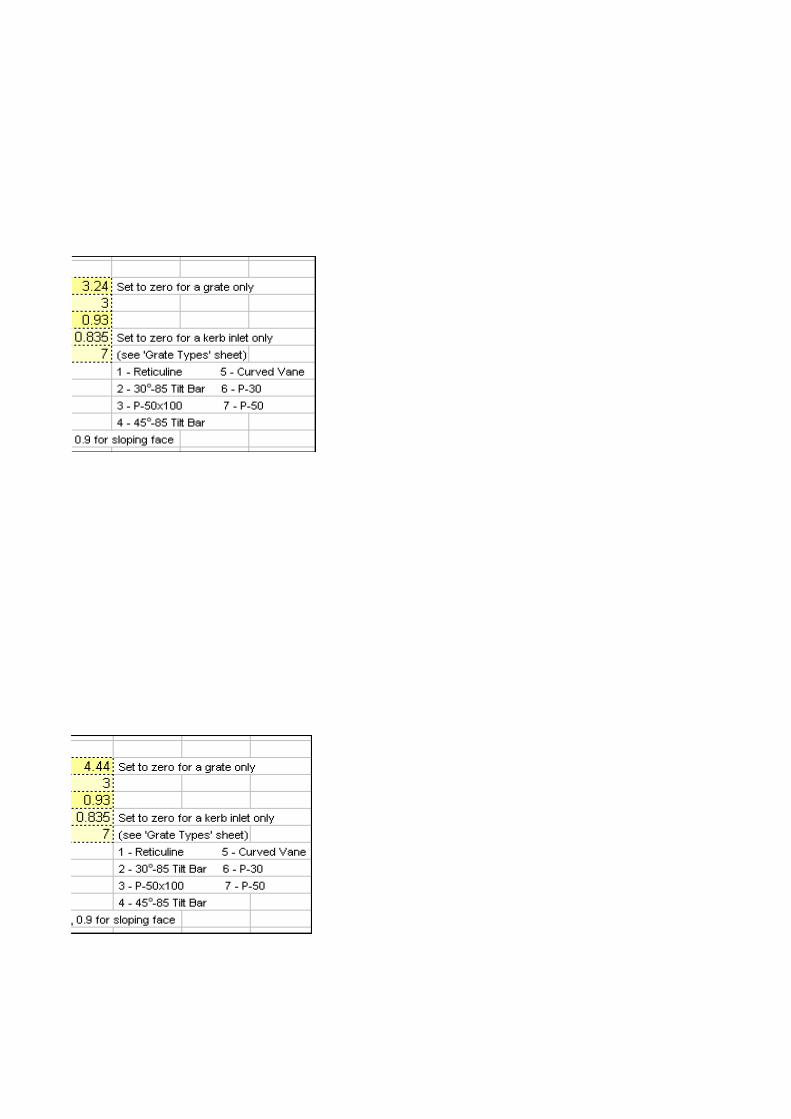
Queensland Department of Main Roads S Gully Pit

Queensland Department of Main Roads M Gully Pit
Queensland Department of Main Roads L Gully Pit

MaxQ Pits Drainway Plus Draincover Grate, Configuration 0TP/Z

The MaxQ inlets are unique in having been tested for a much greater range than any other sets oif pits,
Generally, HEC22 gives a fairly good fit to this kerb inlet.
MaxQ Pits Drainway Plus Maxflow Grate, Configuration 0TP/Z
Fits between relationships derived from measurements and from HEC22 are reasonable.
Sag Relationships for Drainway Plus Inlets with and without Grates
up to 2.5 m3/s approach flow.

ACT Inlet with Kerb KG (Kerb & Gutter), Single Type R Sump, 3% Crossfall

ACT Inlet with Kerb KG (Kerb & Gutter), Triple Type R Sump, 3% Crossfall
ACT Pit with MLBK Modified Layback Kerb, Type R Sump, 3% Crossfall

ACT Pit with Kerb MKG Mountable Kerb and Gutter, Type R Sump, 3% Crossfall
ACT Pits in Sags

South Australian Transport SA Single (900 mm long) Kerb Inlet
The HEC22 estimate underestimates both the recorded pit capacitywith deflectors (Def) and without these (NoDef).
The HEC22 procedure has no means of making allowance for deflectors.
Transport SA Double (1900 mm long) Kerb Inlet


This section provides checks and comparisons so that potential users can assess the suitability of this macro
Users are encouraged to carry out their own tests by varying the inputs into the various calculation procedures (on the yellow cells).
This section compares results from the examples in HEC22 with those calculated in the macros.
This is for an on-grade grate inlet on road section with gutter width = 0.6 m, longitudinal grade = 1%, crossfall = 2%, n = 0.016 and gutter depression = 50 mm
The differences appear to be due to roundoff errors in charts in the HEC22 calculations. Our computer-based results should be more accurate.
For the road cross-section in Example 4-2, with a total flow width of 3 m, road crossfall of 0.025, longitudinal slope of 0.04 and n = 0.016,
The equivalent flowrates from trial and error calculations in the 'On-Grade Inlets in Streets' worksheet are:
The capacities calculated here are slightly below those obtained in the HEC22 manual. This probably relatesto the way that cross-sectional flow capacities are calculated. These calculations are based on the procedures
This example considers a kerb inlet on a road with a 1% longitudinal grade, road and gutter crossfalls of 2% and a Manning's n of 0.016.
The gutter cross-slope is assumed to be 0.05/0.6 = 0.083333 or 8.333%. The flowrate corresponding to a spread of 2.5 m is estimated to be 0.058 m3/s.
The first part of the on-grade pit spreadsheet is used to find the flowrate corresponding at a spread of 2.5 m as 0.058 m3/s.
, so agreement is good.
For the road cross-section in Example 4-2, the capacity of a curved vane grate, 0.6 m x 0.6 m is to be found when approach flow is 0.06 m 3/s.
, frontal flow efficiency = 1.0, side flow efficiency = 0.11 and capacity = 0.044 m3/s.
/s, the 'On-Grade in Street' worksheet gives the following values that differ slightly from those in HEC22:
, side flow efficiency = 0.10 and capacity = 0.042 m3/s.
/s, and the inlet capacities of the following grates are estimated:

A combination inlet system is on a road with a 2% crossfall, a 6.2% gutter crossfall, a longitudinal slope of 1% and a roughness of 0.016.
The width of a grate in a sag is 0.6 m, and a 50% blocking factor is applied. The allowable depth at kerb is 0.15 m.
An undepressed kerb inlet in a sag with a length of 2.5 m and a slot height of 0.13 m is on a road with a 2% crossfall..
/s the inlet capacity of a 3 m long kerb inlet is found to be 0.031 m3/s.
For this same flowrate, the capacity of a 3 m kerb inlet with a depression 0.6 m wide and 0.025 m deep is found to be 0.044 m3/s.
For the depressed gutter at the inlet having a crossfall of 0.025/0.6 = 0.0417 or 4.167%, the estimated inlet capacity from the macro is 0.0415 m3/s.
For the same road system as in Example 4-7, the minimum length of kerb opening needed to capture 100% of a flow of 0.064 m 3/s
/s, based on an allowable width of 3 m.
/s at a gutter depth of 0.15 m for an unblocked pit with a perimeter of 2.31 m.
For a ponding area width of 2.5 m, corresponding to a depth of 0.05 m, the inlet capacity is calculated as 0.045 m3/s,
If the gutter is depressed by 0.025 m, and the gutter is 0.6 m wide, the inlet capacity will be 0.048 m3/s,

using Equation 4.30 only. It is difficult to determine the exact ranges over which Equation 4-28 works, and
A combination pit has a 0.6 m x 1.2 m P-50 grate and a kerb opening 1.2 m long with a slot 0.1 m high.
The calculation in HEC22 determines that for a perimeter of 2.4 m, the average depth of ponding will be 0.11 m,
A median ditch has a base width of 1.2 m and a Manning's roughness of 0.03. Sideslopes are 1:6 V:H and the longitudinal grade is 2%.
A median ditch has a base width of 0.6 m and a Manning's roughness of 0.03. Sideslopes are 1:6 V:H and the longitudinal grade is 3%.
This section compares relationships obtained from laboratory testing for commonly-used Australian pits with relationships obtained from the Visual Basic macros (coloured green). The numbers used in the macros are shown along with plots of relationships.
They show that the HEC22 procedures should be used with care, and with reference to any available information.However, it must be recognised that in many cases, in many cases the HEC22 procedures will be the only avaialable information source.
NSW RTA (DMR) SA1 1 m Long Inlets - Kerb Inlets and Combination (Kerb Inlet + Grate) Inlets
in the first situation, and the same value of 0.045 m3/s in the second,
flow so that the flow depth at the kerb is limited to 0.09 m.
0.138 m3/s when the depth of ponding is 0.09 m.
If the grate is completely blocked, all flow will be through the kerb inlet and the depth at the kerb will be 0.24 m.
/s. This should be more accurate than the answer in HEC22.If the grate is clogged, and is assumed to have zero dimensions, the depth corresponding to the required inflow is 0.228 m.
nominally 0.10 m3/s (actually 0.092 m3/s) will be intercepted
, which should be more accurate than the HEC22 result.
0.16 m3/s will be intercepted and 0.12 m3/s will bypass the pit.

Fits for both the herb inlet alone and the combination ofkerb inlet and grate (modelled as a grate alone by HEC22)are good in this low range.
A good fit to the combination grate and a poor one to the kerb inlet alone.

A good fit to the combination grate and an underestimate for the kerb inlet alone.
Agreement is good.HEC22 shows variations between 6 and 12% grades,rather than a single relationship.

Since the manual's relationships apply for all grades, they are compared with HEC22 results at 1% and 2%.
Above this flow, the HEC22 procedures give higher inflows than thevalues from the manual.
The effect of longitudinal grade is relatively small.
The capacities from the VicRoads manual are higher than from the HEC22 procedure. The latter allows for a 33%gutter slope at the inlet.
There is no obvious explanation for this difference.These Victorian relationships are the "odd men out" among the relationships,having a poor agreement with the HEC22 relationships, while other pitshad relatively good fits.
There is good agreement for approach flows below 0.15 m3/s.
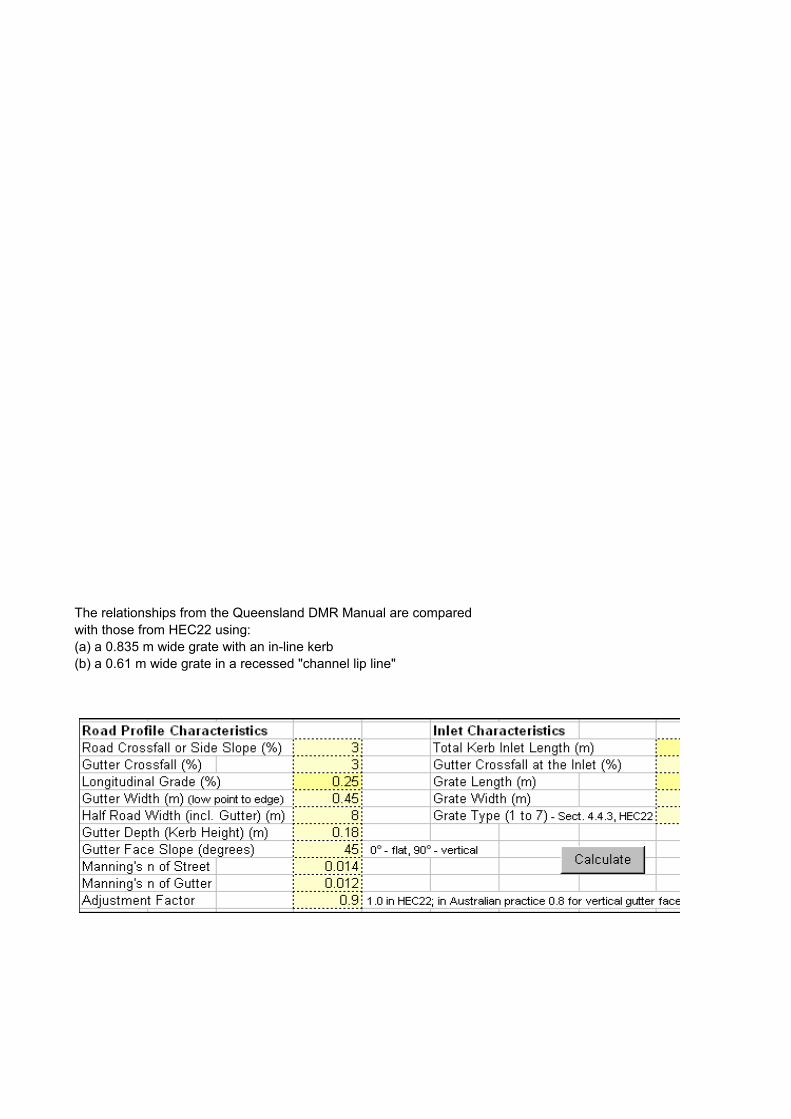
The relationships from the Queensland DMR Manual are comparedwith those from HEC22 using:(a) a 0.835 m wide grate with an in-line kerb(b) a 0.61 m wide grate in a recessed "channel lip line"


The HEC22 calculations underestimate the inflows from the manualat low depths It is not possible to make comparisons at high ponding depths.
Generally, HEC22 relationships underestimate measured inflows, a point noted by Pezzaniti, D.,
Civil Engineering Transactions, Vol. CE42, p. 42-47Johnston, L. and Argue, J. (2000) Road Surface Drainage - cost and liability issues, IEAust

The MaxQ inlets are unique in having been tested for a much greater range than any other sets oif pits,
These show the HEC22 relationships overestimating the relationships from the Max Q brochure.

This is unusual because in other cases (ACT, Queensland DMR) the HEC22 reationships provide underestimates.
These pits exhibit the same pattern as for the Drainway Plus Pits, but not so severely.


Agreement is rather poor. HEC22 procedures underestimate modelled capacities up to about 0.2 m depth.They will probably be more accurate at higher depths.

The HEC22 estimate underestimates both the recorded pit capacitywith deflectors (Def) and without these (NoDef).
The HEC22 procedure has no means of making allowance for deflectors.
Generally the HEC22 results underestimate the measured capacity and have a much greater spread.


This is unusual because in other cases (ACT, Queensland DMR) the HEC22 reationships provide underestimates.