Embed Size (px)
Citation preview
NEA NUCLEAR SCIENCE COMMITTEE
CALCULATIONS OF DIFFERENT
TRANSMUTATION CONCEPTS
An International Benchmark Exercise
February 2000
NUCLEAR ENERGY AGENCYORGANISATION FOR ECONOMIC AND CO-OPERATION DEVELOPMENT
ORGANISATION FOR ECONOMIC CO-OPERATION AND DEVELOPMENT
Pursuant to Article 1 of the Convention signed in Paris on 14th December 1960, and which came into forceon 30th September 1961, the Organisation for Economic Co-operation and Development (OECD) shall promotepolicies designed:
− to achieve the highest sustainable economic growth and employment and a rising standard of living inMember countries, while maintaining financial stability, and thus to contribute to the development ofthe world economy;
− to contribute to sound economic expansion in Member as well as non-member countries in the processof economic development; and
− to contribute to the expansion of world trade on a multilateral, non-discriminatory basis in accordancewith international obligations.
The original Member countries of the OECD are Austria, Belgium, Canada, Denmark, France, Germany,Greece, Iceland, Ireland, Italy, Luxembourg, the Netherlands, Norway, Portugal, Spain, Sweden, Switzerland, Turkey,the United Kingdom and the United States. The following countries became Members subsequently through accessionat the dates indicated hereafter: Japan (28th April 1964), Finland (28th January 1969), Australia (7th June 1971), NewZealand (29th May 1973), Mexico (18th May 1994), the Czech Republic (21st December 1995), Hungary (7th May1996), Poland (22nd November 1996) and the Republic of Korea (12th December 1996). The Commission of theEuropean Communities takes part in the work of the OECD (Article 13 of the OECD Convention).
NUCLEAR ENERGY AGENCY
The OECD Nuclear Energy Agency (NEA) was established on 1st February 1958 under the name of theOEEC European Nuclear Energy Agency. It received its present designation on 20th April 1972, when Japan became itsfirst non-European full Member. NEA membership today consists of 27 OECD Member countries: Australia, Austria,Belgium, Canada, Czech Republic, Denmark, Finland, France, Germany, Greece, Hungary, Iceland, Ireland, Italy,Japan, Luxembourg, Mexico, the Netherlands, Norway, Portugal, Republic of Korea, Spain, Sweden, Switzerland,Turkey, the United Kingdom and the United States. The Commission of the European Communities also takes part inthe work of the Agency.
The mission of the NEA is:
− to assist its Member countries in maintaining and further developing, through international co-operation, the scientific, technological and legal bases required for a safe, environmentally friendly andeconomical use of nuclear energy for peaceful purposes, as well as
− to provide authoritative assessments and to forge common understandings on key issues, as input togovernment decisions on nuclear energy policy and to broader OECD policy analyses in areas such asenergy and sustainable development.
Specific areas of competence of the NEA include safety and regulation of nuclear activities, radioactivewaste management, radiological protection, nuclear science, economic and technical analyses of the nuclear fuel cycle,nuclear law and liability, and public information. The NEA Data Bank provides nuclear data and computer programservices for participating countries.
In these and related tasks, the NEA works in close collaboration with the International Atomic EnergyAgency in Vienna, with which it has a Co-operation Agreement, as well as with other international organisations in thenuclear field.
© OECD 2000Permission to reproduce a portion of this work for non-commercial purposes or classroom use should be obtained through the Centrefrançais d’exploitation du droit de copie (CCF), 20, rue des Grands-Augustins, 75006 Paris, France, Tel. (33-1) 44 07 47 70,Fax (33-1) 46 34 67 19, for every country except the United States. In the United States permission should be obtained through theCopyright Clearance Center, Customer Service, (508)750-8400, 222 Rosewood Drive, Danvers, MA 01923, USA, or CCC Online:http://www.copyright.com/. All other applications for permission to reproduce or translate all or part of this book should be made toOECD Publications, 2, rue André-Pascal, 75775 Paris Cedex 16, France.
3
FOREWORD
In April 1996, the NEA Nuclear Science Committee (NSC) Expert Group on Physics Aspects ofDifferent Transmutation Concepts launched a benchmark exercise to compare different transmutationconcepts based on pressurised water reactors (PWRs), fast reactors, and an accelerator-driven system(ADS). The aim was to investigate the physics of complex fuel cycles involving reprocessing of spentPWR reactor fuel and its subsequent reuse in different reactor types. The objective was also tocompare the calculated activities for individual isotopes as a function of time for different plutoniumand minor actinide (MA) transmutation scenarios in different reactor systems.
This report gives the analysis of results of the 15 solutions provided by the participants: six forthe PWRs, six for the fast reactor and three for the accelerator case. Various computer codes andnuclear data libraries were applied.
For the PWR benchmark, the results show consistency well within the limits on multipleplutonium recycling established by the NEA Working Party on Plutonium Fuels and Innovative FuelCycles (WPPR). For the fast reactor benchmark, the computer code systems used by the participantsshow a good general agreement in the prediction of the nuclear characteristics of the minor actinideloaded fast reactor core. For the ADS benchmark, large discrepancies are observed in main neutroniccharacteristics such as initial keff and burn-up behaviour.
The analysis of the current ADS benchmark results indicates a need for refining the benchmarkspecification and continuing the exercise with a wider participation to resolve the discrepanciesobserved before proceeding to more complex problems.
Acknowledgements
The Secretariat wishes to express its special thanks to all participants who devoted their time andeffort to this endeavour.

5
TABLE OF CONTENTS
Executive Summary ......................................................................................................................... 11
Chapter 1. INTRODUCTION........................................................................................................ 13
Chapter 2. SUMMARY OF THE PRESSURISED WATER REACTORBENCHMARK............................................................................................................. 15
2.1 Problem specification............................................................................................. 15
2.2 Requested results.................................................................................................... 15
2.3 Participants............................................................................................................. 16
2.4 Results and discussions .......................................................................................... 16
2.5 Conclusions ............................................................................................................ 17
Chapter 3. SUMMARY OF THE FAST REACTOR BENCHMARK ...................................... 19
3.1 Problem specification............................................................................................. 19
3.2 Requested results.................................................................................................... 19
3.3 Participants............................................................................................................. 19
3.4 Results and discussions .......................................................................................... 19
3.5 Conclusions ............................................................................................................ 21
Chapter 4. SUMMARY OF THE ACCELERATOR-DRIVEN SYSTEMBENCHMARK............................................................................................................. 23
4.1 Problem specification............................................................................................. 23
4.2 Required cross-section library and code description.............................................. 23
4.3 Spallation neutron source spectrum ....................................................................... 24
4.4 Requested results.................................................................................................... 24
4.5 Participants............................................................................................................. 25
4.6 Results and discussions .......................................................................................... 25
4.7 Conclusions ............................................................................................................ 26
6
Chapter 5. CONCLUSIONS AND RECOMMENDATIONS ..................................................... 29
REFERENCES ................................................................................................................................. 31
TABLES ............................................................................................................................................ 33
FIGURES .......................................................................................................................................... 61
Appendix A. BENCHMARK SPECIFICATIONS ....................................................................... 83
A.1 NEA/NSC benchmark on physics aspects of different transmutationconcepts – specifications for PWRs .................................................................... 85
A.2 Proposal for a benchmark calculation of MA transmutationin fast reactors (1 000 MWe)............................................................................... 99
A.3 JAERI proposal of benchmark problem on method and data to calculatethe nuclear characteristics in accelerator-based transmutation systemwith fast neutron flux........................................................................................... 111
Appendix B. CALCULATION DETAILS SUPPLIED BY PARTICIPANTS .......................... 119
B.1 Pressurised water reactor benchmark .................................................................. 121
B.2 Fast reactor benchmark........................................................................................ 135
B.3 Accelerator-driven system benchmark ................................................................ 151
LIST OF CONTRIBUTORS ........................................................................................................... 157
7
List of tables
Table 2.1. Benchmark cell specifications for PWR .................................................................. 35
Table 2.2. Number densities of PWR UO2 cell at BOL ............................................................ 35
Table 2.3. Actinide atom per cent fraction ................................................................................ 36
Table 2.4. Number densities of the normal PWR lattice ........................................................... 36
Table 2.5. Number densities of the wider PWR lattice ............................................................. 37
Table 2.6. Proposed macro steps for depletion calculations...................................................... 37
Table 2.7. Fission products weight (kg) of 99Tc, 129I and 135Cs generated at the burn-up33 GWd/tHM and normalised to 1 t fuel.................................................................. 38
Table 2.8. Index of MA transmutation which means negative or positive signcorresponding to decrease or increase from initial loading MA .............................. 38
Table 2.9. Comparison of Doppler and void reactivities, Part I – MOX12............................... 39
Comparison of Doppler and void reactivities, Part II – MOX22 ............................. 41
Comparison of Doppler and void reactivities, Part III – MOX22 (wide)................. 43
Table 3.1. Plutonium isotopic composition (PWR UO2 fuel 50 GWd/tHM,seven years cooling) ................................................................................................. 44
Table 3.2. Homogenised atomic density ................................................................................... 45
Table 3.3.1. keff at 0, 365, 1 460, 1 825 EFPD (reference core) ................................................... 46
Table 3.3.2. keff at 0, 365, 1 460, 1 825 EFPD (2.5% MA core) .................................................. 46
Table 3.3.3. keff at 0, 365, 1 460, 1 825 EFPD (5% MA core) ..................................................... 46
Table 3.4.1. Spectral indices at 0 EFPD (reference core)............................................................. 46
Table 3.4.2. Spectral indices at 0 EFPD (2.5% MA core)............................................................ 46
Table 3.4.3. Spectral indices at 0 EFPD (5% MA core)............................................................... 47
Table 3.5.1. Reactivity losses over five cycles (reference core) .................................................. 47
Table 3.5.2. Reactivity losses over five cycles (2.5% MA core) ................................................. 47
Table 3.5.3. Reactivity losses over five cycles (5% MA core) .................................................... 47
Table 3.6.1. Isotopic composition variation (EOC-BOC) (reference core, inner core)................ 48
Table 3.6.2. Isotopic composition variation (EOC-BOC) (2.5% MA core, inner core)............... 48
Table 3.6.3. Isotopic composition variation (EOC-BOC) (5% MA core, inner core).................. 49
Table 3.7.1. Sodium reactivity worth at the beginning of the fourth cycle (BOC)(reference core, sodium void whole core) ................................................................ 49
Table 3.7.2. Sodium reactivity worth at the beginning of the fourth cycle (BOC)(2.5% MA core, sodium void whole core) ............................................................... 49
Table 3.7.3. Sodium reactivity worth at the beginning of the fourth cycle (BOC)(5% MA core, sodium void whole core) .................................................................. 50
Table 3.8.1. Doppler reactivity worth at the fourth cycle (reference core) .................................. 50
8
Table 3.8.2. Doppler reactivity worth at the fourth cycle (2.5% MA core) ................................. 50
Table 3.8.3. Doppler reactivity worth at the fourth cycle (5% MA core) .................................... 50
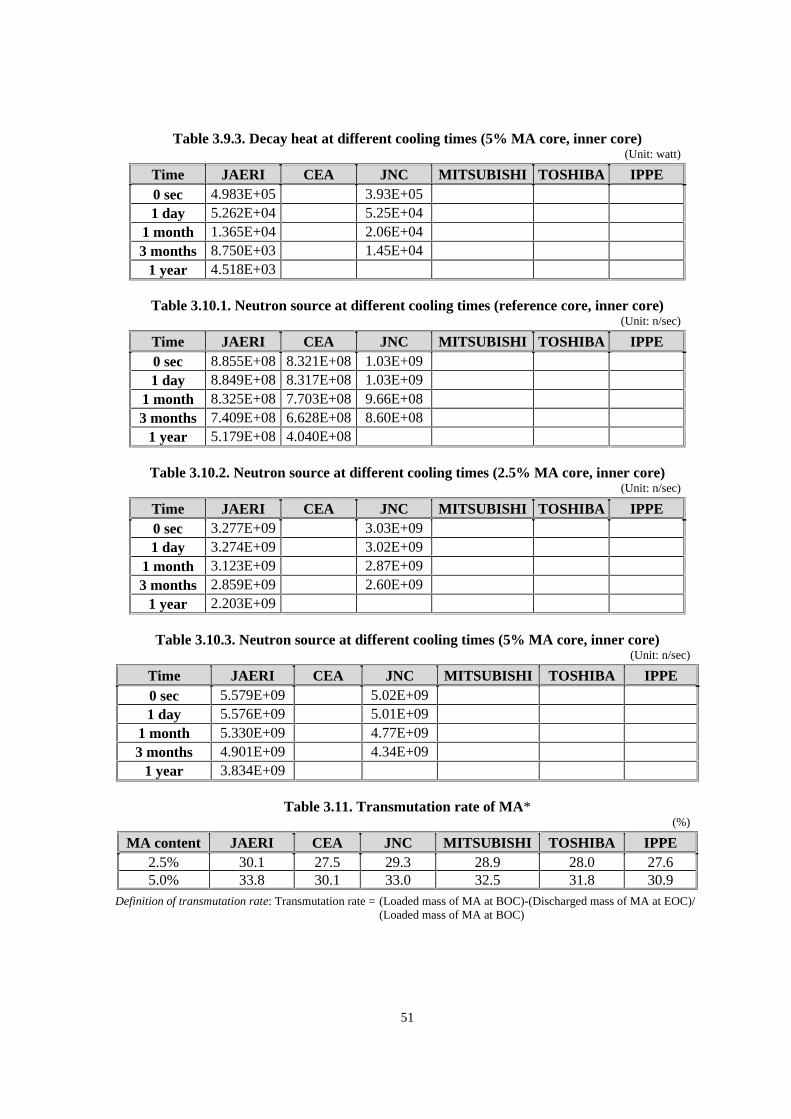
Table 3.9.1. Decay heat at different cooling times (reference core, inner core) .......................... 50
Table 3.9.2. Decay heat at different cooling times (2.5% MA core, inner core).......................... 50
Table 3.9.3. Decay heat at different cooling times (5% MA core, inner core)............................. 51
Table 3.10.1. Neutron source at different cooling times (reference core, inner core).................... 51
Table 3.10.2. Neutron source at different cooling times (2.5% MA core, inner core)................... 51
Table 3.10.3. Neutron source at different cooling times (5% MA core, inner core)...................... 51
Table 3.11. Transmutation rate of MA........................................................................................ 51
Table 4.1. Specification of target/core transmutation system ................................................... 52
Table 4.2. Actinide atom per cent fraction ................................................................................ 52
Table 4.3. Homogenised atomic number densities (× 1024/cm3) ............................................... 53
Table 4.4. Normalised spallation neutron spectrum from the target ......................................... 54
Table 4.5. Number of spallation neutrons per incident proton (n/p) ......................................... 54
Table 4.6. Maximum and average heat power densities in target region .................................. 54
Table 4.7. Nuclear characteristics results .................................................................................. 55
Table 4.8. Fission and capture rate (initial core) ....................................................................... 55
Table 4.9. Fission and capture rate (200 GWd/tHM burn-up) .................................................. 56
Table 4.10. PSI results (MOX11)................................................................................................ 56
Table 4.11. PSI results (MOX12)................................................................................................ 57
Table 4.12. JAERI results (MOX11)........................................................................................... 58
Table 4.13. JAERI results (MOX12)........................................................................................... 59
Table 4.14. IPPE results (MOX11) ............................................................................................. 60
Table 4.15. IPPE results (MOX12) ............................................................................................. 60
List of figures
Figure 1.1. Schematic fuel cycle scenario for the benchmark proposal ........................................... 63
Figure 2.1. Benchmark cell geometry .............................................................................................. 64
Figure 2.2. k∞ as a function of burn-up for MOX12 (33 GWd/tHM) and MA 0.0%....................... 64
Figure 2.3. k∞ as a function of burn-up for MOX12 (33 GWd/tHM) and MA 1.0%....................... 65
Figure 2.4. k∞ as a function of burn-up for MOX12 (33 GWd/tHM) and MA 2.5%....................... 65
Figure 2.5. k∞ as a function of burn-up for MOX22 (50 GWd/tHM) and MA 0.0%....................... 66
Figure 2.6. k∞ as a function of burn-up for MOX22 (50 GWd/tHM) and MA 1.0%....................... 66
Figure 2.7. k∞ as a function of burn-up for MOX22 (50 GWd/tHM) and MA 2.5%....................... 67
9
Figure 2.8. k∞ as a function of burn-up for MOX22 (50 GWd/tHM) wide latticeand MA 0.0%................................................................................................................. 67
Figure 2.9. k∞ as a function of burn-up for MOX22 (50 GWd/tHM) wide latticeand MA 1.0%................................................................................................................. 68
Figure 2.10. k∞ as a function of burn-up for MOX22 (50 GWd/tHM) wide latticeand MA 2.5%................................................................................................................. 68
Figure 2.11. Atomic number density of 237Np as a function of burn-up for MOX22(50 GWd/tHM) and MA 2.5%....................................................................................... 69
Figure 2.12. Atomic number density of 241Pu as a function of burn-up for MOX22(50 GWd/tHM) and MA 2.5%....................................................................................... 69
Figure 2.13. Atomic number density of 242Pu as a function of burn-up for MOX22(50 GWd/tHM) and MA 2.5%....................................................................................... 70
Figure 2.14. Atomic number density of 242mAm as a function of burn-up for MOX22(50 GWd/tHM) and MA 2.5%....................................................................................... 70
Figure 2.15. Radioactivity of 239Pu (Bq) as a function of decay time (years) for MOX22(50 GWd/tHM) and MA 2.5%....................................................................................... 71
Figure 2.16. Radioactivity of 241Pu (Bq) as a function of decay time (years) for MOX22(50 GWd/tHM) and MA 2.5%....................................................................................... 71
Figure 2.17. Radioactivity of 242mAm (Bq) as a function of decay time (years) for MOX22(50 GWd/tHM) and MA 2.5%....................................................................................... 72
Figure 2.18. Radioactivity of 243Cm (Bq) as a function of decay time (years) for MOX22(50 GWd/tHM) and MA 2.5%....................................................................................... 72
Figure 3.1. Reference core (1 000 MWe class FBR) ....................................................................... 73
Figure 3.2. Dependence of keff on burn-up (reference core)............................................................. 74
Figure 3.3. Dependence of keff on burn-up (2.5% MA core)............................................................ 74
Figure 3.4. Dependence of keff on burn-up (5% MA core)............................................................... 75
Figure 3.5. Number density of 237Np at various cooling times (2.5% MA core) ............................. 75
Figure 4.1. Calculational model ....................................................................................................... 76
Figure 4.2. Target and fuel configurations ....................................................................................... 77
Figure 4.3. Axial distribution of neutrons (> 15 MeV) leaking from target at r = 150 mm .................. 78
Figure 4.4. Average neutron spectrum in-core (MOX11)................................................................ 78
Figure 4.5. Time evolution of keff (MOX11).................................................................................... 79
Figure 4.6. Time evolution of keff (MOX12).................................................................................... 79
Figure 4.7. Time evolution of 237Np number density (MOX11) ...................................................... 80
Figure 4.8. Time evolution of 237Np number density (MOX12) ...................................................... 80
Figure 4.9. Time evolution of 241Am number density (MOX11) ..................................................... 81
Figure 4.10. Time evolution of 241Am number density (MOX12) ..................................................... 81

11
EXECUTIVE SUMMARY
During the past decade, the transmutation of plutonium and minor actinides (MAs) in existingreactors and/or innovative systems has gained interest and become one of the attractive options toreduce the inventories of actinides and long-lived fission products in nuclear waste.
However, the state of the art in minor actinide transmutation calculations is not as well establishedas that of the conventional uranium and plutonium fuelled reactor systems, because nuclear data forminor actinides are less accurate and burn-up decay chains are not completely modelled in currentcomputations.
In this context, a benchmark has been launched in order to evaluate the actual status of MAtransmutation calculations for different reactor systems. The focus of the benchmark is on the physicsof minor actinide transmutation in MOX fuel in pressurised water reactors (PWR), fast reactors (FR),and fast flux accelerator-driven systems (ADS). The emphasis is on long-term activities of the finalwastes and to optimise the transmutation scheme involving complex but realistic fuel cycle scenarios.
Concerning the PWR benchmark geometry, a standard PWR cell (volume ratio of moderator tofuel Vm/Vf = 1.929) and a wide lattice cell (Vm/Vf = 3.0) for the highly moderated PWR were consideredand two target burn-ups, 33 GWd/tHM and 50 GWd/tHM, were investigated. Six institutions havecontributed results: FZK (Germany), IKE (Germany), JAERI (Japan), Tohoku University (Japan)ITEP (Russian Federation) and IPPE (Russian Federation). Overall, the results submitted showconsistency, and are well within the limits on multiple plutonium recycling established by the NEAWorking Party on Plutonium Fuels and Innovative Fuel Cycles (WPPR).
The fast reactor (FR) benchmark was for a 1 000 MWe fast breeder reactor with a breeding rationear 1.25. The core consists of two fuel zones with different enrichments. The fuel comprises mixedoxide pins of depleted uranium and once-through PWR plutonium. Three kinds of fuels, containingdifferent quantities of minor actinides (0%, 2.5% and 5%), were selected. Contributions have beenprovided by JAERI (Japan), CEA (France), JNC (Japan), Mitsubishi (Japan), Toshiba (Japan) andIPPE (Russian Federation). Excellent agreement is observed with regard to the main neutroniccharacteristics, but discrepancies in burn-up composition variations for some isotopes are relativelylarge. In general, it is found that the calculation code systems used have a very good generalagreement in the predictions of the nuclear characteristics of the minor actinide loaded FR core.
For the accelerator-driven system (ADS) benchmark, a sodium cooled sub-critical system(keff = 0.9) driven by a proton beam of 1 GeV and 10 mA was considered. The sub-critical systemconsists of a beam duct with void, a two-region tungsten target, a minor actinide dominant nitridefuelled core and a surrounding reflector region. This system was analysed by the following threecontributors: JAERI (Japan), PSI (Switzerland) and IPPE (Russian Federation). Satisfactoryagreements are observed in the number of spallation neutrons per incident proton and the axialdistribution of leakage neutrons from the spallation target (> 15 MeV), but large discrepancies arefound in the maximum and average heat power densities in the target. Significant discrepancies arealso found in the keff and burn-up characteristics. This is probably due to differences in capture and

12
fission cross-sections used for minor actinides in different nuclear data libraries and also due todifferent treatment of fission products in burn-up calculations. These results require a thoroughinvestigation into differences in nuclear data libraries and into different calculation procedures andapproximations. A wider participation is needed in order to draw further conclusions from theseADS results.
13
Chapter 1
INTRODUCTION
Various systems for plutonium and minor actinide (MA) transmutation have been considered tooptimise the transmutation scheme. The state-of-the-art MA transmutation calculations are not as wellestablished as those of the conventional uranium and plutonium burn-up reactor systems, becausenuclear data for MAs are less reliable and the burn-up chains for decay and generation are notcompletely modelled in the computation.
A benchmark of the OECD/NEA Task Force on Physics Aspects of Different TransmutationConcepts was launched in April 1996 [1]. It was done so in order to investigate the physics of complexfuel cycles involving reprocessing of spent PWR reactor fuel and its subsequent reuse in differentreactor types, and to compare the calculated activities for individual isotopes as a function of time fordifferent stages of plutonium and MA transmutation scenarios in different reactor systems.
The focus of the benchmark is on the physics of recovered MA transmutations in MOX fuel inpressurised water reactors (PWR), fast reactors (FR), and fast flux accelerator-driven systems (ADS)with emphasis on the long-term activities of the final wastes.
The benchmark consists of three stages (Figure 1.1). The first stage – the input stage – considersthe UO2 fuelled PWR reactor. A representative pin cell is used to perform the burn-up calculations to atarget burn-up of 50 GWd/tHM. The PWR benchmark also considers the 33 GWd/tHM burn-up toprovide insight into the effects of burn-up extension on the long-term radiological characteristicsof PWR wastes. The spent PWR fuel is then reprocessed after seven years of cooling, and the plutoniumand MAs are recovered. Plutonium and MAs are then used to specify the MOX fuel composition forthe second stage of the benchmark – the recycling stage. A three-year MOX fuel fabrication time isassumed, allowing for build-up of 241Am in the MOX fuel.
In the recycling stage, two different possibilities are considered: the MOX fuel defined in theinput stage is fed either into a PWR pin cell or into a full core model of a FR. Burn-up calculations arethen performed to obtain exit fuel compositions of MOX fuel from a PWR and a FR. The spent MOXfuel from the second stage of the benchmark is subject to reprocessing and then used for defining fuelcompositions for the third stage of the benchmark – the partitioning and transmutation stage.
In the third stage of the benchmark, three possibilities are considered: another MOX fuelledPWR, another FR and an ADS. At this stage the MAs from the first input stage are admixed to thesecond recycling stage reprocessed fuel or several admix combinations of the MAs from stages oneand two are considered.
The fuel specifications of the four accelerator cases considered are based on the MA andplutonium vectors following from the PWR benchmark but are MA dominated (unlike the PWR andFR benchmarks). This reflects the design constraints of JAERI’s accelerator-driven system, which is
14
dedicated to MA transmutation and is not intended to generate electricity. Its core remains sub-criticalwhen using MA dominated fuel and becomes super-critical for low MA content fuel typical of PWRsand FRs.
At the end of the benchmark, a total of 15 solutions (six for the PWR, six for the FR and three forthe accelerator case) was received. The summary of the benchmark was presented at the Long Islandconference in the late summer of 1998 [2]. For the PWR benchmark, the results show consistency withlimits of multiple plutonium recycling established by the NEA Working Party on Plutonium Fuels andInnovative Fuel Cycles. For the FR benchmark, calculational code systems of participants have a goodgeneral agreement in the predictions of the nuclear characteristics of the MA loaded FR core. For theADS benchmark, very good agreements are observed for spallation neutron number/proton, axialneutron distribution from the target and so on. Large discrepancies are, however, observed in keff andburn-up characteristics.
15
Chapter 2
SUMMARY OF THE PRESSURISED WATER REACTOR BENCHMARK
2.1 Problem specification
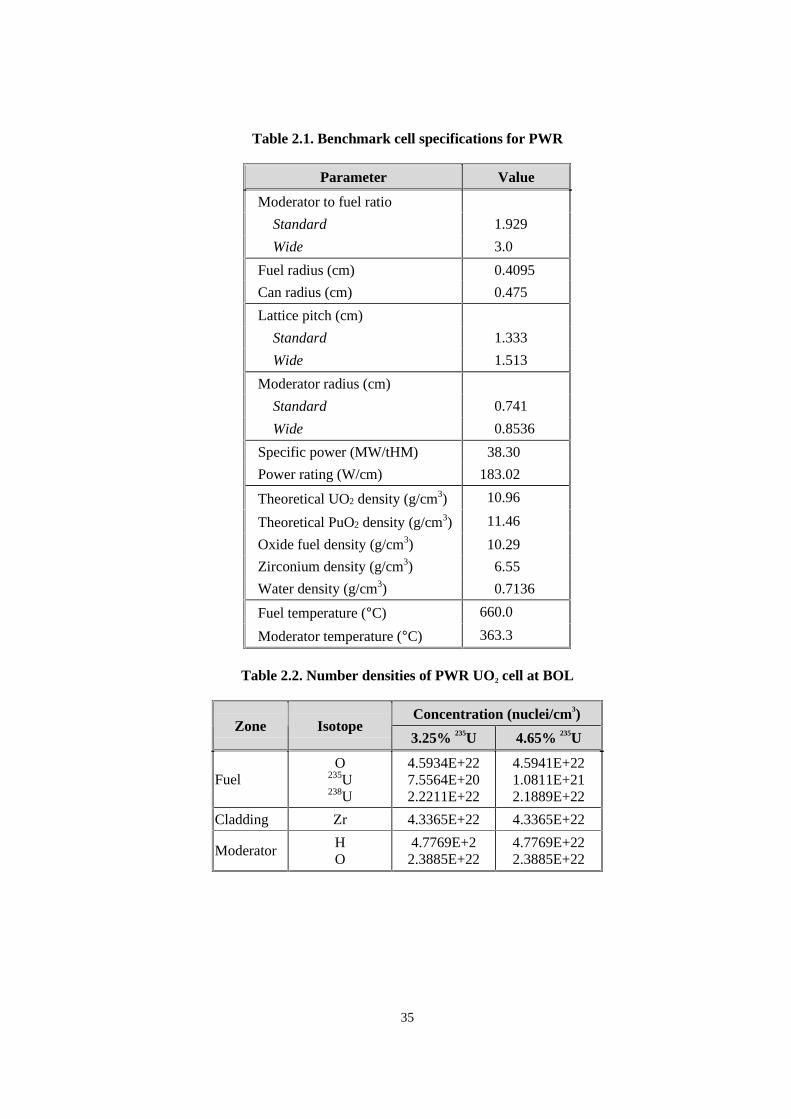
The full benchmark specification for PWRs can be found in Appendix A.1. The benchmark cellspecifications for PWR are summarised in Tables 2.1 and 2.2. The geometry of the benchmark cell isspecified in Figure 2.1. The pitch and the equivalent outer cell radius are given for two cells: the smallerone (normal lattice) for the standard PWR and the larger one (wide lattice) for the highly moderatedPWR. The volume ratios of moderator relative to fuel, Vm/Vf, are 1.929 and 3.0 for the normal andwide lattices, respectively. For the sake of simplicity, the influences of water boration and of the fuelassembly structures are neglected in this benchmark.
The very comprehensive PWR proposal covers many possibilities for plutonium utilisation in thePWRs. Two target burn-ups are considered: 33 GWd/tHM and 50 GWd/tHM for both the initial UO2
and MOX fuels. As the input specifications to PWR or accelerator benchmark calculations, fourdesirable plutonium and MA compositions were originally considered. These are denoted as MOX11,MOX21, MOX12 and MOX22 as shown in Table 2.3.
• MOX11 refers to plutonium and MA compositions resulting from reprocessing of 3.25% UO2
fuel from PWR burned to 33 GWd/tHM.
• MOX21 is plutonium and MA compositions from 50 GWd/tHM burned results of 4.65% UO2
fuel PWR.
• MOX12 is the compositions from 33 GWd/tHM burn-up using the MOX11 compositions.
• MOX22 is the compositions obtained from 50 GWd/tHM burn-up for MOX21.
In all cases, seven years cooling time before reprocessing plus three years of MOX manufacturingtime is considered. In addition, the total MA contents specified are 0.0, 1.0 and 2.5 wt.%, respectively.
Finally, in the present benchmark calculations, the MOX12 and MOX22 cases were selected for thestandard PWR lattice. For the highly moderated PWR lattices, only the MOX22 case was adopted.The actinide atom per cent fraction and atomic number densities are shown in Tables 2.4 and 2.5.
2.2 Requested results
The edited data to be required for the burn-up calculation are as follows:
• k∞ as a function of burn-up.
16
• Atomic number densities (atom/cm3) and weight (kg) normalised to one tonne of initial heavymetal at each burn-up step in Table 2.6 for the following isotopes: 234U, 235U, 236U, 238U, 237Np,239Np, 238Pu, 239Pu, 240Pu, 241Pu, 242Pu, 241Am, 242Am, 242mAm, 243Am, 242Cm, 243Cm, 244Cm and245Cm, and the long-lived fission products (LLFPs) Tc99, 129I and 135Cs.
• Radioactivities at reactor shutdown time and cooling times of 7, 10, 20, 50, 100, 200, 500,1 000, 2 000, 5 000, 10 000, 20 000, 50 000 and 100 000 years.
• Void reactivities for the void fractions of 40, 70 and 95%.
• Doppler reactivity for temperature change from 660 to 960°C.
2.3 Participants
There were six participants for the PWR benchmark. The list of participants, their basic data andcodes used are given in the following table.
Institution (country) Participants Basic data Codes
FZK (Germany) C. Broeders KEDAK4ENDF/B-5 and 6
JEF-2.2
KAPROS/KARBUS
IKE (Germany) D. Lutz JEF-2.2 RESMOD/RSYST
JAERI (Japan) H. TakanoH. AkieK. Kaneko
JENDL-3.2 SRAC95
Tohoku University (Japan) T. IwasakiD. Fujiwara
JENDL-3.2 SWAT
ITEP (Russian Federation) B. KochurovA. KwaratzheliN. Selivanova
BNAB-26 TRIFON
IPPE (Russian Federation) A. Tsiboulia FOND-2 WIMS
2.4 Results and discussions
The six participants reported a remarkably large number of results. The results obtained aresummarised as follows.
The variations of k∞ as a function of burn-up are shown in Figures 2.2-2.4 for the MOX12(33 GWd/tHM), Figures 2.5-2.7 for the MOX22 (50 GWd/tHM) with the normal lattice, andFigures 2.8-2.10 for the MOX22 (50 GWd/tHM) with the wide lattice.
17
The discrepancies in k∞ values are about 3% between the ITEP and IPPE results and about 2%between ITEP and Tohoku for MOX22 (wide), though a good agreement can be observed between theJapanese and German results, including MA contents of 1.0 and 2.5%. Burn-up reactivity swing ismoderated by increasing the MA contents. This tendency is more strongly observed in the case ofMOX12 than in that of MOX22, due to 237Np in MA compositions. Furthermore, this is observed inthe MOX22 (standard) case rather than the MOX22 (wide) case.
In the comparison of the atomic number densities, a good agreement is seen among the six resultsas a function of burn-up with the exception of a few cases: 237Np of FZK becomes much larger thanthe other results with increasing burn-up (Figure 2.11). Atomic number densities of 241Pu, 242Pu and242mAm become more discrepant with burn-up among all participants (Figures 2.12-2.14). There areseven zero values for 239Np and 242Cm of JAERI, 242Am of IKE, 243Cm and 245Cm of FZK, and FPs ofIPPE, because these results were not reported.
The fission products 99Tc, 129I and 135Cs are in good agreement with each other, with theexception of 129I of FZK. Table 2.7 shows the FP production (kg) at the 33 GWd/tHM burn-up in thecases of MOX12, MOX22 (standard) and MOX22 (wide). The production of 99Tc and 129I do notchange in all cases and with different MA contents. However, 135Cs depends considerably on the MAcontent for all types of fuels, i.e. MOX12 and MOX22. This is probably due to the differences inneutron spectra between UO2 and MOX fuels, standard and wide lattice cell, and MA contents. That is,135Xe are transmuted to 136Xe before decay to 135Cs.
Table 2.8 shows an index for MA transmutation of 237Np, 241Am, 243Am and 244Cm by PWR.Though 237Np and 241Am are transmuted and initial loading quantities are reduced, 243Am and 244Cmincrease by larger generation than transmutation rates, except for the Japanese results in theMOX22 (wide) case with 2.5% MA.
The activities are calculated by four participants for the 0.0% MA and six participants for the1.0% and 2.5% MA. For uranium and plutonium isotopes, they are in good agreement with each other(Figure 2.15 for 239Pu). 241Pu of JAERI stops at 500 years (Figure 2.16 for 241Pu), as they did notconsider the decay chain of 245Cm. In several isotopes of americium and curium, significantdiscrepancies are observed (242mAm, Figure 2.17). Particularly, 243Cm and 245Cm of FZK showdifferent variations from the others (243Cm, Figure 2.18).
Void and Doppler reactivities are compared in Table 2.9. The Doppler reactivities are in a goodagreement with each other, with the exception of the results for wider lattice by ITEP. In the voidreactivities, the discrepancies among the calculated results expand as the void fraction increases. Thisbecomes particularly remarkable for a void fraction of 95%. The void reactivity becomes positive asthe MA content increases. In the MOX 12 and MOX 22 standard lattice, the reactivities becomepositive at the 70% void fraction when MA content is 2.5%. In the wider lattice, the reactivities areexpressed with more negative values than for the results of standard lattice. The JAERI values aremore positive than those of the others.
2.5 Conclusions
In general, good agreement was observed among results submitted. Overall, the results showconsistency with limits of multiple plutonium recycling established by the NEA Working Party onPlutonium Fuels and Innovative Fuel Cycles.

19
Chapter 3
SUMMARY OF THE FAST REACTOR BENCHMARK
3.1 Problem specification
The detailed benchmark specification for FRs can be found in Appendix A.2; only its mainfeatures are described here. The FR benchmark is for a 1 000 MWe (2 600 MWth) fast breeder reactorwhich operates on a 365 EFPD cycle at 80% capacity factor; one-third of the core is refuelled percycle. As shown in Figure 3.1, the core is of a homogeneous layout with two radial enrichment zonesand a radial blanket zone. Axially, the core is one meter high and has axial blankets of 30 cm.The breeding ratio is near 1.25. The fuel comprises mixed oxide pins of depleted uranium andonce-through PWR plutonium, as shown in Table 3.1. Three kinds of fuel containing minor actinides(0%, 2.5% and 5%) are selected in the FR benchmark. The beginning of life compositions arespecified as shown in Table 3.2.
3.2 Requested results
Participants were requested to provide the following results:
• Eigenvalues (keff) and critical balance (absorption and leakage) as a function of burn-up.
• Neutron balance (neutron production and absorption).
• Spectral indices.
• Reactivity loss as a function of burn-up.
• Inner and outer core isotopic composition variation (including MA build-up).
• Safety coefficients such as sodium void coefficient and fuel Doppler reactivity.
• Decay heat, neutron sources and radiotoxicity of wastes at various cooling times.
3.3 Participants
Six solutions were submitted for the fast reactor benchmark. The table appearing on the followingpage shows a synopsis of contributors, basic data and codes used in the solution of the problem.Some of the contributions were only partial.
3.4 Results and discussions
In the following paragraphs, some major features of the exercise are analysed.
20
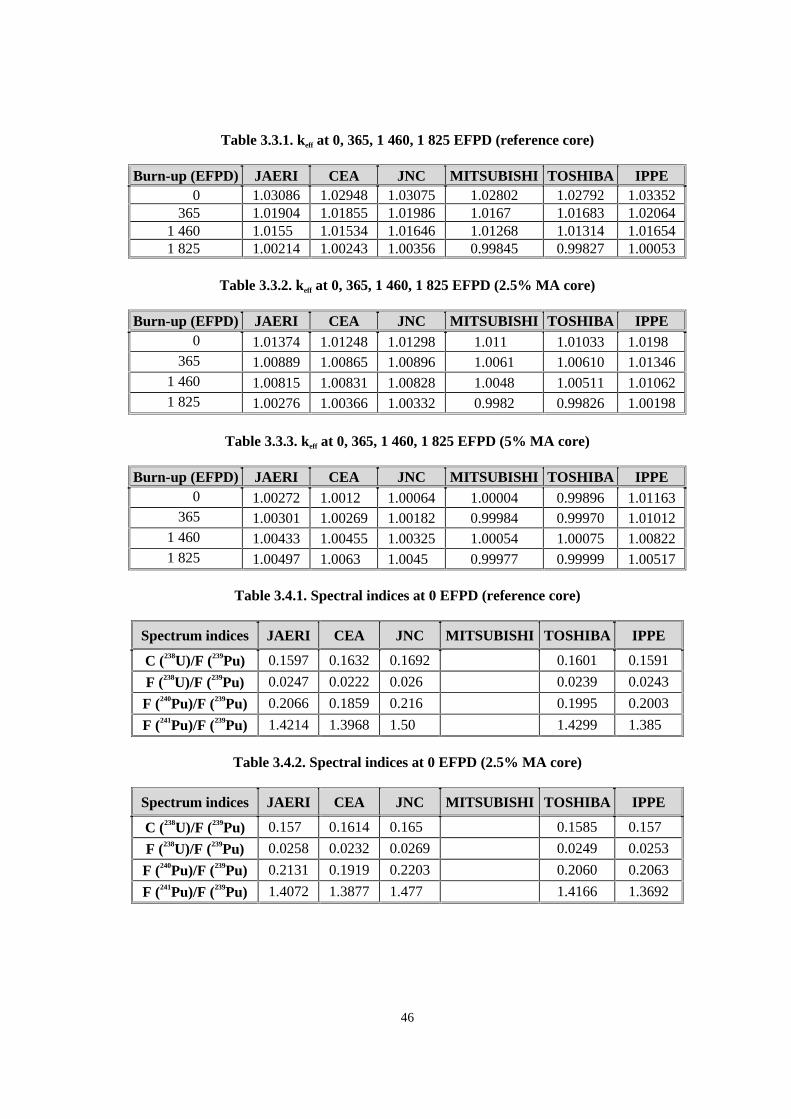
In Table 3.3 and Figures 3.2, 3.3 and 3.4, keff is shown. For the reference core with 0% MA, agood overall agreement within 0.3% ∆k/kk′ can be observed in keff. For the 2.5% MA core, threeresults (JNC, CEA, JAERI) are very close; Toshiba and Mitsubishi results are slightly lower (within0.5% ∆k/kk′) in comparison with the first three results. The IPPE result is a bit higher at the beginningof cycle (about 0.6% ∆k/kk′). For the 5.0% MA core, the CEA, JAERI and JNC results are verysimilar, the Toshiba and Mitsubishi results show small deviations, and the IPPE results are quitedifferent. The shape of the keff curve calculated by IPPE shows a different trend in comparison withthe other results.
List of contributors, basic data and codes
Organisation(Country)
Contributors Basic dataNumber of
energy groupsCodes
JAERI(Japan)
K. TsujimotoH. OigawaT. Mukaiyama
JENDL-3.2 701 (burn-up calc.)
ABC-SC code system• SLAROM• CITATION-FBR• ORILIB• ORIGEN-2• F-CHANGE• PERKY• RADAMES
CEA(France)
J. Tommasi CARNAVAL-IV+ JEF-1
25 • ERANOS
JNC(Japan)
T. Wakabayashi JENDL-3.2 707 (burn-up calc.)
• SLAROM• CITATION-FBR• ORIGEN-2• PERKY
MITSUBISHI(Japan)
M. Yano JENDL-3.2 187 (burn-up calc.)
• ODDBURN• 2DBURN• HANYO
TOSHIBA(Japan)
M. KawashimaM. Yamaoka
JENDL-3.2 707 (burn-up calc.)
• STANBRE-V3
IPPE(Russian Federation)
M. SemenovA. Tsiboulia
FOND-2 26 • CONSYST2• TRIGEX• CARE
Spectral indices at the core centre are shown in Table 3.4. Very good agreements can be observedin spectral indices for all participants.
Table 3.5 shows reactivity losses due to burn-up. Reactivity losses are in very good agreementwith maximum difference of 0.3% in ∆k/kk′ for all three (0%, 2.5%, 5% MA) cores.
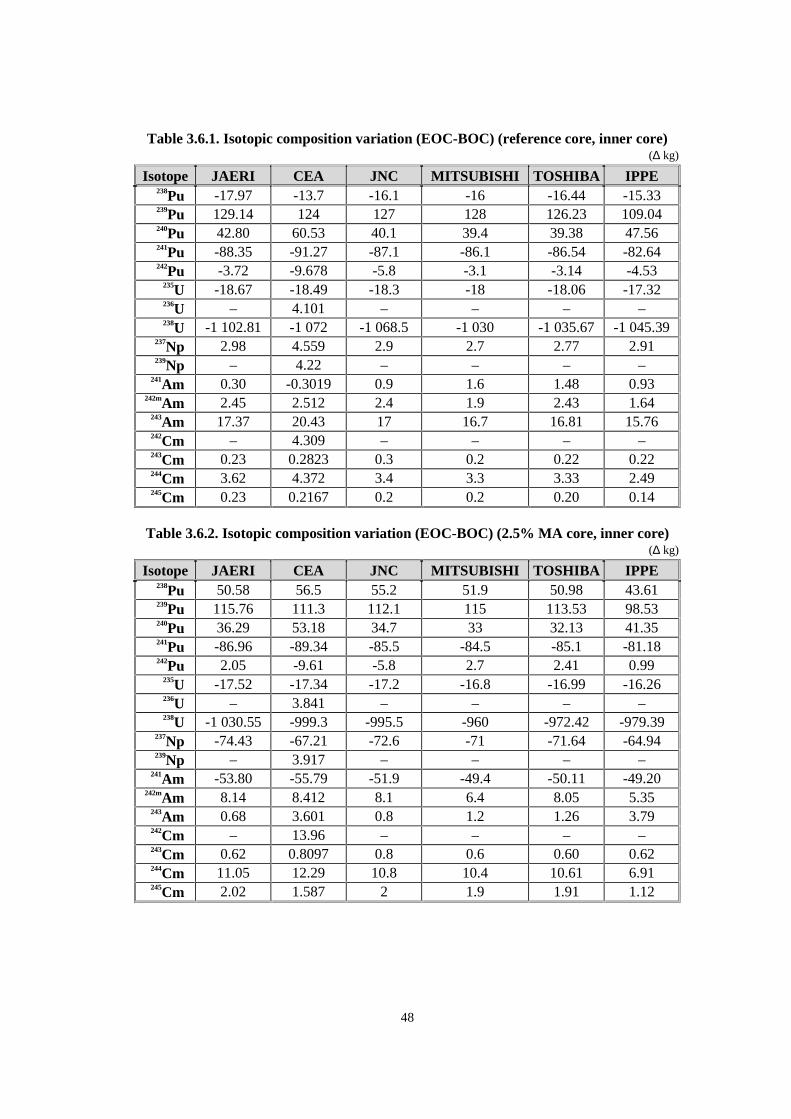
Table 3.6 shows some results for the isotopic composition variation due to burn-up. Of the23 isotopes considered, a good agreement is found between isotopic composition variations as afunction of burn-up for all isotopes except 238Pu, 240Pu, 242Pu, 241Am, 243Am, 244Cm and 237Np. The CEAresults present a high value for the build-up of 243Am and curium isotopes. A perturbation analysiswould be very valuable to help understand the differences.
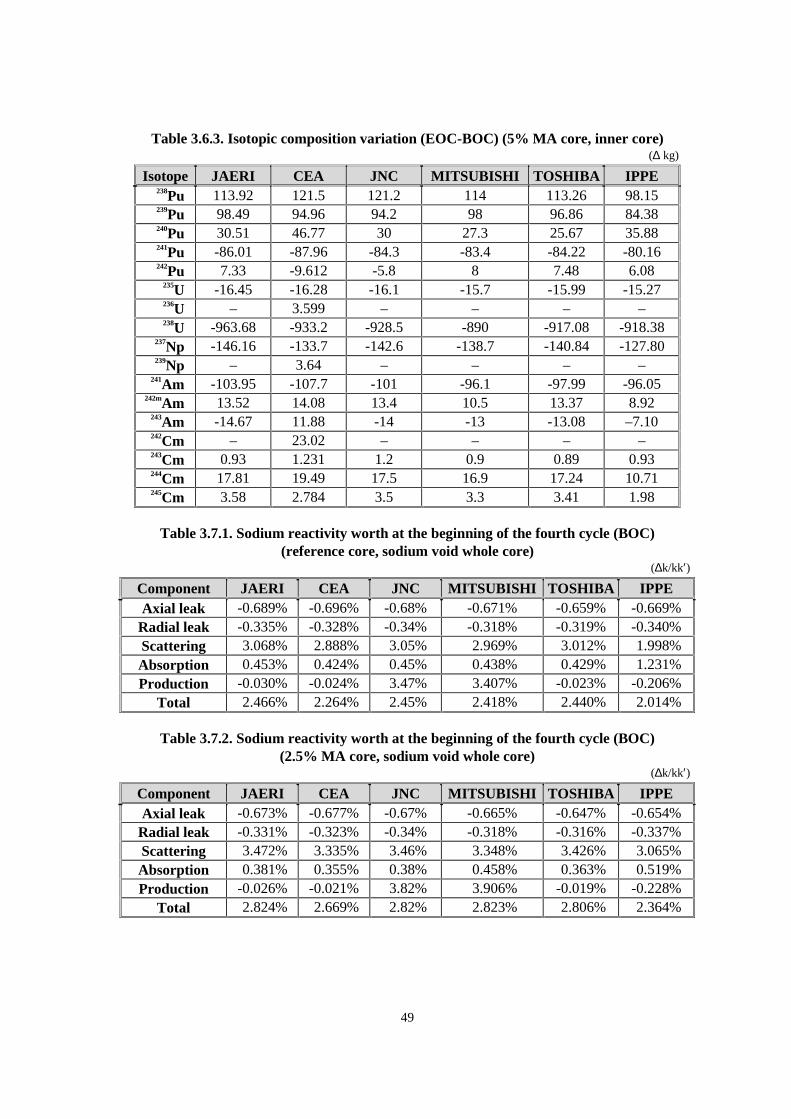
Reactivity worths for sodium void and Doppler coefficient are shown in Tables 3.7 and 3.8.
21
Excellent agreements for five results (within 8%) can be observed for sodium void reactivity,with the exception of the IPPE result. For IPPE, a discrepancy of about 20% is found for all threecores considered (0%, 2.5%, 5% MA).
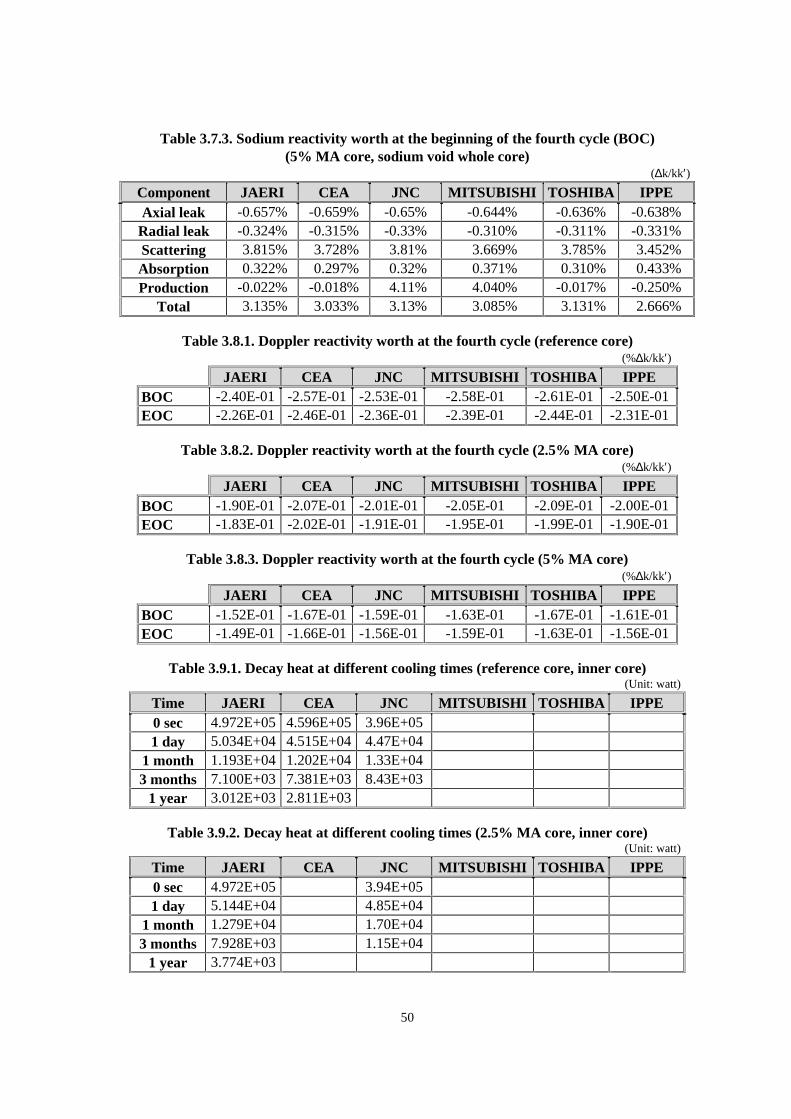
The Doppler coefficient of reactivity (total for the core) is in very good agreement, within 10%for all results (the discrepancy for this parameter is usually of the order of 20% for calculations versusmeasurements). Doppler components nuclide-by-nuclide are also in good agreement for all cases.
Some results of decay heat and neutron sources are shown in Tables 3.9 and 3.10. Decay heatresults appear to be in good agreement between JAERI and CEA, while JNC has decidedly lower valuesfor the reference core with 0% MA. A good overall agreement can be observed in neutron sources.
Transmutation rates for the 2.5% and 5% MA cores are shown in Table 3.11. A good overallagreement within 4% can be observed for the transmutation rate.
Typical results of number densities of wastes at various cooling times are shown in Figure 3.5.The CEA, JAERI and JNC results for number densities and activities of waste are similar.
3.5 Conclusions
Six solutions were submitted for the FR benchmark. The following conclusions can be derivedfrom the benchmark calculations:
1. Particularly satisfactory agreements are observed in keff, spectral indices, reactivity losses,sodium void reactivity, Doppler reactivity, neutron sources and transmutation rate.
2. The main discrepancies are observed in 238Pu, 240Pu, 242Pu, 241Am, 243Am, 244Cm and 237Npisotopic composition variations. They are due to cross-section differences.
3. The lesser discrepancies are noticed in decay heat and activities of waste.
It is found that the calculational code systems of participants have a very good general agreementin the predictions of the nuclear characteristics of the MA-loaded FR core.

23
Chapter 4
SUMMARY OF THE ACCELERATOR-DRIVEN SYSTEM BENCHMARK
4.1 Problem specification
A benchmark problem was provided for code and data validation in a proton accelerator-driventransmutation system (ADS) which is based on a conceptual design study by JAERI. The detailedbenchmark specification for ADS is given in Appendix A.3. The main characteristics of thebenchmark system are summarised in Table 4.1. The dirty plutonium from HLW is mixed into MAfuel to suppress the reactivity swing at the first burn-up stage. Here, plutonium and MA in HLW(obtained through partitioning after seven years cooling of the fuel burned up to 33 GWd/tHM, plusthree years of manufacturing time) have compositions as shown in Table 4.2 (this fuel is denoted asMOX11).
Three more fuel compositions based on plutonium and MA vectors are denoted as MOX21,MOX12 and MOX22; they have been added to this benchmark as presented in Table 4.2. These extracases are considered by FZK, Germany as part of a proposal regarding the investigation of physics ofdifferent transmutation concepts in PWRs. Hence, MOX21 refers to plutonium and MA compositionsresulting from the reprocessing of 4.65% UO2 fuel from Stage 1 PWR burned to 50 MWd/tHM,MOX12 refers to plutonium and MA compositions resulting from reprocessing of 4.1% MOX11burned to 33 MWd/tHM in a Stage 2 PWR and then admixed with depleted uranium, and MOX22refers to plutonium and MA compositions resulting from reprocessing of 6.0% MOX21 burned to50 MWd/tHM in a Stage 2 PWR and then admixed with natural uranium. In all cases seven years ofcooling time of spent fuel before reprocessing plus three years of MOX manufacturing time isconsidered. The resulting accelerator fuel compositions are heavily MA dominated as required by thedesign constraints of the accelerator considered (sub-critical core).
Figure 4.1 shows the two-dimensional model of the present benchmark system. This systemconsists of a two-region tungsten target injected by proton beam, MA fuelled core and reflectors, eachof which is cooled by sodium flow. The optimised target is a stack of tungsten discs with two differentthicknesses as shown in Figure 4.2(a). The MA nitride fuel pins are arranged in the core region asshown in Figure 4.2(b). Here the atom number densities are smeared in every region to simplify thebenchmark problem; these homogenised number densities are presented in Table 4.3.
4.2 Required cross-section library and code description
Participants should use their own cross-section library and energy group structure and providetheir description.
Code descriptions of the cascade code calculating the nuclear processes above 15 MeV energyand of the neutron transport code and the burn-up code for the energy range below 15 to 20 MeVshould be provided. Specifically, the calculation method, energy group structure and the actinide chainconsidered in the burn-up calculations should be included in the code description.
24
4.3 Spallation neutron source spectrum
In the analysis of the spallation neutron, special codes such as HETC or NMTC/JAERI arerequired. For the participants who were not familiar with these codes, the spallation neutron sourcespectrum was provided. The spectrum was determined by calculational results determined by theNMTC/JAERI code and supplied by JAERI. Table 4.4 displays the 73 group-wised spectra at theinterface between target and core.
4.4 Requested results
This hybrid system is expected to be driven by a proton beam of 1 GeV energy and a current of10 mA in a sub-critical state of keff = 0.9. The neutron transport process in target/core may becalculated as the fixed source problem based on spallation neutron distributions using transport codeor diffusion code. Burn-up calculations should be made for actinides in the energy range below15 MeV with the fixed neutron spectrum to make one group cross-sections. Participants are requestedto provide the benchmark results specified in points (a) through (c).
(a) Spallation neutrons (energy range from 1 GeV to 15-20 MeV, initial core):
• Number of spallation neutrons per incident proton.
• Region averaged spallation neutron spectra in target and core.
• Axial distribution of neutrons leaking from target at r = 150 mm.
• Maximum and average heat power densities in target region.
(b) Nuclear characteristics of transmutation target/core (energy range 15-20 MeV, initial core):
• Effective neutron multiplication factor.
• Sodium void reactivity effect (include sodium in target region).
• Region averaged neutron spectra in target and core.
• Average neutron energy in core region.
• Axial neutron flux distributions at r = 75 mm and r = 275 mm.
• Average neutron flux in core region.
• Fission and capture reaction rates in whole core region.
• Maximum and average heat power density in core region.
• Amount of transmuted MA per year (only by fission).
• MA transmutation rate (only by fission).
25
(c) Burn-up characteristics:
• Atom number densities for actinides (at the constant flux of 1.0 × 10¹⁶ n/cm2/s) at burn-upsteps of 10, 50, 100, 150, 200 GWd/tHM.
• Time evolution of keff with burn-up.
4.5 Participants
For the ADS benchmark, there were only three participants. The list of participants, basic dataand codes used for each stage of the calculations are presented in the following table.
Institution(country)
Participants Basic data Codes
JAERI(Japan)
T. NishidaT. TakizukaT. Sasa
JENDL-3.2 > 20 MeV• NMTC/JAERI
< 20 MeV• TWODANT• (neutron transport: 73 groups)• BURNER (burn-up)• NJOY-91.38/MILER/BONAMI-S• (cross-sections)
PSI(Switzerland)
G. YouinouS. PelloniP. Wydler
JEF-2.2 > 15 MeV• HETC-PSI
< 15 MeV• TWODANT• (neutron transport: 33 groups)• 2DTB (burn-up)• NJOY-89.62/MICROR/MICROX-2• (cross-sections)
IPPE(Russian Federation)
T.T. IvanovaV.F. BatyaevA.A Tsiboulia
ABBN-93from FOND-2
> 20 MeV• HETC
< 20 MeV• TWODANT• (neutron transport: 28 groups)• CARE (burn-up)• CONSYST2 (cross-sections)
4.6 Results and discussions
The number of neutrons produced by spallation is given in Table 4.5. Three results from JAERI,PSI and IPPE show a good agreement. Maximum and average heat densities in the target aresummarised in Table 4.6. The variation in average heat densities is relatively small, however thevariation in maximum heat densities is very large (a factor of 3) in both the thick and thin disk parts.A possible source of the discrepancies of heat power density results is the difference in the calculationmodels of the codes used.
26
The main neutronic characteristics of the core are given in Table 4.7. The initial keff of IPPE isquite different from that of JAERI and PSI. Sodium void reactivity is very similar for the PSI andJAERI solutions whereas the IPPE results are significantly different.
JAERI and PSI results give very similar values of average neutron energy for both MOX11 andMOX12 fuel, but about a 30% difference between JAERI and PSI results is observed for averageneutron flux, maximum and average heat power density in the fuel.
Fission and capture rates for initial core and 200 GWd/tHM burn-up core are shown in Tables 4.8and 4.9 respectively. These results show a good agreement for all solutions.
Burn-up characteristics of MOX11 and MOX 12 from PSI, JAERI and IPPE are shown inTables 4.10-4.15. These tables show the change in keff and atomic number densities of isotopes as afunction of burn-up; 0, 10, 50, 100, 150, 200 GWd/tHM.
Axial neutron distribution at r = 150 mm shows a good agreement for all solutions as shown inFigure 4.3.
The average neutron energy spectrum in-core is given in Figure 4.4. An excellent agreementbetween the JAERI and PSI results for MOX11 can be observed.
The time evolution of keff is shown in Figures 4.5 and 4.6 for MOX11 and MOX 12, respectively.Significant discrepancies are observed. The shape of the curve is identical for IPPE and JAERI, butdifferent for PSI with about a 3% difference in keff at zero burn-up. The difference between JAERI andPSI at the beginning of burn-up is relatively small, but it becomes larger after 100 GWd/tHM. JAERImade additional calculations to examine the influence of fission energy values and fission neutronenergy spectrum on reactivity [3]. As for the fission energy value, Q, three different values were taken(190, 200 and 210 MeV). The difference caused by the fission energy value is less than 0.5% and thetrend of the reactivity change with burn-up has not been affected. To determine the impact of thedifference of the fission energy spectrum (the so-called chi-vector), the calculations were performedby substituting the chi-vector of 237Np in ENDF/B-VI, JENDL-3.2 and JEF-2.2. Other reactioncross-sections were based on the JENDL-3.2 library. ENDF/B-VI shows the highest keff at the start-upcore. It is about 2% higher than that of JENDL-3.2 and 3% higher than that of JEF-2.2. The chi-vectorin ENDF/B-VI is the highest among the libraries. This causes more threshold fission reactions than theother two libraries and then the highest initial keff value is given. With regard to discrepancies in theburn-up reactivity change, besides different treatment of fission products used by the participants intheir burn-up calculations, the difference in the fission spectrum of 237Np between JENDL-3.2 andJEF-2.2 may be one of the origins of discrepancies [4].
Figures 4.7-4.10 show time evolution of number densities of 237Np and 241Am. An excellentagreement is observed for both of the isotopes for PSI and IPPE solutions. Overall the discrepancy inthe results increases as the total MA content increases.
4.7 Conclusions
Neutronics of accelerator-driven transmutation system (ADS) has been studied for validation ofcodes and data on the international level. The study is composed of benchmark calculations of spallationneutrons, nuclear characteristics of transmutation target/core, and burn-up characteristics for the targetand core of sodium-cooled nitride fuel ADS.
27
Three solutions were submitted for the benchmark. The following conclusions can be derivedfrom the benchmark results:
1) Satisfactory agreements are observed in the number of spallation neutrons per incident protonand the axial distribution of leakage neutrons from the spallation target (> 15 MeV). Largediscrepancies are found in the maximum and average heat power densities in the thin andthick disk parts of the target.
2) The results of the average neutron spectrum show good agreement. Essential discrepanciesare found in the keff and burn-up characteristics.
3) The discrepancies in keff and burn-up characteristics may be attributable to the treatment ofthe fission neutron energy spectrum, treatment of fission products including the preparation offission product chains, lumped fission products and fission yields, differences in themicroscopic cross-sections, etc.
The current ADS benchmark results are too discrepant and inconclusive. Therefore, the need for afurther ADS benchmark is clearly evident. Its design should provide the necessary features forresolving the discrepancies found in the present study and should be the starting point for morecomplex investigations involving transient behaviour of ADS systems. This is very important tofurther improve the reliability for validation of codes and data.

29
Chapter 5
CONCLUSIONS AND RECOMMENDATIONS
In the framework of the OECD/NEA project on “Physics Aspects of Different TransmutationConcepts,” the physics of recovered plutonium and MA transmutation in the form of MOX fuel inPWR, FR and ADS has been studied.
The Secretariat received a total of 15 solutions: six for the PWR, six for the FR and three forthe ADS.
For the PWR benchmark, in general, good agreement was observed among the submitted results.Overall, the results show consistency with limits of multiple plutonium recycling established by theNEA Working Party on Plutonium Fuels and Innovative Fuel Cycles (WPPR). In the PWR benchmarkcalculations, the discrepancies in keff values were about 2-3% between the ITEP and IPPE results,despite a good agreement being observed between the Japanese and German results. The fissionproducts build-up of 99Tc, 129I and 135Cs were in good agreement with each other. It was found theproduction of 135Cs depends considerably on the MA contents and MOX12 and MOX22 fuelled cases,that is on neutron spectra between UO2 and MOX fuels, standard and wide lattice cell and MAcontents. For MA transmutation, 237Np and 241Am are transmuted and initial loading quantities arereduced, but 243Am and 244Cm increase by larger build-up rates than transmutation rates.
For the FR benchmark, very good general agreement was also observed among submitted results.Therefore, calculational code systems of participants have a fairly good agreement in the predictionsof the nuclear characteristics of the MA loaded FR core. In the FR benchmark calculations,considerably good agreements were shown in the keff values, burn-up reactivity swings, spectralindices, sodium void reactivity, Doppler reactivity and transmutation rate. However, there weresignificant discrepancies for burn-up build-up of 238Pu, 242Pu, 237Np, 241Am, 243Am and 244Cm.Furthermore, FR benchmark calculations will be required for different (plutonium, MA) compositionssuch as the MOX22 case.
For the ADS benchmark, we observed good agreement for spallation neutron number/proton,axial neutron distribution from the target and so on. Large discrepancies were, however, observed inkeff and burn-up characteristics. The major causes are due to fission neutron spectrum, treatment offission products and capture and fission cross-sections used for MA nuclides in different nuclear datalibraries.
In the ADS benchmark, considerable differences in calculated initial keff values and burn-upreactivity swings indicated the need for a further ADS benchmark. Its specification should provide thenecessary features for resolving discrepancies identified in the present benchmark and can later beextended for more complex investigations such as beam trip transient behaviour of ADS systems.The detailed benchmark specification for the proposed ADS design can be found in Reference [5].

31
REFERENCES
[1] “OECD/NEA NSC Task Force on Physics Aspects of Different Transmutation Concepts –Benchmark Specifications”, NSC/DOC(96)10, 15 April 15 1996.
[2] H. Takano et al., “Benchmark Problems on Transmutation Calculation by the OECD/NEA TaskForce on Physics Aspects of Different Transmutation Concepts”, Int. Conf. on the Physics ofNuclear Science and Technology, Long Island, NY, USA, 5-8 October 1998, p. 1 462.
[3] T. Sasa, JAERI, private communications, December 1999.
[4] “Present Status of Minor Actinide Data”, International Evaluation Co-operation, Volume 8,NEA/WPEC-8, 1999.
[5] P. Wydler and H. Takano, “Comparison Calculations for an Accelerator-Driven Minor ActinideBurner”, NSC/DOC(99)13.


33
TABLES

35
Table 2.1. Benchmark cell specifications for PWR
Parameter Value
Moderator to fuel ratio
Standard 1.929
Wide 3.0
Fuel radius (cm) 0.4095
Can radius (cm) 0.475
Lattice pitch (cm)
Standard 1.333
Wide 1.513
Moderator radius (cm)
Standard 0.741
Wide 0.8536
Specific power (MW/tHM) 38.30
Power rating (W/cm) 183.02
Theoretical UO2 density (g/cm3) 10.96
Theoretical PuO2 density (g/cm3) 11.46
Oxide fuel density (g/cm3) 10.29
Zirconium density (g/cm3) 6.55
Water density (g/cm3) 0.7136
Fuel temperature (°C) 660.0
Moderator temperature (°C) 363.3
Table 2.2. Number densities of PWR UO2 cell at BOL
Concentration (nuclei/cm3)Zone Isotope
3.25% 235U 4.65% 235U
FuelO
235U238U
4.5934E+227.5564E+202.2211E+22
4.5941E+221.0811E+212.1889E+22
Cladding Zr 4.3365E+22 4.3365E+22
Moderator HO
4.7769E+22.3885E+22
4.7769E+222.3885E+22
36
Table 2.3. Actinide atom per cent fraction
MOX11 MOX21 MOX12 MOX2233 GWd/tHM 50 GWd/tHM 33 GWd/tHM 50 GWd/tHMFuel burn-up
Nuclide atom %238Pu 1.5 2.7 2.6 4.1239Pu 59.3 55.3 44.5 41.9240Pu 23.7 23.9 31.0 30.5241Pu 8.7 9.5 10.7 10.6242Pu 5.5 7.1 9.5 11.3
241Am 1.3 1.5 1.7 1.7Total 100 100 100 100237Np 44.6 46.4 4.5 4.4241Am 43.6 37.1 62.5 58.3243Am 9.7 12.7 24.3 26.1243Cm 0.0 0.0 0.0 0.0244Cm 2.1 3.8 8.7 11.3245Cm 0.0 0.0 0.0 0.0Total 100 100 100 100
Table 2.4. Number densities of the normal PWR lattice
MOX12 (33 GWd/tHM) MOX22 (50 GWd/tHM)MA(%)
0.0 1.0 2.5 0.0 1.0 2.5235U 4.6618E-05 4.4263E-05 4.1190E-05 1.4144E-04 1.3547E-04 1.2639E-04238U 2.0673E-02 1.9628E-02 1.8265E-02 1.9752E-02 1.8918E-02 1.7651E-02
237Np 0.0000E+00 1.0332E-05 2.5881E-05 0.0000E+00 1.0105E-05 2.5357E-05238Pu 5.6777E-05 7.8873E-05 1.0646E-04 1.2477E-04 1.5081E-04 1.9044E-04239Pu 9.7176E-04 1.3499E-03 1.8222E-03 1.2751E-03 1.5412E-03 1.9462E-03240Pu 6.7695E-04 9.4041E-04 1.2694E-03 9.2817E-04 1.1219E-03 1.4167E-03241Pu 2.3366E-04 3.2459E-04 4.3814E-04 3.1953E-04 3.8622E-04 4.8771E-04242Pu 2.0745E-04 2.8819E-04 3.8900E-04 3.4388E-04 4.1564E-04 5.2487E-04
241Am 3.7123E-05 1.4349E-04 3.5946E-04 5.1734E-05 1.3366E-04 3.3540E-04243Am 0.0000E+00 5.5790E-05 1.3976E-04 0.0000E+00 5.9941E-05 1.5041E-04244Cm 0.0000E+00 1.9974E-05 5.0037E-05 0.0000E+00 2.5952E-05 6.5121E-05
O 4.5807E-02 4.5768E-02 4.5813E-02 4.5873E-02 4.5798E-02 4.5839E-02
37
Table 2.5. Number densities of the wider PWR lattice
MOX22 (50 GWd/tHM)MA(%)
0.0 1.0 2.5235U 1.4994E-04 1.4400E-04 1.3317E-04238U 2.0939E-02 2.0109E-02 1.8596E-02
237Np 0.0000E+00 1.0084E-05 2.5286E-05238Pu 7.3785E-05 9.9693E-05 1.4991E-04239Pu 7.5405E-04 1.0188E-03 1.5320E-03240Pu 5.4889E-04 7.4162E-04 1.1152E-03241Pu 1.8896E-04 2.5531E-04 3.8392E-04242Pu 2.0336E-04 2.7476E-04 4.1317E-04
241Am 3.0594E-05 1.3339E-04 3.3446E-04243Am 0.0000E+00 5.9819E-05 1.4999E-04244Cm 0.0000E+00 2.5899E-05 6.4939E-05
O 4.5873E-02 4.5798E-02 4.5839E-02The plutonium enrichments are respectively: 0.0% MA: 4.15% Pu-f
1.0% MA: 5.6% Pu-f2.5% MA: 8.4% Pu-f
Table 2.6. Proposed macro steps for depletion calculations
StepBurn-up
(MWd/tHM)∆T*(day)
1 0 0.0002 150 3.9163 500 9.1384 1 000 13.0555 2 000 26.1106 4 000 52.2197 6 000 52.2198 10 000 104.4399 15 000 130.548
10 20 000 130.54811 22 000 52.21912 26 000 104.43913 30 000 104.43914 33 000 78.32915 33 300 7.83316 35 000 44.38617 40 000 130.54818 45 000 130.54819 50 000 130.548
* Power rating 183.02 W/cm
38
Table 2.7. Fission products weight (kg) of 99Tc, 129I and 135Csgenerated at the burn-up 33 GWd/tHM and normalised to 1 t fuel
MA contents (%)Fuel Nuclide
0.0 1.0 2.599Tc 0.80 0.80 0.80
MOX12 129I 0.21 0.21 0.21135Cs 0.91 1.04 1.1499Tc 0.81 0.81 0.80
MOX22 (standard) 129I 0.21 0.21 0.20135Cs 1.04 1.10 1.1799Tc 0.82 0.82 0.81
MOX22 (wide) 129I 0.20 0.20 0.20135Cs 0.71 0.84 1.00
Table 2.8. Index of MA transmutation which means negative or positivesign corresponding to decrease or increase from initial loading MA
MOX12 MOX22-standard MOX22-wideNuclide
1.0% MA 2.5% MA 1.0% MA 2.5% MA 1.0% MA 2.5% MA237Np 0.0 - 0.0 - - (+FZK) -241Am - - - - - -243Am + 0.0 + + + 0.0244Am + + + + + +
39
Table 2.9. Comparison of Doppler and void reactivities
Part I – MOX12
1. MOX12, 33 GWd, 5.3% Pu-f 0% MA
a) Burn-up = 0 GWd/tHM (BOL)
Tohoku Univ. ITEP JAERI IKE FZK
Void fraction k00 1.10399 1.1296 1.10854 1.1081 1.10694
∆k = k′ - k00.4 -0.0810 -0.0835 -0.0806 -0.0815 -0.08120.7 -0.1349 -0.1465 -0.1327 -0.1346 -0.13320.95 -0.1502 -0.1602 -0.1286 -0.1419 -0.1458
Doppler (+300°C) -0.0099 -0.0106 -0.0098 -0.0102
b) Burn-up = 33 GWd/tHM (EOL)
Void fraction k0
0 -0.99942 1.006 0.99728 0.98641
∆k = k′ - k00.4 -0.0803 -0.0797 -0.0808 -0.07910.7 -0.1358 -0.1334 -0.1362 -0.13220.95 -0.1462 -0.1403 -0.1304 -0.1399
Doppler (+300°C) -0.0084 -0.0080 -0.0086 -0.0088
2. MOX12, 33 GWd, 7.5% Puf 1.0% MA
a) Burn-up = 0 GWd/tHM (BOL)
Tohoku Univ. ITEP JAERI IKE FZK
Void fraction k00 1.07879 1.100 1.08437 1.0808 1.08431
∆k = k′ - k00.4 -0.0513 -0.0563 -0.0513 -0.0513 -0.04930.7 -0.0574 -0.0688 -0.0557 -0.0556 -0.05080.95 -0.0033 -0.0075 -0.0261 -0.0138 -0.0180
Doppler (+300°C) -0.0086 -0.0085 -0.0086 -0.0092
b) Burn-up = 33 GWd/tHM (EOL)
Void fraction k0
0 1.00916 1.0167 1.00721 0.99682
∆k = k′ - k00.4 -0.0524 -0.0543 -0.0532 -0.05010.7 -0.0631 -0.0684 -0.0637 -0.05680.95 -0.0047 -0.0052 -0.0132 -0.0086
Doppler (+300°C) -0.0079 -0.0075 -0.0080 -0.0083
40
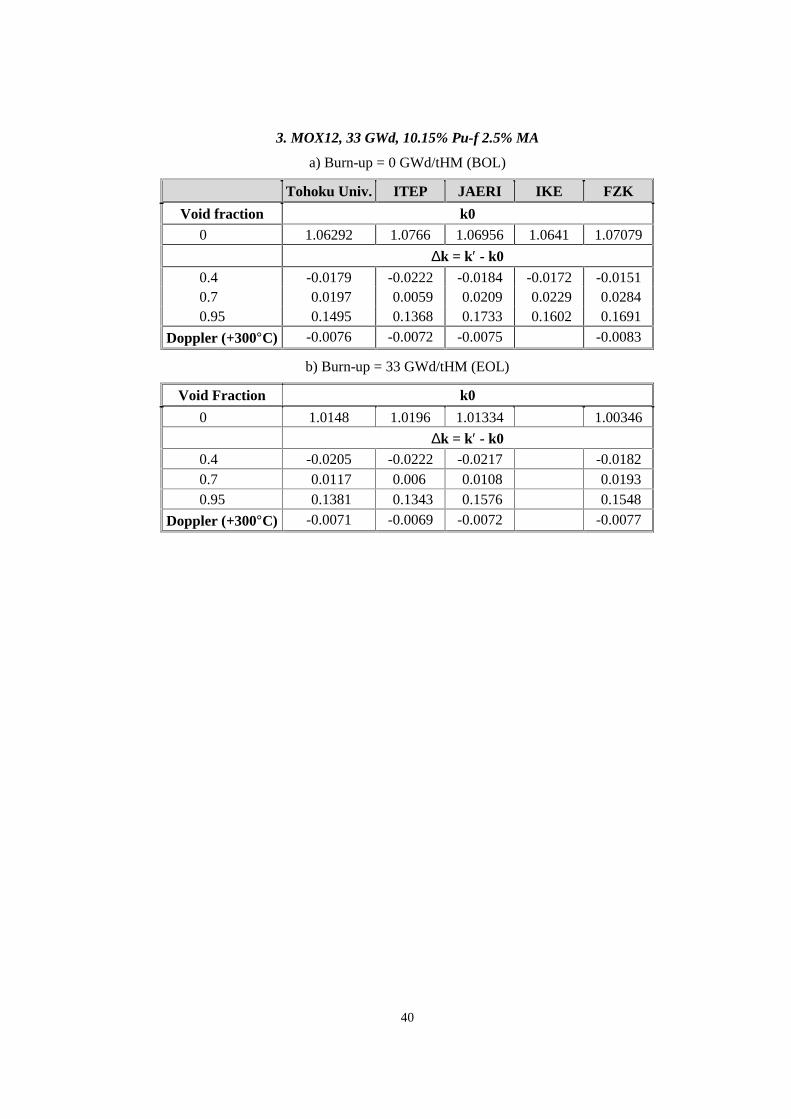
3. MOX12, 33 GWd, 10.15% Pu-f 2.5% MA
a) Burn-up = 0 GWd/tHM (BOL)
Tohoku Univ. ITEP JAERI IKE FZK
Void fraction k00 1.06292 1.0766 1.06956 1.0641 1.07079
∆k = k′ - k00.4 -0.0179 -0.0222 -0.0184 -0.0172 -0.01510.7 -0.0197 -0.0059 -0.0209 -0.0229 -0.02840.95 -0.1495 -0.1368 -0.1733 -0.1602 -0.1691
Doppler (+300°C) -0.0076 -0.0072 -0.0075 -0.0083
b) Burn-up = 33 GWd/tHM (EOL)
Void Fraction k0
0 1.0148 1.0196 1.01334 1.00346
∆k = k′ - k00.4 -0.0205 -0.0222 -0.0217 -0.01820.7 -0.0117 -0.0060 -0.0108 -0.01930.95 -0.1381 -0.1343 -0.1576 -0.1548
Doppler (+300°C) -0.0071 -0.0069 -0.0072 -0.0077

41
Table 2.9. Comparison of Doppler and void reactivities (continued)
Part II – MOX22
1. MOX22, 50 GWd, 7% Pu-f 0.0% MA
a) Burn-up = 0 GWd/tHM (BOL)
Tohoku Univ. ITEP JAERI IKE FZK
Void fraction k00 1.1247 1.1494 1.12957 1.1286 1.12585
∆k = k′ - k00.4 -0.0543 -0.0600 -0.0542 -0.0547 -0.0569
0.7 -0.0673 -0.0809 -0.0655 -0.0664 -0.06530.95 -0.0215 -0.0328 -0.0010 -0.0119 -0.0148
Doppler (+300°C) -0.0094 -0.0089 -0.0093 -0.0100
b) Burn-up = 50 GWd/tHM (EOL)
Void fraction k0
0 0.99221 0.9991 0.98943 0.9741
∆k = k′ - k00.4 -0.0597 -0.0595 -0.0610 -0.05870.7 -0.0809 -0.0827 -0.0829 -0.07830.95 -0.0350 -0.0305 -0.0210 -0.0288
Doppler (+300°C) -0.0078 -0.0078 -0.0081 -0.0082
2. MOX22, 50 GWd, 8.45% Pu-f 1.0% MA
a) Burn-up = 0 GWd/tHM (BOL)
Tohoku Univ. ITEP JAERI IKE FZK
Void fraction k00 1.10426 1.1257 1.10968 1.1069 1.10371
∆k = k′ - k00.4 -0.0346 -0.0404 -0.0348 -0.0347 -0.0338
0.7 -0.0186 -0.0328 -0.0170 -0.0167 -0.01480.95 -0.0752 -0.0626 -0.0988 -0.0858 -0.0855
Doppler (+300°C) -0.0085 -0.0089 -0.0084 -0.0091
b) Burn-up = 50 GWd/tHM (EOL)
Void fraction k00 1.00207 1.0089 0.99864 0.97986
∆k = k′ - k00.4 -0.0405 -0.0430 -0.0420 -0.0400
0.7 -0.0342 -0.0400 -0.0360 -0.03190.95 -0.0547 -0.0544 -0.0707 -0.0617
Doppler (+300°C) -0.0075 -0.0076 -0.0077 -0.0079
42
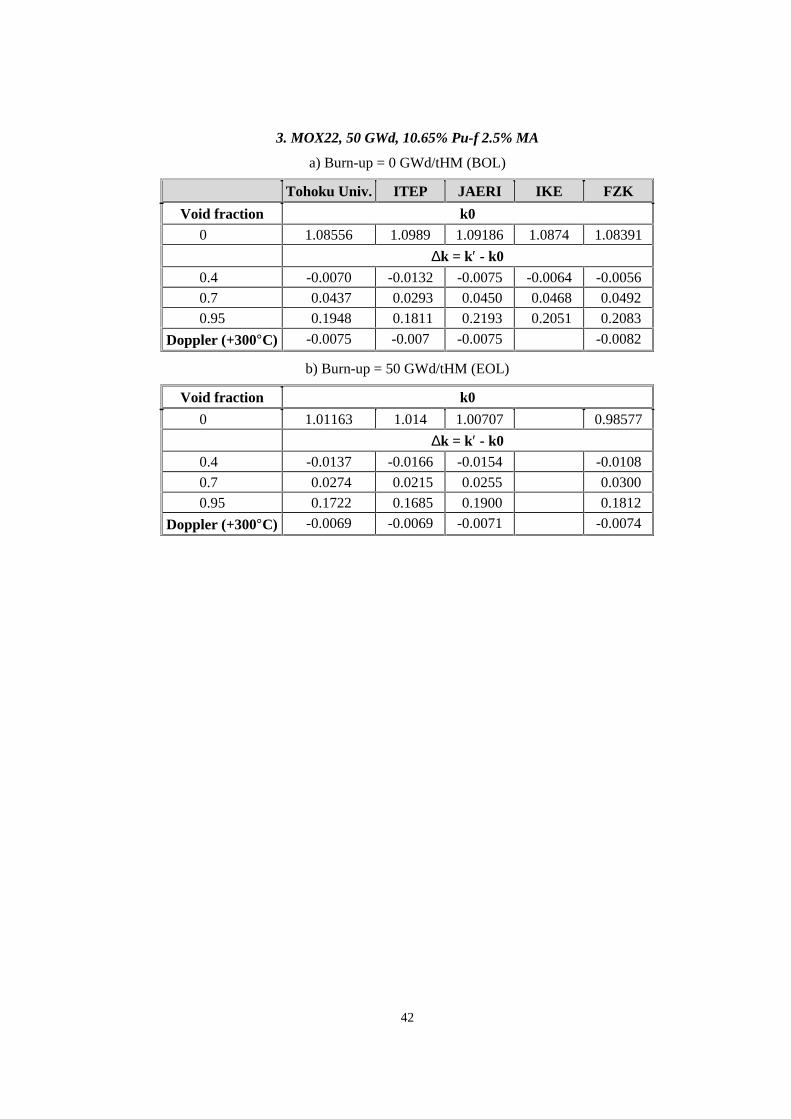
3. MOX22, 50 GWd, 10.65% Pu-f 2.5% MA
a) Burn-up = 0 GWd/tHM (BOL)
Tohoku Univ. ITEP JAERI IKE FZK
Void fraction k00 1.08556 1.0989 1.09186 1.0874 1.08391
∆k = k′ - k00.4 -0.0070 -0.0132 -0.0075 -0.0064 -0.00560.7 -0.0437 -0.0293 -0.0450 -0.0468 -0.04920.95 -0.1948 -0.1811 -0.2193 -0.2051 -0.2083
Doppler (+300°C) -0.0075 -0.007 -0.0075 -0.0082
b) Burn-up = 50 GWd/tHM (EOL)
Void fraction k0
0 1.01163 1.014 1.00707 0.98577
∆k = k′ - k00.4 -0.0137 -0.0166 -0.0154 -0.0108
0.7 -0.0274 -0.0215 -0.0255 -0.03000.95 -0.1722 -0.1685 -0.1900 -0.1812
Doppler (+300°C) -0.0069 -0.0069 -0.0071 -0.0074
43
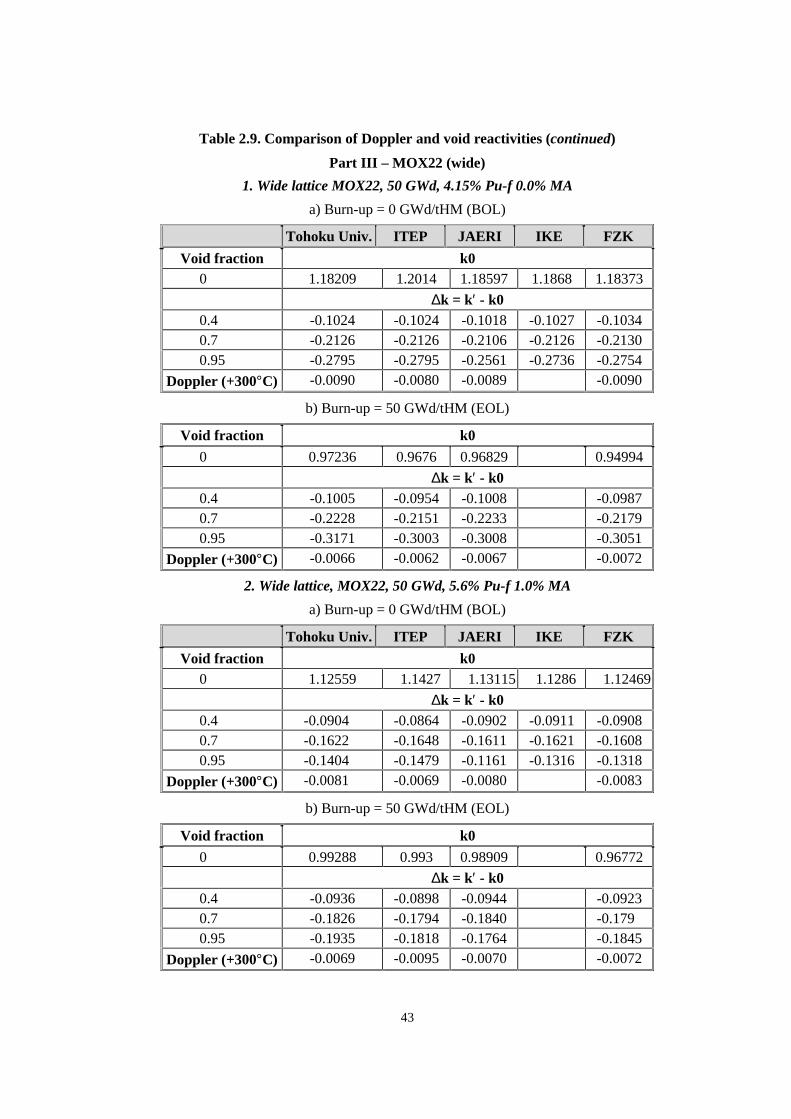
Table 2.9. Comparison of Doppler and void reactivities (continued)
Part III – MOX22 (wide)
1. Wide lattice MOX22, 50 GWd, 4.15% Pu-f 0.0% MA
a) Burn-up = 0 GWd/tHM (BOL)
Tohoku Univ. ITEP JAERI IKE FZK
Void fraction k00 1.18209 1.2014 1.18597 1.1868 1.18373
∆k = k′ - k00.4 -0.1024 -0.1024 -0.1018 -0.1027 -0.10340.7 -0.2126 -0.2126 -0.2106 -0.2126 -0.21300.95 -0.2795 -0.2795 -0.2561 -0.2736 -0.2754
Doppler (+300°C) -0.0090 -0.0080 -0.0089 -0.0090
b) Burn-up = 50 GWd/tHM (EOL)
Void fraction k0
0 0.97236 0.9676 0.96829 0.94994
∆k = k′ - k00.4 -0.1005 -0.0954 -0.1008 -0.09870.7 -0.2228 -0.2151 -0.2233 -0.21790.95 -0.3171 -0.3003 -0.3008 -0.3051
Doppler (+300°C) -0.0066 -0.0062 -0.0067 -0.0072
2. Wide lattice, MOX22, 50 GWd, 5.6% Pu-f 1.0% MA
a) Burn-up = 0 GWd/tHM (BOL)
Tohoku Univ. ITEP JAERI IKE FZK
Void fraction k00 1.12559 1.1427 1.13115 1.1286 1.12469
∆k = k′ - k00.4 -0.0904 -0.0864 -0.0902 -0.0911 -0.09080.7 -0.1622 -0.1648 -0.1611 -0.1621 -0.16080.95 -0.1404 -0.1479 -0.1161 -0.1316 -0.1318
Doppler (+300°C) -0.0081 -0.0069 -0.0080 -0.0083
b) Burn-up = 50 GWd/tHM (EOL)
Void fraction k0
0 0.99288 0.993 0.98909 0.96772
∆k = k′ - k00.4 -0.0936 -0.0898 -0.0944 -0.09230.7 -0.1826 -0.1794 -0.1840 -0.17900.95 -0.1935 -0.1818 -0.1764 -0.1845
Doppler (+300°C) -0.0069 -0.0095 -0.0070 -0.0072
44
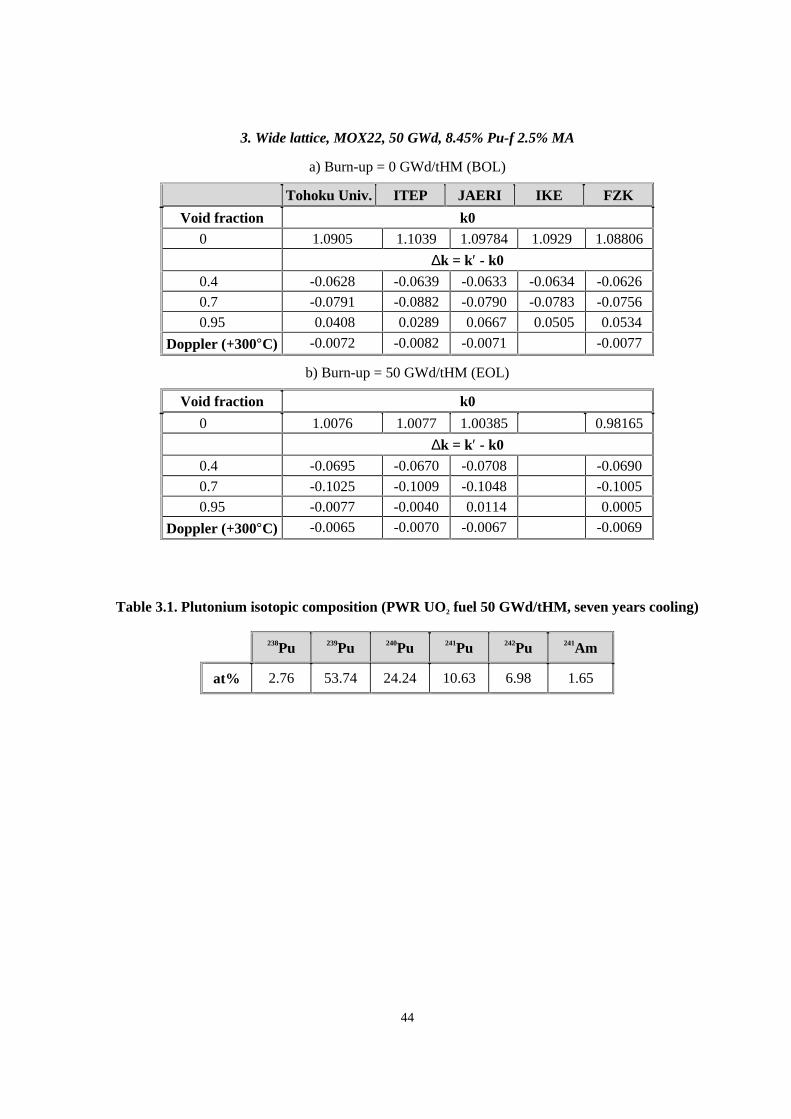
3. Wide lattice, MOX22, 50 GWd, 8.45% Pu-f 2.5% MA
a) Burn-up = 0 GWd/tHM (BOL)
Tohoku Univ. ITEP JAERI IKE FZK
Void fraction k00 1.0905 1.1039 1.09784 1.0929 1.08806
∆k = k′ - k00.4 -0.0628 -0.0639 -0.0633 -0.0634 -0.06260.7 -0.0791 -0.0882 -0.0790 -0.0783 -0.07560.95 -0.0408 -0.0289 -0.0667 -0.0505 -0.0534
Doppler (+300°C) -0.0072 -0.0082 -0.0071 -0.0077
b) Burn-up = 50 GWd/tHM (EOL)
Void fraction k0
0 1.0076 1.0077 1.00385 0.98165
∆k = k′ - k00.4 -0.0695 -0.0670 -0.0708 -0.0690
0.7 -0.1025 -0.1009 -0.1048 -0.10050.95 -0.0077 -0.0040 -0.0114 -0.0005
Doppler (+300°C) -0.0065 -0.0070 -0.0067 -0.0069
Table 3.1. Plutonium isotopic composition (PWR UO2 fuel 50 GWd/tHM, seven years cooling)
238Pu 239Pu 240Pu 241Pu 242Pu 241Am
at% 2.76 53.74 24.24 10.63 6.98 1.65

45
46
Table 3.3.1. keff at 0, 365, 1 460, 1 825 EFPD (reference core)
Burn-up (EFPD) JAERI CEA JNC MITSUBISHI TOSHIBA IPPE0 1.03086 1.02948 1.03075 1.02802 1.02792 1.03352
365 1.01904 1.01855 1.01986 1.01670 1.01683 1.020641 460 1.01550 1.01534 1.01646 1.01268 1.01314 1.016541 825 1.00214 1.00243 1.00356 0.99845 0.99827 1.00053
Table 3.3.2. keff at 0, 365, 1 460, 1 825 EFPD (2.5% MA core)
Burn-up (EFPD) JAERI CEA JNC MITSUBISHI TOSHIBA IPPE0 1.01374 1.01248 1.01298 1.0110 1.01033 1.01980
365 1.00889 1.00865 1.00896 1.0061 1.00610 1.013461 460 1.00815 1.00831 1.00828 1.0048 1.00511 1.010621 825 1.00276 1.00366 1.00332 0.9982 0.99826 1.00198
Table 3.3.3. keff at 0, 365, 1 460, 1 825 EFPD (5% MA core)
Burn-up (EFPD) JAERI CEA JNC MITSUBISHI TOSHIBA IPPE0 1.00272 1.00120 1.00064 1.00004 0.99896 1.01163
365 1.00301 1.00269 1.00182 0.99984 0.99970 1.010121 460 1.00433 1.00455 1.00325 1.00054 1.00075 1.008221 825 1.00497 1.00630 1.00450 0.99977 0.99999 1.00517
Table 3.4.1. Spectral indices at 0 EFPD (reference core)
Spectrum indices JAERI CEA JNC MITSUBISHI TOSHIBA IPPE
C (238U)/F (239Pu) 0.1597 0.1632 0.1692 0.1601 0.1591
F (238U)/F (239Pu) 0.0247 0.0222 0.0260 0.0239 0.0243
F (240Pu)/F (239Pu) 0.2066 0.1859 0.2160 0.1995 0.2003
F (241Pu)/F (239Pu) 1.4214 1.3968 1.5000 1.4299 1.3850
Table 3.4.2. Spectral indices at 0 EFPD (2.5% MA core)
Spectrum indices JAERI CEA JNC MITSUBISHI TOSHIBA IPPE
C (238U)/F (239Pu) 0.1570 0.1614 0.1650 0.1585 0.1570
F (238U)/F (239Pu) 0.0258 0.0232 0.0269 0.0249 0.0253
F (240Pu)/F (239Pu) 0.2131 0.1919 0.2203 0.2060 0.2063
F (241Pu)/F (239Pu) 1.4072 1.3877 1.4770 1.4166 1.3692

47
Table 3.4.3. Spectral indices at 0 EFPD (5% MA core)
Spectrum indices JAERI CEA JNC MITSUBISHI TOSHIBA IPPE
C (238U)/F (239Pu) 0.1542 0.1594 0.1611 0.1560 0.1552
F (238U)/F (239Pu) 0.0269 0.0242 0.0279 0.0260 0.0262
F (240Pu)/F (239Pu) 0.2196 0.1978 0.2247 0.2124 0.2114
F (241Pu)/F (239Pu) 1.3933 1.3785 1.4560 1.4025 1.3593
Table 3.5.1. Reactivity losses over five cycles (reference core)(%∆k/kk′)
Burn-up (EFPD) JAERI CEA JNC MITSUBISHI TOSHIBA IPPE0-365 1.679 1.574 1.547 1.619 1.691 1.764
365-730 1.336 1.288 1.279 1.424 1.494 1.534730-1 095 1.297 1.257 1.253 1.396 1.458 1.521
1 095-1 460 1.310 1.269 1.264 1.407 1.470 1.5671 460-1 825 1.311 1.270 1.265 1.407 1.470 1.574
Table 3.5.2. Reactivity losses over five cycles (2.5% MA core)(%∆k/kk′)
Burn-up (EFPD) JAERI CEA JNC MITSUBISHI TOSHIBA IPPE0-365 0.686 0.558 0.573 0.707 0.706 0.858
365-730 0.483 0.399 0.436 0.610 0.635 0.767730-1 095 0.511 0.437 0.473 0.635 0.665 0.818
1 095-1 460 0.532 0.458 0.491 0.653 0.683 0.8511 460-1 825 0.533 0.458 0.491 0.653 0.684 0.853
Table 3.5.3. Reactivity losses over five cycles (5% MA core)(%∆k/kk′)
Burn-up (EFPD) JAERI CEA JNC MITSUBISHI TOSHIBA IPPE0-365 -0.071 -0.234 0.2 0.009 -0.044 0.175
365-730 -0.161 -0.291 -0.227 -0.005 -0.021 0.188730-1 095 -0.092 -0.202 -0.145 0.055 0.054 0.280
1 095-1 460 -0.067 -0.178 -0.125 0.076 0.076 0.3041 460-1 825 -0.065 -0.177 -0.124 0.077 0.076 0.301
48
Table 3.6.1. Isotopic composition variation (EOC-BOC) (reference core, inner core)(∆ kg)
Isotope JAERI CEA JNC MITSUBISHI TOSHIBA IPPE238Pu -17.97 -13.7 -16.1 -16 -16.44 -15.33239Pu 129.14 124 127 128 126.23 109.04240Pu 42.80 60.53 40.1 39.4 39.38 47.56241Pu -88.35 -91.27 -87.1 -86.1 -86.54 -82.64242Pu -3.72 -9.678 -5.8 -3.1 -3.14 -4.53
235U -18.67 -18.49 -18.3 -18 -18.06 -17.32236U – 4.101 – – – –238U -1 102.81 -1 072 -1 068.5 -1 030 -1 035.67 -1 045.39
237Np 2.98 4.559 2.9 2.7 2.77 2.91239Np – 4.22 – – – –
241Am 0.30 -0.3019 0.9 1.6 1.48 0.93242mAm 2.45 2.512 2.4 1.9 2.43 1.64
243Am 17.37 20.43 17 16.7 16.81 15.76242Cm – 4.309 – – – –243Cm 0.23 0.2823 0.3 0.2 0.22 0.22244Cm 3.62 4.372 3.4 3.3 3.33 2.49245Cm 0.23 0.2167 0.2 0.2 0.20 0.14
Table 3.6.2. Isotopic composition variation (EOC-BOC) (2.5% MA core, inner core)(∆ kg)
Isotope JAERI CEA JNC MITSUBISHI TOSHIBA IPPE238Pu 50.58 56.5 55.2 51.9 50.98 43.61239Pu 115.76 111.3 112.1 115 113.53 98.53240Pu 36.29 53.18 34.7 33 32.13 41.35241Pu -86.96 -89.34 -85.5 -84.5 -85.1 -81.18242Pu 2.05 -9.61 -5.8 2.7 2.41 0.99
235U -17.52 -17.34 -17.2 -16.8 -16.99 -16.26236U – 3.841 – – – –238U -1 030.55 -999.3 -995.5 -960 -972.42 -979.39
237Np -74.43 -67.21 -72.6 -71 -71.64 -64.94239Np – 3.917 – – – –
241Am -53.80 -55.79 -51.9 -49.4 -50.11 -49.20242mAm 8.14 8.412 8.1 6.4 8.05 5.35
243Am 0.68 3.601 0.8 1.2 1.26 3.79242Cm – 13.96 – – – –243Cm 0.62 0.8097 0.8 0.6 0.60 0.62244Cm 11.05 12.29 10.8 10.4 10.61 6.91245Cm 2.02 1.587 2 1.9 1.91 1.12
49
Table 3.6.3. Isotopic composition variation (EOC-BOC) (5% MA core, inner core)(∆ kg)
Isotope JAERI CEA JNC MITSUBISHI TOSHIBA IPPE238Pu 113.92 121.5 121.2 114 113.26 98.15239Pu 98.49 94.96 94.2 98 96.86 84.38240Pu 30.51 46.77 30 27.3 25.67 35.88241Pu -86.01 -87.96 -84.3 -83.4 -84.22 -80.16242Pu 7.33 -9.612 -5.8 8 7.48 6.08
235U -16.45 -16.28 -16.1 -15.7 -15.99 -15.27236U – 3.599 – – – –238U -963.68 -933.2 -928.5 -890 -917.08 -918.38
237Np -146.16 -133.7 -142.6 -138.7 -140.84 -127.80239Np – 3.64 – – – –
241Am -103.95 -107.7 -101 -96.1 -97.99 -96.05242mAm 13.52 14.08 13.4 10.5 13.37 8.92
243Am -14.67 11.88 -14 -13 -13.08 –7.10242Cm – 23.02 – – – –243Cm 0.93 1.231 1.2 0.9 0.89 0.93244Cm 17.81 19.49 17.5 16.9 17.24 10.71245Cm 3.58 2.784 3.5 3.3 3.41 1.98
Table 3.7.1. Sodium reactivity worth at the beginning of the fourth cycle (BOC)(reference core, sodium void whole core)
(∆k/kk′)
Component JAERI CEA JNC MITSUBISHI TOSHIBA IPPEAxial leak -0.689% -0.696% -0.68% -0.671% -0.659% -0.669%
Radial leak -0.335% -0.328% -0.34% -0.318% -0.319% -0.340%Scattering -3.068% -2.888% -3.05% -2.969% -3.012% -1.998%Absorption -0.453% -0.424% -0.45% -0.438% -0.429% -1.231%Production -0.030% -0.024% -3.47% -3.407% -0.023% -0.206%
Total -2.466% -2.264% -2.45% -2.418% -2.440% -2.014%
Table 3.7.2. Sodium reactivity worth at the beginning of the fourth cycle (BOC)(2.5% MA core, sodium void whole core)
(∆k/kk′)
Component JAERI CEA JNC MITSUBISHI TOSHIBA IPPEAxial leak -0.673% -0.677% -0.67% -0.665% -0.647% -0.654%
Radial leak -0.331% -0.323% -0.34% -0.318% -0.316% -0.337%Scattering -3.472% -3.335% -3.46% -3.348% -3.426% -3.065%Absorption -0.381% -0.355% -0.38% -0.458% -0.363% -0.519%Production -0.026% -0.021% -3.82% -3.906% -0.019% -0.228%
Total -2.824% -2.669% -2.82% -2.823% -2.806% -2.364%
50
Table 3.7.3. Sodium reactivity worth at the beginning of the fourth cycle (BOC)(5% MA core, sodium void whole core)
(∆k/kk′)
Component JAERI CEA JNC MITSUBISHI TOSHIBA IPPEAxial leak -0.657% -0.659% -0.65% -0.644% -0.636% -0.638%
Radial leak -0.324% -0.315% -0.33% -0.310% -0.311% -0.331%Scattering -3.815% -3.728% -3.81% -3.669% -3.785% -3.452%Absorption -0.322% -0.297% -0.32% -0.371% -0.310% -0.433%Production -0.022% -0.018% -4.11% -4.040% -0.017% -0.250%
Total -3.135% -3.033% -3.13% -3.085% -3.131% -2.666%
Table 3.8.1. Doppler reactivity worth at the fourth cycle (reference core)(%∆k/kk′)
JAERI CEA JNC MITSUBISHI TOSHIBA IPPEBOC -2.40E-01 -2.57E-01 -2.53E-01 -2.58E-01 -2.61E-01 -2.50E-01EOC -2.26E-01 -2.46E-01 -2.36E-01 -2.39E-01 -2.44E-01 -2.31E-01
Table 3.8.2. Doppler reactivity worth at the fourth cycle (2.5% MA core)(%∆k/kk′)
JAERI CEA JNC MITSUBISHI TOSHIBA IPPEBOC -1.90E-01 -2.07E-01 -2.01E-01 -2.05E-01 -2.09E-01 -2.00E-01EOC -1.83E-01 -2.02E-01 -1.91E-01 -1.95E-01 -1.99E-01 -1.90E-01
Table 3.8.3. Doppler reactivity worth at the fourth cycle (5% MA core)(%∆k/kk′)
JAERI CEA JNC MITSUBISHI TOSHIBA IPPEBOC -1.52E-01 -1.67E-01 -1.59E-01 -1.63E-01 -1.67E-01 -1.61E-01EOC -1.49E-01 -1.66E-01 -1.56E-01 -1.59E-01 -1.63E-01 -1.56E-01
Table 3.9.1. Decay heat at different cooling times (reference core, inner core)(Unit: watt)
Time JAERI CEA JNC MITSUBISHI TOSHIBA IPPE0 sec 4.972E+05 4.596E+05 3.96E+051 day 5.034E+04 4.515E+04 4.47E+04
1 month 1.193E+04 1.202E+04 1.33E+043 months 7.100E+03 7.381E+03 8.43E+03
1 year 3.012E+03 2.811E+03
Table 3.9.2. Decay heat at different cooling times (2.5% MA core, inner core)(Unit: watt)
Time JAERI CEA JNC MITSUBISHI TOSHIBA IPPE0 sec 4.972E+05 3.94E+051 day 5.144E+04 4.85E+04
1 month 1.279E+04 1.70E+043 months 7.928E+03 1.15E+04
1 year 3.774E+03
51
Table 3.9.3. Decay heat at different cooling times (5% MA core, inner core)(Unit: watt)
Time JAERI CEA JNC MITSUBISHI TOSHIBA IPPE0 sec 4.983E+05 3.93E+051 day 5.262E+04 5.25E+04
1 month 1.365E+04 2.06E+043 months 8.750E+03 1.45E+04
1 year 4.518E+03
Table 3.10.1. Neutron source at different cooling times (reference core, inner core)(Unit: n/sec)
Time JAERI CEA JNC MITSUBISHI TOSHIBA IPPE0 sec 8.855E+08 8.321E+08 1.03E+091 day 8.849E+08 8.317E+08 1.03E+09
1 month 8.325E+08 7.703E+08 9.66E+083 months 7.409E+08 6.628E+08 8.60E+08
1 year 5.179E+08 4.040E+08
Table 3.10.2. Neutron source at different cooling times (2.5% MA core, inner core)(Unit: n/sec)
Time JAERI CEA JNC MITSUBISHI TOSHIBA IPPE0 sec 3.277E+09 3.03E+091 day 3.274E+09 3.02E+09
1 month 3.123E+09 2.87E+093 months 2.859E+09 2.60E+09
1 year 2.203E+09
Table 3.10.3. Neutron source at different cooling times (5% MA core, inner core)(Unit: n/sec)
Time JAERI CEA JNC MITSUBISHI TOSHIBA IPPE0 sec 5.579E+09 5.02E+091 day 5.576E+09 5.01E+09
1 month 5.330E+09 4.77E+093 months 4.901E+09 4.34E+09
1 year 3.834E+09
Table 3.11. Transmutation rate of MA*(%)
MA content JAERI CEA JNC MITSUBISHI TOSHIBA IPPE2.5% 30.1 27.5 29.3 28.9 28.0 27.65.0% 33.8 30.1 33.0 32.5 31.8 30.9
Definition of transmutation rate: Transmutation rate = (Loaded mass of MA at BOC)-(Discharged mass of MA at EOC)/(Loaded mass of MA at BOC)

52
Table 4.1. Specification of target/core transmutation system
Proton beam 1.0 GeV, 10 mABeam radius 15 cmBeam profile Uniform
Beam duct radius 15 cmTarget/core Concentric cylinders with height of 1 m
Radii 15 cm/40 cmTarget Tungsten (disk layer type)
Height 80 cm, radius 15 cmUpper region Height 26 cm, disk thickness 1.5 cmLower region Height 54 cm, disk thickness 13 cm
Fuel (90 MA-10 Pu)N (nitride pin-bundle type)Pin outside diameter 7.3 cmPin pitch 9.9 cmPin height 80 cmFuel pellet diameter 6 cmSodium bond thickness 0.35 mmCladding thickness 0.3 mm (HT9 SS)
Reflector Stainless steelInner/outer radii 40 cm/90 cmTop thickness 30 cmBottom thickness 40 cm
Sodium volume fractionTarget upper region 86%Target lower region 37.2%Core 61.7%Reflector 41.3%
Table 4.2. Actinide atom per cent fraction
Fuelburn-up
MOX1133 GWd/tHM
MOX2150 GWd/tHM
MOX1233 GWd/tHM
MOX2250 GWd/tHM
Nuclide atom %238Pu 1.5 2.7 2.6 4.1239Pu 59.3 55.3 44.5 41.9240Pu 23.7 23.9 31.0 30.5241Pu 8.7 9.5 10.7 10.6242Pu 5.5 7.1 9.5 11.3
241Am 1.3 1.5 1.7 1.7Total 100 100 100 100237Np 44.6 46.4 4.5 4.4
241Am 43.6 37.1 62.5 58.3243Am 9.7 12.7 24.3 26.1243Cm – – – –244Cm 2.1 3.8 8.7 11.3245Cm – – – –Total 100 100 100 100

53
Table 4.3. Homogenised atomic number densities (× 1024/cm3)
TARGETNuclide
Upper region Lower region182W 2.688E-03 1.075E-02183W 1.453E-03 5.814E-03184W 3.103E-03 1.241E-02186W 2.859E-03 1.144E-0223Na 1.821E-02 7.806E-03
FUELNuclide MOX11
33 GWd/tHMMOX21
50 GWd/tHMMOX12
33 GWd/tHMMOX22
50 GWd/tHM238Pu 1.251E-05 2.252E-05 2.169E-05 3.420E-05239Pu 4.947E-04 4.613E-04 3.712E-04 3.495E-04240Pu 1.977E-04 1.994E-04 2.586E-04 2.544E-04241Pu 7.257E-05 7.924E-05 8.925E-05 8.842E-05242Pu 4.588E-05 5.922E-05 7.924E-05 9.426E-05
241Am 1.084E-05 1.251E-05 1.418E-05 1.418E-05237Np 3.353E-03 3.488E-03 3.383E-04 3.308E-04
241Am 3.278E-03 2.789E-03 4.699E-03 4.375E-03243Am 7.293E-04 9.548E-04 1.827E-03 1.962E-03244Cm 1.579E-04 2.857E-04 6.541E-04 8.495E-04
15N 8.352E-0323Na 1.296E-02182W 2.735E-06183W 1.555E-06184W 3.092E-06186W 2.868E-06
12C 5.626E-05natSi 3.671E-0551V 2.094E-05
natCr 8.206E-0455Mn 3.107E-05natFe 5.391E-03natNi 3.029E-05
natMo 3.781E-05
Nuclide REFLECTOR23Na 8.673E-03natCr 8.599E-03
55Mn 5.061E-04natFe 3.424E-02natNi 6.000E-03
natMo 1.265E-03
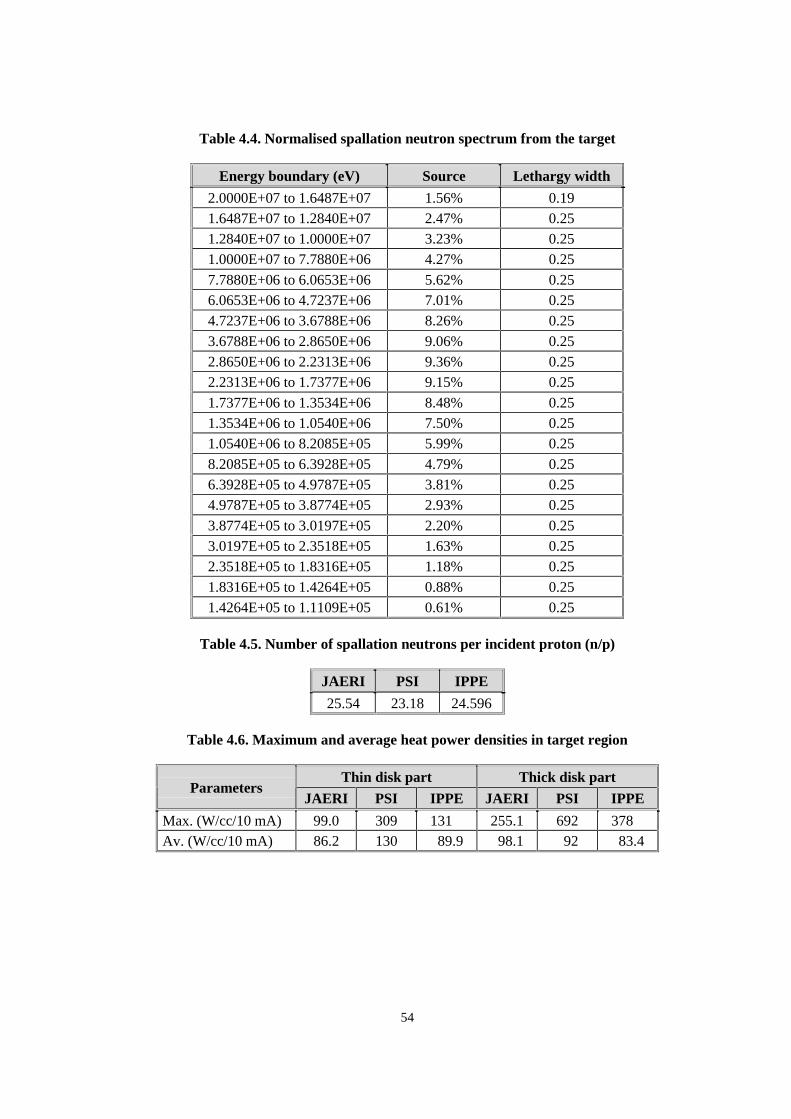
54
Table 4.4. Normalised spallation neutron spectrum from the target
Energy boundary (eV) Source Lethargy width
2.0000E+07 to 1.6487E+07 1.56% 0.191.6487E+07 to 1.2840E+07 2.47% 0.251.2840E+07 to 1.0000E+07 3.23% 0.251.0000E+07 to 7.7880E+06 4.27% 0.25
7.7880E+06 to 6.0653E+06 5.62% 0.256.0653E+06 to 4.7237E+06 7.01% 0.254.7237E+06 to 3.6788E+06 8.26% 0.25
3.6788E+06 to 2.8650E+06 9.06% 0.252.8650E+06 to 2.2313E+06 9.36% 0.252.2313E+06 to 1.7377E+06 9.15% 0.25
1.7377E+06 to 1.3534E+06 8.48% 0.251.3534E+06 to 1.0540E+06 7.50% 0.251.0540E+06 to 8.2085E+05 5.99% 0.25
8.2085E+05 to 6.3928E+05 4.79% 0.256.3928E+05 to 4.9787E+05 3.81% 0.254.9787E+05 to 3.8774E+05 2.93% 0.25
3.8774E+05 to 3.0197E+05 2.20% 0.253.0197E+05 to 2.3518E+05 1.63% 0.252.3518E+05 to 1.8316E+05 1.18% 0.25
1.8316E+05 to 1.4264E+05 0.88% 0.251.4264E+05 to 1.1109E+05 0.61% 0.25
Table 4.5. Number of spallation neutrons per incident proton (n/p)
JAERI PSI IPPE
25.54 23.18 24.596
Table 4.6. Maximum and average heat power densities in target region
Thin disk part Thick disk partParameters
JAERI PSI IPPE JAERI PSI IPPE
Max. (W/cc/10 mA) 99.0 309 131.0 255.1 692 378.0Av. (W/cc/10 mA) 86.2 130 089.9 098.1 092 083.4

55
Table 4.7. Nuclear characteristics results
MOX11 MOX12Parameters
JAERI PSI IPPE JAERI PSI IPPE
keff 0.8993 0.8966 0.9308 0.9180 0.9205 0.9533
Sodium void reactivity(%∆ k/kk′) 7.16 7.31 4.65 7.30 7.44 4.99
Average neutron energy(MeV)
0.827 0.828 – 0.809 0.838 –
Average neutron flux(1015 n/cm2/s/10 mA)
2.39 1.58 – 2.92 1.99 –
Maximum heat power density(10-4 W/cc/10 mA)
6.03 4.72 – 6.66 5.42 –
Average heat power density(10-4 W/cc/10 mA)
3.73 2.75 – 4.22 3.31 –
Table 4.8. Fission and capture rate (initial core)
Fission CaptureMOX11
JAERI PSI IPPE JAERI PSI IPPE237Np 0.3699 0.3707 0.3671 0.4151 0.3616 0.3966238Pu 0.0037 0.0032 0.0030 0.0006 0.0005 0.0006239Pu 0.1599 0.1639 0.1519 0.0170 0.0153 0.0176240Pu 0.0223 0.0238 0.0217 0.0090 0.0076 0.0089241Pu 0.0279 0.0278 0.0262 0.0030 0.0037 0.0025242Pu 0.0037 0.0043 0.0039 0.0018 0.0015 0.0017
241Am 0.3346 0.3256 0.3441 0.4484 0.5029 0.4990243Am 0.0576 0.0583 0.0615 0.0889 0.0902 0.0541244Cm 0.0223 0.0221 0.0206 0.0088 0.0071 0.008
Structural material 0.0000 0.0000 0.0000 0.0076 0.0097 0.011
Fission CaptureMOX12
JAERI PSI IPPE JAERI PSI IPPE237Np 0.0395 0.0398 0.0385 0.0429 0.0348 0.0421238Pu 0.0066 0.0059 0.0055 0.0011 0.0008 0.0010239Pu 0.1301 0.1286 0.1206 0.0131 0.0110 0.0138240Pu 0.0313 0.0331 0.0296 0.0120 0.0094 0.0120241Pu 0.0379 0.0355 0.0342 0.0038 0.0044 0.0032242Pu 0.0082 0.0079 0.0071 0.0030 0.0024 0.0031
241Am 0.5041 0.4962 0.5148 0.6541 0.6858 0.7387243Am 0.1499 0.1554 0.1609 0.2260 0.2145 0.1408244Cm 0.0939 0.0976 0.0889 0.0363 0.0277 0.0338
Structural material 0.0000 0.0000 0.0000 0.0077 0.0092 0.0115

56
Table 4.9. Fission and capture rate (200 GWd/tHM burn-up)
Fission CaptureMOX11
JAERI PSI JAERI PSI237Np 0.2202 0.2354 0.3284 0.3104238Np 0.0020 0.0063 0.0003 0.0002238Pu 0.2352 0.2096 0.0605 0.0392239Pu 0.1038 0.1015 0.0140 0.0121240Pu 0.0213 0.0219 0.0111 0.0093241Pu 0.0189 0.0180 0.0025 0.0029242Pu 0.0140 0.0161 0.0077 0.0075
241Am 0.1898 0.1859 0.3483 0.3847242Am 0.0007 0.0021 0.0001 0.0003
242mAm 0.0581 0.0551 0.0073 0.0061243Am 0.0360 0.0380 0.0783 0.0798242Cm 0.0474 0.0577 0.0125 0.0167243Cm 0.0067 0.0063 0.0006 0.0003244Cm 0.0355 0.0368 0.0195 0.0156245Cm 0.0104 0.0084 0.0010 0.0007
Fission products 0 0 0.0976 0.1051Structural material 0 0 0.0088 0.0090
Table 4.10. PSI results (MOX11)
Burn-up (GWd/tHM)Nuclide
0 10 50 100 150 200keff 8.966E-01 9.025E-01 9.112E-01 9.171E-01 9.183E-01 9.149E-01
234U 0.000E00 1.193E-08 2.329E-07 8.545E-07 1.754E-06 2.820E-06235U 0.000E00 7.536E-10 6.296E-09 2.684E-08 6.944E-08 1.360E-07236U 0.000E00 4.187E-08 1.972E-07 3.682E-07 5.188E-07 6.529E-07
237Np 3.353E-03 3.280E-03 3.001E-03 2.683E-03 2.392E-03 2.124E-03238Np 0.000E00 1.049E-05 1.245E-05 1.222E-05 1.180E-05 1.139E-05236Pu 0.000E00 2.676E-08 1.185E-07 2.062E-07 2.719E-07 3.211E-07238Pu 1.251E-05 4.583E-05 2.220E-04 4.330E-04 6.190E-04 7.764E-04239Pu 4.947E-04 4.796E-04 4.257E-04 3.699E-04 3.239E-04 2.854E-04240Pu 1.977E-04 1.970E-04 1.940E-04 1.897E-04 1.851E-04 1.802E-04241Pu 7.257E-05 7.058E-05 6.333E-05 5.554E-05 4.884E-05 4.297E-05242Pu 4.588E-05 5.399E-05 8.637E-05 1.206E-04 1.491E-04 1.728E-04
241Am 3.289E-03 3.202E-03 2.877E-03 2.512E-03 2.184E-03 1.887E-03242Am 0.000E00 4.633E-06 4.745E-06 4.518E-06 4.297E-06 4.097E-06
242mAm 0.000E00 9.412E-06 4.109E-05 7.038E-05 9.144E-05 1.064E-04243Am 7.293E-04 7.139E-04 6.563E-04 5.914E-04 5.328E-04 4.791E-04242Cm 0.000E00 3.578E-05 1.541E-04 2.447E-04 2.991E-04 3.322E-04243Cm 0.000E00 7.891E-08 1.459E-06 4.139E-06 6.912E-06 9.447E-06244Cm 1.579E-04 1.656E-04 1.930E-04 2.208E-04 2.429E-04 2.603E-04245Cm 0.000E00 8.639E-07 4.325E-06 8.542E-06 1.253E-05 1.623E-05246Cm 0.000E00 1.547E-09 3.785E-08 1.464E-07 3.176E-07 5.444E-07
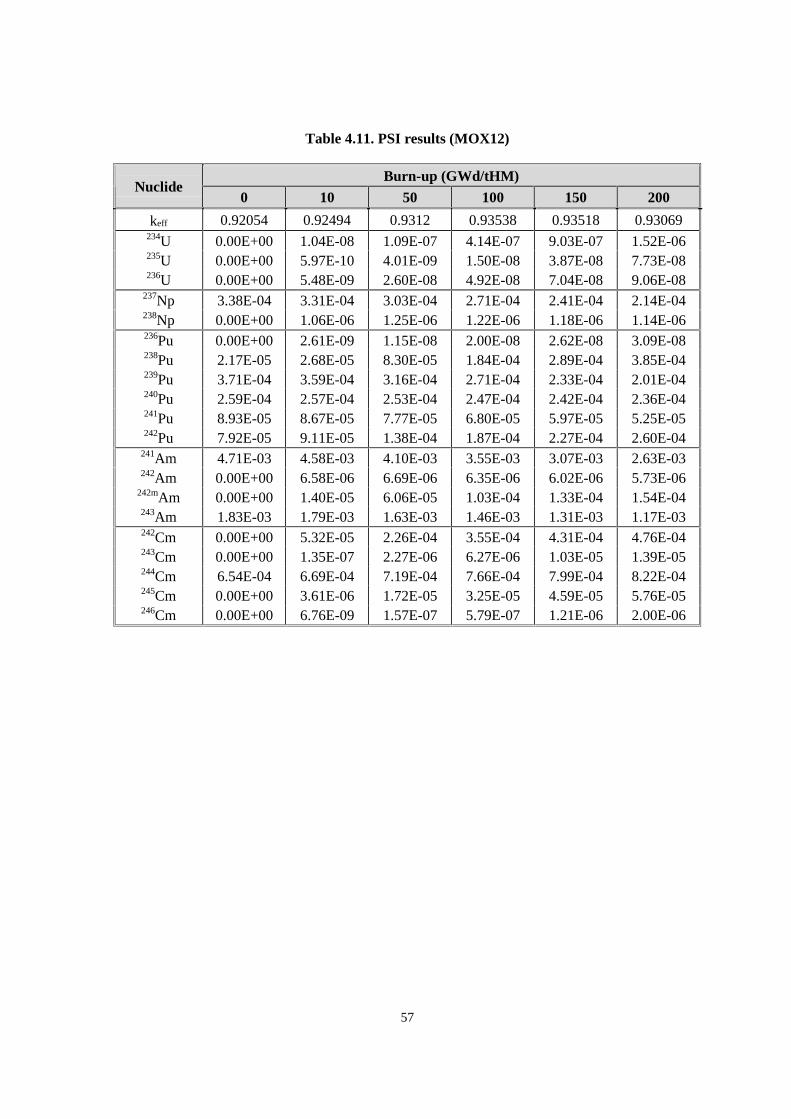
57
Table 4.11. PSI results (MOX12)
Burn-up (GWd/tHM)Nuclide
0 10 50 100 150 200
keff 0.92054 0.92494 0.9312 0.93538 0.93518 0.93069234U 0.00E+00 1.04E-08 1.09E-07 4.14E-07 9.03E-07 1.52E-06235U 0.00E+00 5.97E-10 4.01E-09 1.50E-08 3.87E-08 7.73E-08236U 0.00E+00 5.48E-09 2.60E-08 4.92E-08 7.04E-08 9.06E-08
237Np 3.38E-04 3.31E-04 3.03E-04 2.71E-04 2.41E-04 2.14E-04238Np 0.00E+00 1.06E-06 1.25E-06 1.22E-06 1.18E-06 1.14E-06236Pu 0.00E+00 2.61E-09 1.15E-08 2.00E-08 2.62E-08 3.09E-08238Pu 2.17E-05 2.68E-05 8.30E-05 1.84E-04 2.89E-04 3.85E-04239Pu 3.71E-04 3.59E-04 3.16E-04 2.71E-04 2.33E-04 2.01E-04240Pu 2.59E-04 2.57E-04 2.53E-04 2.47E-04 2.42E-04 2.36E-04241Pu 8.93E-05 8.67E-05 7.77E-05 6.80E-05 5.97E-05 5.25E-05242Pu 7.92E-05 9.11E-05 1.38E-04 1.87E-04 2.27E-04 2.60E-04
241Am 4.71E-03 4.58E-03 4.10E-03 3.55E-03 3.07E-03 2.63E-03242Am 0.00E+00 6.58E-06 6.69E-06 6.35E-06 6.02E-06 5.73E-06
242mAm 0.00E+00 1.40E-05 6.06E-05 1.03E-04 1.33E-04 1.54E-04243Am 1.83E-03 1.79E-03 1.63E-03 1.46E-03 1.31E-03 1.17E-03242Cm 0.00E+00 5.32E-05 2.26E-04 3.55E-04 4.31E-04 4.76E-04243Cm 0.00E+00 1.35E-07 2.27E-06 6.27E-06 1.03E-05 1.39E-05244Cm 6.54E-04 6.69E-04 7.19E-04 7.66E-04 7.99E-04 8.22E-04245Cm 0.00E+00 3.61E-06 1.72E-05 3.25E-05 4.59E-05 5.76E-05246Cm 0.00E+00 6.76E-09 1.57E-07 5.79E-07 1.21E-06 2.00E-06
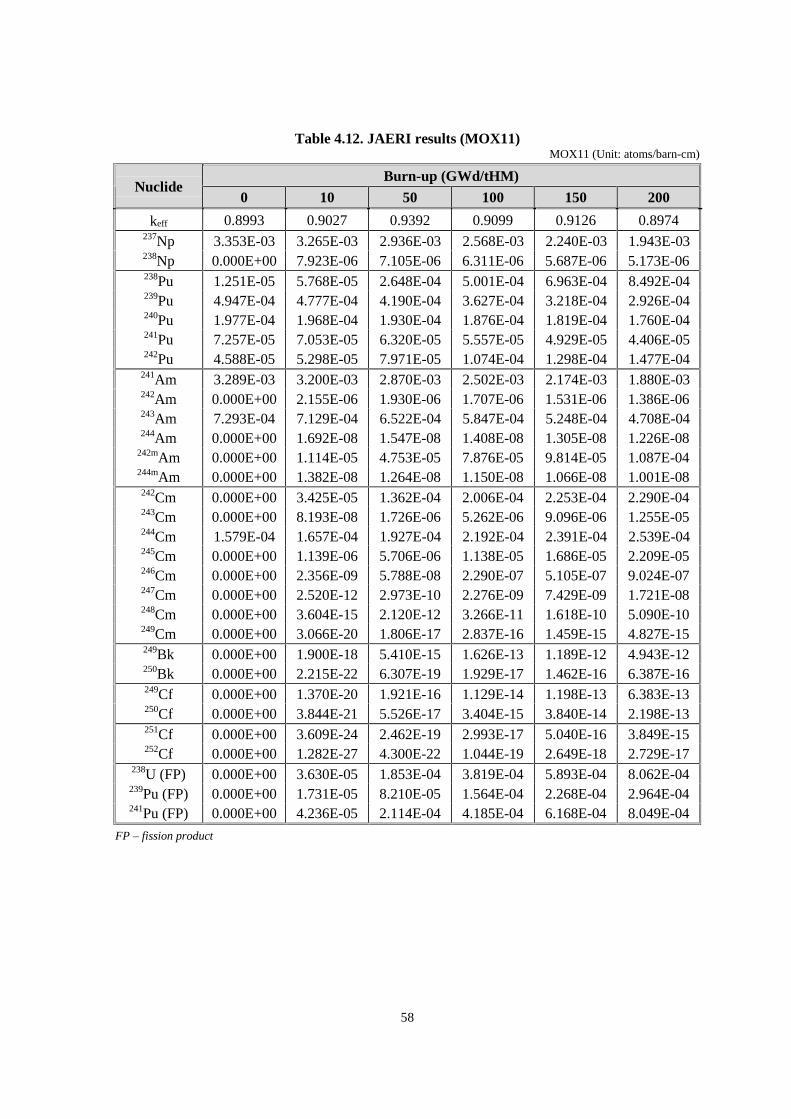
58
Table 4.12. JAERI results (MOX11)MOX11 (Unit: atoms/barn-cm)
Burn-up (GWd/tHM)Nuclide
0 10 50 100 150 200
keff 0.8993 0.9027 0.9392 0.9099 0.9126 0.8974237Np 3.353E-03 3.265E-03 2.936E-03 2.568E-03 2.240E-03 1.943E-03238Np 0.000E+00 7.923E-06 7.105E-06 6.311E-06 5.687E-06 5.173E-06238Pu 1.251E-05 5.768E-05 2.648E-04 5.001E-04 6.963E-04 8.492E-04239Pu 4.947E-04 4.777E-04 4.190E-04 3.627E-04 3.218E-04 2.926E-04240Pu 1.977E-04 1.968E-04 1.930E-04 1.876E-04 1.819E-04 1.760E-04241Pu 7.257E-05 7.053E-05 6.320E-05 5.557E-05 4.929E-05 4.406E-05242Pu 4.588E-05 5.298E-05 7.971E-05 1.074E-04 1.298E-04 1.477E-04
241Am 3.289E-03 3.200E-03 2.870E-03 2.502E-03 2.174E-03 1.880E-03242Am 0.000E+00 2.155E-06 1.930E-06 1.707E-06 1.531E-06 1.386E-06243Am 7.293E-04 7.129E-04 6.522E-04 5.847E-04 5.248E-04 4.708E-04244Am 0.000E+00 1.692E-08 1.547E-08 1.408E-08 1.305E-08 1.226E-08
242mAm 0.000E+00 1.114E-05 4.753E-05 7.876E-05 9.814E-05 1.087E-04244mAm 0.000E+00 1.382E-08 1.264E-08 1.150E-08 1.066E-08 1.001E-08242Cm 0.000E+00 3.425E-05 1.362E-04 2.006E-04 2.253E-04 2.290E-04243Cm 0.000E+00 8.193E-08 1.726E-06 5.262E-06 9.096E-06 1.255E-05244Cm 1.579E-04 1.657E-04 1.927E-04 2.192E-04 2.391E-04 2.539E-04245Cm 0.000E+00 1.139E-06 5.706E-06 1.138E-05 1.686E-05 2.209E-05246Cm 0.000E+00 2.356E-09 5.788E-08 2.290E-07 5.105E-07 9.024E-07247Cm 0.000E+00 2.520E-12 2.973E-10 2.276E-09 7.429E-09 1.721E-08248Cm 0.000E+00 3.604E-15 2.120E-12 3.266E-11 1.618E-10 5.090E-10249Cm 0.000E+00 3.066E-20 1.806E-17 2.837E-16 1.459E-15 4.827E-15249Bk 0.000E+00 1.900E-18 5.410E-15 1.626E-13 1.189E-12 4.943E-12250Bk 0.000E+00 2.215E-22 6.307E-19 1.929E-17 1.462E-16 6.387E-16249Cf 0.000E+00 1.370E-20 1.921E-16 1.129E-14 1.198E-13 6.383E-13250Cf 0.000E+00 3.844E-21 5.526E-17 3.404E-15 3.840E-14 2.198E-13251Cf 0.000E+00 3.609E-24 2.462E-19 2.993E-17 5.040E-16 3.849E-15252Cf 0.000E+00 1.282E-27 4.300E-22 1.044E-19 2.649E-18 2.729E-17
238U (FP) 0.000E+00 3.630E-05 1.853E-04 3.819E-04 5.893E-04 8.062E-04239Pu (FP) 0.000E+00 1.731E-05 8.210E-05 1.564E-04 2.268E-04 2.964E-04241Pu (FP) 0.000E+00 4.236E-05 2.114E-04 4.185E-04 6.168E-04 8.049E-04
FP – fission product
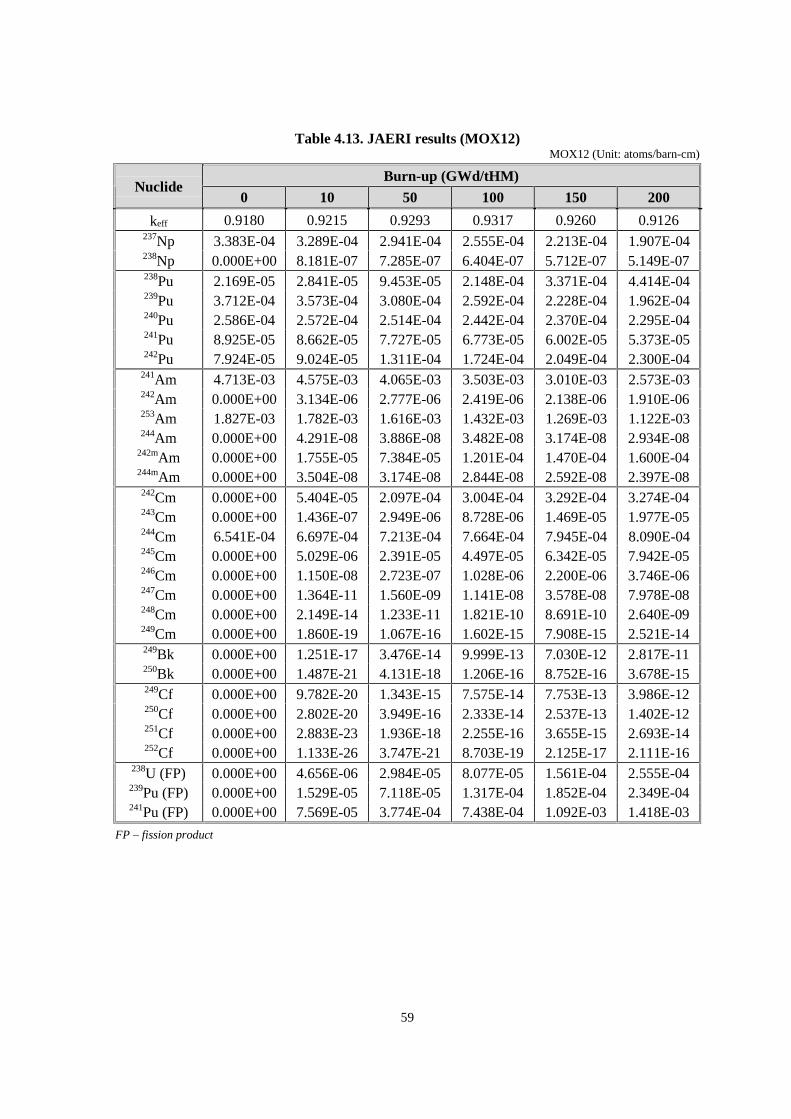
59
Table 4.13. JAERI results (MOX12)MOX12 (Unit: atoms/barn-cm)
Burn-up (GWd/tHM)Nuclide
0 10 50 100 150 200
keff 0.9180 0.9215 0.9293 0.9317 0.9260 0.9126237Np 3.383E-04 3.289E-04 2.941E-04 2.555E-04 2.213E-04 1.907E-04238Np 0.000E+00 8.181E-07 7.285E-07 6.404E-07 5.712E-07 5.149E-07238Pu 2.169E-05 2.841E-05 9.453E-05 2.148E-04 3.371E-04 4.414E-04239Pu 3.712E-04 3.573E-04 3.080E-04 2.592E-04 2.228E-04 1.962E-04240Pu 2.586E-04 2.572E-04 2.514E-04 2.442E-04 2.370E-04 2.295E-04241Pu 8.925E-05 8.662E-05 7.727E-05 6.773E-05 6.002E-05 5.373E-05242Pu 7.924E-05 9.024E-05 1.311E-04 1.724E-04 2.049E-04 2.300E-04
241Am 4.713E-03 4.575E-03 4.065E-03 3.503E-03 3.010E-03 2.573E-03242Am 0.000E+00 3.134E-06 2.777E-06 2.419E-06 2.138E-06 1.910E-06253Am 1.827E-03 1.782E-03 1.616E-03 1.432E-03 1.269E-03 1.122E-03244Am 0.000E+00 4.291E-08 3.886E-08 3.482E-08 3.174E-08 2.934E-08
242mAm 0.000E+00 1.755E-05 7.384E-05 1.201E-04 1.470E-04 1.600E-04244mAm 0.000E+00 3.504E-08 3.174E-08 2.844E-08 2.592E-08 2.397E-08242Cm 0.000E+00 5.404E-05 2.097E-04 3.004E-04 3.292E-04 3.274E-04243Cm 0.000E+00 1.436E-07 2.949E-06 8.728E-06 1.469E-05 1.977E-05244Cm 6.541E-04 6.697E-04 7.213E-04 7.664E-04 7.945E-04 8.090E-04245Cm 0.000E+00 5.029E-06 2.391E-05 4.497E-05 6.342E-05 7.942E-05246Cm 0.000E+00 1.150E-08 2.723E-07 1.028E-06 2.200E-06 3.746E-06247Cm 0.000E+00 1.364E-11 1.560E-09 1.141E-08 3.578E-08 7.978E-08248Cm 0.000E+00 2.149E-14 1.233E-11 1.821E-10 8.691E-10 2.640E-09249Cm 0.000E+00 1.860E-19 1.067E-16 1.602E-15 7.908E-15 2.521E-14249Bk 0.000E+00 1.251E-17 3.476E-14 9.999E-13 7.030E-12 2.817E-11250Bk 0.000E+00 1.487E-21 4.131E-18 1.206E-16 8.752E-16 3.678E-15249Cf 0.000E+00 9.782E-20 1.343E-15 7.575E-14 7.753E-13 3.986E-12250Cf 0.000E+00 2.802E-20 3.949E-16 2.333E-14 2.537E-13 1.402E-12251Cf 0.000E+00 2.883E-23 1.936E-18 2.255E-16 3.655E-15 2.693E-14252Cf 0.000E+00 1.133E-26 3.747E-21 8.703E-19 2.125E-17 2.111E-16
238U (FP) 0.000E+00 4.656E-06 2.984E-05 8.077E-05 1.561E-04 2.555E-04239Pu (FP) 0.000E+00 1.529E-05 7.118E-05 1.317E-04 1.852E-04 2.349E-04241Pu (FP) 0.000E+00 7.569E-05 3.774E-04 7.438E-04 1.092E-03 1.418E-03
FP – fission product

60
Table 4.14. IPPE results (MOX11)Burn-up: GWd/tHM, Nuclide: atom/b/cm
Burn-up (GWd/tHM)Nuclide
0 10 50 100 150 200
keff 0.9308 0.9317 0.9391 0.9418 0.9383 0.9299238Pu 1.251E-05 5.225E-05 2.305E-04 4.378E-04 6.123E-04 7.512E-04239Pu 4.947E-04 4.782E-04 4.209E-04 3.656E-04 3.247E-04 2.945E-04240Pu 1.977E-04 1.969E-04 1.933E-04 1.884E-04 1.834E-04 1.784E-04241Pu 7.257E-05 7.060E-05 6.358E-05 5.645E-05 5.073E-05 4.610E-05242Pu 4.588E-05 5.349E-05 8.126E-05 1.093E-04 1.313E-04 1.485E-04
241Am 3.289E-03 3.198E-03 2.866E-03 2.509E-03 2.208E-03 1.951E-03237Np 3.353E-03 3.272E-03 2.973E-03 2.648E-03 2.366E-03 2.123E-03243Am 7.293E-04 7.173E-04 6.727E-04 6.235E-04 5.804E-04 5.423E-04244Cm 1.579E-04 1.608E-04 1.706E-04 1.802E-04 1.873E-04 1.928E-04
242mAm 0.000E+00 8.953E-06 3.742E-05 6.082E-05 7.481E-05 8.239E-05242Cm 0.000E+00 3.608E-05 1.398E-04 2.036E-04 2.275E-04 2.310E-04243Cm 0.000E+00 7.434E-08 1.495E-06 4.488E-06 7.678E-06 1.053E-05245Cm 0.000E+00 9.213E-07 4.256E-06 7.860E-06 1.093E-05 1.354E-05
Fission product 0.000E+00 0.000E+00 4.032E-04 8.690E-04 1.305E-03 1.712E-03
Table 4.15. IPPE results (MOX12)Burn-up: GWd/tHM, Nuclide: atom/b/cm
Burn-up (GWd/tHM)Nuclide
0 10 50 100 150 200
keff 0.9533 0.9537 0.9568 0.9551 0.9481 0.9372238Pu 2.169E-05 2.706E-05 8.117E-05 1.815E-04 2.863E-04 3.810E-04239Pu 3.712E-04 3.592E-04 3.166E-04 2.742E-04 2.417E-04 2.170E-04240Pu 2.586E-04 2.575E-04 2.529E-04 2.470E-04 2.415E-04 2.360E-04241Pu 8.925E-05 8.698E-05 7.891E-05 7.074E-05 6.419E-05 5.889E-05242Pu 7.924E-05 8.973E-05 1.280E-04 1.665E-04 1.966E-04 2.203E-04
241Am 4.713E-03 4.586E-03 4.125E-03 3.633E-03 3.216E-03 2.861E-03237Np 3.383E-04 3.307E-04 3.026E-04 2.720E-04 2.456E-04 2.227E-04243Am 1.827E-03 1.798E-03 1.689E-03 1.568E-03 1.462E-03 1.368E-03244Cm 6.541E-04 6.565E-04 6.628E-04 6.668E-04 6.675E-04 6.660E-04
242mAm 0.000E+00 1.260E-05 5.271E-05 8.593E-05 1.061E-04 1.176E-04242Cm 0.000E+00 5.076E-05 1.980E-04 2.912E-04 3.286E-04 3.371E-04243Cm 0.000E+00 1.038E-07 2.089E-06 6.284E-06 1.080E-05 1.489E-05
Fission product 0.000E+00 0.000E+00 3.742E-04 8.076E-04 1.211E-03 1.585E-03

61
FIGURES

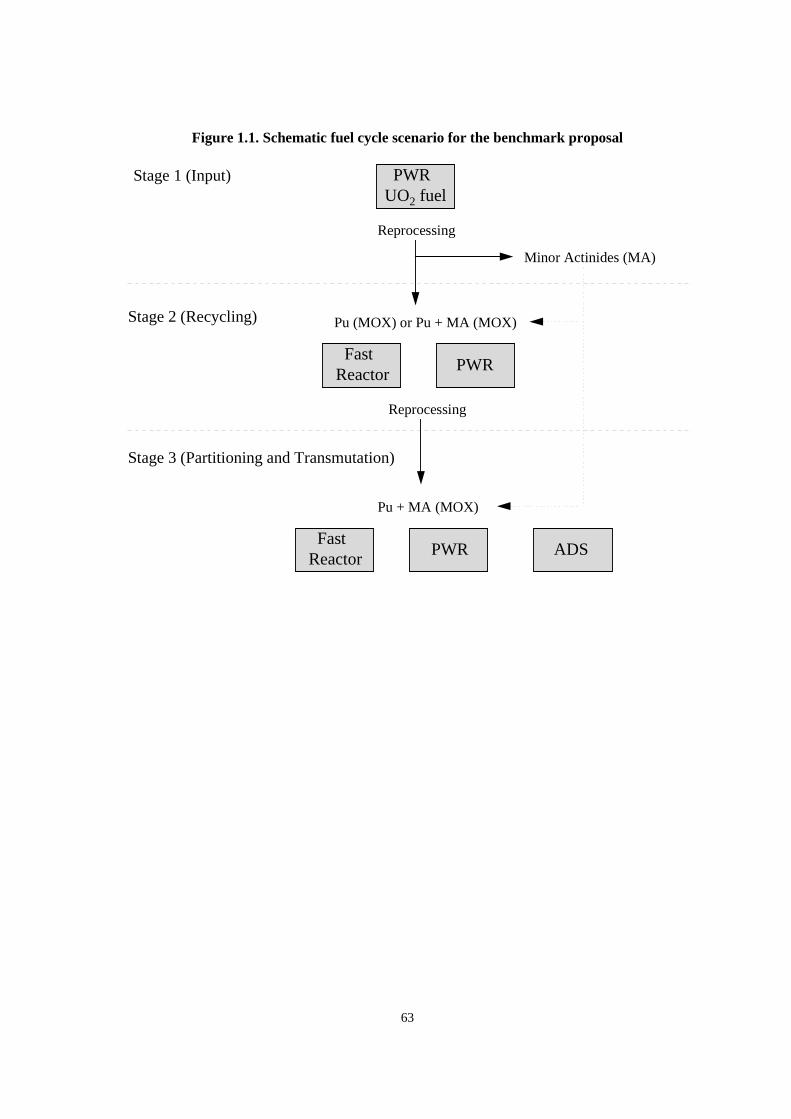
63
Figure 1.1. Schematic fuel cycle scenario for the benchmark proposal
Stage 1 (Input)
Stage 2 (Recycling)
Stage 3 (Partitioning and Transmutation)
PWR UO2 fuel
Fast Reactor
PWR
Fast Reactor
PWR ADS
Pu (MOX) or Pu + MA (MOX)
Reprocessing
Minor Actinides (MA)
Reprocessing
Pu + MA (MOX)
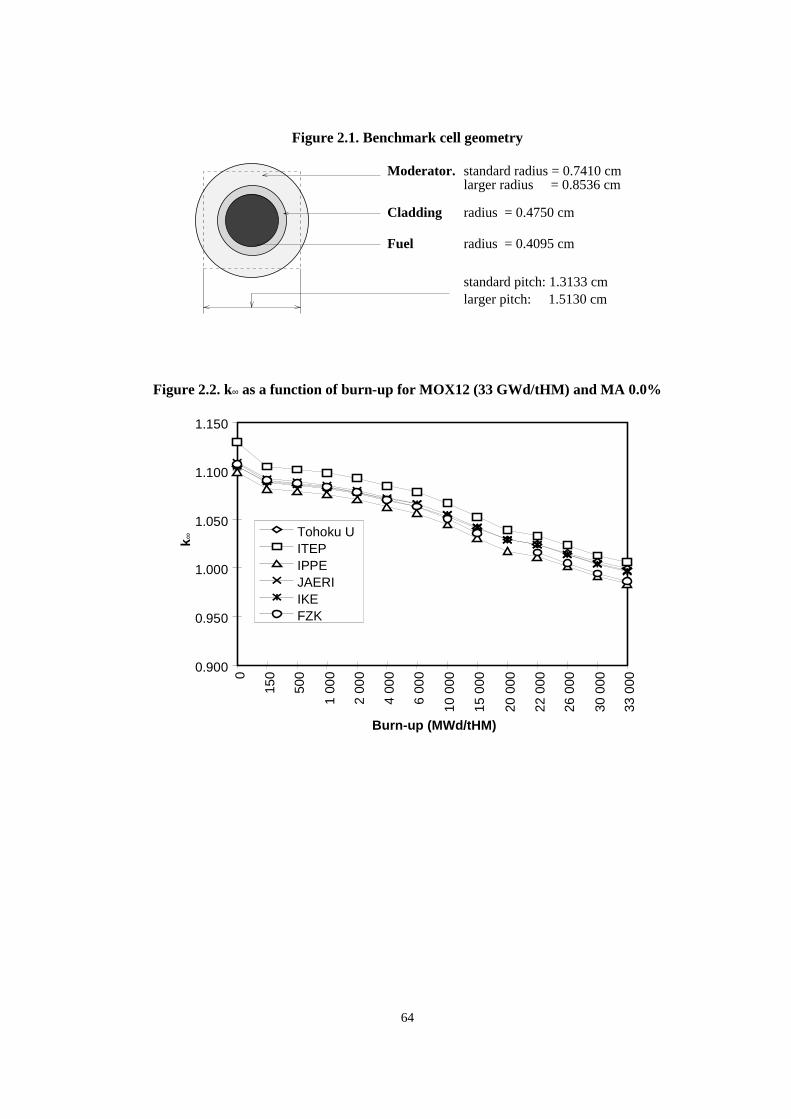
64
Figure 2.1. Benchmark cell geometry
Cladding
Fuel
Moderator. standard radius = 0.7410 cm
radius = 0.4750 cm
radius = 0.4095 cm
larger radius = 0.8536 cm
standard pitch: 1.3133 cmlarger pitch: 1.5130 cm
Figure 2.2. k∞ as a function of burn-up for MOX12 (33 GWd/tHM) and MA 0.0%
0.900
0.950
1.000
1.050
1.100
1.150
0
150
500
1 00
0
2 00
0
4 00
0
6 00
0
10 0
00
15 0
00
20 0
00
22 0
00
26 0
00
30 0
00
33 0
00
Tohoku UITEPIPPEJAERIIKEFZK
Burn-up (MWd/tHM)
k ∞
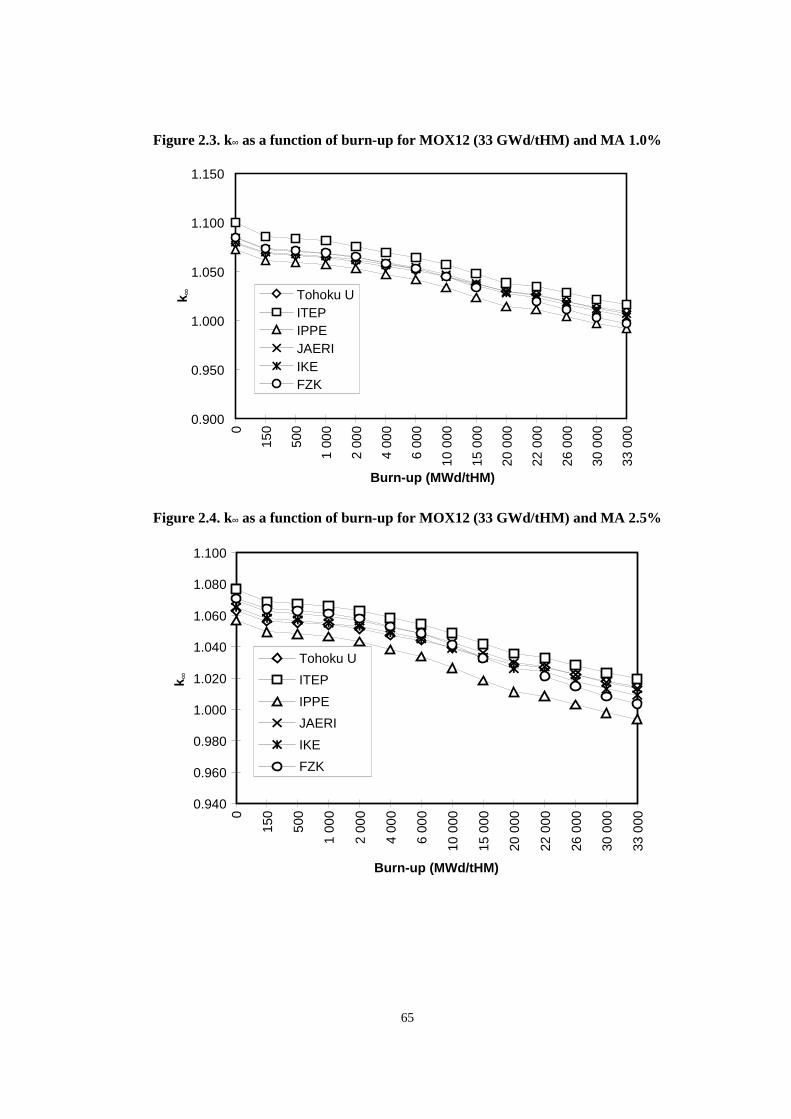
65
Figure 2.3. k∞ as a function of burn-up for MOX12 (33 GWd/tHM) and MA 1.0%
0.900
0.950
1.000
1.050
1.100
1.150
0
150
500
1 00
0
2 00
0
4 00
0
6 00
0
10 0
00
15 0
00
20 0
00
22 0
00
26 0
00
30 0
00
33 0
00
Tohoku UITEPIPPEJAERIIKEFZK
Burn-up (MWd/tHM)
k ∞
Figure 2.4. k∞ as a function of burn-up for MOX12 (33 GWd/tHM) and MA 2.5%
0.940
0.960
0.980
1.000
1.020
1.040
1.060
1.080
1.100
0
150
500
1 00
0
2 00
0
4 00
0
6 00
0
10 0
00
15 0
00
20 0
00
22 0
00
26 0
00
30 0
00
33 0
00
Tohoku U
ITEP
IPPE
JAERI
IKE
FZK
Burn-up (MWd/tHM)
k ∞
66
Figure 2.5. k∞ as a function of burn-up for MOX22 (50 GWd/tHM) and MA 0.0%
0.900
0.920
0.940
0.960
0.980
1.000
1.020
1.040
1.060
1.080
1.100
1.120
1.140
1.160
1.180
0
500
2 00
0
6 00
0
15 0
00
22 0
00
30 0
00
33 3
00
40 0
00
50 0
00
Tohoku U
ITEP
IPPE
JAERI
IKE
FZK
Burn-up (MWd/tHM)
k ∞
Figure 2.6. k∞ as a function of burn-up for MOX22 (50 GWd/tHM) and MA 1.0%
0.900
0.920
0.940
0.960
0.980
1.000
1.020
1.040
1.060
1.080
1.100
1.120
1.140
0
500
2 00
0
6 00
0
15 0
00
22 0
00
30 0
00
33 3
00
40 0
00
50 0
00
Tohoku U
ITEP
IPPE
JAERI
IKE
FZK
Burn-up (MWd/tHM)
k ∞

67
Figure 2.7. k∞ as a function of burn-up for MOX22 (50 GWd/tHM) and MA 2.5%
0.900
0.950
1.000
1.050
1.100
1.150
0
500
2 00
0
6 00
0
15 0
00
22 0
00
30 0
00
33 3
00
40 0
00
50 0
00
Tohoku U
ITEP
IPPE
JAERI
IKE
FZK
Burn-up (MWd/tHM)
k ∞
Figure 2.8. k∞ as a function of burn-up for MOX22 (50 GWd/tHM) wide lattice and MA 0.0%
0.900
0.950
1.000
1.050
1.100
1.150
1.200
1.250
0
500
2 00
0
6 00
0
15 0
00
22 0
00
30 0
00
33 3
00
40 0
00
50 0
00
Burn-up (MWd/tHM)
k ∞ Tohoku U
ITEP
JAERI
IKE
FZK
68
Figure 2.9. k∞ as a function of burn-up for MOX22 (50 GWd/tHM) wide lattice and MA 1.0%
0.900
0.950
1.000
1.050
1.100
1.150
1.200
0
500
2 00
0
6 00
0
15 0
00
22 0
00
30 0
00
33 3
00
40 0
00
50 0
00
Burn-up (MWd/tHM)
k ∞
Tohoku U
ITEP
JAERI
IKE
FZK
Figure 2.10. k∞ as a function of burn-up for MOX22 (50 GWd/tHM) wide lattice and MA 2.5%
0.900
0.950
1.000
1.050
1.100
1.150
0
500
2 00
0
6 00
0
15 0
00
22 0
00
30 0
00
33 3
00
40 0
00
50 0
00
Burn-up (MWd/tHM)
k ∞ Tohoku UITEPJAERIIKEFZK
69
Figure 2.11. Atomic number density of 237Np as a functionof burn-up for MOX22 (50 GWd/tHM) and MA 2.5%
0.00E+00
5.00E-06
1.00E-05
1.50E-05
2.00E-05
2.50E-05
3.00E-05
0
500
2 00
0
6 00
0
15 0
00
22 0
00
30 0
00
33 3
00
40 0
00
50 0
00
Tohoku U
ITEP
IPPE
JAERI
IKE
FZK
Figure 2.12. Atomic number density of 241Pu as a functionof burn-up for MOX22 (50 GWd/tHM) and MA 2.5%
4.70E-04
4.75E-04
4.80E-04
4.85E-04
4.90E-04
4.95E-04
5.00E-04
5.05E-04
5.10E-04
5.15E-04
5.20E-04
5.25E-04
0
500
2 00
0
6 00
0
15 0
00
22 0
00
30 0
00
33 3
00
40 0
00
50 0
00
Tohoku U
ITEP
IPPE
JAERI
IKE
FZK
70
Figure 2.13. Atomic number density of 242Pu as a functionof burn-up for MOX22 (50 GWd/tHM) and MA 2.5%
5.00E-04
5.05E-04
5.10E-04
5.15E-04
5.20E-04
5.25E-04
5.30E-04
5.35E-04
0
500
2 00
0
6 00
0
15 0
00
22 0
00
30 0
00
33 3
00
40 0
00
5000
0
Tohoku U
ITEP
IPPE
JAERI
IKE
FZK
Figure 2.14. Atomic number density of 242mAm as a functionof burn-up for MOX22 (50 GWd/tHM) and MA 2.5%
0.00E+00
2.00E-06
4.00E-06
6.00E-06
8.00E-06
1.00E-05
1.20E-05
0
500
2 00
0
6 00
0
15 0
00
22 0
00
30 0
00
33 3
00
40 0
00
50 0
00
Tohoku U
ITEP
IPPE
JAERI
IKE
FZK
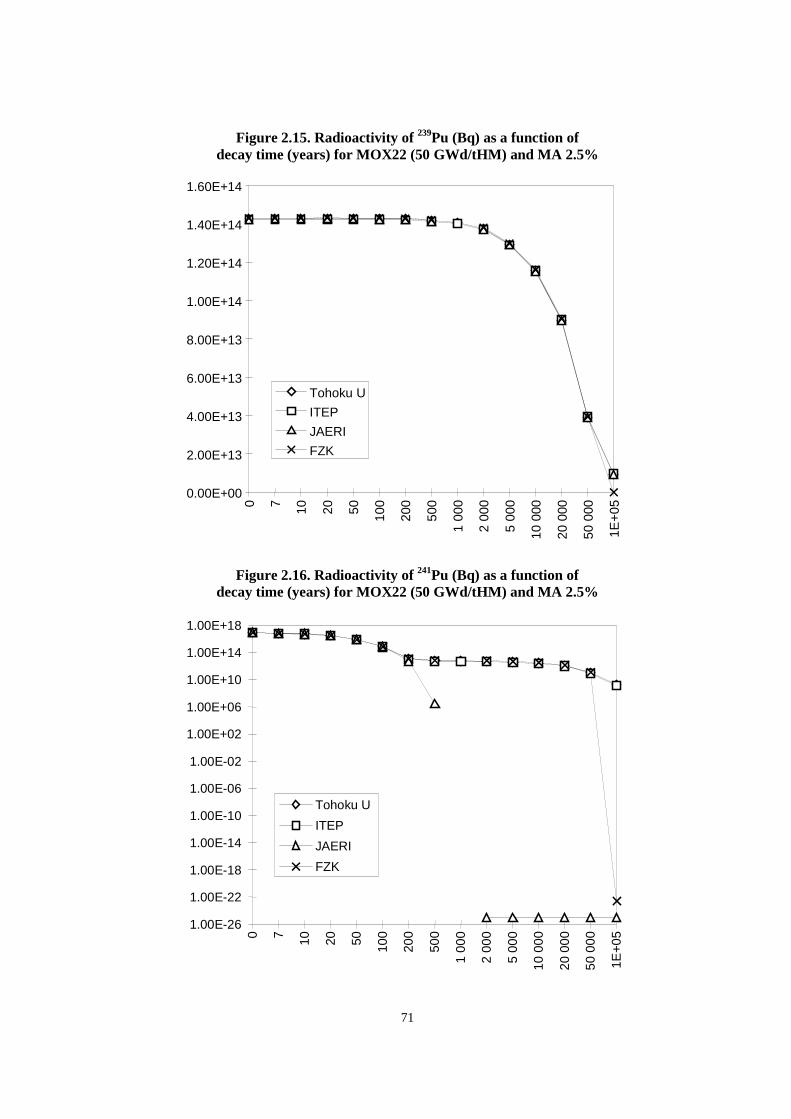
71
Figure 2.15. Radioactivity of 239Pu (Bq) as a function ofdecay time (years) for MOX22 (50 GWd/tHM) and MA 2.5%
0.00E+00
2.00E+13
4.00E+13
6.00E+13
8.00E+13
1.00E+14
1.20E+14
1.40E+14
1.60E+14
0 7 10 20 50 100
200
500
1 00
0
2 00
0
5 00
0
10 0
00
20 0
00
50 0
00
1E+
05
Tohoku U
ITEP
JAERI
FZK
Figure 2.16. Radioactivity of 241Pu (Bq) as a function ofdecay time (years) for MOX22 (50 GWd/tHM) and MA 2.5%
1.00E-26
1.00E-22
1.00E-18
1.00E-14
1.00E-10
1.00E-06
1.00E-02
1.00E+02
1.00E+06
1.00E+10
1.00E+14
1.00E+18
0 7 10 20 50 100
200
500
1 00
0
2 00
0
5 00
0
10 0
00
20 0
00
50 0
00
1E+0
5
Tohoku U
ITEP
JAERI
FZK
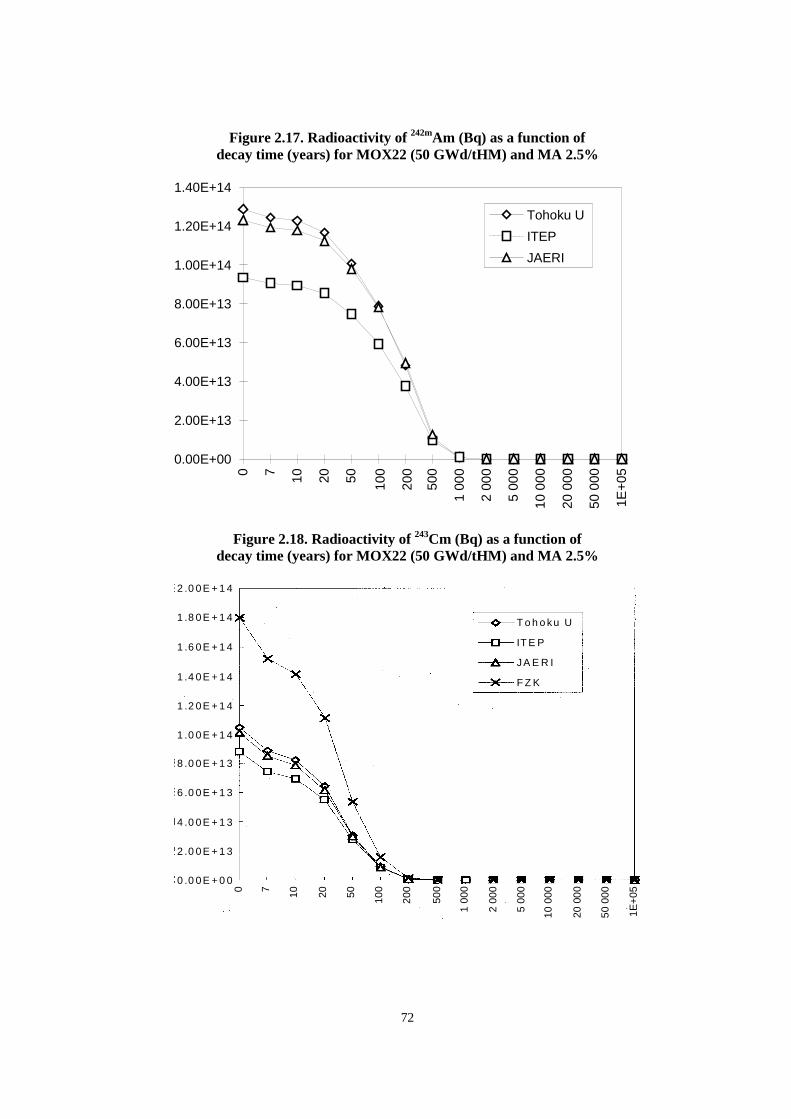
72
Figure 2.17. Radioactivity of 242mAm (Bq) as a function ofdecay time (years) for MOX22 (50 GWd/tHM) and MA 2.5%
0.00E+00
2.00E+13
4.00E+13
6.00E+13
8.00E+13
1.00E+14
1.20E+14
1.40E+14
0 7 10 20 50 100
200
500
1 00
0
2 00
0
5 00
0
10 0
00
20 0
00
50 0
00
1E+
05
Tohoku U
ITEP
JAERI
Figure 2.18. Radioactivity of 243Cm (Bq) as a function ofdecay time (years) for MOX22 (50 GWd/tHM) and MA 2.5%
0 7 10 20 50 100
200
500
1 00
0
2 00
0
5 00
0
10 0
00
20 0
00
50 0
00
2 .0 0 E + 1 4
1 .8 0 E + 1 4
1 .6 0 E + 1 4
1 .4 0 E + 1 4
1 .2 0 E + 1 4
1 .0 0 E + 1 4
8 .0 0 E + 1 3
6 .0 0 E + 1 3
4 .0 0 E + 1 3
2 .0 0 E + 1 3
0 .0 0 E + 0 0
T o h o ku U
IT E P
JA E R I
F Z K
1E+
05
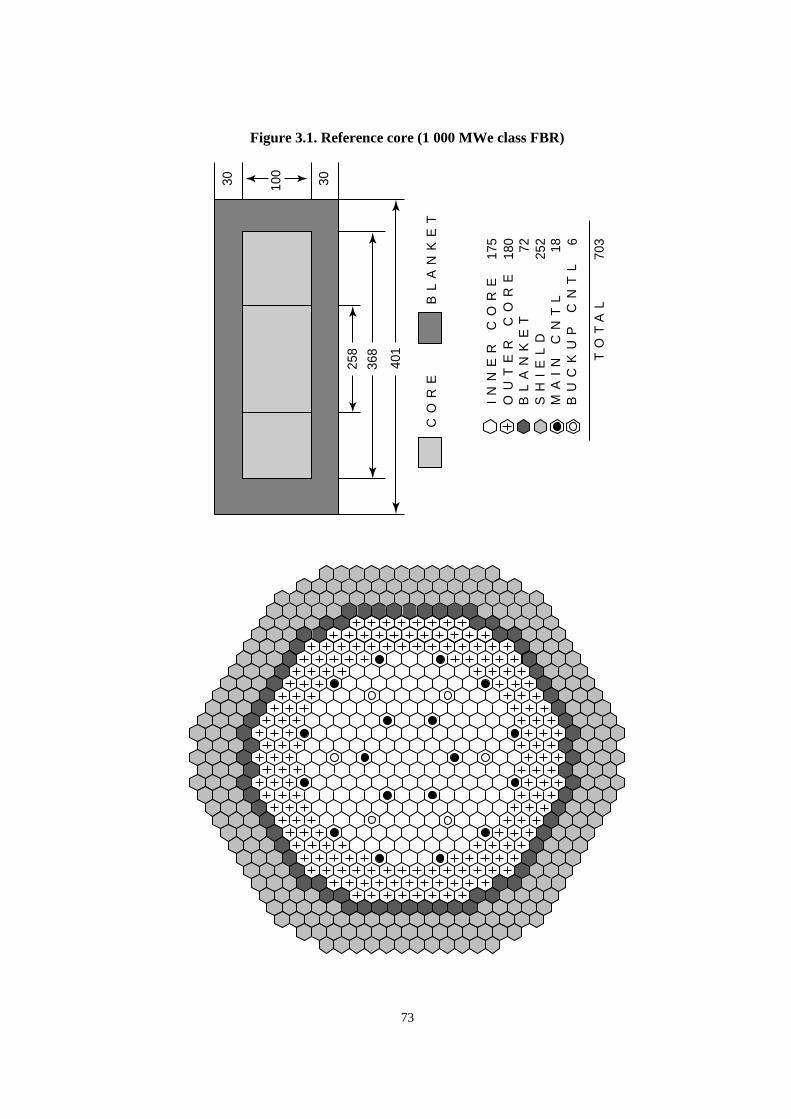
73
Figure 3.1. Reference core (1 000 MWe class FBR)
100
30 30
258
368
401
CO
RE
BL
AN
KE
T
IN
NE
R
CO
RE
OU
TE
R
CO
RE
BL
AN
KE
TS
HI
EL
DM
AI
N
CN
TL
BU
CK
UP
C
NT
L
TO
TA
L
175
180 72 252 18 6
703
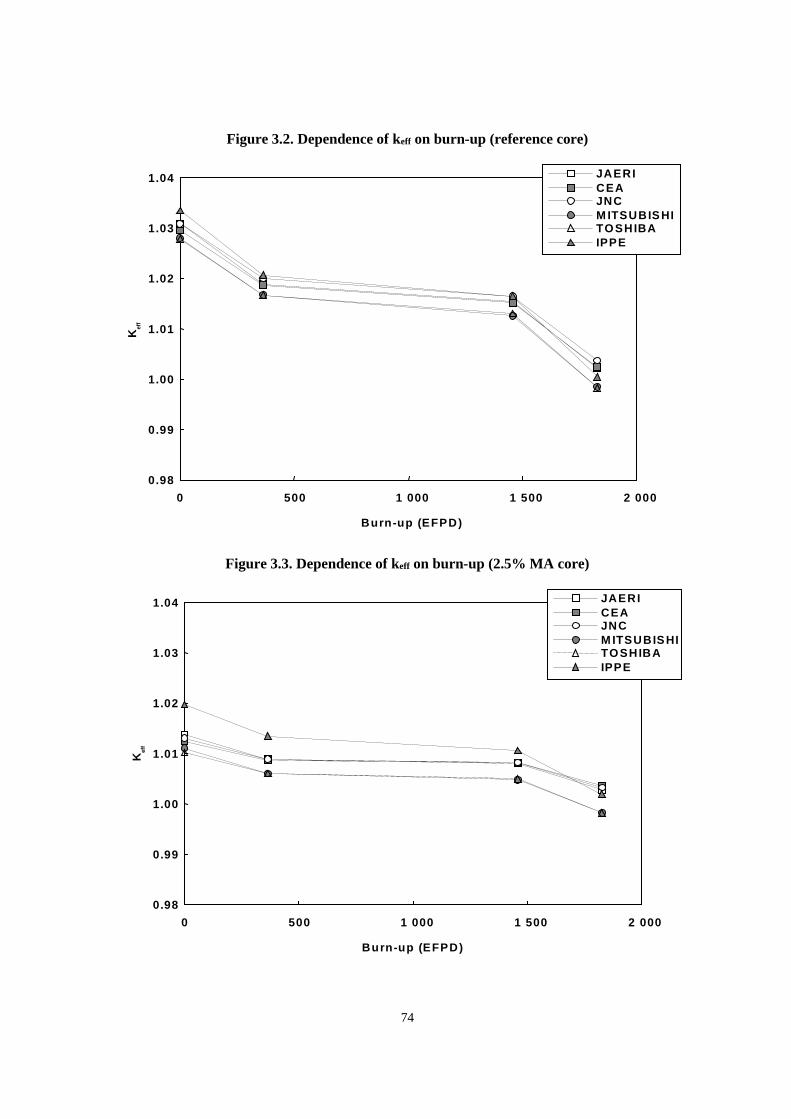
74
Figure 3.2. Dependence of keff on burn-up (reference core)
0.98
0.99
1.00
1.01
1.02
1.03
1.04
0 500 1 000 1 500 2 000
Burn-up (EFPD)
Kef
f
JAERICEAJNCM ITSUBISHITOSHIBAIPPE
Figure 3.3. Dependence of keff on burn-up (2.5% MA core)
0.98
0.99
1.00
1.01
1.02
1.03
1.04
0 500 1 000 1 500 2 000
Burn-up (EFPD)
Kef
f
JAERICEAJNCM ITSUBISHITOSHIBAIPPE
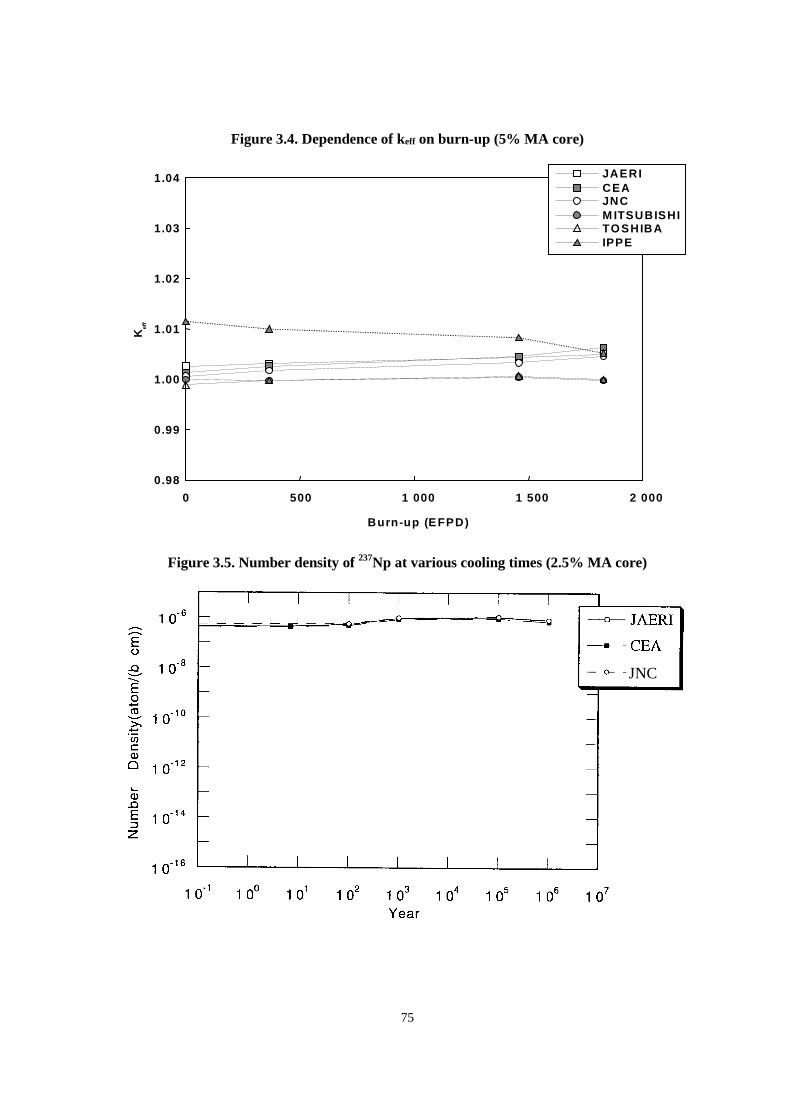
75
Figure 3.4. Dependence of keff on burn-up (5% MA core)
0.98
0.99
1.00
1.01
1.02
1.03
1.04
0 500 1 000 1 500 2 000
Burn-up (EFPD)
Kef
f
JAERICEAJNCM ITSUBISHITOSHIBAIPPE
Figure 3.5. Number density of 237Np at various cooling times (2.5% MA core)
JNC
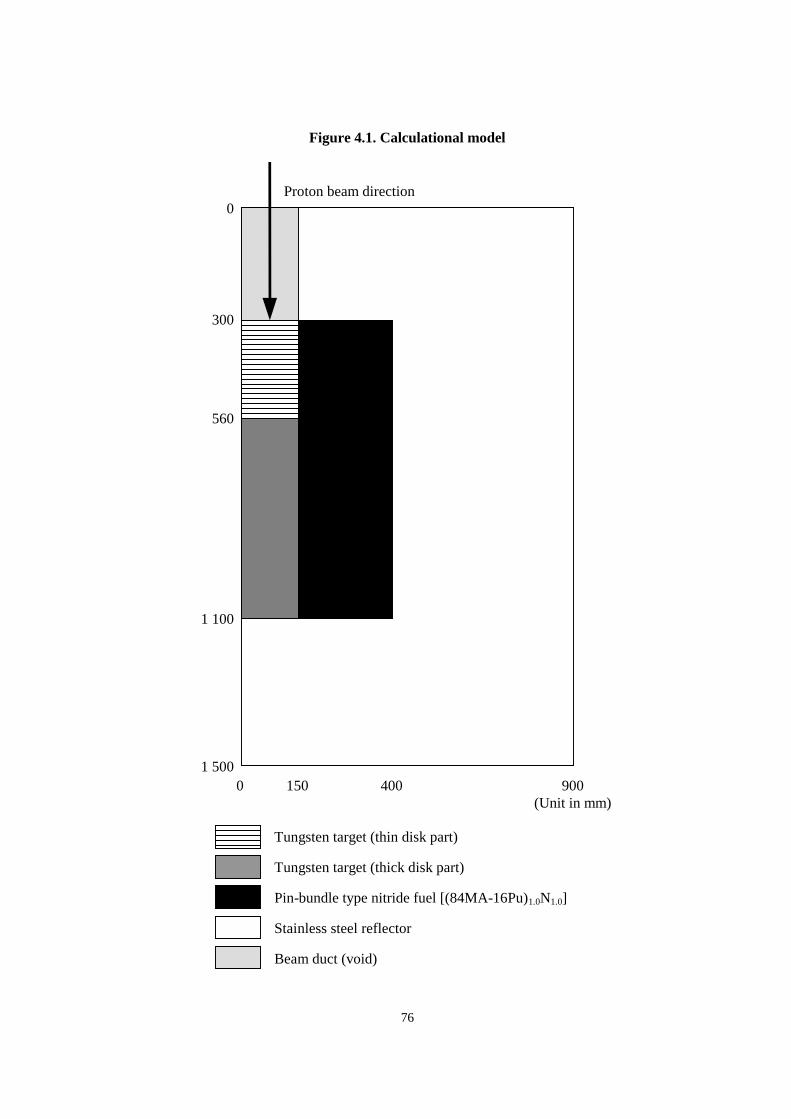
76
Figure 4.1. Calculational model
Proton beam direction0
300
560
1 100
1 5000 150 400 900
(Unit in mm)
Tungsten target (thin disk part)
Tungsten target (thick disk part)
Pin-bundle type nitride fuel [(84MA-16Pu)1.0N1.0]
Stainless steel reflector
Beam duct (void)
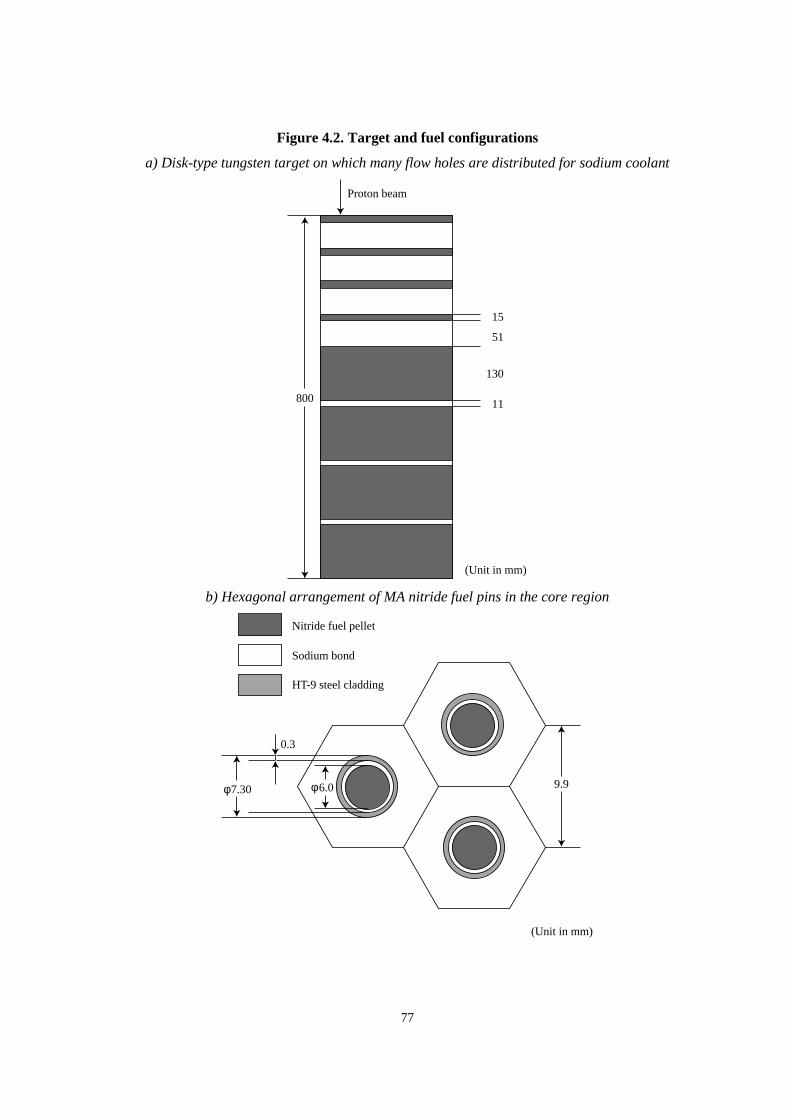
77
Figure 4.2. Target and fuel configurations
a) Disk-type tungsten target on which many flow holes are distributed for sodium coolant
800 11
130
51
15
(Unit in mm)
Proton beam
b) Hexagonal arrangement of MA nitride fuel pins in the core region
(Unit in mm)
Nitride fuel pellet
Sodium bond
HT-9 steel cladding
9.9
0.3
7.30 6.0φ φ
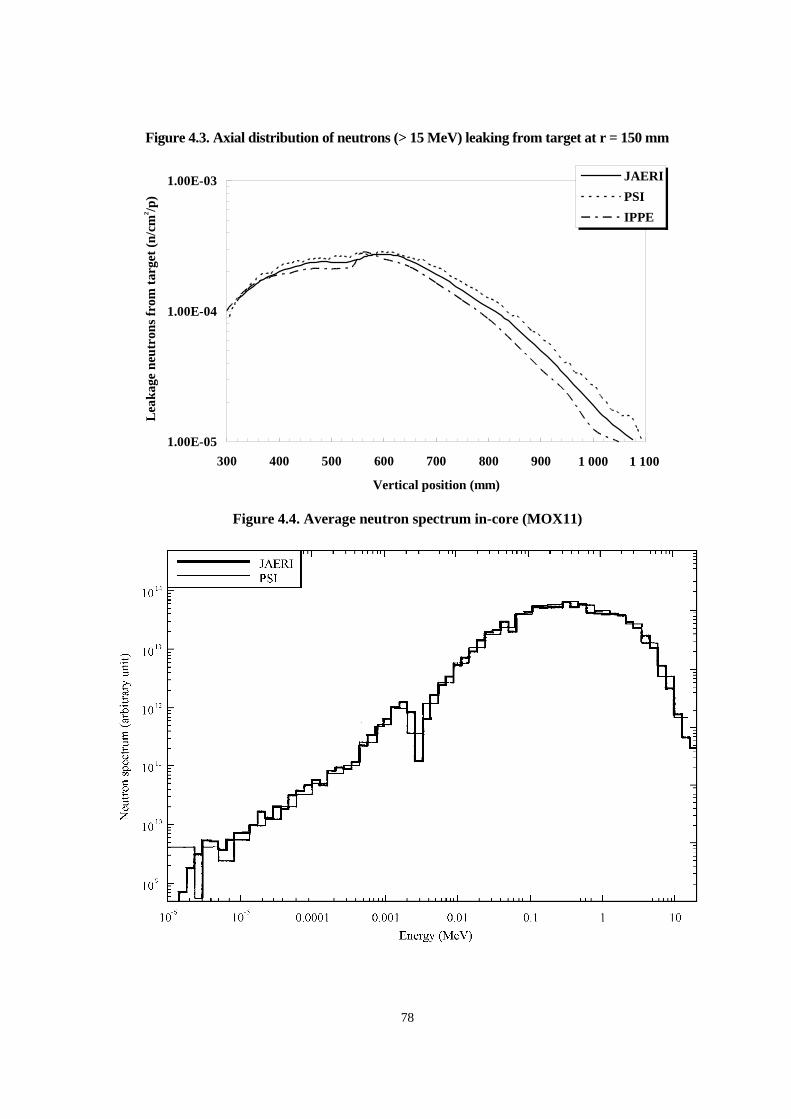
78
Figure 4.3. Axial distribution of neutrons (> 15 MeV) leaking from target at r = 150 mm
1.00E-05
1.00E-04
1.00E-03
300 400 500 600 700 800 900 1000 1100
Vertical position (mm)
Lea
kage
neu
tron
s fr
om t
arge
t (n
/cm
2/p)
JAERI
PSI
IPPE
1 000 1 100
Lea
kage
neu
tron
s fr
om t
arge
t (n
/cm
2 /p)
Figure 4.4. Average neutron spectrum in-core (MOX11)

79
Figure 4.5. Time evolution of keff (MOX11)
0.89
0.9
0.91
0.92
0.93
0.94
0.95
0 50 100 150 200Burn-up (GWd/t)
k-ef
fict
ive
JAERI
PSI
IPPE
Figure 4.6. Time evolution of keff (MOX12)
0.91
0.92
0.93
0.94
0.95
0.96
0 50 100 150 200Burn-up (GWd/t)
k-ef
fict
ive
JAERI
PSI
IPPE
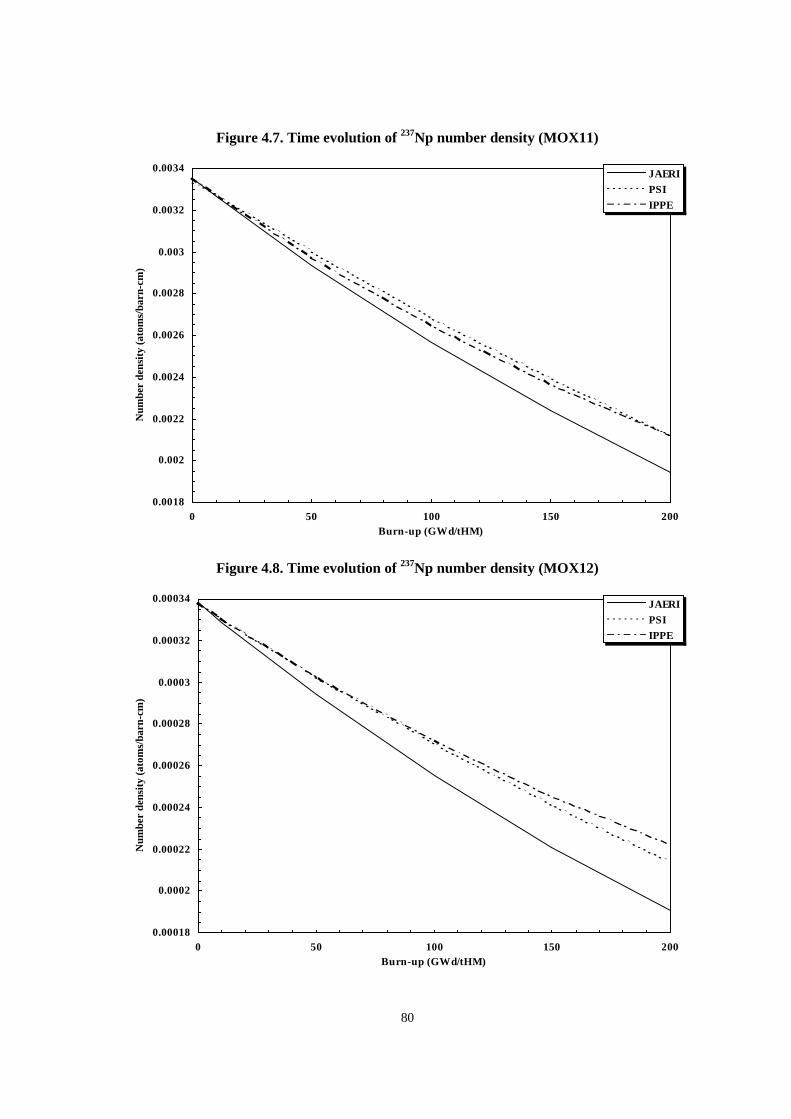
80
Figure 4.7. Time evolution of 237Np number density (MOX11)
0.0018
0.002
0.0022
0.0024
0.0026
0.0028
0.003
0.0032
0.0034
0 50 100 150 200Burn-up (GWd/tHM)
Num
ber
dens
ity
(ato
ms/
barn
-cm
)
JAERI
PSI
IPPE
Figure 4.8. Time evolution of 237Np number density (MOX12)
0.00018
0.0002
0.00022
0.00024
0.00026
0.00028
0.0003
0.00032
0.00034
0 50 100 150 200Burn-up (GWd/tHM)
Num
ber
dens
ity
(ato
ms/
barn
-cm
)
JAERI
PSI
IPPE
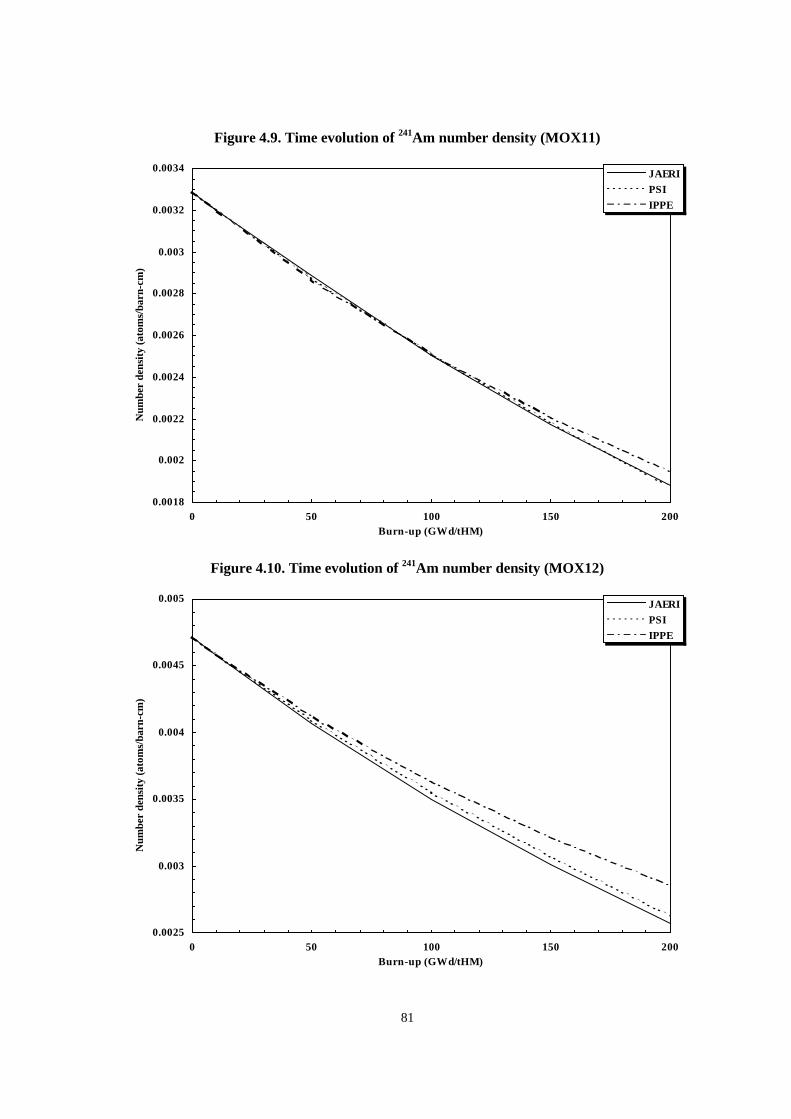
81
Figure 4.9. Time evolution of 241Am number density (MOX11)
0.0018
0.002
0.0022
0.0024
0.0026
0.0028
0.003
0.0032
0.0034
0 50 100 150 200Burn-up (GWd/tHM)
Num
ber
dens
ity
(ato
ms/
barn
-cm
)
JAERI
PSI
IPPE
Figure 4.10. Time evolution of 241Am number density (MOX12)
0.0025
0.003
0.0035
0.004
0.0045
0.005
0 50 100 150 200Burn-up (GWd/tHM)
Num
ber
dens
ity
(ato
ms/
barn
-cm
)
JAERI
PSI
IPPE

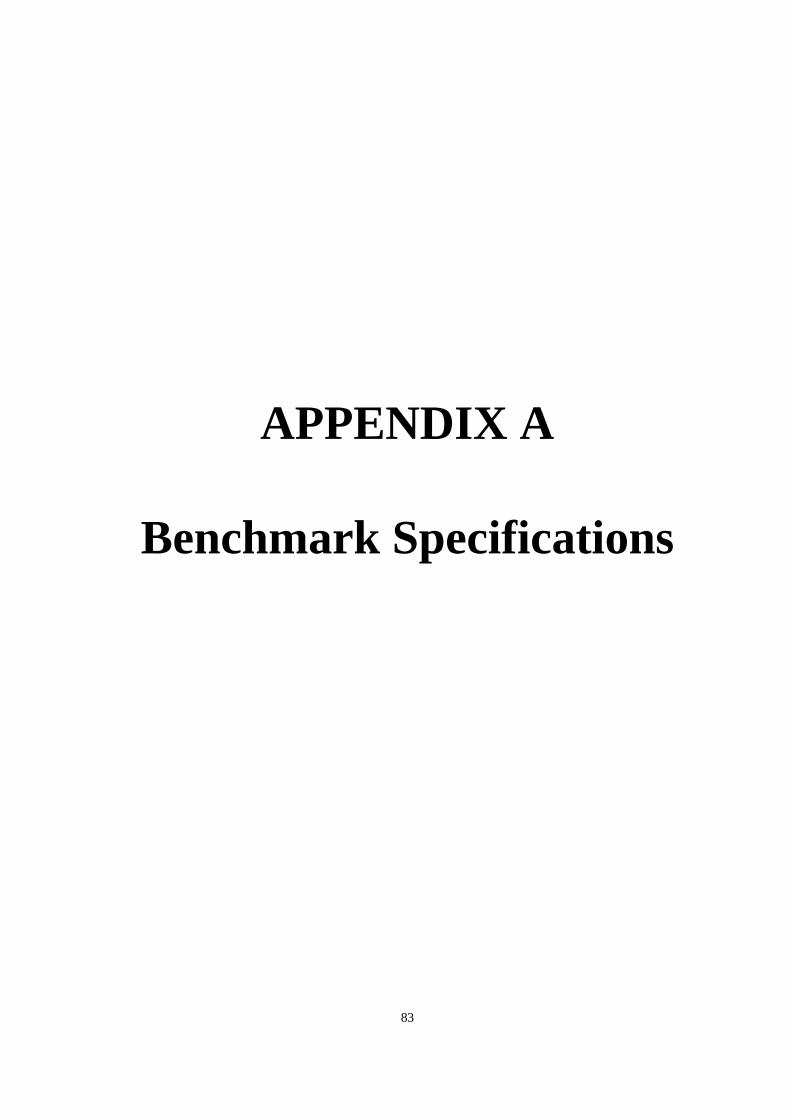
83
APPENDIX A
Benchmark Specifications

85
Appendix A.1
NEA/NSC benchmark on physics aspects of differenttransmutation concepts – specifications for PWRs
C. Broeders, H. Küsters, L. PayenFZK, Institut für Neutronenphysik
und ReaktortechnikPostfach 3640, 76021 Karlsruhe
J. VergnesEDF/DER
Département Physique des réacteurs1, avenue du Général de Gaulle
Introduction
The Nuclear Energy Agency’s Nuclear Science Committee (NEA/NSC) is investigating thephysical aspects of partitioning and transmutation (P-T) of actinides and fission products in severaltask forces [1,2]. One result of these efforts was a proposal to instigate benchmarks for a set of commontransmutation system models [1]. At the task force meeting at Cadarache on 15 December 1994 it wasagreed to propose a rather simple and realistic benchmark, close to actual scenarios. The objective is tocompare the calculated activities for individual isotopes as a function of time (0 to 100 000 years) fordifferent stages of proposed scenarios. The calculated activities must be normalised to the powerproduced.
The following stages are defined in Ref. [2]:
1. The initial stage (input data):
a) The activity, after seven years cooling, of UO2 fuel (burn-up = 45 GWd/tHM) from atypical PWR reactor, where the minor actinides are taken out.
2. The second stage (recycling stage), that would input both plutonium and minor actinides tothe third stage (seven years cooling), contains either:
a) A standard MOX fuelled fast reactor.
b) A standard MOX fuelled PWR.
3. The third and last stage (transmutation stage) contains either:
a) A standard fast reactor.
b) A special actinide burning fast reactor.
c) A PWR with moderator to fuel ratio of about 3.
d) An accelerator-driven transmutation system based on a fast neutron flux.
e) An accelerator-driven transmutation system based on a thermal neutron flux.
f) A special electron linear accelerator for the transmutation of fission products.
86
In Ref. [2] it was agreed, that FZK (formerly KZK) would specify the benchmark for the firststage (PWR UO2 fuel), and would collaborate with BNFL the PWRs for Stages 2 and 3.
The characteristics should be representative for the type of system described. It was agreed torecommend that simple calculation methods, such as cell calculations, be used by the participants.
Because of the common experience of EDF and FZK with joined benchmarks on plutoniumrecycling in PWRs [3,4] the co-operation between EDF and FZK was extended for the new NEA/NSCbenchmarks.
The proposal was discussed with representatives of BNFL at FZK on 20 April 1995 [5].
General discussion of the fuel cycle stages
In this section we discuss the background and arguments for the specific data of the benchmarkproposal. The detailed benchmark specifications are given in the section entitled Detailed benchmarkspecification.
All calculations will be based on simplified cell models. The basic cell is the same as in theearlier NEA/NSC benchmark for plutonium recycling in PWRs [6]. This square lattice cell was alsoconsidered in the EDF/KFK plutonium recycling benchmarks [3] and is representative of modernFrench PWRs. The outer fuel pin diameter of 9.5 mm is also used in modern German PWRs.
Stage 1: Initial stage with UO2 PWRs
Instead of the value of 45 GWd/tHM target burn-up in Ref. [2], we propose to investigate twodifferent burn-up values:
1) 33 GWd/tHM, having been representative of most spent PWR fuel up to now.
2) 50 GWd/tHM, being an often mentioned target burn-up for the near future. The EDF/KFKbenchmark of Ref. [4] specifies this burn-up value.
The results for these two burn-up values will give us quantitative information about the impact oftarget burn-up increase on long-term radiological consequences. Very probably these data will justifythe increased benchmark efforts.
Stage 2: Plutonium recycling in PWRs
In this stage only the plutonium from Stage 1 is put into a follow-up PWR core. Other transuraniaand fission products eventually have to be treated in a Stage 3 scenario. The (PuU)O2 mixed oxide(MOX) may be manufactured with natural or depleted uranium. At present, there is a tendency toutilise depleted uranium for the MOX in order to consume a maximum amount of plutonium in theexpensive MOX fuel assemblies (plutonium burning).
87
The results of Ref. [4] indicate that plutonium may be recycled more than once in PWRs. However,the planned benchmark will only consider one recycling step before the final transmutation stage. For theplutonium recycling in PWRs we have to select the applied full core model:
• A full MOX core.
• A mixed core with MOX and UO2 fuel assemblies.
Although full MOX PWR cores are feasible and even have some advantages, e.g. related topower distributions, no real application seems to be planned for the near future. Therefore a mixedMOX/UO2 core is proposed for this benchmark. The characteristics of the MOX and of the UO2 fuelassemblies have to be determined by independent cell calculations for the corresponding lattices.This choice leads to two open questions:
1) Which partition of the mixed core will be MOX?Some investigations consider the use of self-generated MOX in a mixed MOX/UO2 core.In practical cases, however, the MOX comes from different reactors and its partition is fixedin some way. Usually the licensing procedures allow up to about 50% MOX content in thecore. For the benchmark we propose to use a fixed partition of e.g. 30% MOX.
2) What are the criteria for MOX and UO2 fuel assemblies being utilised together in a fullreactor core model?The criteria for equivalency of UO2 and MOX fuel assemblies are not well defined. In practiceit must be possible to run the full core in a satisfactory manner over the whole reactor cycle.The first experiences in French and German PWRs for target burn-ups of ≈35 GWd/tHMindicate that for burn-up calculations without boron in the coolant, the following relation forthe end of cycle k∞ values is reasonable:
k kMOXEOC
UOXEOC
∞ ∞= −, , .0 03 (1)
For the benchmark we propose to apply this formula. This means that a Pufis value must bedetermined to match Eq. (1) for a given UO2 lattice.
Stage 3: Partition and transmutation in PWRs
In Ref. [2] it is proposed to investigate a PWR with a moderator to fuel ratio of about 3 (highlymoderated PWR). In order to obtain systematic information about the potential of modern PWRs forpartition and transmutation (P&T) purposes, we propose to also consider the PWR specification ofStages 1/2. The following problem areas may be identified for the benchmark specification:
1. The maximum Pu content of the MOX fuel, eventually admixed with other transurania and/orfission products. It is well known that too high Pu contents may lead to problems with safetyparameters, e.g. the moderator density reactivity coefficient (void effect).
2. Choice of the uranium composition for the MOX fuel. Here a balance must be found betweencolliding requirements such as maximum transurania consumption and upper transuranialimits due to safety considerations. In addition to natural and depleted uranium, 235U enricheduranium may also become of interest.

88
3. Technical feasibility of separation of individual transurania isotopes and fission products.At present, only the extraction of plutonium, neptunium and selected fission products seemsto be feasible [5]. For the benchmark we propose to study the following alternatives:
a) Transmutation of plutonium and neptunium. This would be possible with currenttechniques. With this option it should be emphasised that 237Np will be produced by theamericium on store. The transmuted 237Np is converted to 238Pu.
b) Transmutation of plutonium and all other transurania (neptunium, americium andcurium). Technical developments are required to realise this option. The disadvantage ofthis procedure is the high radioactivity of curium.
c) Transmutation of plutonium, neptunium and americium. Technical developments arerequired to realise this most desirable option.
d) Burning of selected fission products. It is of interest to clarify the capabilities of fissionproduct incineration in PWRs in a benchmark investigation.
4. For the highly moderated PWRs no actual design for UO2 fuel is available with the proposedmoderator to fuel ratio of 3. Thus there is no basis for a mixed PWR core with UO2 and MOXfuel assemblies. To avoid further complications we propose to consider a full MOX highlymoderated PWR. The Pufis fraction should be determined on the basis of fundamental modediffusion calculations with the requirement keff
EOC = 1 . For a reasonable geometrical buckling,
e.g. for a realistic 3 000 MWth reactor.
Detailed benchmark specification
All calculations should be performed on the basis of the cylindrical Wigner-Seitz cell as specifiedin Figure 1 and Table 1. The pitch and the equivalent outer cell radius are given twice: the smaller onefor the standard PWR of the Stages 1-3 and a larger one for the highly moderated PWR of Stage 3.For simplicity the influences of the water boration and of the fuel assembly structures are neglected inthis benchmark. The effects of these simplifications have been studied in some detail. They are notsignificant for fuel inventory calculations [7]. The determination of the one-group cross-sections forthe depletion calculations should be based on cell flux calculations with critical buckling.
Specifications for the fuel
For this benchmark we have three different sources for the manufacturing of the fuel:
1) Uranium oxide (UO2) with a theoretical density of 10.96 g/cm3 (see Table 1). Natural uraniumwith 0.711% 235U or depleted uranium with 0.225% 235U will be used in the MOX in mostcases. Only the isotopes 235U and 238U will be considered in the fresh uranium fuel.
2) Plutonium oxide (PuO2) with a theoretical density of 11.46 g/cm3 (see Table 1). The originand history of the plutonium strongly affect its composition. At reactor beginning of cycle(BOC) we assume reprocessed plutonium after three years fabrication time. This fuel containsthe plutonium isotopes 238Pu, 239Pu, 240Pu, 241Pu, 242Pu and 241Am from the β–-decay of 241Pu(T1/2 = 14.4 years).
89
3) Additives like neptunium, americium, curium and fission products. These materials can bespecified in several ways. For the benchmark it is recommended to replace uranium by theseadditives.
The density of the oxide fuel has to be kept constant for all cases: ρox = 10.29 g/cm3. This meansthat for different fractions of plutonium to the MOX, the ratio of the actual oxide density to thetheoretical value varies.
Isotopic composition of plutonium mixtures
The isotopic composition of the plutonium very strongly depends on its irradiation history.The higher isotopes increase with increasing irradiation, e.g. by higher target burn-ups or byrecyclings. An increase of higher plutonium isotopes determines a decrease in the fissile fractionf f fPu Pu Pufis
= +239 241 . Low fPu fis values are disadvantageous for use in PWRs. The usability of highly
irradiated plutonium can be improved by mixing it with better quality plutonium. The isotopiccomposition of plutonium from a mixture of different charges can be determined by mass weighting ofthe fractions of the single charges. For N charges with weight Wi, (= 1,N), we obtain the isotopicfraction fj of isotope j, (j = 238Pu, 239Pu, 240Pu, 241Pu, 242Pu, 241Am) with the following formula:
fW f
Wj
i ji
toti N
=⋅
=∑
1,
(2)
with f ji the isotopic fraction of isotope j in charge i and:
W Wtot i
i N
==∑
1,
(3)
Stage 1: Initial stage with UO2 PWRs
For the initial stage number densities are specified for two target burn-ups. Recommendations aregiven for the detailed burn-up scheme, including the burn-ups steps and the list of isotopes for explicittreatment. Finally the required results to be reported are specified.
Specification of the number densities
For the initial Stage 1, two 235U enrichments are specified:
1) 3.25% for the target burn-up of 33 GWd/tHM. This value is in accordance with experiencegained while running PWRs with three batches. The mean end of cycle (EOC) burn-upamounts 22 GWd/tHM.
2) 4.65% for the target burn-up of 50 GWd/tHM. This is the same value as for the EDF/KFKbenchmark investigations of Refs. [3,4]. In a three batch reactor system the mean EOCburn-up amounts 33.3 GWd/tHM.
Table 2 contains the isotopic concentrations in the fuel, cladding and moderator zones for theseenrichments. These number densities have been obtained by the Karlsruhe KARBUS code [8]. Theyare defined to be the starting conditions for the benchmark calculations.
90
Specification of the burn-up steps
For both enrichments depletion calculations must be performed up to the specified target burn-up.Although inventory calculations are not very sensitive to the interval scheme for the recalculation ofone-group cross-sections (macro steps for the depletion calculations), it is recommended to applyrather small steps as specified in Table 3. The accumulated burn-up and the corresponding incrementaltime steps are tabulated at a power rating of 183.02 W/cm (see also Table 1).
Specification of the explicitly treated isotopes
For the cell flux and the one-group cross-section calculations the following isotopes should betreated explicitly if possible:
• Uranium: 234U, 235U, 236U and 238U.
• Neptunium: 237Np and 239Np.
• Plutonium: 238Pu, 239Pu, 240Pu, 241Pu and 242Pu.
• Americium: 241Am, 242Am, 242mAm and 243Am.
• Curium: 242Cm, 243Cm, 244Cm and 245Cm.
• Fission products: the long-lived fission products 99Tc, 129I and 135Cs will be considered inStage 3. Thus, they must be treated explicitly. For other fission products it is recommended toconsider as much as available.
Evaluation of the results
Tabulated results should be prepared for the in situ burn-up and for the long-term depletion.For the burn-up calculations the following results have to be tabulated for all isotopes listed in theabove section Specification of the explicitly treated isotopes and the burn-up steps of Table 3 with anadditional seven years cooling time:
• k∞.
• Number densities (atoms/cm3).
• Weights (kg), normalised to 1 t of initial heavy metal (TIHM).
For the long-term, the depletion of the radioactivity of the same isotopes, with the exception ofthe short-lived 239Np and 242Cm has to be determined for the following time scale:
• Reactor shutdown, seven years cooling time, 10, 20, 50, 100, 200, 500, 1 000, 2 000, 5 000,10 000, 20 000, 50 000 and 100 000 years decay.
Ref. [2] proposes to normalise to the power produced (Bq/GWh). Here one has to decide betweenthermal or electric power produced. For a benchmark on P&T systems with different efficiencies,electric (net) power seems to be preferable. In the case electric power normalisation is required, theefficiency factor ηp of the PWR (in the range 0.32-0.35) must be defined, e.g. ηp = 1/3.
91
Further, the calculation of the activity of individual isotopes has to be clarified. Two alternativemethods are discussed:
1) The time dependence of the radioactivity of the single isotopes within the unloaded fuel.In fact this means a continuation of the reactor burn-up calculations with zero neutron flux(decay processes).
2) Determination of the long-term behaviour of the individual isotopes after unloading from thecore. The proper activity of each isotope as well as the activity of its successors is considered.Separate decay calculations, starting with only the single unloaded individual isotopes, haveto be performed.
The second method seems to be more suitable for the judgement of hazard potential after fuelunloading from reactors. In spite of possible complications with calculational procedures, the secondoption is recommended.
Stage 2: Plutonium recycling in PWRs
In this stage, the plutonium gained in Stage 1 is reused in a PWR. Other transurania and fissionproducts stay on store. After seven years cooling and reprocessing time and three years fabricationtime, the MOX fuel assemblies (FA) are loaded in a PWR core together with UO2 FA. The partition ofMOX and UO2 FA is fixed: 30% MOX and 70% UO2.
For the benchmark it is assumed that enough material with the mean characteristics of theobtained “Stage 1” plutonium is available for the production of 30% MOX FA. In this first plutoniumrecycling depleted uranium is preferred for the MOX. The plutonium content in the MOX FA isdetermined by the required fissile plutonium (Pufis) to match the equivalency criteria of Eq. (1)(under the section entitled General discussion of the fuel cycle stages, see the sub-section Stage 2:Plutonium recycling in PWRs).
Two cases should be calculated:
1) For the plutonium coming from the target burn-up of 33 GWd/tHM the Pufis value has to bedetermined for the same target burn-up in a core along with 3.25% enriched UO2.
2) For the plutonium coming from the target burn-up of 50 GWd/tHM the Pufis value has to bedetermined for the same target burn-up in a core along with 4.65% enriched UO2.
For both cases the required Pufis value and the same results as specified for Stage 1 must bereported.
Stage 3: Partition and transmutation in PWRs
The definition of the Stage 3 benchmark specifications is not as straightforward as the first twostages. Too many material compositions are possible. Table 4 summarises possible materials forincineration studies for PWRs. The identifications of the second column will be used below. U325FAand U465FA are UO2 fuel assemblies, whereas U020, U070 and Uxyz define admixed uranium to theMOX fuel assemblies.
92
For Stage 3 the specification of the materials of Table 4 may be provided for use in alltransmutation concepts, e.g. on the basis of KARBUS/APOLLO [4] calculations.
The plutonium from Stage 1, MOX331 and MOX501, is the same as the input for Stage 2.The Stage 2 output plutonium, MOX332 and MOX502, is the mixture of 70% UO2 and 30% MOX FA.The plutonium composition of MOXxx2 can be determined by Eq. (2).
In Ref. [2] no information is given about the amount of admixed transurania or fission products tothe plutonium or about the uranium in the MOX.
For PWRs it seems worthwhile to study the feasibility to incinerate the self-generated long-livedisotopes, both with the standard and with the highly moderated lattice. Thus for selected cases it isproposed to make the same calculations as those described in the sub-section of Detailed benchmarkspecification, entitled Stage 1: Initial stage with UO2 PWRs. It may be assumed that the additionalmaterials may be admixed homogeneously to the MOX fuel. The preference for the uranium in thisMOX is:
a) Depleted uranium if possible. This leads to a maximum amount of transurania in the expensiveMOX FA.
b) Natural or even enriched uranium in cases, where the need for high Pufis contents withdepleted uranium would lead to safety concerns.
In Ref. [2] it is proposed to use the second generation MOXxx2 plutonium in the “transmutationPWR”. However, it might also be of general interest to investigate the P&T potential of PWRs withfirst generation plutonium MOXxx1. Thus we propose to consider all available plutonium compositionsfrom Stages 1 and 2 for the incineration studies of Stage 3. The transurania fraction of the fuel shouldnot exceed 10%. Some possibilities for the additives are:
• NP331, NP332 and NP331 + NP332 in a 33 GWd/tHM PWR with U325FA.
• NP501, NP502 and NP501 + NP502 in a 50 GWd/tHM PWR with U465FA.
• NPAM331, NPAM332 and NPAM331 + NPAM332 33 GWd/tHM PWR with U325FA.
• NPAM501, NPAM502 and NPAM501 + NPAM502 50 GWd/tHM PWR with U465FA.
• TRU331, TRU332 and TRU331 + TRU332 in a 33 GWd/tHM PWR with U325FA.
• TRU501, TRU502 and TRU501 + TRU502 in a 50 GWd/tHM PWR with U465FA.
• TC331, TC332 and TC331 + TC332 in a 33 GWd/tHM PWR with U325FA.
• TC501, TC502 and TC501 + TC502 in a 50 GWd/tHM PWR with U465FA.
• I331, I332 and I331 + I332 in a 33 GWd/tHM PWR with U325FA.
• I501, I502 and I501 + I502 in a 50 GWd/tHM PWR with U465FA.
• CS331, CS332 and CS331 + CS332 in a 33 GWd/tHM PWR with U325FA.
• CS501, CS50 2 and CS501 + CS502 in a 50 GWd/tHM PWR with U465FA.
93
The most interesting case from the physics point of view is the transmutation of neptunium andamericium together (NPAMxx).
For caesium technical problems may occur with 137Cs. This isotope with T1/2 = 30 years is also afission product and must be taken into account in some way (e.g. 100 years cooling time).
In the case some of these investigations are successful for PWRs, larger amounts of the materialsmay be admixed to the fuel, e.g. the inventories of 2,3,..,Nmax reactor systems. These specificationscould be fixed in a later stage of the benchmark investigations.
Specifications for the highly moderated PWR
The cell specifications for the highly moderated PWR with moderator to fuel ratio 3 are given inTable 1. The determination of the required Pufis in the MOX should be performed on the basis of a3 000 MWth full MOX PWR. With fundamental mode diffusion calculations the end of cycle reactivitycondition keff
EOC = 1 must be satisfied. It is proposed to use the geometrical buckling of a cylindrical
core with height to diameter ratio one (H/D=1). For this conditions we obtain:
• For the geometry H = D = 362.8 cm.
• For the geometrical buckling: B cmg2 4 22 50 10= ⋅ − −. .
Summary
Within the framework of an international NEA/NSC benchmark on P&T of transurania andfission products with available concepts, this paper proposes the specifications for PWRs.
Figure 2 gives an overview for the three stages:
1) The initial stage with PWRs, producing the first generation plutonium, other transurania andfission products.
2) The recycling stage with reload of the first generation plutonium to PWRs, producing secondgeneration plutonium and further transurania and fission products.
3) The transmutation stage. Among various transmutation concepts, the use of PWRs is alsoconsidered.
Two target burn-up values (33 and 50 GWd/tHM) are proposed for Stage 1 to obtain quantitativeinformation about the impact of target burn-up increase on long-term radiological consequences.
In accordance with actual developments for MOX loading in PWRs, for Stage 2 a mixed corewith UO2 and MOX fuel assemblies is proposed. The partition of MOX FA to the core amounts 30%.The proposed equivalency criteria for UO2 and MOX FA in the same PWR core is based on initialexperiences in French and German PWRs with UO2/MOX loadings.
For the transmutation stage with PWRs, it is proposed to investigate both standard and highlymoderated PWRs. Depleted uranium should preferably be used in the MOX FA because this leads tomaximum plutonium consumption. For cases where criticality requirements lead to too high plutoniumfractions with depleted uranium, natural or even enriched uranium may be taken into account.
94
REFERENCES TO APPENDIX A.1
[1] S. Matsuura, et al., “Overview of Physics Aspects of Different Transmutation Concepts”,NEA/NSC/DOC(94)11 (1994).
[2] S. Matsuura, et al., “Summary Record of the NSC Task Force Meeting on Physics Aspects ofDifferent Transmutation Concepts”, NEA/NSC/DOC(94)34 (1994).
[3] J. Vergnes, “First Proposition of Scenario for the Second Part of the CEA-EDF-KfK-SiemensBenchmark on Plutonium Multi-Recycling in PWR”, private communication (1993).
[4] J. Vergnes, C. Broeders, L. Payen, “Plutonium Multi-Recycling in PWRs: Benchmark EDF-KfK”,EDF Note HT-11/95/003/A (1995).
[5] Discussion on NEA/NSC/DOC(94)34 at FZK, 20/04/1995. Participants: P. Little (BNFL),C. Zimmermann (BNFL), C. Broeders (FZK), H. Küsters (FZK).
[6] D. Lutz, W. Bernnat, E. Sartori, “Physics of Plutonium Recycling, Vol. 2, Benchmark onPlutonium Recycling in PWRs”, OECD/NEA (1995).
[7] C. Broeders, L. Payen, private communication (1995).
[8] C.H.M. Broeders, “Entwicklungsarbeiten für die neutronenphysikalische Auslegung vonFortschrittlichen Druckwasserreaktoren (FDWR) mit kompakten Dreiecksgittern in hexagonalenBrennelemente”, KfK5072 (1992).
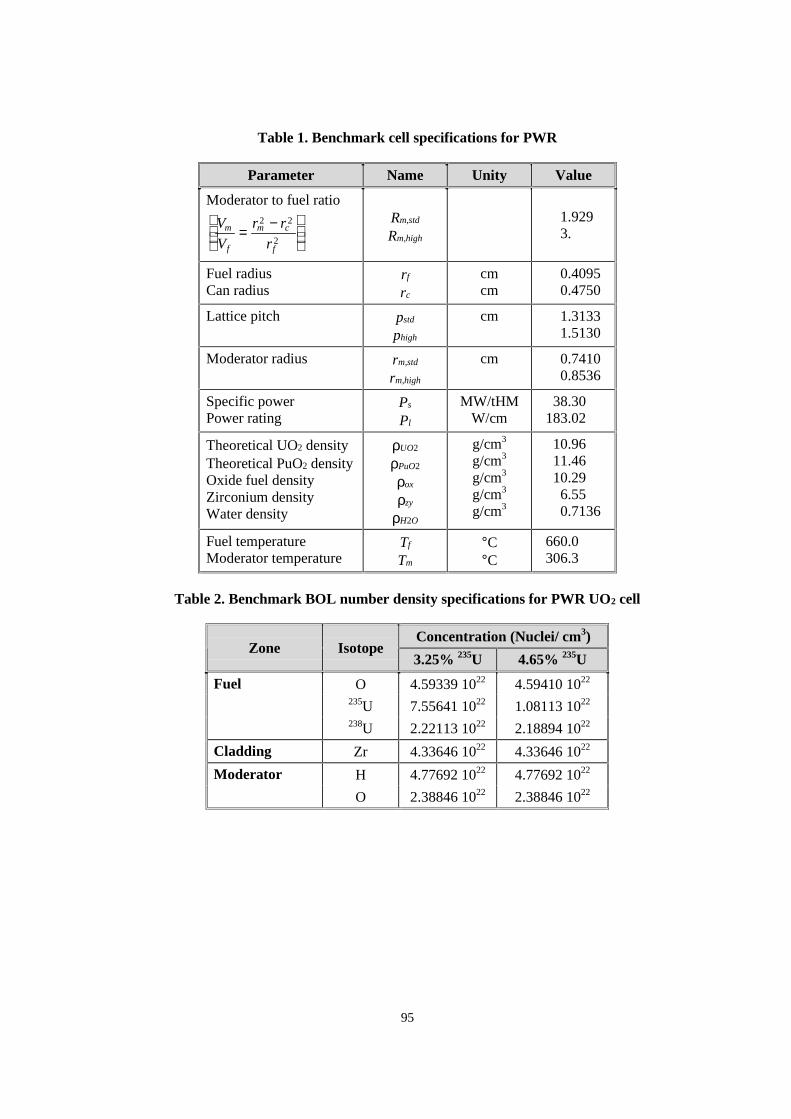
95
Table 1. Benchmark cell specifications for PWR
Parameter Name Unity Value
Moderator to fuel ratio
V
V
r r
rm
f
m c
f
= −
2 2
2
Rm,std
Rm,high
1.9293.
Fuel radiusCan radius
rf
rc
cmcm
0.40950.4750
Lattice pitch pstd
phigh
cm 1.31331.5130
Moderator radius rm,std
rm,high
cm 0.74100.8536
Specific powerPower rating
Ps
Pl
MW/tHMW/cm
38.30183.02
Theoretical UO2 densityTheoretical PuO2 densityOxide fuel densityZirconium densityWater density
ρUO2
ρPuO2
ρox
ρzy
ρH2O
g/cm3
g/cm3
g/cm3
g/cm3
g/cm3
10.9611.4610.296.550.7136
Fuel temperatureModerator temperature
Tf
Tm
°C°C
660.0306.3
Table 2. Benchmark BOL number density specifications for PWR UO2 cell
Concentration (Nuclei/ cm3)Zone Isotope
3.25% 235U 4.65% 235U
Fuel O 4.59339 1022 4.59410 1022
235U 7.55641 1022 1.08113 1022
238U 2.22113 1022 2.18894 1022
Cladding Zr 4.33646 1022 4.33646 1022
Moderator H 4.77692 1022 4.77692 1022
O 2.38846 1022 2.38846 1022
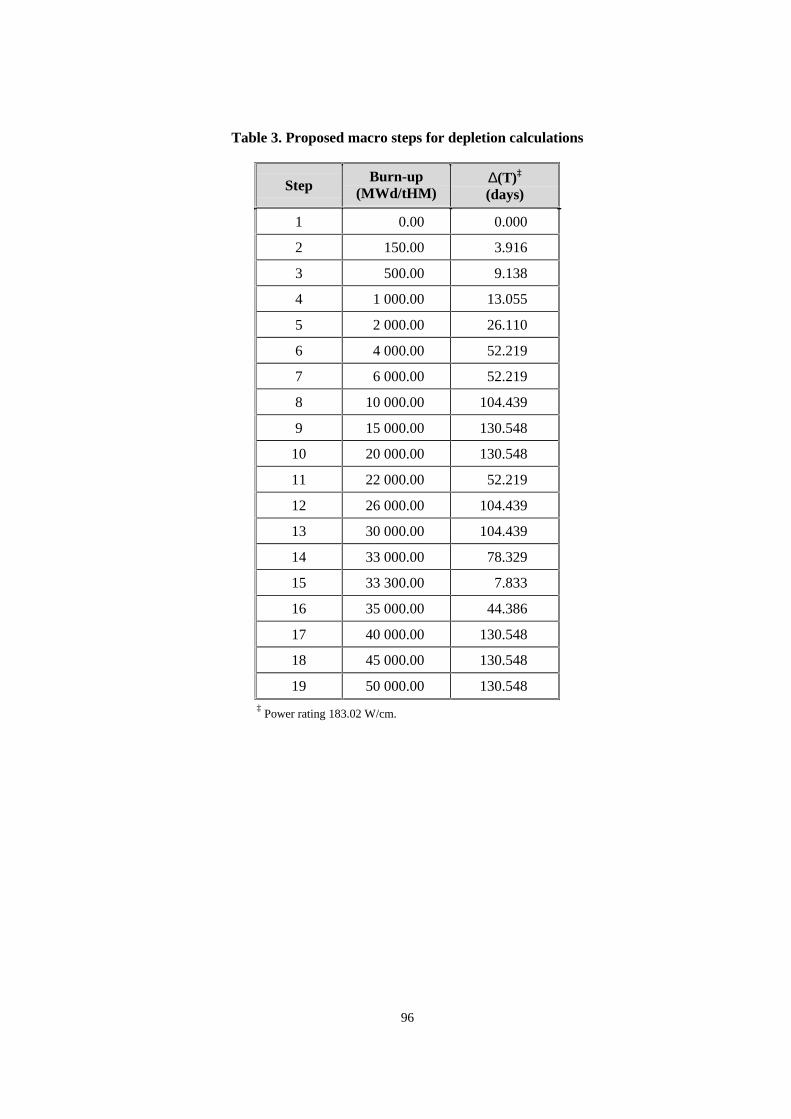
96
Table 3. Proposed macro steps for depletion calculations
StepBurn-up
(MWd/tHM)∆(T)‡
(days)
1 0.00 0.000
2 150.00 3.916
3 500.00 9.138
4 1,000.00 13.055
5 2,000.00 26.110
6 4,000.00 52.219
7 6,000.00 52.219
8 10,000.00 104.439
9 15,000.00 130.548
10 20,000.00 130.548
11 22,000.00 52.219
12 26,000.00 104.439
13 30,000.00 104.439
14 33,000.00 78.329
15 33,300.00 7.833
16 35,000.00 44.386
17 40,000.00 130.548
18 45,000.00 130.548
19 50,000.00 130.548‡ Power rating 183.02 W/cm.
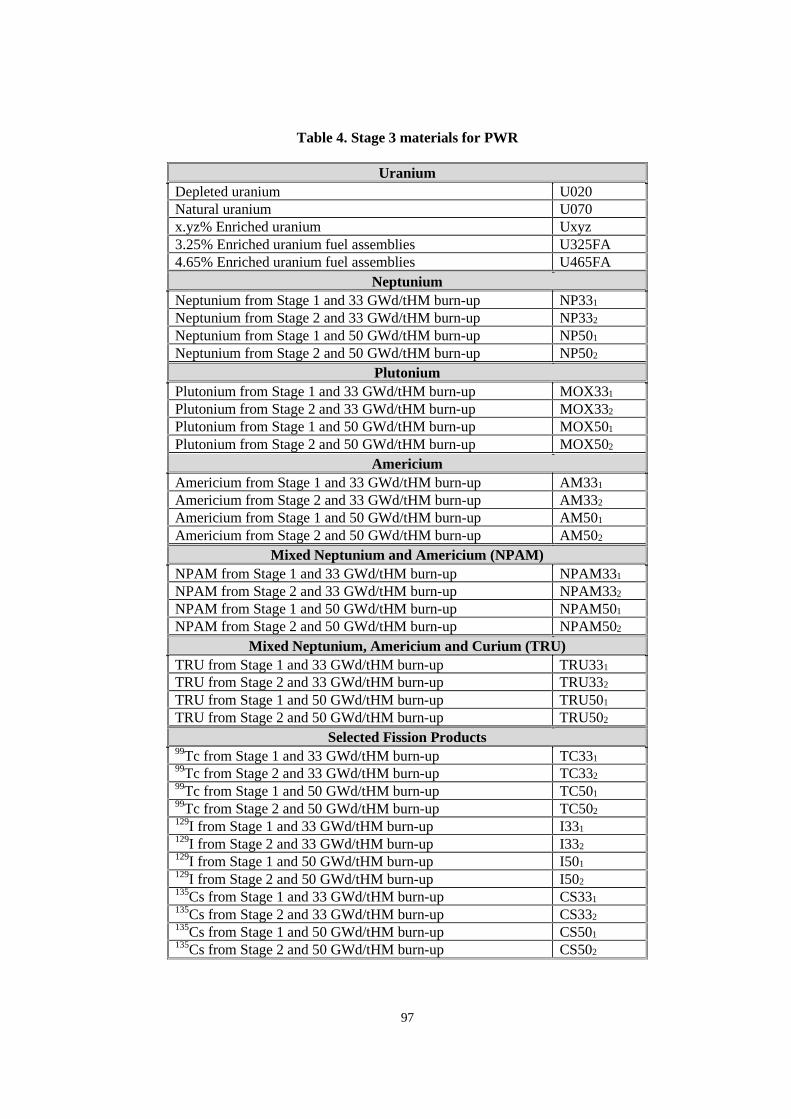
97
Table 4. Stage 3 materials for PWR
UraniumDepleted uranium U020Natural uranium U070x.yz% Enriched uranium Uxyz3.25% Enriched uranium fuel assemblies U325FA4.65% Enriched uranium fuel assemblies U465FA
NeptuniumNeptunium from Stage 1 and 33 GWd/tHM burn-up NP331
Neptunium from Stage 2 and 33 GWd/tHM burn-up NP332
Neptunium from Stage 1 and 50 GWd/tHM burn-up NP501
Neptunium from Stage 2 and 50 GWd/tHM burn-up NP502
PlutoniumPlutonium from Stage 1 and 33 GWd/tHM burn-up MOX331
Plutonium from Stage 2 and 33 GWd/tHM burn-up MOX332
Plutonium from Stage 1 and 50 GWd/tHM burn-up MOX501
Plutonium from Stage 2 and 50 GWd/tHM burn-up MOX502
AmericiumAmericium from Stage 1 and 33 GWd/tHM burn-up AM331
Americium from Stage 2 and 33 GWd/tHM burn-up AM332
Americium from Stage 1 and 50 GWd/tHM burn-up AM501
Americium from Stage 2 and 50 GWd/tHM burn-up AM502
Mixed Neptunium and Americium (NPAM)NPAM from Stage 1 and 33 GWd/tHM burn-up NPAM331
NPAM from Stage 2 and 33 GWd/tHM burn-up NPAM332
NPAM from Stage 1 and 50 GWd/tHM burn-up NPAM501
NPAM from Stage 2 and 50 GWd/tHM burn-up NPAM502
Mixed Neptunium, Americium and Curium (TRU)TRU from Stage 1 and 33 GWd/tHM burn-up TRU331
TRU from Stage 2 and 33 GWd/tHM burn-up TRU332
TRU from Stage 1 and 50 GWd/tHM burn-up TRU501
TRU from Stage 2 and 50 GWd/tHM burn-up TRU502
Selected Fission Products99Tc from Stage 1 and 33 GWd/tHM burn-up TC33199Tc from Stage 2 and 33 GWd/tHM burn-up TC33299Tc from Stage 1 and 50 GWd/tHM burn-up TC50199Tc from Stage 2 and 50 GWd/tHM burn-up TC502129I from Stage 1 and 33 GWd/tHM burn-up I331129I from Stage 2 and 33 GWd/tHM burn-up I332129I from Stage 1 and 50 GWd/tHM burn-up I501129I from Stage 2 and 50 GWd/tHM burn-up I502135Cs from Stage 1 and 33 GWd/tHM burn-up CS331135Cs from Stage 2 and 33 GWd/tHM burn-up CS332135Cs from Stage 1 and 50 GWd/tHM burn-up CS501135Cs from Stage 2 and 50 GWd/tHM burn-up CS502
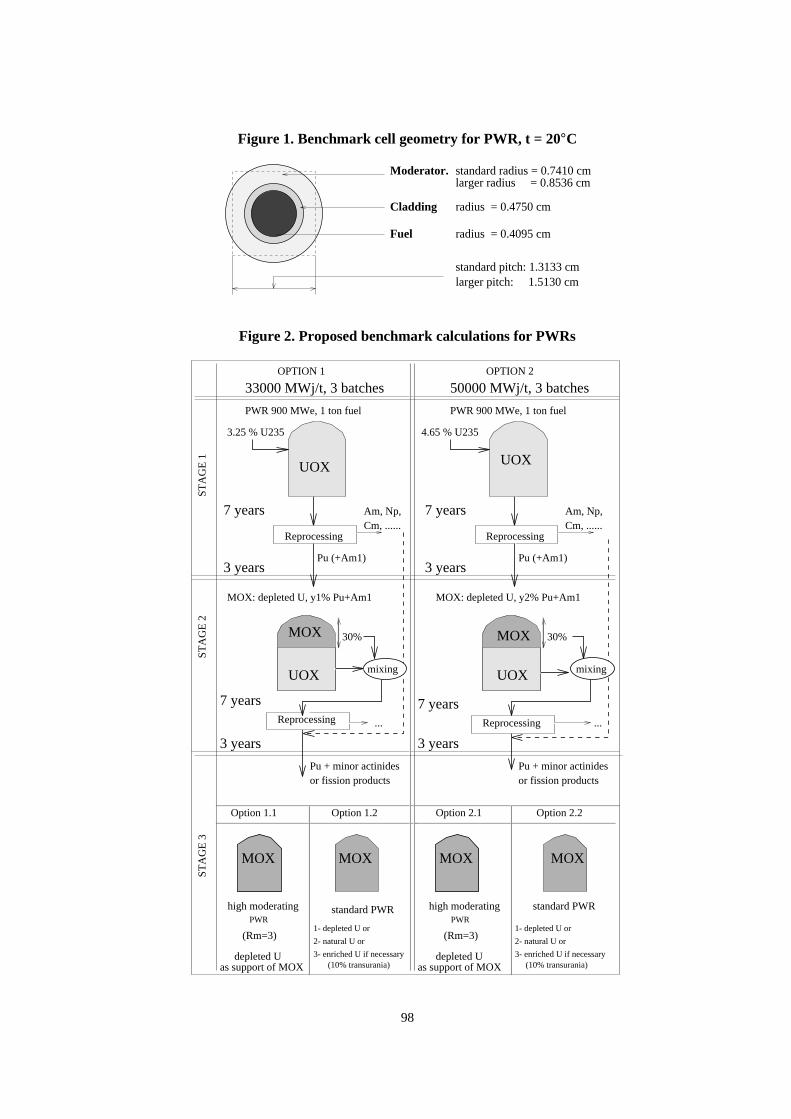
98
Figure 1. Benchmark cell geometry for PWR, t = 20°C
Cladding
Fuel
Moderator. standard radius = 0.7410 cm
radius = 0.4750 cm
radius = 0.4095 cm
larger radius = 0.8536 cm
standard pitch: 1.3133 cmlarger pitch: 1.5130 cm
Figure 2. Proposed benchmark calculations for PWRs
high moderatinghigh moderating
(Rm=3) (Rm=3)
33000 MWj/t, 3 batches 50000 MWj/t, 3 batches
30% 30%
3.25 % U235 4.65 % U235
PWR 900 MWe, 1 ton fuel PWR 900 MWe, 1 ton fuel
MOX: depleted U, y1% Pu+Am1 MOX: depleted U, y2% Pu+Am1
Option 1.2Option 1.1 Option 2.1 Option 2.2
MOXMOX
ReprocessingCm, ......Am, Np,
Pu (+Am1)
Reprocessing
Pu (+Am1)
Cm, ......Am, Np,7 years7 years
...
3 years 3 years
mixing mixing
Reprocessing Reprocessing
7 years
3 years 3 years
7 years
MOX MOX MOX MOX
...
Pu + minor actinidesPu + minor actinidesor fission products or fission products
UOX UOX
UOX UOX
STA
GE
1ST
AG
E 2
STA
GE
3
OPTION 2OPTION 1
PWR PWRstandard PWR standard PWR
depleted Uas support of MOX
depleted Uas support of MOX
3- enriched U if necessary
2- natural U or
1- depleted U or
3- enriched U if necessary
2- natural U or
1- depleted U or
(10% transurania) (10% transurania)
99
Appendix A.2
Proposal for a benchmark calculation of MA transmutation in fast reactors (1 000 MWe)
T. WakabayashiJapan Nuclear Cycle Fuel Development Institute (JNC)
4–49, Murumatsu, Tokai-mura, Naka-gun, Ibaraki, 319-1184, Japan
Introduction
The present proposal is made in the framework of the benchmark calculations of the NuclearScience Committee of the NEA.
The data necessary to the neutronics calculation are given both for the subassemblies and for thecore. Geometrical characteristics are given at 20°C, unless values in 5 to 7 corresponding to operatingconditions.
Fuel subassembly
• Fissile column height: 1 000 mm.
• Subassembly lattice dimension: 179.8 mm.
• Number of pins/subassembly: 271.
• External clad diameter: 8.3 mm.
• Pellet diameter: 7.32 mm.
• Nature and density of the fuel: mixed UO2-PuO2(= 0.48 × PR + 5.96 + 2.5 × OM)PR: Pu ratio OM: 1.98.
• Uranium isotopic composition:
235U 238Uat% 0.30 99.70
• Plutonium isotopic composition: PWR UO2 fuel (50 GWd/tHM, seven year cooling):
238Pu 239Pu 240Pu 241Pu 242Pu 241Amat % 2.76 53.74 24.24 10.63 2.76 1.65
100
• Pu/U + Pu ratio for inner and outer cores: 15.3%, 19.1% (wt%)(without MA: reference);
• Pu/U + Pu ratio for inner and outer cores: 15.22%, 18.96% (with 2.5% MA);
• Pu/U + Pu ratio for inner and outer cores: 15.13%, 18.84% (with 5% MA);
• Composition and density of steel (hexagonal tube and cladding): 7.97 g/cm3:
Fe Cr Ni Mo Mn
Mass % 60.97 15.05 19.50 2.51 1.97
• Volume fraction of subassembly components:
UPuO2 Steel Sodium
Vol. % 37.45 19.74 37.75
• Numbers of S/As in inner and outer cores: 175, 180.
• Density of sodium: 0.84867 g/cm3 at 430°C.
Reflector subassembly
• Volume fraction of components:
Axial Radial
Steel Sodium Steel Sodium
Vol. % 19.74 37.52 80.0 20.0
Control subassembly
• Absorber part: not calculated.
• Composition for the follower part:
Steel Sodium
Vol. % 7.622 92.378
Operating conditions
• Thermal power: 2 600 MW.
• Cycle length and load factor: 365 EFPD.
• Residence time of fuel subassemblies: 1 095 EFPD.
101
• Core: 3 batch.
• Blanket: 4 batch.
Cell calculations
• Fuel cell, cladding, tube and sodium: homogenised cells.
• Rod follower, reflectors: homogenised cells.
Spatial calculations
• Reactor core map: see Figure 1.
• RZ geometry: see Figure 2.
• Mesh size: ~5cm, both R and Z.
• Broad group structure (~7 groups): see Table 1 (example).
• Boundary conditions: Φ = 0 on the outer boundary.
Atomic number densities
• Atomic densities: see Table 2 (start of burn-up calculation).
Required calculations (RZ geometry)
1) keff (In diffusion theory. Possibly: transport effects):
• 0 EFPD (beginning of life).
• 365 EFPD (beginning of first cycle).
• 1 460 EFPD (beginning of fourth cycle, equilibrium cycle).
• 1 825 EFPD (end of fourth cycle, end of life).
2) Critical balance components (productions, absorptions, leakage) and decomposition by isotope:
• 0 EFPD (beginning of life).
• 365 EFPD (beginning of first cycle).
• 1 460 EFPD (beginning of fourth cycle, equilibrium cycle).
• 1 825 EFPD (end of fourth cycle, end of life).
102
3) Spectrum indices at core centre:
C(238U) F(238U) F(240Pu) F(241Pu)
F(239Pu) F(239Pu) F(239Pu) F(239Pu)
• 0 EFPD (beginning of life).
• 1 460 EFPD (beginning of fourth cycle, equilibrium cycle).
• 1 825 EFPD (end of fourth cycle, end of life).
4) Burn-up calculation, at a thermal power of 2 600 MW, in three steps with flux calculation ateach step:
• 0 EFPD (beginning of life).
• 365 EFPD (beginning of first cycle).
• 730 EFPD (end of first cycle).
• 730 EFPD (beginning of second cycle).
• 1 095 EFPD (end of second cycle).
• 1 095 EFPD (beginning of third cycle).
• 1 460 EFPD (end of 3rd cycle).
• 1 460 EFPD (beginning of fourth cycle, equilibrium cycle).
• 1 825 EFPD (end of fourth cycle, end of life).
Reactivity loss with breakdown into fission product and heavy isotope components.
5) Inner core and outer core isotopic compositions at the end of life (including minor actinidesbuild-up).
6) Definition of transmutation rate:
• Transmutation rate = ((Loaded Mass of MA at BOC)-(Discharged Mass of MA at EOC))/((Loaded Mass of MA at BOC)
7) Sodium void coefficient for inner core and whole core, with breakdown into components(derived from perturbation theory calculations):
• Axial leakage component.
• Radial leakage component.
• Scattering (spectral) component.
103
• Absorption component.
• Production component.
At beginning of fourth cycle (BOC) and end of fourth cycle (EOC).
8) Fuel Doppler reactivity at BOC and EOC, defined as:
( ) ( )k T C k T C k keff eff eff eff1 2 1 21100 1 600= ° − = ° ⋅
Decomposition by isotope.
9) Decay heat of irradiated fuel subassembly (IC and OC) at the end of the cycle and successivecooling times Tc:Tc = 1 day, 1 month, 3 months, 1 year.
10) Neutron sources and activity of irradiated fuel subassemblies.
11) Radiotoxicity of wastes at various cooling times (see appendix):
Tc = 0, 100 y, 1 000 y, Tc = 10 000 y, Tc = 100 000 y, Tc = 1 000 000 y
(Hypothesis on reprocessing losses: 0.3% Pu and 1% minor actinides.)
Radiotoxicity calculation
The calculation of the radiotoxicity will be performed as indicated below, starting from theisotopic composition of the discharged irradiated fuel (Tc = 0):
• Calculation of the mass of the descendants at various cooling time, for each nuclide initiallypresent in the wastes. The nuclides to be taken into account are plutonium, neptunium,americium and curium and the fission products 99Tc, 129I and 135Cs.
• Calculation of their respective activities in becquerels.
• Calculation of the corresponding radiotoxicities and summation on the whole descendance fora given initial nuclide. The radiotoxicity is obtained when multiplying the activity by thehazard factor defined in Table 3.
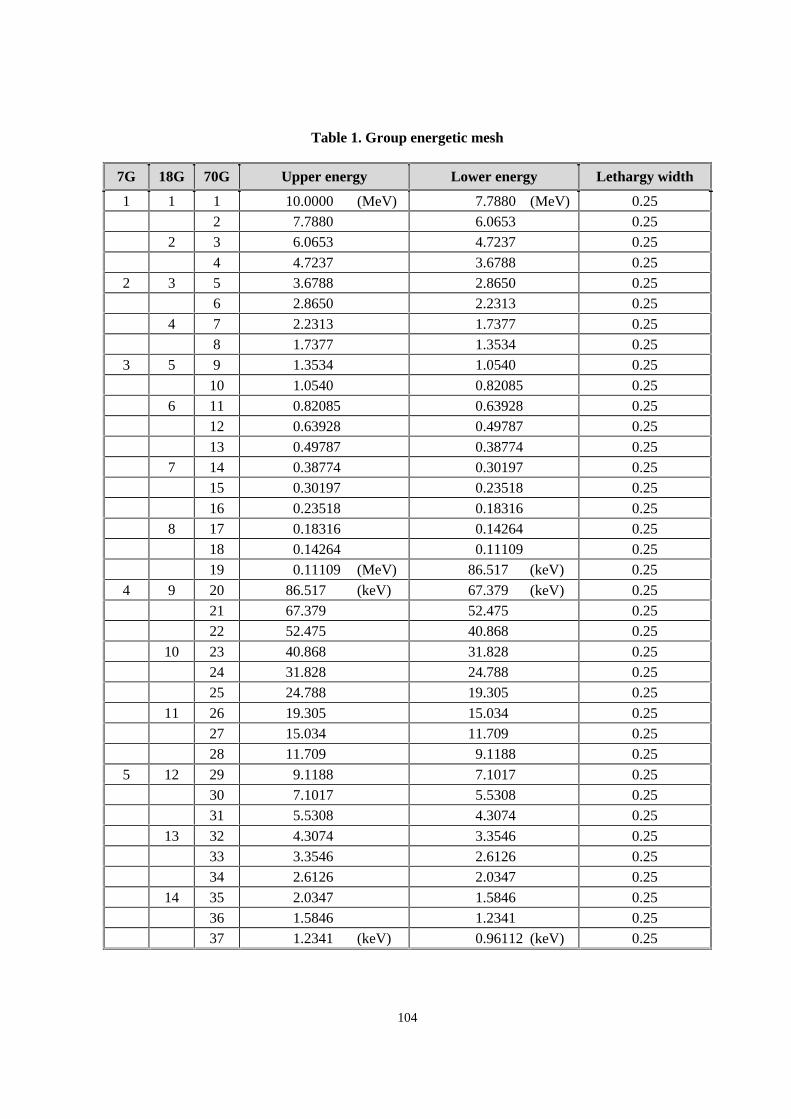
104
Table 1. Group energetic mesh
7G 18G 70G Upper energy Lower energy Lethargy width
1 1 1 10.0000 (MeV) 7.7880 (MeV) 0.252 7.7880 6.0653 0.25
2 3 6.0653 4.7237 0.25
4 4.7237 3.6788 0.252 3 5 3.6788 2.8650 0.25
6 2.8650 2.2313 0.25
4 7 2.2313 1.7377 0.258 1.7377 1.3534 0.25
3 5 9 1.3534 1.0540 0.25
10 1.0540 0.82085 0.256 11 0.82085 0.63928 0.25
12 0.63928 0.49787 0.25
13 0.49787 0.38774 0.257 14 0.38774 0.30197 0.25
15 0.30197 0.23518 0.25
16 0.23518 0.18316 0.258 17 0.18316 0.14264 0.25
18 0.14264 0.11109 0.2519 0.11109 (MeV) 86.517 (keV) 0.25
4 9 20 86.517 (keV) 67.379 (keV) 0.2521 67.379 52.475 0.2522 52.475 40.868 0.25
10 23 40.868 31.828 0.2524 31.828 24.788 0.2525 24.788 19.305 0.25
11 26 19.305 15.034 0.2527 15.034 11.709 0.2528 11.709 9.1188 0.25
5 12 29 9.1188 7.1017 0.2530 7.1017 5.5308 0.2531 5.5308 4.3074 0.25
13 32 4.3074 3.3546 0.2533 3.3546 2.6126 0.2534 2.6126 2.0347 0.25
14 35 2.0347 1.5846 0.2536 1.5846 1.2341 0.2537 1.2341 (keV) 0.96112 (keV) 0.25
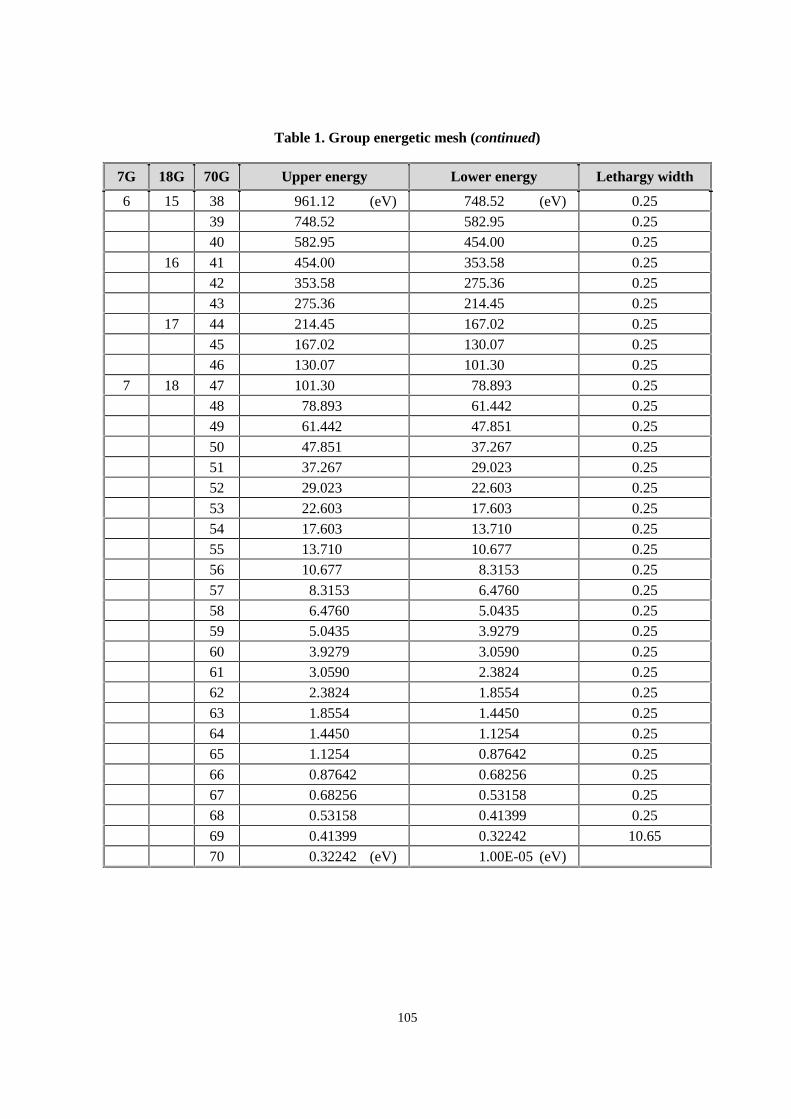
105
Table 1. Group energetic mesh (continued)
7G 18G 70G Upper energy Lower energy Lethargy width
6 15 38 961.12 (eV) 748.52 (eV) 0.2539 748.52 582.95 0.2540 582.95 454.00 0.25
16 41 454.00 353.58 0.2542 353.58 275.36 0.2543 275.36 214.45 0.25
17 44 214.45 167.02 0.2545 167.02 130.07 0.2546 130.07 101.30 0.25
7 18 47 101.30 78.893 0.2548 78.893 61.442 0.2549 61.442 47.851 0.25
50 47.851 37.267 0.2551 37.267 29.023 0.2552 29.023 22.603 0.25
53 22.603 17.603 0.2554 17.603 13.710 0.2555 13.710 10.677 0.2556 10.677 8.3153 0.25
57 8.3153 6.4760 0.2558 6.4760 5.0435 0.2559 5.0435 3.9279 0.25
60 3.9279 3.0590 0.2561 3.0590 2.3824 0.2562 2.3824 1.8554 0.25
63 1.8554 1.4450 0.2564 1.4450 1.1254 0.2565 1.1254 0.87642 0.25
66 0.87642 0.68256 0.2567 0.68256 0.53158 0.2568 0.53158 0.41399 0.25
69 0.41399 0.32242 10.6570 0.32242 (eV) 1.00E-05 (eV)
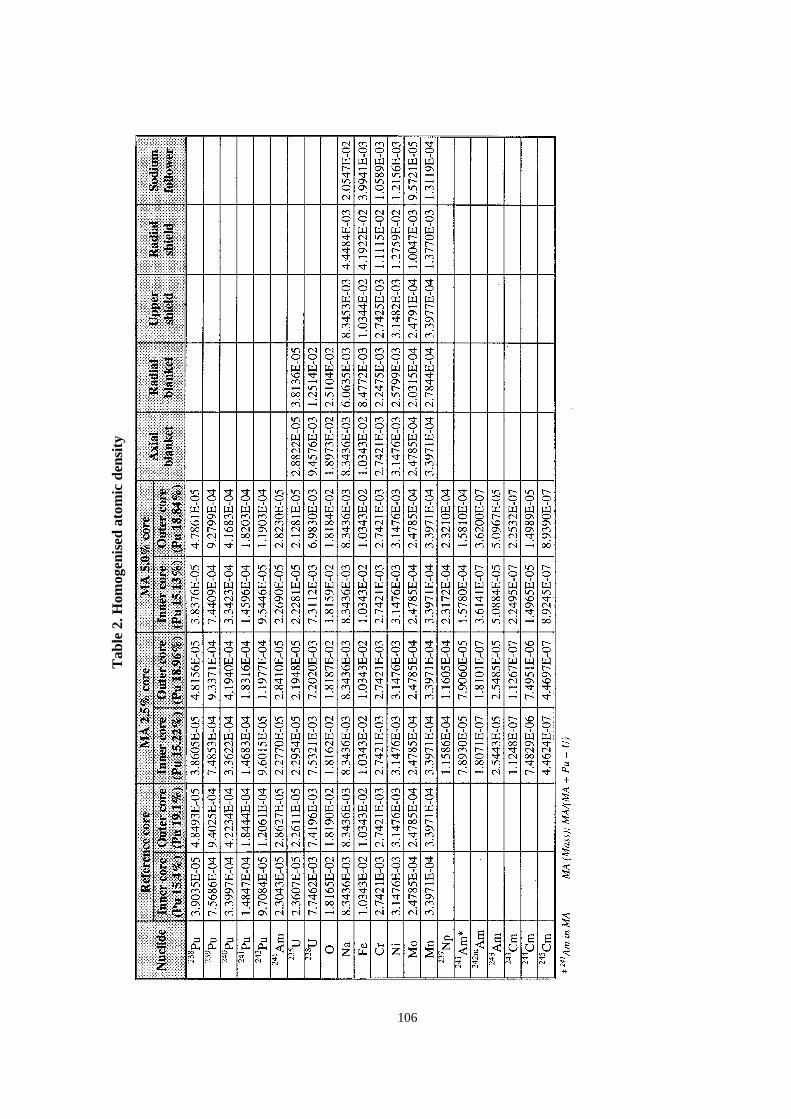
106
Tab
le 2
. Hom
ogen
ised
ato
mic
den
sity
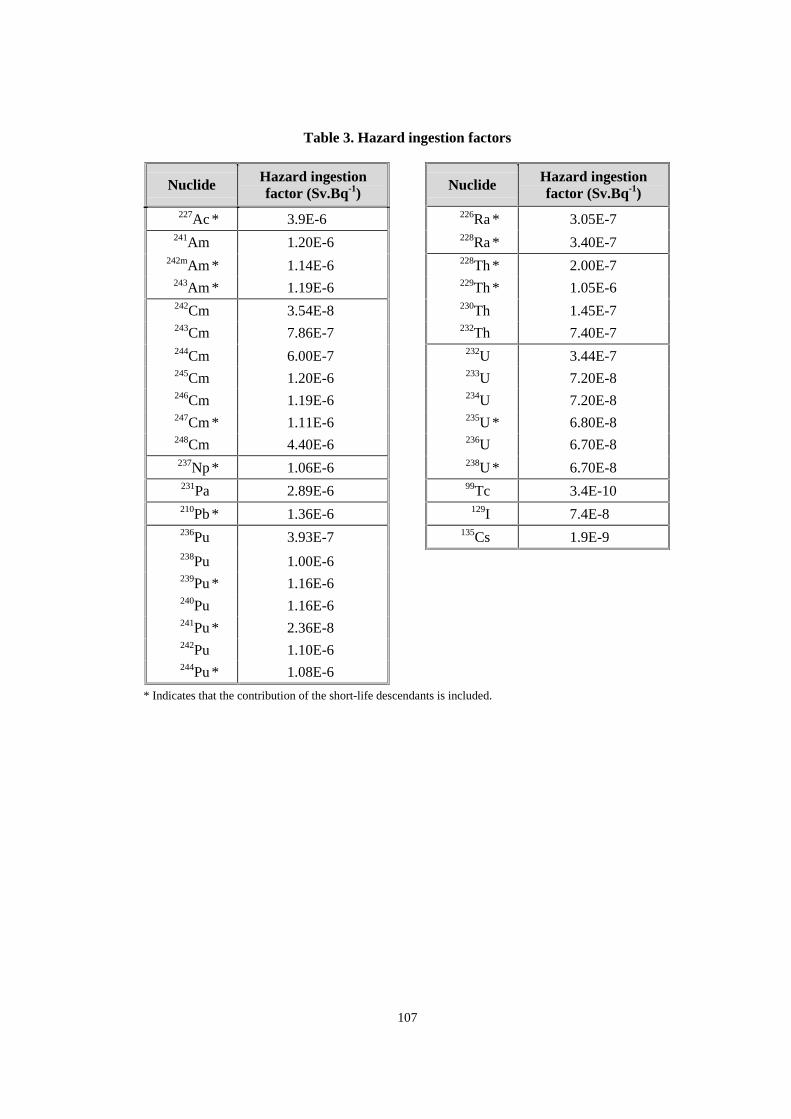
107
Table 3. Hazard ingestion factors
Nuclide Hazard ingestionfactor (Sv.Bq-1) Nuclide Hazard ingestion
factor (Sv.Bq-1)227Ac * 3.9E-6 226Ra * 3.05E-7
241Am 1.20E-6 228Ra * 3.40E-7242mAm * 1.14E-6 228Th * 2.00E-7
243Am * 1.19E-6 229Th * 1.05E-6242Cm 3.54E-8 230Th 1.45E-7243Cm 7.86E-7 232Th 7.40E-7244Cm 6.00E-7 232U 3.44E-7245Cm 1.20E-6 233U 7.20E-8246Cm 1.19E-6 234U 7.20E-8247Cm * 1.11E-6 235U * 6.80E-8248Cm 4.40E-6 236U 6.70E-8237Np * 1.06E-6 238U * 6.70E-8231Pa 2.89E-6 99Tc 3.4E-10210Pb * 1.36E-6 129I 7.4E-8236Pu 3.93E-7 135Cs 1.9E-9238Pu 1.00E-6239Pu * 1.16E-6240Pu 1.16E-6241Pu * 2.36E-8242Pu 1.10E-6244Pu * 1.08E-6
* Indicates that the contribution of the short-life descendants is included.

108
Figure 1. Reference core (1 000 MWe class FBR)
100
30 30
258
368
401
CO
RE
BL
AN
KE
T
IN
NE
R
CO
RE
OU
TE
R
CO
RE
BL
AN
KE
TS
HI
EL
DM
AI
N
CN
TL
BU
CK
UP
C
NT
L
TO
TA
L
175
180 72 252 18 6
703
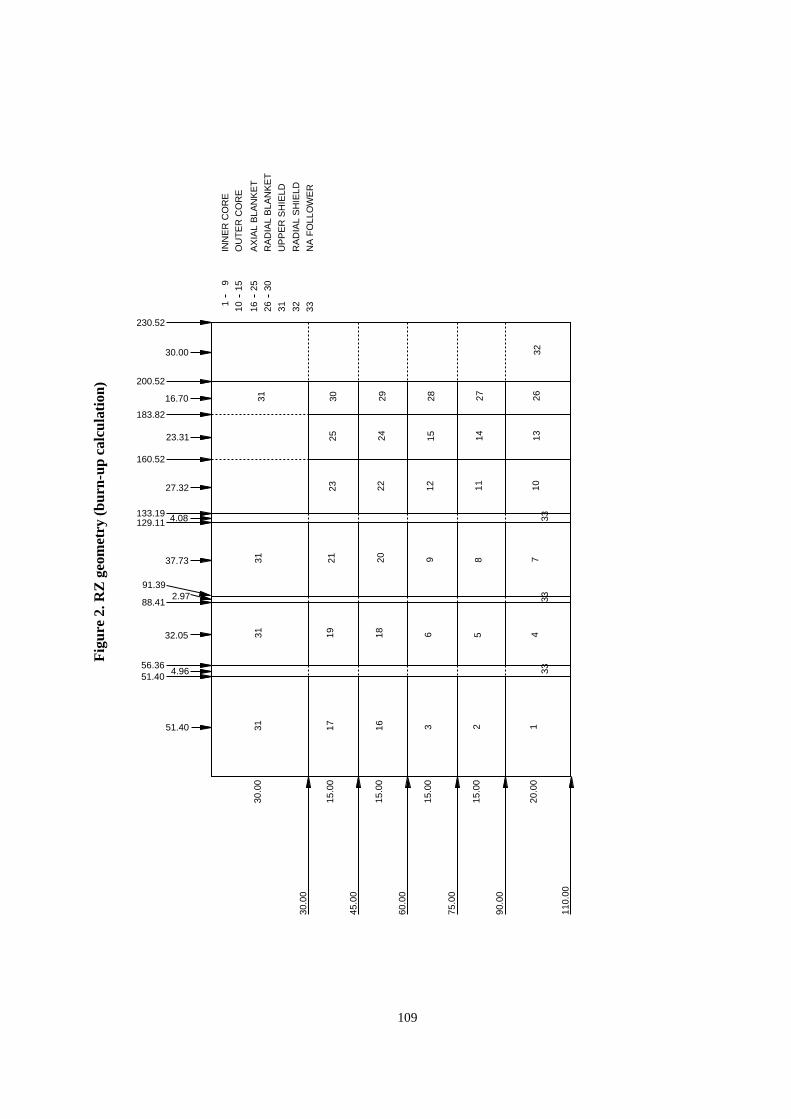
109
30.0
0
45.0
0
60.0
0
75.0
0
90.0
0
110.
00
30.0
0
15.0
0
15.0
0
15.0
0
15.0
0
20.0
0
3131
31
1719
1618
3 2 1
6 5 4
21 20 9 8
3333
337
2325
30
2224
29 28 2714
11 1013
2632
1215
31
51.40
4.9651.4056.36
32.05
88.412.97
91.39
37.73
129.11 4.08133.19
27.32
160.52
23.31
183.82
16.70
200.52
30.00
230.52
19
1510 16
25 3026 31 32 33
INN
ER
CO
RE
OU
TE
R C
OR
E
AX
IAL
BLA
NK
ET
RA
DIA
L B
LAN
KE
T
UP
PE
R S
HIE
LD
RA
DIA
L S
HIE
LD
NA
FO
LLO
WE
R
Fig
ure
2. R
Z g
eom
etry
(bur
n-up
cal
cula
tion
)

111
Appendix A.3
JAERI proposal of benchmark problem on method and data to calculate the nuclearcharacteristics in accelerator-based transmutation system with fast neutron flux
T. Nishida, T. Takizuka, T. SasaTransmutation System Laboratory
Dept. of Reactor EngineeringJapan Atomic Energy Research Institute
Tokai-mura, Naka-gun, Ibaraki-ken, 319-11, Japan5 May 1995
Benchmark problem
Since 1989, a conceptual design study has been carried out at JAERI on the intense protonaccelerator-driven transmutation fast flux systems with solid and liquid target/core in the frameworkof the national research programme OMEGA on partitioning and transmutation [1,2]. JAERI’saccelerator-based system aims mainly at developing a burning system for minor actinides (MA) inhigh level waste (HLW) discharged from the reprocessing plant of LWR spent fuel, and not theplutonium burning system. Therefore, we would like to propose an appropriate benchmark problem ofcode and data validation in preliminary design study for a module of a proton accelerator-driventransmutation system based on the specifications as summarised in Table 1. The dirty plutonium fromHLW is mixed into MA fuel to suppress the reactivity swing at the first burn-up stage. Here plutoniumand MA in HLW, obtained through partitioning after seven years cooling of products from reprocessingthe fuel burned up to 33 GWd/tHM (plus three years of manufacturing time) have compositions as inTable 2 (this fuel is denoted as MOX11).
Three more fuel compositions based on Pu and MA vectors denoted as MOX21, MOX12, andMOX22 have been added to this benchmark as shown in Table 2. These extra cases are considered bythe FZK (Germany), which proposes investigating the physics of different transmutation concepts inPWRs (see details in the PWR benchmark proposal). Hence, MOX21 refers to plutonium and MAcompositions resulting from the reprocessing of 4.65% UO2 fuel from a Stage 1 PWR burned to50 MWd/tHM, MOX12 refers to plutonium and MA compositions resulting from the reprocessing of4.1% MOX11 burned to 33 MWd/tHM in a Stage 2 PWR and then admixed with depleted uranium,and MOX22 refers to Pu and MA compositions resulting from the reprocessing of 6.0% MOX21burned to 50 MWd/tHM in a Stage 2 PWR and then admixed with natural uranium. In all cases, sevenyears of cooling time of spent fuel before reprocessing plus three years of MOX manufacturing time isconsidered. The resulting accelerator fuel compositions are heavily MA dominated as required by thedesign constraints of the accelerator considered (sub-critical core).
Figure 1 shows the two dimensional model of our proposed accelerator-based fast flux system.This system consists of a two-region tungsten target injected by a proton beam, MA fuelled core andreflectors, each of which is cooled by sodium flow. The optimised target is a stack of tungsten discs
112
with two different thicknesses as shown in Figure 2(a) [6]. The MA nitride fuel pins are arranged inthe core region as shown in Figure 2(b) [7]. Here the atom number densities are smeared in everyregion to simplify the benchmark problem, and the homogenised number densities are presented inTable 3.
Cross-section library
Participants should use their own cross-section library and energy group structure and providedescriptions of both.
Code description [8,10]
Code descriptions of the cascade code calculating the nuclear processes above 15 MeV energyand of the neutron transport code and the burn-up code for the energy range below 15 MeV should beprovided. Specifically, the calculational method, energy group structure and the actinide chainconsidered in the burn-up calculations should be included in the code description.
Requested results
This hybrid system is expected to be driven by a proton beam of 1 GeV energy and a current of10 mA in the sub-critical state of keff = 0.9. The neutron transport process in target/core may becalculated as the fixed source problem based on spallation neutron distributions using transport codeor diffusion code. Burn-up calculations should be made for actinides in the energy range below15 MeV with the fixed neutron spectrum to make one-group cross-sections. Participants are requestedto provide the following benchmark results that are specified in points a)-c).
a) Spallation neutrons (energy range from 1 GeV to 15-20 MeV, initial core):
• Number of spallation neutrons per incident proton.
• Region averaged spallation neutron spectra in target and core.
• Axial distribution of neutrons leaking from target at r = 150 mm.
• Maximum and average heat power densities in target region.
b) Nuclear characteristics of transmutation target/core (energy range 15-20 MeV, initial core):
• Effective neutron multiplication factor.
• Sodium void reactivity effect (include sodium in target region).
• Region averaged neutron spectra in target and core.
• Average neutron energy in core region.
• Axial neutron flux distributions at r = 75 mm and r = 275mm.
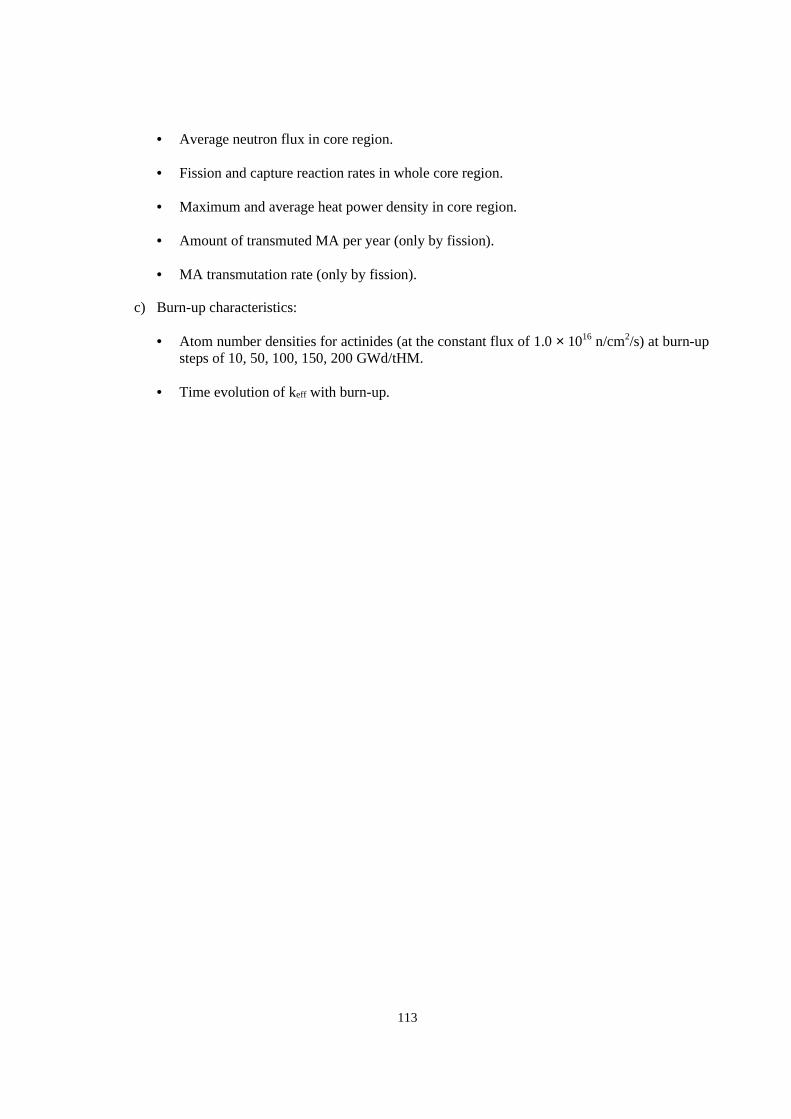
113
• Average neutron flux in core region.
• Fission and capture reaction rates in whole core region.
• Maximum and average heat power density in core region.
• Amount of transmuted MA per year (only by fission).
• MA transmutation rate (only by fission).
c) Burn-up characteristics:
• Atom number densities for actinides (at the constant flux of 1.0 × 10¹⁶ n/cm2/s) at burn-upsteps of 10, 50, 100, 150, 200 GWd/tHM.
• Time evolution of keff with burn-up.
114
REFERENCES TO APPENDIX A.3
[1] T. Takizuka, et al., “A Study of Incineration Target System”, Proc. 5th Int. Conf. Emerg. Nucl.Systems, Karlsruhe (1989).
[2] M. Mizumoto, et al., “High Intensity Proton Accelerator for Nuclear Waste Transmutation”,16th Int. Linear Accelerator Conf. LINAC-92, Ottawa (1992).
[3] Y. Kato, et al., “Accelerator Molten-Salt Target System for Transmutation of Long-LivedNuclides”, Proc. OECD/NEA Specialists Meeting on Accelerator-Based Transmutation, PSI(1992).
[4] H. Katsuta, et al., “A Continuous Transmutation System for Long-Lived Nuclides withAccelerator-Driven Fluid Target”, Proc. 2nd Inform. Exch. Meeting, Argonne (1993).
[5] H. Katsuta, et al., “A Concept of Accelerator-Based Incineration System for Transmutation ofTRU and FP with Liquid TRU-Alloy Target and Molten Salt Blanket”, Proc. ICENES’93,Makuhari (1993), pp. 424.
[6] T. Nishida, et al., “Minor Actinide Transmutation System with an Intense Proton Accelerator”,Proc. ICENES’93, Makuhari (1993), pp. 419.
[7] T. Takizuka, et al., “Conceptual Design Study of an Accelerator-Based Actinide TransmutationPlant with Sodium-Cooled Slid Target/Core”, Proc. 2nd Inform. Exch. Meeting, Argonne(1993), pp. 397.
[8] Y. Nakahara, Tsutsui, “NMTC/JAERI – A Simulation Code System for High Energy NuclearReactions and Nucleon-Meson Transport Process”, JAERI-M 82-198 (1982) (in Japanese).
[9] T. Nishida, et al., “Improvement of Spallation Reaction Simulation Codes NMTC/JAERI andNUCLEUS”, 2nd Int. Symp. on Advanced Nuclear Energy Research, Mito (1990).
[10] T. Nishhida, Y. Nakahara, JAERI-M 84-154 (1984) (in Japanese).
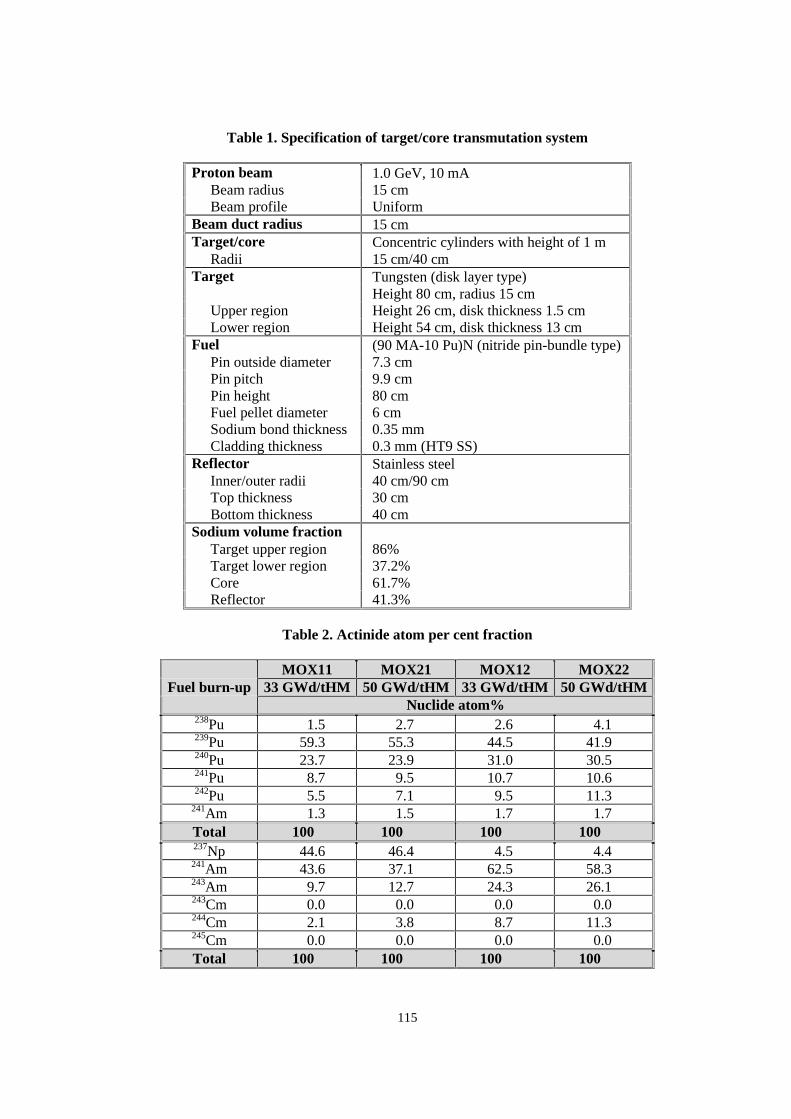
115
Table 1. Specification of target/core transmutation system
Proton beam 1.0 GeV, 10 mABeam radius 15 cmBeam profile Uniform
Beam duct radius 15 cmTarget/core Concentric cylinders with height of 1 m
Radii 15 cm/40 cmTarget Tungsten (disk layer type)
Height 80 cm, radius 15 cmUpper region Height 26 cm, disk thickness 1.5 cmLower region Height 54 cm, disk thickness 13 cm
Fuel (90 MA-10 Pu)N (nitride pin-bundle type)Pin outside diameter 7.3 cmPin pitch 9.9 cmPin height 80 cmFuel pellet diameter 6 cmSodium bond thickness 0.35 mmCladding thickness 0.3 mm (HT9 SS)
Reflector Stainless steelInner/outer radii 40 cm/90 cmTop thickness 30 cmBottom thickness 40 cm
Sodium volume fractionTarget upper region 86%Target lower region 37.2%Core 61.7%Reflector 41.3%
Table 2. Actinide atom per cent fraction
MOX11 MOX21 MOX12 MOX2233 GWd/tHM 50 GWd/tHM 33 GWd/tHM 50 GWd/tHMFuel burn-up
Nuclide atom%238Pu 1.5 2.7 2.6 4.1239Pu 59.3 55.3 44.5 41.9240Pu 23.7 23.9 31.0 30.5241Pu 8.7 9.5 10.7 10.6242Pu 5.5 7.1 9.5 11.3
241Am 1.3 1.5 1.7 1.7Total 100 100 100 100237Np 44.6 46.4 4.5 4.4241Am 43.6 37.1 62.5 58.3243Am 9.7 12.7 24.3 26.1243Cm 0.0 0.0 0.0 0.0244Cm 2.1 3.8 8.7 11.3245Cm 0.0 0.0 0.0 0.0Total 100 100 100 100
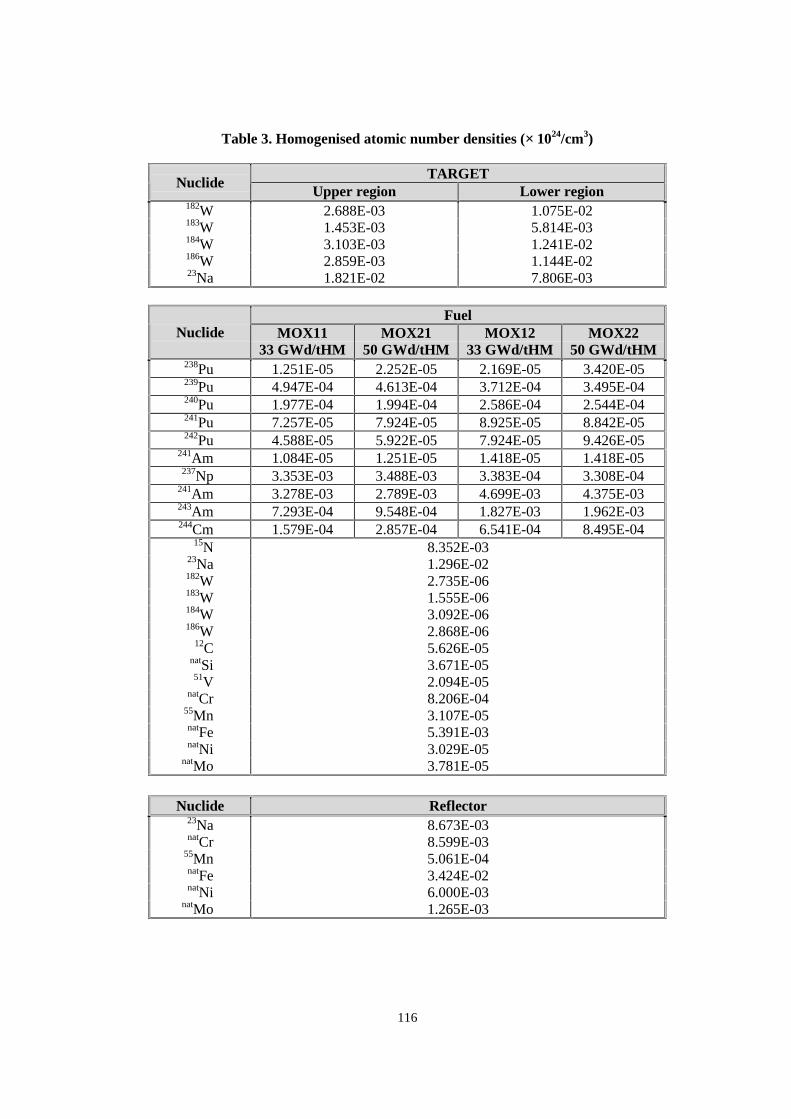
116
Table 3. Homogenised atomic number densities (× 1024/cm3)
TARGETNuclide
Upper region Lower region182W 2.688E-03 1.075E-02183W 1.453E-03 5.814E-03184W 3.103E-03 1.241E-02186W 2.859E-03 1.144E-0223Na 1.821E-02 7.806E-03
FuelNuclide MOX11
33 GWd/tHMMOX21
50 GWd/tHMMOX12
33 GWd/tHMMOX22
50 GWd/tHM238Pu 1.251E-05 2.252E-05 2.169E-05 3.420E-05239Pu 4.947E-04 4.613E-04 3.712E-04 3.495E-04240Pu 1.977E-04 1.994E-04 2.586E-04 2.544E-04241Pu 7.257E-05 7.924E-05 8.925E-05 8.842E-05242Pu 4.588E-05 5.922E-05 7.924E-05 9.426E-05
241Am 1.084E-05 1.251E-05 1.418E-05 1.418E-05237Np 3.353E-03 3.488E-03 3.383E-04 3.308E-04
241Am 3.278E-03 2.789E-03 4.699E-03 4.375E-03243Am 7.293E-04 9.548E-04 1.827E-03 1.962E-03244Cm 1.579E-04 2.857E-04 6.541E-04 8.495E-04
15N 8.352E-0323Na 1.296E-02182W 2.735E-06183W 1.555E-06184W 3.092E-06186W 2.868E-06
12C 5.626E-05natSi 3.671E-0551V 2.094E-05
natCr 8.206E-0455Mn 3.107E-05natFe 5.391E-03natNi 3.029E-05
natMo 3.781E-05
Nuclide Reflector23Na 8.673E-03natCr 8.599E-03
55Mn 5.061E-04natFe 3.424E-02natNi 6.000E-03
natMo 1.265E-03
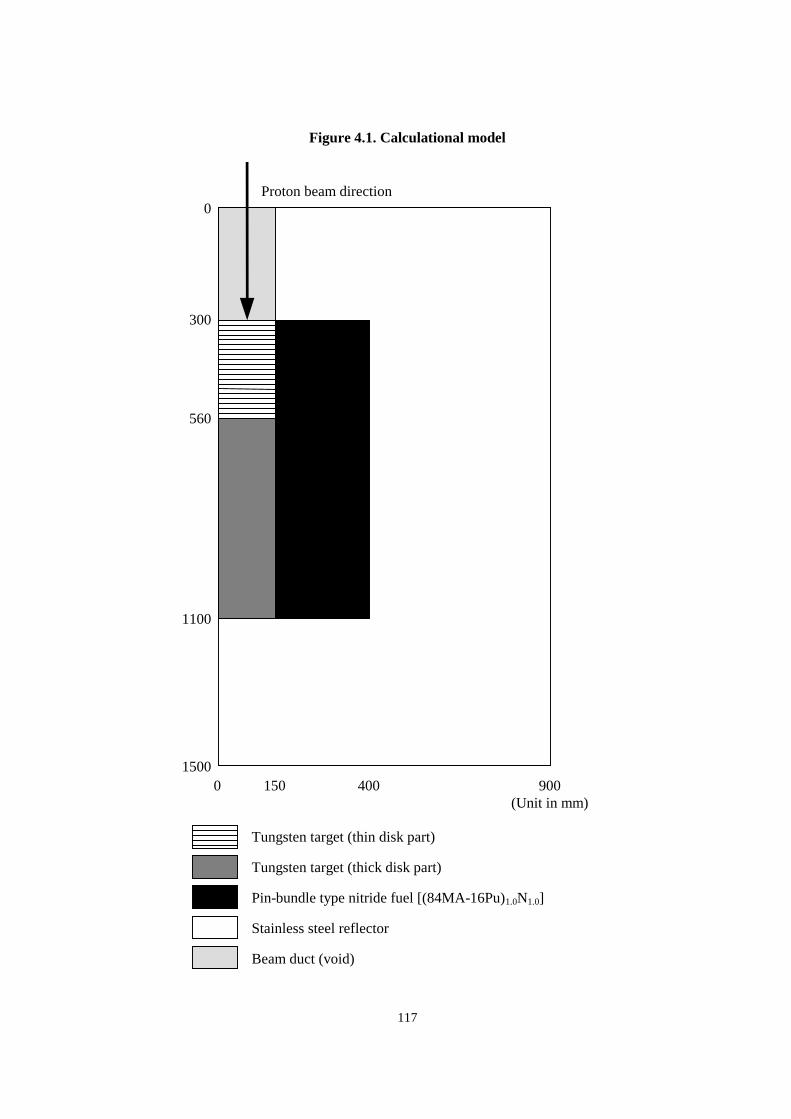
117
Figure 4.1. Calculational model
Proton beam direction0
300
560
1100
15000 150 400 900
(Unit in mm)
Tungsten target (thin disk part)
Tungsten target (thick disk part)
Pin-bundle type nitride fuel [(84MA-16Pu)1.0N1.0]
Stainless steel reflector
Beam duct (void)
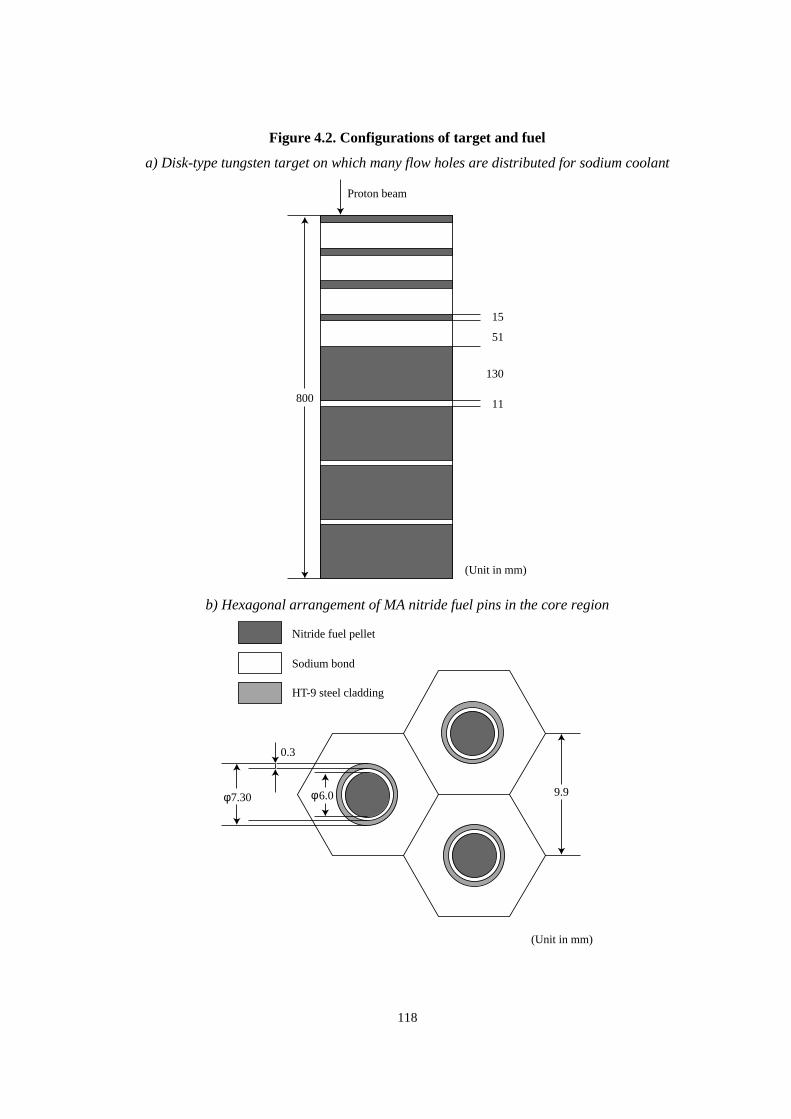
118
Figure 4.2. Configurations of target and fuel
a) Disk-type tungsten target on which many flow holes are distributed for sodium coolant
800 11
130
51
15
(Unit in mm)
Proton beam
b) Hexagonal arrangement of MA nitride fuel pins in the core region
(Unit in mm)
Nitride fuel pellet
Sodium bond
HT-9 steel cladding
9.9
0.3
7.30 6.0φ φ
119
APPENDIX B
Calculation DetailsSupplied by Participants

121
Appendix B.1
Pressurised water reactor benchmark
FZK (Germany)
1. Name of participant:C.H.M. Broeders
2. Organisation: Forschungszentrum Karlsruhe (FZK)
3. Name of code used: KAPROS/KARBUS
4. Bibliographic references:
[1] C.H.M. Broeders, “Entwicklungsarbeiten für die neutronenphysikalische Auslegung vonFortschrittlichen Druckwasser Reaktoren (FDWR) mit kompakten Dreiecksgittern inhexagonalen Brennelementen”, KfK 5072 (1992).
5. Origin of cross-section data:
• KEDAK4, ENDF/B-5/6, JEF-2.2
6. Spectral calculations and data reduction method used:
• Resonance shielding: Improved table look-up method for the self-shielding factors for allenergies and all isotopes.
7. Number of energy groups used in different phases:
• Cell calculation: 69 group WIMS structure, upscatter cut-off 4 eV.
• Burn-up calculation: one energy group
8. Calculations:
• Theory used: Transport theory
• Method used: Collision probability method in cell calculations, Bateman method (ORIGENderived) in depletion calculations
122
IKE (Germany)
1. Name of participant:D. Lutz
2. Organisation: Institut fuer Kernenergetik und EnergiesystemeUniversity of Stuttgart, Germany
3. Name of code used: RESMOD working in the SCALE system [1]Reactor code system RSYST3 [2]
4. Bibliographic references:
[1] W. Bernnat, D. Lutz, J. Keinert, M. Mattes, “Erstellung und Validierung vonWirkungsquerschnittsbibliotheken im SCALE-Format auf Basis der evaluierten DateienJEF-2 und ENDF/B-VI fuer Kritikalitaets- und Reaktorauslegungsrechnungen sowieStoerfallanalysen, IKE 6-189 (1994).
[2] R. Ruehle, “RSYST, an Integrated Modular System for Reactor and Shielding Calculations”,Conf-730 414-12 (1973).
5. Origin of cross-section data:
• JEF-2.2, processed to 292 group library N292 and 13 000 energy group library for about40 resonance and structural nuclides [1].
6. Spectral calculations and data reduction method used:
• Collapsing from 292 to 45 energy groups with a RESMOD spectrum generated applyingself-shielded cross-sections (BONAMI code in the SCALE system) and an ultrafine solution ofthe one-dimensional slowing down equation in the energy range from 1 000 eV to 3 eV with13 000 energy groups [1]. Mutual shielding for BOL is taken into account.
• Fission spectra are mixed corresponding to the isotopic production rates of 235U, 238U, 239Pu and241Pu in the four different pin cells.
• (n,2n) reaction is included in the scattering matrices.
7. Number of energy groups used in different phases:
• Spectral calculations with 292 groups.
• Cell burn-up calculations with 45 groups.
8. Calculations:
• One-dimensional cell calculations with a collision probability code in RSYST [2]. Burn-upcalculations for 20 actinides and 83 fission product isotopes in RSYST.
123
JAERI (Japan)
1. Name of participant: Hideki Takano, Hiroshi Akie and Kunio Kaneko
2. Organisation: Japan Atomic Energy Research Institute (JAERI)
3. Name of code used: SRAC95
4. Bibliographic references:
[1] K. Tsuchihashi, et al., “Revised SRAC Code System”, JAERI-1302 (1986).
[2] K. Okumure, et al., “SRAC95, General Purpose Neutronics Code System”, JAERI-Data/Code96-015 (1996), in Japanese.
5. Origin of cross-section data:
• JENDL-3.2.
6. Spectral calculations and data reduction method used:
• Resonance shielding:
− PEACO: ultra-fine energy group calculation with collision probability method is used in thefollowing energy range:
961.12-130.07 eV (lethargy width = 0.00025)130.07 eV – thermal cut-off (lethargy width = 0.0005)
(thermal cut-off energy in the benchmark = 2.3824 eV) for main resonant and fissionproduct nuclides.
− Table look-up method: the self-shielding factors calculated by the ultra-fine group methodfor homogeneous system are used for the other nuclides except for those calculated with thePEACO method.
• Mutual shielding:
Mutual shielding effect is accurately treated by the PEACO method
• Weighting spectrum for scatting matrices:
Correction of the out-scatter and self-scatter cross-section is considered by elastic and elasticremoval f-tables. In PEACO energy range, the out-elastic-scatter and self-elastic-scatter arecalculated using ultra-fine spectrum and ultra-fine elastic cross-sections for the resonantmaterial.
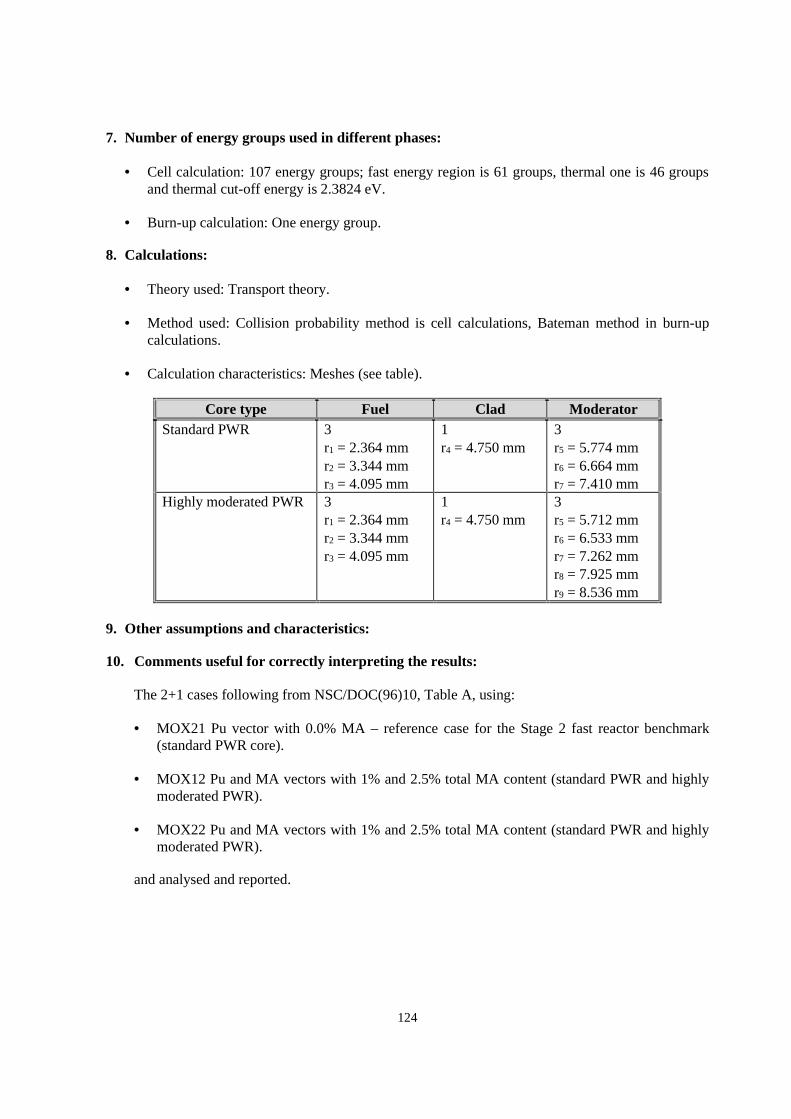
124
7. Number of energy groups used in different phases:
• Cell calculation: 107 energy groups; fast energy region is 61 groups, thermal one is 46 groupsand thermal cut-off energy is 2.3824 eV.
• Burn-up calculation: One energy group.
8. Calculations:
• Theory used: Transport theory.
• Method used: Collision probability method is cell calculations, Bateman method in burn-upcalculations.
• Calculation characteristics: Meshes (see table).
Core type Fuel Clad ModeratorStandard PWR 3
r1 = 2.364 mmr2 = 3.344 mmr3 = 4.095 mm
1r4 = 4.750 mm
3r5 = 5.774 mmr6 = 6.664 mmr7 = 7.410 mm
Highly moderated PWR 3r1 = 2.364 mmr2 = 3.344 mmr3 = 4.095 mm
1r4 = 4.750 mm
3r5 = 5.712 mmr6 = 6.533 mmr7 = 7.262 mmr8 = 7.925 mmr9 = 8.536 mm
9. Other assumptions and characteristics:
10. Comments useful for correctly interpreting the results:
The 2+1 cases following from NSC/DOC(96)10, Table A, using:
• MOX21 Pu vector with 0.0% MA – reference case for the Stage 2 fast reactor benchmark(standard PWR core).
• MOX12 Pu and MA vectors with 1% and 2.5% total MA content (standard PWR and highlymoderated PWR).
• MOX22 Pu and MA vectors with 1% and 2.5% total MA content (standard PWR and highlymoderated PWR).
and analysed and reported.
125
Tohoku University (Japan)
1. Name of participant:Tomohiko Iwasaki and Daisuke Fujiwara
2. Organisation: Tohoku University, Japan
3. Name of code used: SWAT
4. Bibliographies references:
[1] K. Suyama, T. Iwasaki and N. Hirakawa, “SWAT: Code Manual”, Japan Atomic EnergyResearch Institute, JAERI-Data/Code 97-047 (1997).
[2] K. Suyama, T. Iwasaki and N. Hirakawa, “Analysis of Post-Irradiation Experiments in PWRUsing New Nuclear Data Libraries”, J. Nucl. Sci. Tech., 31 (6), 596-608 (1994).
[3] K. Suyama, T. Iwasaki and N. Hirakawa, “Improvement of Burn-up Code System for Use inBurn-up Credit Problem”, Proc. on PHYSOR’96, L-53 (1996).
5. Origin of cross-section data:
• JENDL-3.2.
6. Spectral calculations and data reduction method used:
• Resonance shielding:
− Method 1: Direct calculation using ultra-fine energy groups.Energy range: 130 eV to 3.92 eV.Nuclides:232Th, 233~236,238U, 237,239Np, 236,238~242Pu, 241~243Am, 244,245Cm, 99Tc, 103Rh, 113In,
131Xe, 137Cs, 155~158,160Gd, 107,109Ag, 174,176~180Hf.
− Method 2: f-table method.Energy range: Above 3.92 eV.Nuclides: Other nuclides.
• Mutual shielding: Implicitly considered by the direct calculation using ultra-fine energy groups.
• Weighting spectrum for scattering matrices: S(α,β).
7. Number of energy groups used in the different phases:
• Fast and epithermal:Energy range: 10 MeV to 3.92 eV.No. of groups: 59 groups.
• Thermal:Energy range: below 3.92 eV.No. of groups: 48 groups.
126
8. Calculations:
• Theory used: Cell calculation in infinite cylinder geometry with equivalent radii.
• Method used: Collision probability method.
• Calculation characteristics:
Three coarse mesh for pin: Fuel, cladding, coolant.Nine fine mesh for fuel.One fine mesh for cladding.One fine mesh for coolant.
9. Other assumptions and characteristics:
Decay data: ORIGEN-2 built-in values with a few revised data based on the “Table of Isotope”(seventh edition).
FP yield: JNDC Library (1990), Fission Yield Library for 1 228 nuclides of Japan Nuclear DataCentre (1990).
127
ITEP (Russian Federation)
1. Names of participant: B.P. Kochurov, A.Yu. Kwaratzheli and N.N. Selivanova
2. Organisation: State Scientific Centre – Institute of Theoretical and Experimental PhysicsB. Cheremushkinskaya, 25, Moscow, 117218, Russian FederationE-mail: [email protected]/Fax: (095) 127-0543
3. Name of code used: TRIFON [1-3](authors B.P. Kochurov, A.Yu. Kwaratzheli, V.M. Michailov)
4. Bibliographic references:
[1] B.P. Kochurov, A.Yu. Kwaratzheli, V.M. Michailov, “Computer Code TRIFON: Manual”,Pre-print ITEP 10-95, Institute of Theoretical and Experimental Physics, Moscow, 1995.
[2] A.Yu. Kwaratzheli, B.P. Kochurov, “Computer Code TRIFON Abstract”, VANT, Ser.:PHTYAR (Russ.), 1985, N4, p. 45-47.
[3] B.P. Kochurov, A.Yu. Kwaratzheli, A.P. Knyazev, “New Methods and Computer CodesDevelopments for Neutron Reactor Physics Calculations”, International Conf. on the Physicsof Nuclear Science and Technology, Long Island, New York, 5-8 October 1998.
[4] L.P. Abag’an, et el., “Group Constants for Reactor and Shielding Calculations”, Moscow,Energoatomizdat, 1981.
[5] S.F. Mughabghab, “Neutron Cross-Sections, Volume 1, Neutron Resonance Parameters andThermal Cross-Sections”, National Nuclear Data Center, Brookhaven National Laboratory,Academic Press, 1984.
[6] S.V. Akimushkin, B.P. Kochurov, “Effective Resonances of 238U”, VANT, Ser.: PHTYAR(Russ.), 1991, N1, p. 25.
[7] V.A. Konjshin, “Nuclear Data for Fissile Nuclides, Handbook”, Moscow, EnergoAtomizdat,1984.
[8] “JNDC Nuclear Data Library of Fission Products”, Second Version, JAERI 1320, JapanAtomic Energy Research Institute, September 1990.
[9] A.D. Galanine, “Revision of Scheme of the Main Fission Products and Weak EffectiveFission Products”, Pre-print ITEP 135-89, Moscow-TsniiAtomInform, 1989.
5. Origin of cross-section data:
Twenty-six group system of BNAB-26 nuclear data library [4], resonance parameters [5], effectiveresonance parameters for 238U [6], cross-sections for thermal region and multi-group cross-sectionsfor Pu isotopes [7], fission products yields [8], parameters of weak effective (lumped) fissionproducts [9].
128
6. Spectral calculations and data reduction method used:
Fission spectrum χ(E) in the interval of energies 10.5 MeV >E >0.00465 MeV , is based on theformula:
Xi(E) = 2exp(-ab/4)exp(-E/a)Sh(Sqrt(bE))/Sqrt(πa3b),
where: a = 0.965(0.8+0.08ν), b = 2.245/(0.8+0.08ν)2, and corresponding to ν =2.416 was takenfrom [4] (ν – number of secondary neutrons released in fission).
K∞ spectrum as the result of space-energy neutron transport solution in the cell was used fortwo-group microscopic cross-sections determination to simulate burn-up.
• Strong resonances of 238U below 215 eV and above 0.465 eV were explicitly treated with a finenon-uniform sub-division of lethargy scale into 130 groups.
Strong resonances of 237Np, 240Pu, 242Pu, 241Am, 243Am, 244Cm were explicitly treated as well.
For 238U effective resonance levels [6] were used (one resonance per group in 11-16 groups ofBNAB system [4]).
Self-shielding factors of 235U, 239Pu, Zr [4] were taken into account with a mean chord (dilutioncross-section) determined as the solution of inverse problem.
• Mutual shielding (overlapping of resonances).
Overlapping of strong resonances is treated automatically in the solution of space-energyproblem for reactor cell.
• Weighting spectrum of scattering matrices: space-energy distribution of neutron spectrum(below 0.465 eV) was calculated as a solution of space-energy thermalisation problem withNelkin model for H2O and capture and fission cross-sections from [7].
7. Number of energy groups used in different phases:
Each of 11-16 groups having lethargy width 0.765 of BNAB system in the range of energies215-21 500 eV was separated into 20 sub-intervals (non-uniform division) to describe resonanceabsorption by effective resonances of 238U.
One hundred thirty sub-intervals in the range 0.465-215 eV were used to describe resonanceabsorption by strong resonances. Ten groups were used in the interval 0 < E < 0.465 eV for thermalneutrons.
Total number of energy groups is 270.
8. Calculations:
• Theory used [3]: collision probability method was used for every energy group. Multi-groupcalculations with downscattering (above 0.465 eV) and upscattering and downscattering in therange of thermal neutrons were used.
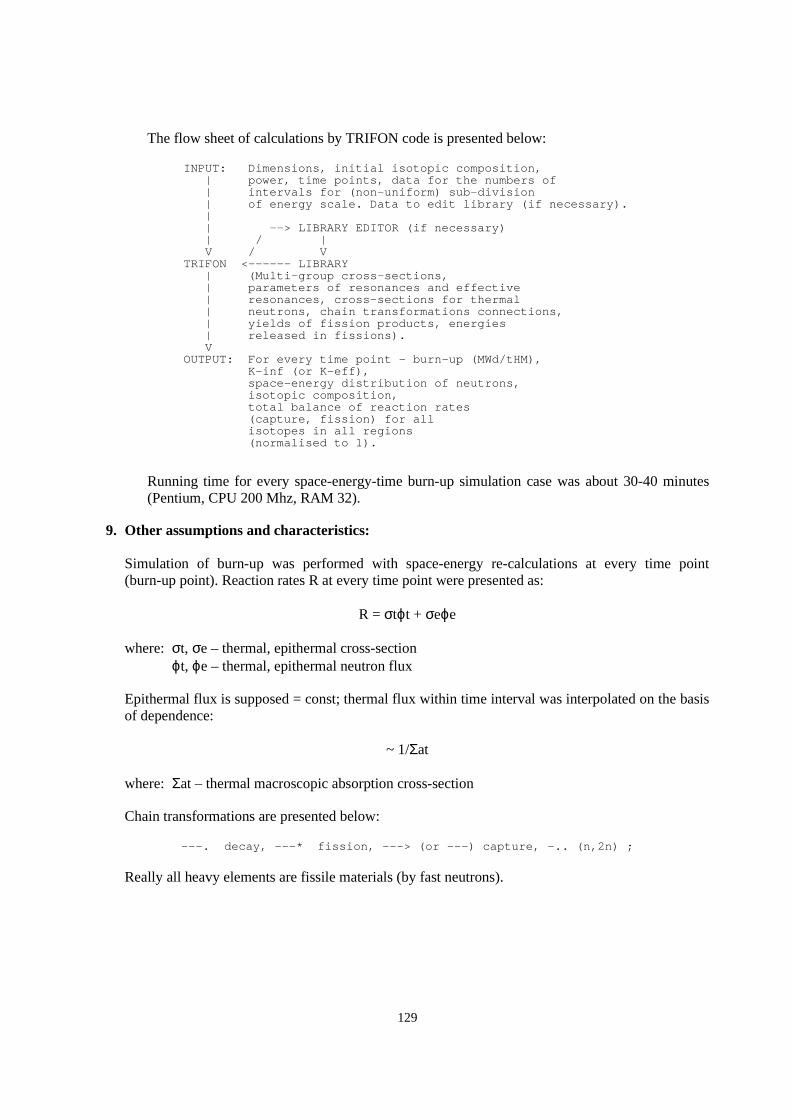
129
The flow sheet of calculations by TRIFON code is presented below:
INPUT: Dimensions, initial isotopic composition, | power, time points, data for the numbers of | intervals for (non-uniform) sub-division | of energy scale. Data to edit library (if necessary). | | --> LIBRARY EDITOR (if necessary) | / | V / VTRIFON <------ LIBRARY | (Multi-group cross-sections, | parameters of resonances and effective | resonances, cross-sections for thermal | neutrons, chain transformations connections, | yields of fission products, energies | released in fissions). VOUTPUT: For every time point – burn-up (MWd/tHM), K-inf (or K-eff), space-energy distribution of neutrons, isotopic composition, total balance of reaction rates (capture, fission) for all isotopes in all regions (normalised to 1).
Running time for every space-energy-time burn-up simulation case was about 30-40 minutes(Pentium, CPU 200 Mhz, RAM 32).
9. Other assumptions and characteristics:
Simulation of burn-up was performed with space-energy re-calculations at every time point(burn-up point). Reaction rates R at every time point were presented as:
R = σtϕt + σeϕe
where: σt, σe – thermal, epithermal cross-sectionϕt, ϕe – thermal, epithermal neutron flux
Epithermal flux is supposed = const; thermal flux within time interval was interpolated on the basisof dependence:
~ 1/Σat
where: Σat – thermal macroscopic absorption cross-section
Chain transformations are presented below:
---. decay, ---* fission, ---> (or ---) capture, -.. (n,2n) ;
Really all heavy elements are fissile materials (by fast neutrons).

130
Chain transformations for heavy nuclides
Cf249->Cf250->Cf251->Cf252-> | . /| ^ | | | * \ / * | * * | \ | | / Bk249 <-- / | | \ / . * \ . Cm242->Cm243 ---> Cm244->Cm245->Cm246->Cm247->Cm248 | | | | / | ^ | | | | | * | * / * \ * * * * | | ______/ \ / || \ / / |Am241->Am242*->Am243 / / | | . ^ | / / | * \ | * . . . \ | Pu238-> Pu239->Pu240->Pu241 ->Pu242 | | . | . | \ | | * | \ * \ * \ * * / \ \ ----\ / \ \ \ / Np237-> Np238->Np239<---- / | . | | \ / * \ * * \ / \ | / \ | / \ | . \ ..--(n,2n) |U234 ->U235->U236->U237 ->U238----- / | /| | |. * . * * *
242Am*
* (Fiss.) | | (10%)----> Am242m ->Am243 ^ / 152 yearsAm241 / . (0.5%) |(99.5%) | \ Pu238 | * V . (90%)----> Am242g -->Am243 | 16 h * (84%) (16%) | \ . . Cm242 Pu242
Chain transformations for fission products (* means direct yield in fissions)
* * * * Fps5 Fps8 Fps9 Fps1
* * * * * *Kr83 Zr95 Mo99 Ru103 Pd108->Ag109 | | | . . . * * * Nb95 Tc99->Ru100 Rh103 Rh105 Cd113 In115 | | . . Mo95 Pd105
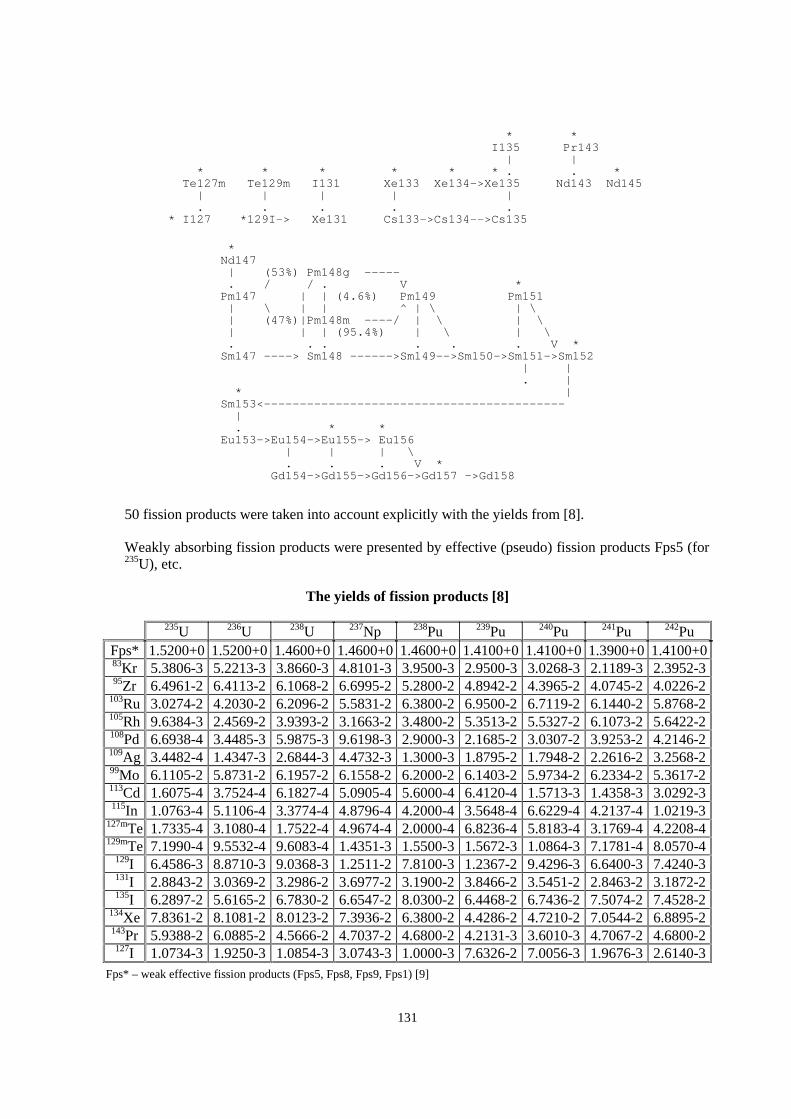
131
* * I135 Pr143 | | * * * * * * . . * Te127m Te129m I131 Xe133 Xe134->Xe135 Nd143 Nd145 | | | | | . . . . .* I127 *129I-> Xe131 Cs133->Cs134-->Cs135
*Nd147 | (53%) Pm148g ----- . / / . V *Pm147 | | (4.6%) Pm149 Pm151 | \ | | ^ | \ | \ | (47%)|Pm148m ----/ | \ | \ | | | (95.4%) | \ | \ . . . . . . V *Sm147 ----> Sm148 ------>Sm149-->Sm150->Sm151->Sm152 | | . | * |Sm153<------------------------------------------ | . * *Eu153->Eu154->Eu155-> Eu156 | | | \ . . . V * Gd154->Gd155->Gd156->Gd157 ->Gd158
50 fission products were taken into account explicitly with the yields from [8].
Weakly absorbing fission products were presented by effective (pseudo) fission products Fps5 (for235U), etc.
The yields of fission products [8]
235U 236U 238U 237Np 238Pu 239Pu 240Pu 241Pu 242PuFps* 1.5200+0 1.5200+0 1.4600+0 1.4600+0 1.4600+0 1.4100+0 1.4100+0 1.3900+0 1.4100+083Kr 5.3806-3 5.2213-3 3.8660-3 4.8101-3 3.9500-3 2.9500-3 3.0268-3 2.1189-3 2.3952-395Zr 6.4961-2 6.4113-2 6.1068-2 6.6995-2 5.2800-2 4.8942-2 4.3965-2 4.0745-2 4.0226-2
103Ru 3.0274-2 4.2030-2 6.2096-2 5.5831-2 6.3800-2 6.9500-2 6.7119-2 6.1440-2 5.8768-2105Rh 9.6384-3 2.4569-2 3.9393-2 3.1663-2 3.4800-2 5.3513-2 5.5327-2 6.1073-2 5.6422-2108Pd 6.6938-4 3.4485-3 5.9875-3 9.6198-3 2.9000-3 2.1685-2 3.0307-2 3.9253-2 4.2146-2109Ag 3.4482-4 1.4347-3 2.6844-3 4.4732-3 1.3000-3 1.8795-2 1.7948-2 2.2616-2 3.2568-299Mo 6.1105-2 5.8731-2 6.1957-2 6.1558-2 6.2000-2 6.1403-2 5.9734-2 6.2334-2 5.3617-2113Cd 1.6075-4 3.7524-4 6.1827-4 5.0905-4 5.6000-4 6.4120-4 1.5713-3 1.4358-3 3.0292-3115In 1.0763-4 5.1106-4 3.3774-4 4.8796-4 4.2000-4 3.5648-4 6.6229-4 4.2137-4 1.0219-3
127mTe 1.7335-4 3.1080-4 1.7522-4 4.9674-4 2.0000-4 6.8236-4 5.8183-4 3.1769-4 4.2208-4129mTe 7.1990-4 9.5532-4 9.6083-4 1.4351-3 1.5500-3 1.5672-3 1.0864-3 7.1781-4 8.0570-4
129I 6.4586-3 8.8710-3 9.0368-3 1.2511-2 7.8100-3 1.2367-2 9.4296-3 6.6400-3 7.4240-3131I 2.8843-2 3.0369-2 3.2986-2 3.6977-2 3.1900-2 3.8466-2 3.5451-2 2.8463-2 3.1872-2135I 6.2897-2 5.6165-2 6.7830-2 6.6547-2 8.0300-2 6.4468-2 6.7436-2 7.5074-2 7.4528-2
134Xe 7.8361-2 8.1081-2 8.0123-2 7.3936-2 6.3800-2 4.4286-2 4.7210-2 7.0544-2 6.8895-2143Pr 5.9388-2 6.0885-2 4.5666-2 4.7037-2 4.6800-2 4.2131-3 3.6010-3 4.7067-2 4.6800-2127I 1.0734-3 1.9250-3 1.0854-3 3.0743-3 1.0000-3 7.6326-2 7.0056-3 1.9676-3 2.6140-3
Fps* – weak effective fission products (Fps5, Fps8, Fps9, Fps1) [9]
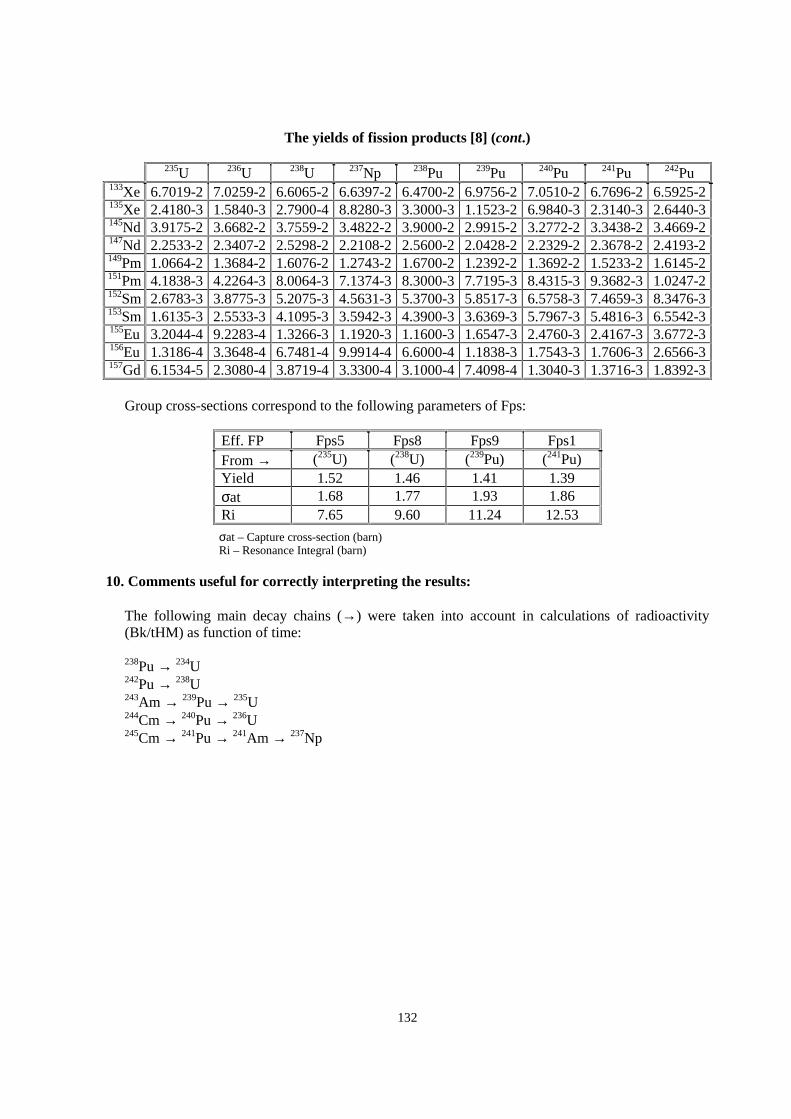
132
The yields of fission products [8] (cont.)
235U 236U 238U 237Np 238Pu 239Pu 240Pu 241Pu 242Pu133Xe 6.7019-2 7.0259-2 6.6065-2 6.6397-2 6.4700-2 6.9756-2 7.0510-2 6.7696-2 6.5925-2135Xe 2.4180-3 1.5840-3 2.7900-4 8.8280-3 3.3000-3 1.1523-2 6.9840-3 2.3140-3 2.6440-3145Nd 3.9175-2 3.6682-2 3.7559-2 3.4822-2 3.9000-2 2.9915-2 3.2772-2 3.3438-2 3.4669-2147Nd 2.2533-2 2.3407-2 2.5298-2 2.2108-2 2.5600-2 2.0428-2 2.2329-2 2.3678-2 2.4193-2149Pm 1.0664-2 1.3684-2 1.6076-2 1.2743-2 1.6700-2 1.2392-2 1.3692-2 1.5233-2 1.6145-2151Pm 4.1838-3 4.2264-3 8.0064-3 7.1374-3 8.3000-3 7.7195-3 8.4315-3 9.3682-3 1.0247-2152Sm 2.6783-3 3.8775-3 5.2075-3 4.5631-3 5.3700-3 5.8517-3 6.5758-3 7.4659-3 8.3476-3153Sm 1.6135-3 2.5533-3 4.1095-3 3.5942-3 4.3900-3 3.6369-3 5.7967-3 5.4816-3 6.5542-3155Eu 3.2044-4 9.2283-4 1.3266-3 1.1920-3 1.1600-3 1.6547-3 2.4760-3 2.4167-3 3.6772-3156Eu 1.3186-4 3.3648-4 6.7481-4 9.9914-4 6.6000-4 1.1838-3 1.7543-3 1.7606-3 2.6566-3157Gd 6.1534-5 2.3080-4 3.8719-4 3.3300-4 3.1000-4 7.4098-4 1.3040-3 1.3716-3 1.8392-3
Group cross-sections correspond to the following parameters of Fps:
Eff. FP Fps5 Fps8 Fps9 Fps1From → (235U) (238U) (239Pu) (241Pu)Yield 1.52 1.46 1.41 1.39σat 1.68 1.77 1.93 1.86Ri 7.65 9.60 11.24 12.53
σat – Capture cross-section (barn)Ri – Resonance Integral (barn)
10. Comments useful for correctly interpreting the results:
The following main decay chains (→) were taken into account in calculations of radioactivity(Bk/tHM) as function of time:
238Pu → 234U242Pu → 238U243Am → 239Pu → 235U244Cm → 240Pu → 236U245Cm → 241Pu → 241Am → 237Np
133
IPPE (Russian Federation)*
1. Name of participant:A.A. Tsiboulia
2. Organisation: IPPE, Russian Federation
3. Name of code used:
4. Bibliographic references:
5. Origin of cross-section data:
6. Spectral calculations and data reduction method used:
7. Number of energy groups used in different phases:
8. Calculations:
9. Other assumptions and characteristics:
10. Comments useful for correctly interpreting the results:
* Calculation details have not been provided.

135
Appendix B.2
Fast reactor benchmark
JAERI (Japan)
1. Name of participant:Kazufumi Tsujimoto, Hiroyuki Oigawa and Takehiko Mukaiyama
2. Organisation: Japan Atomic Energy Research Institute (JAERI)
3. Name of code used:
• Transmutation calculation: ABC-SC code system [1], which consists of the followingcomponents:
− Preparation of effective cross-sections: SLAROM [2].Calculation of steady-state neutronics: CITATION-FBR [3].Collapse of effective cross-section: ORILIB [1].Calculation of burn-up and decay: ORIGEN-2 [4].Management of fuel shuffling: F-CHANGE [1].
• Reactivity and reaction rate calculation: JAERI’s Standard Calculation System for FastReactor, which consists of the following components:
− Preparation of effective cross-sections: SLAROM [2].Calculation of steady-state neutronics: CITATION-FBR [3].Perturbation calculation: PERKY [5].Reaction rate calculation: RADAMES [6].
4. Bibliographic references:
[1] Y. Gunji, T. Mukaiyama, H. Takano and T. Takizuka, “A Computer Code System forActinide Transmutation Calculation in Fast Reactors – ABC-SC”, JAERI-M 92-032 (1992)(in Japanese).
[2] M. Nakagawa and K. Tsuchihashi, “SLAROM: A Code for Cell Homogenisation Calculationof Fast Reactor”, JAERI 1294 (1984).
[3] S. Iijima, “CITATION-FBR”, to be published.
[4] A.G. Croff, “ORIGEN-2: A Revised and Updated Version of Oak Ridge Isotope Generationand Development Code”, ORNL-5621 (1980).
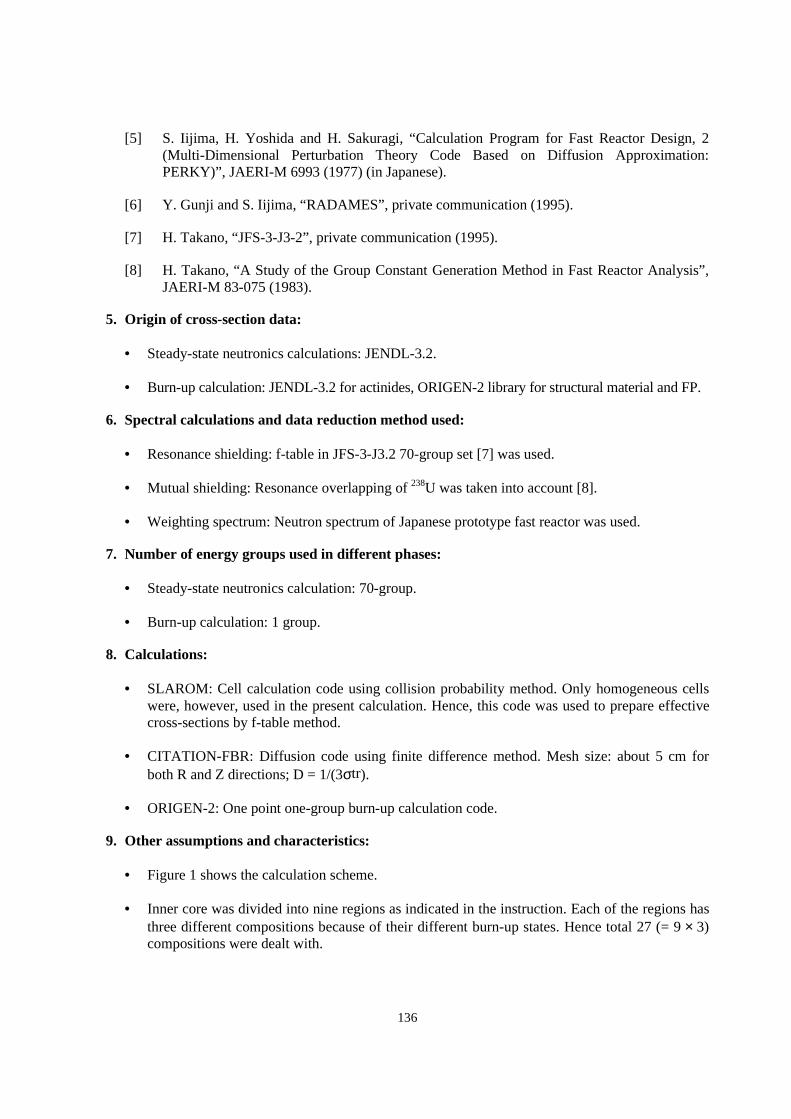
136
[5] S. Iijima, H. Yoshida and H. Sakuragi, “Calculation Program for Fast Reactor Design, 2(Multi-Dimensional Perturbation Theory Code Based on Diffusion Approximation:PERKY)”, JAERI-M 6993 (1977) (in Japanese).
[6] Y. Gunji and S. Iijima, “RADAMES”, private communication (1995).
[7] H. Takano, “JFS-3-J3-2”, private communication (1995).
[8] H. Takano, “A Study of the Group Constant Generation Method in Fast Reactor Analysis”,JAERI-M 83-075 (1983).
5. Origin of cross-section data:
• Steady-state neutronics calculations: JENDL-3.2.
• Burn-up calculation: JENDL-3.2 for actinides, ORIGEN-2 library for structural material and FP.
6. Spectral calculations and data reduction method used:
• Resonance shielding: f-table in JFS-3-J3.2 70-group set [7] was used.
• Mutual shielding: Resonance overlapping of 238U was taken into account [8].
• Weighting spectrum: Neutron spectrum of Japanese prototype fast reactor was used.
7. Number of energy groups used in different phases:
• Steady-state neutronics calculation: 70-group.
• Burn-up calculation: 1 group.
8. Calculations:
• SLAROM: Cell calculation code using collision probability method. Only homogeneous cellswere, however, used in the present calculation. Hence, this code was used to prepare effectivecross-sections by f-table method.
• CITATION-FBR: Diffusion code using finite difference method. Mesh size: about 5 cm forboth R and Z directions; D = 1/(3σtr).
• ORIGEN-2: One point one-group burn-up calculation code.
9. Other assumptions and characteristics:
• Figure 1 shows the calculation scheme.
• Inner core was divided into nine regions as indicated in the instruction. Each of the regions hasthree different compositions because of their different burn-up states. Hence total 27 (= 9 × 3)compositions were dealt with.

137
• Outer core was divided into six regions as indicated in the instruction. Each of the regions hasthree different compositions because of their different burn-up states. Hence total 18 (= 6 × 3)compositions were dealt with.
• Axial blanket was divided into two regions; one is located above and below the inner core andthe other is for the outer core. Each of the regions has three different compositions because oftheir different burn-up states. Hence total 6 (= 2 × 3) compositions were dealt with.
• Radial blanket was combined into one region, which has four different compositions because oftheir different burn-up states. Hence total 4 (= 1 × 4) compositions were dealt with.
• A total of 55 compositions were, therefore, dealt with in this problem.
• The codes SLAROM, ORILIB and ORIGEN-2 were executed 55 times per each burn-up step,respectively, to obtain effective cross-sections and compositions of each region.
• CITATION-FBR calculated keff and 70-group flux of each region, which was then used forcollapsing cross-sections in ORILIB.
• The thermal power output was normalised at 2 600 MW. The energy release per fission wasassumed at 202.6 MeV for all nuclei.
• ORILIB collapsed microscopic effective cross-section from 70-group to one-group. Thisone-group cross-section was used in ORIGEN-2 to update the actinide effective cross-section.
• Burn-up calculation in ORIGEN-2 was based on constant flux approximation. The flux valueswere taken from the CITATION-FBR results.
• No cooling time was assumed between burn-up states.
• No cooling time was assumed before the reprocessing.
• Two burn-up calculations and three keff calculations were performed in one cycle (365 EFPD).
10. Comments useful for correctly interpreting the results:
• Table 5: Reactivity losses:The calculation method for keff was not the same as that in Table 1. The 55 compositions weremixed into 18 regions before the SLAROM calculation for Table 5, though this procedure wasperformed after the SLAROM calculation for Table 1. The difference in burn-up reactivity wasless than 0.01%.
• Table 9: Doppler reactivity worth:238Pu, 242MAm and 243Cm do not have temperature dependent f-tables in JFS-3-J3.2. Hence,there is no Doppler effect in these nuclei.
• Table 11: Number densities of wastes:Average values for inner core, outer core and axial blanket.
138
Figure 1. Calculation scheme of ABC-SC code system
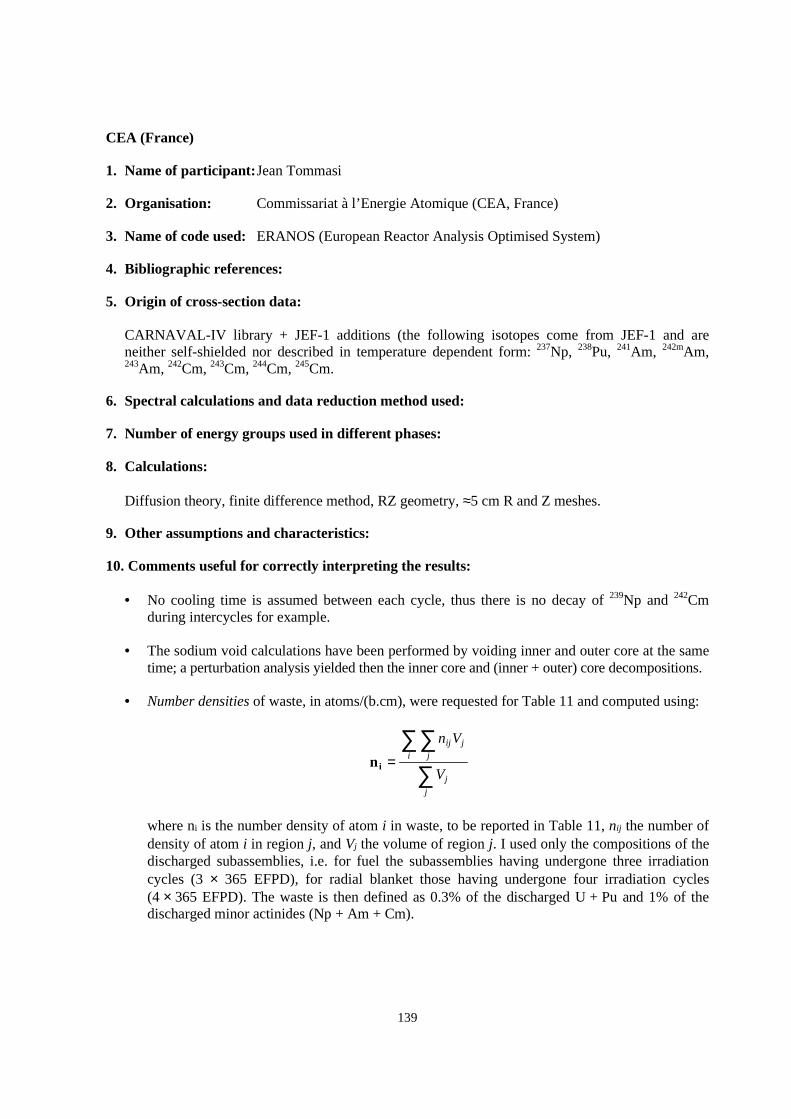
139
CEA (France)
1. Name of participant:Jean Tommasi
2. Organisation: Commissariat à l’Energie Atomique (CEA, France)
3. Name of code used: ERANOS (European Reactor Analysis Optimised System)
4. Bibliographic references:
5. Origin of cross-section data:
CARNAVAL-IV library + JEF-1 additions (the following isotopes come from JEF-1 and areneither self-shielded nor described in temperature dependent form: 237Np, 238Pu, 241Am, 242mAm,243Am, 242Cm, 243Cm, 244Cm, 245Cm.
6. Spectral calculations and data reduction method used:
7. Number of energy groups used in different phases:
8. Calculations:
Diffusion theory, finite difference method, RZ geometry, ≈5 cm R and Z meshes.
9. Other assumptions and characteristics:
10. Comments useful for correctly interpreting the results:
• No cooling time is assumed between each cycle, thus there is no decay of 239Np and 242Cmduring intercycles for example.
• The sodium void calculations have been performed by voiding inner and outer core at the sametime; a perturbation analysis yielded then the inner core and (inner + outer) core decompositions.
• Number densities of waste, in atoms/(b.cm), were requested for Table 11 and computed using:
ni =∑∑∑
n V
V
ij j
ji
j
j
where ni is the number density of atom i in waste, to be reported in Table 11, nij the number ofdensity of atom i in region j, and Vj the volume of region j. I used only the compositions of thedischarged subassemblies, i.e. for fuel the subassemblies having undergone three irradiationcycles (3 × 365 EFPD), for radial blanket those having undergone four irradiation cycles(4 × 365 EFPD). The waste is then defined as 0.3% of the discharged U + Pu and 1% of thedischarged minor actinides (Np + Am + Cm).

140
JNC (Japan)
1. Name of participant:Toshio Wakabayashi
2. Organisation: Power Reactor and Nuclear Fuel Development Corporation, Japan
3. Name of code used: SLAROM, CITATION, PERKY, ORIGEN-2
4. Bibliographic references:
5. Origin of cross-section data:
• JENDL-3.2.
6. Spectral calculations and data reduction method used:
• See Figure 1.
7. Number of energy groups used in different phases:
• Burn-up calculation: 7-group.
• Reactivity coefficient calculations: 70-group.
8. Calculations:
• Theory used: Diffusion.
• Method used: Finite difference.
• Calculation characteristics:
9. Other assumptions and characteristics:
• Decay chain: See Figures 2 and 3.
10. Comments useful for correctly interpreting the results:
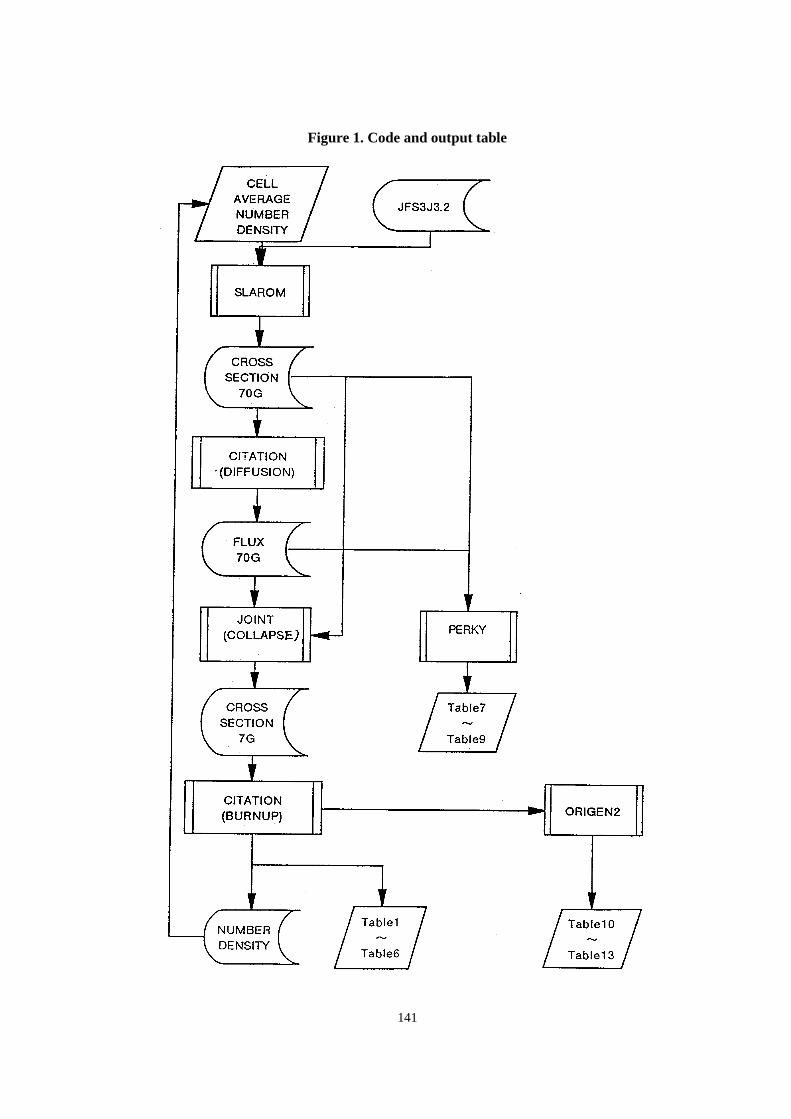
141
Figure 1. Code and output table
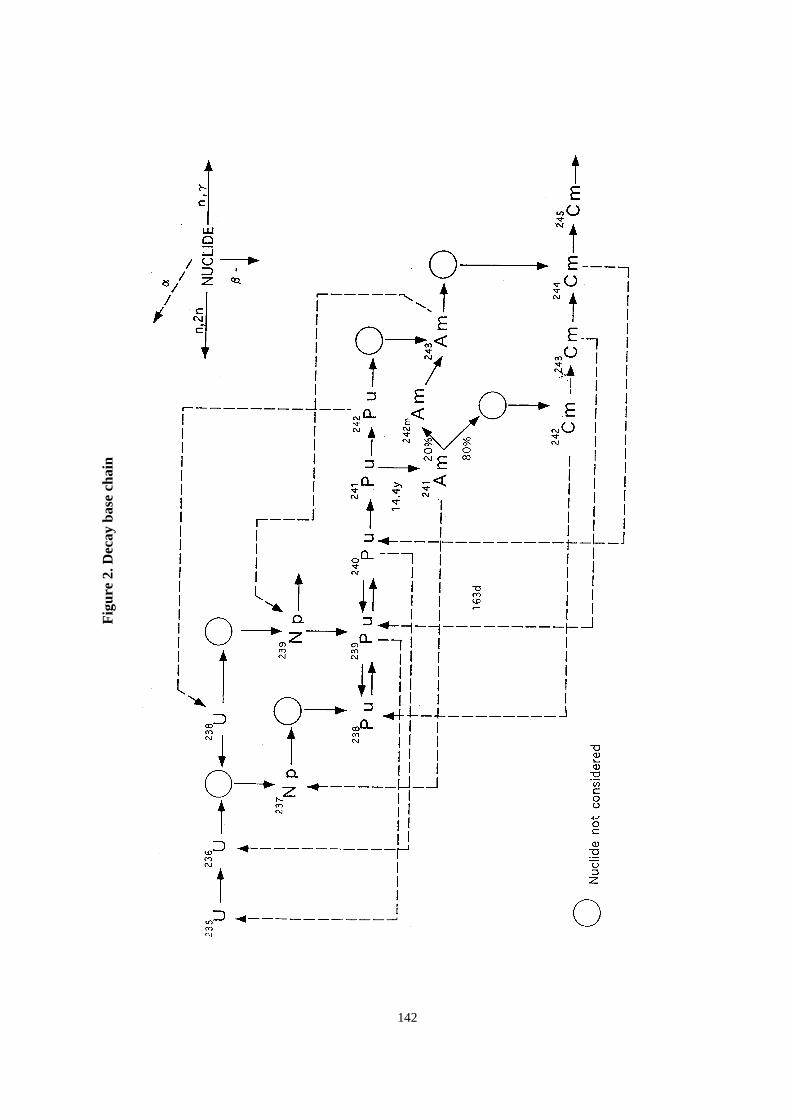
142
Fig
ure
2. D
ecay
bas
e ch
ain
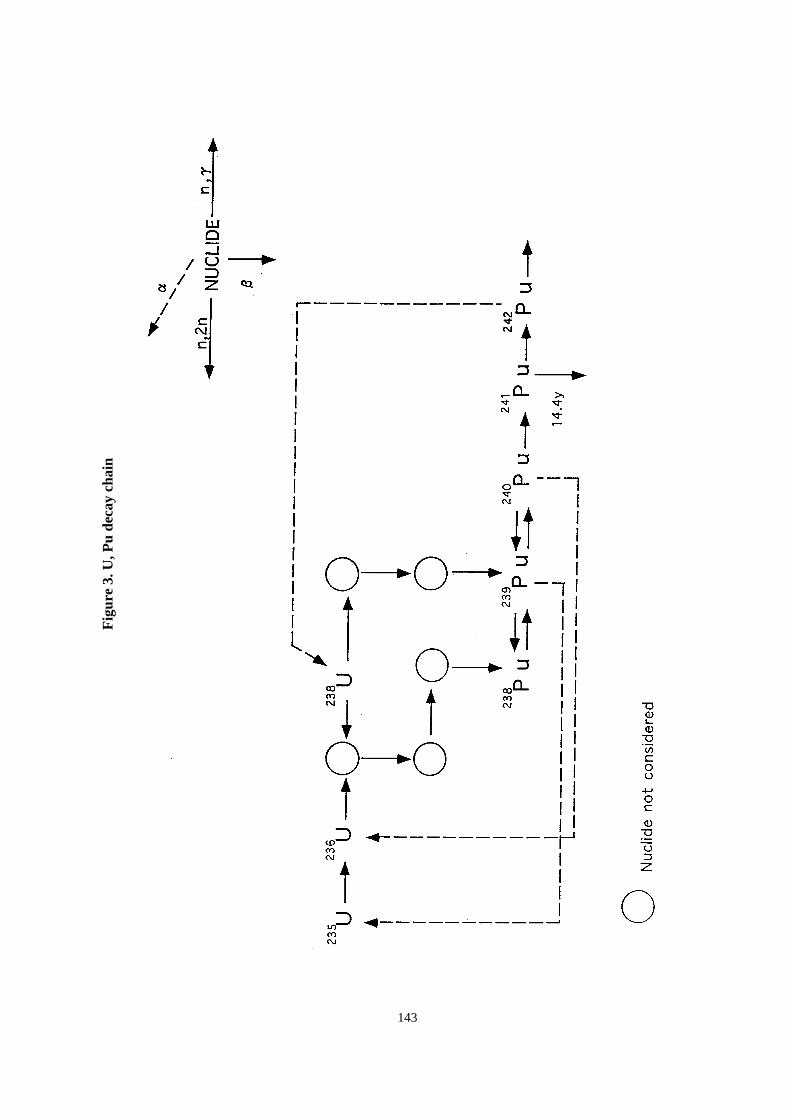
143
Fig
ure
3. U
, Pu
deca
y ch
ain

144
MITSUBISHI (Japan)
1. Name of participant:Mari Yano
2. Organisation: Mitsubishi Heavy Industries, Ltd.
3. Name of code used: ODDBURN, 2DBURN, HANYO
4. Bibliographic references:
• None.
5. Origin of cross-section data:
• JENDL-3.2.
6. Spectral calculations and data reduction method used:
• See Figure 1.
7. Number of energy groups used in different phases:
• Burn-up calculation: 7-group.
• Reactivity coefficient calculations: 18-group.
8. Calculations:
• Diffusion.
• Finite difference.
• –
9. Other assumptions and characteristics:
• Decay chain: See Figure 2.
10. Comments useful for correctly interpreting the results:

145
Figure 1. Code and output table
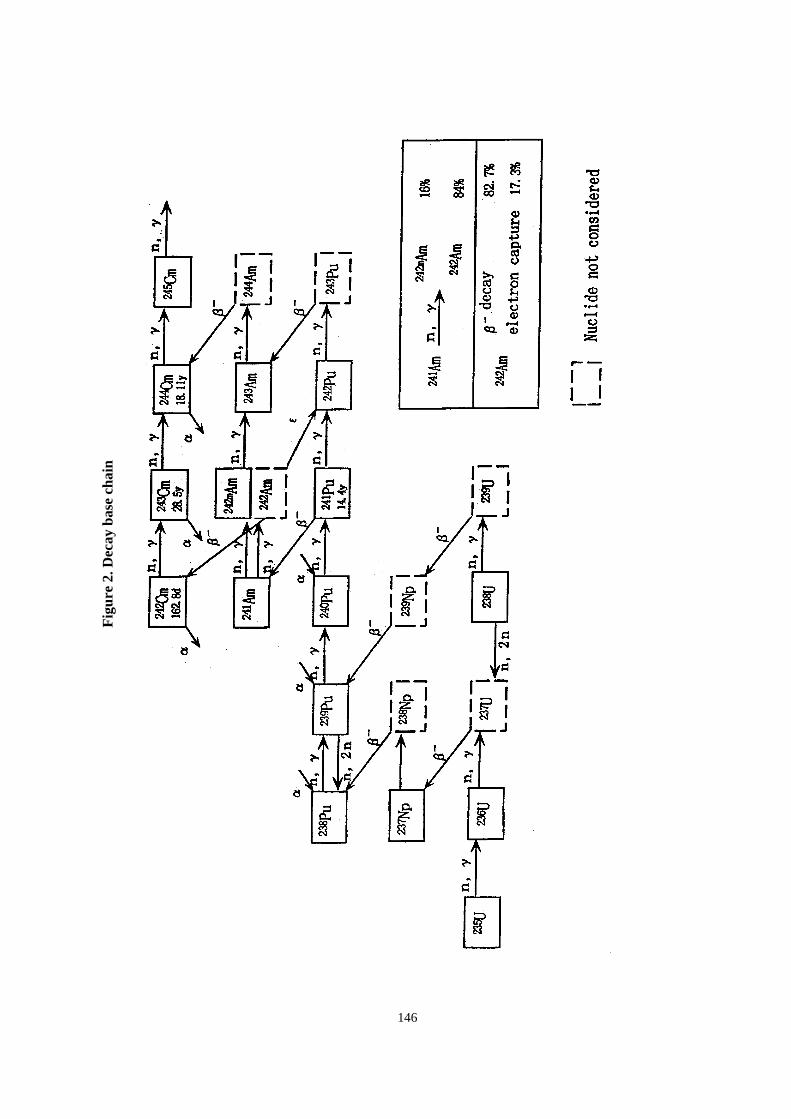
146
Fig
ure
2. D
ecay
bas
e ch
ain
147
TOSHIBA (Japan)
1. Name of participant:Masatoshi Kawashima and M. Yamaoka
2. Organisation: Nuclear Engineering Laboratory, Toshiba Corporation
3. Name of code used: STANBRE-V3 (private code)
4. Bibliographic references:
• None.
This code uses conventional multi-group diffusion theory with the “corner mesh” scheme intwo-dimensional RZ geometry. Simplified burn-up chains are available using analytic expressionsinvolving several approximations.
5. Origin of cross-section data:
• 70-group group constants JFS-3-J3.2 processed from JENDL-3.2 by JAERI.
6. Spectral calculations and data reduction method used:
• Please refer to the JFS-3-J3.2 document (or see Dr. Wakabayashi’s paper).
• Mutual shielding: Ignored.
• Weighting spectrum for scattering matrices: No special treatment. The region-wise 70-groupspectra are calculated using one-dimensional R-model. RZ burn-up model for each burn-upstep specified by the user. The 70-group microscopic cross-sections are determined for theaveraged burn-up compositions in every step defined by the user (if necessary).
7. Number of energy groups used in different phases:
The burn-up calculations were done with the specified 7-group structure. Seventy-group diffusioncalculations are done for the Doppler and sodium void worth in the core region.
8. Calculations:
• Diffusion.
• Finite difference with flux definition by “corner-mesh”.
• Calculation characteristics: Basically specified meshes and groups are used.
9. Other assumptions and characteristics:
Three lumped FP cross-sections are used as follows:
• LFP(235U): 235U.
• LFP(238U): 236U, 238U, 238Pu, 240Pu, 242Pu, MAs.
• LFP(239Pu): 239Pu, 241Pu.
148
The original constant set includes several types of lumped FP cross-sections. The FP cross-sectionsused correspond to 547.5 days burn-FP composition under the FP gas non-release assumption fromfuels to gas plenum region. The recent group constant set has lumped cross-sections for 241Pu-FP,but the present model uses the above substitution.
10. Comments useful for correctly interpreting the results:
The mesh-size effect on keff is different than for the “volume centre” mesh codes.
A cycle length is divided into five steps for the initial and the equilibrium cycles. Neutron spectrafor group reductions are calculated for every step. The self-shielding factors are determined by theaverage compositions obtained by burn-up calculations at the beginning, middle and end of cycles.
149
IPPE (Russian Federation)*
1. Name of participant:M. Semenov and A.A. Tsiboulia
2. Organisation: IPPE, Russian Federation
3. Name of code used:
4. Bibliographic references:
5. Origin of cross-section data:
6. Spectral calculations and data reduction method used:
7. Number of energy groups used in different phases:
8. Calculations:
9. Other assumptions and characteristics:
10. Comments useful for correctly interpreting the results:
* Calculation details have not been provided.

151
Appendix B.3
Accelerator-driven system benchmark
JAERI (Japan)
1. Name of participant:T. Nishida, T. Takizuka and T. Sasa
2. Organisation: Japan Atomic Energy Research InstituteTokai Mura, Naka-gun, Ibaraki-ken 319-11, JapanTransmutation System Laboratory, Department of Reactor Engineering
3. Name of code used:
• Spallation cascade code: MNTC/JAERI94 (Monte Carlo) (> 20 MeV).
• Neutron transport code: TWODANT (Sn method) (< 20 MeV) – using 73 group cross-sections.
• Burn-up code: BURNER
• Data processing code: SCALE
4. Bibliographic references:
5. Origin of cross-section data:
• JENDL-3.2.
6. Spectral calculations and data reduction method used:
7. Number of energy groups used in different phases:
8. Calculations:
9. Other assumptions and characteristics:
10. Comments useful for correctly interpreting the results:
152
PSI and CEA (Switzerland and France)
1. Name of participant:G. Youinou1,2, S. Pelloni1 and P. Wydler1
2. Organisation: 1Paul Scherrer Institut, CH-5232 Villigen PSI, Switzerland2CEA, CE Cadarache, F-13108 Saint-Paul-lez-Durance, France
3. Name of code used:
• For energies larger than 15 MeV: HETC (PSI version).
• For energies smaller than 15 MeV: NJOY (Version 89.62), MICROR (Ed. 2), MICROX-2(Ed. 14), 2DTB, HETC-to-2DTB neutron source reformatting code.
4. Bibliographic references:
• For HETC: F. Atchison, PSI Proceedings 92-02, (1992) 440.
• For NJOY: R.E. MacFarlane and D.W. Muir, LA-12740-M, (1994).
• For MICROR: D.R. Mathews, J. Stepanek, S. Pelloni, C.E. Higgs, EIR Report 539 (1984).
• For MICROX-2: D. Mathews, PSI-97-11, (1997).
• For TWODANT: R.E. Alcouffe, R.S. Baker, F.W. Brinkley, D.R. Marr, R.D. O’Dell andW.F. Walters, LA-12969-M (1995).
• For 2DB: W.W. Little, Jr. and R.W. Hardie, BNWL-831, Rev. 1 (1968).
• For 2DTB: S. Pelloni, Y. Kadi and H.U. Wenger, “Present Methods for Physics Calculations ofHybrid Fast Systems at PSI”, Proc. Specialists Mtg. on Intermediate Energy Nuclear Data:Models and Codes, Vol. 1, pp. 342-348, Issy-les-Moulineaux (1994).
5. Origin of cross-section data:
• JEF-2.2.
6. Spectral calculations and data reduction method used:
For energies smaller than 15 MeV:
• Pointwise cross-sections and P0-P3 fine group cross-sections in 92 epithermal neutron groupsbetween 15 MeV and 2.38 eV were generated using NJOY (Version 89.62). The fine groupcross-sections were produced applying the standard Bondarenko method. A typical fast reactorflux spectrum (IWT = 7 in the NJOY terminology) was employed.
• The interface program MICROR (Ed. 2) was applied to generate the following code-specificlibraries for use in conjunction with the cell code MICROX-2:
− A multi-group data library, consisting of the computed sigma0 dependent, P0-P3
cross-sections and fission spectra.
153
− A pointwise data library, consisting of additional cross-sections below 8 keV. In total, thecross-sections were given in about 24 000 energy points equally spaced in velocity.
• The two-region MICROX-2 code was employed to generate shielded, microscopic broad groupcross-sections, as well as the global fission spectrum, for later use in detailed core and burn-upcalculations with the code 2DTB:
− The consistent diagonal transport correction was used to produce P0-P2 cross-sections.
− The broad energy structure chosen (33 groups) is equally spaced in lethargy (Delta u = 0.5).
For energies above 8 keV, the broad group cross-sections were computed from those availablein the fast data library. The sigma0 dependent cross-sections (also in the unresolved energyrange) were interpolated in the two regions, using a two-point, semi-logarithmic algorithm.The required energy dependent sigma0s were calculated using the background cross-sectionmethod.
For energies below 8 keV, the broad group cross-sections were derived from those available inthe pointwise data library, thereby accounting for resonance overlap. The required fluxes forenergy collapsing were obtained from a resonance calculation in two regions. For the fuel cells,B1 neutron slowing-down balance equations were solved, in which appropriate sources,obtained from cross-sections available in the fast data library, were used. For non fuel cells, thesame sources were used, but the buckling was not searched for.
• In the core calculations (with the external neutron source), 2 cm meshes in the radial directionand 2.5 cm meshes in the axial direction, as well as P2-S8 approximations, were used.
2DTB is a PSI code based upon the General Atomic code 2DB (for the diffusion option) andTWODANT (for the transport option). For the burn-up calculations, six fission product yield setswere used, describing the fission of 237Np, 238Pu, 239Pu, 242Pu, 241Am and 244Cm. For each of theseactinides, 71 explicit fission products were used together with “pseudo fission products” tocompensate for missing absorption. For the latter, cross-sections were generated using the PSI codePSD.
7. Number of energy groups used in different phases:
• Cell calculations: 93 neutron groups in conjunction with about 24 000 energy points below8 keV.
• Core calculations: 33 neutron groups.
8. Calculations:
• Transport theory.
• P2-S8, finite difference.
• 2 cm meshes in the radial direction, 2.5 cm meshes in the axial direction.
154
9. Other assumptions and characteristics:
Each region was associated with a burn-up zone. Fission yields of actinides others than 237Np,238Pu, 239Pu, 242Pu and 241Am were approximated with those available. The burn-up calculations didnot include the contributions from energies higher than 15 MeV.
10. Comments useful for correctly interpreting the results:

155
IPPE (Russian Federation)
1. Name of participant:T.T. Ivanova, V.F. Batyaev and A.A. Tsiboulia
2. Organisation: IPPE, Russian Federation
3. Name of codes used:
• > 20 MeV – HETC.
• < 20 MeV – CONSYST2 – preparation of group cross-sections.TWODANT-SYS – neutron transport.CARE – burn-up calculation.
4. Bibliographic references:
[1] Radiation Shielding Information Centre, “HETC Monte Carlo High-Energy Nucleon-MesonTransport Code”, Report CCC-178, Oak Ridge National Laboratory (August 1977).
[2] RSICC DLC-182 “ABBN-90: Multi-Group Constant Set for Calculation of Neutron andPhoton Radiation Fields and Functionals, Including the CONSYST2 Program.”
[3] RSICC CCC-547, “TWODANT-SYS: One- and Two-Dimentional, Multi-Group, DiscreteOrdinates Transport Code System.”
[4] A.L. Kochetkov, “CARE – Isotope Generation and Depletion Code”, IPPE-2431, 1995.
5. Origin of cross-section data:
• FOND-2 data library.
6. Spectral calculations and data reduction methods used:
• Resonance shielding: Resonance self-shielding effects are taken into account by usingBondarenko self-shielding factors.
• Mutual shielding: See resonance shielding (above).
• Weighting spectrum for scattering matrices: 0-dimentional 299 groups spectrum calculation.
7. Number of energy groups used in the different phases:
• > 20 MeV – continuous energy.
• < 20 MeV – 28 neutron groups.
156
8. Calculations:
• Theory used: 2-D transport theory.
• Method used: > 20 MeV – Monte Carlo.< 20 MeV – DSN 16.
• Calculation characteristics: > 20 MeV – 1 000 000 histories, continuous energy.< 20 MeV – total amount of meshes – 2 925.
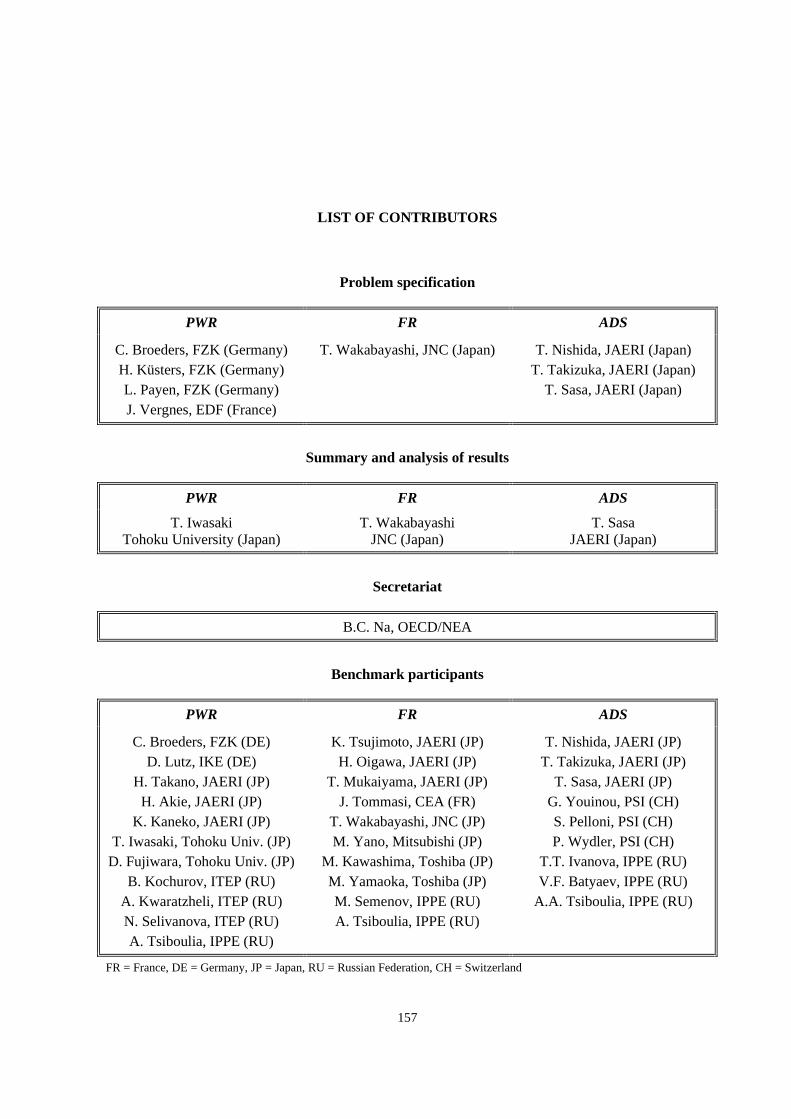
157
LIST OF CONTRIBUTORS
Problem specification
PWR FR ADS
C. Broeders, FZK (Germany)H. Küsters, FZK (Germany)L. Payen, FZK (Germany)J. Vergnes, EDF (France)
T. Wakabayashi, JNC (Japan) T. Nishida, JAERI (Japan)T. Takizuka, JAERI (Japan)
T. Sasa, JAERI (Japan)
Summary and analysis of results
PWR FR ADS
T. IwasakiTohoku University (Japan)
T. WakabayashiJNC (Japan)
T. SasaJAERI (Japan)
Secretariat
B.C. Na, OECD/NEA
Benchmark participants
PWR FR ADS
C. Broeders, FZK (DE)D. Lutz, IKE (DE)
H. Takano, JAERI (JP)H. Akie, JAERI (JP)
K. Kaneko, JAERI (JP)T. Iwasaki, Tohoku Univ. (JP)D. Fujiwara, Tohoku Univ. (JP)
B. Kochurov, ITEP (RU)A. Kwaratzheli, ITEP (RU)N. Selivanova, ITEP (RU)A. Tsiboulia, IPPE (RU)
K. Tsujimoto, JAERI (JP)H. Oigawa, JAERI (JP)
T. Mukaiyama, JAERI (JP)J. Tommasi, CEA (FR)
T. Wakabayashi, JNC (JP)M. Yano, Mitsubishi (JP)
M. Kawashima, Toshiba (JP)M. Yamaoka, Toshiba (JP)M. Semenov, IPPE (RU)A. Tsiboulia, IPPE (RU)
T. Nishida, JAERI (JP)T. Takizuka, JAERI (JP)
T. Sasa, JAERI (JP)G. Youinou, PSI (CH)S. Pelloni, PSI (CH)P. Wydler, PSI (CH)
T.T. Ivanova, IPPE (RU)V.F. Batyaev, IPPE (RU)
A.A. Tsiboulia, IPPE (RU)
FR = France, DE = Germany, JP = Japan, RU = Russian Federation, CH = Switzerland