Embed Size (px)
Citation preview
CALCULATING TRANSPORT ACCIDENT COSTS
FINAL REPORT OF THE EXPERT ADVISORS TO THEHIGH LEVEL GROUP ON INFRASTRUCTURE CHARGING
(WORKING GROUP 3)
APRIL 27 1999
This report was prepared by Dr Gunnar Lindberg, VTI, Borlänge,Sweden and finalised in agreement with the other experts in the groupincluding:
Mr PenttiAjoManaging DirectorFinnish Motor Insurers’ CentreHelsinki
Mr António Brito da SilvaPresidentNAT/Associação Industrial PortuguesaPraça das Indústrias 1302Lisboa
Mr CharlesCrawfordTechnical Services DirectorCEA -Churchill InsuranceUK
Dr. RudolfKruppLeitender Regierungsdirektorbast – Bundesanstalt für StraßenwesenGermany
Dr GunnarLindbergV T IBorlänge Sweden
Mr Manuel RuiOsório NunesINSURTRAMLisboa
Dr JohnPeirsonUniversity of KentCanterbury UK
Dr GünterSchneglbergerAustrian road hauliers associationVienna
Mr Wim SmoldersInternational Road Transport UnionBruxelles
Meetings were chaired by Dr José Viana Baptista, member of the High LevelGroup.
3
TABLE OF CONTENTSEXECUTIVE SUMMARY.......................................................................................................................... 4
1 INTRODUCTION..................................................................................................................................... 7
2 MARGINAL EXTERNAL COSTS: DEFINITIONS, DIFFERENCES, AND PRACTICE ............... 7
2.2 THE BASIC PRINCIPLE............................................................................................................................ 7
2.3 TRAFFIC VOLUME AND ACCIDENTS- RISK AND RISK-ELASTICITY.......................................................... 8
2.4 ACCIDENT-PRONE PERSONS, FAULT AND NEGLIGENCE........................................................................ 14
2.5 THE VALUATION OF ACCIDENTS........................................................................................................... 15
2.6 CONCLUSION ANDDISCUSSION............................................................................................................ 18
3 INTERNALISATION: MECHANISM FOR CHARGING COSTS TO USER ................................. 23
3.2 THE POTENTIAL OF THE INSURANCE SYSTEM TO INTERNALISE ACCIDENT COST................................... 25
3.3 CURRENT PRACTICE...................................................................................................................... 26
3.4 BEHAVIOURAL INCENTIVES................................................................................................................. 30
3.5 IS IT POSSIBLE TO IMPROVE THEEUROPEANINSURANCE SYSTEM FOR FAIRER AND MORE EFFICIENT
CHARGES............................................................................................................................................................ 32
3.6 CONCLUSION ANDDISCUSSION............................................................................................................ 36
4 CONCLUDING OPINIONS OF THE WORKING GROUP............................................................... 38
5 SELECTED REFERENCES................................................................................................................... 41
4
EXECUTIVE SUMMARY
1. The report of the high level group on infrastructure charging stated that transport chargesare not efficient unless they reflect all the costs, including the external costs, of the use oftransport. It also suggested further guidance was necessary on how to estimate the variouselements of marginal costs. To this end, the working group on transport accident costs wasestablished. Chapter 2 defines the costs the working group considers relevant, the natureof accident risks, the valuation of costs and any differences that may occur betweendifferent modes. Chapter 3 considers the different mechanisms available for chargingthese costs to users. And Chapter 4 offers the working group's conclusions andrecommendations to the high level group.
Valuation2. Accident costs are one of the most high profile and highest costs of transport. This
working group has examined the range of methods available for estimating accident costsand mechanisms for passing such costs on. Below we provide conclusions regarding thevarious cost categories and estimation techniques.
3. The working group has focussed on estimating the marginal external cost of road and railaccidents, as requested by the high level group, with some consideration given to the costsof other transport modes. These marginal external costs are the incremental costs of anaccident borne by society at large, including victims, family and friends, imposed by thosewho cause the accident. The relevant factors when estimating the costs are the relationshipbetween accident risk and traffic volume, the determining the external element and thevaluation of specific cost elements. The group considered these factors in turn.
4. Traffic accident risk depends on the volume of traffic (e.g. traffic flow and degree ofcongestion)and on the type of vehicle (e.g. crash worthiness), road (including changes dueto weather conditions) and driver (e.g. health, age, behaviour). On balance, the number ofaccidents rises proportionally with traffic volumes for normaltraffic levels in interurban areasand more than proportionally for higher levels of traffic and inurban areas(i.e. with road type). The external cost of the accident is also higher when involving largevehicles and HGVs rather than passenger cars - and so varies withvehicle type(howeveraccident risk is lower). These different categories should therefore be used whenconsidering different approaches to estimating and passing on the costs of accidents.Finally, as risk exposure clearly rises with transport activity, it is also useful to considerrisk in relation tovehicle kilometresfor the same category of infrastructure.
5. Having determined the risk of accidents, the costs themselves fall into two maincategories: material and non material costs. Material costs include property damage,administrative costs, medical and hospital costs, net lost production andcongestioncaused (as measured by WG2 and if separated from total congestion costs). Such externalcosts are dominated however by the non material costs: the emotional and social costs ofcasualties resulting from transport accidents. Methods for estimating such costs may bebased on "human capital" losses, however these will underestimate the value of sufferingand loss. Other methods are more commonly based on a willingness to pay (WTP) toreduce the risk of such accidents. (WTP is also discussed, consistently, in WG2). Thismethod is not perfect, and may not always accurately take account of the capacity to pay(e.g. the values reported in WTP studies may be overestimates if not constrained by
5
respondents' income). However they provide a useable result in terms of estimates of thevalue of reduced health, for injuries, and a "value of statistical life" for risks of mortalaccidents. Such cost estimates follow an "ex ante" approach. For this reason, the workinggroup favours this WTP approach to estimating the non material costs of accidents, whereWTP estimates vary with scale, context, mode of transport and between Member States.
6. While the WTP component is the dominant factor in the value of statistical life (andinjuries) it should be remembered that the users' own WTP component is alreadyinternalised. Under certain conditions (to some degree fulfilled in interurban car trafficwith constant risk and homogenous road users), the external marginal cost boils down toonly the material cost. This condition is not fulfilled in urban areas, for heavy vehicles orfor rail traffic. For these the external marginal cost will include an element of the WTPresulting in a significantly higher level of external marginal costs.
7. The values calculated by this process may well differ with context, but the methodremains generally applicable, across modes and across Member States. Efficient pricing -internalisation - requires that all these marginal external costs are passed on to the usersconcerned, using the most effective mechanism.
Mechanisms8. Having determined the cost estimates with a method generally applicable to all modes of
transport, several choices exist in terms of passing such costs on to those who bear them.General taxation, existing transport specific taxes, fines, transport user charges, theinsurance system - all are possible tools. These are all pricing tools and the focus of thisexercise. They should not replace existing safety standards or information programmessuch as road safety campaigns, but reinforce the same safety goals.
9. A strategy to internalise the external accident costs should aim to internalise costs ex ante.While ex post coverage is possible, this requires that users anticipate the expectedaccident cost in their decision and signals are weak. The ex ante approach is thereforepreferred.
10. Current approaches are implicitly based on general taxation or specific transport taxessuch as fuel and vehicle taxes. However these are poor proxies as they are not based onthe costs of accidents and provide no signals to users to alter their behaviour with regardto accidents (two requirements of an efficient economic policy tool). If such tools are usedat all, they should take into account transport safety features (for instance reducing vehicletaxes when safety features are added). The greater use and variability of traffic fines,based more closely on incremental accident risks could also be a means of improving theincentives to take more care travelling.
11. The use of insurance premiums has also been considered. In a deregulated insuranceindustry, premiums vary considerably to reflect quite fine degrees of accident risk andcost. Insurance by its nature insulates the transport user against the risk of facing the costof an accident and may change risk-avoiding behaviour (the "moral hazard"). However,greater variability of insurance premiums and refined bonus/malus systemsdo send asignal to transport users; can clearly be set to reflect the costs involved (including bothmaterial and non material costs); and unlike fines, are directly attributable to meeting thecosts of the accident in practice. Premiums based solely on such costs would not be
6
excessively high (and so would avoid the risk of increasing the number of uninsureddrivers) but would not necessarily cover average costs. The working group thereforebelieves that a sophisticated insurance structure based on detailed risk information andreflecting the different variable components of the costs of accidents is the mostsatisfactory available means of internalising the external costs of transport accidents.Particularly in the case of medical costs, the use of insurance switches expenditure fromgeneral taxation to users, in the manner expected in a user pays system. If the insurancesystem is unable to reflect these different costs continued use of the tax system may benecessary. In urban areas the importance of a mix of policy instruments are highlighted.
12. The magnitude of external costs and the effectiveness of different mechanisms depends toa great extent on the legal basis for action. For instance the allocation of health costsdepends on the type of public health system and responsibility for accidents depends onthe legal liability regime. When considering the allocation of costs, the working group isof the opinion that the nature offault should be considered and reflected in themechanism for passing on the cost of accidents.In the context of transport insurance,the liability regime defines the allocation of fault or responsibility ("strict liability"/ "nofault" etc. of the "victim", "causer" or infrastructure manager) and a mix, according tomode, may well be most appropriate. The working group is of the opinion that the choiceof liability regime reflects equity considerations rather than efficiency (except where thelegal costs of a fault based liability regime raise transaction costs excessively).
13. The development of all these cost estimates and mechanisms requires a range of data,detailed in the report and in the Commission publication "COST 313: Socio-economiccost of road accidents". Specific instances where data are needed include access to driverrecords (if insurance premiums are to distinguish between risk categories) theinvestigation of driver/pedestrian behaviour and regularly updated statistics on materialcosts of accidents and (WTP) estimates of non material costs.
7
1 INTRODUCTION
1.1.1 The report of the high level group on infrastructure charging proposed the pricingprinciples of user pays and marginal cost pricing (as adopted by the Commission inthe White Paper "Fair Payment for Infrastructure Use") on the grounds that transportcharges are not efficient unless they reflect all the costs, including the external costs,of the use of transport. The high level group report also concluded that furtherguidance was necessary on how to estimate marginal costs for the various costelements to be recovered from users.
1.1.2 To this end, the working group on transport accident costs was established, toinvestigate methods of estimating the costs of transport accidents and the possible useof charges and insurance coverage to ensure the costs are borne by those who causethe accidents. Chapter 2 defines the costs the working group considers relevant, thenature of accident risks, the valuation of costs and any differences that may occurbetween different modes. Chapter 3 considers the different mechanisms available forcharging these costs to users. And Chapter 4 offers the working group's conclusionsand recommendations to the high level group.
2 MARGINAL EXTERNAL COSTS: DEFINITIONS, DIFFERENCES, andPRACTICE
2.1.1 External accident cost has for a long time been considered as a simple average cost,with more or less qualified assumptions on the allocation of the accident cost betweenexternal and internal components. While this lack of theoretical sound principles isserious, more serious is the fact that the underlying theory is not fully developed.Nevertheless, we do believe that enough information is available to move the transportpolicy a few steps further.
2.2 THE BASIC PRINCIPLE
2.2.1 Marginal external costs of transport accidents are the incremental costs of an accidentborne by society at large, including family and friends, and can include costs borne bythe victims of an accident. The aim of an accident externality charge is to increase theefficiency of the transport system. The basic conclusion from general economic theoryis emphasised; the charge shouldinternalise the external marginal cost. In addition,internalisation based on a ‘polluter pays principle’ (PPP) is generally seen as a ‘fair’principle. In the context of accidents the PPP may be expressed as -individual thatimposes risks on others should be responsible for the extra cost they impose.
2.2.2 When a vehicle enters into the traffic flow the user (i) exposes himself to the averageaccident risk in that transport mode. At the same time he (ii) increase or decrease theaccident risk for all other users of the same mode. Finally, his entrance (iii) exposeusers of other transport modes with an accident risk; this risk may also increase,decrease or stay constant. When economic values are assigned to these three
8
consequences they express the (whole)marginal accident cost(both internal andexternal).
2.2.3 The cost of an accident,ex ante, can be expressed as three components; (a)willingness-to-pay (WTP) for safety on part of those travelling in a particular modeexposed to the risk; (b) ditto, on the part of relatives and friends of the person; (c)costs on the part of the rest of the society. The user internalises in his decision the riskhe exposes himself to, valued as his WTP. The remaining cost, theexternal marginalcost, consists of three components, which is named in a similar way as in Elvik(1994). (I) System externalities- the expected accident cost to the rest of the society(c) when the user exposes himself to risk (r ) by entering into the traffic flow- mainlymedical and hospital costs [cr]; (II) Traffic volume externalities- the WTP of thehousehold (a), relatives and friends (b) and the rest of society (c) related to theincrease or decrease in the accident risk for all other users of the same mode[(a+b+c)rErQ]; and finally (III) Traffic category externalities1 - the WTP of thehousehold, relatives and friends and the rest of society related to the changed accidentrisk [r’(1+E r’Q )] in other modes of transport [(a+b+c)r’(1+Er’Q )].
2.2.4 The importance of the relationship between risk2 and traffic flow, i.e. the elasticity3,should be obvious. As Newbery (1988) put it“the key element in determining theaccident externality cost is thus the relationship between traffic flow and accidentrates..”.
2.3 TRAFFIC VOLUME AND ACCIDENTS- RISK AND RISK-ELASTICITY
2.3.1 In the European Union every year about 50,000 individuals are killed in transportaccidents, the majority in road traffic accidents. In rail transport approximately 1,300fatalities occur every year, in commercial aviation between 20 and 80 and inwaterborne transport around 180 fatalities occur annually (Table 4).
2.3.2 The vehicle owner should be aware of the marginal accident cost in his decision. Therelevant accident risk is thus related tovehicle kilometre. The safety advantage of railand aviation compared to road per passenger kilometre described in Table 4 becomes adisadvantage when the risk is expressed per vehicle kilometre. The (fatality) risk permillion vehicle kilometre is higher in rail and aviation than in road traffic (Table 5).Consequently, we should therefore not be surprised if the accident externality chargeis higher in what is generally beheld as safe modes. However, when this charge ispassed on to the passengers the charge per passenger will be low.
2.3.3 The relationship between traffic volume and accidents is unfortunately a neglectedarea in transportation research. In road traffic a limited number of older studies existbut lately, some interesting empirical research has been presented (see Box 1).
1 Elvik (1994) uses instead the term Physical externality (p. 720).
2 Defined as r=Zi/Qi where Z is the expected number of accidents, Q the traffic volume and i is the charged mode or r’=Zj/Qi where j is other modes
3 ErQ=dr/dQi*Qi/r and Er’Q=dr’/dQi*Qi/r’
9
2.3.4 Aviation accidents are relatively infrequent which makes it difficult to suggestaverage numbers4. The accident risk per vehicle kilometre in airline passengertransport may be ten times higher than the accident risk for bus transport (Table 5).However, while a significant part of the bus accidents affect non-occupants themajority of aviation accidents affect occupants.
2.3.5 If the number of accidents increase in proportion to the number of flights theTrafficvolume externality (II)is irrelevant. The Traffic category externality(III), i.e. theconsequence for other persons, is also negligible in aviation. Hence, as the seriousconsequences almost uniquely fall on the user, only theSystem externality (I) isrelevant, which result in a relatively low external accident cost.
2.3.6 The total number of fatalities inrail traffic in the EU in the early 1990s is estimatedto about 1,300 and the number of injuries to be about 4,700 annually (ETSC 1997).Approximately 85% of the fatalities and 66% of injuries in rail accidents are non-railusers, mainly road users at crossings (Table 6). Rail accidents differ between rail tracktypes, on high quality tracks the fatality risk is 30% lower than on the average track. Afatality and injury risk below average is thus appropriate to use on new constructedrail corridors.
2.3.7 The risks for railway users are limited and consequently System (I) and Traffic volumeexternalities (II)are negligible. Nevertheless, accident externality charges are relevantbecause theTraffic category externality(III) is significant. Even if the number ofcar/train accidents increases in proportion to the train traffic volume the externalitymay be substantial. Given the relatively large number of non-user fatalities we expecta relatively high external accident cost on railways.
2.3.8 Based on currently available data, it is estimated that, on average around 140 peoplelosing their lives annually atsea in freight and passenger transport accidents inEuropean Waters. The average number of fatalities oninland waterways is estimatedto around 40 annually. Table 5 relates the accidents to passenger kilometres andsuggests a surprisingly high number. The main cost element in waterborne transport isrelated to property and environmental damage and not the cost of human casualties(ETSC 1997). As in aviation only theSystem externality (I)is relevant resulting in arelatively low external accident cost. Accidents with leisure boats are not included inthese figures.
2.3.9 Clearly, the above analysis suggests that the framework for analysing transportaccident costs and risks is applicable to all modes of transport.
2.3.A. ROAD TRANSPORT
2.3.10 Each year in the Europe Union approximately 45.000 people are killed in road trafficaccidents and almost 1.6 million are reported injured (Table 4). While a comparison of
4 ESCT (1997) suggest that in airline passenger transport around 80 fatalities occur annually while the Green Paper ‘Towards Fair and Efficient Pricing in
Transport’ suggests 18 fatalities
10
road accident fatalities and related risk measures is indeed difficult5, a similarcomparison of injuries is almost impossible due tounderreporting. Evidence suggeststhat, generally, in Europe serious injuries are underreported by about 30% and slightinjuries by about 60% (OECD-IRTAD, 1994). However, the rate may vary widelybetween different Member States. To find a common European wide risk to apply isobviously impossible.
2.3.11 The accident risk differs between different vehicle categories and even moreimportant, the proportion of person injured within the vehicle to persons injuredoutside the vehicle will be dependent on vehicle type. The lighter vehicle types, asmotorcycles, generates the highest risk to the occupants themselves (r ) while theheavy vehicle types, as buses, generates the main risk for non-occupants (r’ ). This willstrongly affect the external accident cost, i.e.Traffic category externality (III).Although the difference in accident risk is huge between different Member States thesimilarities in the pattern of occupants risk and non-occupants risk are striking as isshown in Table 7.
2.3.12 The discussion above points at the importance of differentiation. Partly an explanationof the difference between vehicle types is the difference in accident risks between roadtype or traffic environment (Table 8). It is important to note that as the accidentrisk isreduced it may well be that the consequences per accident become more serious.
2.3.13 After survey the literature (Annex 1) a number of consistent but involved conclusionsmay be drawn in relation to the road traffic accident elasticity. Single-vehicleaccidents probably have negative risk elasticity while multi-vehicle accidents show, onaverage, a limited positive risk elasticity. More severe accidents may have a lowerelasticity than light accidents but the evidences are sparse. On balance, taking therelative costs of different accident types into account, it seems reasonable to assumethat the total accident cost is proportional to the traffic volume on interurban roadlinks at low to moderate flow levels, i.e. the risk elasticity is zero. This conclusion issupported by the practice among Road authorities, which usually employ a zero riskelasticity on road-links (UK COBA, Swedish EVA). At high and even congestedtraffic flows the risk elasticity may be positive.
2.3.14 Consequently, on interurban roads only theSystem externality (I)is relevant, as theelasticity is negligible for car-car accidents and the number of accidents with otherroad user categories are limited. Ignoring the cost of accidents with only materialdamages we present in Table 12 the marginal accident cost for interurban car traffic onan average Swedish road by cost components. On heavy goods vehicles we expect ahigher externality charge because, even on interurban roads, we have a significantnumber of accidents involving other user groups.
2.3.15 The risk elasticity appears to be higher in urban areas than in non-urban areas. This isconsistent with the practice among Road authorities to have flow dependent risk
5 The fatality and injury risk varies widely between different Member States. The highest fatality risk per 100,000 population is 29 and the lowest 6.5; the highest
risk per million registered passenger cars is 1043 and the lowest 164 while the highest accident risk per million vehicle kilometre is 0.67 and the lowest 0.15.

11
functions at intersections; as the number of intersection increases the risk elasticitywill increase.
2.3.16 In urban areas we find two different kinds of relationships between accidents andtraffic volume. Accidents involving only motor vehicles seem to increaseprogressively with traffic volume, while accidents between motor vehicles andunprotected road users increase digressively. Consequently, all three types ofexternalities are represented in urban areas; in addition to theSystem externality(I) theelasticity for car-car accidents may be positive generatingTraffic volume externality(II) and the number of accidents with unprotect road users are significant resulting in arelevant (but decreasing)Traffic category externality (III).On balance, the totalexternal marginal cost is probablyu-shapedwith decreasing costs at low trafficvolumes and slowly increasing costs at higher traffic volumes (Table 13). The totalaccident externality charge is likely to be overten timeshigher in a central city areathan on interurban roads. This fact highlights the need for different policy responseson urban and interurban road networks.
2.3.17 For the vulnerable road users themselves their risk will be falling when the number ofpedestrians and cyclists increases as follows from the models by Maycock and Hall(1984), Brüde, Larsson (1993) as well as Ekman (1996). The marginal cost will thusbe falling and unprotected road users internalise most of the accident cost.Consequently, the remaining external component is negative, i.e. they should besubsidised because more pedestrians and cyclist reduce the risk for existing vulnerableroad users.
RISK AVOIDING BEHAVIOUR, CONGESTION AND THE HIDDEN COST OF ACCIDENTS
2.3.18 The user reacts in a number of different ways when he perceives that the risk level haschanged. Peltzman (1975) developed the hypothesis ofrisk compensationandpresented evidence showing that a safer environment due to stricter vehicle safetyregulations in US was compensated by the user with increased exposure to risk -driving more intenselyas Peltzman put it. In the same way a more unsafe environmentmay be compensate by the user with reduced exposure to risk. These reactionsgenerate a cost to the user and reduce the observed change in risk. The cost of thisrisk-avoiding (RA) behaviourhas to be included in the external marginal cost.
2.3.19 The marginal cost may be estimated based on the observed elasticity including the costof RA behaviour or it may be estimated on pure risk elasticity(i.e. the risk changewithout any RA-behaviour) without any additional cost. Peirson et al (1994)introduces a form of RA behaviour where the user, when he selfish adapt his riskbehaviour, reduces the risk for all other users. The RA behaviour includes an elementof positive externality. Johansson (1996) shows how this can be internalised throughthe accident externality charge in a second-best situation where the RA behaviour isnot subsidedper se.
2.3.20 When the traffic flow increases the number of possibly conflicts increase but the speedgoes down; the outcome may be more but less severe accidents. Shefer et.al. (1997)suggests that the reduction in severity is so strong that the total accident cost isreduced due to increased congestion. Consequently, congestion may have a positive
12
effect and will reduce the accident externality charge. On the other hand we know thataccidents cause traffic disturbances that may be measured as congestion. On top of theaccident cost estimated as in this paper the extra cost of traffic disturbance should belevied. However, to separately estimate congestion as a pure traffic flow problem andas an incidence/accident problem is difficult. This distinction is not so important whendesigning the charge, the label of the components will differ but the sum of chargeswill be the same. But when design policy and investment measures the informationmay be more important as pure traffic flow congestion requires one solution andincidents/accidents another.
2.3.21 It is reasonable to assume that the cost of RA behaviour for unprotected road users issubstantial. Reduced walking, parents driving their children to school etc. areexamples of RA behaviour (Maddison 1995). In addition, if users perceive risks toincrease with higher traffic volume they will reduce the speed; the accident externalityis transferred to a congestion externality. An extreme example is the situation wherean accident actual has happened creating congestion. While these costs are relevantand hidden costs of accidents we favour the first method mentioned above, i.e. theseadditional elements should be estimated separately and added to the external marginalcost. If the congestion consequence is estimated as congestion cost or as an accidentcost is irrelevant for the total outcome.
13
BOX 1. THE RELATION BETWEEN ACCIDENTS AND TRAFFIC FLOWS IN L ONDON
By Andrew Dickerson, John Peirson and Roger Vickerman
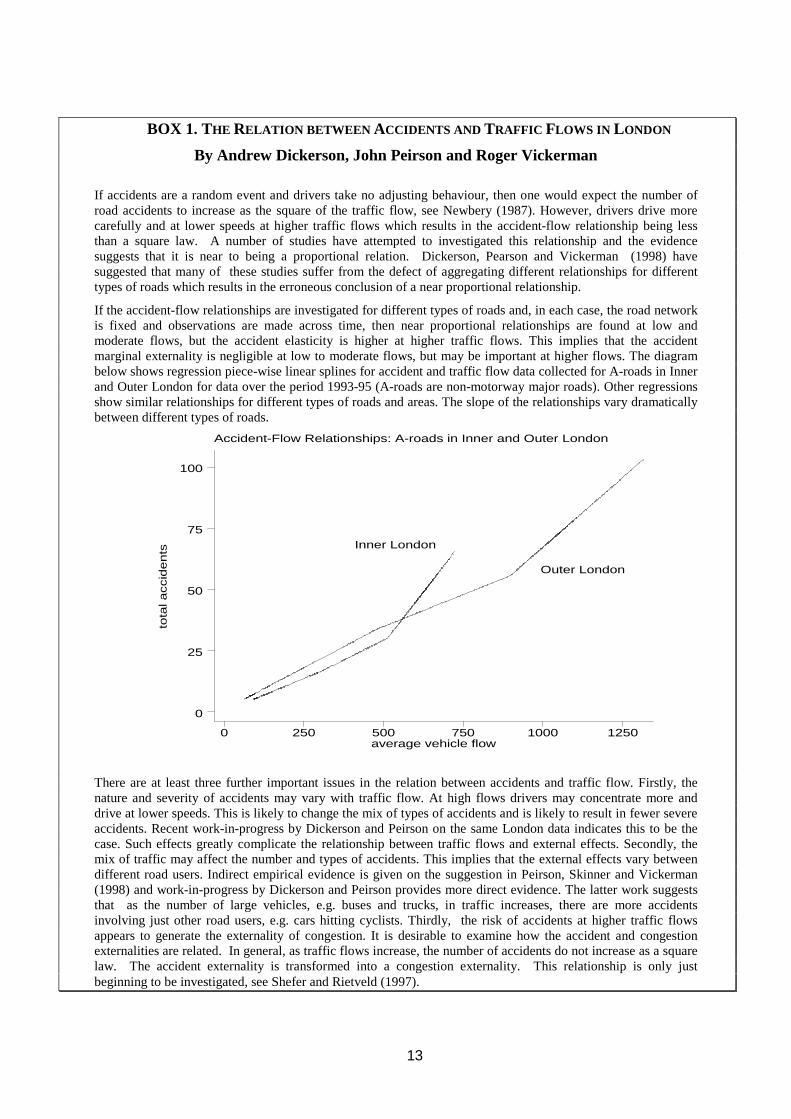
If accidents are a random event and drivers take no adjusting behaviour, then one would expect the number ofroad accidents to increase as the square of the traffic flow, see Newbery (1987). However, drivers drive morecarefully and at lower speeds at higher traffic flows which results in the accident-flow relationship being lessthan a square law. A number of studies have attempted to investigated this relationship and the evidencesuggests that it is near to being a proportional relation. Dickerson, Pearson and Vickerman (1998) havesuggested that many of these studies suffer from the defect of aggregating different relationships for differenttypes of roads which results in the erroneous conclusion of a near proportional relationship.
If the accident-flow relationships are investigated for different types of roads and, in each case, the road networkis fixed and observations are made across time, then near proportional relationships are found at low andmoderate flows, but the accident elasticity is higher at higher traffic flows. This implies that the accidentmarginal externality is negligible at low to moderate flows, but may be important at higher flows. The diagrambelow shows regression piece-wise linear splines for accident and traffic flow data collected for A-roads in Innerand Outer London for data over the period 1993-95 (A-roads are non-motorway major roads). Other regressionsshow similar relationships for different types of roads and areas. The slope of the relationships vary dramaticallybetween different types of roads.
Outer London
Inner London
Accident-Flow Relationships: A-roads in Inner and Outer London
tota
la
cc
ide
nts
average vehicle flow0 250 500 750 1000 1250
0
25
50
75
100
There are at least three further important issues in the relation between accidents and traffic flow. Firstly, thenature and severity of accidents may vary with traffic flow. At high flows drivers may concentrate more anddrive at lower speeds. This is likely to change the mix of types of accidents and is likely to result in fewer severeaccidents. Recent work-in-progress by Dickerson and Peirson on the same London data indicates this to be thecase. Such effects greatly complicate the relationship between traffic flows and external effects. Secondly, themix of traffic may affect the number and types of accidents. This implies that the external effects vary betweendifferent road users. Indirect empirical evidence is given on the suggestion in Peirson, Skinner and Vickerman(1998) and work-in-progress by Dickerson and Peirson provides more direct evidence. The latter work suggeststhat as the number of large vehicles, e.g. buses and trucks, in traffic increases, there are more accidentsinvolving just other road users, e.g. cars hitting cyclists. Thirdly, the risk of accidents at higher traffic flowsappears to generate the externality of congestion. It is desirable to examine how the accident and congestionexternalities are related. In general, as traffic flows increase, the number of accidents do not increase as a squarelaw. The accident externality is transformed into a congestion externality. This relationship is only justbeginning to be investigated, see Shefer and Rietveld (1997).
14
2.4 ACCIDENT-PRONE PERSONS, FAULT AND NEGLIGENCE
2.4.1 In the discussion above we have distinguished between different modes, vehiclecategories and traffic environment. Implicitly we have assumed that within thesedefinitions the risk is homogenous. However, accident is a random event with a largevariability in the probability. The accident risk depends on the traffic flow asdiscussed at length above, the road environment including weather condition, thevehicle type and the behaviour of the drivers.
2.4.2 A slippery road surface increases the risk of personal injury accidents three to sixtimes. In the dark period the risk may increase five to ten times compared to the drydaylight situation (Engström et.al.). The difference between road types is less extreme,an old road construction may have a risk of three times a modern motorway (COBA).
2.4.3 The drivers behaviour and personality affects the risk. However, personality ascontrol, aggressivity, lifestyle etc can not explain more than 10-20% of the accidentvariation (Engström et.al. p313). Speed is clearly correlated to risk. If the speed isincreased with 10% the risk increases with 40% (Carlsson 1989). Alcoholconsumption also increases the risk, with a consumption of 0.5 promille the riskincrease four times, with a consumption of 1.5 promille the risk increase forty times.Health factors also affect the risk but the quality of the empirical data is weak. Agehave a significant effect on the risk of causing an accident. Young drivers up to theage of 25 have an accident risk between two and six times higher than middle agedrivers. At the age of 60 the risk starts to increase again suggesting that drivers aged75 to 80 have an accident risk six to nine times higher than the middle age group.
2.4.4 There are substantial differences in the crashworthiness of different car models. Themass and the size of the car are essential factors in explaining these differences. Bigcar models have a lower occupancy risk while they are more ‘aggressive’ i.e.generates more casualties for non-occupants than smaller cars. The driver’s risk ofinjury is in the worst car models three times the risk in the best car and 1.6 times therisk in the average car. The aggressively of the worst car model is two to three timesthe best and 1.4 times the average. (See Huttula, Pirtala and Ernvall 1997).
2.4.5 The external marginal cost will be higher, due to higher risk, in bad weather and onsmall roads. To differentiate a charge according to weather seems rather meaninglesswhile the difference between road type is more important to take into account. If thisis not done a charging system may create adverse route choice decisions. Personality,behaviour and age affect the risk and consequently the external marginal cost. This isalready known among insurance companies. The vehicle type affects both the risk andthe occupancy/non-occupancy risk. Heavy vehicles, although with a higher generalsafety, may generate a large risk for other road users and should be levied a highexternal marginal cost. The aggressivity of different vehicle types will thus stronglyaffect the relevant charge.
2.4.6 Assume that two equal drivers have an accident where one of them did one singlemistake. The mistake is impossible to monitor and can not be included in anyregulation or charging system ex ante. Ex post, one of them will be guilty. In such a
15
situation the observable marginal external cost will be equal between the two drivers.We suggest that it is efficient to have the same charge for the two drivers in this case.However, if one of them belongs to an accident-prone group and the other a safe groupof users their risks are possible to estimate ex ante and it is efficient to have differentcharges. The concept of fault and negligence do not pose any problems to the pricingprinciple as long as this group is identified ex ante. Nevertheless, these complexmatters are not well understood.
2.4.7 Finally, in accidents between different categories of users the behaviour of theopposite category will affect the risk. A careless pedestrian will increase the risk that acar will hit the pedestrian, a careless driver will increase the risk that a train will hitthe car at level crossings etc. The increased risk due to this behaviour will increase theexternal marginal cost of both modes. If this is reasonable or not is a complicatedlegal/ethical question. On one hand it can be argued that the system should bedesigned so it can accept a faulty behaviour without terrible consequences. In this casea strict responsibly could be imposed on the heavy mode and consequently a higherexternal marginal cost. On the other hand it can be argued that people are responsiblefor their own behaviour and are aware of the risk within the system. With this view aresponsibility based on negligence is appropriate and the external marginal cost willnot be increased on the heavier mode. We can not give one right recommendation; thepractice is coded within the legal system.
2.5 THE VALUATION OF ACCIDENTS
2.5.1 The valuation of accidents is a controversial matter – and should probably so be.While it is evident that life is too important to value in monetary terms we know thatchanges in risks are a different matter. While no one would trade their life for a sum ofmoney most people will be prepared to choose between safety equipment’s withdifferent prices and safety performance or between different ways of crossing a streetcompared to the saving of time. In Box 2 we briefly discuss different valuationmethods. For a deeper discussion on methods we recommend the European UnionCOST 313 project.
2.5.2 Road planning has probably been the field where the value of statistical life andinjuries has been most widely used. The cost of an accident consists of both‘cold-blooded’ material cost and a ‘warm-blooded’component. The material cost includesproperty damage, administrative cost, medical and hospital cost and net lostproduction. Together these elements are only 9% of the whole accident value forfatalities, 20% for severe injuries and 40% for light injuries (see Table 10 for Swedishfigures). The ‘warm-blooded’willingness-to-pay (WTP) component is the dominantcomponent and overshadows all other costs.
2.5.3 An initial example may explain the problem we have to face and also therecommendation we give.Ask parents what they are willing to sacrifice for theirchildren’s safety – the answer will be a considerable amount of money that they willspend to reduce the risk. After a serious accident has occurred the question on risk-reduction has no meaning anymore – life can’t be valued in money. However, themonetary loss for the parents can be measured but will only be a small amount. Theuse of only the material accident costs will thus seriously underestimate the true value
16
people will invest in safety. It may then be tempting to add a component for ‘life’ buta value ex-post underestimates the true value. Instead an ex ante WTP approachshould be favoured.
2.5.4 However, the problems to estimate willingness-to-pay values for risk reduction shouldnot be underestimated. See Schwab and Soguel (1995) for a discussion on a number ofmethodological problems in connection to WTP studies of risk reductions.
2.5.5 It is often observed that the aversion against one accident with ten casualties is largerthan for ten accidents with one causality each. The former type of accidents are acharacteristic of aviation, maritime and often rail and public transport accidents. Thequestion then arises - can we use the same WTP for all modes of transport? Thedisaster aversion may be divided into “scale effects“ and “context effects“. Theargument that the “scale effect“ - number of casualties - should influence the WTP hasonly limited empirical support. However, the “context effect“ seems to influence theperceived seriousness of an accident. The context could be related to the control of therisk, if the risk is voluntary or not, and the level of own responsibility. Type oftransport mode, air borne, under water etc., may also affect the “context“. The WTP toavoid a lost statistical life in the metro has been estimated to approximately 50%higher than the WTP in road traffic (Jones-Lee (1995)). While the context effectweakly support an introduction of different values in different modes it does questionthe use of the same valuation method in all modes of transport.
2.5.6 One consequence of the WTP approach is that values expressedex anteis not equal tovalues expressedex post. After an accident has occurred the term ‘risk’ has anothermeaning and the WTP will be expressed in relation to one certain accident. Naturally,in the case of fatal accidents the WTP of the victim is zero even if relatives and friendsmay express a high WTP. This is in principle not a problem and we should not expectto find thatex postandex antevalues are identical. As Vickrey (1968) put it”it maybe convenient but it is not logically necessary that the aggregate of charges assessedshould just cover the payments to the injured…”.
2.5.7 We would like to highlight the fact that the WTP approach does not value a person’slife per se. In fact such an exercise is generally believed to be impossible and are infact irrelevant. Infrastructure investments, regulation and pricing is aboutreducing therisk for many persons and not about savingone specific life. The WTP method thustakes its starting point at the value people put on a certain risk reduction. It is oftenconvenient to transfer this individual-based value on risk reduction to a value onstatistical life (VOSL) (see Box 2).
2.5.8 The relevant question to ask in the pricing discussion is‘what are the compensationrequired by all other users to accept one more vehicle on the infrastructure?’Thetraditional approach has been to apply the values developed for investment planning inestimates of the external marginal cost. If the willingness-to-pay is an increasing,concave function of risk reduction6 the WTP estimated for investment planning willnot be an overestimation of the value relevant for pricing.
6 See e.g. Jones-Lee (1989).
17
2.5.9 The cost of an accident,ex ante, has in section 2.2 been expressed as threecomponents; (a) willingness-to-pay for safety on part of those travelling in a particularmode exposed to the risk; (b) ditto, on the part of relatives and friends of the person;(c) ditto (or costs), on the part of the rest of the society.
2.5.10 The borderline between the material losses and the WTP for safety is uncertain. Acommon assumption is that the individual when making his decision on the ”riskmarket” assess a value on the risk that includesvalue of own lost consumption. Noadditional component covering this item is therefore necessary. The wholenet lostproductioncan be assumed to be a loss for the rest of the society and majorities of thecost for hospital care, administration and property damage.A large part of this netlost production is in fact tax income on the person’s gross income. To summarise, asthe user is paying a part of the material losses approximately 80% of the materiallosses in fatal and severe accidents and 40% in slight accidents has to be covered bythe rest of the societyand constitutes a part of the c-component. In Table 11 wesummarise relevant values to use in the estimate of the external marginal accident cost inSweden.
2.5.11 While it is evident that most persons have positive WTP for increased safety forrelatives and friends, it is less clear how this fact should be treated in the context ofaccident externality charges. When it comes to accident externality charges we believethe conclusion will be different.First, the b-component of relatives and friends to usersof other transport systems (Traffic category externality) will always be relevantirrespectively of their preferences over the travellers well-being in general of the simplereason that the consumption of these groups will not be affected. The same reasoning willhold true also for the cost term related to traffic volume externality.
18
BOX 2. METHODS FOR VALUATION OF ACCIDENTS
To value accidents we may distinguish between output-based (or human capital) definitions and socialwelfare (or willingness-to-pay) definitions. The output based approach that has been most widely used is the“gross output“ or “human capital“ definition. The major component in these approaches is thediscountedpresented value of the victim’s future output (income) that is foregone due to his premature death. Allowance isoften made for non-market output and for various “direct“ economic costs such as medical cost, cost ofadministration and property damage.
An alternative output based concept is the “net output“ definition. This concept takes into account the factthat a person consumes a considerable amount of what he produces during his lifetime. The discounted presentvalue of the victim’s future consumption is subtracted from the “gross output“. This approach provides a purenarrow economic impact for the rest of the society due to a person’s premature death. The net production isapproximately only 20% of the gross production for fatal accidents while the two measures are equal for lightinjuries.
The objection to the last approach is obvious - when a person has retired the net present value will benegative! The net output approach is thus seldom used. But also the gross output approach has a number of fairlyobvious shortcomings; it focuses exclusively upon output effects and takes no account of the fact that we valueour life of more sophisticated reasons than our estimated production capacity. To meet this criticism anadditional element to the gross output has been advocated; often called ‘pain, grief and suffering’.
Accepting the fact that the value of reduced risk of death and injuries includes a number of differentconsideration by the individuals it is more appropriate to leave thead-hoc“pain, grief and suffering“ componentand concentrate on individual preferences. The trade-off people make between risk and money - individualmarginal rate of substitution of wealth for probability of death and injury - is their “willingness-to-pay“ (WTP)for risk changes. Jones-Lee (1989), Johansson (1995) and Viscusi (1993) give comprehensive discussions on thetheoretical issues related to valuation of safety.
An early CVM study related to risk reductions in traffic is Blomquist (1979). Jones-Lee et al (1985) wasprobably the first study with strong policy influences. The reaction on this study convinced the Swedish NationalRoad Administration to initiate a study, Persson and Cedervall (1991), which has strongly influenced the usedvalues in the road planning. Kidholm (1995) made a similar study in Denmark while Elvik (1993) summarisedexisting studies and suggested changes in the Norwegian practice. The European Commission (1994)summarised the current practices in the COST 313 project (see Table 9).
The marginal rate of substitution of wealth for probability of death (WTP) is often transferred to the Valueof Statistical Life (VOSL). Assume that the WTP is expressed for a small change in the probability (dz) for oneindividual. Sum these small changes overn individuals such thatn*dz=1; i.e. in a group of sizen one statisticaldeath will be avoided. The VOSL may then be expressed as the sum of the WTP over alln individuals7. The sizeof the WTP component depends on the initial risk level and the magnitude of the risk change in question. OfficialVOSL are (hopefully) estimated with the relevant values for the area in which they are intended to be used.
[see also P. Hammond Economica, 1981, Vol. 48. pp. 235-250]
2.6 CONCLUSION ANDDISCUSSION
2.6.1 The basic principle of the external marginal accident cost is straightforward. Themagnitude of the cost depends on risk elasticity, the external element of the cost andthe valuation of accidents. However, the empirical data needed to estimate the cost arenot well developed in all areas. Consequently, figures on the magnitude of the externalaccident cost are prone to relatively large uncertainty. Having said this, we do believe
7 . VOSL=WTP*n = WTP/dz
19
enough information exists to estimate external accident cost, which will give theproper structure and relation of costs.
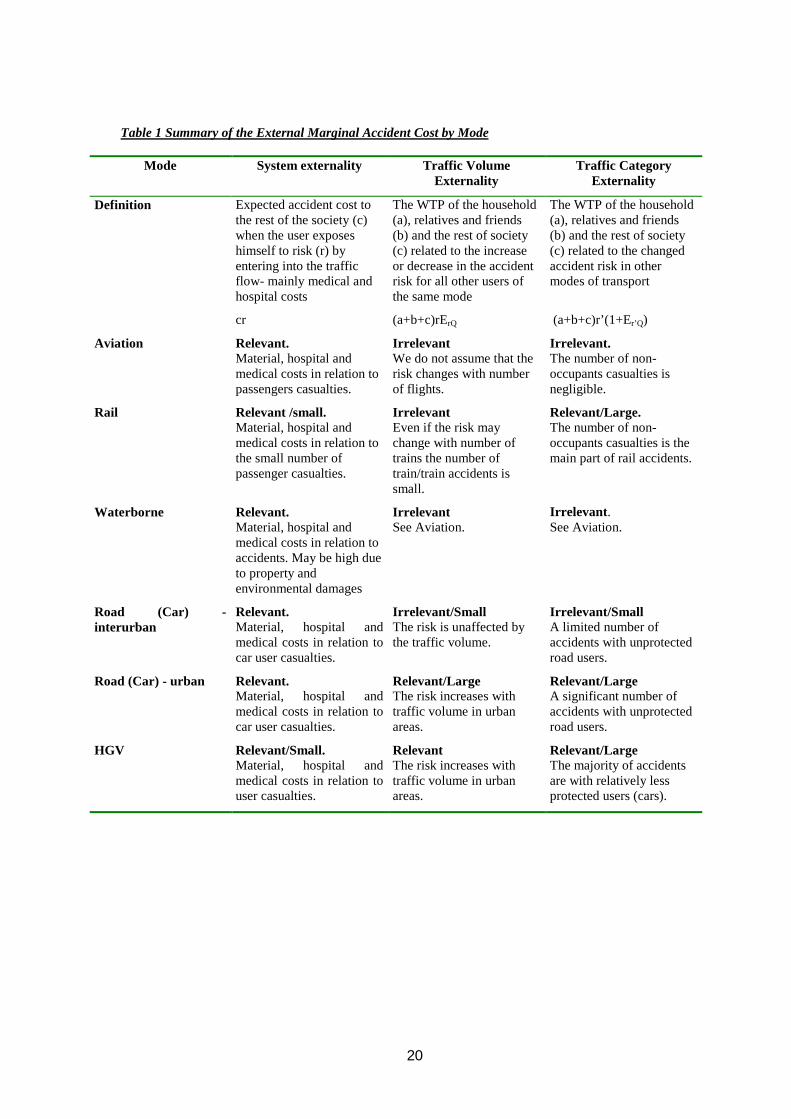
2.6.2 The external marginal cost consists of three components;(I) System externalities- the expected accident cost to the rest of the society when theuser exposes himself to risk - mainly medical and hospital costs;(II) Traffic volume externalities- the willingness- to-pay of the household, relativesand friends and the rest of society related to the increase or decrease in the accidentrisk for all other users of the same mode;(III) Traffic category externalities- the willingness- to-pay of the household, relativesand friends and the rest of society related to the changed accident risk in other modesof transport.
2.6.3 All modes generateSystem externalities(I). In interurban road traffic the evidencesuggests that the number of accidents increase in proportion to the traffic volume, i.e.the Traffic volume externality (II)is negligible. Although the evidences for thisrelationship on other modes of transport is limited we may assume that this holds truealso for Rail, Aviation and Waterborne transport. In urban areas the number ofaccidents increase faster than the traffic volume, which results in a relevantTrafficvolume externality (II). Even if the number of accidents between different modes donot increase proportional with traffic volume the conflict between categories generatea relevantTraffic category externality (III).This externality is relevant in urban roadtraffic (cars versus vulnerable road users), for heavy (Goods) Vehicles and for rail(cars versus train). In Waterborne transport and Aviation the majority of the casualtiesare users within that mode.
2.6.4 The cost of an accident consists of both‘cold-blooded’ material cost and a ‘warm-blooded’ component. The ‘warm-blooded’willingness-to-pay (WTP) component isthe dominant component and overshadows all other costs. The use of only the materialaccident costs will seriously underestimate the true value people will invest in safety.An ex ante WTP approach should be favoured.
2.6.5 We highlight the fact that the WTP approach does not value a person’s lifeper se.Infrastructure investments, regulation and pricing is aboutreducing the riskfor manypersons and not about savingone specific life. The WTP method takes its startingpoint at the value people put on a certain risk reduction. Yet it is often convenient totransfer this individual-based value on risk reduction to a value on statistical life(VOSL). This highlights the difference between cost accountingex postas a base forcost recovery and insurance and marginal external costex anteas a base for efficientincentives.
2.6.6 While the high WTP component may be controversial it should be remembered that thezero risk elasticity on interurban roads and in Aviation and Maritime transport impliesthat only the system external cost has to be internalised. However, the WTP componentwill affect urban road transport, HGV and Rail.
2.6.7 An additional complexity emerges when we introduce the problem of risk avoidingbehaviour. The cost of this behaviour exists and should be internalised but it isdifficult to observe its magnitude.
20
Table 1 Summary of the External Marginal Accident Cost by Mode
Mode System externality Traffic VolumeExternality
Traffic CategoryExternality
Expected accident cost tothe rest of the society (c)when the user exposeshimself to risk (r) byentering into the trafficflow- mainly medical andhospital costs
The WTP of the household(a), relatives and friends(b) and the rest of society(c) related to the increaseor decrease in the accidentrisk for all other users ofthe same mode
The WTP of the household(a), relatives and friends(b) and the rest of society(c) related to the changedaccident risk in othermodes of transport
Definition
cr (a+b+c)rErQ (a+b+c)r’(1+Er’Q)
Aviation Relevant.Material, hospital andmedical costs in relation topassengers casualties.
IrrelevantWe do not assume that therisk changes with numberof flights.
Irrelevant.The number of non-occupants casualties isnegligible.
Rail Relevant /small.Material, hospital andmedical costs in relation tothe small number ofpassenger casualties.
IrrelevantEven if the risk maychange with number oftrains the number oftrain/train accidents issmall.
Relevant/Large.The number of non-occupants casualties is themain part of rail accidents.
Waterborne Relevant.Material, hospital andmedical costs in relation toaccidents. May be high dueto property andenvironmental damages
IrrelevantSee Aviation.
Irrelevant .See Aviation.
Road (Car) -interurban
Relevant.Material, hospital andmedical costs in relation tocar user casualties.
Irrelevant/SmallThe risk is unaffected bythe traffic volume.
Irrelevant/SmallA limited number ofaccidents with unprotectedroad users.
Road (Car) - urban Relevant.Material, hospital andmedical costs in relation tocar user casualties.
Relevant/LargeThe risk increases withtraffic volume in urbanareas.
Relevant/LargeA significant number ofaccidents with unprotectedroad users.
HGV Relevant/Small.Material, hospital andmedical costs in relation touser casualties.
RelevantThe risk increases withtraffic volume in urbanareas.
Relevant/LargeThe majority of accidentsare with relatively lessprotected users (cars).
21
GUIDELINE TO ESTIMATE THE EXTERNAL MARGINAL ACCIDENT COST
2.6.8 To estimate the external marginal accident cost we need three types of information, i)accident or casualty risk, ii) risk elasticity and iii) economic valuation. All thesecategories have been discussed in the previous sections and a short guideline ispresented in this section.
2.6.9 We recommend to base the estimates oncasualty risk. As the number of casualties peraccident differ between different modes and accident types the economic valuation peraccident may not be constant. We define three types of casualty, i) fatality, ii) severeinjuries, iii) slight injury. In addition some costs that occur also in non-personal injuryaccidents has to be taken into account; consequently we need to define a forthcategory; iv) damage only accidents. The exact definition of these casualty typesdiffers between Member States. However, as we recommend to use the economicvalues defined in each Member State no inconsistency should occur due to differentdefinitions. For estimates of the external accident cost the data on accidents and theMember States should supply valuation.
2.6.10 In addition we need to know the mode and vehicle type of the victim as well as theother vehicle element in the accident. Finally we need to know the exposure by modeand vehicle type. We use driven kilometre as the relevant measure of exposure foreach mode/vehicle type. Table 5 summarises such risk estimates for some MemberStates. Annex 2 presents Swedish casualty risks used in the following example.
2.6.11 For each casualty a number of cost elements are relevant. See table 7 for a summaryof values presented in the COST 313 project. The values used in the Swedishinfrastructure planning is presented in table 8 and how this is transferred to valuesused in estimates of the external marginal cost is presented in Table 9. Annex 2 gives aguideline how to transfer values used in Road Investment planning to the purpose ofestimating the external marginal cost.
2.6.12 The risk elasticity should be defined by casualty type and mode/vehicle type.However, this detailed information is not available and in the previous sections wehave discussed possible magnitudes of the elasticity between the same type of vehiclesand between different categories.
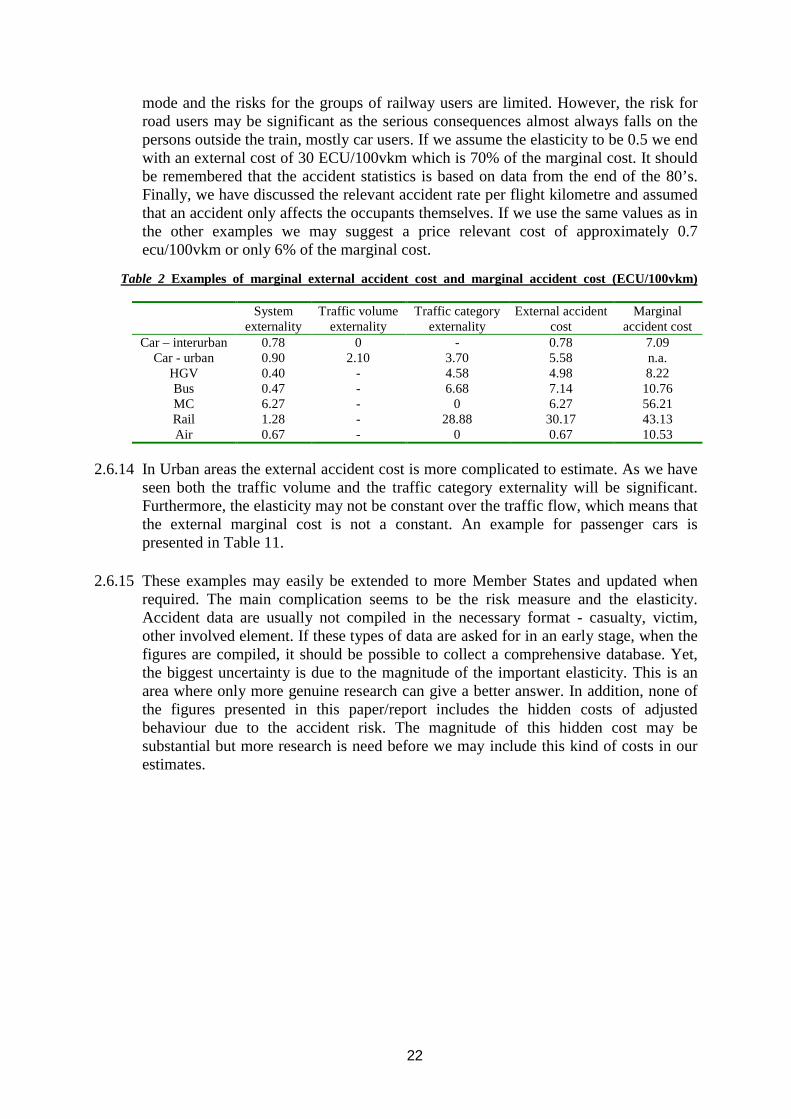
2.6.13 Based on this type of information we may estimate in Annex 2 the marginal accidentcost and the external marginal accident cost. Table 10 presents the marginal accidentcost on Swedish interurban roads which is stated to be around 7.09 ECU/100vkm. Ofthese costs 65% is internal WTP to the driver, 7% internal (direct and indirect)material cost for the household and 24% cost based on WTP for relatives and friends.While the last component may be debated we assume that it is internal as long as it isrelatives and friends of the driver (as a non-market transaction between relatives andfriends). The external marginal cost is the remaining 11% or around 0.78 ECU/100vkm. The example suggests that the cost for HGV could be around 5 ECU/100vkm,which is 60% of the marginal cost. For busses approximately 70% of the marginal costis external and for MC only 11% is external. Railway transport is a safe transport
22
mode and the risks for the groups of railway users are limited. However, the risk forroad users may be significant as the serious consequences almost always falls on thepersons outside the train, mostly car users. If we assume the elasticity to be 0.5 we endwith an external cost of 30 ECU/100vkm which is 70% of the marginal cost. It shouldbe remembered that the accident statistics is based on data from the end of the 80’s.Finally, we have discussed the relevant accident rate per flight kilometre and assumedthat an accident only affects the occupants themselves. If we use the same values as inthe other examples we may suggest a price relevant cost of approximately 0.7ecu/100vkm or only 6% of the marginal cost.
Table 2 Examples of marginal external accident cost and marginal accident cost (ECU/100vkm)
Systemexternality
Traffic volumeexternality
Traffic categoryexternality
External accidentcost
Marginalaccident cost
Car – interurban 0.78 0 - 0.78 7.09Car - urban 0.90 2.10 3.70 5.58 n.a.
HGV 0.40 - 4.58 4.98 8.22Bus 0.47 - 6.68 7.14 10.76MC 6.27 - 0 6.27 56.21Rail 1.28 - 28.88 30.17 43.13Air 0.67 - 0 0.67 10.53
2.6.14 In Urban areas the external accident cost is more complicated to estimate. As we haveseen both the traffic volume and the traffic category externality will be significant.Furthermore, the elasticity may not be constant over the traffic flow, which means thatthe external marginal cost is not a constant. An example for passenger cars ispresented in Table 11.
2.6.15 These examples may easily be extended to more Member States and updated whenrequired. The main complication seems to be the risk measure and the elasticity.Accident data are usually not compiled in the necessary format - casualty, victim,other involved element. If these types of data are asked for in an early stage, when thefigures are compiled, it should be possible to collect a comprehensive database. Yet,the biggest uncertainty is due to the magnitude of the important elasticity. This is anarea where only more genuine research can give a better answer. In addition, none ofthe figures presented in this paper/report includes the hidden costs of adjustedbehaviour due to the accident risk. The magnitude of this hidden cost may besubstantial but more research is need before we may include this kind of costs in ourestimates.
23
3 INTERNALISATION: MECHANISM FOR CHARGING COSTS TO USER
3.1.1 The discussion on internalisation of external costs has until now almost exclusivelyfocused on the use of theFuel excise duty. Only Vickrey (1968) seems to haveincluded insurance system as a policy instrument; lately this possibility has beenhighlighted in the EU-Commissions Green Paper ”Towards Fair and Efficient Pricingin Transport” (1995). We discuss internalisation around the concept ofex postandexante systems where both pricing, regulation and liability or fines may be included.Already today we have a mix of systems - insurance, tax and regulations – and a newstrategy would most probably include many different systems but in a co-ordinatedway. We deal with both the efficiency aspects of prices - the extent to which marginalcosts can be internalised by differing instruments; and fairness aspects, which focus oncost recovery, ex post costs.
3.1.2 The purpose is to estimate the level of the cost that should be internalised. From theoutset it should be clear that internalisation of the accident cost is only one part of atraffic safety policy. In addition a number of other cost-effective policies should bediscussed, such as infrastructure investments, influences of driver behaviour andvehicle standard. However, as long as the external costs are not internalised theefficiency of all the additional policies will be reduced. Internalisation of the externalaccident cost is a necessary condition for a socio-economic efficient traffic safetypolicy, but it is not a sufficient condition.
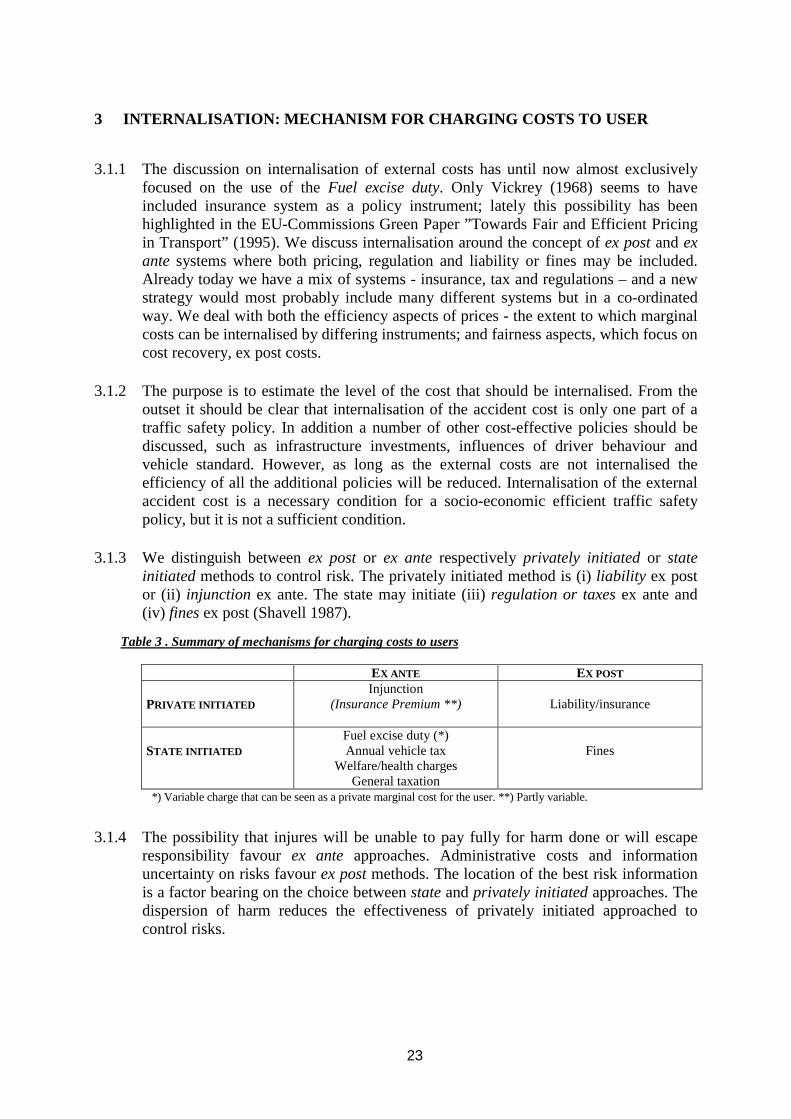
3.1.3 We distinguish betweenex postor ex anterespectivelyprivately initiated or stateinitiated methods to control risk. The privately initiated method is (i)liability ex postor (ii) injunction ex ante. The state may initiate (iii)regulation or taxesex ante and(iv) finesex post (Shavell 1987).
Table 3 . Summary of mechanisms for charging costs to users
EX ANTE EX POST
PRIVATE INITIATED
Injunction(Insurance Premium **) Liability/insurance
STATE INITIATED
Fuel excise duty (*)Annual vehicle tax
Welfare/health chargesGeneral taxation
Fines
*) Variable charge that can be seen as a private marginal cost for the user. **) Partly variable.
3.1.4 The possibility that injures will be unable to pay fully for harm done or will escaperesponsibility favour ex ante approaches. Administrative costs and informationuncertainty on risks favourex postmethods. The location of the best risk informationis a factor bearing on the choice betweenstateandprivately initiatedapproaches. Thedispersion of harm reduces the effectiveness of privately initiated approached tocontrol risks.
24
3.1.5 Pricing is not always the best ex ante state initiated system. The decreasing chargerelated to accidents with unprotected road users in urban areas suggests that a ‘cornersolution’ may be the most efficient solution, i.e. no car traffic at all, which is easiest toachieve through regulation. The pros and cons of pricing versus regulation follow inthis area the mainstream in the literature.
3.1.6 Under the assumption that the state has the best risk information or that injures will beunable to pay fully for harm done an ex ante state initiated control of the risk isrecommended, i.e. taxation or regulations. The advantage of the ‘traditional’internalisation method, the Fuel excise duty, is low transaction costs (as the taxalready exists) and a reasonable good correlation with distance. However, the chargeis uncorrelated to vehicle type, environment or driver skill. Furthermore, the exciseduty gives incentives to fuel efficiency, which may not be correlated with safetyimprovements, possibly, the opposite. The use of the Annual vehicle tax makes itpossible to link the charge to vehicle type and partly driver skill but the chargebecomes totally independent on driven distance and the environment.
3.1.7 It is evident that an internalisation through the Fuel excise duty never will be able tocharge high-risk drivers different from low-risk drivers or adjust the charge accordingto the specific risk, e.g. by road type. Internalisation through an insurance system willin principle be able to handle the first problem in a more differentiated way. Thesecond problem has to be handled with more advanced charging mechanism.
3.1.8 The insurance policy transfers an ex post liability to an ex ante premium. From theoutset it should be clear that insurance is a method of managing risk by distributing itamong large numbers of individuals. The main aim is not to internalise accident costsor affect behaviour.
3.1.9 A kilometre charge, an advanced form of the current vignette (or user charge) onHGV, is another possible mechanism for passing on accident costs. The charge can inprinciple be vehicle (or driver) and environment specific as well as distance related. Inurban areas the same conclusion holds true for modern Road Pricing systems. Thedegree of sophistication of the system will constrain the degree to which charges canvary with risk or transport user.
3.1.10 Were sufficiently advanced technologies available, insurance companies could use thisprecise information to greatly refine their premium charges.
3.1.11 It is obvious that a number of market failures exist regarding to traffic safety. Externalcost is only one of these failures. Customers can make well-balanced choices betweensafety and other aspects only if they accurately can assess the safety level offered bydifferent alternatives. As this information is not easily available an imperfection occur.A second information problem is sometimes called Myopia. Because customers arenot well informed about the risk of different operators they can cheat on their safetyperformance. The prevention cost they save are borne today while the accident cost, ifthey are lucky, may be postponed many years. Consequently, in addition to thediscussed internalisation of external accident cost provision of better informationseems to be an additional important policy.
25
3.2 THE POTENTIAL OF THE INSURANCE SYSTEM TO INTERNALISE ACCIDENT COST
3.2.1 The main aim of the liability insurance system is to spread the economic burden ofaccidents over the group that faces an accident risk and the system is thus not gearedtowards accident prevention or internalisation of the external costs.
3.2.2 By paying a relatively small sum – the premium – the insured policyholder receives apromise from an insurance company to pay the insured if he suffers a loss. The insuredavoids the risk of suffering a large loss by substituting it for the certainty of suffering asmall premium cost. The theory of insurance predicts that a policyholder will purchaseinsurance so that he is covered for all his losses given that the insurance market iscompetitive.
3.2.3 Insurers try to set the price of coverage in accordance with the expected loss – theprobability of a loss (risk) multiplies by the magnitude of the loss if it occurs. Suchpricing is based on average insurance costs rather than marginal costs, but whenaccurate (capable of discriminating between different risk characteristics) it is capableof sending quite precise price signals to the insured (by passing some of the risk on)and so offering partial internalisation.
3.2.4 Lost earnings and medical expenses rather than non-material costs usually bound themagnitude of the loss, the coverage. The marginal external cost is dependent on therisk elasticity, the risk and the ex ante valuation of accidents. Consequently, adifference between insurance premiums and pure marginal cost can be found aroundthe use of ex post or ex ante values and the use of average cost or marginal cost, thelatter is affected by the elasticity.
3.2.5 The existence of the uncertainty surrounding thenon-pecuniary losses causesdivergence between ex post and ex ante cost estimates and thus a divergence betweencoverage optimal for compensation and coverage optimal for deterrence. This problemis most obvious in the case of fatal accidents. The coverage of costs compared to theex ante valuation is one indicator on the possible degree of internalisation throughinsurance systems. However, under certain conditions the material cost is thedominant part of the external marginal cost reducing this difference.
3.2.6 If insurance spread the burden of risks so effectively that policyholders can engage inhigher risk activities the safety effect of an insurance system may be negative. This isthemoral hazardproblem, which, in principle, can be partially countered by means ofdifferentiated insurance premiums. A major problem for any scheme (including FuelExcise Duty) to internalise external costs, is the difficulty to observe individualbehaviour; i.e. we have asymmetric information. This problem has generated acomplex premium structure, which includes ex post charges as Bonus/Malus tocompensate for the lack of information ex ante. Nevertheless, considerable risksharing and possible moral hazard still occurs (see Boyer, Dionne (1986) and Pauly(1974)).
3.2.7 Internalisation of the external accident cost is about affecting behaviour. Anycharge/premium has to be linked to the activity/decision that generates accidents. The
26
insurer will always use a market classification with high correlation to the cost and therisk (Harrington, Doerpinghaus 1993). The use of information that has no predictivepower will not be rewarded over time and the market will classify as long as premiumscan be reduced for low-risk groups. Competitive adjustments in the supply of coveragewould ensure different premiums linked to the activity/decision. While profitmaximisation and competition provide insurers with incentives for accurateclassification, the cost of obtaining relevant and accurate information will frequentlybe prohibitive.
3.2.8 To achieve internalisation through insurance systems we should ensure a competitiveinsurance market with coverage in line withex antevalues of statistical life. However,the existence of elasticity in the expression of external marginal cost suggests that exante values could be reduced when determining the coverage. In addition, theelasticity gives rise to more complex charging structures in urban areas and may notbe properly handled by the insurance system. The actual consequences for the costrecovery of the insurance industry require further investigation. Finally, the use ofgovernment information and charging systems should be offered insurance companiesto improve the premium structure.
3.2.9 Although, the insurance system is not aimed at internalisation the premium may beseen as an instrument for partial internalisation of external accident cost. Acompetitive market will ensure that the premium approximates the expected claimcost, which includes the risk level and the ex post cost of an accident. Such a premiumgoes many steps towards internalisation. However, the existence of uncertaintyregarding non-material losses causes a divergence between ex post and ex ante costsand thus coverage optimal for compensation and coverage optimal for deterrence.Finally, the cost of information and charging may be too high to make it feasible forinsurance companies to align their premiums with detailed risk classification andactivities.
3.3 CURRENT PRACTICE
3.3.1 We can not find any current practice with the aim to internalise the marginal externalaccident cost in any Member State. However, in some Member State the level of theFuel excise dutyis discussed as a way to internalise external costs.Annual vehicletaxesappear not to be safety related anywhere. ThePurchase taxis often dependenton the price of the vehicle. Introduction of expensive safety equipment will thusincrease the taxation, which is a perverse safety policy. Neither the currentEurovignettesystem nor existingRoad Pricing/Tolls are safety related
3.3.2 While government initiated pricing is rare as a safety policy the use of regulation iswidespread. Vehicle standard, driver education and behaviour (e.g. speed) areregulated in Member States.
3.3.3 In some Member State governments’ welfare and health charges is directly chargedroad users. In other the main part of the costs due to an accidents is born by thegovernment and thus the general taxation system.
27
3.3.4 Summaries of the current European insurance systems are presented in section 3.2.abelow. The coverage of costs compared to the ex ante valuation is one indicator on thepossible degree of internalisation through insurance systems. This is discussed in sub-section 3.2.b below. The insurance premium is the ex ante outcome of the insurancepolicy. Both the level and the structure of the premium will influence the level ofinternalisation and the potential for behaviour influences (section 3.2.c).
3.2.A. EUROPEANINSURANCESYSTEMS
3.3.5 In all EU-countries, there is a legislative requirement that makes it obligatory formotor vehicle to have insurance in respect of liability for personal injury and propertydamage of third parties.
3.3.6 The motor insurance industry has been deregulated in the European Union. However,the process to adapt to a deregulated environment has not yet stabilised. DifferentMember States have advanced to a different degree where UK seems to have made thefastest progress. This is important to remember when the function of the insurancemarket is studied.
3.3.7 While internalisation through insurance system is of interest for all modes of transportwe concentrate this discussion on the Road system.
3.3.8 Most liability systems are based on the system of fault where the onus falls upon thevictim to establish that another person was guilty of causing the injury or damage inorder to obtain compensation. If this cannot be proven compensation may not be paid.In some European countries the principle of liability based on fault appliesunconditionally to road traffic accidents. This is true of Belgium, the Netherlands,Luxembourg, Italy, UK and Ireland. In UK, Ireland and Belgium the injured party isrequired to provide unqualified proof of fault. In Italy, the Netherlands andLuxembourg fault of the damaging part is assumed until he provides proof of thecontrary. However, in the Netherlands the presumption of fault applies only in favourof non-motorised victims.
3.3.9 Other European countries have introduced a system of strict liability; Denmark, Spain(within limits), Greece, Germany (within limits) and France, i.e. irrespective of fault.In France the driver and owner are liable without restrictions for bodily injury or deathof non-motorised victims if the person injured or killed is younger than 16 or olderthan 70 years, or has at least 80% disability (loi Badinter 1985). In this case, neitherthe existence of an inevitable event nor negligence on the injured party can lead to anexemption of the principle of fault liability. Spain, and to some extent Denmark, havethe principle of liability for material damage but strict liability in the case of bodilyinjuries.
3.3.10 Sweden, Finland and Norway operate systems which combine features of the fault andstrict liability systems, coupled with "no fault" arrangements resembling systems insome states in USA where policyholders receive compensation from their owninsurers. The policy is based on "strict responsibility", i.e. irrespective of whether thevehicle has been used irresponsibly or not, the cover has to be paid. The obligatory
28
part of the insurance in the Nordic countries covers the cost for the driver, passengersand other persons irrespectively of who is at fault and are covered by the own vehicleinsurer.
3.3.11 Three different approaches are thus taken towards motor liability insurance within EU.Comprehensive analyses of the pros and cons of the different systems is not within thescope of the present paper. Possibly consequences on the internalisation of differentinsurance systems can be; if accidents are seen as a stochastic event with equal costburden independent of behaviour a no-fault system will be appropriate; if driverbehaviour is seen as important a fault system may be favoured or a no-fault systemwith bonus/malus. Finally, if the cost burden always fall on the other party (forexample vulnerable road users) a strict liability system may be favoured.
3.3.12 While we are not in the position to recommend any system it appears that a mix ofsystems may be appropriate to internalise accident costs. The strict liability in relationto relatively vulnerable road users (cars in HGV/car accidents, pedestrians in motorvehicle/pedestrian accidents, cars in rail/car accidents) is essential to internalise thetraffic category externality (III).
3.3.13 In many Member States, the social security authorities have the right of full recourseon motor liability insurers for costs incurred by traffic accident victims. In practise theconsequence of the arrangement is internalisation of these costs in the premium paidby the insurance consumer. In Finland, this is organised in the reverse: motor insurersin their capacity as primary payers settle all claims for victims.
3.3.14 Motorists are taxpayers in conjunction with their Motor Liability Insurance Premiumin most of the Member States. Value Added Tax, VAT, is the most common form, insome countries under the name of Insurance Premium Tax. In Denmark, there is noVAT on the premium, but a 50% tax is added to the premium with the very motivationof internalising motor accident hospital costs. In Finland, in addition to the 22 %premium tax, a special levy for the same purposes as is in Denmark is collected.Furthermore, for the financing of national Road Safety organisations, one per centlevies are collected in France and Finland.
3.2.B. THE COVERAGE OF COSTS IN INSURANCE POLICY– LIMITS AND PRACTICES.
3.3.15 The limits of cover vary between countries as seen in Table 15. When the insurancelimit is compared with the value of statistical life for fatalities we find that the limit isrestrictive in four of the Member States of which we have information. For three ofthese cases the limit is sever and reduces the amount with 50% or more.
3.3.16 The European Union tries with directive to align the minimum amounts of insurancecover of the Member States. The minimum cover required by the Second CouncilMotor Liability Insurance Directive (84/5/EEC) is 350.000 ECU per victim in the caseof personal injury and 100.000 ECU per claim in the case of damage to property. TheCouncil has recently directed a questionnaire to the Member States i.e. on the need toreview these minimum covers.
29
3.3.17 An important difference between Member States concerns damages for survivingdependants. Today, this is awarded in all EU countries with the exception of Denmark,the Netherlands and Germany. The group of those surviving dependants entitled toclaim is sometimes confined solely to the closest relations (spouse or smallchildren)(UK). In other countries siblings and grand parents are entitled to claim(Belgium, Greece).
3.3.18 In each Member State, the amount of compensation which victims may claim is theresult of the legal system of liability. This is not to be confused with the minimumguarantee of the statutory insurance schemes. We have compared the ”most generous”award with the Value of statistical life (VOSL). However, ”in the real world everycase is unique and there is no correct figure in any compensation case..... In someMember States the process has been described as a lottery”(McIntosh and Holmes(1990).
3.3.19 Although the McIntosh and Holmes study is very fragmentary and incomplete, makingit conclusions difficult to draw, we compare the compensation for invalidity andfatality for two different persons, a 40-year-old man, doctor, with two children and 20-year-old single woman who studies. In the case of instant death the variation betweenthe two cases and the deviation from the VOSL seems to be rather extreme (Table16).The relatives of the single woman will in some member states hardly receive anymonetary compensation at all. If she were killed in Italy her relatives would receive300,000 ECU but in UK less than 1000 ECU. For serious injuries the variation ismuch smaller (Table17). Here the different approaches related to relatives are not soobvious.
3.3.20 In Belgium, France and Germany, UK social bodies may claim against the insurancecompany of the driver who caused the accident. The system usually operates so thatthe social security schemes compensate the hospitals in the first instance and the Statelater requires the recovery of the costs from the insurers. In Finland, all claims aredirected to the insurance company. In Sweden and Denmark the social securityscheme covers all road accidents in the framework of the general health insurance andno claim is possible against the insurance company. However, the company bears thematerial damage cost and may bear the non-material costs as mental distress etc.
3.3.21 With the reservations mentioned, some observations may be drawn from thissummary. In the case of fatalities the difference between the victims' willingness-to-pay and the possible award is very large. The underlying reason is the discusseduncertainty causing the difference betweenex postand ex antevalues in the case ofnon material losses. An insurance system basing premiums on ex post values willtherefore be far from reflecting the proper external accident costs in the case of fatalaccidents. To avoid this underestimation, and the "lottery" of ex post compensation,consideration should be given to the use by insurers of ex ante values of non materialcosts. Setting value or "cover" limits, as done in some Member States inhibits theefficient internalisation of costs. Other Member States have practices which reduce theaward. Finally, in some Member States, notably Sweden, the social security systemcovers the medical costs and some other losses. In Sweden evidence suggests that theinsurance system only covers 25% of the losses.
30
3.2.C. PREMIUM STRUCTURE
3.3.22 The general cost of an insurance policy consists of a number of elements; the ‘pure’Premium, Reduction in premium when safety devices etc are installed, Reduction inpremium for extra driver education, Bonus/Malus, Deductibles and reduction afterserious negligence (Vaaje 1995). All these components affect the actual cost perceivedby the policyholder and have thus bearing on the potential behaviour influence.
3.3.23 The common basic criteria used for calculating and applying motor insurancepremiums by insurers are related to the drivers, the type of vehicle and place where thevehicle is kept and used. These criteria is often refined to such details as age, sex,claims and driving experience. As to vehicle itself, engine capacity, power to weightratio, performance, cost of parts, etc. may be taken into account.
3.3.24 The use of distance driven as a rating variable or variable is not common place acrossthe European Union. The reasons may be; i) state of development of rating structuresafter the de-regulation, ii) a feeling that policyholders will not or cannot accuratelydisclose their anticipated annual mileage (so creating the possibility of fraud).However, it should be noted that in the long de-regulated United Kingdom market, useof distance driven as a rating variable is both common place (without any suspicion offraud) and both lowers and raises premiums away from the ”average”.
3.3.25 The policyholders are divided into as homogenous risk categories as possible. Foreach of these categories the mean cost of the risk per vehicle is estimated. Togetherwith transaction costs this indicate the so-called ”a priori” price to be paid by thepolicyholder. However, as this information is difficult to acquire a detailed ”a priori”system may be adjusted with a ”a posteriori” system. In these systems the initialpremium is modified in the light of the policyholder’s involvement in accidents. Themost common such system in use is the Bonus/Malus system where the premium willbe affected by actual safety performance.
3.4 BEHAVIOURAL INCENTIVES
3.4.1 The internalisation method should give behavioural incentives to the user. It is thusimportant the any charge or premium is linked to the activity/decisions that generatesthe accidents, such as; i) driven distance, ii) modal choice, iii) driver skill andbehaviour, iv) choice of vehicle and safety equipment.
3.4.2 A mileage-dependent charge differentiated by vehicle standard, driver skill and roadtype is thefirst bestsolution, which will, in a perfect world, affect all of the decisionsabove. However, this may not be feasible due to the costs of the system. In additionthe user may not perceive the mileage costs when, for example, he purchases a newvehicle. ASecond-bestsolution includes a simpler mileage-dependent system togetherwith an annual vehicle and driver related charge.
3.4.3 Recent evidence on elasticities in transport suggests a much higher sensitivity towardsprice changes than what was previously thought. "In reality, competition between
31
modes, routes or firms gives rise to a wide range of price elasticities, generally muchmore elastic than conventional wisdom would suggest."(Oum 1992).
3.4.4 The basic price elasticities of interest for a discussion on behavioural change as aresult of a price-based policy are own price elasticities on transport demand andsubstitution elasticities between different type of vehicles. Finally, substitutionelasticities with respect to other modes are also of relevance. The substitutionelasticity between similar products can be almost infinite. A minor price differencecan generate major changes in consumption patterns.
3.4.5 For car use, long run fuel price elasticities can be quite high, and a comprehensivesummary of fuel price elasticities (Goodwin 1992) suggests thattraffic volumeelasticitieswith respect to fuel prices are -0.16 in the short run and -0.33 in the longrun. While this is good news for a policy aiming at reducing CO2 emissions throughfuel prices, determining price elasticities for the internalisation of accident costs wouldbe almost impossible.
3.4.6 Even if such elasticities could be determined, current premiums are seldom levied asvariable charges. Instead they are basically fixed on an annual basis. In a few countrieshigh-risk vehicles are subject to increased premiums but the additional premium is stillnot in proportion to the actual risk presented by these vehicles (Vaaje (1995)). Thepricing of insurance may therefore have little influence when purchasing a newvehicle. Encouragement of new safety equipment may be achieved through insurancepremium (extra braking lights, air bag, etc) but there is little empirical evidence forthis. The same is true for differentiated premiums according to driver education, whichexist in France and Norway.
3.4.7 Traffic and accident fines are an alternative means of passing on costs and clearincentives, however Petterson finds that incentives for accident-free driving(insurance) is more effective than schemes with punishment after an accident (fines)(Petterson, Englund (1997)).
3.4.8 The general believe in modern insurance thinking of the Bonus/Malus system is that acar driver, the very seconds before an accident situation does not react in accordancewith the Bonus/Malus factor in the Insurance terms, but follows the internal models ofattitude he represents. Hurst (1980) focus on this weak area in the B/M system –‘Insurance rebates like no-claim bonuses are appropriate rewards for goodbehaviour, but they are so hopelessly delayed that it is hard to see how they couldreinforce specific safe driving behaviour’. This theory is supported by research resultsin Finland – ‘The result do not indicate effects of the means of insurance policy in thedirection of traffic behaviour’( Backman et.al. 1984) - and Sweden (Englund 1995).However, the latter concludes that‘….we ought to use B/M systems. If we want toattain an effect on road safety, however, we should design the system carefully…’.Many authors (Negrin, Italy 1995) including the OECD (1990) share this positive faithin the B/M system, irrespectively of the weak empirical evidence of its effect.
3.4.9 "Deductibles" seem to have their strongest effect on the number of reported accidentsbut the empirical evidence around this effect is also limited (Backman, Haapanen,
32
Mikkonen (1981)). It may simply deter small claims (reducing insurers' administrativecosts) rather than indicate a reduction in accidents.
3.4.10 The choice of vehicle may also be affected by information in addition to charges. Theimportance of vehicle choice should certainly not be ignored, since the studies in thisfield strongly promote the product development of the automotive industry(Huttula&Ernvall,1992,1994).
3.4.11 The empirical evidence of the relationship between the current premium structure anddifferent activities/choices are limited and weak. As the current premium structure hasa very weak correlation with distance we may not expect any effect on distance andnumber of trips. Neither Beckman et.al. (1984) nor Eriksson (1986) found anyrelationship between premium and modal split. The problem to create incentives forsafer behaviour is the absence of an appropriate monitoring systemex ante(Bower(1991)). Incentive can thus only be createdex postwith a B/M system, which onlygive a limited effect as the incentives are delayed. Some authors suggest that theinsurance should be linked to the driver (license) instead of the vehicle (Backmanet.al. 1984) In ‘principle’ many authors believe that insurance premium has an effecton vehicle choice (Petterson (1982), Eriksson (1986), Fröyland(1983) but theempirical evidence is, once again, limited.
3.4.12 It is evident that a ‘mileage-charge’, as the fuel price, affects both driven distance(including both numbers of journeys, choice of origin-destination and modal split) andvehicle technology. As fuel costs are linked to energy consumption this creates anincentive for energy efficiency. It obviously exists apotentialfor a mileage-dependentsafety related charge to influence behaviour in a number of different dimensions;distance, modal split, vehicle choice and technology. However, the current premiumstructure is most often charged on an annual basis, which basically only may affectvehicle choice and technology.
3.5 IS IT POSSIBLE TO IMPROVE THEEUROPEAN INSURANCE SYSTEM FOR FAIRER AND MORE
EFFICIENT CHARGES
3.5.1 Even if the liability insurance system is not geared towards accident prevention orinternalisation of the external costs an internalisation has already taken place to somedegree and a potential exists for further improvements. Below we discuss a number ofpossibilities to influence the insurance market so that internalisation of accident costscan be achieved.
3.4.A CLAIM ALWAYS MEDICAL COSTS AGAINST INSURANCE COMPANIES
3.5.2 In many countries (Belgium, France and Germany, UK ) social bodies may claimagainst the insurance company of the driver who caused the accident. A new RoadTraffic (NHS Charges) Bill with the purpose to ensure that charges reflect the real costof treatment was presented in UK in 1998 (see Box 4). In Finland, all claims aredirected to the insurance company. However, in Sweden, all medical and hospitalcosts are met by the social security systems within the general health insurance; noclaim is possible against the insurance company.
33
3.5.3 When the medical cost (c) is shifted to the user he will purchase an insurance policyfor a premium equal to thesystem externality(I) (pins = cr). The remaining externalcost consists oftraffic volume(II) and traffic category externality(III).
3.5.4 At first glance these two remaining components seems to be a considerable part of theexternal marginal cost. But recall the empirical evidences of interurban road trafficaccidents and traffic volume presented above; if the risk is constant and the number ofintersystem accidents negligible only thesystem externality(I) is relevant. For passengercars no accident charge is necessary on interurban roads if the social security systemalways claims against the insurance company. In actual fact, the cost responsibility isshifted from general health insurance to the insurance system (the social security systemshould no longer be allowed to subsidise traffic).
3.5.5 In Maritime and Air-transport, where the main victims are users of each mode, thesystem externality (I)dominates and consequently a cost responsibility for all materialcosts will go a long way towards internalisation.
3.5.6 However, in rail transport as well as for HGV thetraffic category externality(III) isthe main cost component. Therefore, an accident charge or additional policy measurehas to be taken to internalise railway and HGV accident cost. However, as discussedin the previous section, we face a problem of negligence by the injured party, whichcomplicates the policy recommendation.
3.5.7 If the social security system always claim against the insurance company and if thepremium is variable (see below) the insurance system internalises the majority of theexternal accident costs in many cases. The notable exceptions are urban road transport,heavy (goods) vehicles and rail transport. We suggest therefore that additional policymeasures should be studied in these cases.
34
BOX 3 - A new Road Traffic (NHS Charges) Bill in UK
The NHS currently has the power, under theRoad Traffic Act 1988, to recoup the costs of treating thecasualties of road traffic accidents. Hospitals may levy an "emergency treatment fee" directly on the patients, andNHS trusts may then levy rather larger fees in respect of out-patient and in-patient treatment on the insurancecompany which has made a compensation payment in respect of the accident. However, the system is seen asbureaucratic and much of the possible revenue which could be recovered from insurance companies is leftunclaimed.
The newRoad Traffic (NHS Charges) Bill(Bill 3 1998-99) transfer the responsibility of ensuring paymentsin respect of road traffic accidents to the insurers, and create an administrative system under which thesepayments will be handled.
The main thrust of the Bill provide that where a person is injured or killed as a result of a traffic accidentinvolving a motor vehicle, and a compensation payment is made (e.g. by an insurance company) in respect ofthat injury, then the person making the compensation payment is liable to pay the Secretary of State the"appropriate charges" to cover their NHS treatment. The "compensation payment" is defined as covering bothpayments made by authorised motor insurers and payments made by the Motor Insurers' Bureau where driversare uninsured or untraceable.
The Government's aim is to set a simple tariff, with a set fee for patients treated in accident and emergencydepartments, and a daily rate for those admitted for in-patient treatment. These rates will be set at such a levelthat they should deliver, overall, the actual cost to the NHS of the treatment of road accident casualties. Toreflect these costs, there would be a new flat-rate fee of #354 for patients treated in accident and emergencydepartments or outpatient clinics, and a daily rate of #435 for patients admitted to hospital as in-patients (figuresfrom press-release).
The Bills suggests a new administrative mechanism, whereby insurance companies who are making apayment in connection with a road traffic accident will be obliged to apply to the Secretary of State for a"certificate of NHS charges". The charge on the certificate must then be paid within 14 days of the date on whichthe compensation payment to the injured party has been made. This will thus transfer the responsibility ofinitiating the payment from NHS trusts to the insurance industry, and will centralise the NHS administration inone place.
There appears to be some disagreement as to the actual effect which the Bill will have on premiums. Whilethe Department of Health is estimating £6-£9 and the AA £10, the Association of British Insurers were quoted inthe British Medical Journalas saying that "most companies already take their liability under the existing lawinto account when assessing premiums". Other estimates suggest that premiums might increase by as much as£20.
Source: House of Commons, Research Paper 98/108.
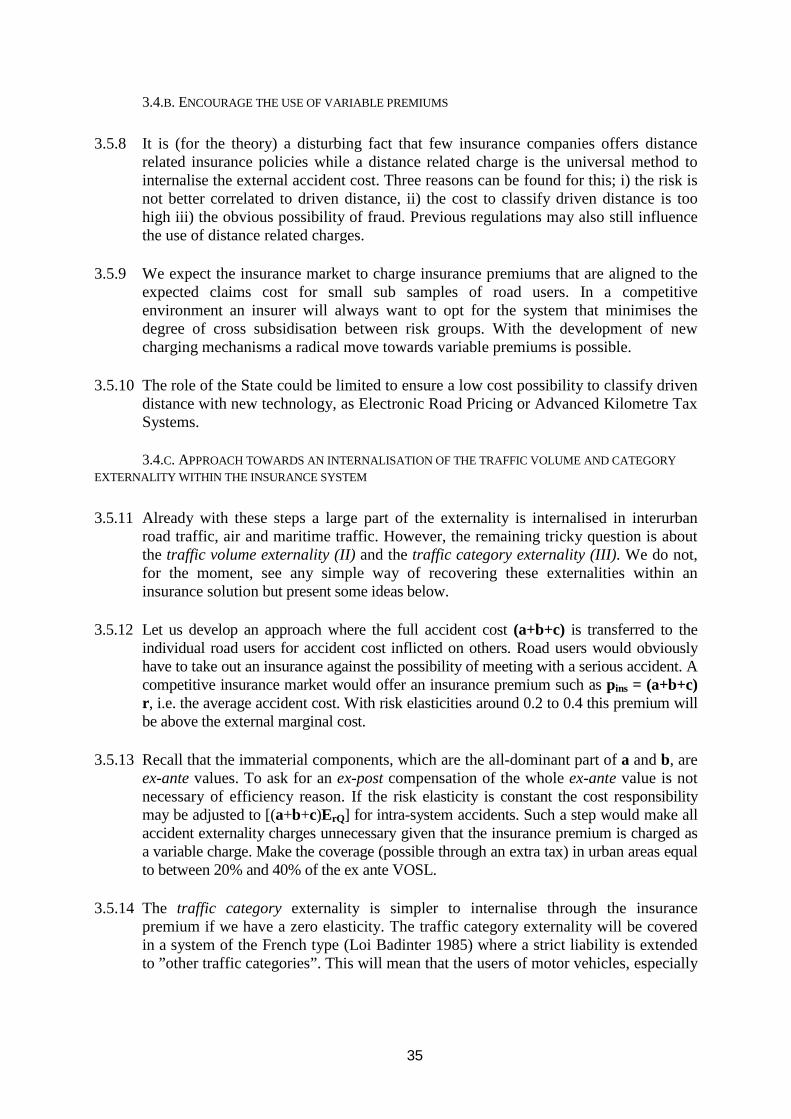
35
3.4.B. ENCOURAGE THE USE OF VARIABLE PREMIUMS
3.5.8 It is (for the theory) a disturbing fact that few insurance companies offers distancerelated insurance policies while a distance related charge is the universal method tointernalise the external accident cost. Three reasons can be found for this; i) the risk isnot better correlated to driven distance, ii) the cost to classify driven distance is toohigh iii) the obvious possibility of fraud. Previous regulations may also still influencethe use of distance related charges.
3.5.9 We expect the insurance market to charge insurance premiums that are aligned to theexpected claims cost for small sub samples of road users. In a competitiveenvironment an insurer will always want to opt for the system that minimises thedegree of cross subsidisation between risk groups. With the development of newcharging mechanisms a radical move towards variable premiums is possible.
3.5.10 The role of the State could be limited to ensure a low cost possibility to classify drivendistance with new technology, as Electronic Road Pricing or Advanced Kilometre TaxSystems.
3.4.C. APPROACH TOWARDS AN INTERNALISATION OF THE TRAFFIC VOLUME AND CATEGORY
EXTERNALITY WITHIN THE INSURANCE SYSTEM
3.5.11 Already with these steps a large part of the externality is internalised in interurbanroad traffic, air and maritime traffic. However, the remaining tricky question is aboutthe traffic volume externality (II)and thetraffic category externality (III). We do not,for the moment, see any simple way of recovering these externalities within aninsurance solution but present some ideas below.
3.5.12 Let us develop an approach where the full accident cost(a+b+c) is transferred to theindividual road users for accident cost inflicted on others. Road users would obviouslyhave to take out an insurance against the possibility of meeting with a serious accident. Acompetitive insurance market would offer an insurance premium such aspins = (a+b+c)r , i.e. the average accident cost. With risk elasticities around 0.2 to 0.4 this premium willbe above the external marginal cost.
3.5.13 Recall that the immaterial components, which are the all-dominant part ofa andb, areex-antevalues. To ask for anex-postcompensation of the wholeex-antevalue is notnecessary of efficiency reason. If the risk elasticity is constant the cost responsibilitymay be adjusted to [(a+b+c)ErQ] for intra-system accidents. Such a step would make allaccident externality charges unnecessary given that the insurance premium is charged asa variable charge. Make the coverage (possible through an extra tax) in urban areas equalto between 20% and 40% of the ex ante VOSL.
3.5.14 The traffic category externality is simpler to internalise through the insurancepremium if we have a zero elasticity. The traffic category externality will be coveredin a system of the French type (Loi Badinter 1985) where a strict liability is extendedto ”other traffic categories”. This will mean that the users of motor vehicles, especially
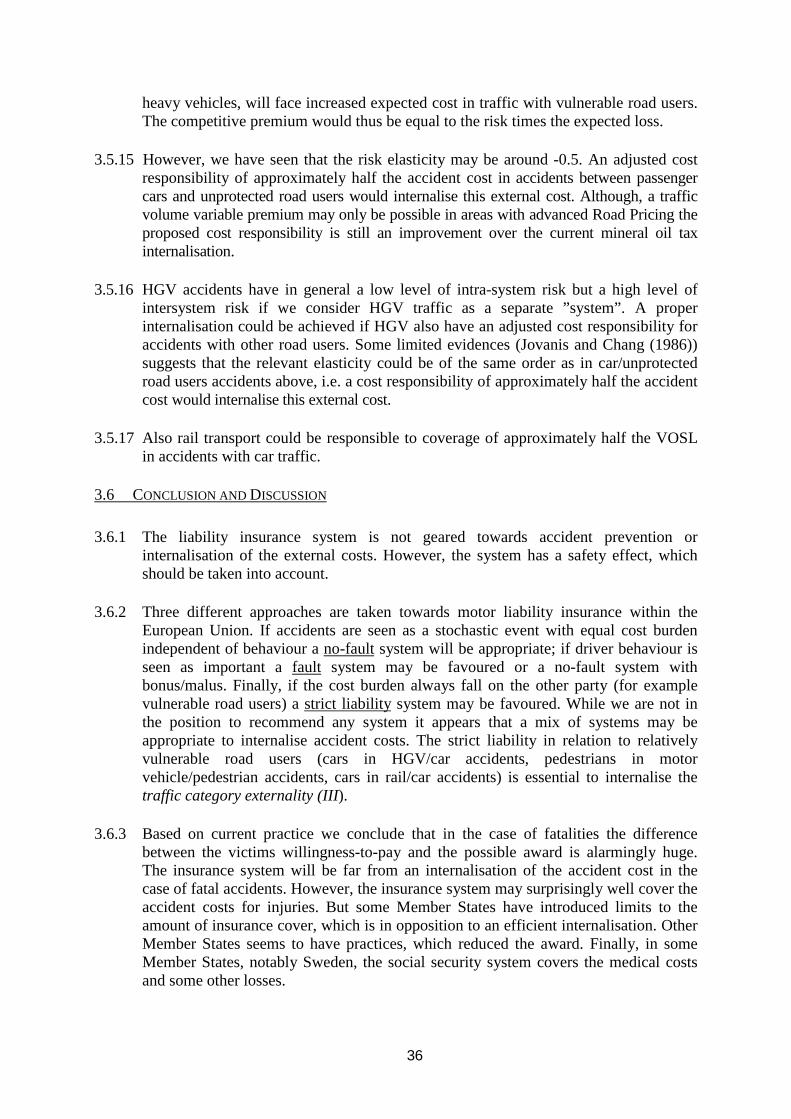
36
heavy vehicles, will face increased expected cost in traffic with vulnerable road users.The competitive premium would thus be equal to the risk times the expected loss.
3.5.15 However, we have seen that the risk elasticity may be around -0.5. An adjusted costresponsibility of approximately half the accident cost inaccidents between passengercars and unprotected road users would internalise this external cost. Although, a trafficvolume variable premium may only be possible in areas with advanced Road Pricing theproposed cost responsibility is still an improvement over the current mineral oil taxinternalisation.
3.5.16 HGV accidents have in general a low level of intra-system risk but a high level ofintersystem risk if we consider HGV traffic as a separate ”system”. A properinternalisation could be achieved if HGV also have an adjusted cost responsibility foraccidents with other road users. Some limited evidences (Jovanis and Chang (1986))suggests that the relevant elasticity could be of the same order as in car/unprotectedroad users accidents above, i.e. a cost responsibility of approximately half the accidentcost would internalise this external cost.
3.5.17 Also rail transport could be responsible to coverage of approximately half the VOSLin accidents with car traffic.
3.6 CONCLUSION ANDDISCUSSION
3.6.1 The liability insurance system is not geared towards accident prevention orinternalisation of the external costs. However, the system has a safety effect, whichshould be taken into account.
3.6.2 Three different approaches are taken towards motor liability insurance within theEuropean Union. If accidents are seen as a stochastic event with equal cost burdenindependent of behaviour a no-fault system will be appropriate; if driver behaviour isseen as important a fault system may be favoured or a no-fault system withbonus/malus. Finally, if the cost burden always fall on the other party (for examplevulnerable road users) a strict liability system may be favoured. While we are not inthe position to recommend any system it appears that a mix of systems may beappropriate to internalise accident costs. The strict liability in relation to relativelyvulnerable road users (cars in HGV/car accidents, pedestrians in motorvehicle/pedestrian accidents, cars in rail/car accidents) is essential to internalise thetraffic category externality (III).
3.6.3 Based on current practice we conclude that in the case of fatalities the differencebetween the victims willingness-to-pay and the possible award is alarmingly huge.The insurance system will be far from an internalisation of the accident cost in thecase of fatal accidents. However, the insurance system may surprisingly well cover theaccident costs for injuries. But some Member States have introduced limits to theamount of insurance cover, which is in opposition to an efficient internalisation. OtherMember States seems to have practices, which reduced the award. Finally, in someMember States, notably Sweden, the social security system covers the medical costsand some other losses.
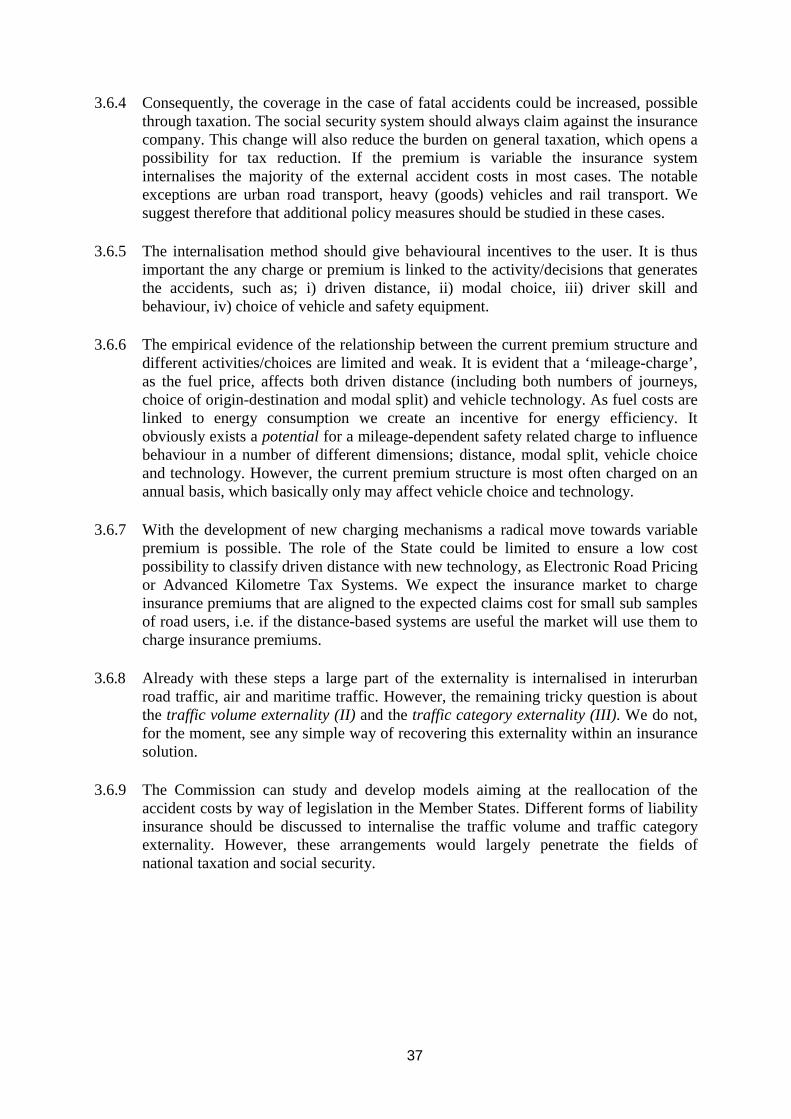
37
3.6.4 Consequently, the coverage in the case of fatal accidents could be increased, possiblethrough taxation. The social security system should always claim against the insurancecompany. This change will also reduce the burden on general taxation, which opens apossibility for tax reduction. If the premium is variable the insurance systeminternalises the majority of the external accident costs in most cases. The notableexceptions are urban road transport, heavy (goods) vehicles and rail transport. Wesuggest therefore that additional policy measures should be studied in these cases.
3.6.5 The internalisation method should give behavioural incentives to the user. It is thusimportant the any charge or premium is linked to the activity/decisions that generatesthe accidents, such as; i) driven distance, ii) modal choice, iii) driver skill andbehaviour, iv) choice of vehicle and safety equipment.
3.6.6 The empirical evidence of the relationship between the current premium structure anddifferent activities/choices are limited and weak. It is evident that a ‘mileage-charge’,as the fuel price, affects both driven distance (including both numbers of journeys,choice of origin-destination and modal split) and vehicle technology. As fuel costs arelinked to energy consumption we create an incentive for energy efficiency. Itobviously exists apotentialfor a mileage-dependent safety related charge to influencebehaviour in a number of different dimensions; distance, modal split, vehicle choiceand technology. However, the current premium structure is most often charged on anannual basis, which basically only may affect vehicle choice and technology.
3.6.7 With the development of new charging mechanisms a radical move towards variablepremium is possible. The role of the State could be limited to ensure a low costpossibility to classify driven distance with new technology, as Electronic Road Pricingor Advanced Kilometre Tax Systems. We expect the insurance market to chargeinsurance premiums that are aligned to the expected claims cost for small sub samplesof road users, i.e. if the distance-based systems are useful the market will use them tocharge insurance premiums.
3.6.8 Already with these steps a large part of the externality is internalised in interurbanroad traffic, air and maritime traffic. However, the remaining tricky question is aboutthe traffic volume externality (II)and thetraffic category externality (III). We do not,for the moment, see any simple way of recovering this externality within an insurancesolution.
3.6.9 The Commission can study and develop models aiming at the reallocation of theaccident costs by way of legislation in the Member States. Different forms of liabilityinsurance should be discussed to internalise the traffic volume and traffic categoryexternality. However, these arrangements would largely penetrate the fields ofnational taxation and social security.
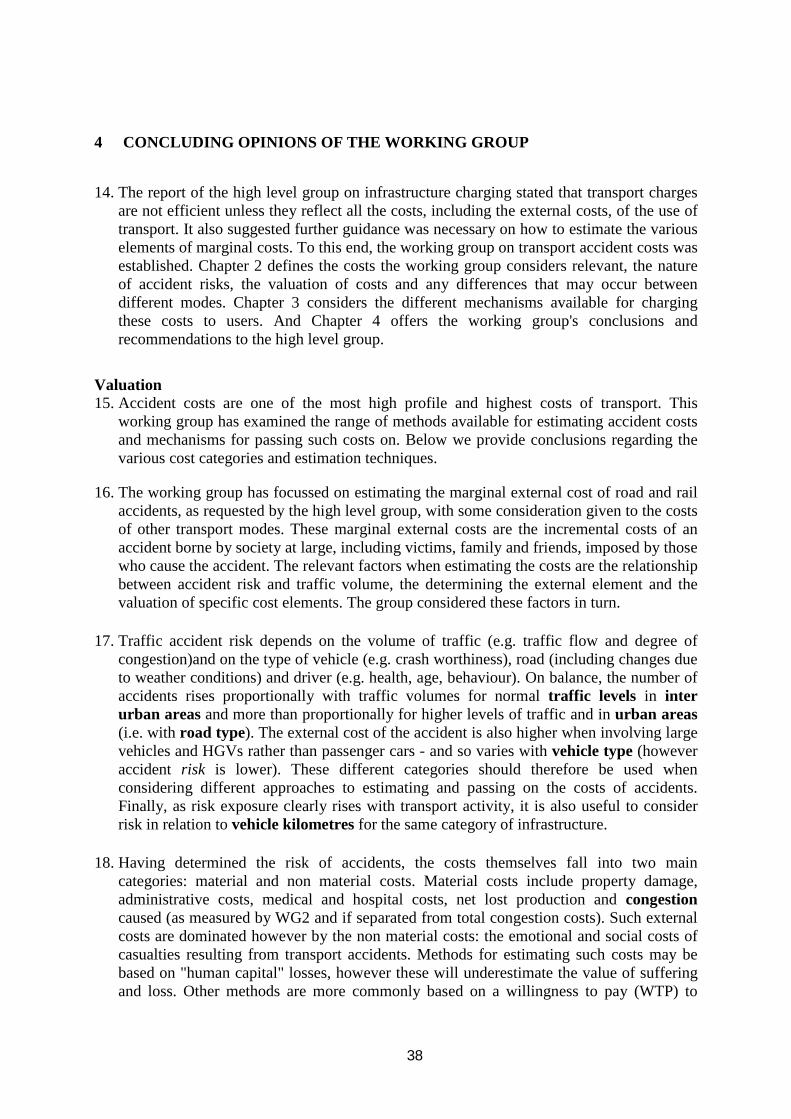
38
4 CONCLUDING OPINIONS OF THE WORKING GROUP
14. The report of the high level group on infrastructure charging stated that transport chargesare not efficient unless they reflect all the costs, including the external costs, of the use oftransport. It also suggested further guidance was necessary on how to estimate the variouselements of marginal costs. To this end, the working group on transport accident costs wasestablished. Chapter 2 defines the costs the working group considers relevant, the natureof accident risks, the valuation of costs and any differences that may occur betweendifferent modes. Chapter 3 considers the different mechanisms available for chargingthese costs to users. And Chapter 4 offers the working group's conclusions andrecommendations to the high level group.
Valuation15. Accident costs are one of the most high profile and highest costs of transport. This
working group has examined the range of methods available for estimating accident costsand mechanisms for passing such costs on. Below we provide conclusions regarding thevarious cost categories and estimation techniques.
16. The working group has focussed on estimating the marginal external cost of road and railaccidents, as requested by the high level group, with some consideration given to the costsof other transport modes. These marginal external costs are the incremental costs of anaccident borne by society at large, including victims, family and friends, imposed by thosewho cause the accident. The relevant factors when estimating the costs are the relationshipbetween accident risk and traffic volume, the determining the external element and thevaluation of specific cost elements. The group considered these factors in turn.
17. Traffic accident risk depends on the volume of traffic (e.g. traffic flow and degree ofcongestion)and on the type of vehicle (e.g. crash worthiness), road (including changes dueto weather conditions) and driver (e.g. health, age, behaviour). On balance, the number ofaccidents rises proportionally with traffic volumes for normaltraffic levels in interurban areasand more than proportionally for higher levels of traffic and inurban areas(i.e. with road type). The external cost of the accident is also higher when involving largevehicles and HGVs rather than passenger cars - and so varies withvehicle type(howeveraccident risk is lower). These different categories should therefore be used whenconsidering different approaches to estimating and passing on the costs of accidents.Finally, as risk exposure clearly rises with transport activity, it is also useful to considerrisk in relation tovehicle kilometresfor the same category of infrastructure.
18. Having determined the risk of accidents, the costs themselves fall into two maincategories: material and non material costs. Material costs include property damage,administrative costs, medical and hospital costs, net lost production andcongestioncaused (as measured by WG2 and if separated from total congestion costs). Such externalcosts are dominated however by the non material costs: the emotional and social costs ofcasualties resulting from transport accidents. Methods for estimating such costs may bebased on "human capital" losses, however these will underestimate the value of sufferingand loss. Other methods are more commonly based on a willingness to pay (WTP) to
39
reduce the risk of such accidents. (WTP is also discussed, consistently, in WG2). Thismethod is not perfect, and may not always accurately take account of the capacity to pay(e.g. the values reported in WTP studies may be overestimates if not constrained byrespondents' income). However they provide a useable result in terms of estimates of thevalue of reduced health, for injuries, and a "value of statistical life" for risks of mortalaccidents. Such cost estimates follow an "ex ante" approach. For this reason, the workinggroup favours this WTP approach to estimating the non material costs of accidents, whereWTP estimates vary with scale, context, mode of transport and between Member States.
19. While the WTP component is the dominant factor in the value of statistical life (andinjuries) it should be remembered that the users' own WTP component is alreadyinternalised. Under certain conditions (to some degree fulfilled in interurban car trafficwith constant risk and homogenous road users), the external marginal cost boils down toonly the material cost. This condition is not fulfilled in urban areas, for heavy vehicles orfor rail traffic. For these the external marginal cost will include an element of the WTPresulting in a significantly higher level of external marginal costs.
20.The values calculated by this process may well differ with context, but the methodremains generally applicable, across modes and across Member States. Efficient pricing -internalisation - requires that all these marginal external costs are passed on to the usersconcerned, using the most effective mechanism.
Mechanisms21. Having determined the cost estimates with a method generally applicable to all modes of
transport, several choices exist in terms of passing such costs on to those who bear them.General taxation, existing transport specific taxes, fines, transport user charges, theinsurance system - all are possible tools. These are all pricing tools and the focus of thisexercise. They should not replace existing safety standards or information programmessuch as road safety campaigns, but reinforce the same safety goals.
22. A strategy to internalise the external accident costs should aim to internalise costs ex ante.While ex post coverage is possible, this requires that users anticipate the expectedaccident cost in their decision and signals are weak. The ex ante approach is thereforepreferred.
23. Current approaches are implicitly based on general taxation or specific transport taxessuch as fuel and vehicle taxes. However these are poor proxies as they are not based onthe costs of accidents and provide no signals to users to alter their behaviour with regardto accidents (two requirements of an efficient economic policy tool). If such tools are usedat all, they should take into account transport safety features (for instance reducing vehicletaxes when safety features are added). The greater use and variability of traffic fines,based more closely on incremental accident risks could also be a means of improving theincentives to take more care travelling.
24. The use of insurance premiums has also been considered. In a deregulated insuranceindustry, premiums vary considerably to reflect quite fine degrees of accident risk andcost. Insurance by its nature insulates the transport user against the risk of facing the costof an accident and may change risk-avoiding behaviour (the "moral hazard"). However,greater variability of insurance premiums and refined bonus/malus systemsdo send a

40
signal to transport users; can clearly be set to reflect the costs involved (including bothmaterial and non material costs); and unlike fines, are directly attributable to meeting thecosts of the accident in practice. Premiums based solely on such costs would not beexcessively high (and so would avoid the risk of increasing the number of uninsureddrivers) but would not necessarily cover average costs. The working group thereforebelieves that a sophisticated insurance structure based on detailed risk information andreflecting the different variable components of the costs of accidents is the mostsatisfactory available means of internalising the external costs of transport accidents.Particularly in the case of medical costs, the use of insurance switches expenditure fromgeneral taxation to users, in the manner expected in a user pays system. If the insurancesystem is unable to reflect these different costs continued use of the tax system may benecessary. In urban areas the importance of a mix of policy instruments are highlighted.
25. The magnitude of external costs and the effectiveness of different mechanisms depends toa great extent on the legal basis for action. For instance the allocation of health costsdepends on the type of public health system and responsibility for accidents depends onthe legal liability regime. When considering the allocation of costs, the working group isof the opinion that the nature offault should be considered and reflected in themechanism for passing on the cost of accidents.In the context of transport insurance,the liability regime defines the allocation of fault or responsibility ("strict liability"/ "nofault" etc. of the "victim", "causer" or infrastructure manager) and a mix, according tomode, may well be most appropriate. The working group is of the opinion that the choiceof liability regime reflects equity considerations rather than efficiency (except where thelegal costs of a fault based liability regime raise transaction costs excessively).
26. The development of all these cost estimates and mechanisms requires a range of data,detailed in the report and in the Commission publication "COST 313: Socio-economiccost of road accidents". Specific instances where data are needed include access to driverrecords (if insurance premiums are to distinguish between risk categories) theinvestigation of driver/pedestrian behaviour and regularly updated statistics on materialcosts of accidents and (WTP) estimates of non material costs.
41
5 SELECTED REFERENCES
Abraham, K.S. (1986) ‘Distributing Risk’, Yale University Press
Backman, M.; Haapanen, H.; Mikkonen, V. (1981) ‘De försäkringsmässiga betinglserna i trafiskäkerhetsarbetet’University of Helsinki, Technical Reports, A 6.
Backman, M.; Mikkonen, V. (1984) ‘Försäkringsmässiga betinglser, risktagning och säkerhet i trafiken’University of Helsinki, Technical Reports, A 20.
Blomquist, G. (1988) ‘The Value of Human Life: An Empirical Perspective, Economic Inquiry, 19, January.
Bower, G.H. (1991) ‘Incentive programmes for promoting safer driving’, International road safety symposium,September 19 – 21, 1990, Copenhagen, Denmark.
Boyer M.; Dionne, G. (1987) ‘The economics of road safety’, Transportation Research, Vol 21B, No5, pp 413 –431.
Brüde, U. Larsson, J. (1993) Models for prediciting accidents at junctions where pedestrians and cyclists areinvolved. How well do they fit? Accident Analysis and Prevention. 25; 499-509. 1993.
Cedar, A; Livneh, M. (1982) Relationships between road accidents and hourly traffic flow. Accident Analysisand Prevention, Vol 14, No 1, 1982, pp. 19 - 34.
Ceder (1982)
Dickson
Ekman, L. (1996) ‘On the treatment of Flow in Traffic Safety Analysis’ Bulletin 136, University of Lund, Lund.
Elvik (1993) ‘Ökonomisk verdesetting av velferdstap ved trafikolykker’ TÖI rappport 203/1993, Oslo.
Elvik, R. (1994) The external costs of traffic injury: definition, estimation, and possibilities for internalization.Accident Analysis and Prevention. 26; 719-732. 1994
Elvik, R. (1995) ”Can insurance schemes internalize the cost of road trafic accidents?” OECD Workshop onAutomobile Insurance and Traffic Safety, 10 - 12 May 1995, Talinn, Estonia.
Englund, A. (1995) ‘Bonus/Malus or not?’ OECD Workshop on Automobile Insurance and Traffic Safety, 10 -12 May 1995, Tallinn, Estonia.
Englund, A.;Petterson, H.E. (1997) ‘Försäkring och trafiksäkerhet’, VTI-rapport 415.
Eriksson R. (1986) ‘Information om motorfordonsförsäkringen – en studie av effekterna på värnpliktigatrafikanter. Pedagoisk forskning i Uppsala 72, Uppsala University.
ETSC (1997) ‘ Transport accident costs and the value of safety’ European Transport Safety Council, Brussels.
European Commission (1994) Common Market Expert Group, The Economic Cost of Traffic Accidents, COST313.
European Commission (1995) ”Towards Fair and Efficient Pricing in Transport”
Fridström, Ifver, Ingebrigtsen, Kumala, Thomsen. (1993) Explaining the variation in road accident counts.NORD 1993:35. Oslo, 1993
Fridström, L. Ingebrigtsen, S. (1991) An aggregate accident model based on pooled, regional time-series data.Accident Analysis and Prevention. 23; 363 - 378. 1991
Fröyland (1983) ‘Forsikring som virkemiddel i trafiksikkerhetsarbeidet’ TOI, Notat 27.5. Oslo.
Goodwin (1992)
Gwynn, D.W. (1967) Relationship of accident rates and accident involvements with hourly volume. TrafficQuartely, Vol 21, No 3, July 1967, pp. 407 - 418.
Harrington, S.E. Doerpinghaous, H.I. (1993) ‘The economics and politics of automobile insurance rateclassification’ The Journal of Risk and Uncertainty, Vol 60, No 1, pp 59-84.
42
Hurst, P.M. (1980) ‘Can enyone reward safe driving’ Accident Analysis and Prevention, Vol 12, 1980, pp 217 –220.
Huttula, J; Pirtala, P; Ernvall, T (1997), Car safety, aggressivity and accident involvement rates by car model1997, University of Oulu, finland 1997.
Janson, J.O. Lindberg, G. (1997) ”PETS - Pricing European Transport Systems - Pricing Principles” EuropeanCommission 1997.
Janson, J.O. Lindberg, G. (1998) ”Accident externality charges - with emphasis on urban transport problems” in1st Asia Pacific Conference on Transportation and Environment 13 - 15 May 1998, Proceedings Volume1, p 401 - 410.
Jansson, J. O. (1994), Accident Externality Charges, Journal of Transport economics and Policy, Vol 28. No 1,pp 31 - 43.
Johansson, O. (1996), Welfare, externalities, and taxation; theory and some road transport applications.Gothenburg University.
Johansson, P-O. (1995), Evaluating health risks. An economic approach. Cambridge University Press,Cambridge.
Jones-Lee, M.W. (1982) The value of life and safety’ North Holland Publishing Company, 1982.
Jones-Lee, M.W. (1989) The economics of Safety and Physical Risk. Oxford, Basil Blackwell.
Jones-Lee, M.W. (1990), The value of Transport Safety, Oxford Review of Economic Policy, Vol 6, No 2, pp 39-58.
Joshua and Garber (1990), Estimating ruck Accident Rates and Involvement using linear poission regressionmodels. Transportation Planning and technology, 1990, Vol, 15. Pp 41 - 58.
Jovanis,P.P. ; Chang, H.L. (1986) Modelling the relationship of accidents to miles travelled. TRR 1068:42-58;1986.
Kidholm, K. (1995) ‘Assessing the value of traffic safety using contingent valuation technique: The Danishsurvey
Langwieder, K. (1995) ‘The influence of insurers’ accident research on driver behaviour and car safety’Incentives’ OECD Workshop on Automobile Insurance and Traffic Safety, 10 - 12 May 1995, Tallinn,Estonia.
Maddison, D. et.al. (1996) The true costs of transport - Blueprint 5. Earthscan, London .
Maycock, G.; Hall,R.D. (1984) Accidents at 4-arm roundabouts. TRRL report 1120. 1984.
Mishan, E.J. (1971), Evaluation of life and limb: a theoretical approach. Journal of Political Economy, vol. 79,pp.687 - 705.
Needleman (1976), L. Valuing other people’s lives. Manchester School, vol. 44, pp 309 -342.
Negrin, D. (1995) ‘Bonus/Malus or not? OECD Workshop on Automobile Insurance and Traffic Safety, 10 - 12May 1995, Tallinn, Estonia.
Newbery, D.M. (1988) Road User Charges in Britain, Economic Journal, vol 98, pp 161 - 76.
Newbery, D.M. (1995) Reforming Road taxation, Automobile Association.
Nilsson, G. (1996). Trafiksäkerhetssituationens variation i tiden, VTI Rapport 15.
OECD (1990) ‘ Automobile insurance and road accident prevention’, Paris.
OECD-IRTAD (1994) ‘Under-reporting of road traffic accidents recorded by the police, at the internationallevel. Spec.Report: H.Hvoslef, Oslo.
Oum (1992)
Pauly, M.V. (1974). Overinsurance and the public provision of insurance: The roles of moral hazard and adverseselection” Quaterly Journal of Economics, Vol. 88 p 44-62.
Peirson, J. Skinner, I. and Vickerman, R. (1994) The microeconomic analysis of the external costs of roadaccidents. Discussion Paper 94/6, CERTE, May 1994
43
Peltzman, S. (1975), The effects of autmobile safety regulations, Journal of Political Economy, vol. 83(4), page677 - 725.
Persson, U. Ödegaard (1995), K. External cost estimates of road traffic accidents. Journal of TransportEconomics and Policy. September 1995.
Persson, U.(1992) ”Three economic approaches to valuing benefits of traffic safety measures”, Lund University.
Persson-Cedervall (1991) ‘The value of riskreduction: Results from a Swedish sample survey’ IHE WorkingPaper 1991:4. Lund.
Petterson, H.E (1982) ‘Fordonsföärsäkringens inverkan på trafikantbeteendet, VTI Meddelande 258, Linköping.
Satterthwaite,S.P. (1981), A survey of research into relationship between traffic accidents and traffic volumes.TRRL Supplement Reprot 692, London.
Schwab Christe,G.N.; Soguel,C.N. (1995) Contingent valuation, transport safety and the value of life. KluwerAcademic Publishers.
Shavell (1987)
Strömbäck, E, red (1992) ”Trafikskadelagen och andra ersättningssystem vid trafikolyckor” 4:e upplagan, C EFritzes AB, Stockholm
Swedish National Road Administration (1989), EVA manual
UK Department of Transport (1994) ‘ COBA’
Vaaje, T. (1995) ‘ Driver behaviour and Insurance Incentives’ OECD Workshop on Automobile Insurance andTraffic Safety, 10 - 12 May 1995, Tallinn, Estonia.
Vickrey, W (1968), Automobile accidents, tort law, externalities, and insurance. Law and ContemporaryProblems, Summer.
Winslott, L. (1998) ‘The external Costs of Traffic Accidents – an empirical analysis of the traffic flow.University of Lund. Lund.
Viscusi, W (1993). Fatal Tradeoffs. Public & Private Responsibility for Risk., Oxford University Press,NewYork.
Vitaliano, D.F. and J. Held (1191), Road accident external effects an empirical assessment.Applied Economics,vol. 23, pp 373-378
Zlatoper, T.J. (1984) Regression analysis of time series data on motor vehicle deaths in the United States.Journal of Transport Economics and Policy 18. pp 263 - 274. 1984.
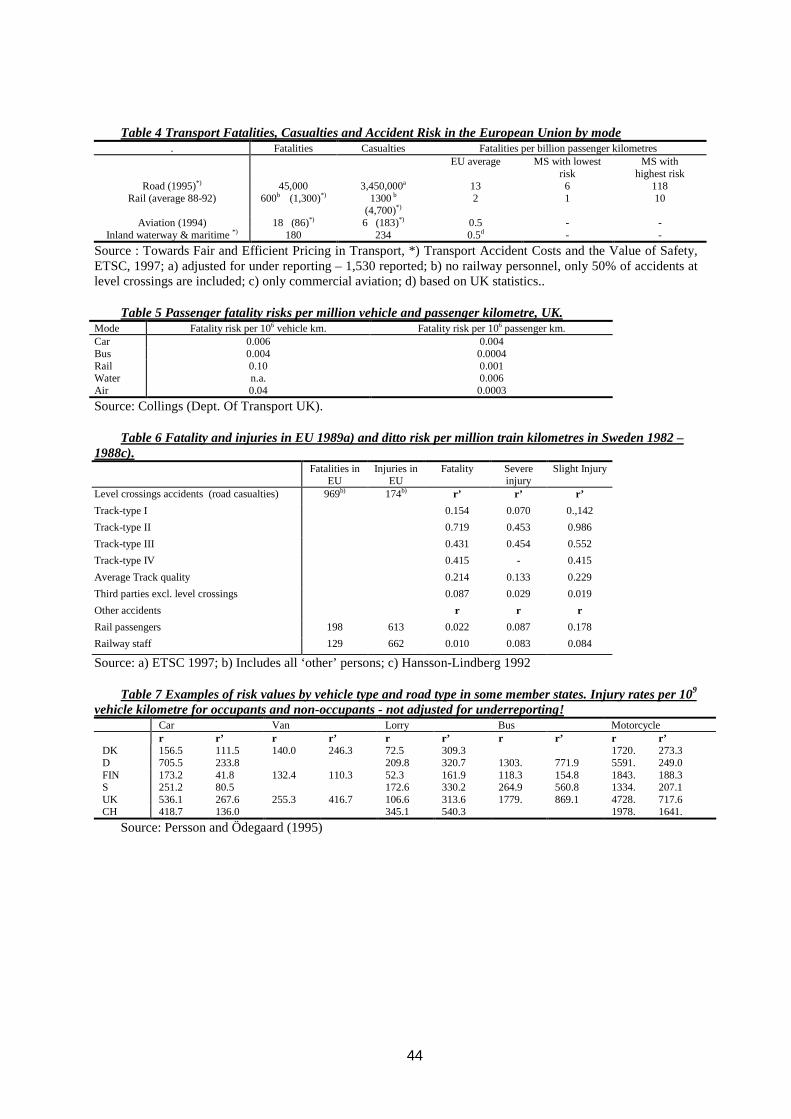
44
Table 4 Transport Fatalities, Casualties and Accident Risk in the European Union by mode. Fatalities Casualties Fatalities per billion passenger kilometres
EU average MS with lowestrisk
MS withhighest risk
Road (1995)*) 45,000 3,450,000a 13 6 118Rail (average 88-92) 600b (1,300)*) 1300b
(4,700)*)2 1 10
Aviation (1994) 18 (86)*) 6 (183)*) 0.5 - -Inland waterway & maritime*) 180 234 0.5d - -
Source : Towards Fair and Efficient Pricing in Transport, *) Transport Accident Costs and the Value of Safety,ETSC, 1997; a) adjusted for under reporting – 1,530 reported; b) no railway personnel, only 50% of accidents atlevel crossings are included; c) only commercial aviation; d) based on UK statistics..
Table 5 Passenger fatality risks per million vehicle and passenger kilometre, UK.Mode Fatality risk per 106 vehicle km. Fatality risk per 106 passenger km.Car 0.006 0.004Bus 0.004 0.0004Rail 0.10 0.001Water n.a. 0.006Air 0.04 0.0003
Source: Collings (Dept. Of Transport UK).
Table 6 Fatality and injuries in EU 1989a) and ditto risk per million train kilometres in Sweden 1982 –1988c).
Fatalities inEU
Injuries inEU
Fatality Severeinjury
Slight Injury
Level crossings accidents (road casualties) 969b) 174b) r’ r’ r’
Track-type I 0.154 0.070 0.,142
Track-type II 0.719 0.453 0.986
Track-type III 0.431 0.454 0.552
Track-type IV 0.415 - 0.415
Average Track quality 0.214 0.133 0.229
Third parties excl. level crossings 0.087 0.029 0.019
Other accidents r r r
Rail passengers 198 613 0.022 0.087 0.178
Railway staff 129 662 0.010 0.083 0.084
Source: a) ETSC 1997; b) Includes all ‘other’ persons; c) Hansson-Lindberg 1992
Table 7 Examples of risk values by vehicle type and road type in some member states. Injury rates per 109
vehicle kilometre for occupants and non-occupants - not adjusted for underreporting!Car Van Lorry Bus Motorcycler r’ r r’ r r’ r r’ r r’
DK 156.5 111.5 140.0 246.3 72.5 309.3 1720. 273.3D 705.5 233.8 209.8 320.7 1303. 771.9 5591. 249.0FIN 173.2 41.8 132.4 110.3 52.3 161.9 118.3 154.8 1843. 188.3S 251.2 80.5 172.6 330.2 264.9 560.8 1334. 207.1UK 536.1 267.6 255.3 416.7 106.6 313.6 1779. 869.1 4728. 717.6CH 418.7 136.0 345.1 540.3 1978. 1641.
Source: Persson and Ödegaard (1995)
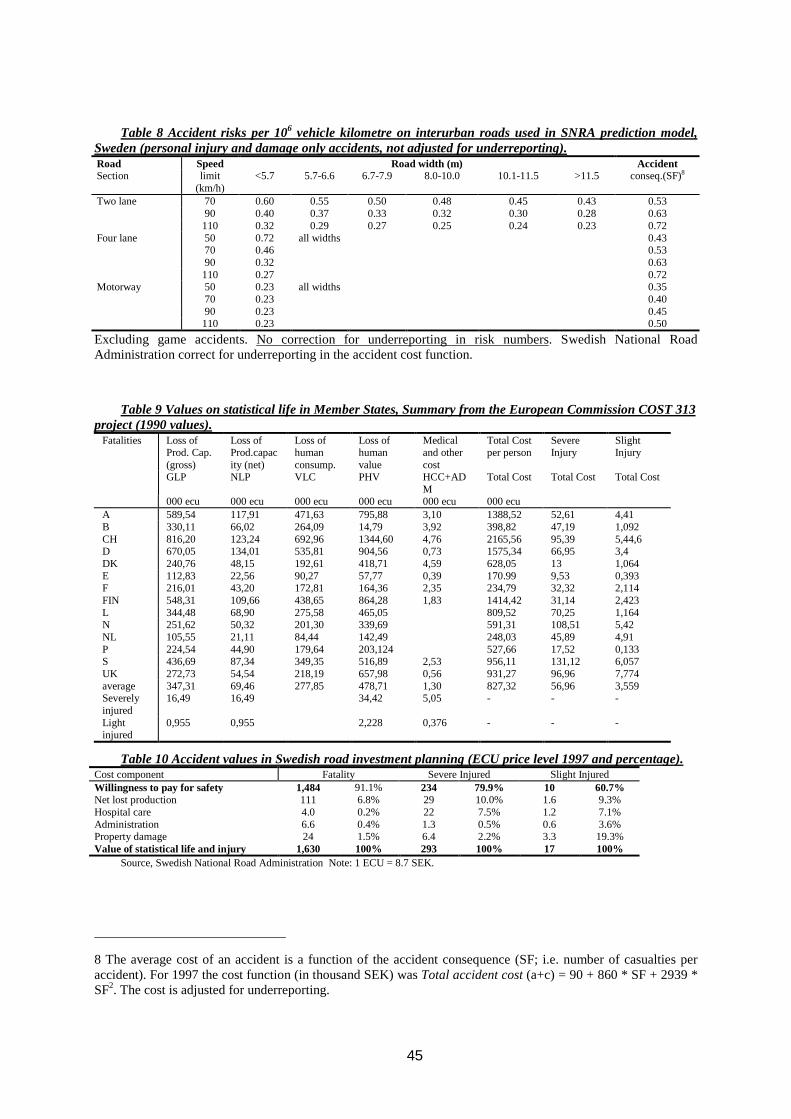
45
Table 8 Accident risks per 106 vehicle kilometre on interurban roads used in SNRA prediction model,Sweden (personal injury and damage only accidents, not adjusted for underreporting).Road Speed Road width (m) AccidentSection limit
(km/h)<5.7 5.7-6.6 6.7-7.9 8.0-10.0 10.1-11.5 >11.5 conseq.(SF)8
Two lane 70 0.60 0.55 0.50 0.48 0.45 0.43 0.5390 0.40 0.37 0.33 0.32 0.30 0.28 0.63110 0.32 0.29 0.27 0.25 0.24 0.23 0.72
Four lane 50 0.72 all widths 0.4370 0.46 0.5390 0.32 0.63110 0.27 0.72
Motorway 50 0.23 all widths 0.3570 0.23 0.4090 0.23 0.45110 0.23 0.50
Excluding game accidents. No correction for underreporting in risk numbers. Swedish National RoadAdministration correct for underreporting in the accident cost function.
Table 9 Values on statistical life in Member States, Summary from the European Commission COST 313project (1990 values).
Fatalities Loss ofProd. Cap.(gross)
Loss ofProd.capacity (net)
Loss ofhumanconsump.
Loss ofhumanvalue
Medicaland othercost
Total Costper person
SevereInjury
SlightInjury
GLP NLP VLC PHV HCC+ADM
Total Cost Total Cost Total Cost
000 ecu 000 ecu 000 ecu 000 ecu 000 ecu 000 ecuA 589,54 117,91 471,63 795,88 3,10 1388,52 52,61 4,41B 330,11 66,02 264,09 14,79 3,92 398,82 47,19 1,092CH 816,20 123,24 692,96 1344,60 4,76 2165,56 95,39 5,44,6D 670,05 134,01 535,81 904,56 0,73 1575,34 66,95 3,4DK 240,76 48,15 192,61 418,71 4,59 628,05 13 1,064E 112,83 22,56 90,27 57,77 0,39 170.99 9,53 0,393F 216,01 43,20 172,81 164,36 2,35 234,79 32,32 2,114FIN 548,31 109,66 438,65 864,28 1,83 1414,42 31,14 2,423L 344,48 68,90 275,58 465,05 809,52 70,25 1,164N 251,62 50,32 201,30 339,69 591,31 108,51 5,42NL 105,55 21,11 84,44 142,49 248,03 45,89 4,91P 224,54 44,90 179,64 203,124 527,66 17,52 0,133S 436,69 87,34 349,35 516,89 2,53 956,11 131,12 6,057UK 272,73 54,54 218,19 657,98 0,56 931,27 96,96 7,774average 347,31 69,46 277,85 478,71 1,30 827,32 56,96 3,559Severelyinjured
16,49 16,49 34,42 5,05 - - -
Lightinjured
0,955 0,955 2,228 0,376 - - -
Table 10 Accident values in Swedish road investment planning (ECU price level 1997 and percentage).Cost component Fatality Severe Injured Slight InjuredWillingness to pay for safety 1,484 91.1% 234 79.9% 10 60.7%Net lost production 111 6.8% 29 10.0% 1.6 9.3%Hospital care 4.0 0.2% 22 7.5% 1.2 7.1%Administration 6.6 0.4% 1.3 0.5% 0.6 3.6%Property damage 24 1.5% 6.4 2.2% 3.3 19.3%Value of statistical life and injury 1,630 100% 293 100% 17 100%
Source, Swedish National Road Administration Note: 1 ECU = 8.7 SEK.
8 The average cost of an accident is a function of the accident consequence (SF; i.e. number of casualties peraccident). For 1997 the cost function (in thousand SEK) wasTotal accident cost(a+c) = 90 + 860 * SF + 2939 *SF2. The cost is adjusted for underreporting.
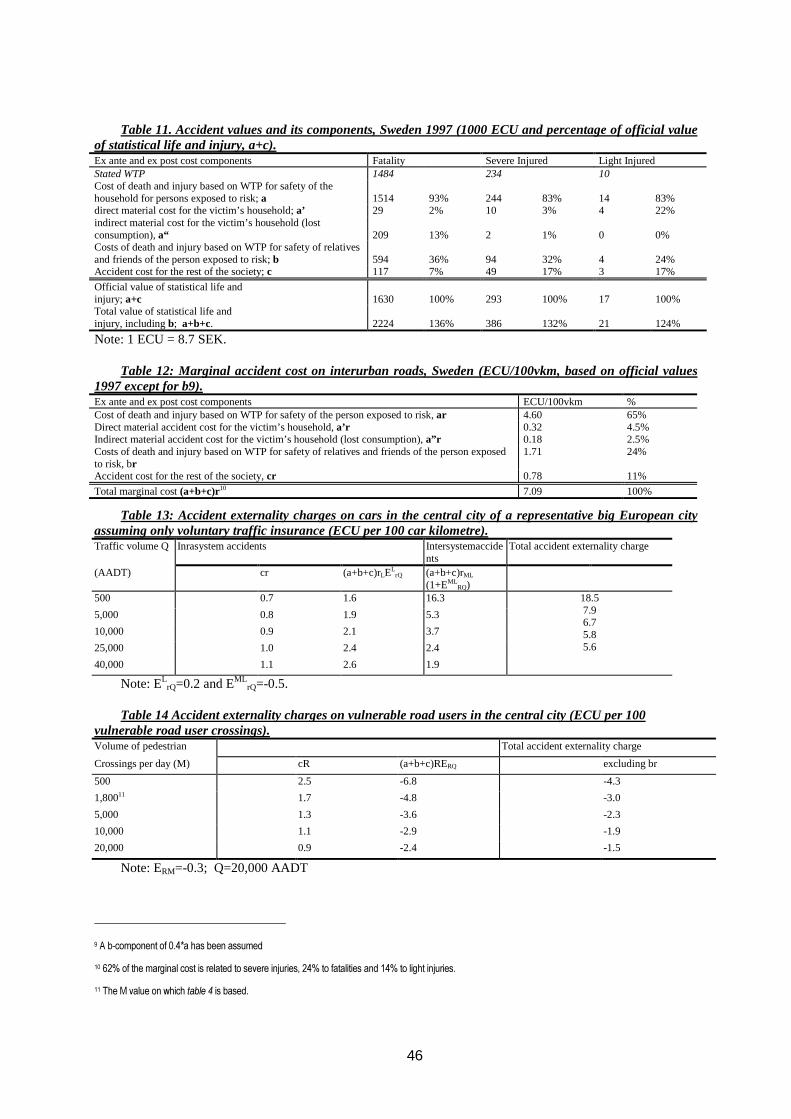
46
Table 11. Accident values and its components, Sweden 1997 (1000 ECU and percentage of official valueof statistical life and injury, a+c).Ex ante and ex post cost components Fatality Severe Injured Light InjuredStated WTP 1484 234 10Cost of death and injury based on WTP for safety of thehousehold for persons exposed to risk;a 1514 93% 244 83% 14 83%direct material cost for the victim’s household;a’ 29 2% 10 3% 4 22%indirect material cost for the victim’s household (lostconsumption),a“ 209 13% 2 1% 0 0%Costs of death and injury based on WTP for safety of relativesand friends of the person exposed to risk;b 594 36% 94 32% 4 24%Accident cost for the rest of the society;c 117 7% 49 17% 3 17%
Official value of statistical life andinjury; a+c 1630 100% 293 100% 17 100%Total value of statistical life andinjury, includingb; a+b+c. 2224 136% 386 132% 21 124%
Note: 1 ECU = 8.7 SEK.
Table 12: Marginal accident cost on interurban roads, Sweden (ECU/100vkm, based on official values1997 except for b9).Ex ante and ex post cost components ECU/100vkm %Cost of death and injury based on WTP for safety of the person exposed to risk,ar 4.60 65%Direct material accident cost for the victim’s household,a’r 0.32 4.5%Indirect material accident cost for the victim’s household (lost consumption),a”r 0.18 2.5%Costs of death and injury based on WTP for safety of relatives and friends of the person exposedto risk, br
1.71 24%
Accident cost for the rest of the society,cr 0.78 11%
Total marginal cost(a+b+c)r10 7.09 100%
Table 13: Accident externality charges on cars in the central city of a representative big European cityassuming only voluntary traffic insurance (ECU per 100 car kilometre).Traffic volume Q Inrasystem accidents Intersystemaccide
ntsTotal accident externality charge
(AADT) cr (a+b+c)rLELrQ (a+b+c)rML
(1+EMLRQ)
500 0.7 1.6 16.3
5,000 0.8 1.9 5.3
10,000 0.9 2.1 3.7
25,000 1.0 2.4 2.4
40,000 1.1 2.6 1.9
18.57.96.75.85.6
Note: ELrQ=0.2 and EML
rQ=-0.5.
Table 14 Accident externality charges on vulnerable road users in the central city (ECU per 100vulnerable road user crossings).Volume of pedestrian Total accident externality charge
Crossings per day (M) cR (a+b+c)RERQ excluding br
500 2.5 -6.8 -4.3
1,80011 1.7 -4.8 -3.0
5,000 1.3 -3.6 -2.3
10,000 1.1 -2.9 -1.9
20,000 0.9 -2.4 -1.5
Note: ERM=-0.3; Q=20,000 AADT
9 A b-component of 0.4*a has been assumed
10 62% of the marginal cost is related to severe injuries, 24% to fatalities and 14% to light injuries.
11 The M value on which table 4 is based.
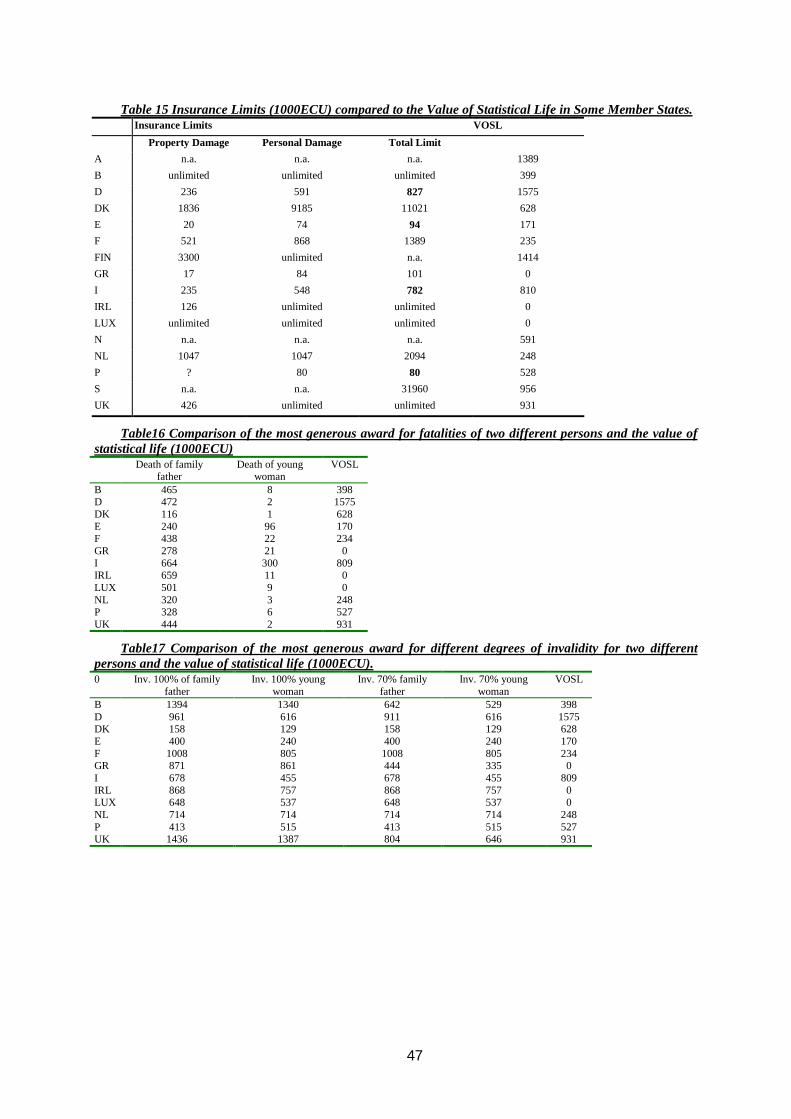
47
Table 15 Insurance Limits (1000ECU) compared to the Value of Statistical Life in Some Member States.Insurance Limits VOSL
Property Damage Personal Damage Total Limit
A n.a. n.a. n.a. 1389
B unlimited unlimited unlimited 399
D 236 591 827 1575
DK 1836 9185 11021 628
E 20 74 94 171
F 521 868 1389 235
FIN 3300 unlimited n.a. 1414
GR 17 84 101 0
I 235 548 782 810
IRL 126 unlimited unlimited 0
LUX unlimited unlimited unlimited 0
N n.a. n.a. n.a. 591
NL 1047 1047 2094 248
P ? 80 80 528
S n.a. n.a. 31960 956
UK 426 unlimited unlimited 931
Table16 Comparison of the most generous award for fatalities of two different persons and the value ofstatistical life (1000ECU)
Death of familyfather
Death of youngwoman
VOSL
B 465 8 398D 472 2 1575DK 116 1 628E 240 96 170F 438 22 234GR 278 21 0I 664 300 809IRL 659 11 0LUX 501 9 0NL 320 3 248P 328 6 527UK 444 2 931
Table17 Comparison of the most generous award for different degrees of invalidity for two differentpersons and the value of statistical life (1000ECU).0 Inv. 100% of family
fatherInv. 100% young
womanInv. 70% family
fatherInv. 70% young
womanVOSL
B 1394 1340 642 529 398D 961 616 911 616 1575DK 158 129 158 129 628E 400 240 400 240 170F 1008 805 1008 805 234GR 871 861 444 335 0I 678 455 678 455 809IRL 868 757 868 757 0LUX 648 537 648 537 0NL 714 714 714 714 248P 413 515 413 515 527UK 1436 1387 804 646 931
48
Annex 1.
The number of opportunities for road accidents is obviously related to the volume of traffic.Fortunately, only a very small proportion of these opportunities actually results in an accident.The ‘simple’ theoretical conclusion suggests that single vehicle accidents should vary inproportion to the number of vehicles on the road and that the number of collisions betweentwo vehicles should beproportional to the squareof the number of vehicles. However, as theprobability of an opportunity producing an accident may be related both to the traffic volumeand to other factors, we can not expect a close relationship between the frequency of accidentsand the volume of traffic.
A comprehensive summary of earlier research of the relationship between accidents andtraffic volume can be found in Satterthwaite (1981). A wide spectrum of estimated riskelasticities appears from surveying the literature but in general the accident risk is more orless independent of the traffic volume, possible slowly decreasing, for mostinterurban roadtypes (links), which means that the risk elasticity is approximately zero (ErQ=0). Thissuggestion is supported by among others Vitaliano and Held (1991) and Winslott (1998).
Considering differentaccident typesand accident consequences, a more complicated patternemerges. Evidences presented by Satterthwaite (1981), Ceder and Livneh (1982), Ceder (1982)and Jovanis and Chang (1986) and lately Winslott (1998) all suggests that collision accidentsincrease with the number of vehicles while single accident decreases. The relationshipbetween traffic volume and total number of accidents is henceU-shaped. As traffic densityincreases, the speed goes down, and the accidents become less severe. It can thus be assumedthat the more serious consequences increase digressively with increased volume while theproperty damage will increase progressively (Elvik 1994). When economic values areassigned to the different injury types theaverage accident costcould be expected to fall withincreased traffic volume. This result has been found empirical by Fridström et al (1991) and(1993) on regional data. However, Winslott (1998) could not find any relationship betweenaverage accident cost and traffic flow on most Swedish road types.
In Urban areasthe elasticity seems to be higher than on interurban roads. Satterthwaite(1981) review a number of studies related to accidents and traffic volume atintersectionsimplying risk elasticity (ErQ) between 0 and 0.4. Maycock and Hall (1984), Swedish NationalRoad Administration (1993) and UK Department of Transport (1994) find and utilises similarresults.
The survey of literature suggests that the elasticity is not constant over the whole interval oftraffic flow. Dickson et.al (1998), Vitalino and Held (1991) respectively Ceder and Livneh(1982)12 found an increasing elasticity with increasing traffic flow for all accident typesrespectively for multi-vehicle accidents.
Maycock and Hall (1984) as well as Brüde, Larsson (1993) have estimated models of accidentrisk for unprotected roadusers at roundabouts respectively intersections. The total number ofaccidents with pedestrian’s (Z) increases in both vehicle flow (Q) and pedestrian crossingflow. The risk, defined as number of accidents with unprotected road users per passing motorvehicle (r’=Z/Q ), decreases with increasing number of motor vehicles. The risk elasticity inrelation to motor vehicles is thus negative. Both studies suggest a risk elasticity (Er’Q ) around–0.5. Ekman (1996) does not support this conclusion and finds in a non-parametric study thatthe risk is more or less independent of the motor vehicle flow.
12 Three out of four observations where the risk does not increase sharply with traffic flow are characterised by low upper bound of traffic flow (p24).
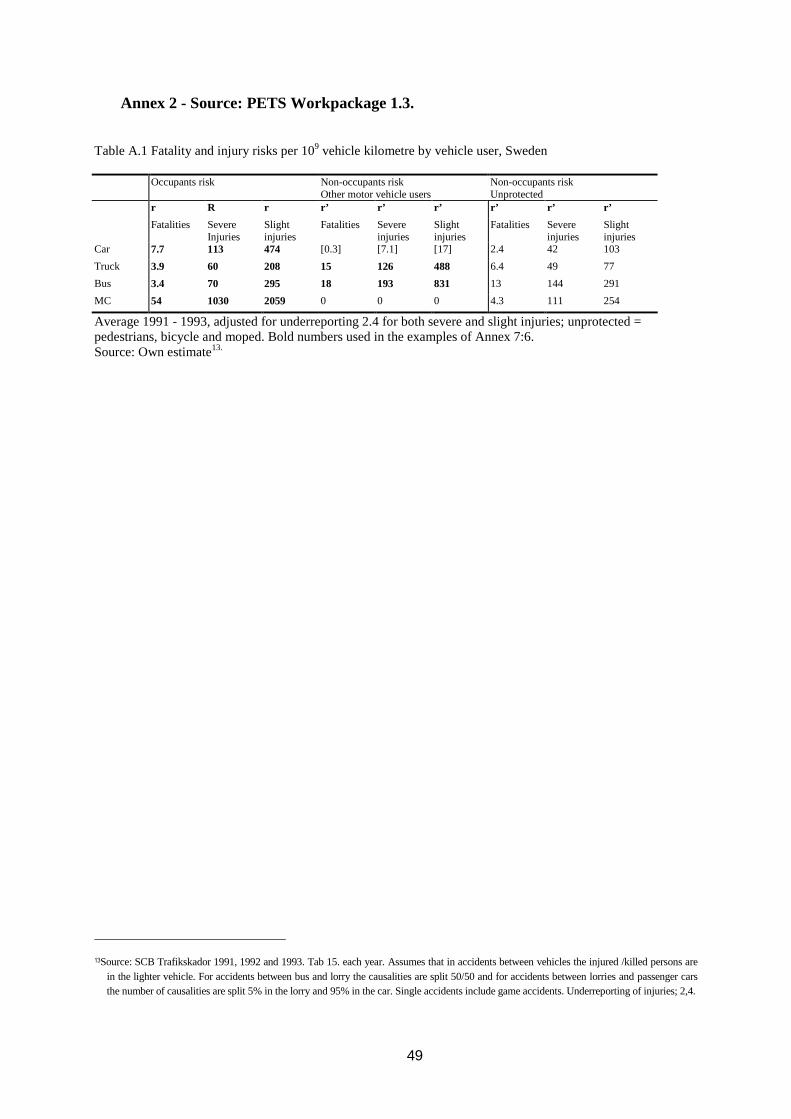
49
Annex 2 - Source: PETS Workpackage 1.3.
Table A.1 Fatality and injury risks per 109 vehicle kilometre by vehicle user, Sweden
Occupants risk Non-occupants riskOther motor vehicle users
Non-occupants riskUnprotected
r R r r’ r’ r’ r’ r’ r’
Fatalities SevereInjuries
Slightinjuries
Fatalities Severeinjuries
Slightinjuries
Fatalities Severeinjuries
Slightinjuries
Car 7.7 113 474 [0.3] [7.1] [17] 2.4 42 103
Truck 3.9 60 208 15 126 488 6.4 49 77
Bus 3.4 70 295 18 193 831 13 144 291
MC 54 1030 2059 0 0 0 4.3 111 254
Average 1991 - 1993, adjusted for underreporting 2.4 for both severe and slight injuries; unprotected =pedestrians, bicycle and moped. Bold numbers used in the examples of Annex 7:6.Source: Own estimate13.
13Source: SCB Trafikskador 1991, 1992 and 1993. Tab 15. each year. Assumes that in accidents between vehicles the injured /killed persons arein the lighter vehicle. For accidents between bus and lorry the causalities are split 50/50 and for accidents between lorries and passenger carsthe number of causalities are split 5% in the lorry and 95% in the car. Single accidents include game accidents. Underreporting of injuries; 2,4.

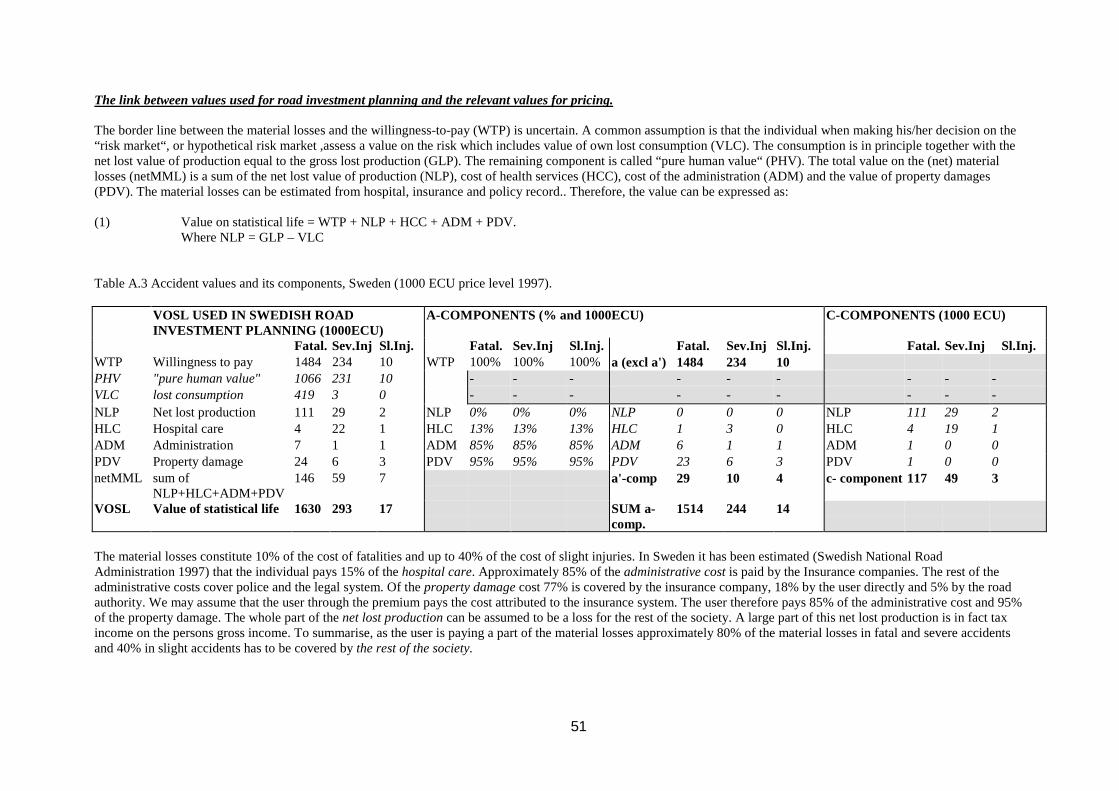
51
The link between values used for road investment planning and the relevant values for pricing.
The border line between the material losses and the willingness-to-pay (WTP) is uncertain. A common assumption is that the individual when making his/her decision on the“risk market“, or hypothetical risk market ,assess a value on the risk which includes value of own lost consumption (VLC). The consumption is in principle together with thenet lost value of production equal to the gross lost production (GLP). The remaining component is called “pure human value“ (PHV). The total value on the (net) materiallosses (netMML) is a sum of the net lost value of production (NLP), cost of health services (HCC), cost of the administration (ADM) and the value of property damages(PDV). The material losses can be estimated from hospital, insurance and policy record.. Therefore, the value can be expressed as:
(1) Value on statistical life = WTP + NLP + HCC + ADM + PDV.Where NLP = GLP – VLC
Table A.3 Accident values and its components, Sweden (1000 ECU price level 1997).
VOSL USED IN SWEDISH ROADINVESTMENT PLANNING (1000ECU)
A-COMPONENTS (% and 1000ECU) C-COMPONENTS (1000 ECU)
Fatal. Sev.Inj Sl.Inj. Fatal. Sev.Inj Sl.Inj. Fatal. Sev.Inj Sl.Inj. Fatal. Sev.Inj Sl.Inj.WTP Willingness to pay 1484 234 10 WTP 100% 100% 100%a (excl a') 1484 234 10PHV "pure human value" 1066 231 10 - - - - - - - - -VLC lost consumption 419 3 0 - - - - - - - - -NLP Net lost production 111 29 2 NLP 0% 0% 0% NLP 0 0 0 NLP 111 29 2HLC Hospital care 4 22 1 HLC 13% 13% 13% HLC 1 3 0 HLC 4 19 1ADM Administration 7 1 1 ADM 85% 85% 85% ADM 6 1 1 ADM 1 0 0PDV Property damage 24 6 3 PDV95% 95% 95% PDV 23 6 3 PDV 1 0 0netMML sum of
NLP+HLC+ADM+PDV146 59 7 a'-comp 29 10 4 c- component 117 49 3
VOSL Value of statistical life 1630 293 17 SUM a-comp.
1514 244 14
The material losses constitute 10% of the cost of fatalities and up to 40% of the cost of slight injuries. In Sweden it has been estimated (Swedish National RoadAdministration 1997) that the individual pays 15% of thehospital care. Approximately 85% of theadministrative costis paid by the Insurance companies. The rest of theadministrative costs cover police and the legal system. Of theproperty damagecost 77% is covered by the insurance company, 18% by the user directly and 5% by the roadauthority. We may assume that the user through the premium pays the cost attributed to the insurance system. The user therefore pays 85% of the administrative cost and 95%of the property damage. The whole part of thenet lost productioncan be assumed to be a loss for the rest of the society. A large part of this net lost production is in fact taxincome on the persons gross income. To summarise, as the user is paying a part of the material losses approximately 80% of the material losses in fatal and severe accidentsand 40% in slight accidents has to be covered bythe rest of the society.
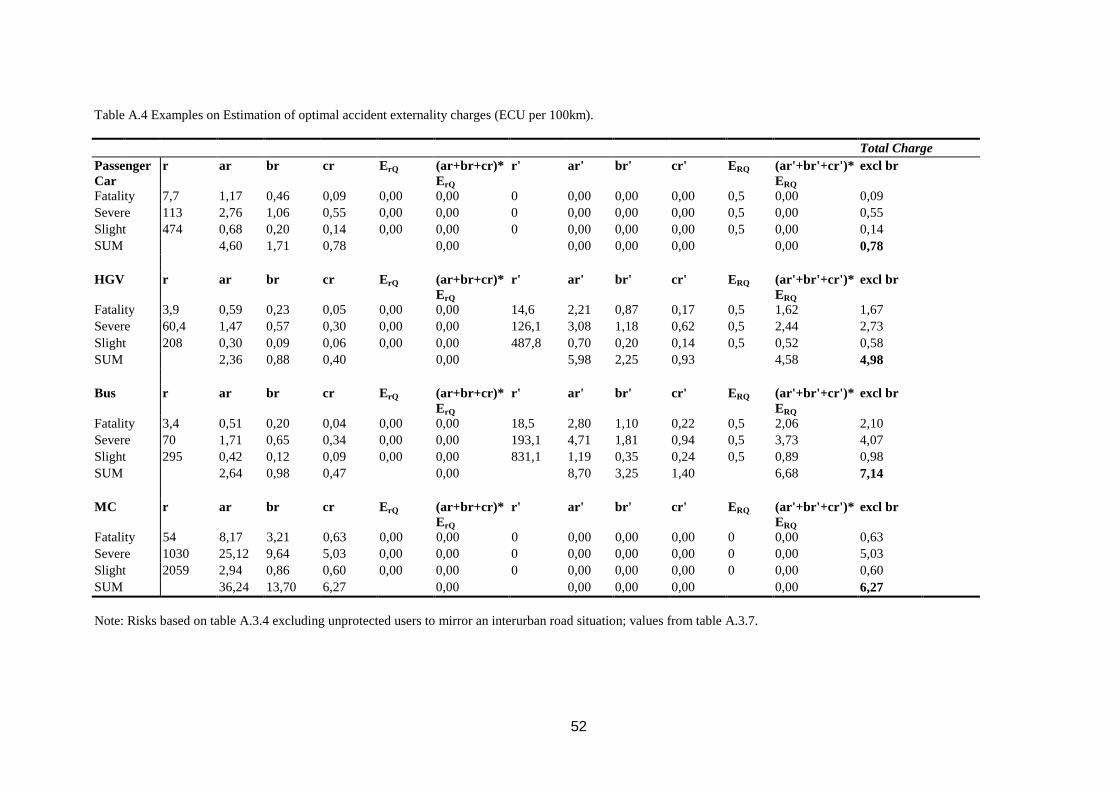
52
Table A.4 Examples on Estimation of optimal accident externality charges (ECU per 100km).
Total ChargePassengerCar
r ar br cr E rQ (ar+br+cr)*ErQ
r' ar' br' cr' E RQ (ar'+br'+cr')*ERQ
excl br
Fatality 7,7 1,17 0,46 0,09 0,00 0,00 0 0,00 0,00 0,00 0,5 0,00 0,09Severe 113 2,76 1,06 0,55 0,00 0,00 0 0,00 0,00 0,00 0,5 0,00 0,55Slight 474 0,68 0,20 0,14 0,00 0,00 0 0,00 0,00 0,00 0,5 0,00 0,14SUM 4,60 1,71 0,78 0,00 0,00 0,00 0,00 0,00 0,78
HGV r ar br cr E rQ (ar+br+cr)*ErQ
r' ar' br' cr' E RQ (ar'+br'+cr')*ERQ
excl br
Fatality 3,9 0,59 0,23 0,05 0,00 0,00 14,6 2,21 0,87 0,17 0,5 1,62 1,67Severe 60,4 1,47 0,57 0,30 0,00 0,00 126,1 3,08 1,18 0,62 0,5 2,44 2,73Slight 208 0,30 0,09 0,06 0,00 0,00 487,8 0,70 0,20 0,14 0,5 0,52 0,58SUM 2,36 0,88 0,40 0,00 5,98 2,25 0,93 4,58 4,98
Bus r ar br cr E rQ (ar+br+cr)*ErQ
r' ar' br' cr' E RQ (ar'+br'+cr')*ERQ
excl br
Fatality 3,4 0,51 0,20 0,04 0,00 0,00 18,5 2,80 1,10 0,22 0,5 2,06 2,10Severe 70 1,71 0,65 0,34 0,00 0,00 193,1 4,71 1,81 0,94 0,5 3,73 4,07Slight 295 0,42 0,12 0,09 0,00 0,00 831,1 1,19 0,35 0,24 0,5 0,89 0,98SUM 2,64 0,98 0,47 0,00 8,70 3,25 1,40 6,68 7,14
MC r ar br cr E rQ (ar+br+cr)*ErQ
r' ar' br' cr' E RQ (ar'+br'+cr')*ERQ
excl br
Fatality 54 8,17 3,21 0,63 0,00 0,00 0 0,00 0,00 0,00 0 0,00 0,63Severe 1030 25,12 9,64 5,03 0,00 0,00 0 0,00 0,00 0,00 0 0,00 5,03Slight 2059 2,94 0,86 0,60 0,00 0,00 0 0,00 0,00 0,00 0 0,00 0,60SUM 36,24 13,70 6,27 0,00 0,00 0,00 0,00 0,00 6,27
Note: Risks based on table A.3.4 excluding unprotected users to mirror an interurban road situation; values from table A.3.7.
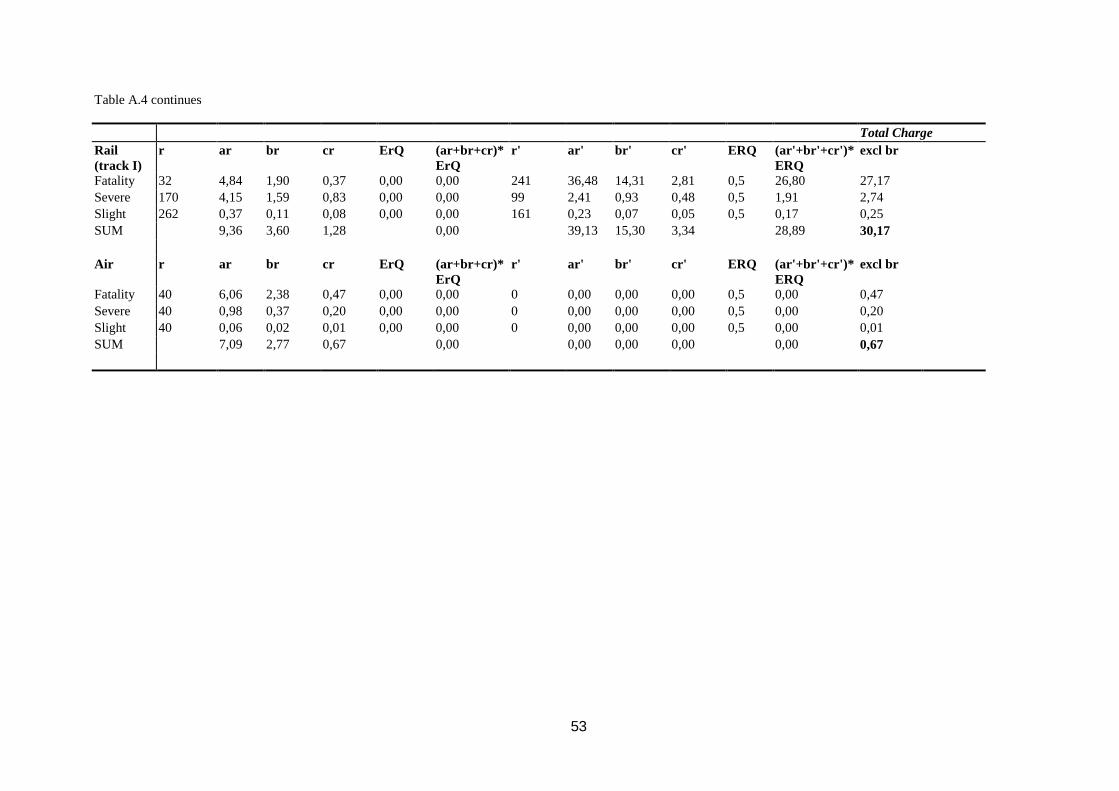
53
Table A.4 continues
Total ChargeRail(track I)
r ar br cr ErQ (ar+br+cr)*ErQ
r' ar' br' cr' ERQ (ar'+br'+cr')*ERQ
excl br
Fatality 32 4,84 1,90 0,37 0,00 0,00 241 36,48 14,31 2,81 0,5 26,80 27,17Severe 170 4,15 1,59 0,83 0,00 0,00 99 2,41 0,93 0,48 0,5 1,91 2,74Slight 262 0,37 0,11 0,08 0,00 0,00 161 0,23 0,07 0,05 0,5 0,17 0,25SUM 9,36 3,60 1,28 0,00 39,13 15,30 3,34 28,89 30,17
Air r ar br cr ErQ (ar+br+cr)*ErQ
r' ar' br' cr' ERQ (ar'+br'+cr')*ERQ
excl br
Fatality 40 6,06 2,38 0,47 0,00 0,00 0 0,00 0,00 0,00 0,5 0,00 0,47Severe 40 0,98 0,37 0,20 0,00 0,00 0 0,00 0,00 0,00 0,5 0,00 0,20Slight 40 0,06 0,02 0,01 0,00 0,00 0 0,00 0,00 0,00 0,5 0,00 0,01SUM 7,09 2,77 0,67 0,00 0,00 0,00 0,00 0,00 0,67