Embed Size (px)
Citation preview

HEALTH ECONOMICS
Health Econ. 8: 1–8 (1999)
GUEST EDITORIAL
CALCULATING THE GLOBAL BURDEN OFDISEASE: TIME FOR A STRATEGIC
REAPPRAISAL?
ALAN WILLIAMS*Centre for Health Economics, Uni6ersity of York, UK
Large organizations responsible for health careface formidable problems in gathering and de-ploying data relevant to their principal tasks,which are to monitor the health of the communi-ties they serve, and to decide where resourcescould most effectively be used to improve things.In the short run, health improvements come bychoosing and supporting the right health careactivities. In the long run, they also come bychoosing and supporting the right researchactivities.
The ambitions of the Global Burden of DiseaseStudy [1] are to contribute to all three of theseimportant objectives. Broadly speaking, the argu-ment is that if we knew the impact of each diseaseor injury upon people’s life expectancy and uponthe (health-related) quality of their lives, and if weknew the incidence and prevalence of each diseaseor injury, we could use this information to moni-tor population health, to establish priorities be-tween interventions, and to guide researchpriorities.
In what follows, I am going to consider thesegeneral claims from three different viewpoints. Inthe first phase I will abstract from practical diffi-culties and ask whether, in principle, calculatingthe global burden of disease is the best way toapproach each of these problems. I shall concludethat it is not. This will lead into the second stage,in which I shall ask whether there is anythinguseful that could be extracted from the global
burden of disease calculations as they are actuallyperformed, that would help with the three majorproblems that have to solved. I shall concludethat there is a little, but that it is not worth thecost, and that resources could, and should, bebetter targeted on discovering those things thatwe really need to know. This will lead into mythird and final section, where I aim to be rathermore constructive, by offering an alternative strat-egy that would achieve the above objectives morestraightforwardly.
Although I shall direct my remarks specificallyto the Global Burden of Disease Study (hence-forth GBD) as conducted under the impressiveleadership of Murray and Lopez, much of what Ihave to say applies in principle to any burden ofdisease (or cost of illness) approach, applied atany level (global, national, regional or local). Butin the second section I will be considering somerather idiosyncratic elements in the Murray–Lopez approach that other calculators of the bur-den of disease have omitted (for reasons good orbad). And because I regard one particular elementin the GBD enterprise, the disability adjusted lifeyear (DALY), as a particular variant of the moregeneral concept of the quality adjusted life year(QALY), my concern here is not with the use ofthat general concept (which I support whole-heartedly) but with the specific features of theDALY that make it less useful than other types ofQALY that might have been used [2].
* Correspondence to: Centre for Health Economics, University of York, York, YO10 5DD, UK.
CCC 1057–9230/99/010001–08$17.50Copyright © 1999 John Wiley & Sons, Ltd.

A. WILLIAMS2
IS IT IN PRINCIPLE THE RIGHTAPPROACH?
First of all it has to be said that combining lifeexpectancy and health-related quality of life intoa single measure as the operational definition ofhealth is undoubtedly the best way forward forthe purposes in hand. The use of life expectancyalone is a poor second best, and no other mor-bidity measure is sufficiently generic to enablethe broad comparisons to be made that are re-quired in this field. So the use of a QALY-typeconcept, as the unit with which to measure bothlevels of health and the benefits of health care,is in principle the right one.
But how should it be used in tackling ourthree fundamental policy issues? In monitoringthe performance of health care systems it is sug-gested that the GBD be measured periodicallyfor the community in question, to see whetherthings are getting better or worse. The well-known scientific difficulty here is that of at-tributing any overall changes in health to anyspecific causes. It is well-known that a majorpredictor of the health of a community (andespecially among poor communities) is its levelof material well-being [3]. This also appears tobe true of individuals within a community [4].So changes in material well-being are likely toobscure anything generated by the health caresystem. If changes due to the health care sys-tem itself are the focus of interest, then itmight well be a better strategy to concentrateon measuring more directly the impact on peo-ple’s health of those changes. To do this we donot need to know the GBD, and a great dealof effort could then be redirected from measur-ing broad aggregates to measuring selective im-pacts. It suggests that, even at the monitoringstage, concentrating on ‘diseases’ as the target ofpolicy interest is mistaken. What we need tomeasure is what impact different interventionswill have, not what impact different diseaseshave.
This is even more clearly the case, as Murrayand Lopez concede [5], when it comes to prior-ity setting across health care activities. Here weneed to know the costs of each activity and itseffects on people’s health. We do not need toknow the GBD, but the marginal impact of ahealth technology upon it [6]. Priority setting isto be driven by a comparison of incremental
gains with incremental costs. That is where in-formation-gathering resources should be di-rected, because that is the data we sodesperately lack. Health technology assessmentis a more urgent, more focused, and more usefulfield of endeavour for priority setting purposesthan calculating the GBD.
Is there however a better case to be made forusing GBD calculations as a guide to prioritysetting in research? The argument might be thatresearch is typically directed at diseases, and soresearch should be concentrated where the dis-ease burden is greatest. I can see some limitedvalidity in this argument, in that we might notwant to devote vast amounts of research moneysearching for a way to eliminate a particulardisease if that disease were an insignificant con-tributor to the overall burden of disease. Butbefore pouring money into diseases that do im-pose significant burdens, we also need to knowwhat the research would cost, what specific con-tribution that research would make to reducingthe overall burden if it were successful, andwhat are the chances of it being successful.Again, it is incremental gains and incrementalcosts associated with particular research acti6itiesthat we need, not broad aggregates focused ondiseases that may or may not be tractable sub-jects for research. Very little research aims ateradicating diseases completely. It is much morecommon to find research directed at relievingparticular symptoms, or arresting the progres-sion of a condition. Very few interventions arefree of side-effects, and the tracing of these hasto be built into any research protocol. They arebest captured directly as negative impacts on thelength or quality of life of the study population,rather than as increased risks of other diseases,which then have to be translated into such im-pacts by more indirect methods outside thestudy in question. So there seems no role forGBD calculations that could not be better ful-filled in other ways.
So my conclusion is that we do not needmeasures of the Global Burden of Disease forANY of the broad purposes stated, and thatthe resources devoted to calculating it should,in the interests of global health, be redirectedinto measuring the cost effectiveness of particu-lar activities (on as wide a scale as can be af-forded).
Copyright © 1999 John Wiley & Sons, Ltd. Health Econ. 8: 1–8 (1999)

GUEST EDITORIAL 3
WHAT PRACTICAL ASPECTS OF THEMURRAY–LOPEZ CALCULATIONS
WOULD BE USEFUL FOR THISINCREMENTAL APPROACH?
Before addressing this question, it is necessary tosketch out the main steps in the Murray–Lopezapproach to calculating the GBD. The four keyelements are:
1. Calculate the years of life lost due to eachdisease
2. Calculate the loss of quality of life of thoseliving with the disease
3. Apply a set of weights to reflect the socialvalue of people at different ages
4. Apply a discount rate to reflect the fact thatbenefits delivered sooner are better than bene-fits delivered later
I will consider each in turn, but in reverse order.The use of discounting is much misunderstood,
since for many people it is associated with the rateof return on capital, and seen as an economicvariable dependent on the productivity of capitalin the private sector of the economy, and designedto ensure that the public sector does not invest inactivities that have lower returns than are obtain-able in the private sector. In my view, this is amistaken interpretation of what the discount rateis there for. In the public sector it is an importantpolicy statement, indicating the willingness of acommunity to sacrifice benefits now for the sakeof bigger benefits in the future. This is what iscalled the ‘time preference’ interpretation of dis-counting, as opposed to the ‘opportunity cost ofcapital’ interpretation that I mentioned earlier. Alow discount rate, such as the 3% used in GBDcalculations (which is also the rate recommendedby the Washington Panel on Cost-Effectiveness inHealth and Health Care [7]) means that thepresent generation does not need much induce-ment to make sacrifices now for future gains,whereas a high discount rate (say 10%) implies avery strong sense of urgency about getting thebenefits from health care. In general, one wouldexpect rich countries to have low rates of timepreference, and poor countries to have high ones(because if the current generations do not survive,there will be no future ones!). Note that thesediscount rates are ‘real’ ones, from which priceinflation has been purged. There is a dilemmahere for Murray and Lopez, because they could
either have applied different discount rates todifferent countries depending on local conditions,or, mimicking the situation of central decision-makers (such as the World Bank), apply the samediscount rate to everyone, in the interests of eq-uity and comparability. They chose the lattercourse, though it would be perfectly feasible toredo all of their calculations using different dis-count rates for different countries. Comparabilityover time within a country would be maintained,but not comparability between countries. Despitethese interpretative difficulties, which are ines-capable, I see no problems in carrying over thiselement in their calculations to an approach basedon estimating incremental benefits rather thantotal burdens.
The age weights that they have applied in orderto reflect the differential social value of people ateach year of age are reproduced in Figure 1. Theyimply that it is not of much social value toprevent a newborn child from dying unless thatchild is going to live into adulthood. They alsoimply that prolonging the life of an old adult for10 years is not as valuable as prolonging the lifeof a young adult for 10 years. Unpleasant thoughthese implications are, they are probably true.One can, of course, challenge the precise formula,which is probably inappropriate in rich countrieswith rather low birth rates and long life expectan-cies, where people remain fit and active well intotheir seventies, but here we face the same dilemmaas with the discount rate. Should it be tailored toindividual circumstances, or applied uniformly tomaintain comparability? But there is an additionalelement here that was not present with the dis-
Figure 1. World Bank Age weights
Copyright © 1999 John Wiley & Sons, Ltd. Health Econ. 8: 1–8 (1999)

A. WILLIAMS4
count rate element, and that is whether age-weights should be an integral part of the calcula-tion of the global burden of disease, or whetherthey should be kept distinct from it, and treatedas an ‘optional extra’. I think it would be better tokeep the measurement of the GBD as easy tounderstand as possible, so in the main calcula-tions it would be better to take the age-weights asbeing 1 at all ages. If someone then wants to usedifferent age-weights, they may do so, and theycan specify their own. Comparability is thenmaintained in the ‘base case’, and the figures arenot contaminated by problematic considerationsthat are difficult to disentangle.
Calculating the loss of quality of life experi-enced by those currently suffering with each dis-ease is a much more complex matter. The needhere was for a measurement scale running from 0to 1 that would reflect the severity of this part ofthe burden of disease. In measuring the GBD thisis measured as departures from good health, sothat 0 represents good health and 1 represents aburden as bad as being dead. In QALY calcula-tions, which focus on the benefits of health carerather than the burdens of disease, the scale runsthe opposite way, with 1 being good health and 0equivalent to being dead. QALY calculations alsopermit the existence of states that are regarded asworse than being dead (i.e. which have negativevalues). But these differences are not matters ofprinciple, but matters of appropriateness in eachcontext.
But because of the focus on diseases as theunits of analysis, this led to a rather strangemethod being adopted to derive health-relatedquality of life (HRQOL) valuations. First of all,some 22 ‘indicator conditions’ were assessed fortheir impact on HRQOL by panels of experts.This was done by asking the experts to comparehow many people would need to be cured of thatcondition compared with some stated number ofpeople in some other situation, for the outcome tobe equal in terms of HRQOL gained. The scoresderived in this way from the experts were thenaveraged, and the indicator conditions rankedaccordingly in order of seriousness. The 22 condi-tions were then grouped roughly into triplets,each triplet having a defined range of averagescores. Seven such ranges were identified, labelleddisability level 1–7, and the midpoint of eachrange was taken as a point score. The resulting7-point category scale was then used by experts to
assess the impact on HRQOL of hundreds ofother conditions, both treated and untreated. Themean values of these assessments were than takento be the DALY burden associated with eachdisease. The judgmental burden placed on theseexperts must have been considerable, since theyneeded to know both the lifetime sequelae of eachcondition in a descriptive sense, and the valua-tions that people would attach to such time pro-files of disability, etc. They would also need toknow all this for the condition when treated, sothey must also assess the effectiveness of treat-ments, or at least of the typical treatments. It is avery complicated and roundabout route, fraughtwith problems. But fortunately there are muchmore straightforward ways of getting into thisterritory once the need to calculate the GBD hasbeen abandoned, which I will return to in the nextsection of this paper.
The final element in the calculation is the esti-mation of the years of life lost due to each disease.This was done by comparing the age at death ofpeople with the disease with the standard lifeexpectancy of someone of that age and sex. Thenatural thing to do here would be to take as the‘standard’ the actual life expectancy of the peoplein question, but in calculating the GBD this is notwhat was done. Instead, the standard was takento be the life expectancy of the longest livingmajor group of people for which we have gooddata, which was taken to be Japanese women,with a life expectancy at birth of 82.5 years. Amodel life table with that life expectancy at birthfor females was then used (and a slightly worseone was used for males, whose standard life ex-pectancy at birth was taken to be 80 years) as thestandard comparator for calculating life years lostthrough each disease. The argument justifying thisprocedure was essentially an equity one, becauseMurray and Lopez did not want the calculationsto show that preventing a 40-year-old woman in arich country from dying (whose life expectancywould still be large at that age) would be morebeneficial (in terms of reducing the GBD) thanpreventing a 40-year-old woman in a poor coun-try from dying (where her remaining life expec-tancy at that age would have been small). So herewe have a strong political judgement entering intothe calculations, based on a postulated aversion tointer-country inequalities in life expectancy ateach age.
At a moral level this may well be commendable,but it raises two issues of principle. The first is
Copyright © 1999 John Wiley & Sons, Ltd. Health Econ. 8: 1–8 (1999)

GUEST EDITORIAL 5
Figure 2. Implied weights for e(0)=50 for different regionalpatterns
weights between rich and poor countries (becausehigh and low life expectancy is closely related tothe real income per head in each country). This isshown in Figure 3 for the case of ‘East’ only, andit indicates that old people in richer countries aregiven more weight on equity grounds than youngadults in poorer countries! This is surely an unin-tended and unwanted side-effect of the Murray–Lopez method of incorporating aversion toinequality in life expectancy into their calcula-tions, and it suggests to me that they should notbe averse to abandoning it if something better canbe done. I will suggest something better shortly.
It should be noted, however, that when it comesto estimating the impact of particular interven-tions, the standard life table is abandoned andactual local life tables are used instead. This raisestwo further questions. The first is: why bother tocalculate the global burden of disease, when it hasto be abandoned just when its policy value wouldbe greatest? The second is: does equity not matterany more when prioritizing health interventions?It seems to me that in both contexts the ‘years oflife lost’ should be the actual years of life lost,estimated as best one can. But equity is stillimportant, and needs to be introduced separately,but explicitly, in both cases. This requires a differ-ent method from adopting as the standard thepseudo-Japanese model life table.
IS THERE A VIABLE ALTERNATIVESTRATEGY?
The problems addressed by the GBD enterprisewill not go away. They are important and willsurely become ever more pressing. The intellectualstrength of the enterprise is its explicitness, which
whether it is right to incorporate this ‘fiction’ intowhat most people regard as a ‘factual’ matter,namely the years of life lost due to a disease.Would it not be better to keep the factual esti-mates separate from the moral judgements?
The second issue of principle is whether thatparticular way of incorporating a moral judge-ment about aversion to global inequality in lifeexpectancy is a sensible one. It is equivalent toapplying an equity weight greater than 1 to eachyear of life lost in a country where life expectancyat a given age is less than the standard. Thisimplied equity weight will be larger the greater theratio of the standard life expectancy to the actuallife expectancy. If the actual were 20, but thestandard 40, then each actual year carries animplied equity weight of 2. When these figures are30 and 50, respectively, the implied equity weightis 1.6. But when applied to the model life tablesthat are used in the GBD calculations [8], thisprocess generates some very peculiar results con-cerning intergenerational equity, both withincountries and between countries. Figure 2 showsthe implied equity weights for four different re-gional model life tables, each of which has lifeexpectancy at birth equal to 50 years. It will beseen that, within each country, years of life gainedby those who have survived into old age areaccorded much higher equity weights than theyears of life gained by younger adults, and for‘East’ and ‘South’, this feature is quite marked. Itis hard to imagine what justification there mightbe on equity grounds for introducing such a biasinto the calculations.
But this oddity becomes even more strangewhen we compare these age profiles of equity Figure 3. Implied weights for ‘East’ only with differing e(0)
Copyright © 1999 John Wiley & Sons, Ltd. Health Econ. 8: 1–8 (1999)
A. WILLIAMS6
enables others to identify weaknesses and checkconclusions. No such undertaking is ever going tobe perfect, and those critics who reject such enter-prises because they have faults need to look atwhat happens already and apply the same criticalcriteria to current practice. We must beware ofallowing unattainable perfection to prevent usfrom recognizing and supporting feasible im-provements. It therefore seems to me to be incum-bent on critics to say what they would do instead,and why they think their proposals would bebetter (though not, of course, perfect). That iswhat I shall attempt to do in this final section.
Starting at a broad strategic level, the mostimportant change that is required is to replace‘disease’ as the system’s keystone with ‘interven-tion’. Once this is done, things become muchsimpler, because we can concentrate on incremen-tal changes and abandon the attempt to calculatecomprehensive aggregates on a global basis. Butthis switch of focus of interest has other advan-tages too, because it will simplify the valuationprocess, reduce the role of experts, and facilitateempirical verification of their judgements. Theseare considerable advantages, and the sooner theenterprise changes course, the sooner we will beable to enjoy them.
Starting with the monitoring of populationhealth, it was argued above that this is not strictlyspeaking necessary for priority setting purposes,either for health care or for research. But theremay be a different role for such monitoring,namely to assist in the identification of newthreats to health, by relating population health torisk factors (such as diet, or smoking behaviour,or environmental pollution). But if the objective isto measure health status as quality adjusted lifeexpectancy in QALY (or DALY) terms, there isno great advantage in pursuing that by the round-about route of measuring the global burden ofdisease. It would be much more straightforwardto do so by introducing some simple generic mea-sure of HRQOL into any survey of a representa-tive sample of the general population, so as togenerate population norms that could then beanalyzed by whatever background factors areconsidered important. The information would bemore accurate, less reliant on the remote estimatesof ‘experts’, and could be tailor made to localpolicy concerns. If the Murray–Lopez estimatesof life expectancy are indeed superior to anypreviously available in many countries, they can
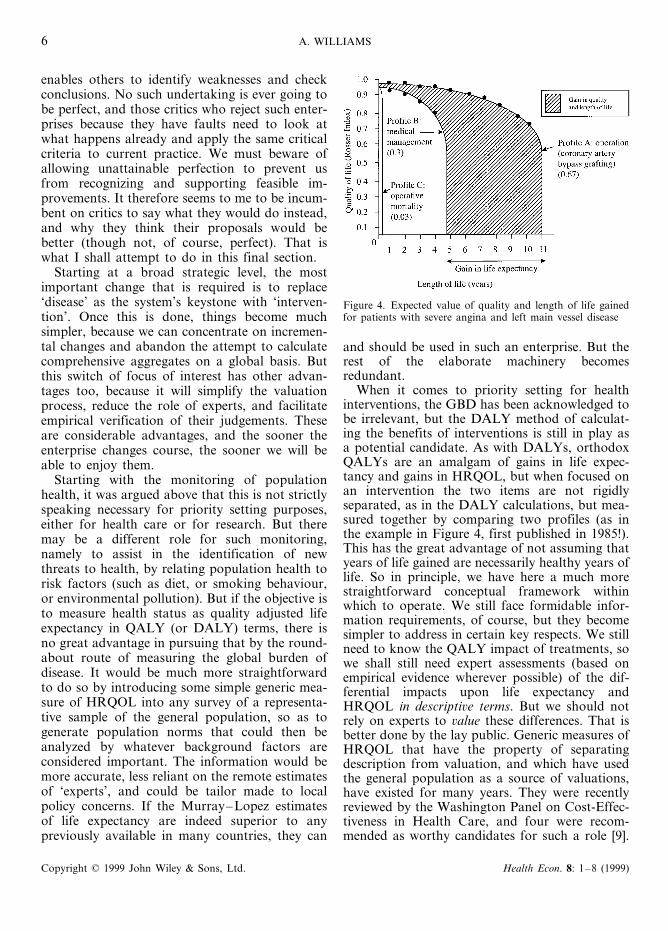
Figure 4. Expected value of quality and length of life gainedfor patients with severe angina and left main vessel disease
and should be used in such an enterprise. But therest of the elaborate machinery becomesredundant.
When it comes to priority setting for healthinterventions, the GBD has been acknowledged tobe irrelevant, but the DALY method of calculat-ing the benefits of interventions is still in play asa potential candidate. As with DALYs, orthodoxQALYs are an amalgam of gains in life expec-tancy and gains in HRQOL, but when focused onan intervention the two items are not rigidlyseparated, as in the DALY calculations, but mea-sured together by comparing two profiles (as inthe example in Figure 4, first published in 1985!).This has the great advantage of not assuming thatyears of life gained are necessarily healthy years oflife. So in principle, we have here a much morestraightforward conceptual framework withinwhich to operate. We still face formidable infor-mation requirements, of course, but they becomesimpler to address in certain key respects. We stillneed to know the QALY impact of treatments, sowe shall still need expert assessments (based onempirical evidence wherever possible) of the dif-ferential impacts upon life expectancy andHRQOL in descripti6e terms. But we should notrely on experts to 6alue these differences. That isbetter done by the lay public. Generic measures ofHRQOL that have the property of separatingdescription from valuation, and which have usedthe general population as a source of valuations,have existed for many years. They were recentlyreviewed by the Washington Panel on Cost-Effec-tiveness in Health Care, and four were recom-mended as worthy candidates for such a role [9].
Copyright © 1999 John Wiley & Sons, Ltd. Health Econ. 8: 1–8 (1999)
GUEST EDITORIAL 7
So instead of getting small panels of experts to doall of this work, it would be better to adopt adescriptive system cast in terms that make senseto ordinary people (in a way that the technicalnames of diseases do not), and a valuationmethod to which they can respond and whichfocuses on the actual differences in people’sHRQOL. The weakness of the person trade-offmethod, as employed latterly in the Murray–Lopez DALY valuations, is that it muddles thevaluation of the health states with people’s viewsabout distributional issues. Distributional consid-erations are important, but they need to be keptseparate from the measurement of HRQOL. Ifsamples of the general public each country wereused as the source of values (as they could be withsystems that focus on health states rather thandiseases), and if the very same valuation experi-ments were conducted on the experts (and onpolicy-makers), we would have a valuable oppor-tunity to verify the capacity of the latter to makejudgements on behalf of the former.
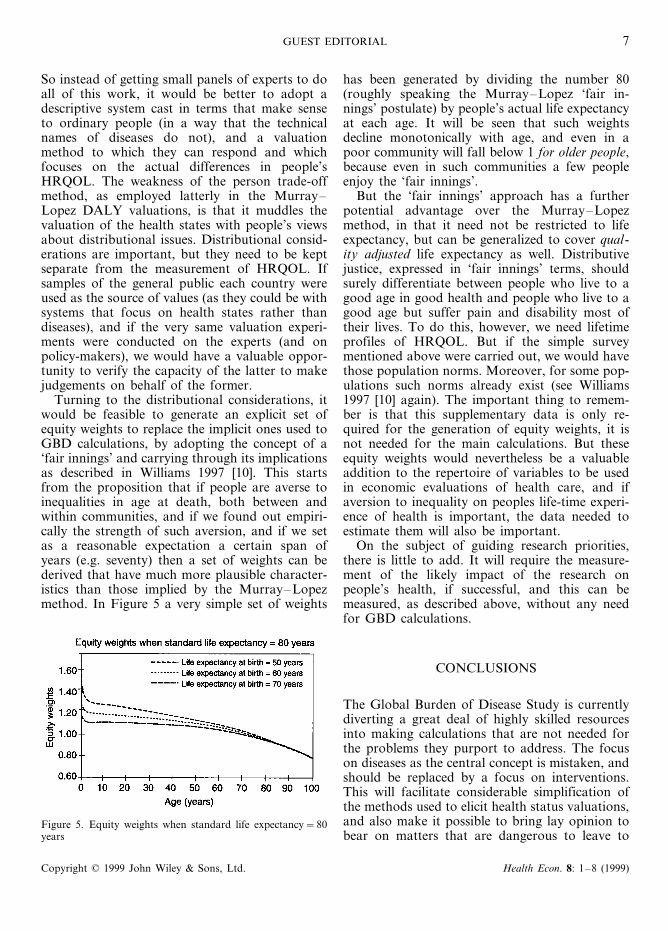
Turning to the distributional considerations, itwould be feasible to generate an explicit set ofequity weights to replace the implicit ones used toGBD calculations, by adopting the concept of a‘fair innings’ and carrying through its implicationsas described in Williams 1997 [10]. This startsfrom the proposition that if people are averse toinequalities in age at death, both between andwithin communities, and if we found out empiri-cally the strength of such aversion, and if we setas a reasonable expectation a certain span ofyears (e.g. seventy) then a set of weights can bederived that have much more plausible character-istics than those implied by the Murray–Lopezmethod. In Figure 5 a very simple set of weights
has been generated by dividing the number 80(roughly speaking the Murray–Lopez ‘fair in-nings’ postulate) by people’s actual life expectancyat each age. It will be seen that such weightsdecline monotonically with age, and even in apoor community will fall below 1 for older people,because even in such communities a few peopleenjoy the ‘fair innings’.
But the ‘fair innings’ approach has a furtherpotential advantage over the Murray–Lopezmethod, in that it need not be restricted to lifeexpectancy, but can be generalized to cover qual-ity adjusted life expectancy as well. Distributivejustice, expressed in ‘fair innings’ terms, shouldsurely differentiate between people who live to agood age in good health and people who live to agood age but suffer pain and disability most oftheir lives. To do this, however, we need lifetimeprofiles of HRQOL. But if the simple surveymentioned above were carried out, we would havethose population norms. Moreover, for some pop-ulations such norms already exist (see Williams1997 [10] again). The important thing to remem-ber is that this supplementary data is only re-quired for the generation of equity weights, it isnot needed for the main calculations. But theseequity weights would nevertheless be a valuableaddition to the repertoire of variables to be usedin economic evaluations of health care, and ifaversion to inequality on peoples life-time experi-ence of health is important, the data needed toestimate them will also be important.
On the subject of guiding research priorities,there is little to add. It will require the measure-ment of the likely impact of the research onpeople’s health, if successful, and this can bemeasured, as described above, without any needfor GBD calculations.
CONCLUSIONS
The Global Burden of Disease Study is currentlydiverting a great deal of highly skilled resourcesinto making calculations that are not needed forthe problems they purport to address. The focuson diseases as the central concept is mistaken, andshould be replaced by a focus on interventions.This will facilitate considerable simplification ofthe methods used to elicit health status valuations,and also make it possible to bring lay opinion tobear on matters that are dangerous to leave to
Figure 5. Equity weights when standard life expectancy=80years
Copyright © 1999 John Wiley & Sons, Ltd. Health Econ. 8: 1–8 (1999)

A. WILLIAMS8
experts. The experts will have quite enough to doin assessing the effectiveness of interventions indescriptive QALY terms, without taking on thevaluation task as well. With such a strategic reap-praisal, the global burden of disease enterprisewill be brought into a more fruitful relationshipwith health technology assessment, and the rede-ployed resources will make a more valuable con-tribution to pressing policy problems there thanby continuing to pursue the calculation of aggre-gates that have too many idiosyncratic elements inthem to be capable of straightforward interpreta-tion or application.
REFERENCES
1. Originally incorporated into the World De6elop-ment Report 1993, published for the World Bankby Oxford University Press, Oxford, 1993. Themain recent methodological source book is Mur-ray, C.J.L. and Lopez, A.D. (eds.) The GlobalBurden of Disease, published by The HarvardSchool of Public Health on behalf of The WorldHealth Organization and The World Bank, 1996,and distributed by Harvard University Press. Someof the results of the study were recently publishedin The Lancet 349 in four articles each authored byMurray, C.J.L. and Lopez, A.D., as follows: Mor-tality by cause for eight regions of the world:Global Burden of Disease Study, 1269–1276; Re-gional patterns of disability-free life expectancy anddisability-adjusted life expectancy: Global Burdenof Disease Study, 1347–1352; Global mortality,disability, and the contribution of risk factors:Global Burden of Disease Study, 1436–1442; andAlternative projections of mortality and disability
by cause 1990–2020: Global Burden of DiseaseStudy, 1498–1504.
2. See for instance the recent review by Gold, M.R. etal. ‘Identifying and valuing outcomes’, In Gold,M.R. et al. (eds.) Cost-Effecti6eness in Health andMedicine, New York: Oxford University Press,1996, chapter 4, pp. 82–134.
3. See for instance the data cited in the World De6el-opment Report, pp. 34–35 (see [1] above) and espe-cially Figure 1.9.
4. See for instance van Doorslaer, E. et al. Income-re-lated inequlities in health: some international com-parisons. Journal of Health Economics 1997; 16:93–112.
5. See for instance Murray, C.J.L. and Lopez, A.D.The Global Burden of Disease, 1996, pp. 19–22.
6. As was pointed out, at a much earlier stage in theGBD Study, by Mooney, G. and Creese, A. Prior-ity setting for health service efficiency: the role ofmeasurement of burden of illness, appendix C, pp.731–740 of Jamison, D.T. et al. (eds.) Diseasecontrol priorities in de6eloping countries. WorldBank, Oxford University Press, 1993.
7. As cited in [2] above, pp. 230–233.8. The study makes use of ‘model life tables’ pub-
lished in Coale, A.J. and Demeny, P. Regionalmodel life tables and stable populations: second edi-tion, New York: Academic Press, 1983. Broadlyspeaking, for each of a wide range of levels of lifeexpectancy at birth, life tables are created thatfollow four distinct patterns, labelled North, South,East and West. In using them, the art lies in findingthe one which most closely matches the knownparameters of any actual data that might be avail-able. It is then assumed that the rest of the data inthe selected model life table will also apply.
9. As cited in [2] above, pp. 124–128.10. Williams, A. Inter-generational equity: an explo-
ration of the ‘fair innings’ argument’, Health Eco-nomics 1997; 6: 117–132.
Copyright © 1999 John Wiley & Sons, Ltd. Health Econ. 8: 1–8 (1999)