Embed Size (px)
Citation preview
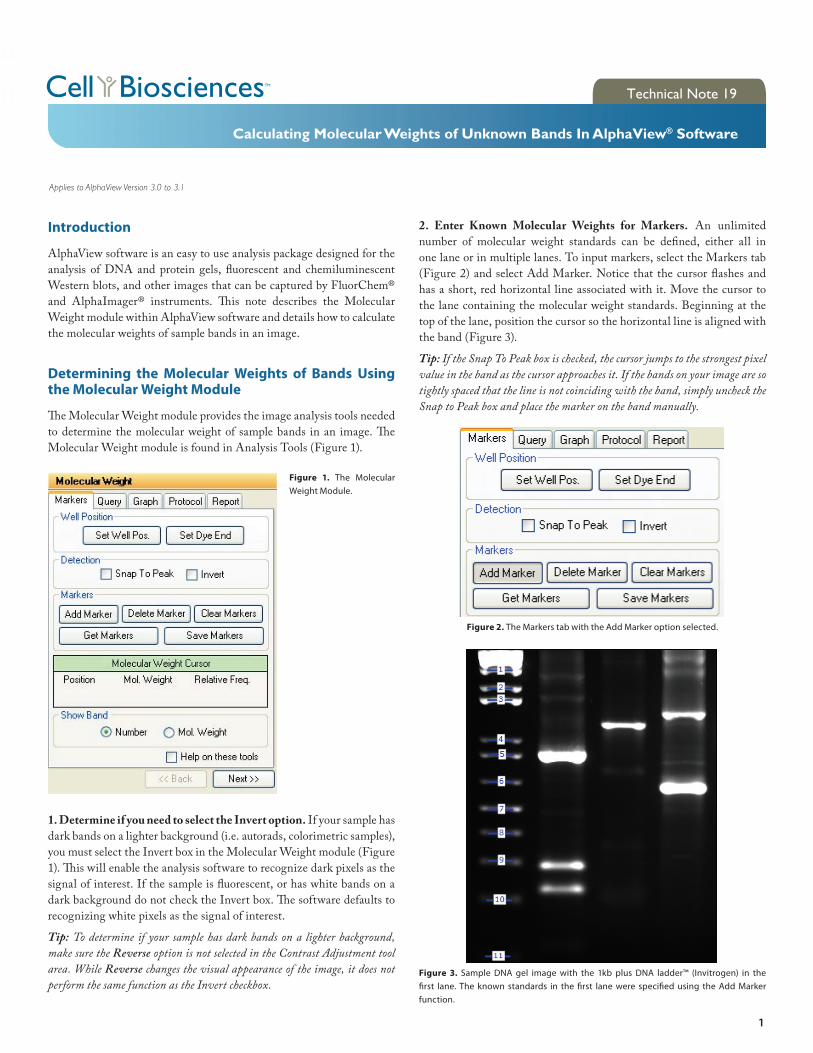
2. Enter Known Molecular Weights for Markers. An unlimited number of molecular weight standards can be defined, either all in one lane or in multiple lanes. To input markers, select the Markers tab (Figure 2) and select Add Marker. Notice that the cursor flashes and has a short, red horizontal line associated with it. Move the cursor to the lane containing the molecular weight standards. Beginning at the top of the lane, position the cursor so the horizontal line is aligned with the band (Figure 3).
Tip: If the Snap To Peak box is checked, the cursor jumps to the strongest pixel value in the band as the cursor approaches it. If the bands on your image are so tightly spaced that the line is not coinciding with the band, simply uncheck the Snap to Peak box and place the marker on the band manually.
Introduction
AlphaView software is an easy to use analysis package designed for the analysis of DNA and protein gels, fluorescent and chemiluminescent Western blots, and other images that can be captured by FluorChem®
Weight module within AlphaView software and details how to calculate the molecular weights of sample bands in an image.
Determining the Molecular Weights of Bands Using the Molecular Weight Module
Molecular Weight module is found in Analysis Tools (Figure 1).
1. Determine if you need to select the Invert option. If your sample has dark bands on a lighter background (i.e. autorads, colorimetric samples), you must select the Invert box in the Molecular Weight module (Figure
signal of interest. If the sample is fluorescent, or has white bands on a
recognizing white pixels as the signal of interest.
Tip: To determine if your sample has dark bands on a lighter background, make sure the Reverse option is not selected in the Contrast Adjustment tool area. While Reverse changes the visual appearance of the image, it does not perform the same function as the Invert checkbox.
Figure 1. The Molecular Weight Module.
!
!Figure 2. The Markers tab with the Add Marker option selected.
!Figure 3. Sample DNA gel image with the 1kb plus DNA ladder™ (Invitrogen) in the
function.
1
Calculating Molecular Weights of Unknown Bands In AlphaView® Software
Technical Note 19
Applies to AlphaView Version 3.0 to 3.1
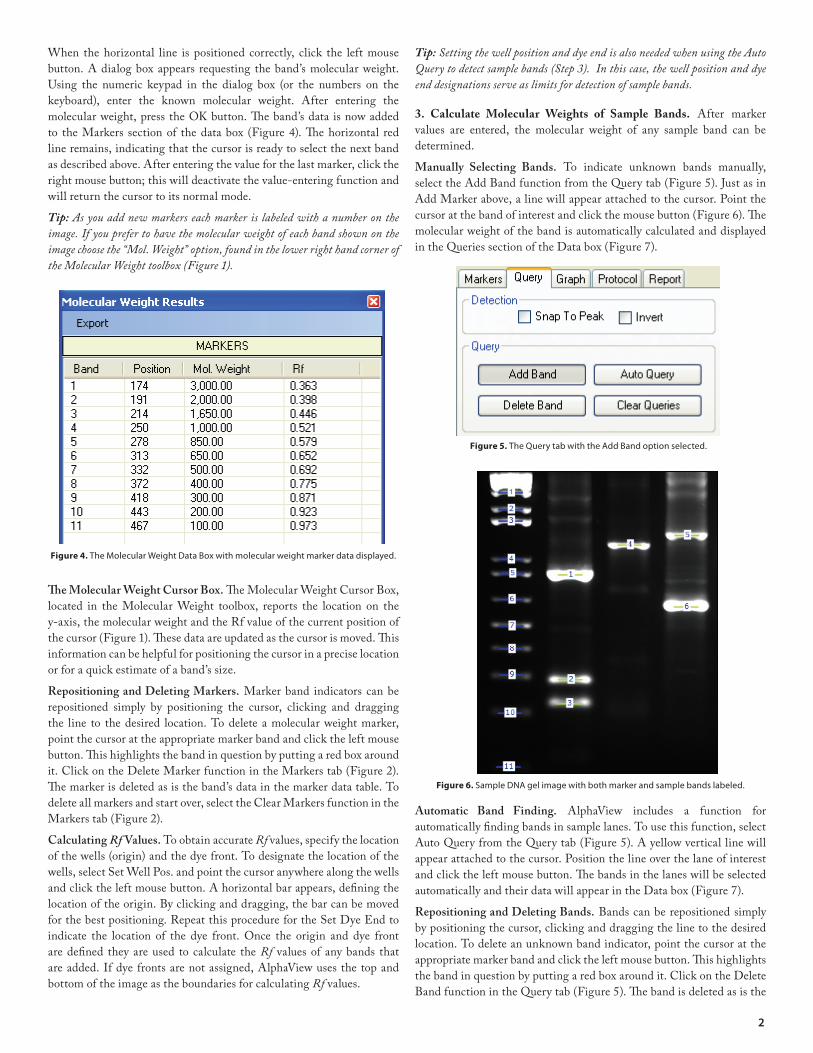
When the horizontal line is positioned correctly, click the left mouse button. A dialog box appears requesting the band’s molecular weight. Using the numeric keypad in the dialog box (or the numbers on the keyboard), enter the known molecular weight. After entering the
line remains, indicating that the cursor is ready to select the next band as described above. After entering the value for the last marker, click the right mouse button; this will deactivate the value-entering function and will return the cursor to its normal mode.
Tip: As you add new markers each marker is labeled with a number on the image. If you prefer to have the molecular weight of each band shown on the image choose the “Mol. Weight” option, found in the lower right hand corner of the Molecular Weight toolbox (Figure 1).
located in the Molecular Weight toolbox, reports the location on the y-axis, the molecular weight and the Rf value of the current position of
information can be helpful for positioning the cursor in a precise location or for a quick estimate of a band’s size.
Repositioning and Deleting Markers. Marker band indicators can be repositioned simply by positioning the cursor, clicking and dragging the line to the desired location. To delete a molecular weight marker, point the cursor at the appropriate marker band and click the left mouse
it. Click on the Delete Marker function in the Markers tab (Figure 2).
delete all markers and start over, select the Clear Markers function in the Markers tab (Figure 2).
Calculating Rf Values. To obtain accurate Rf values, specify the location of the wells (origin) and the dye front. To designate the location of the wells, select Set Well Pos. and point the cursor anywhere along the wells and click the left mouse button. A horizontal bar appears, defining the location of the origin. By clicking and dragging, the bar can be moved for the best positioning. Repeat this procedure for the Set Dye End to indicate the location of the dye front. Once the origin and dye front are defined they are used to calculate the Rf values of any bands that are added. If dye fronts are not assigned, AlphaView uses the top and bottom of the image as the boundaries for calculating Rf values.
Tip: Setting the well position and dye end is also needed when using the Auto Query to detect sample bands (Step 3). In this case, the well position and dye end designations serve as limits for detection of sample bands.
3. Calculate Molecular Weights of Sample Bands. After marker values are entered, the molecular weight of any sample band can be determined.
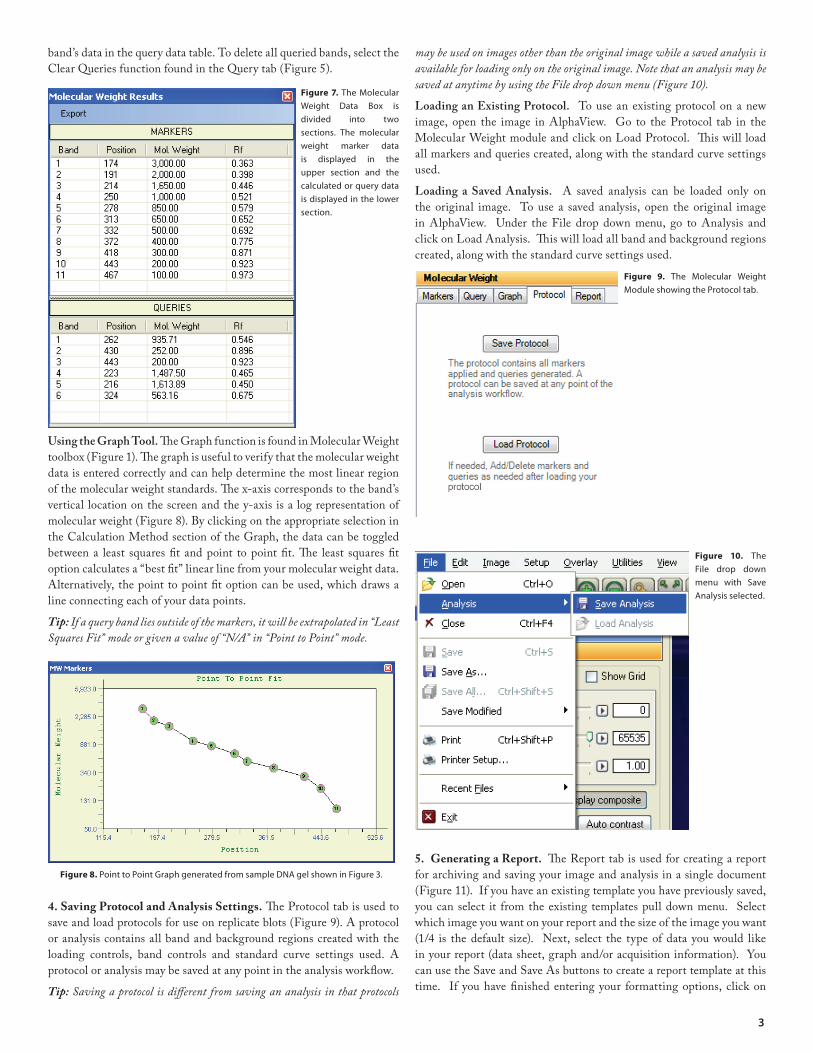
Manually Selecting Bands. To indicate unknown bands manually, select the Add Band function from the Query tab (Figure 5). Just as in Add Marker above, a line will appear attached to the cursor. Point the
molecular weight of the band is automatically calculated and displayed in the Queries section of the Data box (Figure 7).
Automatic Band Finding. AlphaView includes a function for automatically finding bands in sample lanes. To use this function, select Auto Query from the Query tab (Figure 5). A yellow vertical line will appear attached to the cursor. Position the line over the lane of interest
automatically and their data will appear in the Data box (Figure 7).
Repositioning and Deleting Bands. Bands can be repositioned simply by positioning the cursor, clicking and dragging the line to the desired location. To delete an unknown band indicator, point the cursor at the
the band in question by putting a red box around it. Click on the Delete
Figure 4. The Molecular Weight Data Box with molecular weight marker data displayed.
!
!Figure 5. The Query tab with the Add Band option selected.
Figure 6. Sample DNA gel image with both marker and sample bands labeled.
!
2
band’s data in the query data table. To delete all queried bands, select the Clear Queries function found in the Query tab (Figure 5).
Using the Graph Tool.
data is entered correctly and can help determine the most linear region
vertical location on the screen and the y-axis is a log representation of molecular weight (Figure 8). By clicking on the appropriate selection in the Calculation Method section of the Graph, the data can be toggled
option calculates a “best fit” linear line from your molecular weight data. Alternatively, the point to point fit option can be used, which draws a line connecting each of your data points.
Tip: If a query band lies outside of the markers, it will be extrapolated in “Least Squares Fit” mode or given a value of “N/A” in “Point to Point” mode.
4. Saving Protocol and Analysis Settings.save and load protocols for use on replicate blots (Figure 9). A protocol or analysis contains all band and background regions created with the loading controls, band controls and standard curve settings used. A protocol or analysis may be saved at any point in the analysis workflow.
Tip: Saving a protocol is di�erent from saving an analysis in that protocols
may be used on images other than the original image while a saved analysis is available for loading only on the original image. Note that an analysis may be saved at anytime by using the File drop down menu (Figure 10).
Loading an Existing Protocol. To use an existing protocol on a new image, open the image in AlphaView. Go to the Protocol tab in the
all markers and queries created, along with the standard curve settings used.
Loading a Saved Analysis. A saved analysis can be loaded only on the original image. To use a saved analysis, open the original image in AlphaView. Under the File drop down menu, go to Analysis and
created, along with the standard curve settings used.
5. Generating a Report. for archiving and saving your image and analysis in a single document (Figure 11). If you have an existing template you have previously saved, you can select it from the existing templates pull down menu. Select which image you want on your report and the size of the image you want (1/4 is the default size). Next, select the type of data you would like in your report (data sheet, graph and/or acquisition information). You can use the Save and Save As buttons to create a report template at this time. If you have finished entering your formatting options, click on
!
Figure 7. The Molecular Weight Data Box is divided into two sections. The molecular weight marker data is displayed in the upper section and the calculated or query data is displayed in the lower section.
Figure 9. The Molecular Weight Module showing the Protocol tab.
!
Figure 10. The File drop down menu with Save Analysis selected.
!Figure 8. Point to Point Graph generated from sample DNA gel shown in Figure 3.
3
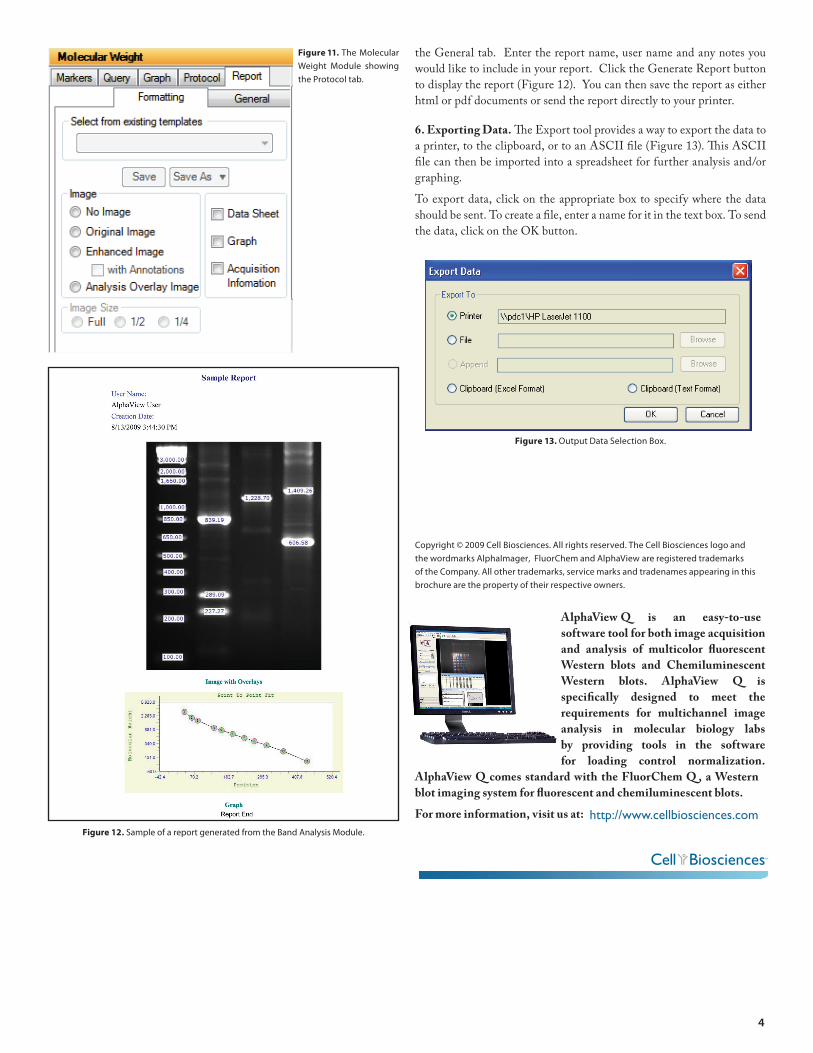
the General tab. Enter the report name, user name and any notes you would like to include in your report. Click the Generate Report button to display the report (Figure 12). You can then save the report as either html or pdf documents or send the report directly to your printer.
6. Exporting Data.
file can then be imported into a spreadsheet for further analysis and/or graphing.
To export data, click on the appropriate box to specify where the data should be sent. To create a file, enter a name for it in the text box. To send the data, click on the OK button.
Figure 13. Output Data Selection Box.!
Figure 11. The Molecular Weight Module showing the Protocol tab.
!
!Figure 12. Sample of a report generated from the Band Analysis Module.
AlphaView Q is an easy-to-use software tool for both image acquisition and analysis of multicolor fluorescent Western blots and Chemiluminescent Western blots. AlphaView Q is specifically designed to meet the requirements for multichannel image analysis in molecular biology labs by providing tools in the software for loading control normalization.
AlphaView Q comes standard with the FluorChem Q , a Western blot imaging system for fluorescent and chemiluminescent blots.
For more information, visit us at:
Copyright © 2009 Cell Biosciences. All rights reserved. The Cell Biosciences logo and the wordmarks AlphaImager, FluorChem and AlphaView are registered trademarks of the Company. All other trademarks, service marks and tradenames appearing in this brochure are the property of their respective owners.
!
4
http://www.cellbiosciences.com