Embed Size (px)
Citation preview

October 4, 2018
Getting Started with Finance Ad Hoc Analysis Templates

October 4, 2018
• Getting Started Cal Answers Ad Hoc • Overview of the Ad Hoc Editor• Modifying Ad Hoc Analysis Templates• Selecting and Filtering Columns • Analysis Results• Pivot Table Formatting• Saving and Opening an Ad Hoc Analysis• Sharing Analyses• Opening Multiple Instances of Cal Answers • Ad Hoc Data Dictionary
Getting Started with Finance Ad Hoc Analysis Templates
2
October 4, 2018
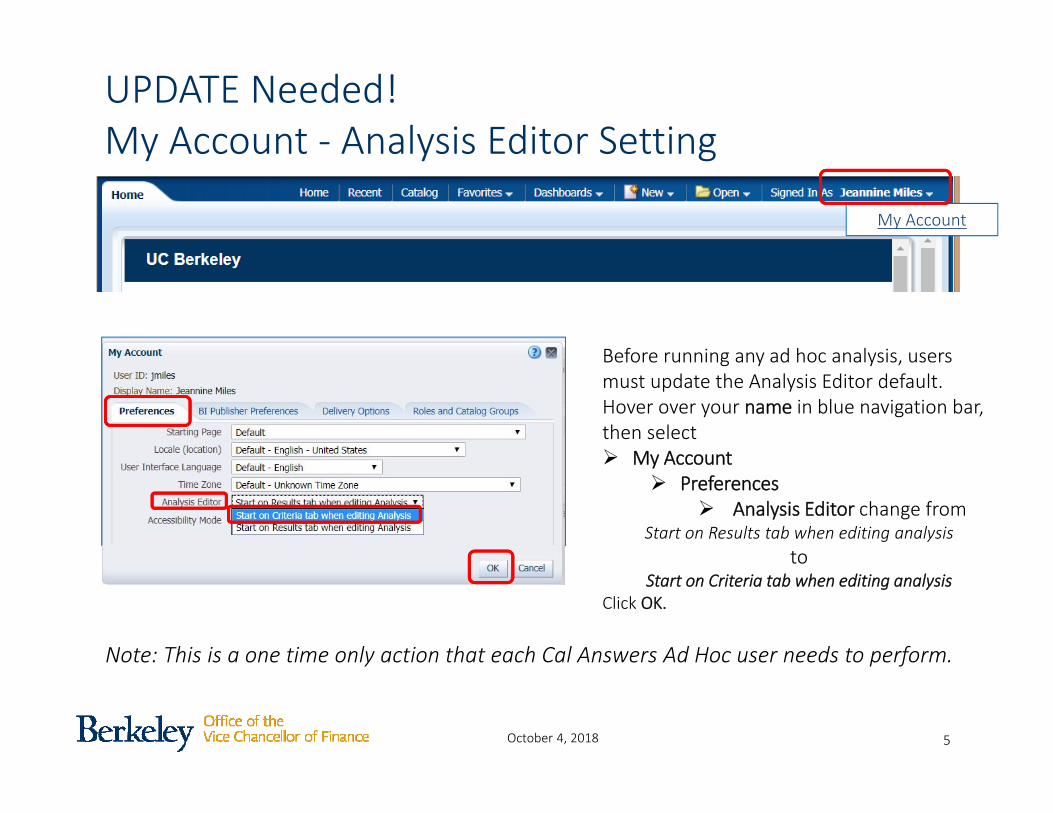
UPDATE Needed! My Account ‐ Analysis Editor Setting
Before running any ad hoc analysis, users must update the Analysis Editor default.Hover over your name in blue navigation bar, then select My Account
Preferences Analysis Editor change from
Start on Results tab when editing analysis to
Start on Criteria tab when editing analysisClick OK.
My Account
5
Note: This is a one time only action that each Cal Answers Ad Hoc user needs to perform.
October 4, 2018 4
Overview of the Cal Answers Ad Hoc Editor
October 4, 2018
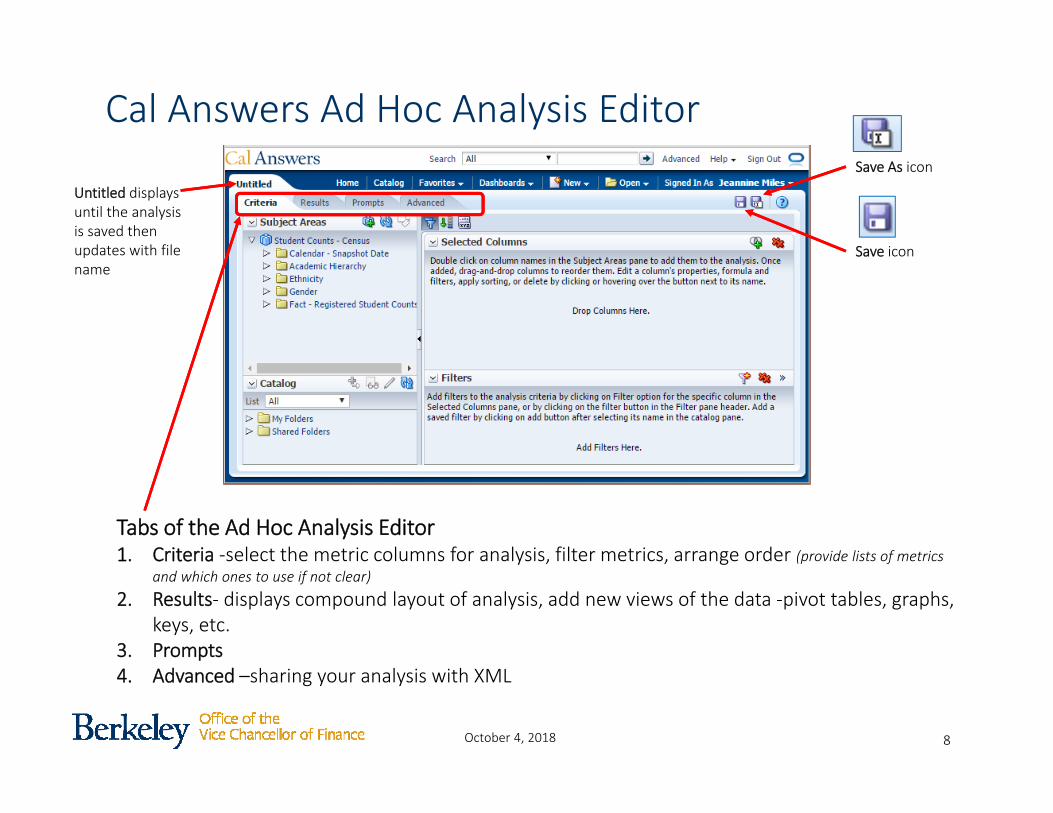
Cal Answers Ad Hoc Analysis Editor
Tabs of the Ad Hoc Analysis Editor 1. Criteria ‐select the metric columns for analysis, filter metrics, arrange order (provide lists of metrics
and which ones to use if not clear)2. Results‐ displays compound layout of analysis, add new views of the data ‐pivot tables, graphs,
keys, etc.3. Prompts 4. Advanced –sharing your analysis with XML
8
Untitled displays until the analysis is saved then updates with file name
Save icon
Save As icon
October 4, 2018
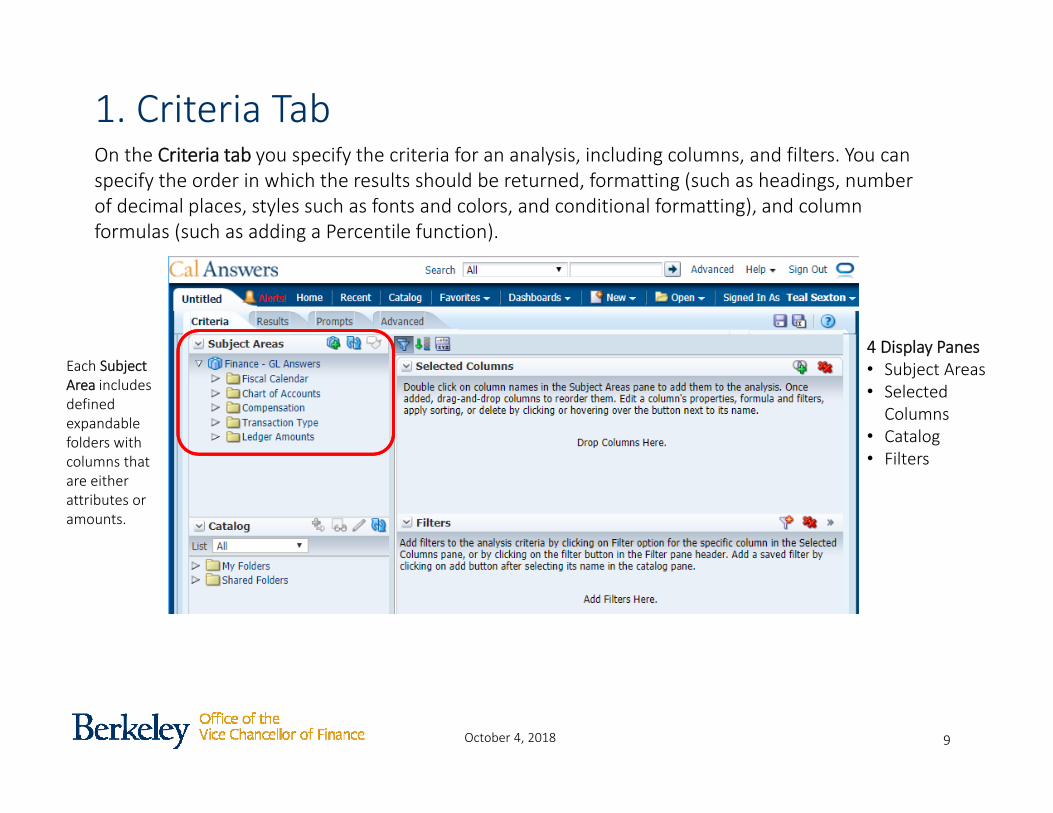
1. Criteria Tab
Each Subject Area includes defined expandable folders with columns that are either attributes or amounts.
On the Criteria tab you specify the criteria for an analysis, including columns, and filters. You can specify the order in which the results should be returned, formatting (such as headings, number of decimal places, styles such as fonts and colors, and conditional formatting), and column formulas (such as adding a Percentile function).
9
4 Display Panes• Subject Areas• Selected Columns
• Catalog• Filters
October 4, 2018
Working with Columns
10
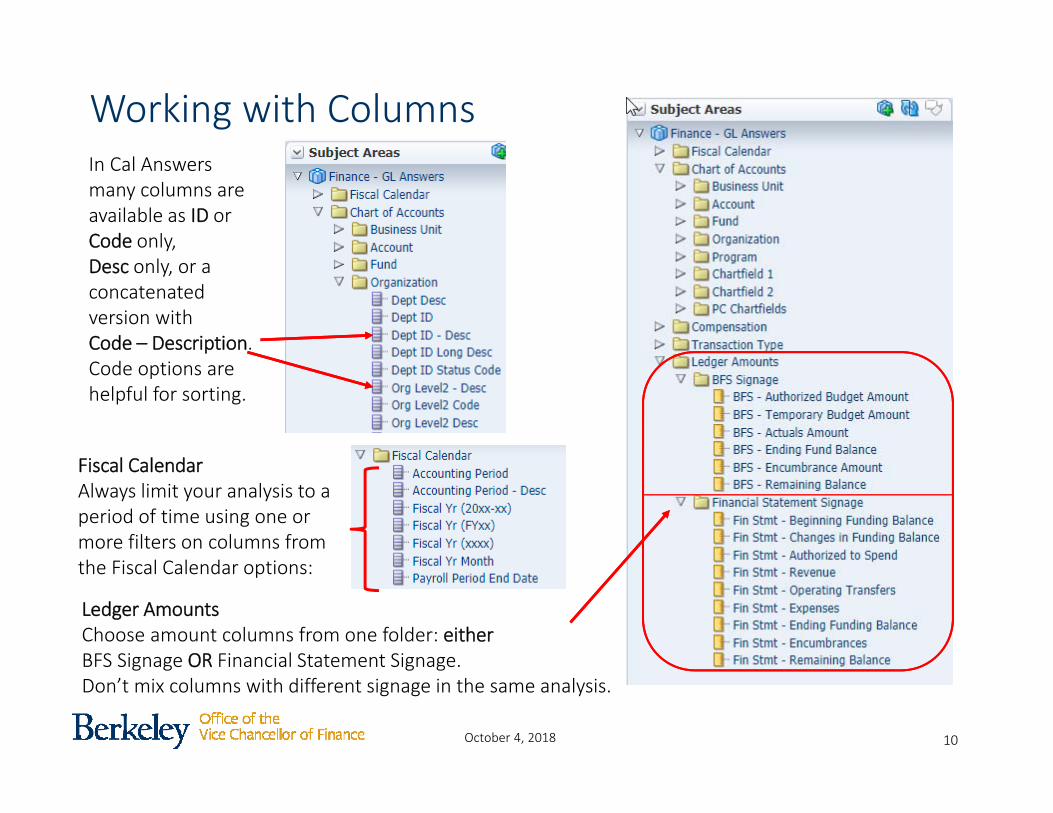
Fiscal CalendarAlways limit your analysis to a period of time using one or more filters on columns from the Fiscal Calendar options:
In Cal Answers many columns are available as ID or Code only, Desc only, or a concatenated version with Code – Description. Code options are helpful for sorting.
Ledger AmountsChoose amount columns from one folder: eitherBFS Signage OR Financial Statement Signage.Don’t mix columns with different signage in the same analysis.
October 4, 2018
Selected Columns & Filter Panes
11
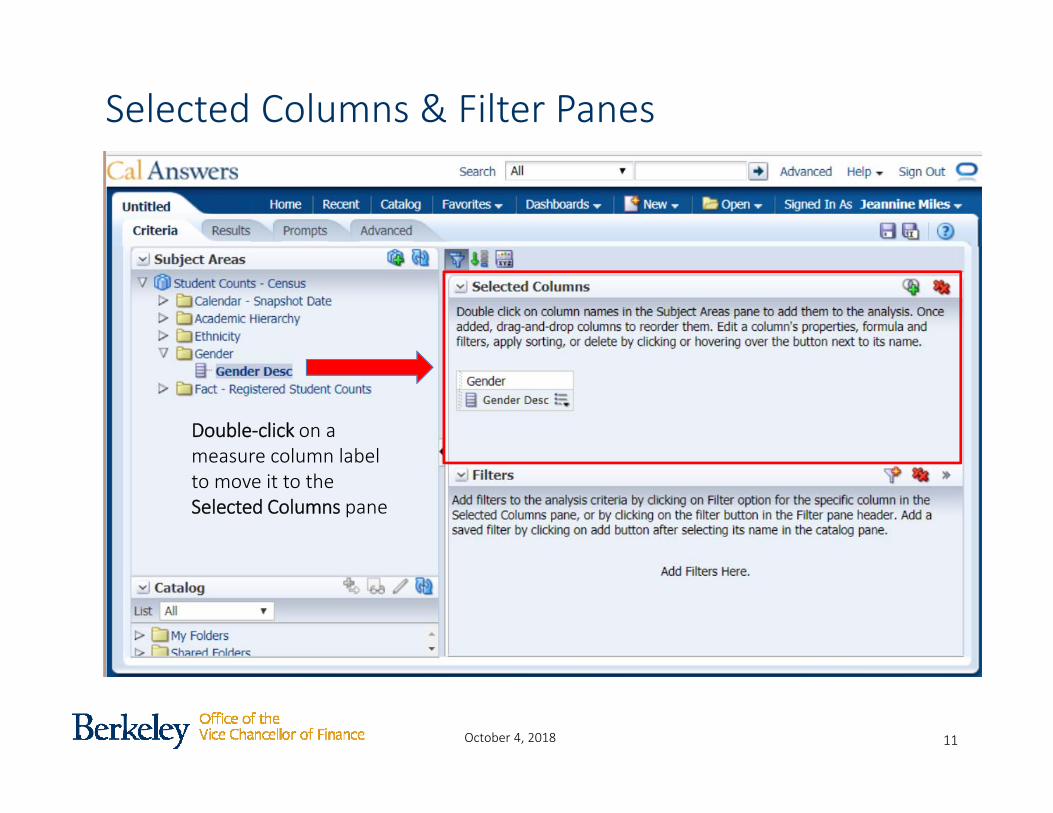
Double‐click on a measure column label to move it to theSelected Columns pane
October 4, 2018 9
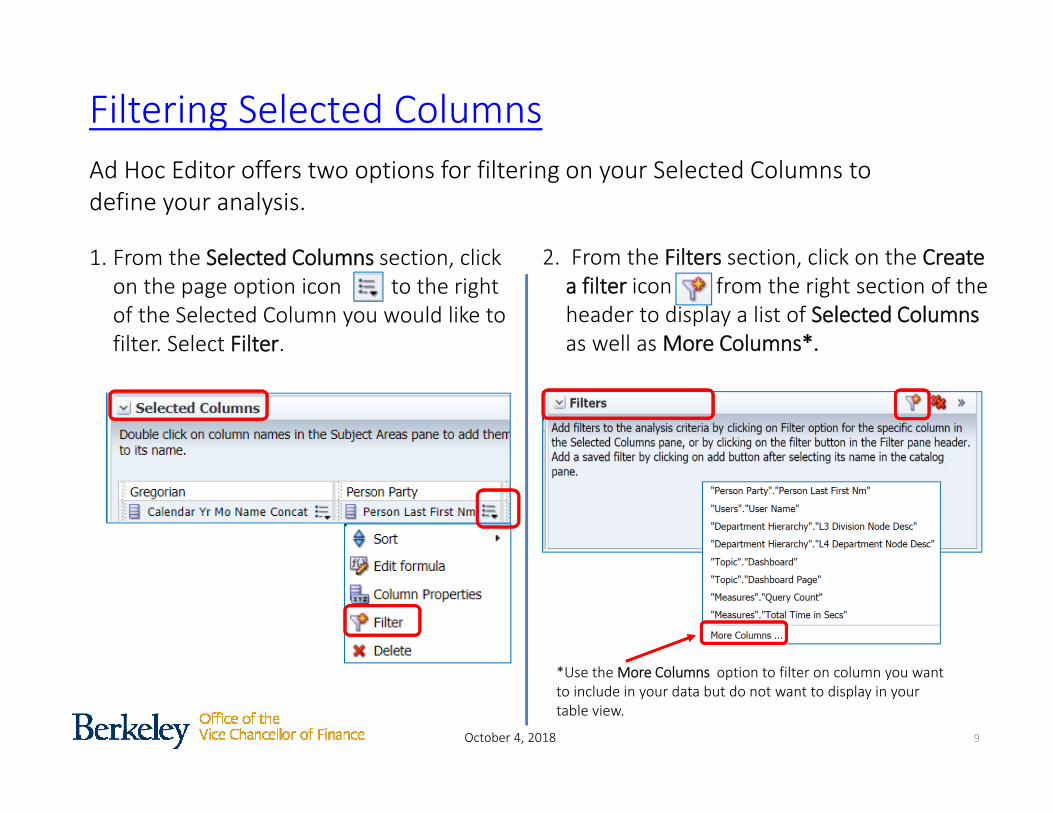
Filtering Selected Columns Ad Hoc Editor offers two options for filtering on your Selected Columns to define your analysis.
1. From the Selected Columns section, click on the page option icon to the right of the Selected Column you would like to filter. Select Filter.
2. From the Filters section, click on the Create a filter icon from the right section of the header to display a list of Selected Columns as well as More Columns*.
*Use the More Columns option to filter on column you want to include in your data but do not want to display in your table view.

October 4, 2018
Filtering OperatorsBoth of the two Filter options open to the Operator dropdown box. Choose from one of 20 different operators to apply to this field, the default being is equal to / is in.
13
October 4, 2018
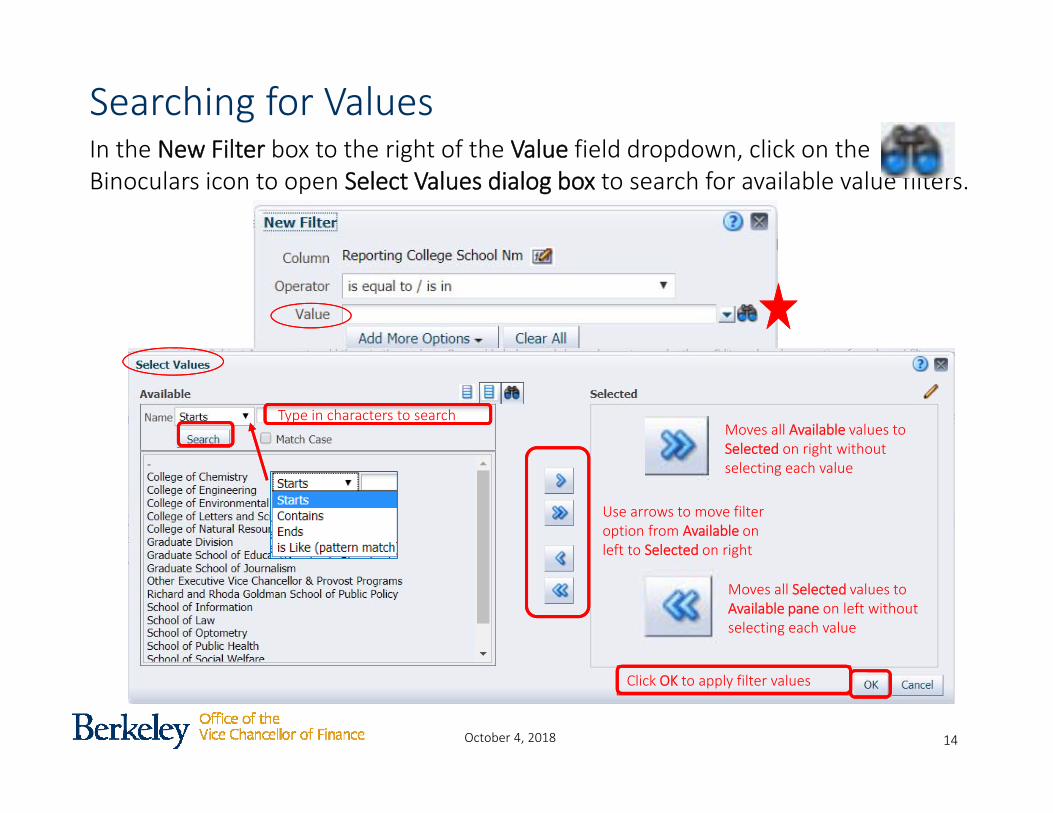
Searching for ValuesIn the New Filter box to the right of the Value field dropdown, click on the Binoculars icon to open Select Values dialog box to search for available value filters.
Type in characters to search
Use arrows to move filter option from Available on left to Selected on right
Click OK to apply filter values
14
Moves all Available values to Selected on right without selecting each value
Moves all Selected values to Available pane on left without selecting each value
October 4, 2018 12
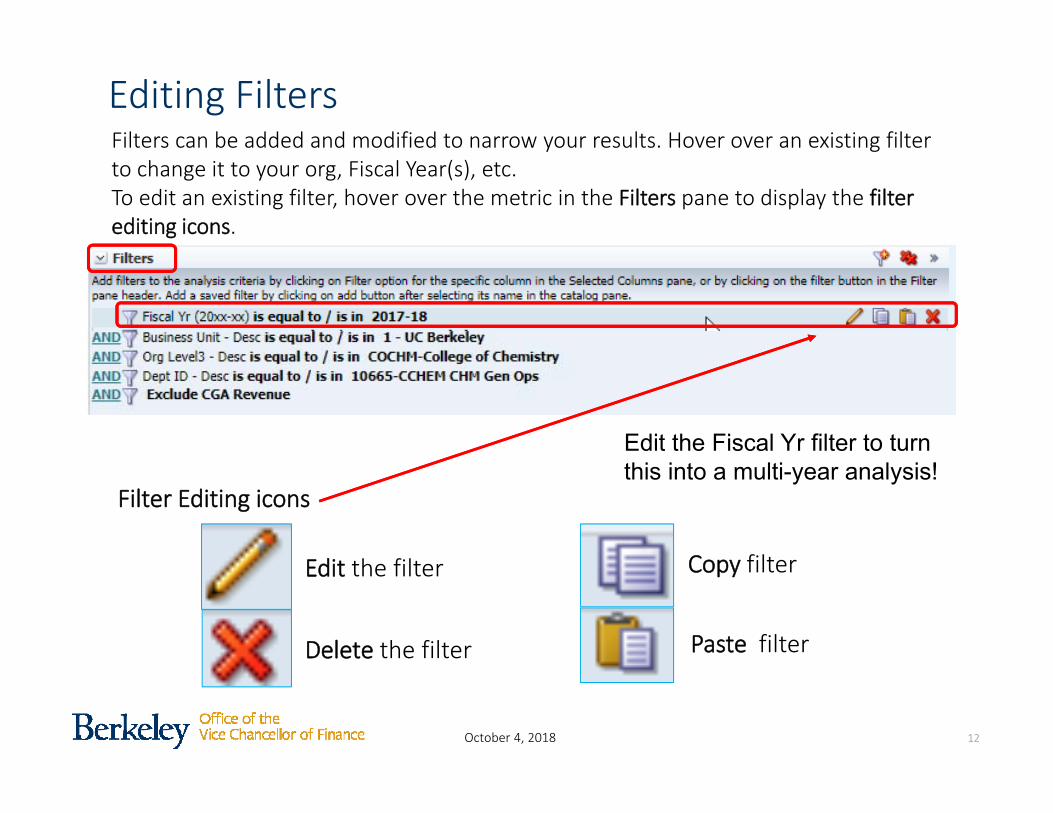
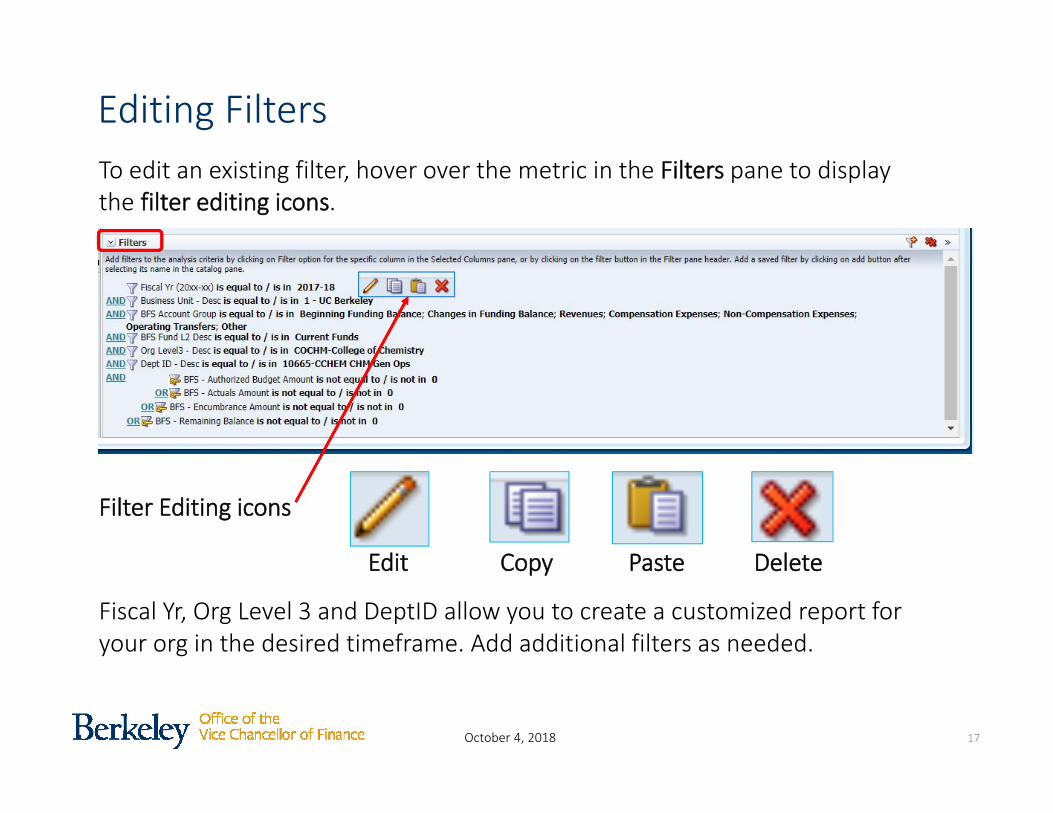
Editing FiltersFilters can be added and modified to narrow your results. Hover over an existing filter to change it to your org, Fiscal Year(s), etc.To edit an existing filter, hover over the metric in the Filters pane to display the filter editing icons.
Edit the filter
Delete the filter Paste filter
Copy filter
Filter Editing icons
Edit the Fiscal Yr filter to turn this into a multi-year analysis!
October 4, 2018
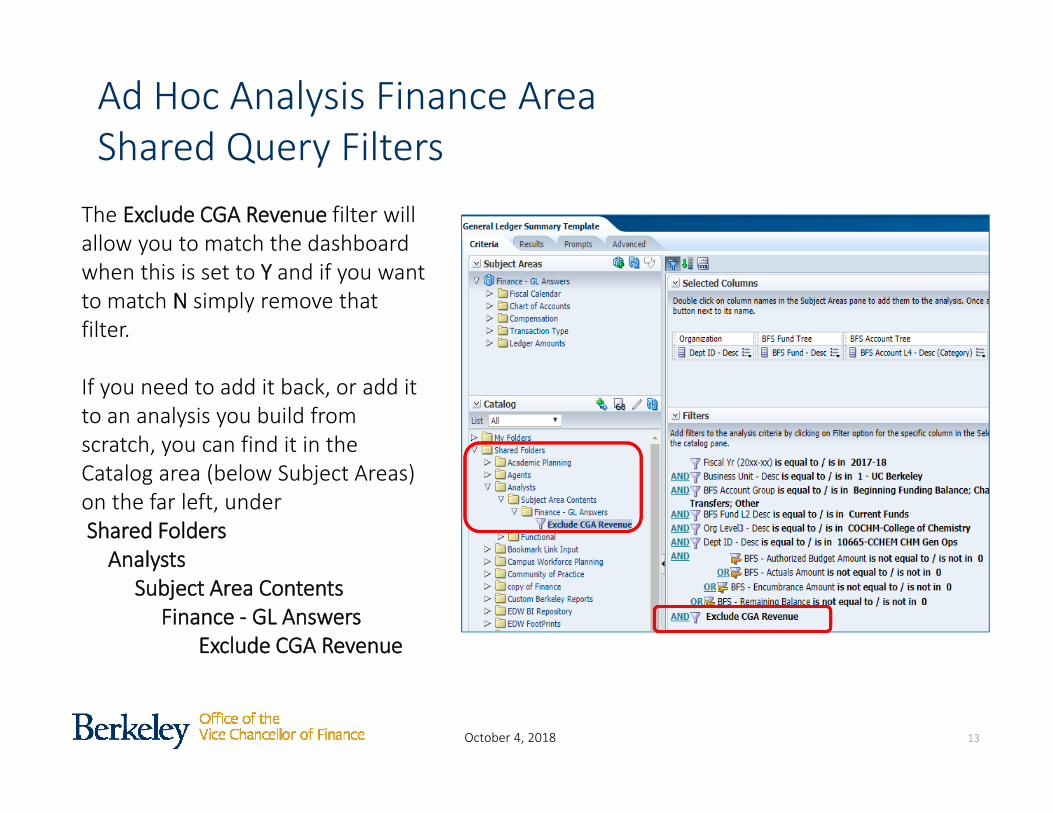
Ad Hoc Analysis Finance AreaShared Query Filters
13
The Exclude CGA Revenue filter will allow you to match the dashboard when this is set to Y and if you want to match N simply remove that filter.
If you need to add it back, or add it to an analysis you build from scratch, you can find it in the Catalog area (below Subject Areas) on the far left, underShared FoldersAnalysts
Subject Area ContentsFinance ‐ GL Answers
Exclude CGA Revenue
October 4, 2018 14
Modifying Ad Hoc Analysis Templates
October 4, 2018 15
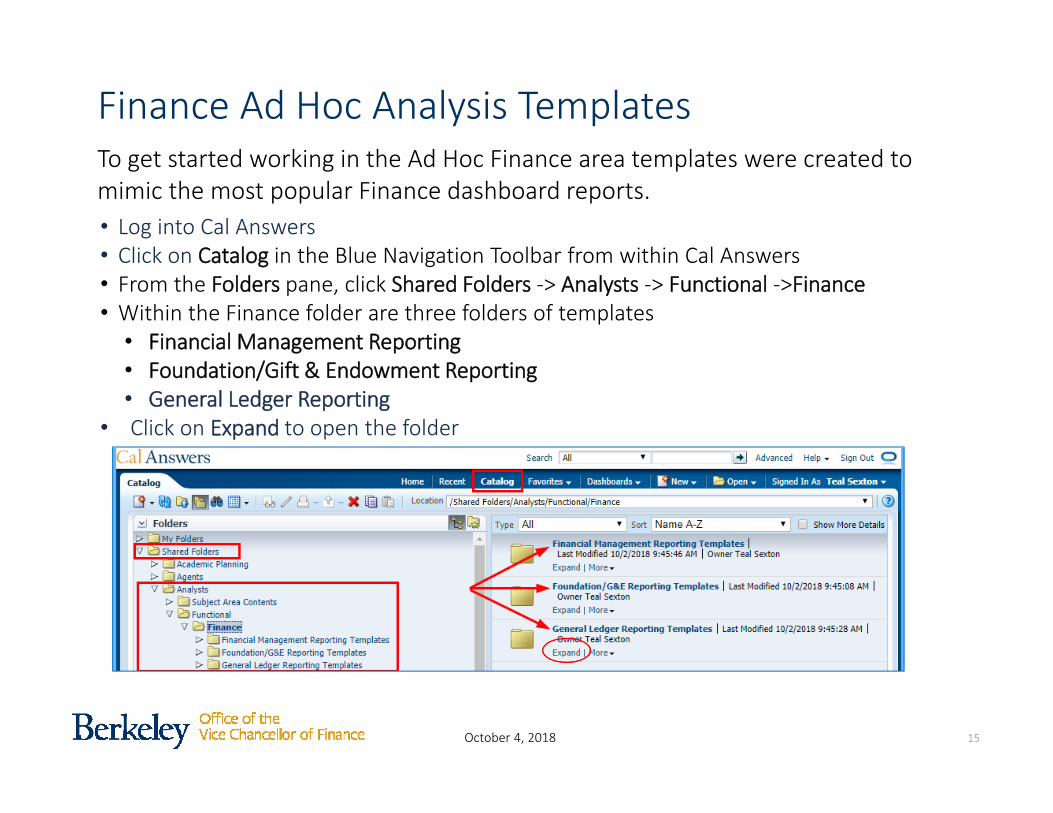
To get started working in the Ad Hoc Finance area templates were created to mimic the most popular Finance dashboard reports.
Finance Ad Hoc Analysis Templates
• Log into Cal Answers• Click on Catalog in the Blue Navigation Toolbar from within Cal Answers • From the Folders pane, click Shared Folders ‐> Analysts ‐> Functional ‐>Finance• Within the Finance folder are three folders of templates
• Financial Management Reporting• Foundation/Gift & Endowment Reporting• General Ledger Reporting
• Click on Expand to open the folder
October 4, 2018 16
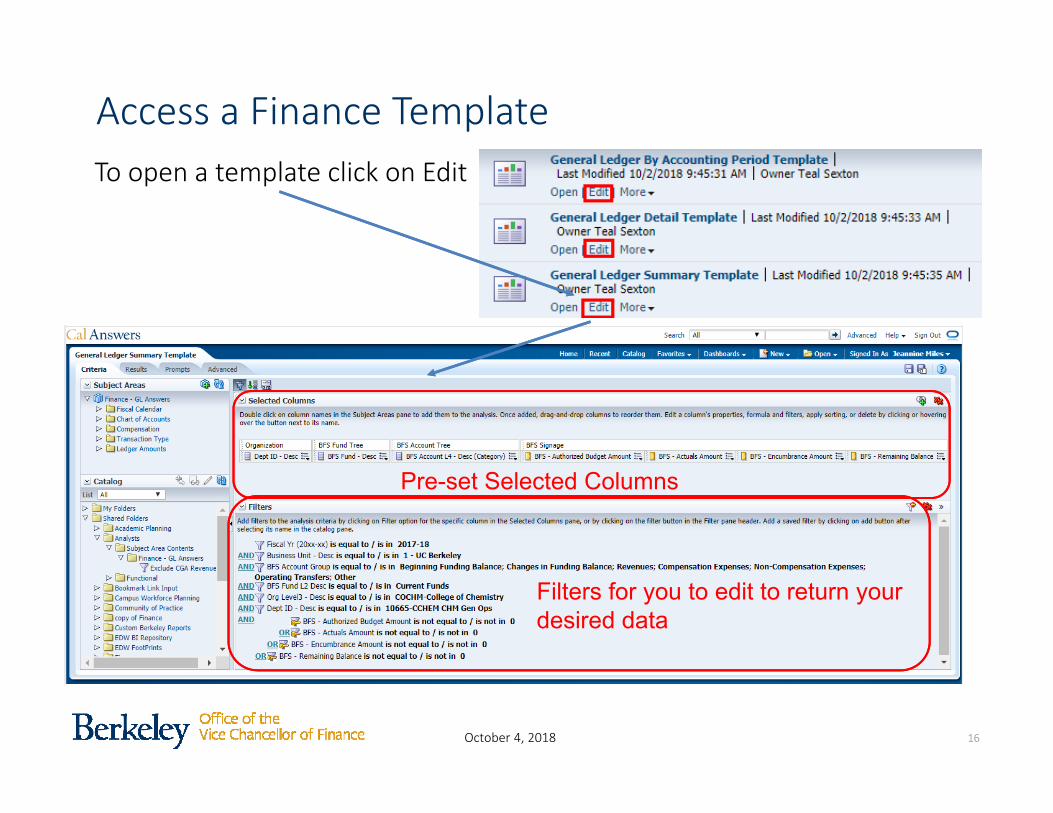
To open a template click on Edit
Access a Finance Template
Pre-set Selected Columns
Filters for you to edit to return your desired data
October 4, 2018 17
Editing FiltersTo edit an existing filter, hover over the metric in the Filters pane to display the filter editing icons.
Edit DeletePasteCopy
Filter Editing icons
Fiscal Yr, Org Level 3 and DeptID allow you to create a customized report for your org in the desired timeframe. Add additional filters as needed.
October 4, 2018 18
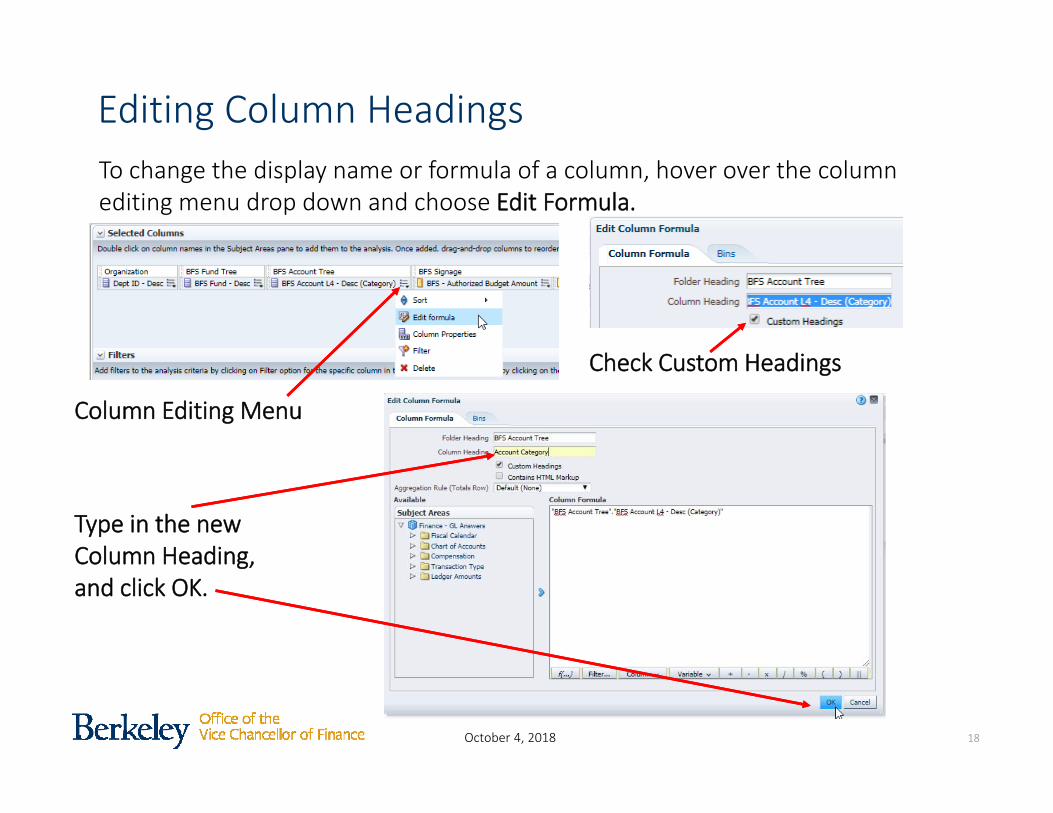
Editing Column HeadingsTo change the display name or formula of a column, hover over the column editing menu drop down and choose Edit Formula.
Check Custom Headings
Type in the new Column Heading, and click OK.
Column Editing Menu
October 4, 2018 19
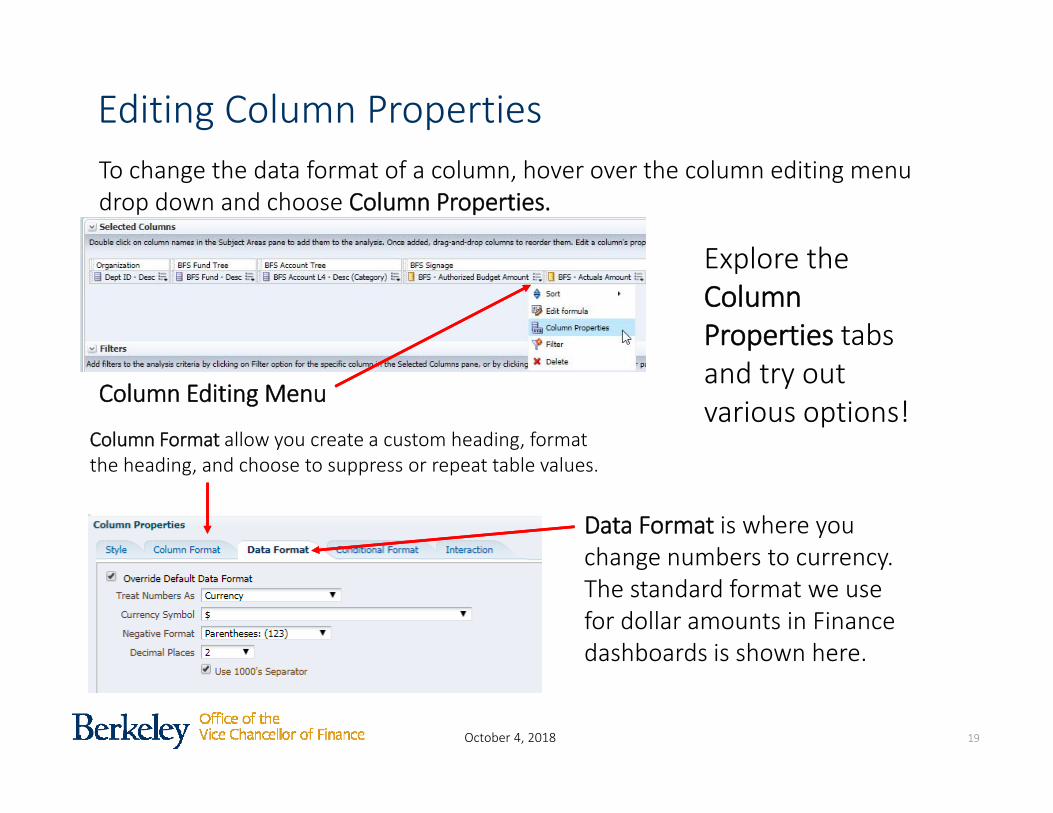
Editing Column PropertiesTo change the data format of a column, hover over the column editing menu drop down and choose Column Properties.
Data Format is where you change numbers to currency. The standard format we use for dollar amounts in Finance dashboards is shown here.
Column Format allow you create a custom heading, format the heading, and choose to suppress or repeat table values.
Column Editing Menu
Explore the Column Properties tabs and try out various options!
October 4, 2018 20
Results Tab
October 4, 2018 21
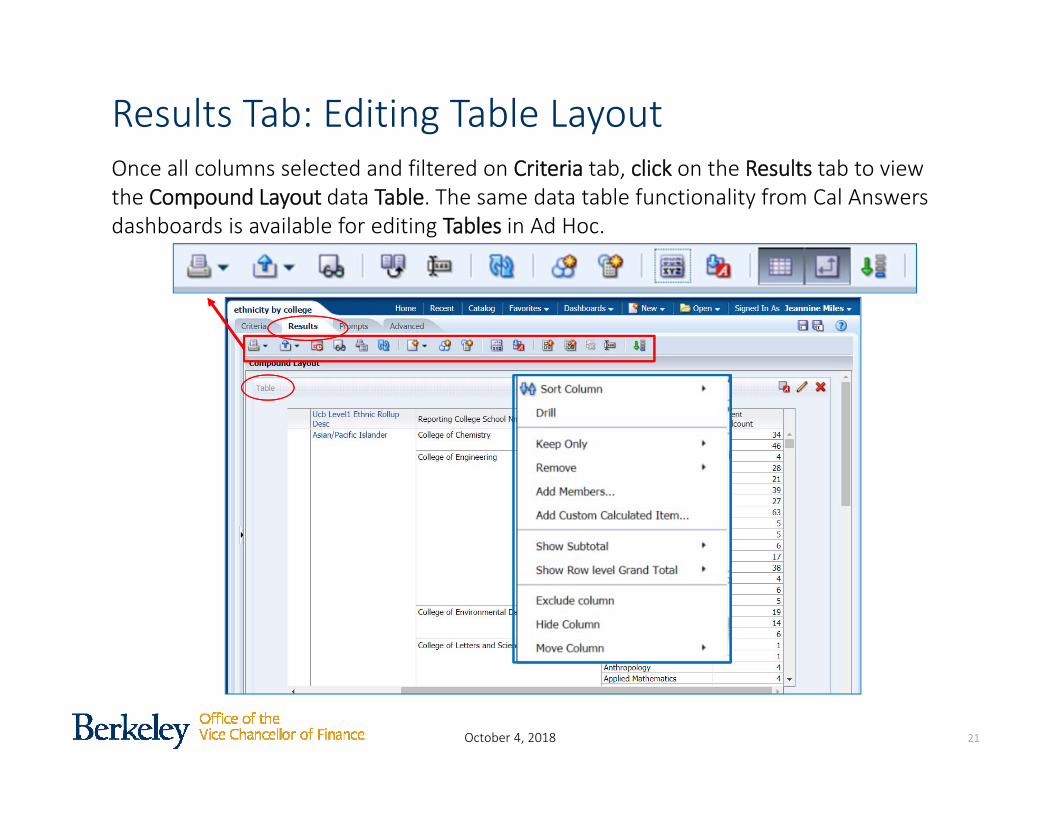
Results Tab: Editing Table LayoutOnce all columns selected and filtered on Criteria tab, click on the Results tab to view the Compound Layout data Table. The same data table functionality from Cal Answers dashboards is available for editing Tables in Ad Hoc.
October 4, 2018 22
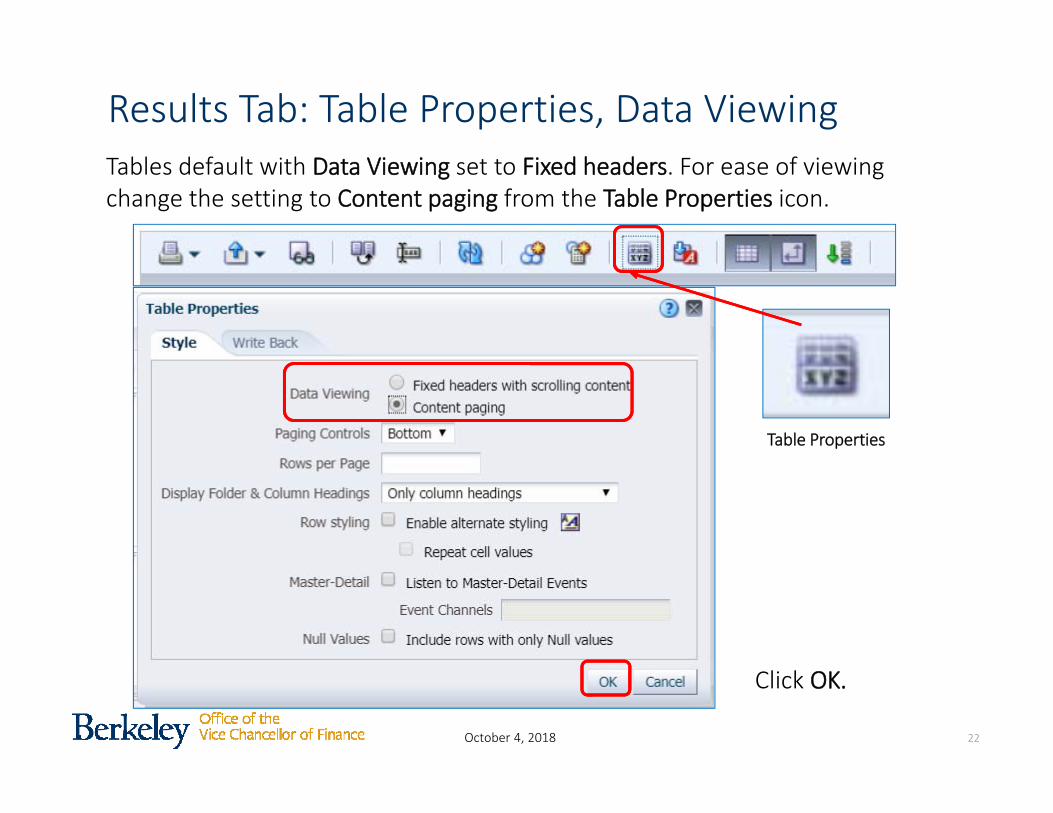
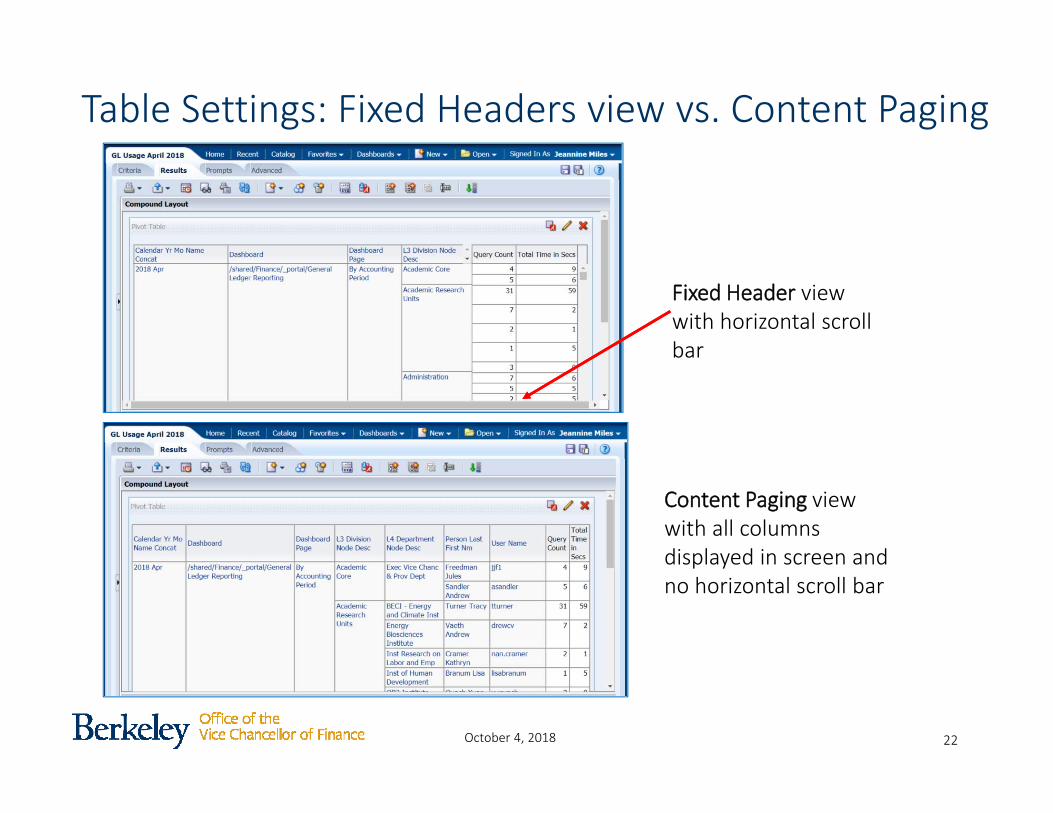
Results Tab: Table Properties, Data ViewingTables default with Data Viewing set to Fixed headers. For ease of viewing change the setting to Content paging from the Table Properties icon.
Table Properties
Click OK.
October 4, 2018 23
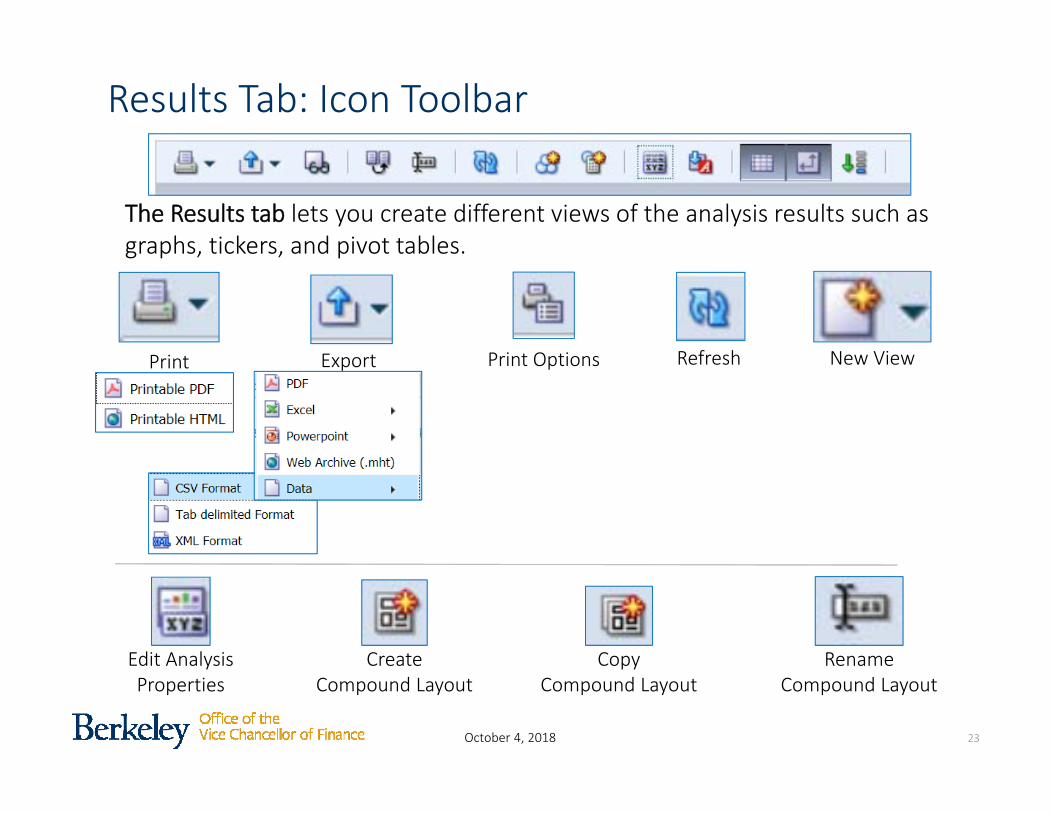
The Results tab lets you create different views of the analysis results such as graphs, tickers, and pivot tables.
Results Tab: Icon Toolbar
Print Export Print Options Refresh New View
Edit Analysis Properties
Copy Compound Layout
Create Compound Layout
Rename Compound Layout
October 4, 2018 24
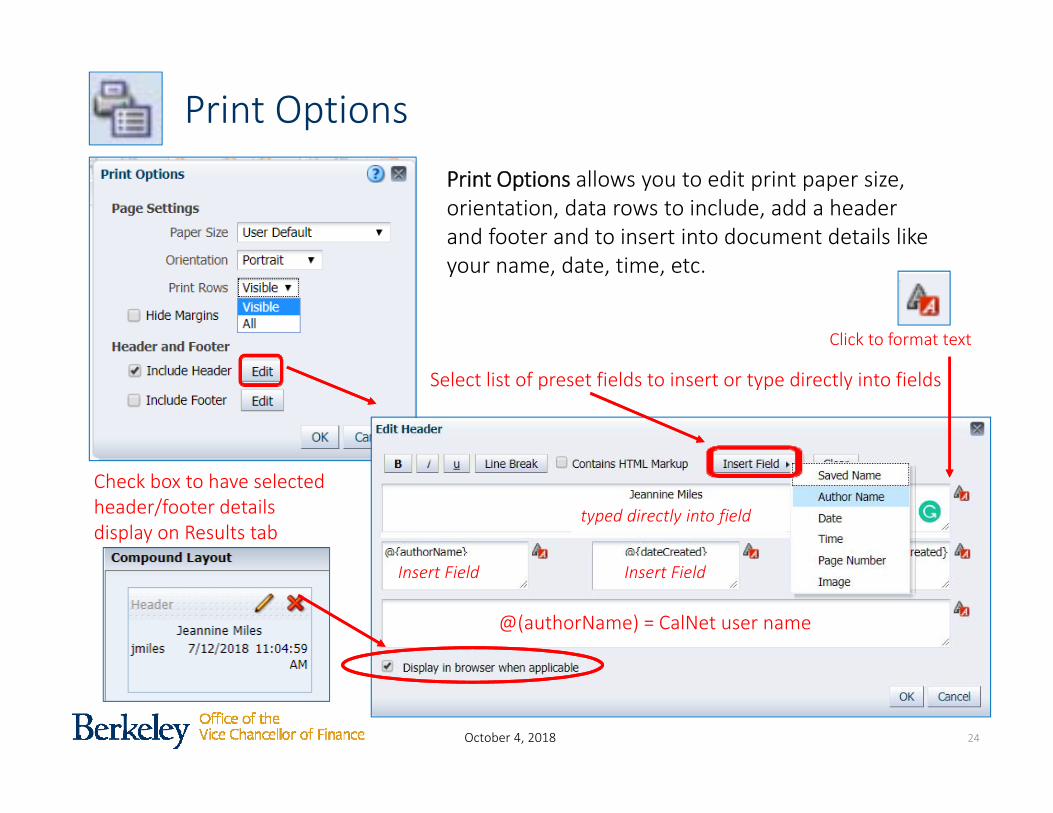
Print OptionsPrint Options allows you to edit print paper size, orientation, data rows to include, add a header and footer and to insert into document details like your name, date, time, etc.
Select list of preset fields to insert or type directly into fields
Click to format text
@(authorName) = CalNet user name
Check box to have selected header/footer details display on Results tab
typed directly into field
Insert Field Insert Field
October 4, 2018 25
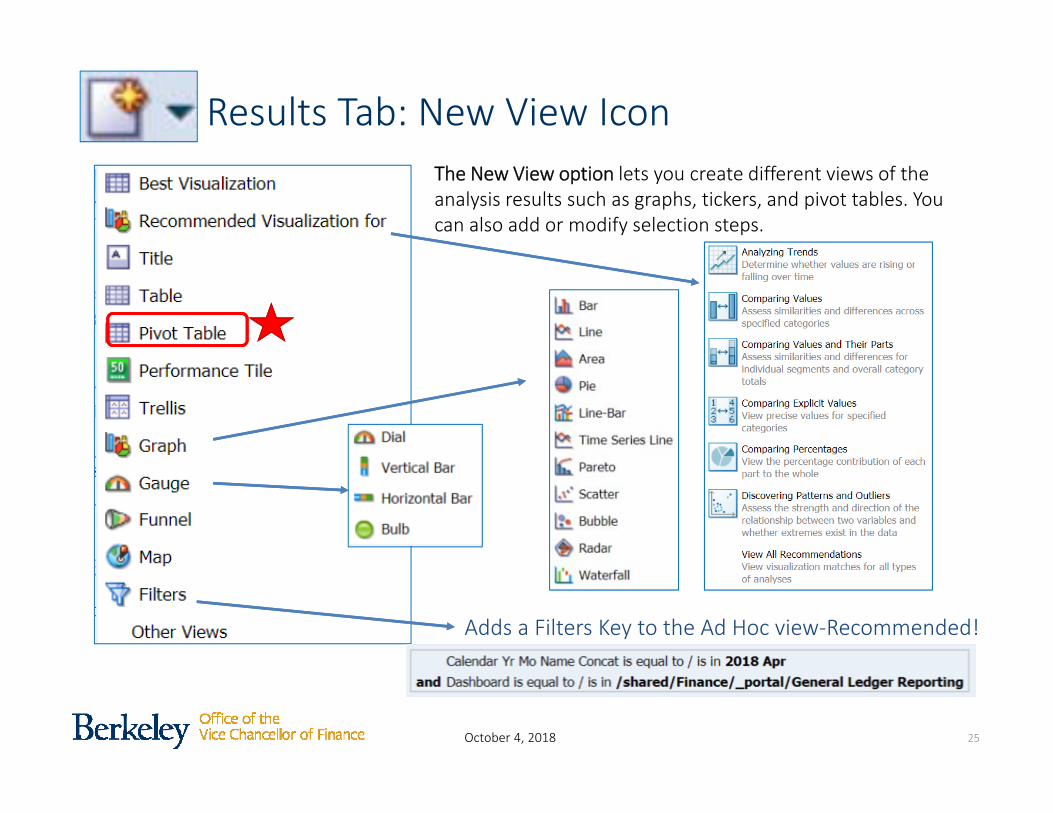
The New View option lets you create different views of the analysis results such as graphs, tickers, and pivot tables. You can also add or modify selection steps.
Results Tab: New View Icon
Adds a Filters Key to the Ad Hoc view‐Recommended!
October 4, 2018 26
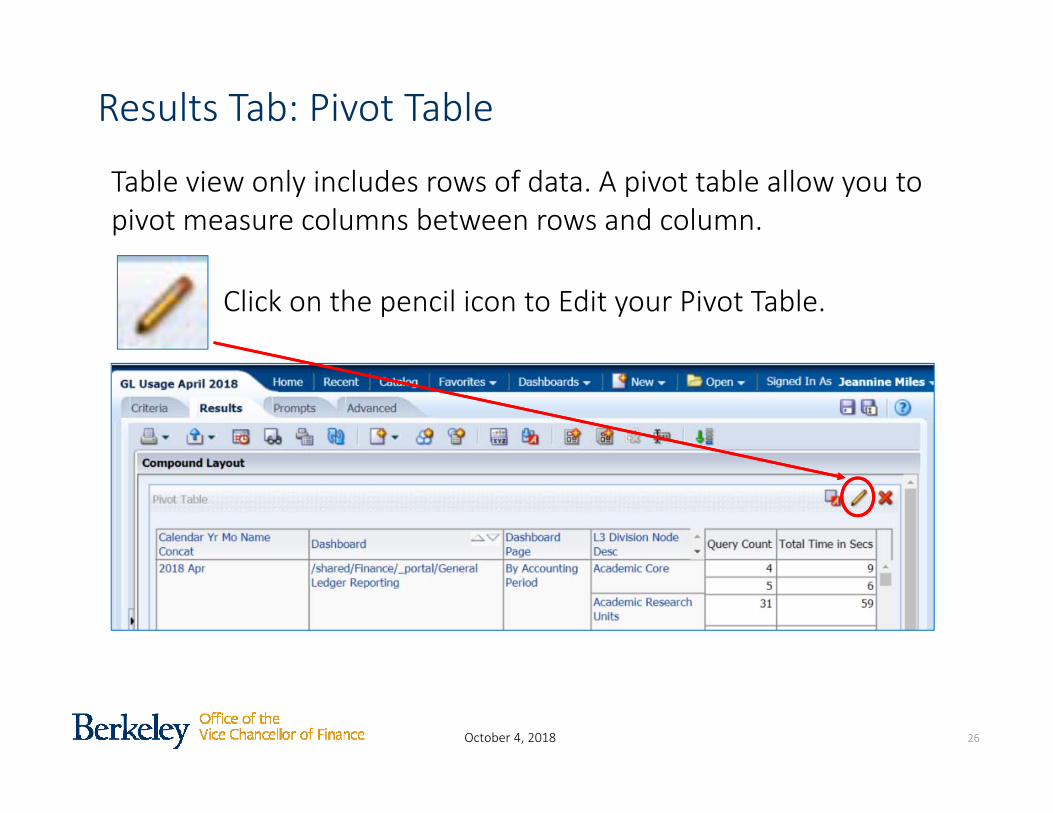
Results Tab: Pivot Table
Table view only includes rows of data. A pivot table allow you to pivot measure columns between rows and column.
Click on the pencil icon to Edit your Pivot Table.
October 4, 2018 27
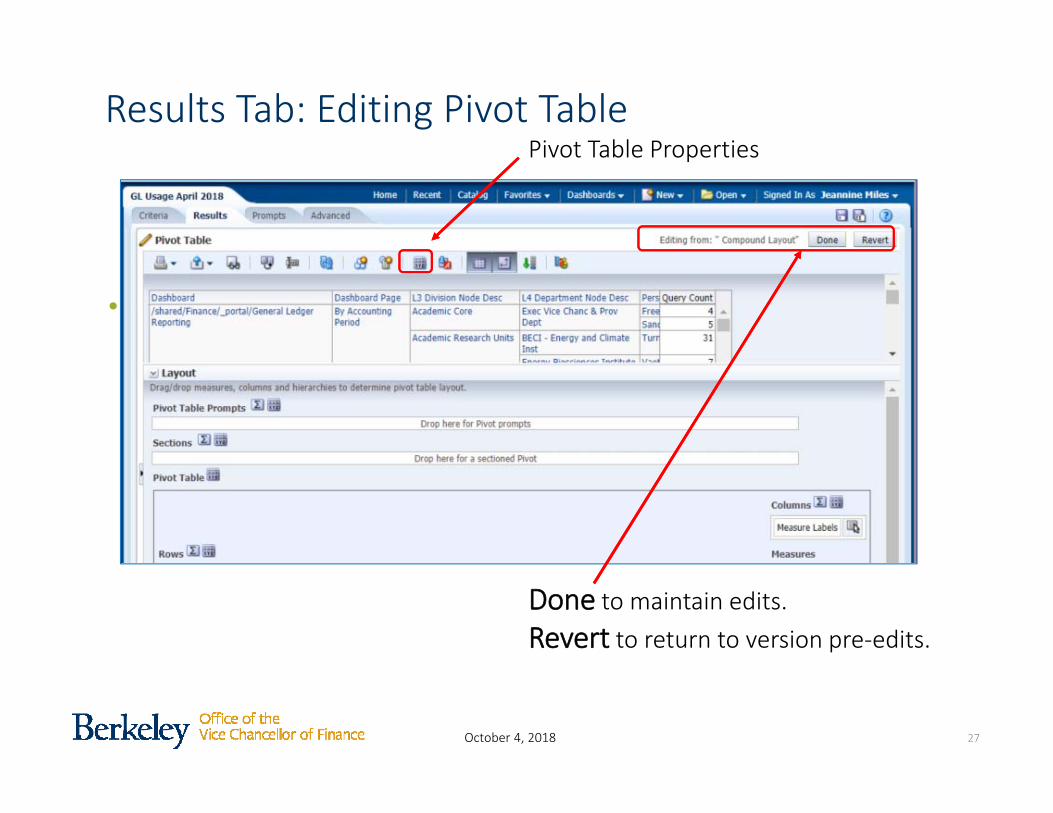
•
Results Tab: Editing Pivot TablePivot Table Properties
Done to maintain edits.Revert to return to version pre‐edits.
October 4, 2018
Table Settings: Fixed Headers view vs. Content Paging
Fixed Header view with horizontal scroll bar
Content Paging view with all columns displayed in screen and no horizontal scroll bar
22
October 4, 2018
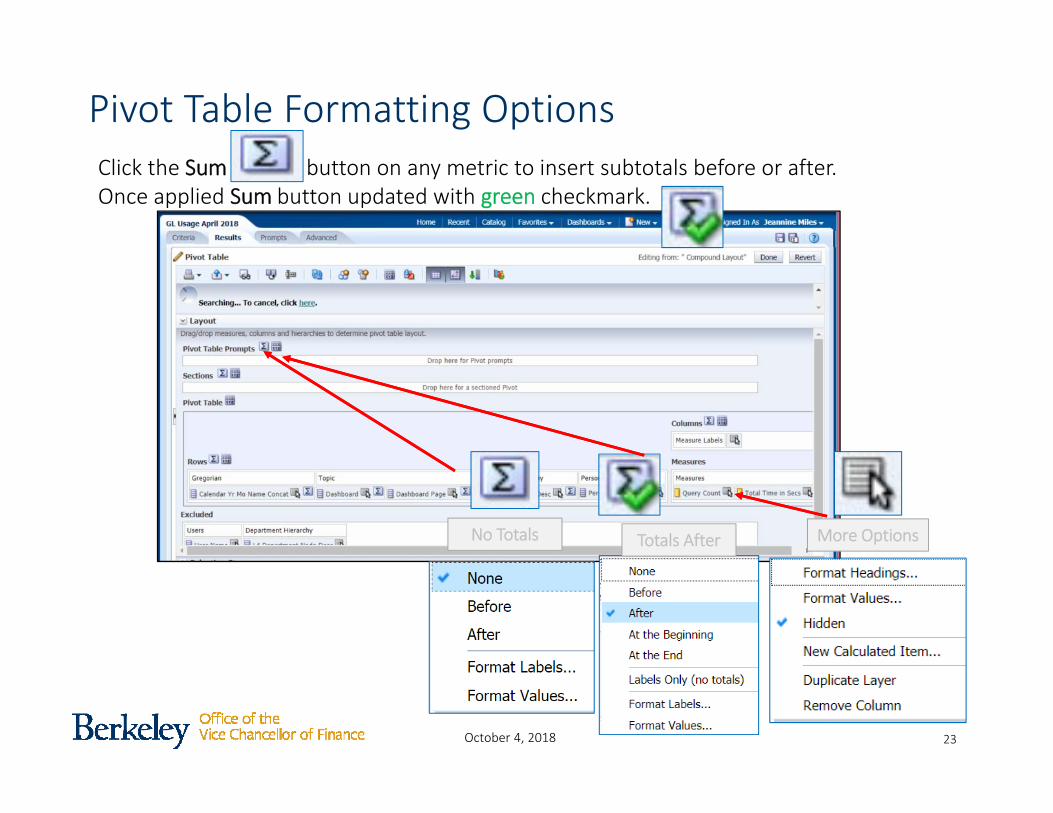
Pivot Table Formatting Options
No Totals More OptionsTotals After
Click the Sum button on any metric to insert subtotals before or after. Once applied Sum button updated with green checkmark.
23
October 4, 2018
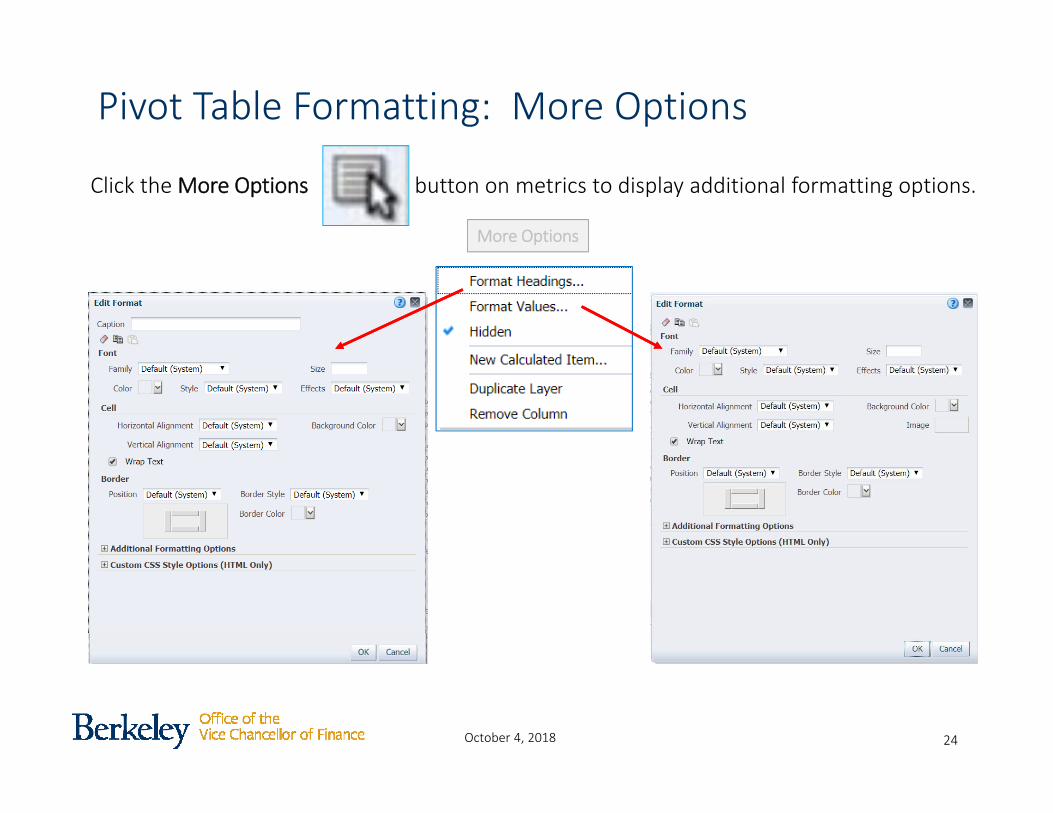
Pivot Table Formatting: More Options
More Options
24
Click the More Options button on metrics to display additional formatting options.
October 4, 2018
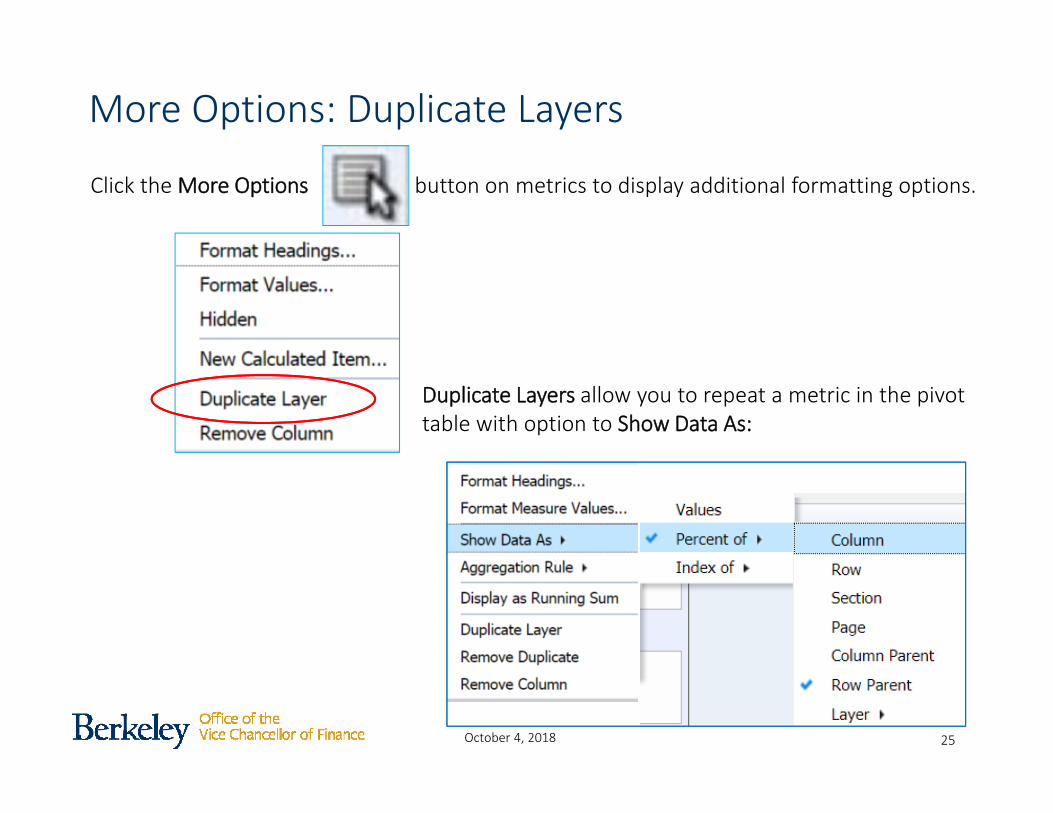
More Options: Duplicate Layers
Click the More Options button on metrics to display additional formatting options.
Duplicate Layers allow you to repeat a metric in the pivot table with option to Show Data As:
25

October 4, 2018 32
Saving and Opening an Ad Hoc Analysis
October 4, 2018 33
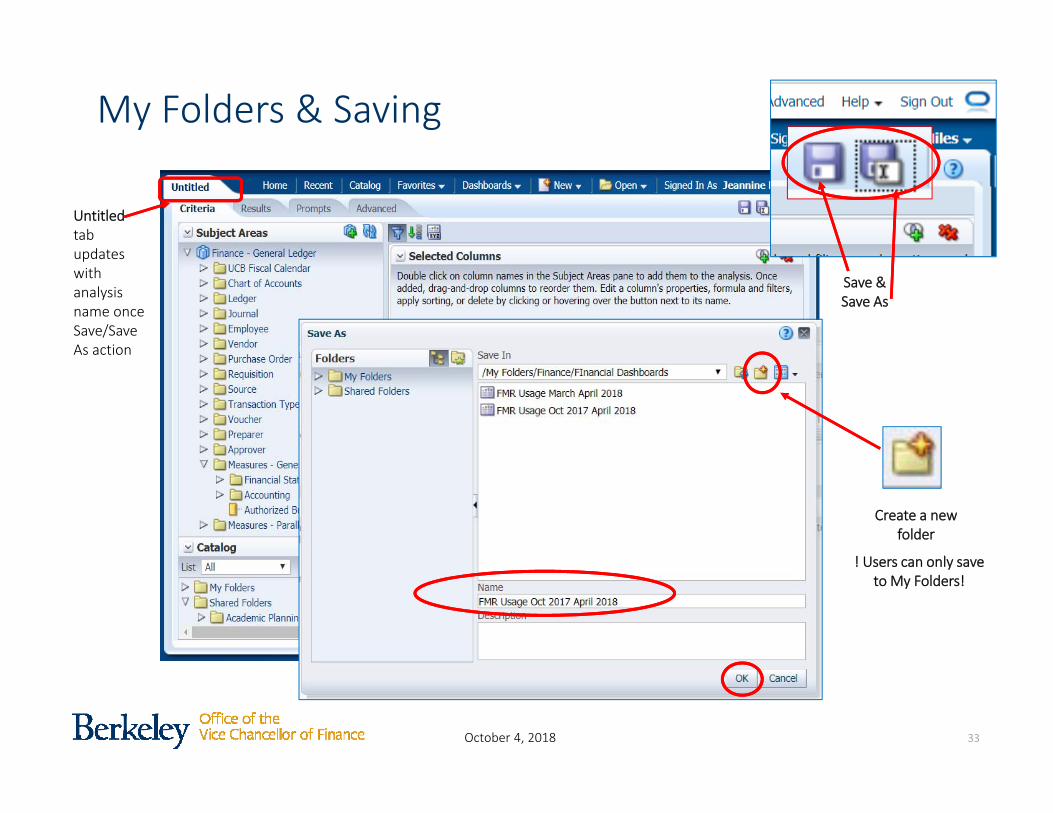
My Folders & Saving
Save & Save As
Create a new folder
! Users can only save to My Folders!
Untitledtab updates with analysis name once Save/Save As action
October 4, 2018 34
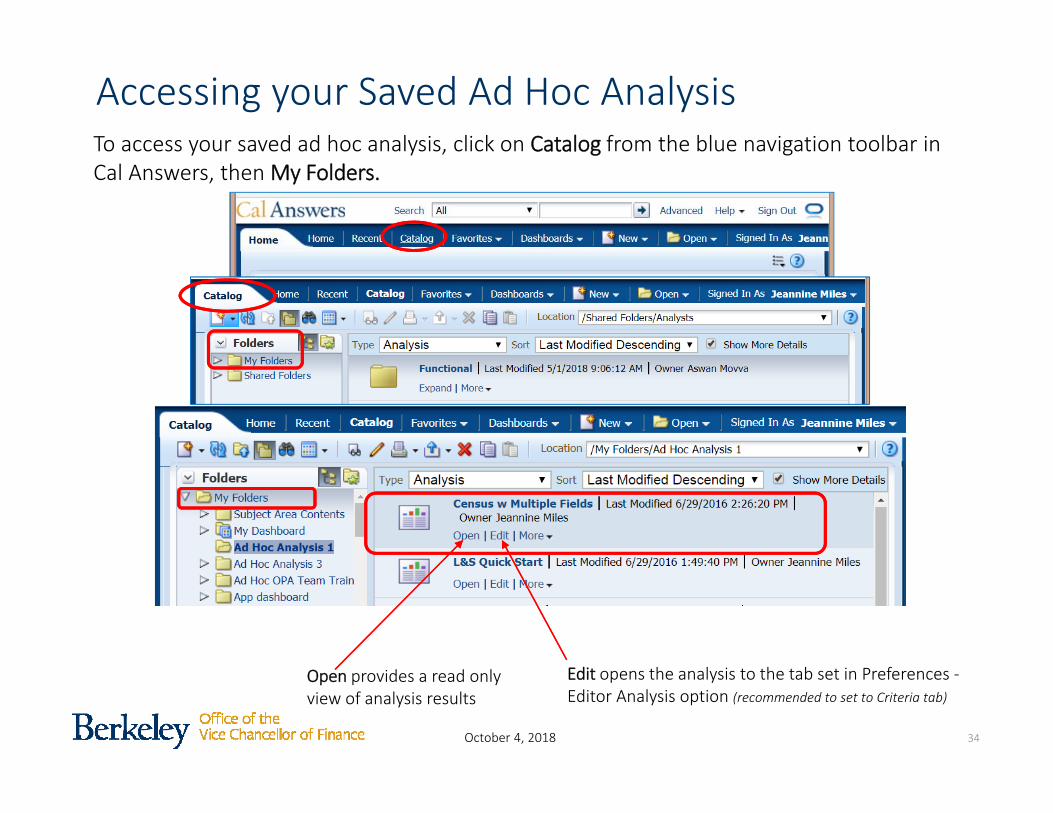
Accessing your Saved Ad Hoc AnalysisTo access your saved ad hoc analysis, click on Catalog from the blue navigation toolbar in Cal Answers, then My Folders.
Open provides a read only view of analysis results
Edit opens the analysis to the tab set in Preferences ‐Editor Analysis option (recommended to set to Criteria tab)
October 4, 2018 35
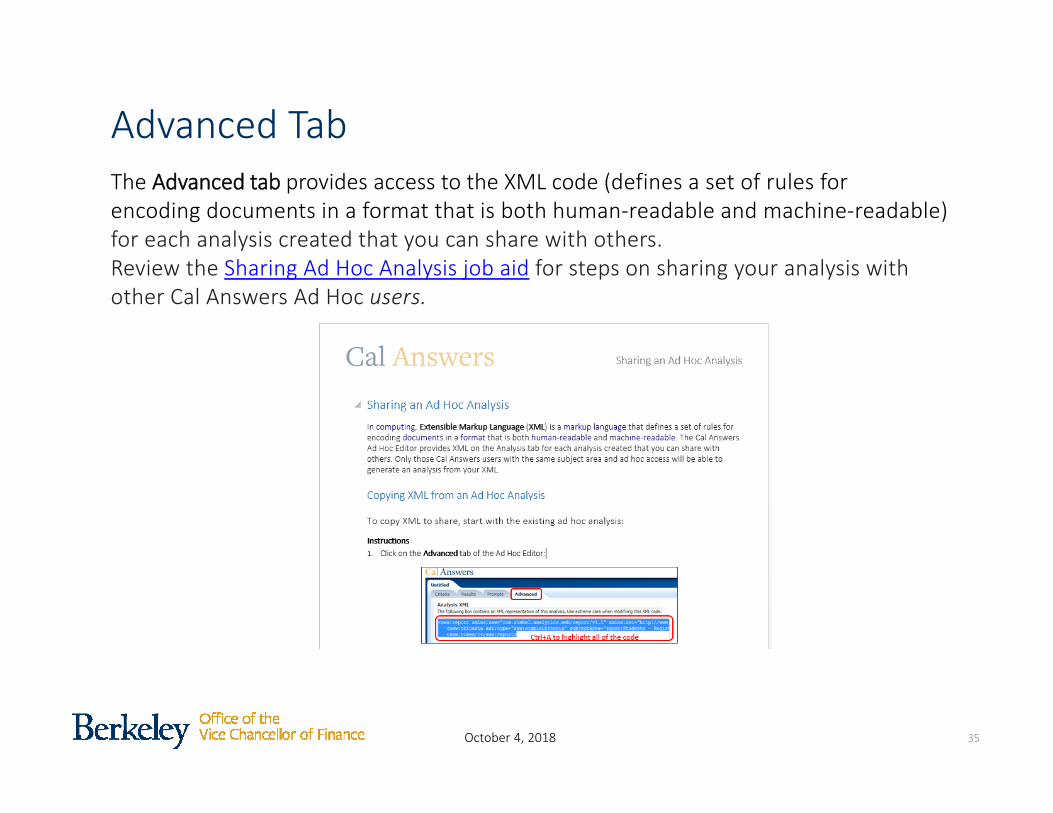
The Advanced tab provides access to the XML code (defines a set of rules for encoding documents in a format that is both human‐readable and machine‐readable)for each analysis created that you can share with others.Review the Sharing Ad Hoc Analysis job aid for steps on sharing your analysis with other Cal Answers Ad Hoc users.
Advanced Tab
October 4, 2018
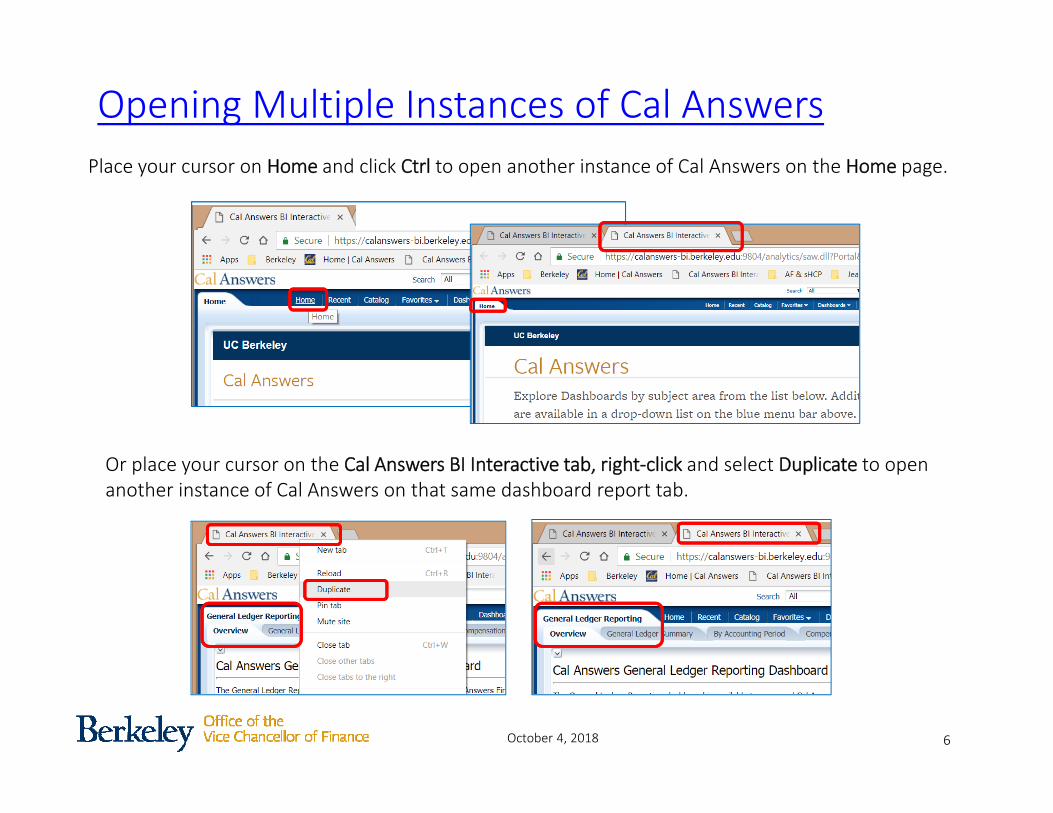
Opening Multiple Instances of Cal AnswersPlace your cursor on Home and click Ctrl to open another instance of Cal Answers on the Home page.
Or place your cursor on the Cal Answers BI Interactive tab, right‐click and select Duplicate to open another instance of Cal Answers on that same dashboard report tab.
6