Embed Size (px)
Citation preview

CAHOON COMMONS 644 & 648 GRASSFIELD PARKWAY :: CHESAPEAKE, VIRGINIA
CBRE | Hampton Roads150 West Main StreetSuite 1100Norfolk, VA 23510O +1 757 490 3300F +1 757 490 1200
m/cahoon
ANCHOR:WAL-MART SUPERCENTER
FOR MORE INFORMATION:
: : Chris Read Senior Vice President +1 757 228 1803 [email protected]
: : Ned Brooks Senior Vice President +1 757 228 1829 [email protected]

CAHOON COMMONS :: EXECUTIVE SUMMARY
PROPERTY DESCRIPTION: The property is a Walmart Supercenter anchored development in the Great Bridge retail
submarket of Chesapeake, Virginia. Retailer opportunities include both shops and
outparcels. The location is in close proximity to Tidewater Community College and
ADDRESS:
CENTER SIZE:
Total: 278,023 sq. ft.
SHOPS AVAILABILITY: Maximum Contiguous: availability and dimensions.)
LEASE RATE:
ADDITIONAL CHARGES:
•
•
•Tax: $.98
YEAR CONSTRUCTED:
OUTPARCEL AVAILABILITY:
ANCHORS: Wal-Mart Supercenter
CO-TENANTS:
OUTPARCELS:
ZONING:
INGRESS/EGRESS:
TRAFFIC COUNTS:
•
•
Demographics (2015) 1-Mile 3-Miles 5-Miles
Population 3,060 37,359 99,072
Average Household Income $109,486 $104,519 $88,401
Daytime Population 1,889 6,419 50,197
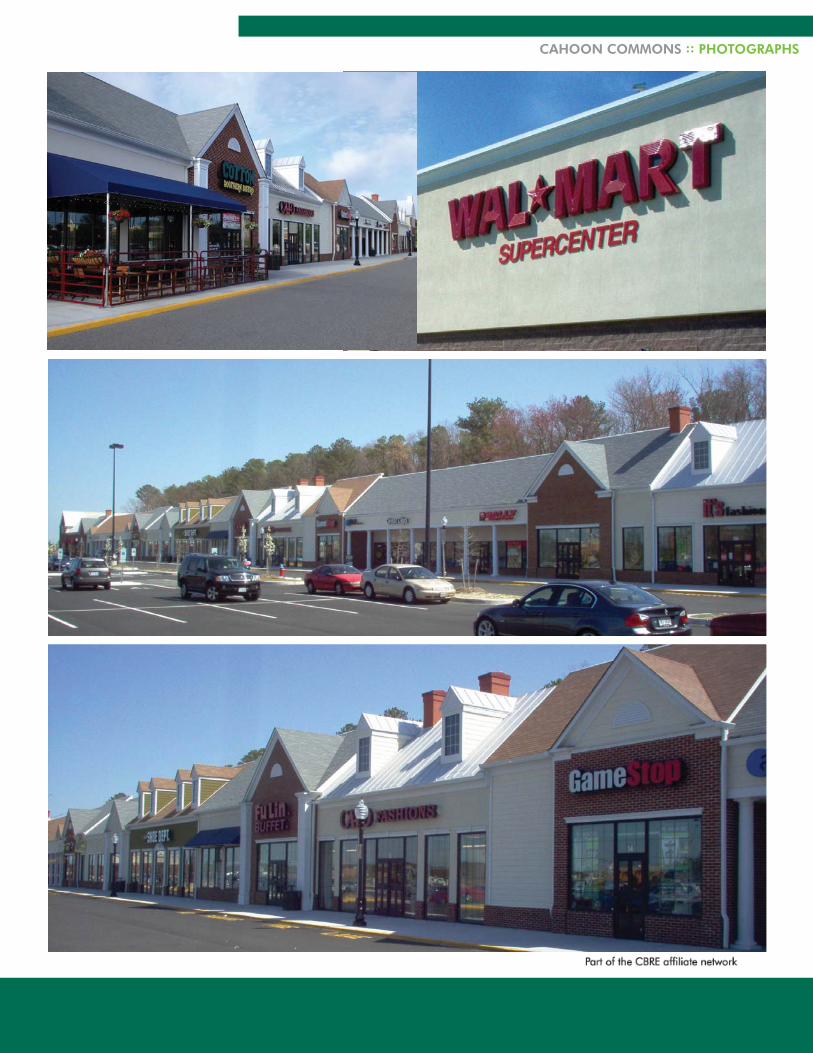
CAHOON COMMONS :: PHOTOGRAPHS

CAHOON COMMONS :: SITE PLAN
648 GRASSFIELD PARKWAY, CHESAPEAKE, VA 23322
Unit Tenant Sq. Ft. Dem.1A
-1EBon Secours 6,876
3 AVAILABLE 3,204 (32’ x 99’)
4 AVAILABLE 2,151 (27’ x 79’)
5 Mike’s Italian Ice 1,593 (20’ x 79‘)
6 FORMER RESTAURANT 1,600 (20’ x 79’)
7 AVAILABLE 1,600 (20’ x 79’)
8 AVAILABLE 1,583 (20’ x 79’)
9 Tropical Smoothie 2,251 (25’ x 89’)
10 AVAILABLE 4,493 (45’ x 99’)
11 The Shoe Dept. 4,791 (48’ x 99’)
12 FORMER RESTAURANT 4,893 (49’ x 99’)
13 Cato 3,894 (39’ x 99’)
14 GameStop 2,505 (25’ x 99’)
15 Verizon 1,580 (20’ x 78’)
16 AVAILABLE 1,580 (20’ x 78’)
17 Liberty Tax 1,587 (19’ x 78’)
18 Sally Beauty 1,573 (19’ x 78’)
19 AVAILABLE 2,702 (30’ x 89’)
20A VA ABC Store 3,164 (32’ x 99’)
20B AVAILABLE 3,810 (38’ x 99’)
644 GRASSFIELD PARKWAY, CHESAPEAKE, VA 23322
Unit Tenant Sq. Ft. Dem.21 AVAILABLE 2,673 (33’ x 79’)
22 AVAILABLE 3,173 (40’ x 79’)
23 Tae Kwon Do 2,500 (31’ x 79’)
24 AVAILABLE 1,580 (19’ x 79’)
25 AVAILABLE 1,820 (23’ x 79’)
26 Finest Nails 1,600 (20’ x 79’)
27 Allstate Insurance 1,600 (20’ x 79’)
28 Long and Foster 2,647 (32’ x 79’)
OUTPARCEL AVAILABILITY
# Location SizeB1 Dominion Bvld 1.38-acres
B4 Grass eld Pky 1.38-acres
A
ALL
STA
TE
6
12
12
GAME STOP
16
VA ABC

CAHOON COMMONS :: AERIAL VIEW
1.38 acres
1.38 acres

CAHOON COMMONS :: AERIAL VIEW

CAHOON COMMONS :: AERIAL VIEW

CAHOON COMMONS :: AERIAL VIEW

CAHOON COMMONS :: AERIAL VIEW

CAHOON COMMONS :: VIRGINIA MAP

CAHOON COMMONS :: AREA MAP
Copyright © 1988-2005 Microsoft Corp. and/or its suppliers. All rights reserved. http://www.microsoft.com/streets/© 2004 NAVTEQ. All rights reserved. This data includes information taken with permission from Canadian authorities © Her Majesty the Queen in Right of Canada. © Copyright 2004 by TeleAtlas North America, Inc. All rights reserved.
0 mi 2 4 6 8 10 12 14

CAHOON COMMONS :: SITE MAP
Copyright © 1988-2005 Microsoft Corp. and/or its suppliers. All rights reserved. http://www.microsoft.com/streets/© 2004 NAVTEQ. All rights reserved. This data includes information taken with permission from Canadian authorities © Her Majesty the Queen in Right of Canada. © Copyright 2004 by TeleAtlas North America, Inc. All rights reserved.
0 mi 0.5 1 1.5

CAHOON COMMONS :: DEMOGRAPHICS
-
644 Grassfield Pkwy 1 mile radius
644 Grassfield Pkwy 3 mile radius
644 Grassfield Pkwy 5 mile radius
2015 Estimated Population 3,060 37,359 99,0722020 Projected Population 3,392 40,354 105,6652010 Census Population 2,676 34,033 92,1742000 Census Population 1,408 24,397 80,018
Growth 2010-2015 14.33% 9.77% 7.48%Growth 2015-2020 10.87% 8.02% 6.65%
2015 Estimated Median Age 38.90 37.35 37.152015 Estimated Average Age 37.16 36.84 37.49
2015 Estimated Households 993 12,256 35,3102020 Projected Households 1,088 13,176 37,6512010 Census Households 888 11,320 32,8852000 Census Households 459 8,077 28,010
Growth 2010-2015 11.79% 8.27% 7.38%Growth 2015-2020 9.65% 7.51% 6.63%
2015 Est. Average Household Size 3.08 2.96 2.75
2015 Est. Median Household Income $92,518 $89,802 $73,4362020 Prj. Median Household Income $98,508 $96,776 $78,9212000 Cen. Median Household Income $61,779 $59,044 $51,945
2015 Est. Average Household Income $109,486 $104,519 $88,4012015 Estimated Per Capita Income $35,521 $34,289 $31,507
2015 Estimated Housing Units 1,031 12,774 36,8132015 Estimated Occupied Units 993 12,256 35,3102015 Estimated Vacant Units 38 518 1,502
2015 Est. Owner Occupied Units 862 10,434 26,0442015 Est. Renter Occupied Units 130 1,822 9,267
2015 Est. Median Housing Value $310,296 $294,180 $259,4632015 Est. Average Housing Value $320,679 $308,040 $275,438
CAHOON COMMONS :: DEMOGRAPHICS
-
644 Grassfield Pkwy 1 mile radius
644 Grassfield Pkwy 3 mile radius
644 Grassfield Pkwy 5 mile radius
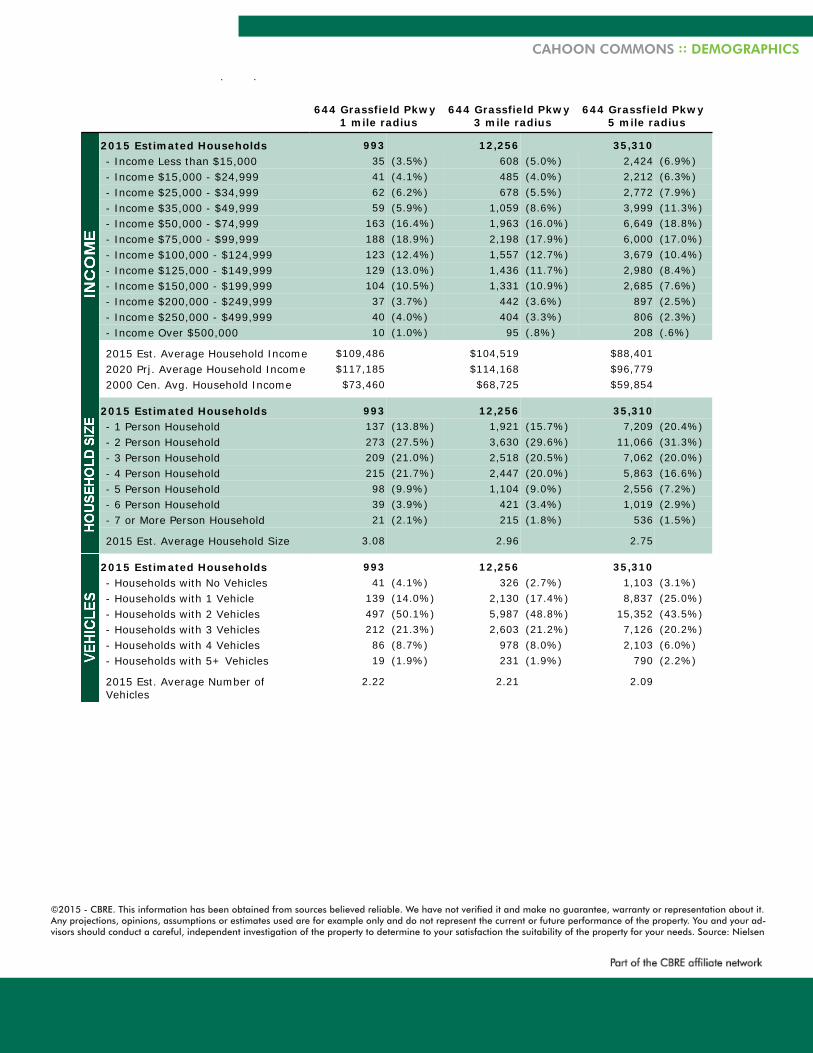
2015 Estimated Households 993 12,256 35,310- Income Less than $15,000 35 (3.5%) 608 (5.0%) 2,424 (6.9%)- Income $15,000 - $24,999 41 (4.1%) 485 (4.0%) 2,212 (6.3%)- Income $25,000 - $34,999 62 (6.2%) 678 (5.5%) 2,772 (7.9%)- Income $35,000 - $49,999 59 (5.9%) 1,059 (8.6%) 3,999 (11.3%)- Income $50,000 - $74,999 163 (16.4%) 1,963 (16.0%) 6,649 (18.8%)- Income $75,000 - $99,999 188 (18.9%) 2,198 (17.9%) 6,000 (17.0%)- Income $100,000 - $124,999 123 (12.4%) 1,557 (12.7%) 3,679 (10.4%)- Income $125,000 - $149,999 129 (13.0%) 1,436 (11.7%) 2,980 (8.4%)- Income $150,000 - $199,999 104 (10.5%) 1,331 (10.9%) 2,685 (7.6%)- Income $200,000 - $249,999 37 (3.7%) 442 (3.6%) 897 (2.5%)- Income $250,000 - $499,999 40 (4.0%) 404 (3.3%) 806 (2.3%)- Income Over $500,000 10 (1.0%) 95 (.8%) 208 (.6%)
2015 Est. Average Household Income $109,486 $104,519 $88,4012020 Prj. Average Household Income $117,185 $114,168 $96,7792000 Cen. Avg. Household Income $73,460 $68,725 $59,854
2015 Estimated Households 993 12,256 35,310- 1 Person Household 137 (13.8%) 1,921 (15.7%) 7,209 (20.4%)- 2 Person Household 273 (27.5%) 3,630 (29.6%) 11,066 (31.3%)- 3 Person Household 209 (21.0%) 2,518 (20.5%) 7,062 (20.0%)- 4 Person Household 215 (21.7%) 2,447 (20.0%) 5,863 (16.6%)- 5 Person Household 98 (9.9%) 1,104 (9.0%) 2,556 (7.2%)- 6 Person Household 39 (3.9%) 421 (3.4%) 1,019 (2.9%)- 7 or More Person Household 21 (2.1%) 215 (1.8%) 536 (1.5%)
2015 Est. Average Household Size 3.08 2.96 2.75
2015 Estimated Households 993 12,256 35,310- Households with No Vehicles 41 (4.1%) 326 (2.7%) 1,103 (3.1%)- Households with 1 Vehicle 139 (14.0%) 2,130 (17.4%) 8,837 (25.0%)- Households with 2 Vehicles 497 (50.1%) 5,987 (48.8%) 15,352 (43.5%)- Households with 3 Vehicles 212 (21.3%) 2,603 (21.2%) 7,126 (20.2%)- Households with 4 Vehicles 86 (8.7%) 978 (8.0%) 2,103 (6.0%)- Households with 5+ Vehicles 19 (1.9%) 231 (1.9%) 790 (2.2%)
2015 Est. Average Number of Vehicles
2.22 2.21 2.09
| p

CAHOON COMMONS :: DEMOGRAPHICS
-
644 Grassfield Pkwy 1 mile radius
644 Grassfield Pkwy 3 mile radius
644 Grassfield Pkwy 5 mile radius
2015 Estimated Population by Race and Origin
3,060 37,359 99,072
- White Population 2,072 (67.7%) 25,254 (67.6%) 63,170 (63.8%)- Black Population 667 (21.8%) 8,798 (23.5%) 26,446 (26.7%)- Asian Population 161 (5.3%) 1,318 (3.5%) 3,557 (3.6%)- Pacific Islander Population 3 (.1%) 22 (.1%) 79 (.1%)- American Indian and Alaska Native 10 (.3%) 125 (.3%) 360 (.4%)- Other Race Population 20 (.7%) 380 (1.0%) 1,712 (1.7%)- Two or More Races Population 126 (4.1%) 1,463 (3.9%) 3,747 (3.8%)- Hispanic Population 134 (4.4%) 1,719 (4.6%) 5,700 (5.8%)- White Non-Hispanic Population 1,978 (64.6%) 24,238 (64.9%) 60,387 (61.0%)
2015 Estimated Population by Age 3,060 37,359 99,072- Aged 0 to 4 Years 186 (6.1%) 2,272 (6.1%) 6,189 (6.2%)- Aged 5 to 9 Years 204 (6.7%) 2,394 (6.4%) 6,432 (6.5%)- Aged 10 to 14 Years 260 (8.5%) 2,849 (7.6%) 6,894 (7.0%)- Aged 15 to 17 Years 165 (5.4%) 1,879 (5.0%) 4,431 (4.5%)- Aged 18 to 20 Years 148 (4.8%) 1,723 (4.6%) 4,074 (4.1%)- Aged 21 to 24 Years 194 (6.3%) 2,312 (6.2%) 5,544 (5.6%)- Aged 25 to 34 Years 234 (7.6%) 4,159 (11.1%) 13,196 (13.3%)- Aged 35 to 44 Years 411 (13.4%) 5,029 (13.5%) 13,195 (13.3%)- Aged 45 to 54 Years 545 (17.8%) 6,402 (17.1%) 15,517 (15.7%)- Aged 55 to 64 Years 381 (12.5%) 4,650 (12.4%) 12,272 (12.4%)- Aged 65 to 74 Years 209 (6.8%) 2,313 (6.2%) 6,751 (6.8%)- Aged 75 to 84 Years 83 (2.7%) 974 (2.6%) 3,205 (3.2%)- Aged 85 Years and Older 41 (1.3%) 403 (1.1%) 1,374 (1.4%)
2015 Estimated Median Age 38.90 37.35 37.152015 Estimated Average Age 37.16 36.84 37.49
2015 Estimated Population Over 25 by Educational Attainment
1,904 23,930 65,509
- Less than 9th Grade 18 (.9%) 297 (1.2%) 1,676 (2.6%)- High School - No Diploma 71 (3.7%) 892 (3.7%) 3,792 (5.8%)- High School Diploma 394 (20.7%) 5,304 (22.2%) 16,613 (25.4%)- Some College 475 (24.9%) 6,200 (25.9%) 17,472 (26.7%)- Associate Degree 202 (10.6%) 2,368 (9.9%) 6,438 (9.8%)- Bachelor's Degree 424 (22.3%) 5,433 (22.7%) 12,797 (19.5%)- Master's Degree 229 (12.0%) 2,625 (11.0%) 5,249 (8.0%)- Professional Degree 73 (3.8%) 541 (2.3%) 939 (1.4%)- Doctoral Degree 19 (1.0%) 269 (1.1%) 534 (.8%)

CAHOON COMMONS :: DEMOGRAPHICS
-
644 Grassfield Pkwy 1 mile radius
644 Grassfield Pkwy 3 mile radius
644 Grassfield Pkwy 5 mile radius
2015 Estimated Owner Occupied Units by Housing Value
862 10,434 26,044
- Valued Less than $20,000 4 (.5%) 78 (.7%) 751 (2.9%)- Valued $20,000 - $39,999 9 (1.0%) 111 (1.1%) 690 (2.6%)- Valued $40,000 - $59,999 3 (.3%) 23 (.2%) 92 (.4%)- Valued $60,000 - $79,999 2 (.2%) 46 (.4%) 182 (.7%)- Valued $80,000 - $99,999 1 (.1%) 19 (.2%) 144 (.6%)- Valued $100,000 - $149,999 18 (2.1%) 361 (3.5%) 1,266 (4.9%)- Valued $150,000 - $199,999 82 (9.5%) 1,273 (12.2%) 4,385 (16.8%)- Valued $200,000 - $299,999 280 (32.5%) 3,512 (33.7%) 8,935 (34.3%)- Valued $300,000 - $399,999 309 (35.8%) 3,097 (29.7%) 6,075 (23.3%)- Valued $400,000 - $499,999 98 (11.4%) 1,370 (13.1%) 2,420 (9.3%)- Valued $500,000 - $749,999 55 (6.4%) 501 (4.8%) 964 (3.7%)- Valued $750,000 - $999,999 1 (.1%) 32 (.3%) 106 (.4%)- Valued More than $1,000,000 1 (.1%) 12 (.1%) 33 (.1%)
2015 Est. Median Housing Value $310,296 $294,180 $259,4632015 Est. Average Housing Value $320,679 $308,040 $275,438
2015 Estimated Housing Units by Housing Type
1,031 12,774 36,813
- 1 Unit Detached 839 (81.4%) 10,289 (80.5%) 25,213 (68.5%)- 1 Unit Attached 113 (11.0%) 1,362 (10.7%) 3,866 (10.5%)- 2 Units 18 (1.7%) 70 (.5%) 376 (1.0%)- 3-4 Units 0 84 (.7%) 816 (2.2%)- 5-19 Units 0 579 (4.5%) 3,924 (10.7%)- 20-49 Units 1 (.1%) 103 (.8%) 566 (1.5%)- 50+ Units 58 (5.6%) 255 (2.0%) 644 (1.7%)- Mobile Home Units 3 (.3%) 32 (.3%) 1,385 (3.8%)- Other Units 0 0 23 (.1%)
2015 Estimated Housing Units by Year Structure Built
1,031 12,774 36,813
- Structure Built 2010 or Later 107 (10.4%) 978 (7.7%) 2,634 (7.2%)- Structure Built 2000 to 2009 254 (24.6%) 2,258 (17.7%) 5,642 (15.3%)- Structure Built 1990 to 1999 420 (40.7%) 4,905 (38.4%) 10,414 (28.3%)- Structure Built 1980 to 1989 145 (14.1%) 2,667 (20.9%) 7,867 (21.4%)- Structure Built 1970 to 1979 31 (3.0%) 826 (6.5%) 4,048 (11.0%)- Structure Built 1960 to 1969 18 (1.7%) 508 (4.0%) 2,915 (7.9%)- Structure Built 1950 to 1959 35 (3.4%) 374 (2.9%) 2,206 (6.0%)- Structure Built 1940 to 1949 7 (.7%) 151 (1.2%) 684 (1.9%)- Structure Built 1939 or Earlier 14 (1.4%) 105 (.8%) 403 (1.1%)
2015 Est. Median Year Structure Built 1996 1994 1990

CAHOON COMMONS :: DEMOGRAPHICS
-
644 Grassfield Pkwy 1 mile radius
644 Grassfield Pkwy 3 mile radius
644 Grassfield Pkwy 5 mile radius
2015 Estimated Population by Sex 3,060 37,359 99,072- Male 1,476 (48.2%) 18,458 (49.4%) 48,464 (48.9%)- Female 1,584 (51.8%) 18,902 (50.6%) 50,608 (51.1%)
2015 Estimated Pop. over 15 byMarital Status
2,410 29,845 79,558
- Male: Never Married 342 (14.2%) 4,556 (15.3%) 12,848 (16.1%)- Male: Married Spouse Absent 39 (1.6%) 579 (1.9%) 1,840 (2.3%)- Male: Married Spouse Present 673 (27.9%) 8,458 (28.3%) 19,834 (24.9%)- Male: Widowed 27 (1.1%) 254 (.9%) 765 (1.0%)- Male: Divorced 73 (3.0%) 848 (2.8%) 3,311 (4.2%)- Female: Never Married 240 (10.0%) 3,223 (10.8%) 9,918 (12.5%)- Female: Married Spouse Absent 42 (1.7%) 651 (2.2%) 2,474 (3.1%)- Female: Married Spouse Present 714 (29.6%) 8,291 (27.8%) 20,082 (25.2%)- Female: Widowed 147 (6.1%) 1,327 (4.4%) 3,495 (4.4%)- Female: Divorced 115 (4.8%) 1,659 (5.6%) 4,991 (6.3%)
2015 Estimated Population in Group Quarters
0 1,243 2,103
- Institutional Group Quarters 0 1,243 (100%) 2,025 (96.3%)- Non-Institutional Group Quarters 0 0 78 (3.7%)
2015 Estimated Occupied Housing Units by Year Occ. Moved In
993 12,256 35,310
- Moved In 2010 or Later 258 (26.0%) 3,197 (26.1%) 9,965 (28.2%)- Moved In 2000-2009 494 (49.7%) 5,649 (46.1%) 15,541 (44.0%)- Moved In 1990-1999 191 (19.2%) 2,286 (18.7%) 5,447 (15.4%)- Moved In 1980-1989 29 (2.9%) 759 (6.2%) 2,463 (7.0%)- Moved In 1970-1979 14 (1.4%) 203 (1.7%) 954 (2.7%)- Moved In 1969 or Earlier 7 (.7%) 162 (1.3%) 941 (2.7%)

CAHOON COMMONS :: DEMOGRAPHICS
-
644 Grassfield Pkwy 1 mile radius
644 Grassfield Pkwy 3 mile radius
644 Grassfield Pkwy 5 mile radius
2015 Estimated Employed Population by Occupation
1,452 17,940 48,513
- Architect/Engineer 40 (2.8%) 652 (3.6%) 1,434 (3.0%)- Arts/Entertain/Sports 19 (1.3%) 258 (1.4%) 957 (2.0%)- Building Grounds Maint 16 (1.1%) 300 (1.7%) 1,127 (2.3%)- Business/Financial Ops 124 (8.5%) 1,113 (6.2%) 2,793 (5.8%)- Community/Soc Svcs 23 (1.6%) 299 (1.7%) 732 (1.5%)- Computer/Mathematical 61 (4.2%) 703 (3.9%) 1,689 (3.5%)- Construction/Extraction 78 (5.4%) 856 (4.8%) 2,472 (5.1%)- Edu/Training/Library 123 (8.5%) 1,508 (8.4%) 3,152 (6.5%)- Farm/Fish/Forestry 6 (.4%) 55 (.3%) 89 (.2%)- Food Prep/Serving 52 (3.6%) 685 (3.8%) 2,279 (4.7%)- Health Practitioner/Tec 79 (5.4%) 1,064 (5.9%) 2,774 (5.7%)- Healthcare Support 6 (.4%) 199 (1.1%) 732 (1.5%)- Legal 26 (1.8%) 200 (1.1%) 370 (.8%)- Life/Phys/Soc Science 12 (.8%) 155 (.9%) 374 (.8%)- Maintenance Repair 63 (4.3%) 641 (3.6%) 2,135 (4.4%)- Management 182 (12.5%) 2,216 (12.4%) 5,192 (10.7%)- Office/Admin Support 191 (13.2%) 2,363 (13.2%) 6,372 (13.1%)- Personal Care/Svc 36 (2.5%) 450 (2.5%) 1,304 (2.7%)- Production 22 (1.5%) 511 (2.8%) 2,200 (4.5%)- Protective Svcs 48 (3.3%) 497 (2.8%) 1,285 (2.6%)- Sales/Related 170 (11.7%) 2,189 (12.2%) 6,006 (12.4%)- Transportation/Moving 73 (5.0%) 1,026 (5.7%) 3,045 (6.3%)
2015 Estimated Employed Population Over 16 by Primary Transportation to Work
1,539 19,019 50,981
- Bicycle 2 (.1%) 61 (.3%) 115 (.2%)- Carpooled 78 (5.1%) 1,033 (5.4%) 3,263 (6.4%)- Drove Alone 1,340 (87.1%) 16,811 (88.4%) 44,658 (87.6%)- Other 13 (.8%) 139 (.7%) 490 (1.0%)- Public Transport 3 (.2%) 97 (.5%) 318 (.6%)- Walked 74 (4.8%) 414 (2.2%) 923 (1.8%)- Worked at Home 30 (1.9%) 464 (2.4%) 1,214 (2.4%)
2015 Estimated Employed Population Over 16 by Travel Time to Work
1,522 18,890 50,885
- Travel Time Less than 15 Min 238 (15.6%) 3,366 (17.8%) 10,041 (19.7%)- Travel Time 15-29 Min 596 (39.2%) 7,493 (39.7%) 21,335 (41.9%)- Travel Time 30-44 Min 451 (29.6%) 5,299 (28.1%) 13,242 (26.0%)- Travel Time 45-59 Min 133 (8.7%) 1,441 (7.6%) 3,163 (6.2%)- Travel Time 60+ Min 73 (4.8%) 826 (4.4%) 1,891 (3.7%)- 2015 Est. Average Travel Time 30 29 27
CAHOON COMMONS :: DEMOGRAPHICS
-
644 Grassfield Pkwy 1 mile radius
644 Grassfield Pkwy 3 mile radius
644 Grassfield Pkwy 5 mile radius
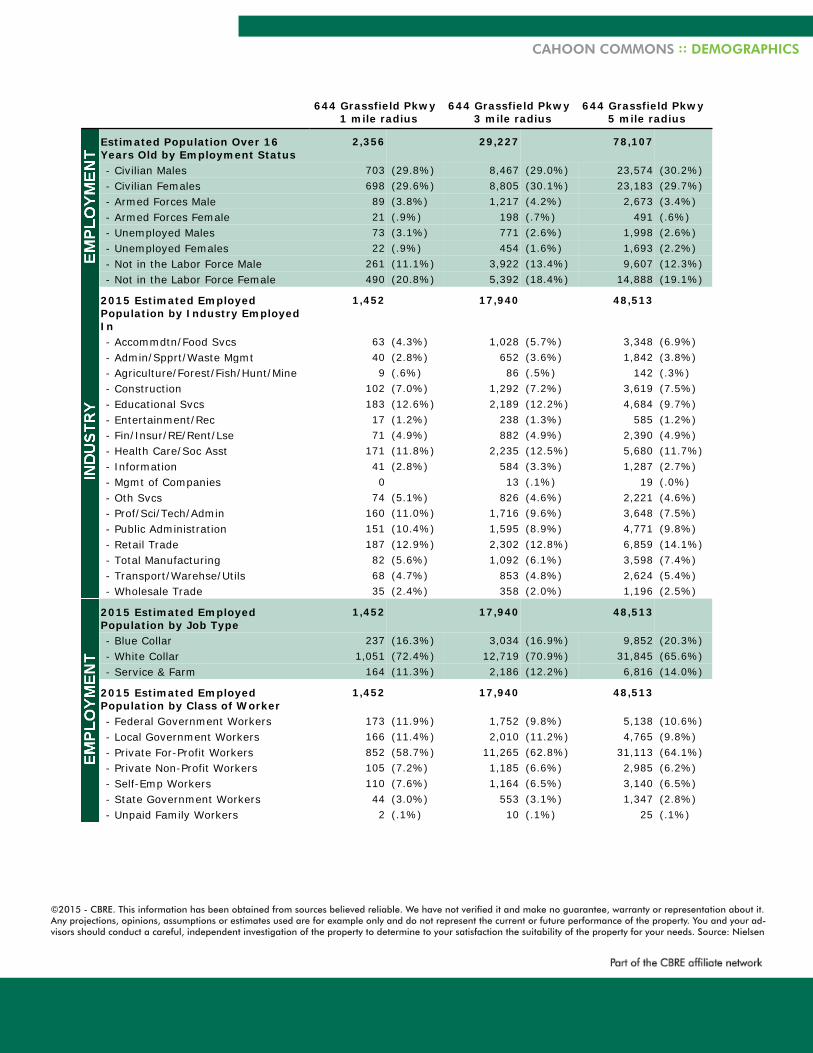
Estimated Population Over 16Years Old by Employment Status
2,356 29,227 78,107
- Civilian Males 703 (29.8%) 8,467 (29.0%) 23,574 (30.2%)- Civilian Females 698 (29.6%) 8,805 (30.1%) 23,183 (29.7%)- Armed Forces Male 89 (3.8%) 1,217 (4.2%) 2,673 (3.4%)- Armed Forces Female 21 (.9%) 198 (.7%) 491 (.6%)- Unemployed Males 73 (3.1%) 771 (2.6%) 1,998 (2.6%)- Unemployed Females 22 (.9%) 454 (1.6%) 1,693 (2.2%)- Not in the Labor Force Male 261 (11.1%) 3,922 (13.4%) 9,607 (12.3%)- Not in the Labor Force Female 490 (20.8%) 5,392 (18.4%) 14,888 (19.1%)
2015 Estimated Employed Population by Industry Employed In
1,452 17,940 48,513
- Accommdtn/Food Svcs 63 (4.3%) 1,028 (5.7%) 3,348 (6.9%)- Admin/Spprt/Waste Mgmt 40 (2.8%) 652 (3.6%) 1,842 (3.8%)- Agriculture/Forest/Fish/Hunt/Mine 9 (.6%) 86 (.5%) 142 (.3%)- Construction 102 (7.0%) 1,292 (7.2%) 3,619 (7.5%)- Educational Svcs 183 (12.6%) 2,189 (12.2%) 4,684 (9.7%)- Entertainment/Rec 17 (1.2%) 238 (1.3%) 585 (1.2%)- Fin/Insur/RE/Rent/Lse 71 (4.9%) 882 (4.9%) 2,390 (4.9%)- Health Care/Soc Asst 171 (11.8%) 2,235 (12.5%) 5,680 (11.7%)- Information 41 (2.8%) 584 (3.3%) 1,287 (2.7%)- Mgmt of Companies 0 13 (.1%) 19 (.0%)- Oth Svcs 74 (5.1%) 826 (4.6%) 2,221 (4.6%)- Prof/Sci/Tech/Admin 160 (11.0%) 1,716 (9.6%) 3,648 (7.5%)- Public Administration 151 (10.4%) 1,595 (8.9%) 4,771 (9.8%)- Retail Trade 187 (12.9%) 2,302 (12.8%) 6,859 (14.1%)- Total Manufacturing 82 (5.6%) 1,092 (6.1%) 3,598 (7.4%)- Transport/Warehse/Utils 68 (4.7%) 853 (4.8%) 2,624 (5.4%)- Wholesale Trade 35 (2.4%) 358 (2.0%) 1,196 (2.5%)
2015 Estimated Employed Population by Job Type
1,452 17,940 48,513
- Blue Collar 237 (16.3%) 3,034 (16.9%) 9,852 (20.3%)- White Collar 1,051 (72.4%) 12,719 (70.9%) 31,845 (65.6%)- Service & Farm 164 (11.3%) 2,186 (12.2%) 6,816 (14.0%)
2015 Estimated Employed Population by Class of Worker
1,452 17,940 48,513
- Federal Government Workers 173 (11.9%) 1,752 (9.8%) 5,138 (10.6%)- Local Government Workers 166 (11.4%) 2,010 (11.2%) 4,765 (9.8%)- Private For-Profit Workers 852 (58.7%) 11,265 (62.8%) 31,113 (64.1%)- Private Non-Profit Workers 105 (7.2%) 1,185 (6.6%) 2,985 (6.2%)- Self-Emp Workers 110 (7.6%) 1,164 (6.5%) 3,140 (6.5%)- State Government Workers 44 (3.0%) 553 (3.1%) 1,347 (2.8%)- Unpaid Family Workers 2 (.1%) 10 (.1%) 25 (.1%)

CAHOON COMMONS :: DEMOGRAPHICS
-
644 Grassfield Pkwy 1 mile radius
644 Grassfield Pkwy 3 mile radius
644 Grassfield Pkwy 5 mile radius
2015 Estimated Hispanic Population by Origin
134 1,719 5,700
- Cuban 7 (5.2%) 79 (4.6%) 224 (3.9%)- Mexican 39 (29.1%) 548 (31.9%) 2,187 (38.4%)- Other 45 (33.6%) 581 (33.8%) 1,685 (29.6%)- Puerto Rican 44 (32.8%) 512 (29.8%) 1,604 (28.1%)
2015 Estimated Hispanic Population by Race
134 1,719 5,700
- White 94 (70.1%) 1,015 (59.0%) 2,784 (48.8%)- Black 7 (5.2%) 130 (7.6%) 518 (9.1%)- Am. Indian or Alaska Native 2 (1.5%) 13 (.8%) 82 (1.4%)- Asian 5 (3.7%) 32 (1.9%) 66 (1.2%)- Native Haw. Or Pac. Islander 0 1 (.1%) 12 (.2%)- Other 13 (9.7%) 313 (18.2%) 1,575 (27.6%)- Two or More 13 (9.7%) 216 (12.6%) 663 (11.6%)
2015 Estimated Asian Population by Category
161 1,318 3,557
- Asian Indian 28 (17.4%) 206 (15.6%) 739 (20.8%)- Cambodian 0 0 0- Chinese, except Taiwanese 45 (28.0%) 316 (24.0%) 698 (19.6%)- Filipino 44 (27.3%) 437 (33.2%) 1,259 (35.4%)- Hmong 0 0 0- Japanese 28 (17.4%) 140 (10.6%) 240 (6.7%)- Korean 7 (4.3%) 140 (10.6%) 261 (7.3%)- Laotian 0 0 0- Other or 2 or More 8 (5.0%) 60 (4.6%) 208 (5.8%)- Thai 0 0 9 (.3%)- Vietnamese 2 (1.2%) 20 (1.5%) 144 (4.0%)
2015 Estimated Population Over 5Years Old by Language Spoken at Home
2,874 35,087 92,884
- Speak Asian or Pacific Island Language at Home
63 (2.2%) 602 (1.7%) 2,157 (2.3%)
- Speak IndoEuropean Language at Home
68 (2.4%) 759 (2.2%) 1,815 (2.0%)
- Speak Only English at Home 2,627 (91.4%) 32,444 (92.5%) 85,148 (91.7%)- Speak Other Language at Home 8 (.3%) 90 (.3%) 387 (.4%)- Speak Spanish at Home 108 (3.8%) 1,191 (3.4%) 3,376 (3.6%)

CAHOON COMMONS :: DEMOGRAPHICS
-
644 Grassfield Pkwy 1 mile radius
644 Grassfield Pkwy 3 mile radius
644 Grassfield Pkwy 5 mile radius
2015 Estimated Population by Ancestry
3,060 37,359 99,072
- Unclassified 333 (10.9%) 3,972 (10.6%) 11,055 (11.2%)- Arab 40 (1.3%) 288 (.8%) 594 (.6%)- Czech 21 (.7%) 121 (.3%) 191 (.2%)- Danish 3 (.1%) 49 (.1%) 120 (.1%)- Dutch 22 (.7%) 312 (.8%) 609 (.6%)- English 284 (9.3%) 3,281 (8.8%) 8,455 (8.5%)- French (except Basque) 40 (1.3%) 556 (1.5%) 1,560 (1.6%)- French Canadian 10 (.3%) 123 (.3%) 319 (.3%)- German 263 (8.6%) 3,119 (8.3%) 7,304 (7.4%)- Greek 13 (.4%) 111 (.3%) 317 (.3%)- Hungarian 6 (.2%) 62 (.2%) 157 (.2%)- Irish 273 (8.9%) 2,858 (7.7%) 7,288 (7.4%)- Italian 103 (3.4%) 1,283 (3.4%) 2,945 (3.0%)- Lithuanian 2 (.1%) 35 (.1%) 54 (.1%)- Norwegian 19 (.6%) 146 (.4%) 287 (.3%)- Other ancestries 1,054 (34.4%) 14,360 (38.4%) 40,717 (41.1%)- Polish 61 (2.0%) 748 (2.0%) 1,498 (1.5%)- Portuguese 0 2 (.0%) 45 (.0%)- Russian 9 (.3%) 97 (.3%) 136 (.1%)- Scotch-Irish 52 (1.7%) 496 (1.3%) 1,187 (1.2%)- Scottish 30 (1.0%) 382 (1.0%) 1,265 (1.3%)- Slovak 0 39 (.1%) 91 (.1%)- Subsaharan African 17 (.6%) 330 (.9%) 1,194 (1.2%)- Swedish 28 (.9%) 270 (.7%) 466 (.5%)- Swiss 7 (.2%) 55 (.1%) 67 (.1%)- Ukrainian 5 (.2%) 49 (.1%) 76 (.1%)- United States or American 346 (11.3%) 4,021 (10.8%) 10,468 (10.6%)- Welsh 5 (.2%) 81 (.2%) 207 (.2%)- West Indian (exc Hisp Groups) 14 (.5%) 114 (.3%) 402 (.4%)

CAHOON COMMONS :: DEMOGRAPHICS
-
644 Grassfield Pkwy 1 mile radius
644 Grassfield Pkwy 3 mile radius
644 Grassfield Pkwy 5 mile radius
Total Number of Employees 1,889 6,419 50,197
Management, Business, and Professional
621 (32.9%) 2,722 (42.4%) 19,407 (38.7%)
- Management 143 (7.6%) 528 (8.2%) 4,139 (8.2%)- Business and financial operations 64 (3.4%) 233 (3.6%) 2,228 (4.4%)- Computer and Mathematical 32 (1.7%) 60 (.9%) 796 (1.6%)- Architecture and Engineering 8 (.4%) 32 (.5%) 503 (1.0%)- Life, Physical, and Social Science 3 (.1%) 23 (.4%) 213 (.4%)- Community and Social Services 32 (1.7%) 167 (2.6%) 1,079 (2.1%)- Legal 0 24 (.4%) 195 (.4%)- Education, Training, and Library 117 (6.2%) 1,264 (19.7%) 5,326 (10.6%)- Arts, Design, Entertainment, Sports, and Media
24 (1.3%) 98 (1.5%) 665 (1.3%)
- Healthcare Practitioners and Technical
202 (10.7%) 295 (4.6%) 4,262 (8.5%)
Sales and Office 470 (24.9%) 1,159 (18.1%) 10,222 (20.4%)- Sales and Related 241 (12.8%) 388 (6.0%) 4,082 (8.1%)- Office and Administrative Support 228 (12.1%) 771 (12.0%) 6,141 (12.2%)
Service 329 (17.4%) 1,249 (19.5%) 8,307 (16.5%)- Healthcare Support 40 (2.1%) 72 (1.1%) 821 (1.6%)- Protective Service 8 (.4%) 227 (3.5%) 1,370 (2.7%)- Food Preparation and Serving Related
64 (3.4%) 263 (4.1%) 1,427 (2.8%)
- Building and Grounds Cleaning and Maintenance
119 (6.3%) 381 (5.9%) 2,762 (5.5%)
- Personal Care and Service 96 (5.1%) 306 (4.8%) 1,926 (3.8%)
Trade & Labor 239 (12.6%) 925 (14.4%) 8,975 (17.9%)- Farming, Fishing, and Forestry 5 (.3%) 46 (.7%) 133 (.3%)- Construction and Extraction 58 (3.1%) 374 (5.8%) 3,810 (7.6%)- Installation, Maintenance, and Repair
48 (2.5%) 186 (2.9%) 1,680 (3.3%)
- Production 27 (1.4%) 85 (1.3%) 934 (1.9%)- Transportation and Material Moving 101 (5.3%) 234 (3.6%) 2,420 (4.8%)
Unclassified 231 (12.2%) 364 (5.7%) 3,285 (6.5%)

CAHOON COMMONS :: DEMOGRAPHICS
-
1. 644 Grassfield Pkwy - 1 mile radius
2. 644 Grassfield Pkwy - 3 mile radius
3. 644 Grassfield Pkwy - 5 mile radius
-76.30728
-76.30728
-76.30728
36.719006
36.719006
36.719006
Location Longitude Latitude


![COURT OF APPEAL FOR BRITISH COLUMBIA · Cahoon v. Brideaux Page 6 [10] Mrs. Cahoon was 55 years of age at the time of the collision and 59 years old when her action came to trial](https://img.pdfslide.us/doc/110x75/60506df487c785253e41b23b/court-of-appeal-for-british-columbia-cahoon-v-brideaux-page-6-10-mrs-cahoon.jpg)