Embed Size (px)
Citation preview
1
Cahier de recherche
2012-03
Customer Value Disclosure and Analyst Forecasts: The Influence of Environmental Dynamism
Marie Josée Ledoux*
Denis Cormier
Sylvain Houle
ESG UQAM
March 2012
This research was conducted with financial support from the fund for education and good governance of the Autorité des marchés financiers (Québec) and PWC. Information, opinions and views expressed in this article are the sole responsibility of the authors. The content of this article does not necessarily reflect the opinion of the Authority and PWC; any errors are the responsibility of the authors.
*Corresponding address:
P.O. Box 8888, downtown station Montréal, Québec, Canada H3C 2P8 [email protected] Tel: 514 987 3000 (ext. 0287)
2
Customer Value Disclosure and Analyst Forecasts:
The Influence of Environmental Dynamism Abstract:
In this paper, we explore the relationships between customer value disclosure, analyst following, and earnings forecasts, taking into account environmental dynamism as captured by R&D intensity, sales variability and the reverse of industry concentration. Results show that customer value disclosure is positively associated with analyst following. Second, our findings show that customer value disclosure increases consensus among analysts and reduces forecast dispersion. Third, environmental dynamism enhances the association between customer value disclosure and analyst following. Fourth, environmental dynamism enhances the association between customer value disclosure and analyst earning forecasts. It appears that customer metrics attract analysts and improve their ability to forecast earnings. Results also suggest such disclosure to be particularly relevant for forecasting earnings of firms involved in dynamic environments. Key words: analyst following, analyst forecasts, customer value disclosure, environmental dynamism. Résumé: Dans cet article, nous explorons les relations entre le reporting valeur-client, le suivi des analystes et les prévisions de résultats, en tenant compte du dynamisme de l'environnement tel que capté par l'intensité des activités de R&D, la variabilité des ventes et l'inverse de la concentration de l'industrie. Les résultats montrent que le reporting valeur-client est positivement associée au suivi des analystes. Deuxièmement, le reporting valeur client augmente le consensus chez les analystes et réduit la dispersion des prévisions de résultats. Troisièmement, le dynamisme de l'environnement améliore la relation entre le reporting valeur-client et le suivi des analystes. Enfin, le dynamisme de l'environnement améliore la relation entre le reporting valeur-client et la précision des prévisions des analystes. Il semble que les informations portant sur la valeur-client attirent les analystes et améliorent leur capacité de prédire les résultats. Il ressort également de nos analyses que le reporting valeur-client est particulièrement pertinent pour la prévision de résultats des firmes œuvrant dans des environnements dynamiques. Mots clés: dynamisme de l’environnement, suivi des analystes, prévisions des analystes, reporting valeur-client.
3
1. Introduction
Analysts are sophisticated users of information that play a critical role in capital market
efficiency. Analysts use their earnings forecasts along with other information to estimate stock’s
value and make recommendations. Corporate disclosure is an essential source of information for
analysts. Previous studies provide empirical evidence that corporate disclosure is associated with
analyst following, more accurate analyst earnings forecasts, and less dispersion among individual
analyst forecasts. These studies suggest that analysts would look for corporate disclosure as it
improves their ability to forecast earnings.
Kaplan and Norton (1996) argue that customer related metrics are leading indicators of a
firm’s future financial performance. An emerging body of literature seeks for empirical evidence
of this argument and generally shows a positive relationship between customer metrics and future
accounting performance. Most of these studies are industry-specific and focus on one customer
related metric such as customer satisfaction or customer loyalty. To the extent that customer
metrics are informative of future earnings, we expect that customer value disclosure would attract
analysts and increase their ability to forecast earnings. Moreover, we expect customer value
disclosure to be particularly relevant for forecasting earnings of firms involved in more dynamic
environments.
Dynamism refers to rapid changes that are hard to predict and heightens uncertainty in a
firm’s environment. Turbulence in the market place may reflect changes in customers’
composition and preferences, advances in technologies, and competition intensity. Firms
operating in high market turbulence more frequently alter their products and services in order to
cater to customers’ changing preferences and competitors’ attacks. Forecasting earnings in such a
context is particularly challenging as it requires anticipating changes in market patterns or
technology while predicting the success of a firm’s market-based strategy. Customer value
4
disclosure captures organizational success in satisfying their customers, in recruiting and
retaining them, in extending new products and services to them, and in meeting the needs of their
target segments. According to Kaplan and Norton (2004), managing customer related metrics
enables firms to articulate the customer and market-based strategy that will deliver superior
future financials returns. Although firms may be reluctant to release such strategic information,
competition may induce them to voluntary disclose the information in an attempt to attract
customers and investors alike.
In this paper, we explore the relationships between customer value disclosure, analyst
following, and analyst earnings forecasts, taking into account environmental dynamism as
captured by R&D intensity, sales variability and the reverse of industry concentration
(competition). Our findings tend to confirm our expectations. First, results show that customer
value disclosure is positively associated with analyst following. Second, customer value
disclosure appears to increase consensus among analysts and to reduce forecast dispersion. Third,
environmental dynamism enhances the association between customer value disclosure and
analyst following. Fourth, environmental dynamism enhances the association between customer
value disclosure and analyst earnings forecasts.
To the best of our knowledge, this study is the first to investigate how environmental
dynamism influences the relationship between customer related disclosure and analyst earnings
forecasts. The remainder of the paper is organized as follows. Section 2 presents the theoretical
background and hypotheses. The study’s method is described in section 3. Results are presented
in section 4. Finally, section 5 provides a conclusion and a discussion of potential implications of
the results.
5
2. Background and hypotheses
2.1 Corporate disclosure, analyst following, and analyst earnings forecasts
Liquid and efficient capital markets rely on investors’ ability to obtain at low cost, timely,
and relevant information about a firm’s performance. In this regard, analysts play a critical role in
collecting and processing information for stock market participants. Analysts use their earnings
forecasts along with other information to estimate share price and make sell, buy, or hold
recommendations (Bradshaw, 2004). Earnings forecast precision is an important issue for the
analyst since poor predictions impact on his reputation, turnover and promotion (Mikhail et al.,
1999; Hong and Kubik, 2003; Wu and Zang, 2009). In the forecasting process, time is also a
crucial issue. Investors react to early more than to late analyst recommendations, even though
forecasts tend to be more precise when the window is reduced (Womack, 1996). In this vein,
Cooper et al. (2001) find that lead analysts, based on their forecast timeliness, have a greater
impact on stock prices than follower analysts. They also find that performance rankings on that
basis are more informative than those built on abnormal trading volume and forecast accuracy.
Analysts need relevant information in order to produce fast and precise earnings forecasts,
and part of this information comes from corporate disclosure. In Lang and Lundholm (1996),
leading analysts evaluate the informativeness of a wide range of corporate disclosure such as
annual published information, quarterly and other published information, and investors’ relations.
The authors provide evidences that firms with more informative disclosure policies have a larger
analyst following, more accurate analyst earnings forecasts, and less dispersion among individual
analyst forecasts. Based on a survey of experts involved in the process of listing international
securities, Higgins (1998) documents an association between the level of firms’ financial
disclosures and analysts’ ability to forecast earnings per share. Focusing on information provided
6
in the annual report, Hope (2003a) also documents an association between the level of firms’
disclosure and forecast accuracy. Barron et al. (1999) provide empirical evidence that analyst
forecast error and dispersion vary inversely with the quality of publicly available information
contained in the Management Discussion and Analysis report.
An emerging body of literature suggests that customer related measures may be useful in
predicting a firm’s future earnings and, ultimately, its stock market value. Kaplan and Norton
(1996) argue that customer related metrics are leading indicators of a firm’s future financial
performance. Most of the studies that seek empirical evidence of this argument are industry-
specific and focus on one customer related metric. A positive relationship between customer
satisfaction and future accounting performance was also documented in the telecom industry
(Banker et al., 2000). Smith and Wright (2004) report that customer loyalty measures explain
relative revenue growth and profitability while providing competitive advantage in the PC
industry.
In resort industry, Ittner and Larcker (1998) show that customer satisfaction is a leading
indicator of future financial performance measures, such as sales or earnings, which ultimately
translate into enhanced stock market performance. Amir and Lev (1996) report that the number of
customers signed up by a wireless operator, and its related costs, contain relevant information
about future earnings and stock returns. Moreover, Rajgopal et al. (2003) show that order backlog
predicts future earnings and share price. Anderson et al. (1994) show positive contemporaneous
associations between customer satisfaction and return on assets in Swedish manufacturing firms,
but weaker or negative associations in service firms. Finally, based on the American Customer
Satisfaction Index, Ngobo et al. (2011) show that customer satisfaction reduces earnings forecast
errors.

7
To the extent that customer metrics are informative about a firm's future financial
performance, we hypothesize that customer value disclosure would attract analysts and increase
their ability to forecast earnings:
H1: Customer value disclosure attracts analyst.
H2: Customer value disclosure is relevant for analyst earnings forecasts.
2.2 Environmental dynamism and analyst earnings forecasts
Dynamism refers to rapid changes that are hard to predict and heightens uncertainty in a
firm’s environment (Duncan, 1972; Dess and Beard, 1984). Turbulence in the market place may
reflect changes in the composition of customers and their preferences and in the competition
intensity. Firms operating in high market turbulence more frequently alter their products and
services in order to cater to customers’ changing preferences and competitors’ attacks (Wang,
2007). Those changes may also reflect technological advances and firms’ ability to adjust their
processes accordingly. Competition attacks may take the form of innovative products, aggressive
promotional campaign, new distribution channel, etc.
Environmental dynamism increases the difficulty of forecasting earnings and, therefore,
the necessity for analysts to collect and process additional information. A more stable
environment is likely to be associated with more stable, and thus easier to predict, patterns in
sales and earnings numbers. In a dynamic environment, analysts must predict the success of the
firm’s recent initiatives while anticipating changes in market patterns or technology. Moreover,
firms more involved in innovation activities have greater investment in intangible assets such as
8
patents, copyrights, trademarks and software, which have more uncertain payoffs than the other
assets of the firm (Barth et al., 2001).
Analyst motivation to follow a firm is driven by economic and reputational
considerations. Although environmental dynamism increases the difficulty and thus the cost of
forecasting earnings, it also represents potential value creation for investors and analysts.
Innovative firms may represent a potential of growth that is valued by stock market participants.
Consistently, Anagnostopoulou and Levis (2008) find a relation between R&D intensity and
consistent growth in sales and gross income in situations where a firm is forced to innovate
because of the industry in which it operates. Barth et al. (2001) show that analyst coverage is
greater for firms with more intangible assets. In addition, potential value creation derives from
stock mispricing associated with market instability.
Finally, analysts may have fewer reputational concerns when forecasting earnings of firms
surrounded by uncertainty. Ackert and Athanassakos (2003) show that the analysts’ optimism
increases with the firm uncertainty, measured by the standard deviation of earnings forecasts.
When there is little uncertainty, dispersion in analyst forecasts is likely to be lower and analysts
may wish to avoid standing out from the crowd. By comparison, when uncertainty is high,
dispersion in analyst forecasts is likely high and analysts have fewer reputational concerns when
they issue forecasts. Previous studies show that analyst coverage is increasing with uncertainty
about earnings predictability (Barth et al., 2001; Bhushan, 1989; Lang et al., 2003; Branson and
Pagash, 2005).
Although past financial performance may be the best predictors the future in a stable
setting, forecasting earnings of firms involved in a dynamic environment is particularly
challenging. Analysts should anticipate changes in market patterns or technology while
predicting customers’ reactions to a firm’s strategic initiatives. Customer value disclosure
9
captures organizational capacity to satisfy their customers, to recruit and retain them, to extend
new products and services to them, and to meet the needs of their target segments. Kaplan and
Norton (1996) balanced scorecard contains key performance indicators, grouped into four axes
namely learning and growth, business process, customers, and financial. Each indicator is part of
a chain of cause and effect that cross axes and eventually lead to financial outcomes. In that
chain, customer metrics appear as the outcome of previous initiatives to improve business
processes, and leading indicators of a firm’s financial performance. According to Kaplan and
Norton (2004), managing customer related metrics enables firms to articulate the customer and
market-based strategy that will deliver superior future financials returns. Relying on customer
metrics should be particularly relevant to predict future earnings of firms involved in dynamic
and thus unstable environment.
Firms may be reluctant to release strategic information that could induce proprietary costs.
The balanced scorecard is a strategic tool that contains long-term outcomes and drivers of
success. Incumbent firms with good news to communicate may choose to withhold information
to prevent competition (Dye, 1985). However, Arya and Mittendorf (2007) demonstrate that
while competition can inhibit disclosure, analysts’ insistence on guidance can be beneficial to
firms and consumers alike. In their setting, although firms are reluctant to disclose the
information that competitors deem pertinent, competition may induce them to voluntary release
information in an attempt to attract customers. In addition, if a firm opts not to disclose the
information, it runs the risk of losing analyst following (Bhushan, 1989; Lang and Lundholm,
1996; Healy et al., 1999).
Therefore, we expect customer value disclosure to be particularly attractive and relevant
to forecast earnings of firms involved in dynamic environment. Recent research provides
empirical evidence of the relevance of customer related metrics to predict future financial
10
performance. Most of these studies emerge from industries highly competitive and in which there
are high levels of innovation (e.g. telecom, PC industry). Moreover, the relevance of non-
financial measures for value creation has been widely recognized in industries where there are
sizable intangibles assets (e.g. Dempsey et al., 1997; Healy et al., 1999). Hence, the two
following hypotheses:
H3: Environmental dynamism enhances the association between customer value
disclosure and analyst following.
H4: Environmental dynamism enhances the relevance of customer value disclosure for
analyst earnings forecasts.
3. Method
3.1 Sample
The sample comprises 179 observations for the year 2010. We collected customer value
disclosure from corporate websites in January and February 2010. Disclosure formats include
annual reports, web pages and sustainability reports. 188 non-financial firms represented on the
Toronto Stock Exchange S&P/TSX Index were identified (the total index comprises 220 firms).
From 188 firms, nine have no forecast dispersion. This provides a sample of 179 firms. Financial
data was collected based on the information available in Compustat and Stock Guide in the spring
of 2010. Sample firms operate in the following industries: Materials; Energy; Industrials;
Consumer discretionary; Consumer staple; Utilities; Telecommunications; Information
technology; and Health care.
11
3.2 Empirical models
This study attempts to provide an integrated analysis of firms' customer value disclosure
strategy, analyst following and analyst forecasts taking into account environmental dynamism.
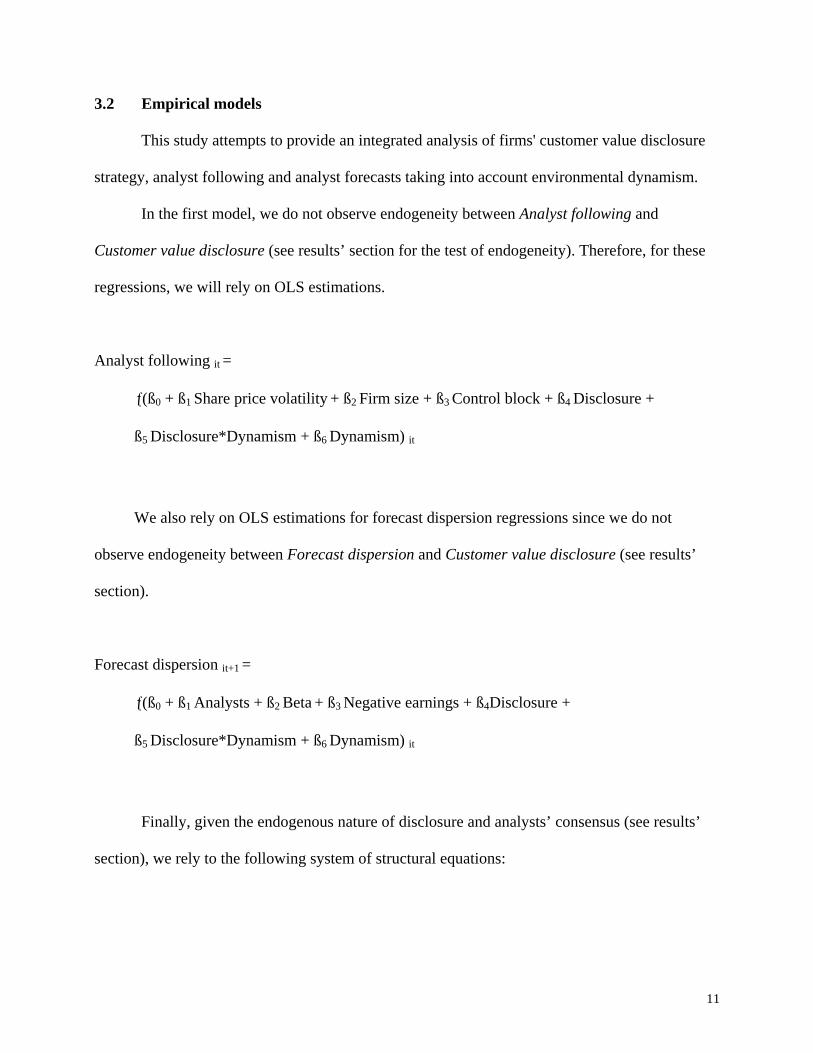
In the first model, we do not observe endogeneity between Analyst following and
Customer value disclosure (see results’ section for the test of endogeneity). Therefore, for these
regressions, we will rely on OLS estimations.
Analyst following it =
(ß0 + ß1 Share price volatility + ß2 Firm size + ß3 Control block + ß4 Disclosure +
ß5 Disclosure*Dynamism + ß6 Dynamism) it
We also rely on OLS estimations for forecast dispersion regressions since we do not
observe endogeneity between Forecast dispersion and Customer value disclosure (see results’
section).
Forecast dispersion it+1 =
(ß0 + ß1 Analysts + ß2 Beta + ß3 Negative earnings + ß4Disclosure +
ß5 Disclosure*Dynamism + ß6 Dynamism) it
Finally, given the endogenous nature of disclosure and analysts’ consensus (see results’
section), we rely to the following system of structural equations:
12
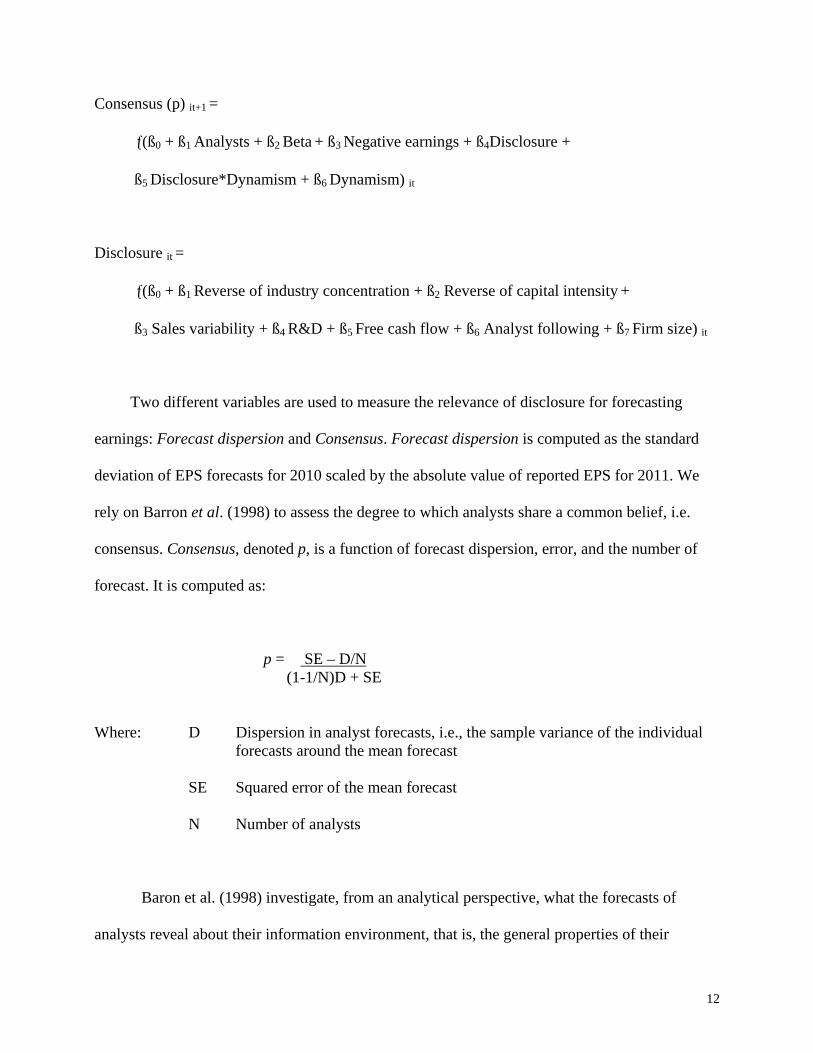
Consensus (p) it+1 =
(ß0 + ß1 Analysts + ß2 Beta + ß3 Negative earnings + ß4Disclosure +
ß5 Disclosure*Dynamism + ß6 Dynamism) it
Disclosure it =
(ß0 + ß1 Reverse of industry concentration + ß2 Reverse of capital intensity +
ß3 Sales variability + ß4 R&D + ß5 Free cash flow + ß6 Analyst following + ß7 Firm size) it
Two different variables are used to measure the relevance of disclosure for forecasting
earnings: Forecast dispersion and Consensus. Forecast dispersion is computed as the standard
deviation of EPS forecasts for 2010 scaled by the absolute value of reported EPS for 2011. We
rely on Barron et al. (1998) to assess the degree to which analysts share a common belief, i.e.
consensus. Consensus, denoted p, is a function of forecast dispersion, error, and the number of
forecast. It is computed as:
p = SE – D/N (1-1/N)D + SE
Where: D Dispersion in analyst forecasts, i.e., the sample variance of the individual forecasts around the mean forecast SE Squared error of the mean forecast N Number of analysts
Baron et al. (1998) investigate, from an analytical perspective, what the forecasts of
analysts reveal about their information environment, that is, the general properties of their
13
information and beliefs. They assume that analyst earning forecast is their best estimate of
earning based on available information, which consists of public (common across analysts) and
private (idiosyncratic) information. Their model demonstrates how these two types of
information result in forecast errors and dispersion and how the underlying unobservable
characteristics of the analyst’s information environment are revealed by expressions involving
observable constructs.
Consensus measures how much the average belief reflects public versus private
information. We expect customer value disclosure to increase the precision or quality of public
information available to analysts and, therefore, to increase their consensus. When all available
information is public, all analysts’ beliefs are identical and p should de equal to 1.
3.3 Measurement of variables
Disclosure. Prior research shows that analyst coverage tends to be positively related to the
degree of corporate information, presumably because better disclosure decreases the cost of doing
research on a company (Lang and Lundholm, 1996; Healy et al., 1999). Therefore, analysts are
less likely to be attracted to firms with poor disclosure (Lang and Lundholm, 1996; Healy et al.,
1999; Bushman and Smith, 2003).
Customer value disclosure is based on balanced scorecard literature and emerging
performance measurement practices (e.g. Ittner and Larker, 1998; Kaplan and Norton, 1996;
Robb et al., 2001). We measure disclosure using a coding instrument in a way that is similar to
Wiseman (1982), Aerts et al. (2007), and Cormier et al. (2009a, b). The grid comprises 15 items
(see table 1). The rating is based on a score of one to three per element, with each item possibly
comprising many elements. A score of three is given for an element that is described in monetary
or quantitative terms, a score two for an element that is specifically described, and a score of one

14
for an element discussed in general. To ensure consistency among firms, two persons reviewed
all individual scores independently. One of the co-researchers subsequently reviewed all
disagreements.
3.3.1 Analyst following model
Share price volatility. Prior research documents a relationship between share price
volatility and analyst coverage (e.g. Bhushan, 1989; Lang et al., 2003), suggesting that the
demand for analysts' services is higher for firms with higher financial risk. Therefore, we expect
a positive relationship between Share price volatility and analyst following. Share price volatility
is defined as the standard deviation of percentage changes in daily stock prices.
Firm size. Prior research shows that firm size is positively related to analyst following.
Bhushan (1989) argues that firm size affects both the aggregate demand and the aggregate supply
for analysts' services. Demand is positively affected by firm size because the aggregate potential
payoff for shareholders from access to higher quality information is more important for larger
firms. Supply is positively affected presumably because there are significant fixed costs in
following a firm, and the payoff from following it is related to its size (Bhushan, 1989).
Therefore, we expect a positive relationship between firm size as measured by ln(Assets), and
analyst following.
Control block. There is likely to be a greater demand for analysts' services if ownership is
more widely dispersed. As Hope (2003c) posits, when ownership is concentrated, information is
more likely to be communicated through private channels, decreasing the role of financial
analysts. Moreover, Lang et al. (2004) argue that analysts are reluctant to follow firms with
potential agency problems. They document that analyst coverage is negatively related to the
control rights held by families or management groups. The variable is measured as the percentage
15
of voting shares that are closely held (percentage of votes attached to the shares of a firm held by
directors, and individuals or companies that own more than 10% of shares outstanding). We
anticipate a negative relationship between control block and analyst following.
Three distinct variables are used to capture the environmental dynamism and its impact on
the association between customer value disclosure and analyst following. We estimate three
separate regressions adding in turn interaction terms Disclosure*R&D, Disclosure*Sales
variability, and Disclosure*Reverse of industry concentration to analyst forecast regressions.
R&D. The extent of R&D is expected to enhance the association between customer value
disclosure and analyst following. The interaction term is introduced in the model:
Disclosure*R&D. R&D is measured as 1+log R&D. We expect the coefficient on the variable
Disclosure*R&D to be positively associated with analyst following.
Sales variability. Sales variability is expected to enhance the association between
customer value disclosure and analyst following. The interaction term is introduced in the model:
Disclosure*Sales variability. We measure Sales variability in the following manner. First, we
compute the absolute value of the percentage change in sales from period t to period t-1. Then,
we subtract the absolute value of the percentage change in sales at the industry level and reach a
net of industry sales variability. We think that sales variability at the firm level must take into
consideration the uncertainty that faces the whole industry in which the firm operates (Ghosh and
Olsen, 2009). We expect the coefficient on the variable Disclosure*Sales variability to be
positively associated with analyst following.
Reverse of industry concentration. We expect competition in the product market to
enhance the association between customer value disclosure and analyst following. The four-firm
concentration ratio, which consists of the percentage of market share owned by the largest four
firms in the industry (otherwise known as the Herfindhal index) is commonly used. A high
16
concentration ratio indicates that competitors are very strong and likely to use any information
being disclosed to their advantage and to the detriment of the discloser’s stockholders (Darrough
and Stoughton, 1990). We computed industry concentration ratios based on 1 213 non-financial
firms included in Stock Guide (from 38 firms for consumer staple to 434 for industrials). The
concentration ratio is measured as 1- the percentage of market share owned by the largest four
firms in the industry. The variable Reverse of industry concentration is computed by ranking
industries based on the reverse of concentration ratio. We expect the coefficient on the variable
Disclosure*Reverse of industry concentration to be positively associated with analyst following.
3.3.2 Analyst forecasts model
In addition to voluntary disclosure, three control variables are added to the model of
analyst forecasts: Beta; Negative earnings, and analyst following. Hope (2003a, b) documents a
relation between forecasts’ properties, analyst following and negative earnings. Patton and
Verardo (2010) observe that the increase in betas is greater for earnings announcements with
larger positive or negative surprises, and with greater analyst forecast dispersion. Furthermore,
the increase in betas is greater for stocks with higher analyst coverage. We expect that beta and
negative earnings should increase forecast dispersion and uncertainty common to all analysts (p).
The opposite is expected for analyst following.
Three distinct variables are used to capture the environmental dynamism and its impact on
the association between customer value disclosure and analyst forecasts. We estimate three
separate regressions adding in turn interaction terms Disclosure*R&D, Disclosure*Sales
variability, and Disclosure*Reverse of industry concentration to analyst forecast regressions. We
expect coefficients on the variable Disclosure*R&D, Disclosure*Sales variability and
17
Disclosure*Reverse of industry concentration to be positively associated consensus (p) and
negatively associated with forecast dispersion.
3.3.3 Disclosure model
Barriers to entry constitute a cost that a new entrant would have to face compared to
existing firms. These include cost in making capital investment intensity, existing intellectual
property rights that make entry difficult, and industry concentration. Dye (1985) asserts that an
incumbent firm with good news to communicate may choose to withhold information to prevent
competition. The lower the market competition, the easier for a firm to keep private information
(Verrecchia, 1983). In the opposite, Darrough and Stoughton (1990) assess that the more it is
difficult to enter a market, the more confident the incumbents will feel about disclosing
information.
Reverse of industry concentration. The demand for disclosure varies among industries
(Wagenhofer, 1990). Industry concentration is a proxy for barriers to entry as the higher the
concentration within an industry, the more existing firms are entrenched and the more difficult it
is for a new firm to gain a foothold. Essentially, the concentration ratio is an indicator of the
relative size of firms in relation to the industry as a whole. The reverse of industry concentration
captures the level of competition in an industry.
Reverse of capital intensity. Product market concerns also revolve around a firm’s capital
investment intensity as it underlies its commitment to its various business partners (suppliers and
customers) and increases its visibility to the surrounding communities. Under these particular
conditions, additional disclosure will facilitate a firm’s commercial operations and, ultimately,
benefit stockholders. We measure capital investment intensity as a firm’s gross property, plant
18
and equipment, divided by its total assets. This variable captures the level of competition at the
firm level.
Prior literature proposes two conflicting predictions concerning the association between
competition and disclosure. First, the lower the market competition, the easier for a firm to keep
private information. Second, the more it is difficult to enter a market, the more confident the
incumbents will feel about disclosing information. Since the actual impact of competition on
customer value disclosure is unclear, no directional predictions are made for our two variables.
Sales variability. Sales variability is measured as the absolute value of the percentage
change in sales from period t to period t-1, net of the industry sales variability. In a situation of
sales instability, the firm may want to enhance its communication about its products and
clientele. However, in such an uncertain context, the reliability of customer value disclosure may
be an issue. Since the actual impact of sales variability on customer value disclosure is unclear,
no directional predictions are made for the variable.
R&D. Proprietary costs are likely to increase with innovation. Dye (1985) asserts that an
incumbent firm with good news to communicate may choose to withhold information to prevent
competition. Hence, a firm proactive in R&D activities will fear to release information that could
advantage competitors. However, innovative firms have new products to offer and to advertise,
leading them to communicate information about customer value. Since the actual impact of R&D
on customer value disclosure is unclear, no directional predictions are made for the variable.
R&D intensity is measured as 1+log R&D.
Two variables are used to capture capital markets’ information considerations that affect
corporate disclosure: Free cash flow and Analyst following.
19
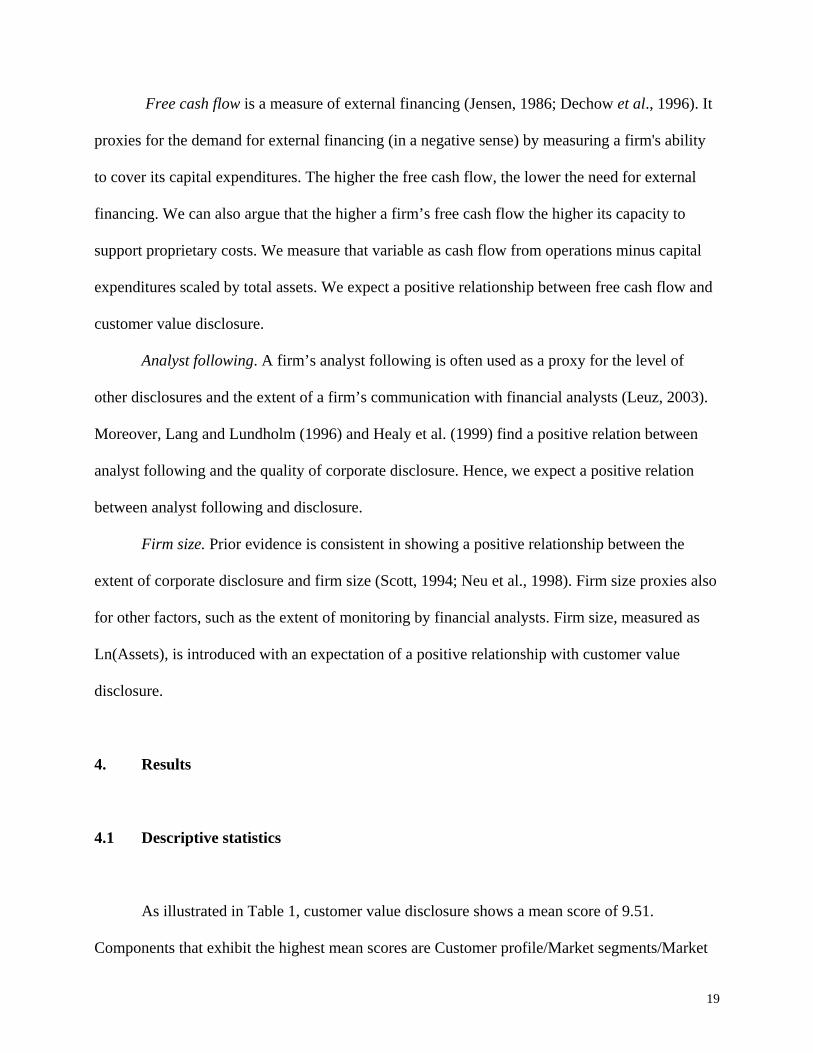
Free cash flow is a measure of external financing (Jensen, 1986; Dechow et al., 1996). It
proxies for the demand for external financing (in a negative sense) by measuring a firm's ability
to cover its capital expenditures. The higher the free cash flow, the lower the need for external
financing. We can also argue that the higher a firm’s free cash flow the higher its capacity to
support proprietary costs. We measure that variable as cash flow from operations minus capital
expenditures scaled by total assets. We expect a positive relationship between free cash flow and
customer value disclosure.
Analyst following. A firm’s analyst following is often used as a proxy for the level of
other disclosures and the extent of a firm’s communication with financial analysts (Leuz, 2003).
Moreover, Lang and Lundholm (1996) and Healy et al. (1999) find a positive relation between
analyst following and the quality of corporate disclosure. Hence, we expect a positive relation
between analyst following and disclosure.
Firm size. Prior evidence is consistent in showing a positive relationship between the
extent of corporate disclosure and firm size (Scott, 1994; Neu et al., 1998). Firm size proxies also
for other factors, such as the extent of monitoring by financial analysts. Firm size, measured as
Ln(Assets), is introduced with an expectation of a positive relationship with customer value
disclosure.
4. Results
4.1 Descriptive statistics
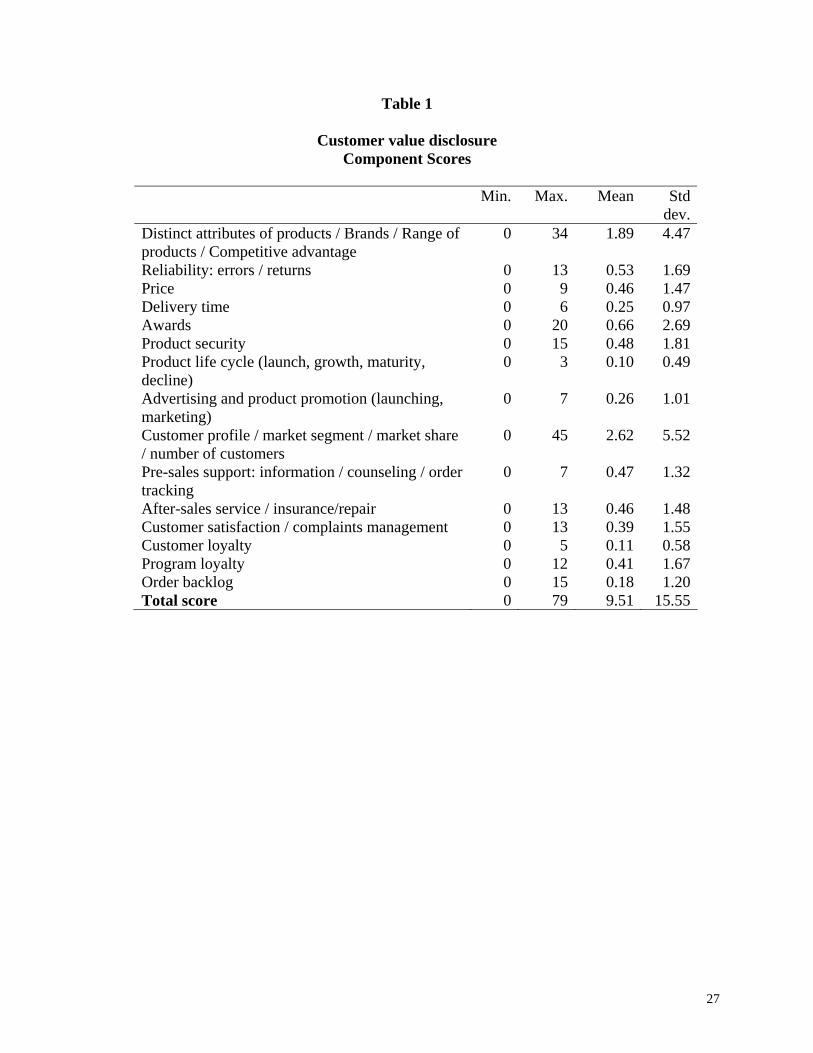
As illustrated in Table 1, customer value disclosure shows a mean score of 9.51.
Components that exhibit the highest mean scores are Customer profile/Market segments/Market
20
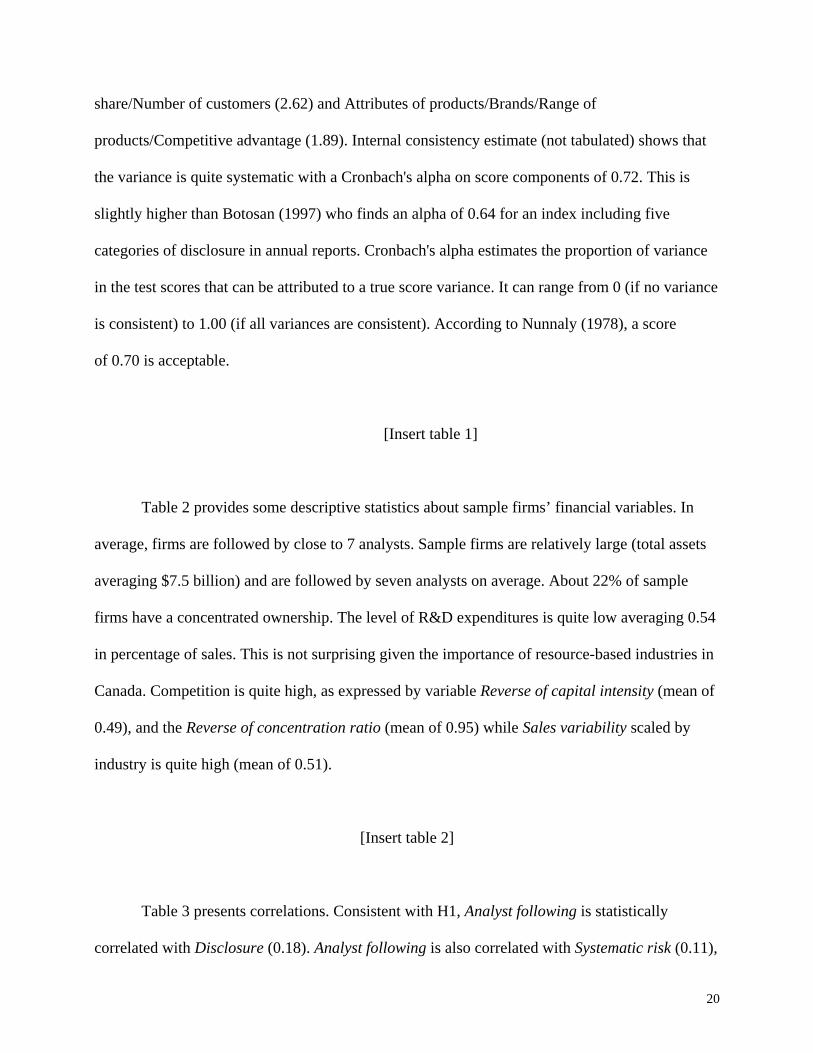
share/Number of customers (2.62) and Attributes of products/Brands/Range of
products/Competitive advantage (1.89). Internal consistency estimate (not tabulated) shows that
the variance is quite systematic with a Cronbach's alpha on score components of 0.72. This is
slightly higher than Botosan (1997) who finds an alpha of 0.64 for an index including five
categories of disclosure in annual reports. Cronbach's alpha estimates the proportion of variance
in the test scores that can be attributed to a true score variance. It can range from 0 (if no variance
is consistent) to 1.00 (if all variances are consistent). According to Nunnaly (1978), a score
of 0.70 is acceptable.
[Insert table 1]
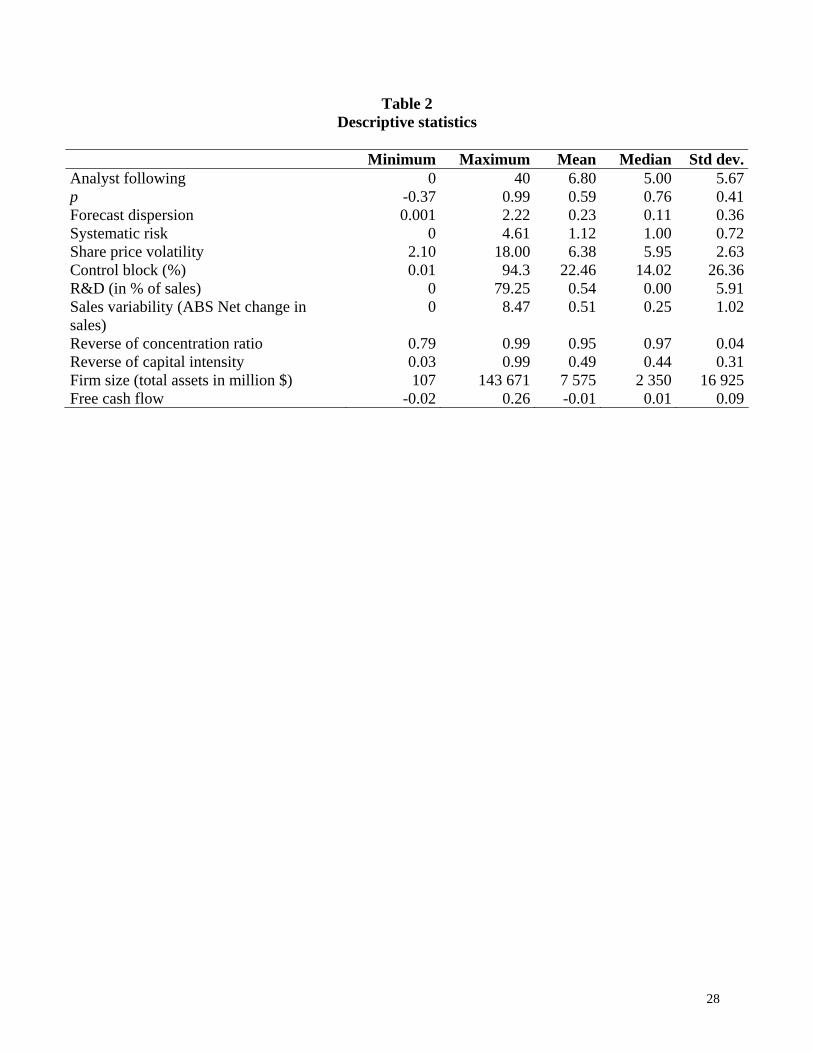
Table 2 provides some descriptive statistics about sample firms’ financial variables. In
average, firms are followed by close to 7 analysts. Sample firms are relatively large (total assets
averaging $7.5 billion) and are followed by seven analysts on average. About 22% of sample
firms have a concentrated ownership. The level of R&D expenditures is quite low averaging 0.54
in percentage of sales. This is not surprising given the importance of resource-based industries in
Canada. Competition is quite high, as expressed by variable Reverse of capital intensity (mean of
0.49), and the Reverse of concentration ratio (mean of 0.95) while Sales variability scaled by
industry is quite high (mean of 0.51).
[Insert table 2]
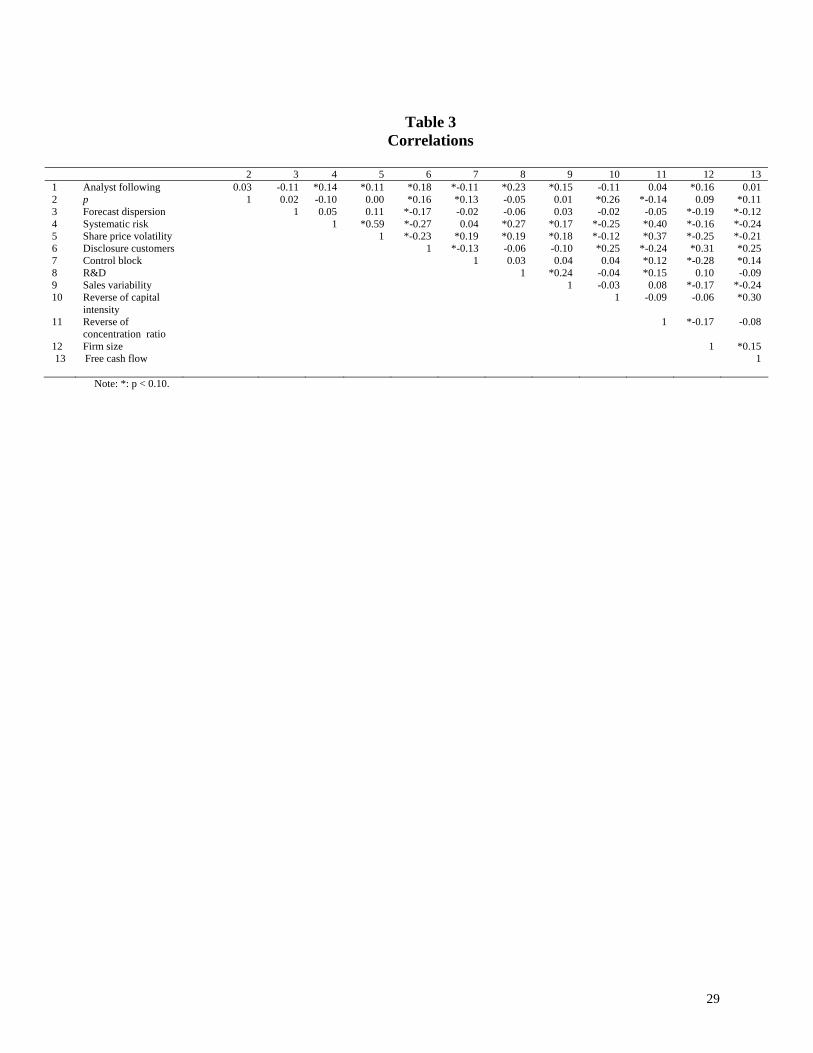
Table 3 presents correlations. Consistent with H1, Analyst following is statistically
correlated with Disclosure (0.18). Analyst following is also correlated with Systematic risk (0.11),
21
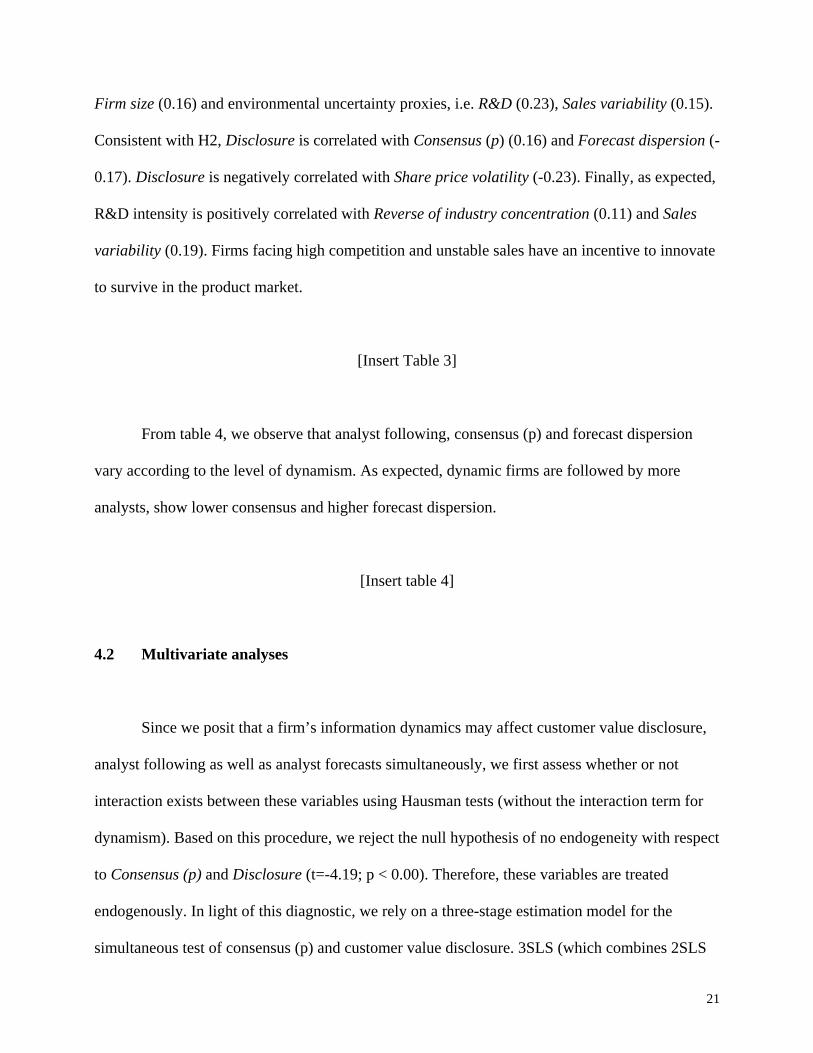
Firm size (0.16) and environmental uncertainty proxies, i.e. R&D (0.23), Sales variability (0.15).
Consistent with H2, Disclosure is correlated with Consensus (p) (0.16) and Forecast dispersion (-
0.17). Disclosure is negatively correlated with Share price volatility (-0.23). Finally, as expected,
R&D intensity is positively correlated with Reverse of industry concentration (0.11) and Sales
variability (0.19). Firms facing high competition and unstable sales have an incentive to innovate
to survive in the product market.
[Insert Table 3]
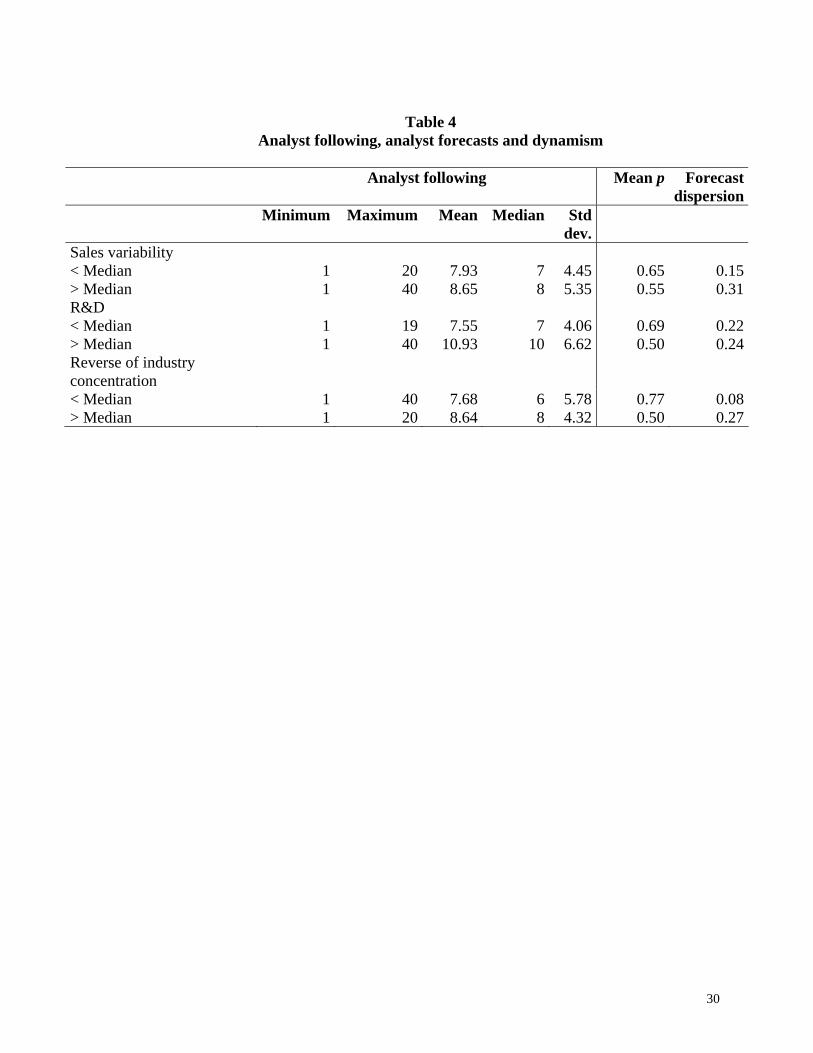
From table 4, we observe that analyst following, consensus (p) and forecast dispersion
vary according to the level of dynamism. As expected, dynamic firms are followed by more
analysts, show lower consensus and higher forecast dispersion.
[Insert table 4]
4.2 Multivariate analyses
Since we posit that a firm’s information dynamics may affect customer value disclosure,
analyst following as well as analyst forecasts simultaneously, we first assess whether or not
interaction exists between these variables using Hausman tests (without the interaction term for
dynamism). Based on this procedure, we reject the null hypothesis of no endogeneity with respect
to Consensus (p) and Disclosure (t=-4.19; p < 0.00). Therefore, these variables are treated
endogenously. In light of this diagnostic, we rely on a three-stage estimation model for the
simultaneous test of consensus (p) and customer value disclosure. 3SLS (which combines 2SLS
22
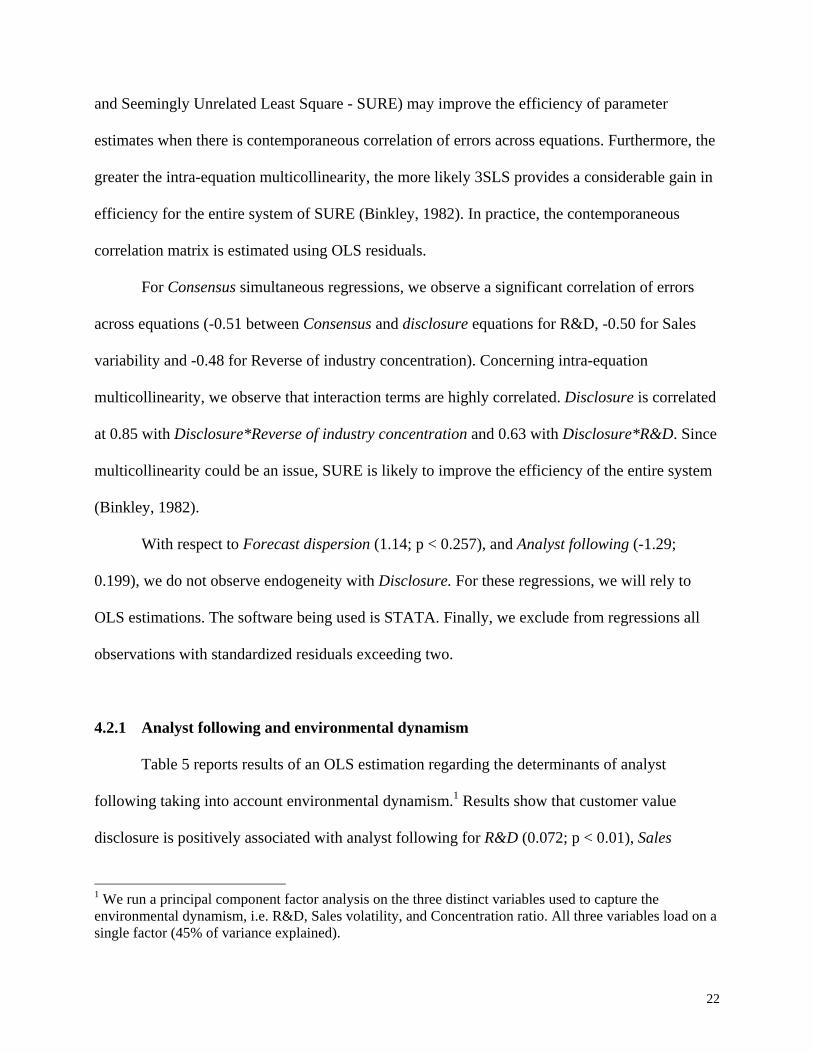
and Seemingly Unrelated Least Square - SURE) may improve the efficiency of parameter
estimates when there is contemporaneous correlation of errors across equations. Furthermore, the
greater the intra-equation multicollinearity, the more likely 3SLS provides a considerable gain in
efficiency for the entire system of SURE (Binkley, 1982). In practice, the contemporaneous
correlation matrix is estimated using OLS residuals.
For Consensus simultaneous regressions, we observe a significant correlation of errors
across equations (-0.51 between Consensus and disclosure equations for R&D, -0.50 for Sales
variability and -0.48 for Reverse of industry concentration). Concerning intra-equation
multicollinearity, we observe that interaction terms are highly correlated. Disclosure is correlated
at 0.85 with Disclosure*Reverse of industry concentration and 0.63 with Disclosure*R&D. Since
multicollinearity could be an issue, SURE is likely to improve the efficiency of the entire system
(Binkley, 1982).
With respect to Forecast dispersion (1.14; p < 0.257), and Analyst following (-1.29;
0.199), we do not observe endogeneity with Disclosure. For these regressions, we will rely to
OLS estimations. The software being used is STATA. Finally, we exclude from regressions all
observations with standardized residuals exceeding two.
4.2.1 Analyst following and environmental dynamism
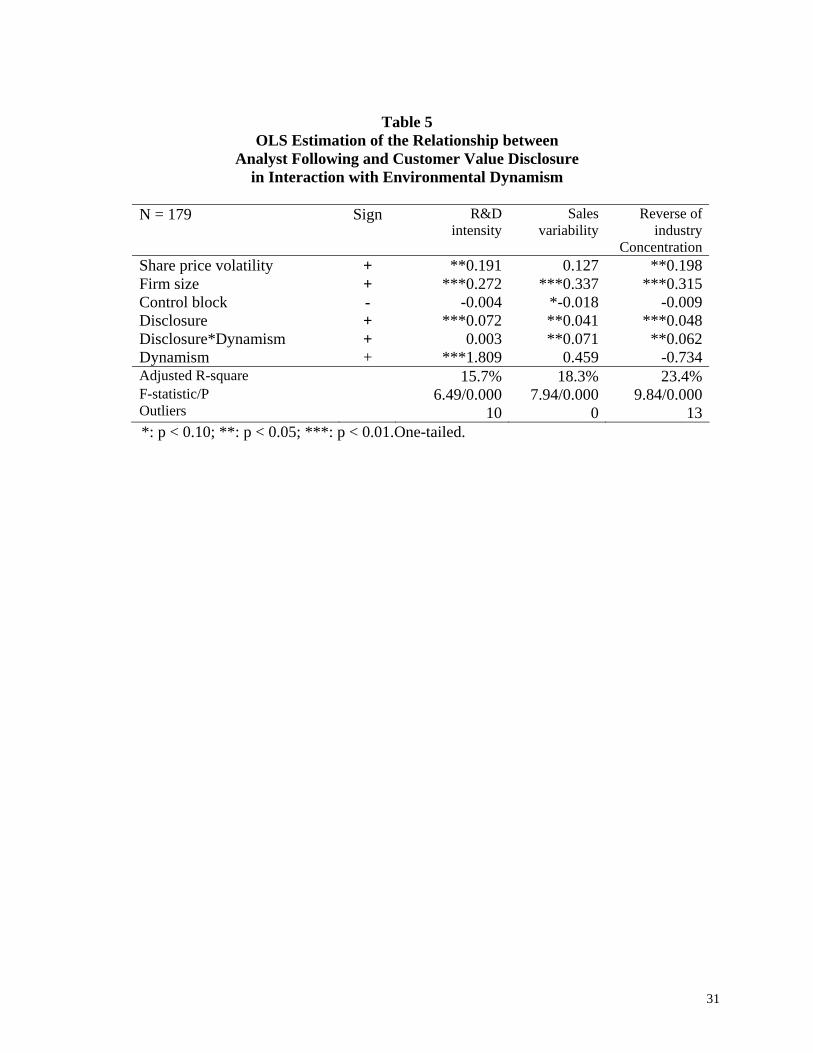
Table 5 reports results of an OLS estimation regarding the determinants of analyst
following taking into account environmental dynamism.1 Results show that customer value
disclosure is positively associated with analyst following for R&D (0.072; p < 0.01), Sales
1 We run a principal component factor analysis on the three distinct variables used to capture the environmental dynamism, i.e. R&D, Sales volatility, and Concentration ratio. All three variables load on a single factor (45% of variance explained).
23
variability (0.0.041; p < 0.05), and Reverse of industry concentration regressions (0.048; p <
0.01) since the coefficient on Disclosure is positive and significant. This is consistent with
hypothesis 1. Consistent with hypothesis 3, environmental dynamism enhances the association
between customer value disclosure and analysts following since coefficients on interaction terms
are positive and significant in all three regressions.
As a sensitivity analysis, since the marginal effect of the number of analysts following a
firm is likely to decrease, we use the logarithm of one plus the number of analysts who follow the
firm as a measure of analyst following. Results (not tabulated) remain almost similar to those
provided in table 5.
[Insert Table 5]
4.2.2 Analyst forecasts, disclosure and environmental dynamism
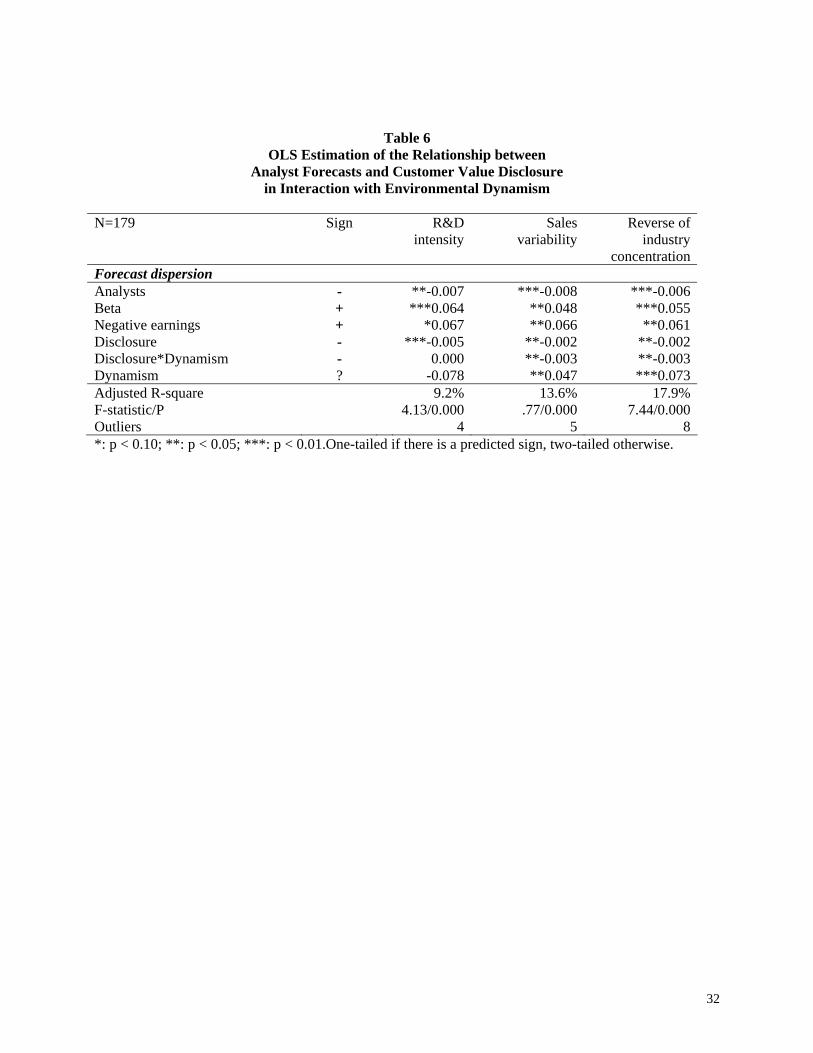
Table 6 reports results of OLS regression estimations regarding the determinants of
forecast dispersion. As expected, we observe that customer value disclosure decreases analyst
forecast dispersion. This is consistent with hypothesis 2. As expected, consistent with hypothesis
4, this relation is enhanced for dynamic firms, as expressed by Disclosure and Sales variability (-
0.003; p < 0.05), and the Reverse of industry concentration (-0.003; p < 0.05). Moreover,
dynamism in itself increases forecast dispersion in the case of sales variability (0.047; p < 0.01)
and competition (0.073; p < 0.01).
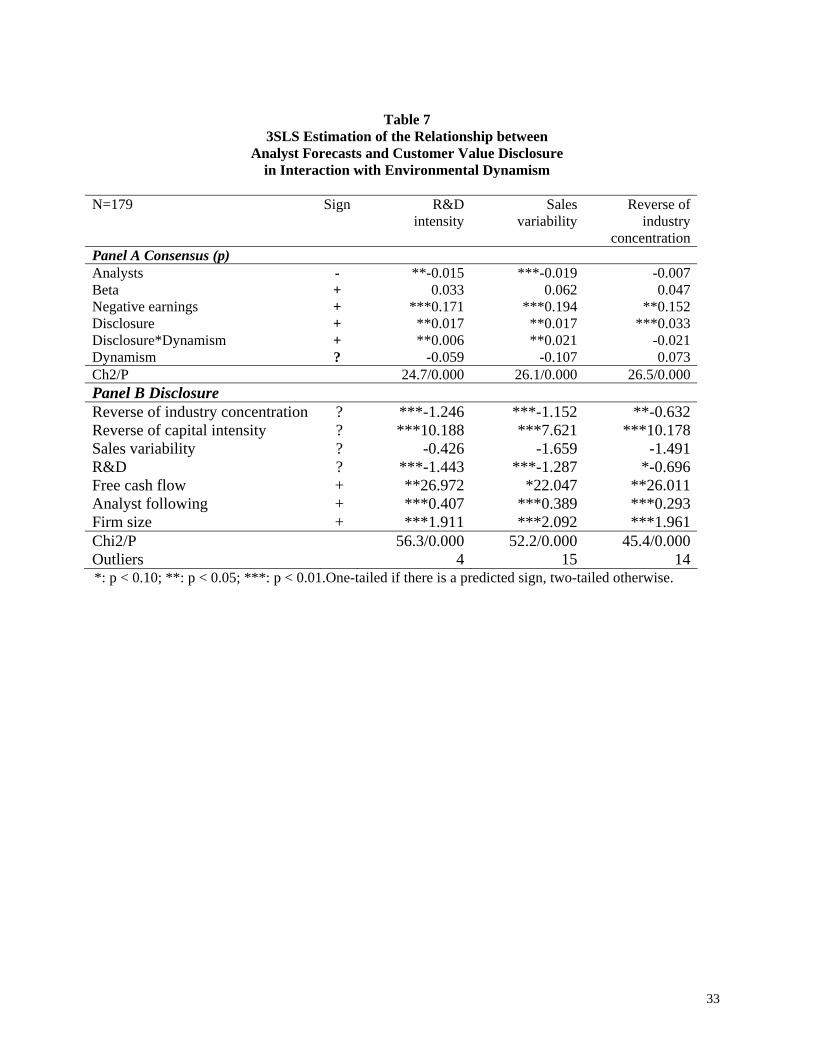
In panel A of Table 7, we present simultaneous test of analyst forecasts and customer
value disclosure for the precision of common information, i.e. consensus (p), treating the
determinants of customer disclosure as instruments in 3SLS estimations. As expected, consistent
with hypothese 2, we observe that customer value disclosure increases common information
24
among analysts. Coefficients on Disclosure are positive and significant in all three regressions.
This relation is enhanced for dynamic firms, as expressed by Disclosure and the level of R&D
(0.006; p < 0.05), and Sales variability (0.021; p < 0.05). This is consistent with hypothesis 4.
[Insert Table 6]
Panel B of Table 7 presents the results for the disclosure regressions. Our findings show
that coefficients on Reverse of Capital intensity, Free cash flow, Analyst following and Firm size
are positively and statistically associated with customer value disclosure in all three regressions
while the coefficient on Reverse of industry concentration and R&D are negatively related to
Disclosure for the three regressions. Consistent with prior research, voluntary disclosure is
positively related to analyst following, free cash flow and firm size.
As for competition, the higher competition at the industry level, the less the firm discloses
information about its customers. This is consistent with Dye’s (1985) assertion that an incumbent
firm with good news to communicate may choose to withhold information to prevent
competition. However, the less barriers to entry at the firm level, as expressed by the reverse of
capital intensity, the more the firms seems to release information about its customers. This result
is consistent with Darrough and Stoughton (1990) who assess that the more it is difficult to enter
a market, the more confident the incumbents will feel about disclosing information.
As mentioned earlier, the industry concentration ratio is computed at country-level and
does not take into account foreign competition. As a sensitivity analysis, we add the number of
geographic segments as a control variable in the disclosure regression. The coefficient on the
variable Geographical segments is not significant and results for the three regression models
remain similar as those presented in table 7.

25
The ability of a firm to support proprietary costs, as proxied by Free cash flow, is
positively related to Disclosure for all three regressions.
[Insert table 7]
5. Discussion and conclusion
Environmental dynamism is the most important contributor to environmental uncertainty
(Duncan, 1972). Uncertainty is one of the most powerful contextual variables affecting
organizational design and managerial decisions (Ghosh and Olsen, 2009). Therefore, it should
also affect the process of forecasting earnings. In this paper, we build on prior literature on
voluntary disclosure by investigating the relationship between analyst following, analyst forecasts
and customer value disclosure considering environmental dynamism.
First, results suggest that customer value disclosure attracts financial analysts. Our results
show that customer value disclosure is positively associated with analyst following. Second, it
appears that customer value disclosure increases consensus among financial analysts and forecast
dispersion. Third, environmental dynamism enhances the association between customer value
disclosure and analyst following. Finally, environmental dynamism enhances the association
between customer value disclosure and consensus in analyst earnings forecasts.
The present study contributes to our knowledge of voluntary disclosure in the following
manner. Our findings reveal that the relations between customer value disclosure, analyst
following and analyst forecasts are not straightforward but depend on a firm’s environmental
uncertainty. Such insights may help standard setters and regulators in the development of new
and effective disclosure guidelines.
26
The results of this study should be interpreted with caution at least two reasons. Our
model is sensitive to the choice and validity of independent variables, especially those treated
endogenously. To mitigate specification error, we base the choice of explanatory variables on
prior empirical studies. However, it does not completely eliminate the potential for model
misspecification and bias of the regression coefficients. Second, our measure of disclosure is
based on a coding instrument that assumes the relevance of the information collected. However,
selected items may not fully capture the underlying phenomenon.
Prior research documents that institutional characteristics affect the information
environment across countries, thus potentially influencing analysts’ costs and benefits from
collecting and processing corporate information. A country’s governance regime affects both the
quality of voluntary disclosure and the effectiveness of its use by stock market participants (Roe,
2003). Since investor protection rights vary internationally, an objective for future research could
be to analyze different governance regimes. For example, it would be interesting to assess the
moderating role of country-level governance mechanisms and market regulation on the relation
between environmental uncertainty and analysts’ decision to cover a firm as well as the quality of
their forecasts.
27
Table 1
Customer value disclosure Component Scores
Min. Max. Mean Std
dev.Distinct attributes of products / Brands / Range of products / Competitive advantage
0 34 1.89 4.47
Reliability: errors / returns 0 13 0.53 1.69Price 0 9 0.46 1.47Delivery time 0 6 0.25 0.97Awards 0 20 0.66 2.69Product security 0 15 0.48 1.81Product life cycle (launch, growth, maturity, decline)
0 3 0.10 0.49
Advertising and product promotion (launching, marketing)
0 7 0.26 1.01
Customer profile / market segment / market share / number of customers
0 45 2.62 5.52
Pre-sales support: information / counseling / order tracking
0 7 0.47 1.32
After-sales service / insurance/repair 0 13 0.46 1.48Customer satisfaction / complaints management 0 13 0.39 1.55Customer loyalty 0 5 0.11 0.58Program loyalty 0 12 0.41 1.67Order backlog 0 15 0.18 1.20Total score 0 79 9.51 15.55
28
Table 2 Descriptive statistics
Minimum Maximum Mean Median Std dev.Analyst following 0 40 6.80 5.00 5.67p -0.37 0.99 0.59 0.76 0.41Forecast dispersion 0.001 2.22 0.23 0.11 0.36Systematic risk 0 4.61 1.12 1.00 0.72Share price volatility 2.10 18.00 6.38 5.95 2.63Control block (%) 0.01 94.3 22.46 14.02 26.36R&D (in % of sales) 0 79.25 0.54 0.00 5.91Sales variability (ABS Net change in sales)
0 8.47 0.51 0.25 1.02
Reverse of concentration ratio 0.79 0.99 0.95 0.97 0.04Reverse of capital intensity 0.03 0.99 0.49 0.44 0.31Firm size (total assets in million $) 107 143 671 7 575 2 350 16 925Free cash flow -0.02 0.26 -0.01 0.01 0.09
29
Table 3
Correlations
2 3 4 5 6 7 8 9 10 11 12 13 1 Analyst following 0.03 -0.11 *0.14 *0.11 *0.18 *-0.11 *0.23 *0.15 -0.11 0.04 *0.16 0.01 2 p 1 0.02 -0.10 0.00 *0.16 *0.13 -0.05 0.01 *0.26 *-0.14 0.09 *0.11 3 Forecast dispersion 1 0.05 0.11 *-0.17 -0.02 -0.06 0.03 -0.02 -0.05 *-0.19 *-0.12 4 Systematic risk 1 *0.59 *-0.27 0.04 *0.27 *0.17 *-0.25 *0.40 *-0.16 *-0.24 5 Share price volatility 1 *-0.23 *0.19 *0.19 *0.18 *-0.12 *0.37 *-0.25 *-0.21 6 Disclosure customers 1 *-0.13 -0.06 -0.10 *0.25 *-0.24 *0.31 *0.25 7 Control block 1 0.03 0.04 0.04 *0.12 *-0.28 *0.14 8 R&D 1 *0.24 -0.04 *0.15 0.10 -0.09 9 Sales variability 1 -0.03 0.08 *-0.17 *-0.24 10 Reverse of capital
intensity 1 -0.09 -0.06 *0.30
11 Reverse of concentration ratio
1 *-0.17 -0.08
12 Firm size 1 *0.15 13
Free cash flow 1
Note: *: p < 0.10.
30
Table 4
Analyst following, analyst forecasts and dynamism
Analyst following Mean p Forecast dispersion
Minimum Maximum Mean Median Std dev.
Sales variability < Median > Median
11
2040
7.938.65
78
4.45 5.35
0.650.55
0.150.31
R&D < Median > Median
11
1940
7.5510.93
710
4.06 6.62
0.690.50
0.220.24
Reverse of industry concentration
< Median > Median
11
4020
7.688.64
68
5.78 4.32
0.770.50
0.080.27
31
Table 5
OLS Estimation of the Relationship between Analyst Following and Customer Value Disclosure
in Interaction with Environmental Dynamism
N = 179 Sign R&D intensity
Sales variability
Reverse of industry
ConcentrationShare price volatility + **0.191 0.127 **0.198Firm size + ***0.272 ***0.337 ***0.315Control block - -0.004 *-0.018 -0.009Disclosure + ***0.072 **0.041 ***0.048Disclosure*Dynamism + 0.003 **0.071 **0.062Dynamism + ***1.809 0.459 -0.734Adjusted R-square 15.7% 18.3% 23.4%F-statistic/P Outliers
6.49/0.00010
7.94/0.000 0
9.84/0.00013
*: p < 0.10; **: p < 0.05; ***: p < 0.01.One-tailed.
32
Table 6 OLS Estimation of the Relationship between
Analyst Forecasts and Customer Value Disclosure in Interaction with Environmental Dynamism
N=179 Sign R&D
intensitySales
variability Reverse of
industry concentration
Forecast dispersion Analysts - **-0.007 ***-0.008 ***-0.006Beta + ***0.064 **0.048 ***0.055Negative earnings + *0.067 **0.066 **0.061Disclosure - ***-0.005 **-0.002 **-0.002Disclosure*Dynamism - 0.000 **-0.003 **-0.003Dynamism ? -0.078 **0.047 ***0.073Adjusted R-square 9.2% 13.6% 17.9%F-statistic/P Outliers
4.13/0.000 4
.77/0.000 5
7.44/0.000 8
*: p < 0.10; **: p < 0.05; ***: p < 0.01.One-tailed if there is a predicted sign, two-tailed otherwise.
33
Table 7
3SLS Estimation of the Relationship between Analyst Forecasts and Customer Value Disclosure
in Interaction with Environmental Dynamism
N=179 Sign R&D intensity
Sales variability
Reverse of industry
concentrationPanel A Consensus (p) Analysts - **-0.015 ***-0.019 -0.007Beta + 0.033 0.062 0.047Negative earnings + ***0.171 ***0.194 **0.152Disclosure + **0.017 **0.017 ***0.033Disclosure*Dynamism + **0.006 **0.021 -0.021Dynamism ? -0.059 -0.107 0.073Ch2/P 24.7/0.000 26.1/0.000 26.5/0.000Panel B Disclosure Reverse of industry concentration ? ***-1.246 ***-1.152 **-0.632Reverse of capital intensity ? ***10.188 ***7.621 ***10.178Sales variability ? -0.426 -1.659 -1.491R&D ? ***-1.443 ***-1.287 *-0.696Free cash flow + **26.972 *22.047 **26.011Analyst following + ***0.407 ***0.389 ***0.293Firm size + ***1.911 ***2.092 ***1.961Chi2/P Outliers
56.3/0.0004
52.2/0.000 15
45.4/0.00014
*: p < 0.10; **: p < 0.05; ***: p < 0.01.One-tailed if there is a predicted sign, two-tailed otherwise.
34
References
Ackert, L.F. and Athanassakos, G. (2003), “A Simultaneous Equations Analysis of Analysts’
Forecast Bias, Analyst Following, and Institutional Ownership”, Journal of Business
Finance & Accounting, vol. 30, No. 7/8, pp. 1017-1042.
Aerts, W., D. Cormier and Magnan, M. (2007), “The Association between Web-Based
Performance Disclosure and Financial Analyst Behaviour under Different Governance
Regimes”, Corporate Governance: An International Review, vol. 15, No. 6, pp. 1301-1329.
Amir, E. and Lev, B. (1996), “Value-Relevance of Non-Financial Information: The Wireless
Communication Industry”, Journal of Accounting and Economics, vol. 22, Nos. 1/3, pp. 3-
30.
Anagnostopoulou, S. and Levis, M. (2008), “R&D and Performance Persistence: Evidence from
the United Kingdom”, International Journal of Accounting, vol.43, No. 3, pp. 293-320.
Anderson, E.W., C. Fornell and Lehmann, D.R. (1994), “Customer Satisfaction, Market Share,
and Profitability: Findings from Sweden”, Journal of Marketing, vol. 58, No. 3, pp. 53-66.
Arya, A. and Mittendorf, B. (2007), “The Interaction among Disclosure, Competition between
Firms, and Analyst Following”, Journal of Accounting and Economics, vol. 43, pp. 321-339.
Banker, R.D., Potter, G. and D. Srinivasan, D. (2000), “An Empirical Investigation of an
Incentive Plan that Includes Nonfinancial Performance Measures”, The Accounting Review,
vol. 75, No. 1, pp. 65-92.
Barron, O.E., O. Kim, S. Lim and Stevens, D.E. (1998), “Using Analysts' Forecasts to Measure
Properties of Analysts' Information Environment”, The Accounting Review, vol. 73, No. 4,
pp. 421-433.
Barron, O.E., Kile, C.O. and O’Keefe, T.B., “MD&A Quality as Measured by the SEC and
Analysts’ Earnings Forecasts”, Contemporary Accounting Research, vol. 16, No. 1, pp 75-
109.
Barth, M.E., R. Kasznik and McNichols, M.F. (2001), “Analyst Coverage and Intangible Assets”,
Journal of Accounting Research, vol. 39, No.1, pp. 1-34.
Bhushan, R. (1989), “Firm Characteristics and Analyst Following”, Journal of Accounting and
Economics, vol. 11, Nos. 2&3, pp. 255-275.
35
Binkley J.K. (1982), “The Effect of Variable Correlation on the Efficiency of Seemingly
Unrelated Regression in a Two-Equation Model”, Journal of the American Statistical
Association, vol. 77, pp. 890-895.
Botosan, C. (1997), “Disclosure Level and the Cost of Equity Capital”, The Accounting Review,
vol. 72, No. 3, pp. 323-349.
Branson, B. and Pagach, D. (2005), “Earnings Predictability: Do analysts Make Coverage
Choices Based on Ease of forecasts?”, The Journal of American Academy of Business, vol. 7,
No. 1, pp. 1-7.
Bushman, R. and Smith, A.J. (2003), “Transparency, Financial Accounting Information, and
Corporate Governance”, Economic Policy Review, vol. 9, No.1, pp. 65-87.
Cooper, R.A., T.E. Day. and Lewis, C.M. (2001), “Following the Leader: A Study of Individual
Analysts’ Earnings Forecasts”, Journal of Financial Economic, vol. 61, No. 3, pp. 383-416.
Cormier, D., W. Aerts, M.J. Ledoux and Magnan, M. (2009a), “Attributes of Social and Human
Capital Disclosure and Information Asymmetry between Managers and Investors”, Canadian
Journal of Administrative Sciences, vol. 26, No. 1, pp. 71-88.
Cormier, D., M.J. Ledoux and Magnan, M. (2009b), “The Use of Web Sites as a Disclosure
Platform for Corporate Performance”, International Journal of Accounting Information
Systems, vol. 10, No. 1, pp. 1-24.
Darrough, M. and Stoughton, N. (1990), “Financial Disclosure Policy in an Entry Game”,
Journal of Accounting and Economics, vol. 21, pp. 219-243.
Dechow, P. M., Sloan, R., Sweeney, A.P. (1996), “‘Causes and Consequences of Earnings
Manipulation: An Analysis of Firms Subject to Enforcement Actions by the SEC”,
Contemporary Accounting Research, vol.13, No.1, pp. 1-36.
Dempsey, S. J., J.F. Gatti, D.J. Grinnell and Cats-Baril, W.L. (1997), “The Use of Strategic
Performance Variables as Leading Indicators in Financial Analysts' Forecasts”, The Journal
of Financial Statement Analysis, vol. 2, No. 4, pp. 61-79.
Dess, G.G. and Beard, D.W. (1984), “Dimensions of Organizational Task Environments”,
Administrative Science Quarterly, vol. 29, pp. 52-73.
Duncan, R.B. (1972), “Characteristics of Organizational Environments and Perceived
Environmental Uncertainty”, Administrative Science Quarterly, vol. 17, pp. 313-327.

36
Dye, R. (1985), “Disclosure of Nonproprietary Information”, Journal of Accounting Research,
vol. 23 (spring), pp. 123-145.
Ghosh, D. and Olsen, L. (2009), “Environmental Uncertainty and Managers’ Use of discretionary
Accruals”, Accounting, Organizations and society, vol. 34, pp. 188-205.
Healy, P., A.P. Hutton and Palepu, K.G. (1999), “Stock Performance and Intermediation Changes
Surrounding Sustained Increases in Disclosure”, Contemporary Accounting Research, vol.
16, No. 3, pp. 485-520.
Higgins, H.N. (1998), “Financial Analyst Forecast Performance in Seven Countries”, Financial
Analysts Journal, vol. 54, No.3, pp. 58-62.
Hong, H.Y. and Kubik, J.D. (2003), “What Determine Financial Analysts’ Career Outcomes
during Mergers?”, Journal of Finance, vol. LVIII, No.1, pp. 313-351.
Hope, O.K. (2003a), “Disclosure Practices, Enforcement of Accounting Standards and Analysts’
Forecasts Accuracy: An International Study”, Journal of Accounting Research, vol. 41, No.
2, pp. 235-272.
Hope, O.K. (2003b), “Analyst Following and the Influence of Disclosure Components, IPOs and
Ownership Concentration”, Asia-pacific Journal of Accounting and Economics, vol. 10, pp.
117-141.
Ittner, C. and Larcker, D. (1998), “Are Non-Financial Measures Leading Indicators of Financial
Performance? An analysis of Customer Satisfaction”, Journal of Accounting Research, vol.
36 (supplement), pp. 1-35.
Jensen, M. (1986), “Agency Costs of Free Cash Flow, Corporate Finance and Takeovers”,
American Economic Review, vol. 76, No.2, 1986, pp. 323-329.
Kaplan, R.S. and Norton, D.P. (1996), The Balanced Scorecard, Harvard Business School Press,
MA.
Kaplan, R.S. and Norton, D.P. (2004), Strategy Maps: Converting Intangible Assets into Tangible
Outcomes, Harvard Business School Press, MA.
Lang, M., Lins, K.V. and Miller, D.P. (2004), “Concentrated Control, Analyst Following, and
Valuation: Do Analysts Matter When Investors are Protected Least”, Journal of Accounting
Research, vol. 42, No. 3, pp. 589-623.
37
Lang, M., Lins, K.V. and Miller, D.P. (2003), “ADRs, Analysts, and Accuracy: Does Cross
Listing in the United States Improve a Firm’s Information Environment and Increase Market
Value?”, Journal of Accounting Research, vol. 41, No. 2, pp. 317-345.
Lang, M. and Lundholm, R. (1996), “Corporate Disclosure Policy and Analyst Behavior”, The
Accounting Review, vol. 71, No. 4, pp. 467-492.
Leuz, C. (2003), “IAS Versus U.S.GAAP: Information Asymmetry-Based Evidence from
Germany’s New Market”, Journal of Accounting Research, Vol. 41, No. 3, pp. 445-472.
Mikhail, M., Walther, B. and Willis, R. (1999), “Does Forecast Accuracy Matter to Security
Analysts?”, The Accounting Review, vol. 74, No. 2, pp. 185-200.
Neu, D., Warsame, H. and Pedwell, K. (1998), “Managing Public Impressions: Environmental
Disclosures in Annual Reports”, Accounting, Organizations and Society, vol. 23, No. 3, pp.
265-282.
Ngobo, P-V., Casta, J-F. and Ramond, O., “ Is Customer Satisfaction a Relevant Metric for
Financial Analysts?”, Journal of the Academy of Marketing Science, VOL. 40, No. 3, PP.
480-508.
Nunnaly, J. (1978), Psychometric Theory, McGraw Hill, 2nd Edition, New York, NY.
Patton, A. J., and Verardo, M., (2010), “Does Beta Move with News? Firm-Specific Information
Flows and Learning about Profitability”, working paper, Duke University.
Rajgopal, S., Shevlin, T. and Venkatachalam, M. (2003), “Does the Stock Market Fully
Appreciate the Implications of Leading Indicators for Future Earnings? Evidence from Order
Backlog”, Review of Accounting Studies, vol. 8, No. 4, pp. 461-492.
Robb, S., Single, L. and Zarseski, M. (2001), ‘‘Nonfinancial Disclosures Across Anglo-American
Countries,’’ Journal of International Accounting, Auditing and Taxation, vol. 10, No. 1, pp.
71–84.
Roe, M.J. (2003), Political Determinants of Corporate Governance, Oxford University Press,
New York, NY.
Scott, T. (1994), “Incentives and Disincentives for Financial Disclosure: Voluntary Disclosure of
Defined Benefit Pension Plan Information by French Firms”, The Accounting Review, vol.
69, No. 1, pp. 26-43.
Smith, R.E., and Wright, W.F. (2004), “Determinants of Customer Loyalty and Financial
Performance”, Journal of Management Accounting Research, vol. 16, pp. 183-205.
38
Verrecchia, R. (1983), “Discretionary Disclosure”, Journal of Accounting and Economics, vol. 5,
pp. 179-194.
Wagenhofer, A. (1990), “Voluntary Disclosure with a Strategic Opponent”, Journal of
Accounting and Economics, vol. 12, 341-363.
Wang, Z. (2007), “Technology Innovation Market Turbulence”, Review of Economic Dynamics,
vol. 10, No.1, pp. 78-105.
Wiseman, J. (1982), “An Evaluation of Environmental Disclosures Made in Corporate Annual
Reports”, Accounting, Organizations and Society, Vol. 7 No. 4, pp. 53-64.
Womack, K.L. (1996), “Do Brokerage analysts’ Recommendations Have Investment Value?”,
Journal of finance, vol. LI, No.1, pp.137-167.
Wu, J.S. and Zang, A.Y. (2009), “What Determine Financial Analysts’ Career Outcomes During
Mergers?”, Journal of Accounting and Economics, vol. 47, No. 1, pp. 59-86.