Embed Size (px)
Citation preview
APPENDIX D CAFETERIA DATA
Lord Stirling Community School APPENDIX D: Cafeteria Data Nehal M. Youssef
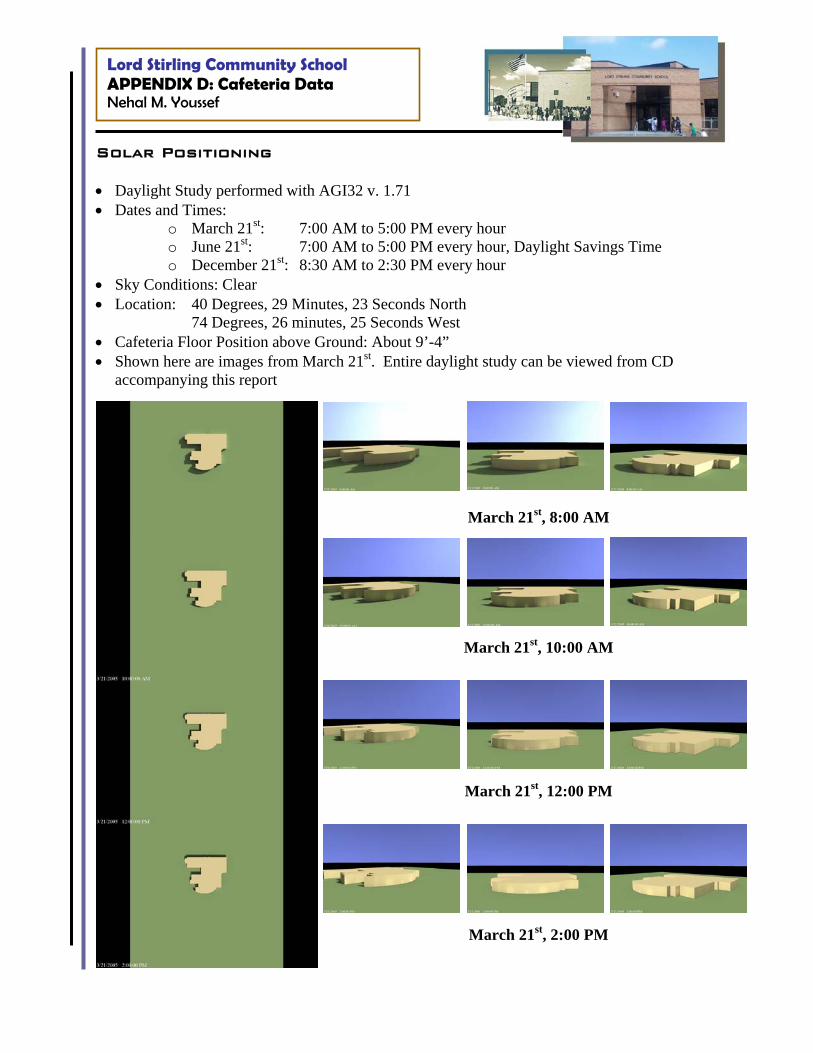
Solar Positioning • Daylight Study performed with AGI32 v. 1.71 • Dates and Times:
o March 21st: 7:00 AM to 5:00 PM every hour o June 21st: 7:00 AM to 5:00 PM every hour, Daylight Savings Time o December 21st: 8:30 AM to 2:30 PM every hour
• Sky Conditions: Clear • Location: 40 Degrees, 29 Minutes, 23 Seconds North
74 Degrees, 26 minutes, 25 Seconds West • Cafeteria Floor Position above Ground: About 9’-4” • Shown here are images from March 21st. Entire daylight study can be viewed from CD
accompanying this report
March 21st, 8:00 AM
March 21st, 10:00 AM
March 21st, 12:00 PM
March 21st, 2:00 PM
Lord Stirling Community School APPENDIX D: Cafeteria Data Nehal M. Youssef
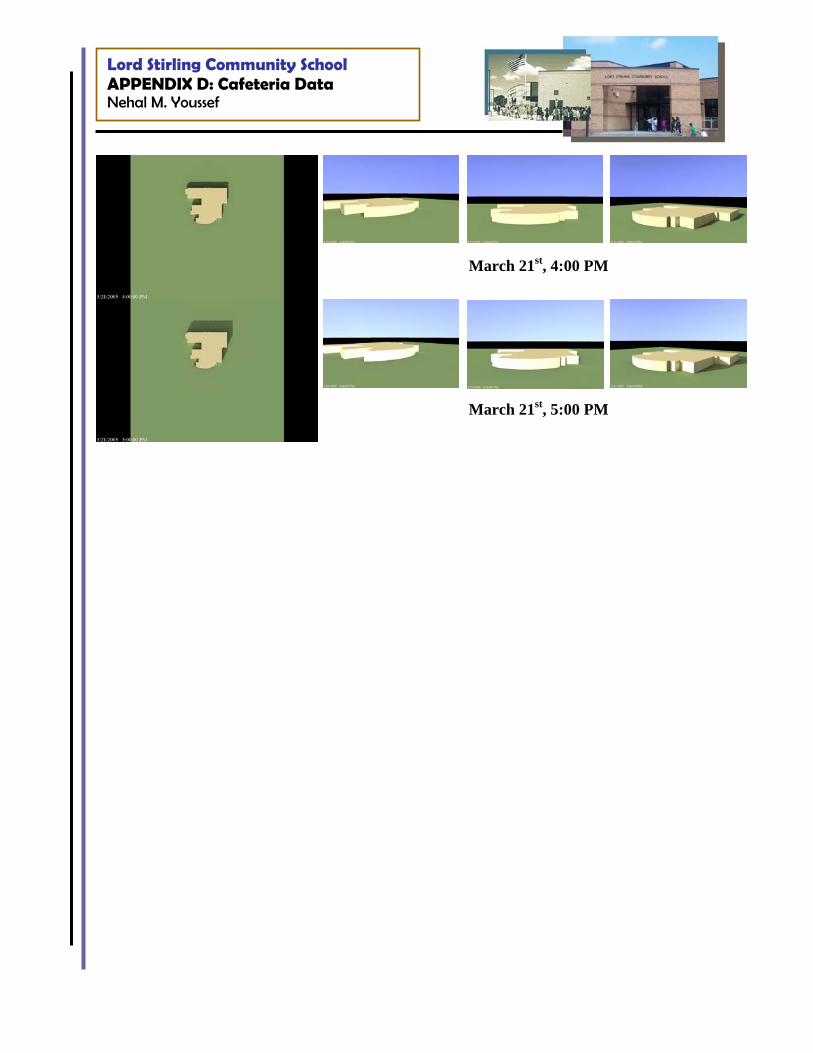
March 21st, 4:00 PM
March 21st, 5:00 PM
Lord Stirling Community School APPENDIX D: Cafeteria Data Nehal M. Youssef
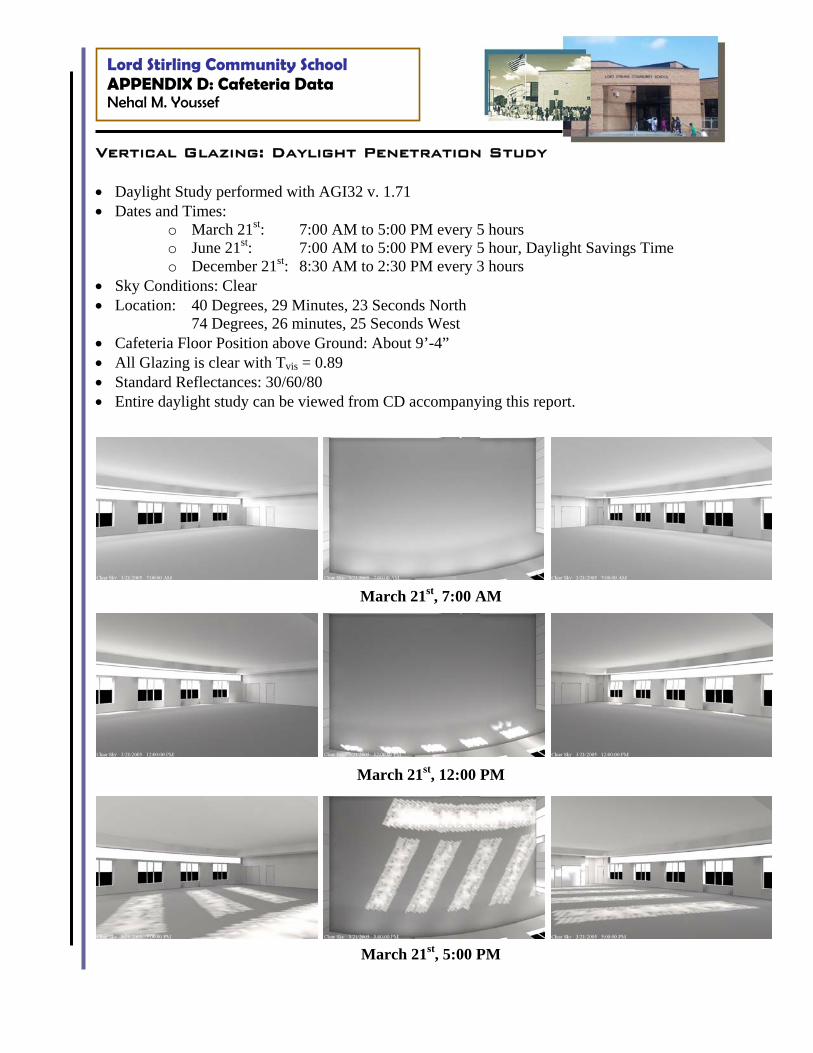
Vertical Glazing: Daylight Penetration Study • Daylight Study performed with AGI32 v. 1.71 • Dates and Times:
o March 21st: 7:00 AM to 5:00 PM every 5 hours o June 21st: 7:00 AM to 5:00 PM every 5 hour, Daylight Savings Time o December 21st: 8:30 AM to 2:30 PM every 3 hours
• Sky Conditions: Clear • Location: 40 Degrees, 29 Minutes, 23 Seconds North
74 Degrees, 26 minutes, 25 Seconds West • Cafeteria Floor Position above Ground: About 9’-4” • All Glazing is clear with Tvis = 0.89 • Standard Reflectances: 30/60/80 • Entire daylight study can be viewed from CD accompanying this report.
March 21st, 7:00 AM
March 21st, 12:00 PM
March 21st, 5:00 PM
Lord Stirling Community School APPENDIX D: Cafeteria Data Nehal M. Youssef
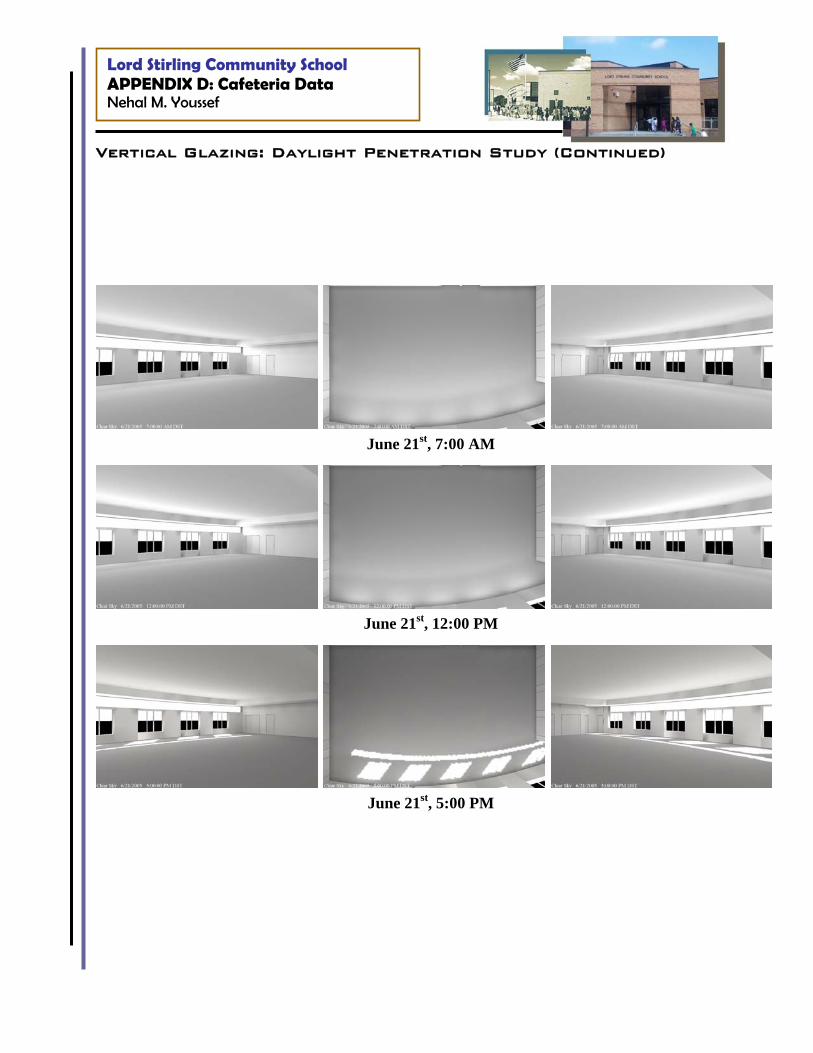
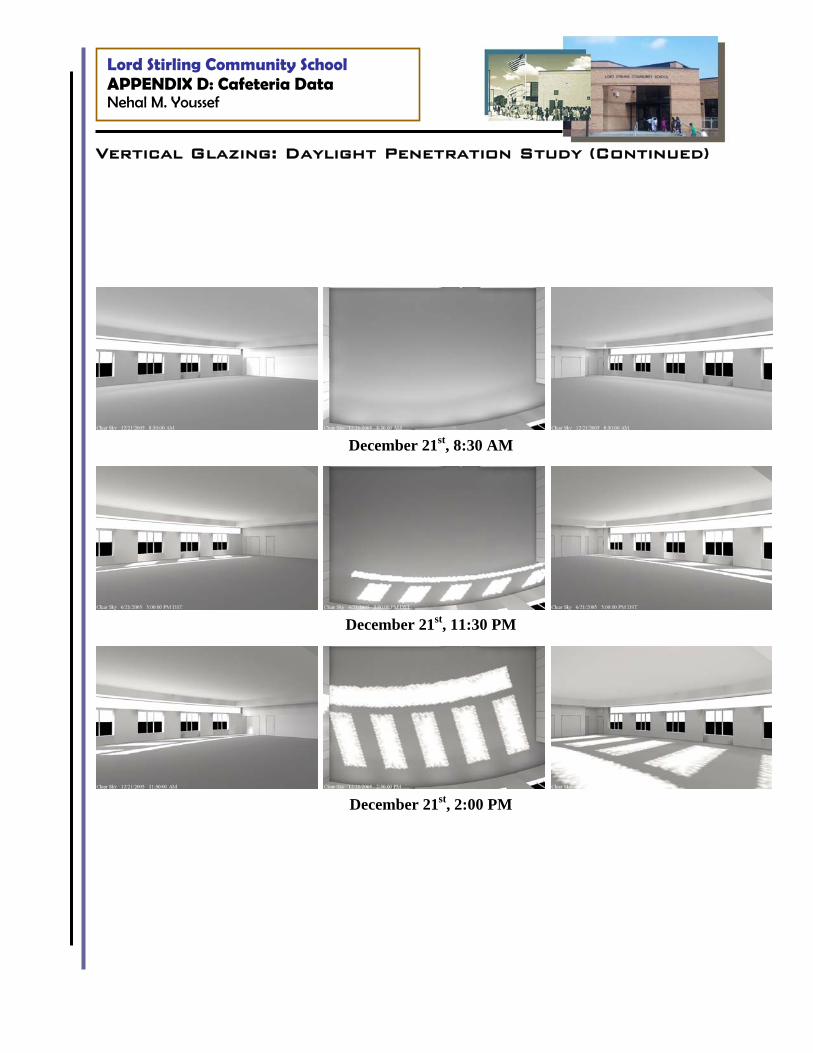
Vertical Glazing: Daylight Penetration Study (Continued)
June 21st, 7:00 AM
June 21st, 12:00 PM
June 21st, 5:00 PM
Lord Stirling Community School APPENDIX D: Cafeteria Data Nehal M. Youssef
Vertical Glazing: Daylight Penetration Study (Continued)
December 21st, 8:30 AM
December 21st, 11:30 PM
December 21st, 2:00 PM
Lord Stirling Community School APPENDIX D: Cafeteria Data Nehal M. Youssef
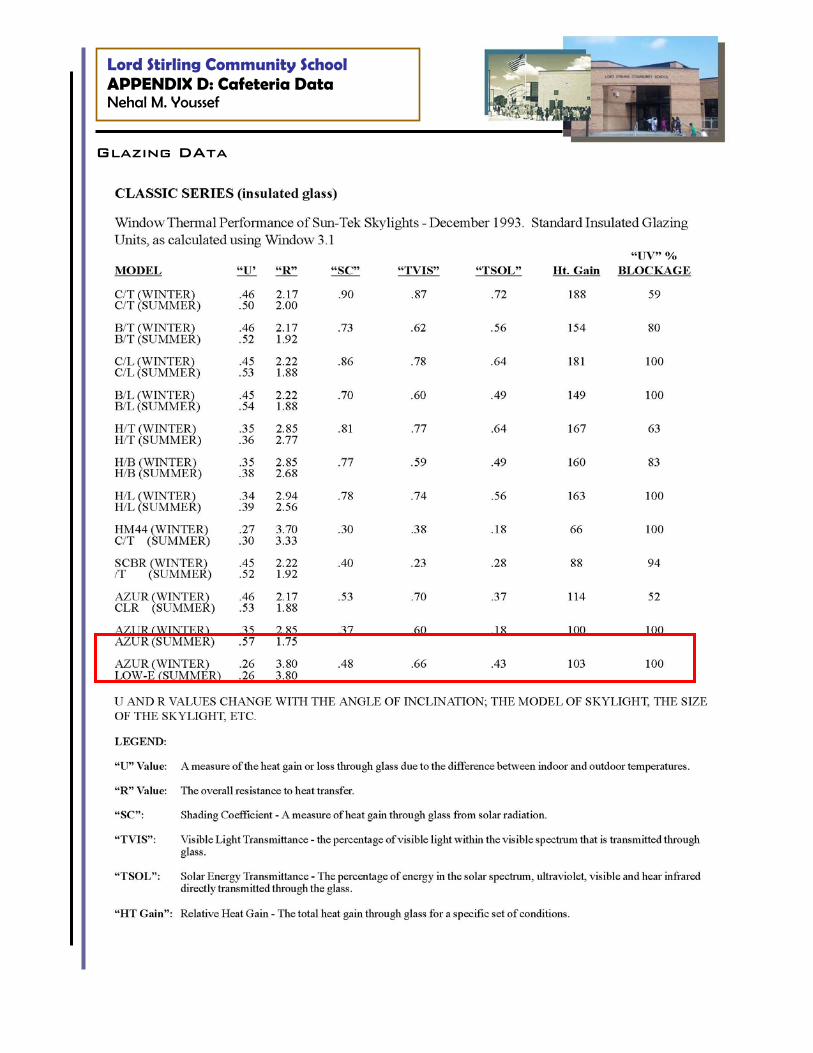
Glazing DAta
CAFETERIA HAP ANALYSIS
COOLING COIL LOAD WITH ADDED SKYLIGHTS
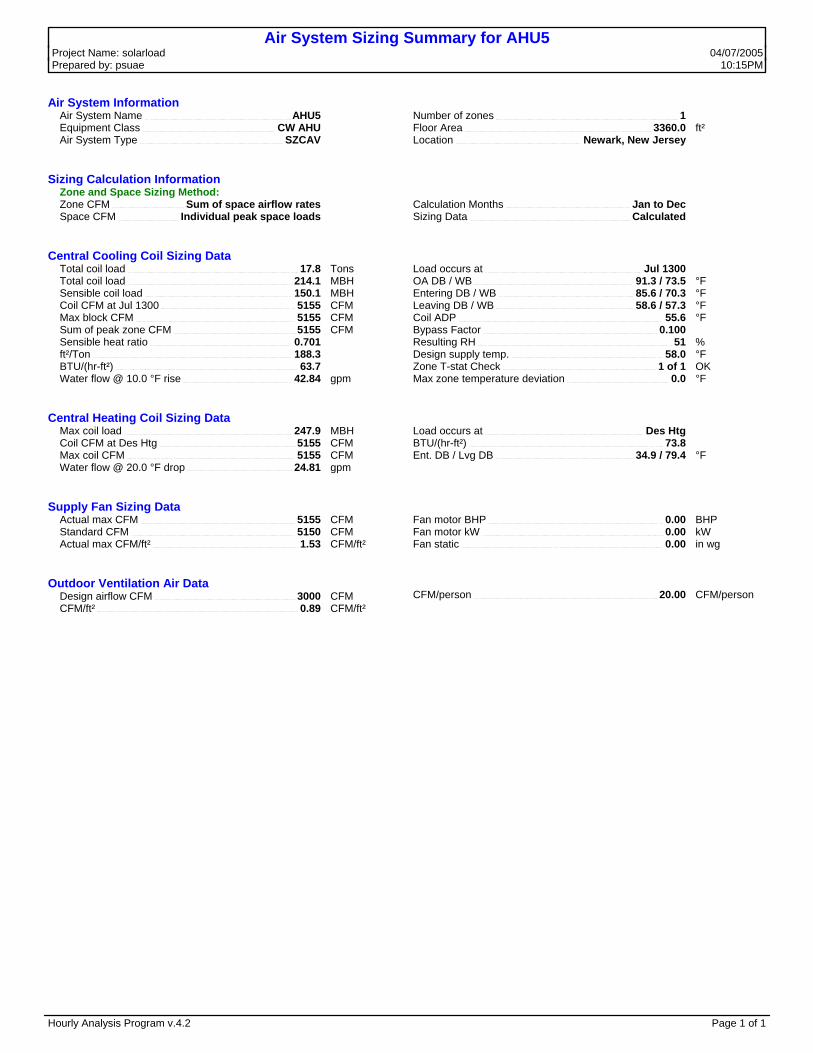
Air System Sizing Summary for AHU5Project Name: solarload 04/07/2005 Prepared by: psuae 10:15PM
Air System Information Air System Name AHU5 Equipment Class CW AHU Air System Type SZCAV
Number of zones 1Floor Area 3360.0 ft²Location Newark, New Jersey
Sizing Calculation Information Zone and Space Sizing Method: Zone CFM Sum of space airflow rates Space CFM Individual peak space loads
Calculation Months Jan to DecSizing Data Calculated
Central Cooling Coil Sizing Data Total coil load 17.8 Tons Total coil load 214.1 MBH Sensible coil load 150.1 MBH Coil CFM at Jul 1300 5155 CFM Max block CFM 5155 CFM Sum of peak zone CFM 5155 CFM Sensible heat ratio 0.701 ft²/Ton 188.3 BTU/(hr-ft²) 63.7 Water flow @ 10.0 °F rise 42.84 gpm
Load occurs at Jul 1300OA DB / WB 91.3 / 73.5 °FEntering DB / WB 85.6 / 70.3 °FLeaving DB / WB 58.6 / 57.3 °FCoil ADP 55.6 °FBypass Factor 0.100Resulting RH 51 %Design supply temp. 58.0 °FZone T-stat Check 1 of 1 OKMax zone temperature deviation 0.0 °F
Central Heating Coil Sizing Data Max coil load 247.9 MBH Coil CFM at Des Htg 5155 CFM Max coil CFM 5155 CFM Water flow @ 20.0 °F drop 24.81 gpm
Load occurs at Des HtgBTU/(hr-ft²) 73.8Ent. DB / Lvg DB 34.9 / 79.4 °F
Supply Fan Sizing Data Actual max CFM 5155 CFM Standard CFM 5150 CFM Actual max CFM/ft² 1.53 CFM/ft²
Fan motor BHP 0.00 BHPFan motor kW 0.00 kWFan static 0.00 in wg
Outdoor Ventilation Air Data Design airflow CFM 3000 CFM CFM/ft² 0.89 CFM/ft²
CFM/person 20.00 CFM/person
Hourly Analysis Program v.4.2 Page 1 of 1
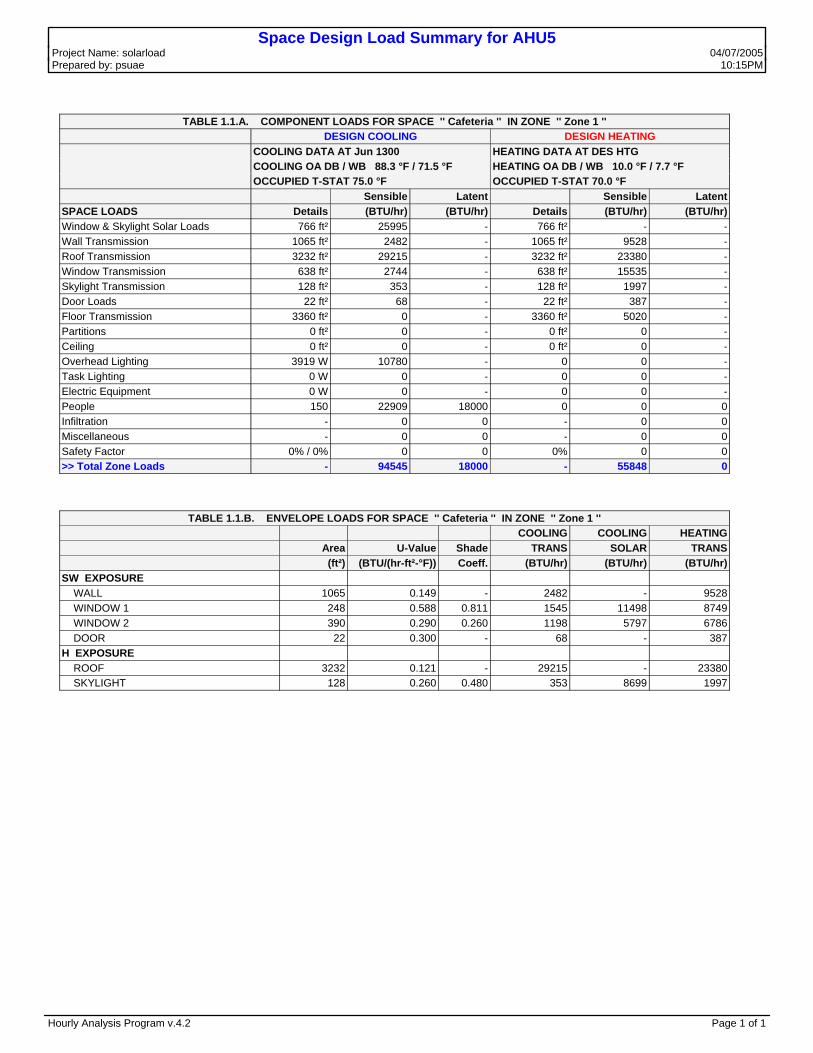
Space Design Load Summary for AHU5Project Name: solarload 04/07/2005 Prepared by: psuae 10:15PM
TABLE 1.1.A. COMPONENT LOADS FOR SPACE '' Cafeteria '' IN ZONE '' Zone 1 '' DESIGN COOLING DESIGN HEATING COOLING DATA AT Jun 1300 HEATING DATA AT DES HTG COOLING OA DB / WB 88.3 °F / 71.5 °F HEATING OA DB / WB 10.0 °F / 7.7 °F OCCUPIED T-STAT 75.0 °F OCCUPIED T-STAT 70.0 °F Sensible Latent Sensible LatentSPACE LOADS Details (BTU/hr) (BTU/hr) Details (BTU/hr) (BTU/hr)Window & Skylight Solar Loads 766 ft² 25995 - 766 ft² - -Wall Transmission 1065 ft² 2482 - 1065 ft² 9528 -Roof Transmission 3232 ft² 29215 - 3232 ft² 23380 -Window Transmission 638 ft² 2744 - 638 ft² 15535 -Skylight Transmission 128 ft² 353 - 128 ft² 1997 -Door Loads 22 ft² 68 - 22 ft² 387 -Floor Transmission 3360 ft² 0 - 3360 ft² 5020 -Partitions 0 ft² 0 - 0 ft² 0 -Ceiling 0 ft² 0 - 0 ft² 0 -Overhead Lighting 3919 W 10780 - 0 0 -Task Lighting 0 W 0 - 0 0 -Electric Equipment 0 W 0 - 0 0 -People 150 22909 18000 0 0 0Infiltration - 0 0 - 0 0Miscellaneous - 0 0 - 0 0Safety Factor 0% / 0% 0 0 0% 0 0>> Total Zone Loads - 94545 18000 - 55848 0
TABLE 1.1.B. ENVELOPE LOADS FOR SPACE '' Cafeteria '' IN ZONE '' Zone 1 '' COOLING COOLING HEATING Area U-Value Shade TRANS SOLAR TRANS (ft²) (BTU/(hr-ft²-°F)) Coeff. (BTU/hr) (BTU/hr) (BTU/hr)SW EXPOSURE WALL 1065 0.149 - 2482 - 9528 WINDOW 1 248 0.588 0.811 1545 11498 8749 WINDOW 2 390 0.290 0.260 1198 5797 6786 DOOR 22 0.300 - 68 - 387H EXPOSURE ROOF 3232 0.121 - 29215 - 23380 SKYLIGHT 128 0.260 0.480 353 8699 1997
Hourly Analysis Program v.4.2 Page 1 of 1

COMPARISON DATA
A H.A.P. ANALYSIS
ELECTRIC LIGHTING ONLY
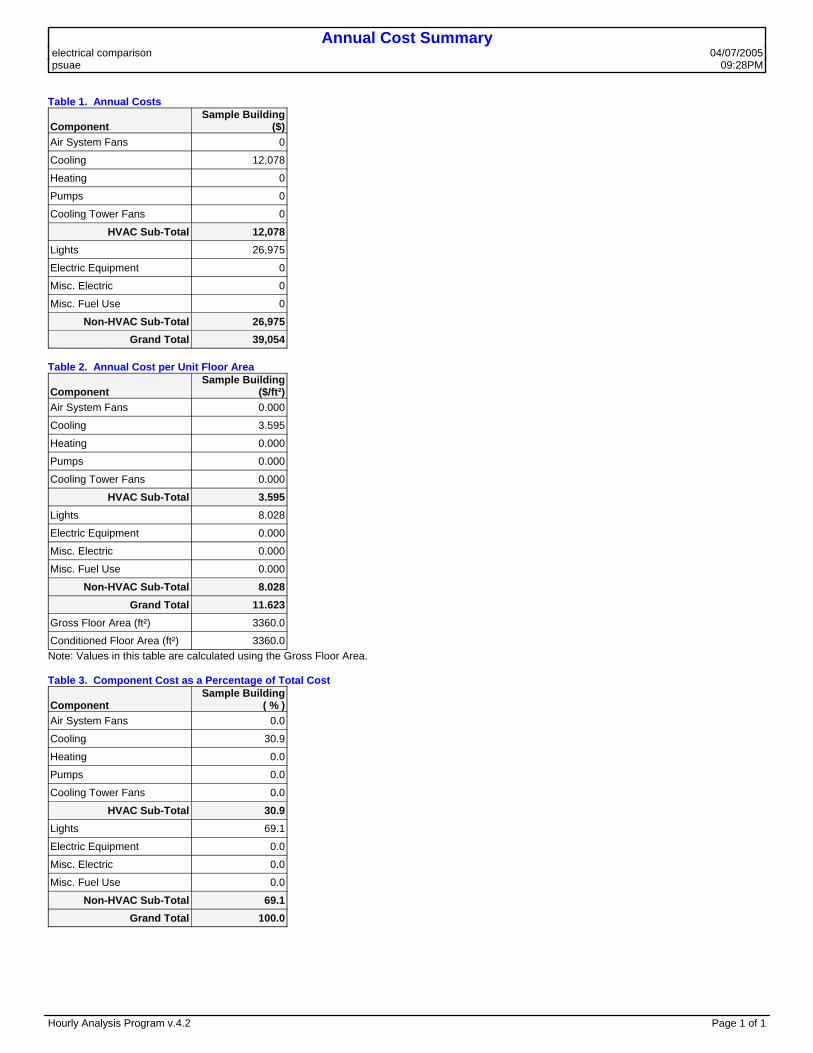
Annual Cost Summaryelectrical comparison 04/07/2005 psuae 09:28PM
Table 1. Annual Costs
ComponentSample Building
($)Air System Fans 0
Cooling 12,078
Heating 0
Pumps 0
Cooling Tower Fans 0
HVAC Sub-Total 12,078Lights 26,975
Electric Equipment 0
Misc. Electric 0
Misc. Fuel Use 0
Non-HVAC Sub-Total 26,975Grand Total 39,054
Table 2. Annual Cost per Unit Floor Area
ComponentSample Building
($/ft²)Air System Fans 0.000
Cooling 3.595
Heating 0.000
Pumps 0.000
Cooling Tower Fans 0.000
HVAC Sub-Total 3.595Lights 8.028
Electric Equipment 0.000
Misc. Electric 0.000
Misc. Fuel Use 0.000
Non-HVAC Sub-Total 8.028Grand Total 11.623
Gross Floor Area (ft²) 3360.0
Conditioned Floor Area (ft²) 3360.0Note: Values in this table are calculated using the Gross Floor Area.
Table 3. Component Cost as a Percentage of Total Cost
ComponentSample Building
( % )Air System Fans 0.0
Cooling 30.9
Heating 0.0
Pumps 0.0
Cooling Tower Fans 0.0
HVAC Sub-Total 30.9Lights 69.1
Electric Equipment 0.0
Misc. Electric 0.0
Misc. Fuel Use 0.0
Non-HVAC Sub-Total 69.1Grand Total 100.0
Hourly Analysis Program v.4.2 Page 1 of 1
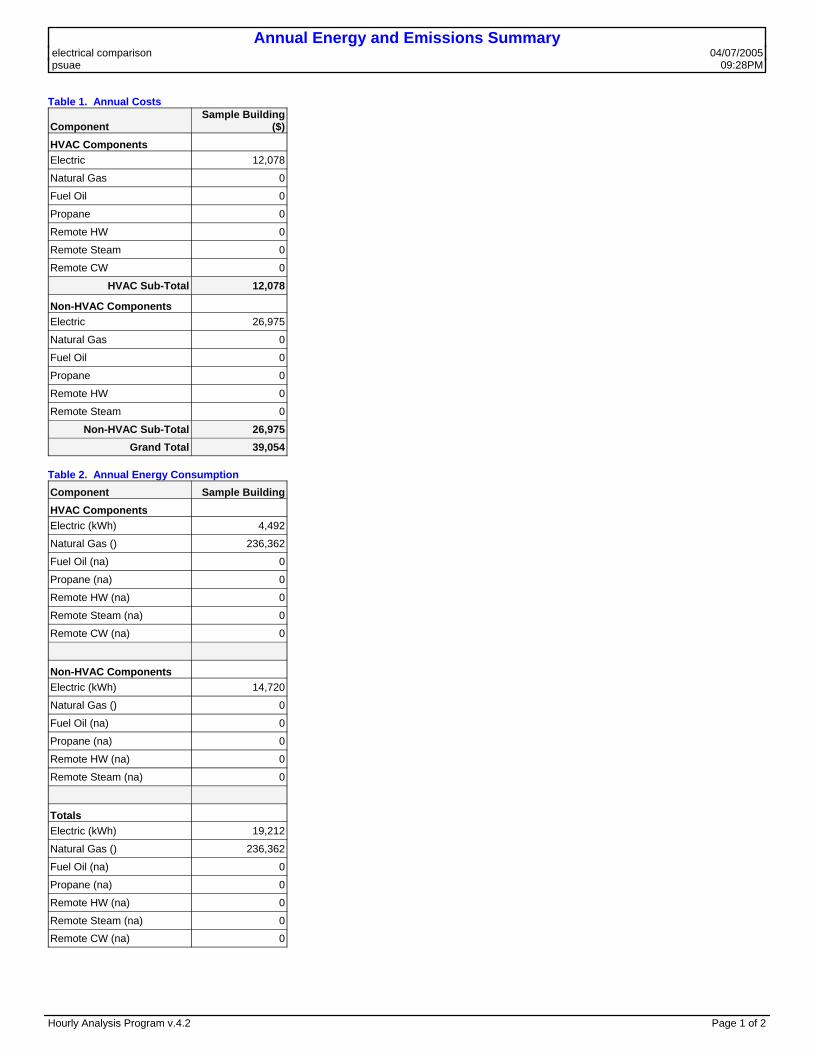
Annual Energy and Emissions Summaryelectrical comparison 04/07/2005 psuae 09:28PM
Table 1. Annual Costs
ComponentSample Building
($)HVAC Components Electric 12,078
Natural Gas 0
Fuel Oil 0
Propane 0
Remote HW 0
Remote Steam 0
Remote CW 0
HVAC Sub-Total 12,078
Non-HVAC Components Electric 26,975
Natural Gas 0
Fuel Oil 0
Propane 0
Remote HW 0
Remote Steam 0
Non-HVAC Sub-Total 26,975Grand Total 39,054
Table 2. Annual Energy ConsumptionComponent Sample BuildingHVAC Components Electric (kWh) 4,492
Natural Gas () 236,362
Fuel Oil (na) 0
Propane (na) 0
Remote HW (na) 0
Remote Steam (na) 0
Remote CW (na) 0
Non-HVAC Components Electric (kWh) 14,720
Natural Gas () 0
Fuel Oil (na) 0
Propane (na) 0
Remote HW (na) 0
Remote Steam (na) 0
Totals Electric (kWh) 19,212
Natural Gas () 236,362
Fuel Oil (na) 0
Propane (na) 0
Remote HW (na) 0
Remote Steam (na) 0
Remote CW (na) 0
Hourly Analysis Program v.4.2 Page 1 of 2
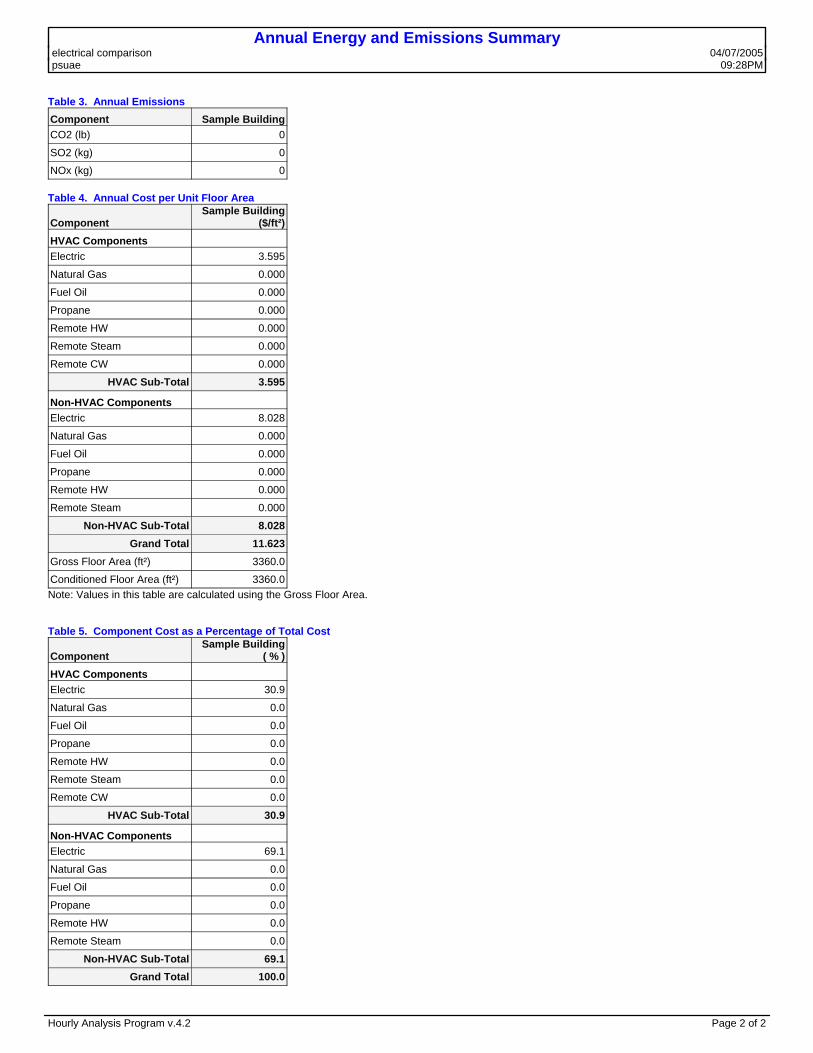
Annual Energy and Emissions Summaryelectrical comparison 04/07/2005 psuae 09:28PM
Table 3. Annual EmissionsComponent Sample BuildingCO2 (lb) 0
SO2 (kg) 0
NOx (kg) 0
Table 4. Annual Cost per Unit Floor Area
ComponentSample Building
($/ft²)HVAC Components Electric 3.595
Natural Gas 0.000
Fuel Oil 0.000
Propane 0.000
Remote HW 0.000
Remote Steam 0.000
Remote CW 0.000
HVAC Sub-Total 3.595
Non-HVAC Components Electric 8.028
Natural Gas 0.000
Fuel Oil 0.000
Propane 0.000
Remote HW 0.000
Remote Steam 0.000
Non-HVAC Sub-Total 8.028Grand Total 11.623
Gross Floor Area (ft²) 3360.0
Conditioned Floor Area (ft²) 3360.0Note: Values in this table are calculated using the Gross Floor Area.
Table 5. Component Cost as a Percentage of Total Cost
ComponentSample Building
( % )HVAC Components Electric 30.9
Natural Gas 0.0
Fuel Oil 0.0
Propane 0.0
Remote HW 0.0
Remote Steam 0.0
Remote CW 0.0
HVAC Sub-Total 30.9
Non-HVAC Components Electric 69.1
Natural Gas 0.0
Fuel Oil 0.0
Propane 0.0
Remote HW 0.0
Remote Steam 0.0
Non-HVAC Sub-Total 69.1Grand Total 100.0
Hourly Analysis Program v.4.2 Page 2 of 2
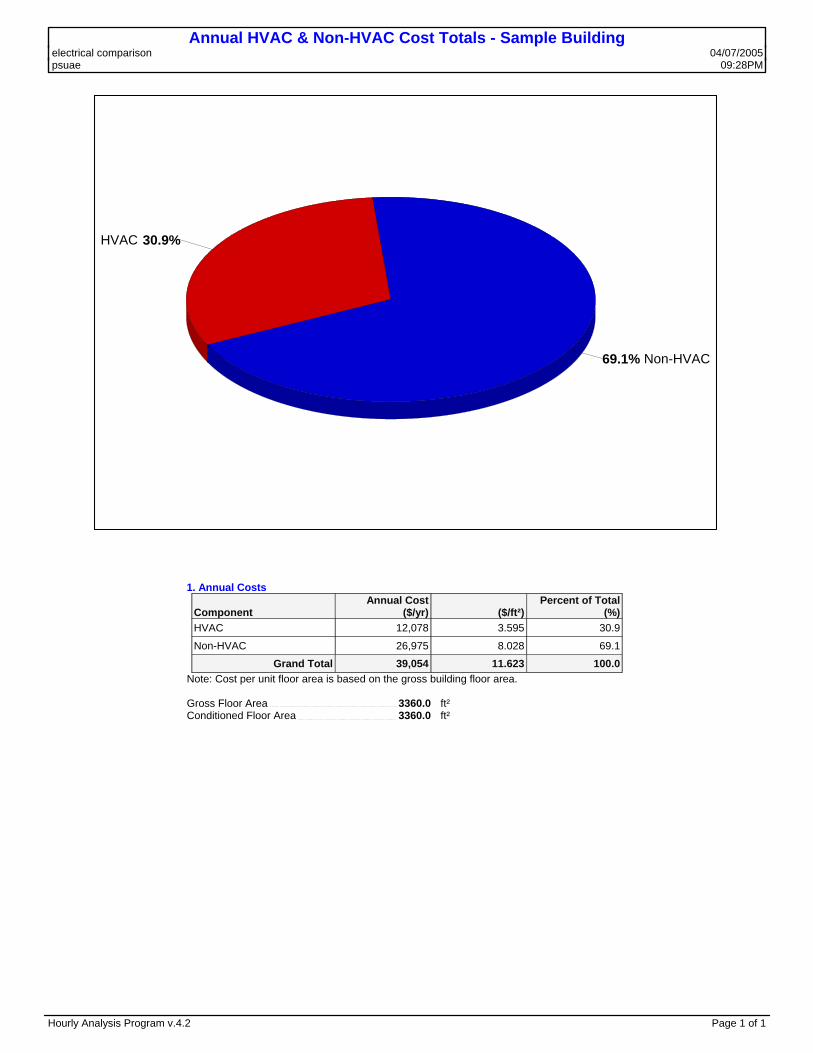
Annual HVAC & Non-HVAC Cost Totals - Sample Buildingelectrical comparison 04/07/2005 psuae 09:28PM
30.9%HVAC
69.1% Non-HVAC
1. Annual Costs
ComponentAnnual Cost
($/yr) ($/ft²)Percent of Total
(%)HVAC 12,078 3.595 30.9
Non-HVAC 26,975 8.028 69.1
Grand Total 39,054 11.623 100.0 Note: Cost per unit floor area is based on the gross building floor area.
Gross Floor Area 3360.0 ft² Conditioned Floor Area 3360.0 ft²
Hourly Analysis Program v.4.2 Page 1 of 1
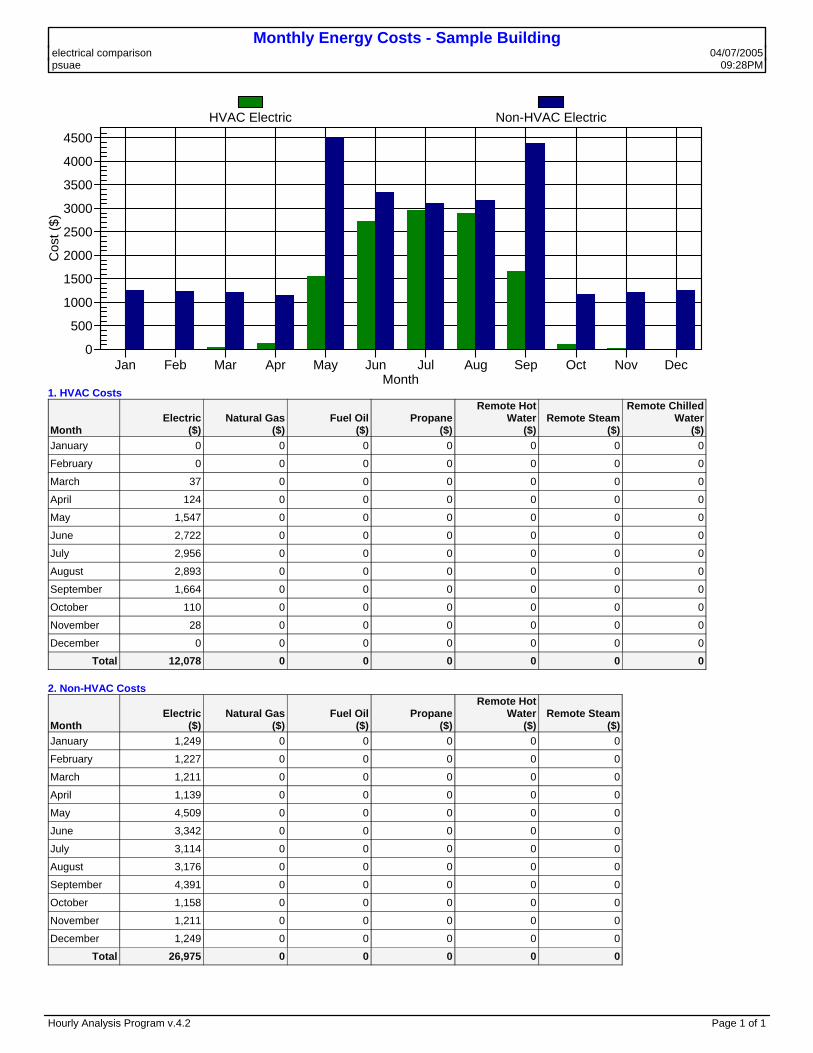
Monthly Energy Costs - Sample Buildingelectrical comparison 04/07/2005 psuae 09:28PM
0
500
1000
1500
2000
2500
3000
3500
4000
4500
Cos
t ($)
MonthJan Feb Mar Apr May Jun Jul Aug Sep Oct Nov Dec
HVAC Electric Non-HVAC Electric
1. HVAC Costs
MonthElectric
($)Natural Gas
($)Fuel Oil
($)Propane
($)
Remote Hot Water
($)Remote Steam
($)
Remote Chilled Water
($)January 0 0 0 0 0 0 0
February 0 0 0 0 0 0 0
March 37 0 0 0 0 0 0
April 124 0 0 0 0 0 0
May 1,547 0 0 0 0 0 0
June 2,722 0 0 0 0 0 0
July 2,956 0 0 0 0 0 0
August 2,893 0 0 0 0 0 0
September 1,664 0 0 0 0 0 0
October 110 0 0 0 0 0 0
November 28 0 0 0 0 0 0
December 0 0 0 0 0 0 0
Total 12,078 0 0 0 0 0 0
2. Non-HVAC Costs
MonthElectric
($)Natural Gas
($)Fuel Oil
($)Propane
($)
Remote Hot Water
($)Remote Steam
($)January 1,249 0 0 0 0 0
February 1,227 0 0 0 0 0
March 1,211 0 0 0 0 0
April 1,139 0 0 0 0 0
May 4,509 0 0 0 0 0
June 3,342 0 0 0 0 0
July 3,114 0 0 0 0 0
August 3,176 0 0 0 0 0
September 4,391 0 0 0 0 0
October 1,158 0 0 0 0 0
November 1,211 0 0 0 0 0
December 1,249 0 0 0 0 0
Total 26,975 0 0 0 0 0
Hourly Analysis Program v.4.2 Page 1 of 1

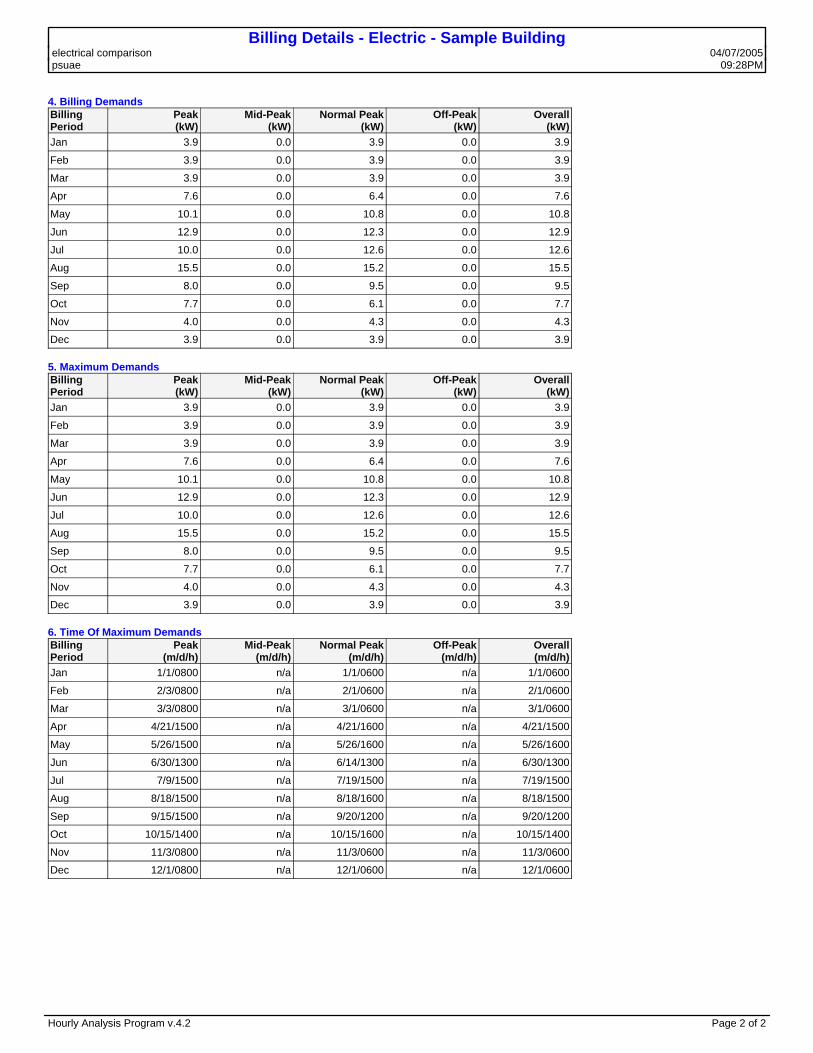
Billing Details - Electric - Sample Buildingelectrical comparison 04/07/2005 psuae 09:28PM
1. Component Charges
BillingPeriod
Energy Charges($)
Demand Charges($)
CustomerCharges
($)Taxes
($)Total Charge
($)Jan 798 0 369 82 1,249
Feb 777 0 369 80 1,227
Mar 797 0 369 82 1,247
Apr 811 1 369 83 1,263
May 5,289 1 369 396 6,056
Jun 5,297 2 369 397 6,064
Jul 5,303 1 369 397 6,070
Aug 5,301 2 369 397 6,068
Sep 5,289 1 369 396 6,055
Oct 816 1 369 83 1,268
Nov 788 0 369 81 1,238
Dec 798 0 369 82 1,249
Totals 32,064 11 4,424 2,555 39,054
2. Totals
BillingPeriod
Total Charges($)
Total Consumption
(kWh)Avg Price
($/kWh)Jan 1,249 1,270 0.9835
Feb 1,227 1,129 1.0868
Mar 1,247 1,260 0.9901
Apr 1,263 1,356 0.9313
May 6,056 1,705 3.5507
Jun 6,064 2,133 2.8428
Jul 6,070 2,475 2.4527
Aug 6,068 2,337 2.5970
Sep 6,055 1,686 3.5912
Oct 1,268 1,390 0.9123
Nov 1,238 1,202 1.0298
Dec 1,249 1,270 0.9835
Totals 39,054 19,212 2.0327
3. Consumption TotalsBillingPeriod
Peak(kWh)
Mid-Peak(kWh)
Normal Peak(kWh)
Off-Peak(kWh)
Overall(kWh)
Jan 721 0 549 0 1,270
Feb 627 0 502 0 1,129
Mar 658 0 601 0 1,260
Apr 717 0 639 0 1,356
May 838 0 868 0 1,705
Jun 1,088 0 1,045 0 2,133
Jul 1,283 0 1,192 0 2,475
Aug 1,129 0 1,207 0 2,337
Sep 842 0 844 0 1,686
Oct 758 0 632 0 1,390
Nov 627 0 575 0 1,202
Dec 721 0 549 0 1,270
Totals 10,010 0 9,202 0 19,212
Hourly Analysis Program v.4.2 Page 1 of 2
Billing Details - Electric - Sample Buildingelectrical comparison 04/07/2005 psuae 09:28PM
4. Billing DemandsBillingPeriod
Peak(kW)
Mid-Peak(kW)
Normal Peak(kW)
Off-Peak(kW)
Overall(kW)
Jan 3.9 0.0 3.9 0.0 3.9
Feb 3.9 0.0 3.9 0.0 3.9
Mar 3.9 0.0 3.9 0.0 3.9
Apr 7.6 0.0 6.4 0.0 7.6
May 10.1 0.0 10.8 0.0 10.8
Jun 12.9 0.0 12.3 0.0 12.9
Jul 10.0 0.0 12.6 0.0 12.6
Aug 15.5 0.0 15.2 0.0 15.5
Sep 8.0 0.0 9.5 0.0 9.5
Oct 7.7 0.0 6.1 0.0 7.7
Nov 4.0 0.0 4.3 0.0 4.3
Dec 3.9 0.0 3.9 0.0 3.9
5. Maximum DemandsBillingPeriod
Peak(kW)
Mid-Peak(kW)
Normal Peak(kW)
Off-Peak(kW)
Overall(kW)
Jan 3.9 0.0 3.9 0.0 3.9
Feb 3.9 0.0 3.9 0.0 3.9
Mar 3.9 0.0 3.9 0.0 3.9
Apr 7.6 0.0 6.4 0.0 7.6
May 10.1 0.0 10.8 0.0 10.8
Jun 12.9 0.0 12.3 0.0 12.9
Jul 10.0 0.0 12.6 0.0 12.6
Aug 15.5 0.0 15.2 0.0 15.5
Sep 8.0 0.0 9.5 0.0 9.5
Oct 7.7 0.0 6.1 0.0 7.7
Nov 4.0 0.0 4.3 0.0 4.3
Dec 3.9 0.0 3.9 0.0 3.9
6. Time Of Maximum DemandsBillingPeriod
Peak(m/d/h)
Mid-Peak(m/d/h)
Normal Peak(m/d/h)
Off-Peak(m/d/h)
Overall(m/d/h)
Jan 1/1/0800 n/a 1/1/0600 n/a 1/1/0600
Feb 2/3/0800 n/a 2/1/0600 n/a 2/1/0600
Mar 3/3/0800 n/a 3/1/0600 n/a 3/1/0600
Apr 4/21/1500 n/a 4/21/1600 n/a 4/21/1500
May 5/26/1500 n/a 5/26/1600 n/a 5/26/1600
Jun 6/30/1300 n/a 6/14/1300 n/a 6/30/1300
Jul 7/9/1500 n/a 7/19/1500 n/a 7/19/1500
Aug 8/18/1500 n/a 8/18/1600 n/a 8/18/1500
Sep 9/15/1500 n/a 9/20/1200 n/a 9/20/1200
Oct 10/15/1400 n/a 10/15/1600 n/a 10/15/1400
Nov 11/3/0800 n/a 11/3/0600 n/a 11/3/0600
Dec 12/1/0800 n/a 12/1/0600 n/a 12/1/0600
Hourly Analysis Program v.4.2 Page 2 of 2
COMPARISON DATA
A H.A.P. ANALYSIS
SKYLIGHT WITH REDUCED ELECTRIC USE

Annual Cost Summaryskylight comparison 04/07/2005 psuae 08:46PM
Table 1. Annual Costs
ComponentSample Building
($)Air System Fans 0
Cooling 16,952
Heating 0
Pumps 0
Cooling Tower Fans 0
HVAC Sub-Total 16,952Lights 21,423
Electric Equipment 0
Misc. Electric 0
Misc. Fuel Use 0
Non-HVAC Sub-Total 21,423Grand Total 38,375
Table 2. Annual Cost per Unit Floor Area
ComponentSample Building
($/ft²)Air System Fans 0.000
Cooling 5.045
Heating 0.000
Pumps 0.000
Cooling Tower Fans 0.000
HVAC Sub-Total 5.045Lights 6.376
Electric Equipment 0.000
Misc. Electric 0.000
Misc. Fuel Use 0.000
Non-HVAC Sub-Total 6.376Grand Total 11.421
Gross Floor Area (ft²) 3360.0
Conditioned Floor Area (ft²) 3360.0Note: Values in this table are calculated using the Gross Floor Area.
Table 3. Component Cost as a Percentage of Total Cost
ComponentSample Building
( % )Air System Fans 0.0
Cooling 44.2
Heating 0.0
Pumps 0.0
Cooling Tower Fans 0.0
HVAC Sub-Total 44.2Lights 55.8
Electric Equipment 0.0
Misc. Electric 0.0
Misc. Fuel Use 0.0
Non-HVAC Sub-Total 55.8Grand Total 100.0
Hourly Analysis Program v.4.2 Page 1 of 1

Annual Energy and Emissions Summaryskylight comparison 04/07/2005 psuae 08:46PM
Table 1. Annual Costs
ComponentSample Building
($)HVAC Components Electric 16,952
Natural Gas 0
Fuel Oil 0
Propane 0
Remote HW 0
Remote Steam 0
Remote CW 0
HVAC Sub-Total 16,952
Non-HVAC Components Electric 21,423
Natural Gas 0
Fuel Oil 0
Propane 0
Remote HW 0
Remote Steam 0
Non-HVAC Sub-Total 21,423Grand Total 38,375
Table 2. Annual Energy ConsumptionComponent Sample BuildingHVAC Components Electric (kWh) 5,105
Natural Gas () 308,161
Fuel Oil (na) 0
Propane (na) 0
Remote HW (na) 0
Remote Steam (na) 0
Remote CW (na) 0
Non-HVAC Components Electric (kWh) 8,587
Natural Gas () 0
Fuel Oil (na) 0
Propane (na) 0
Remote HW (na) 0
Remote Steam (na) 0
Totals Electric (kWh) 13,691
Natural Gas () 308,161
Fuel Oil (na) 0
Propane (na) 0
Remote HW (na) 0
Remote Steam (na) 0
Remote CW (na) 0
Hourly Analysis Program v.4.2 Page 1 of 2
Annual Energy and Emissions Summaryskylight comparison 04/07/2005 psuae 08:46PM
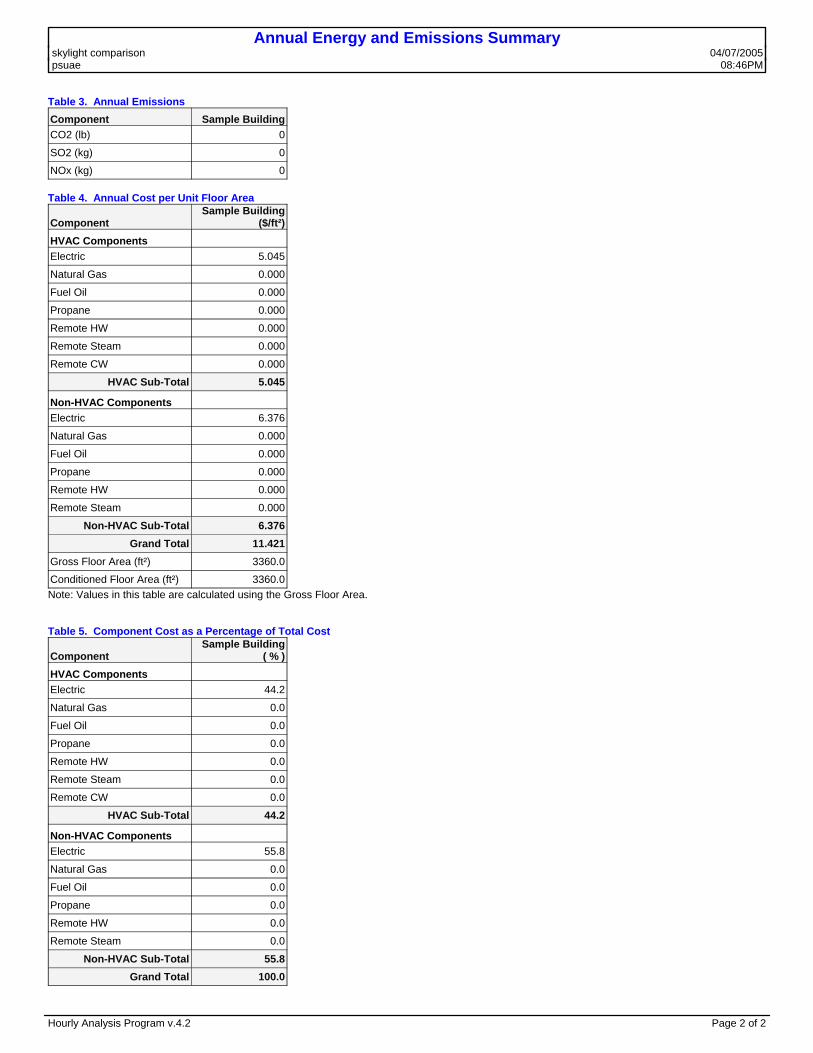
Table 3. Annual EmissionsComponent Sample BuildingCO2 (lb) 0
SO2 (kg) 0
NOx (kg) 0
Table 4. Annual Cost per Unit Floor Area
ComponentSample Building
($/ft²)HVAC Components Electric 5.045
Natural Gas 0.000
Fuel Oil 0.000
Propane 0.000
Remote HW 0.000
Remote Steam 0.000
Remote CW 0.000
HVAC Sub-Total 5.045
Non-HVAC Components Electric 6.376
Natural Gas 0.000
Fuel Oil 0.000
Propane 0.000
Remote HW 0.000
Remote Steam 0.000
Non-HVAC Sub-Total 6.376Grand Total 11.421
Gross Floor Area (ft²) 3360.0
Conditioned Floor Area (ft²) 3360.0Note: Values in this table are calculated using the Gross Floor Area.
Table 5. Component Cost as a Percentage of Total Cost
ComponentSample Building
( % )HVAC Components Electric 44.2
Natural Gas 0.0
Fuel Oil 0.0
Propane 0.0
Remote HW 0.0
Remote Steam 0.0
Remote CW 0.0
HVAC Sub-Total 44.2
Non-HVAC Components Electric 55.8
Natural Gas 0.0
Fuel Oil 0.0
Propane 0.0
Remote HW 0.0
Remote Steam 0.0
Non-HVAC Sub-Total 55.8Grand Total 100.0
Hourly Analysis Program v.4.2 Page 2 of 2
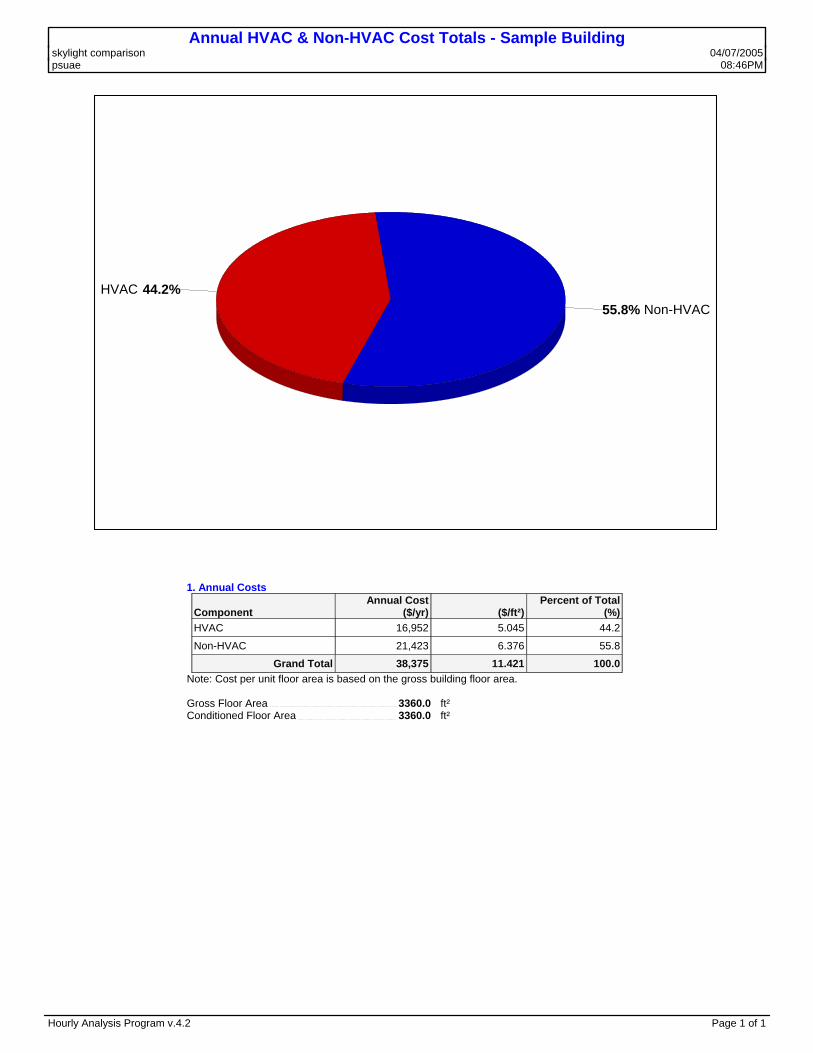
Annual HVAC & Non-HVAC Cost Totals - Sample Buildingskylight comparison 04/07/2005 psuae 08:46PM
44.2%HVAC55.8% Non-HVAC
1. Annual Costs
ComponentAnnual Cost
($/yr) ($/ft²)Percent of Total
(%)HVAC 16,952 5.045 44.2
Non-HVAC 21,423 6.376 55.8
Grand Total 38,375 11.421 100.0 Note: Cost per unit floor area is based on the gross building floor area.
Gross Floor Area 3360.0 ft² Conditioned Floor Area 3360.0 ft²
Hourly Analysis Program v.4.2 Page 1 of 1
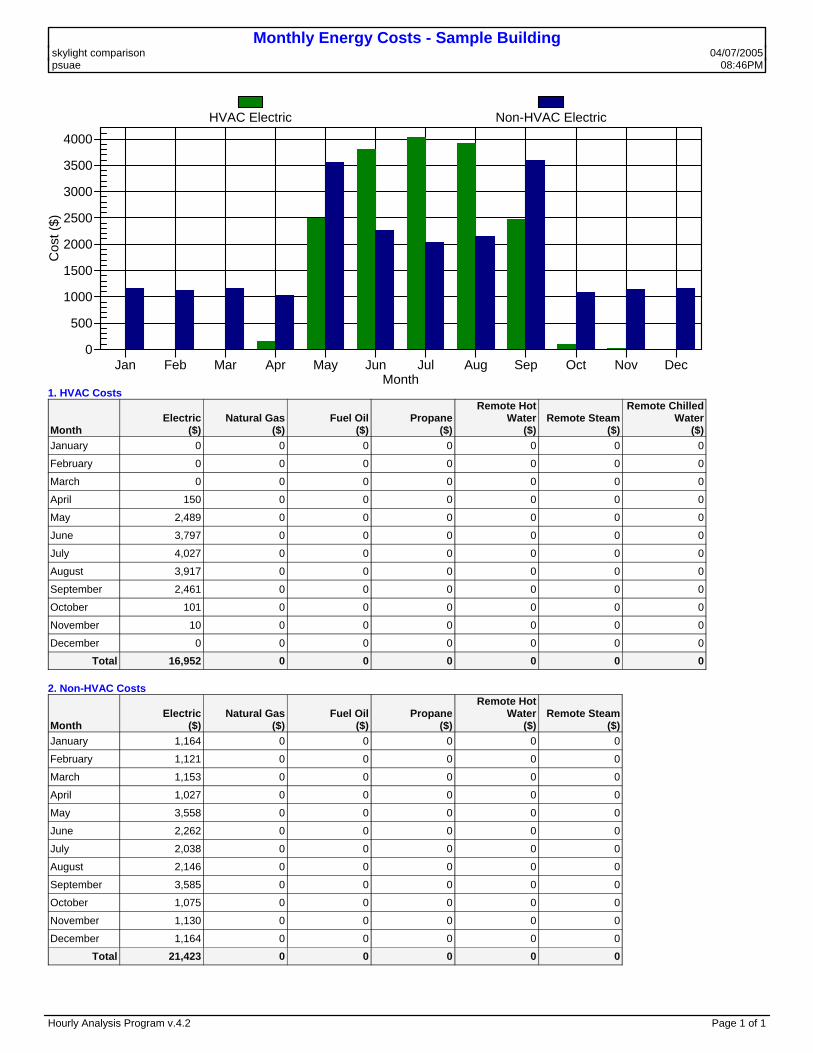
Monthly Energy Costs - Sample Buildingskylight comparison 04/07/2005 psuae 08:46PM
0
500
1000
1500
2000
2500
3000
3500
4000
Cos
t ($)
MonthJan Feb Mar Apr May Jun Jul Aug Sep Oct Nov Dec
HVAC Electric Non-HVAC Electric
1. HVAC Costs
MonthElectric
($)Natural Gas
($)Fuel Oil
($)Propane
($)
Remote Hot Water
($)Remote Steam
($)
Remote Chilled Water
($)January 0 0 0 0 0 0 0
February 0 0 0 0 0 0 0
March 0 0 0 0 0 0 0
April 150 0 0 0 0 0 0
May 2,489 0 0 0 0 0 0
June 3,797 0 0 0 0 0 0
July 4,027 0 0 0 0 0 0
August 3,917 0 0 0 0 0 0
September 2,461 0 0 0 0 0 0
October 101 0 0 0 0 0 0
November 10 0 0 0 0 0 0
December 0 0 0 0 0 0 0
Total 16,952 0 0 0 0 0 0
2. Non-HVAC Costs
MonthElectric
($)Natural Gas
($)Fuel Oil
($)Propane
($)
Remote Hot Water
($)Remote Steam
($)January 1,164 0 0 0 0 0
February 1,121 0 0 0 0 0
March 1,153 0 0 0 0 0
April 1,027 0 0 0 0 0
May 3,558 0 0 0 0 0
June 2,262 0 0 0 0 0
July 2,038 0 0 0 0 0
August 2,146 0 0 0 0 0
September 3,585 0 0 0 0 0
October 1,075 0 0 0 0 0
November 1,130 0 0 0 0 0
December 1,164 0 0 0 0 0
Total 21,423 0 0 0 0 0
Hourly Analysis Program v.4.2 Page 1 of 1
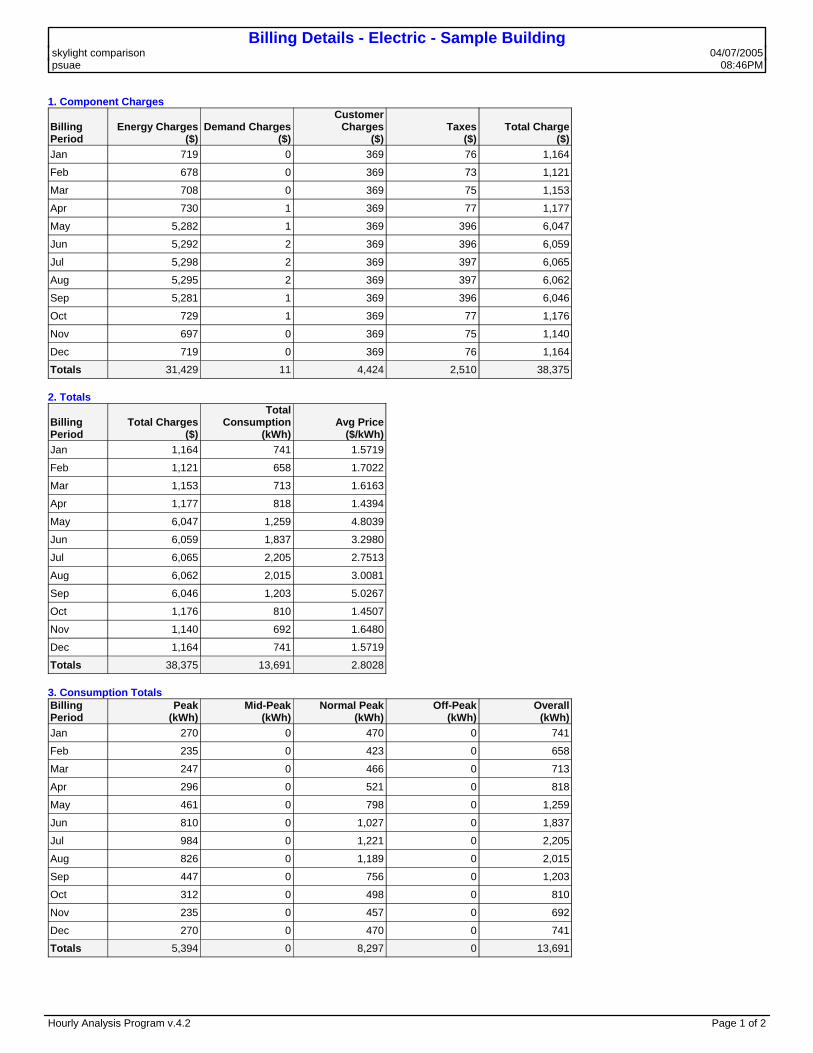
Billing Details - Electric - Sample Buildingskylight comparison 04/07/2005 psuae 08:46PM
1. Component Charges
BillingPeriod
Energy Charges($)
Demand Charges($)
CustomerCharges
($)Taxes
($)Total Charge
($)Jan 719 0 369 76 1,164
Feb 678 0 369 73 1,121
Mar 708 0 369 75 1,153
Apr 730 1 369 77 1,177
May 5,282 1 369 396 6,047
Jun 5,292 2 369 396 6,059
Jul 5,298 2 369 397 6,065
Aug 5,295 2 369 397 6,062
Sep 5,281 1 369 396 6,046
Oct 729 1 369 77 1,176
Nov 697 0 369 75 1,140
Dec 719 0 369 76 1,164
Totals 31,429 11 4,424 2,510 38,375
2. Totals
BillingPeriod
Total Charges($)
Total Consumption
(kWh)Avg Price
($/kWh)Jan 1,164 741 1.5719
Feb 1,121 658 1.7022
Mar 1,153 713 1.6163
Apr 1,177 818 1.4394
May 6,047 1,259 4.8039
Jun 6,059 1,837 3.2980
Jul 6,065 2,205 2.7513
Aug 6,062 2,015 3.0081
Sep 6,046 1,203 5.0267
Oct 1,176 810 1.4507
Nov 1,140 692 1.6480
Dec 1,164 741 1.5719
Totals 38,375 13,691 2.8028
3. Consumption TotalsBillingPeriod
Peak(kWh)
Mid-Peak(kWh)
Normal Peak(kWh)
Off-Peak(kWh)
Overall(kWh)
Jan 270 0 470 0 741
Feb 235 0 423 0 658
Mar 247 0 466 0 713
Apr 296 0 521 0 818
May 461 0 798 0 1,259
Jun 810 0 1,027 0 1,837
Jul 984 0 1,221 0 2,205
Aug 826 0 1,189 0 2,015
Sep 447 0 756 0 1,203
Oct 312 0 498 0 810
Nov 235 0 457 0 692
Dec 270 0 470 0 741
Totals 5,394 0 8,297 0 13,691
Hourly Analysis Program v.4.2 Page 1 of 2
Billing Details - Electric - Sample Buildingskylight comparison 04/07/2005 psuae 08:46PM
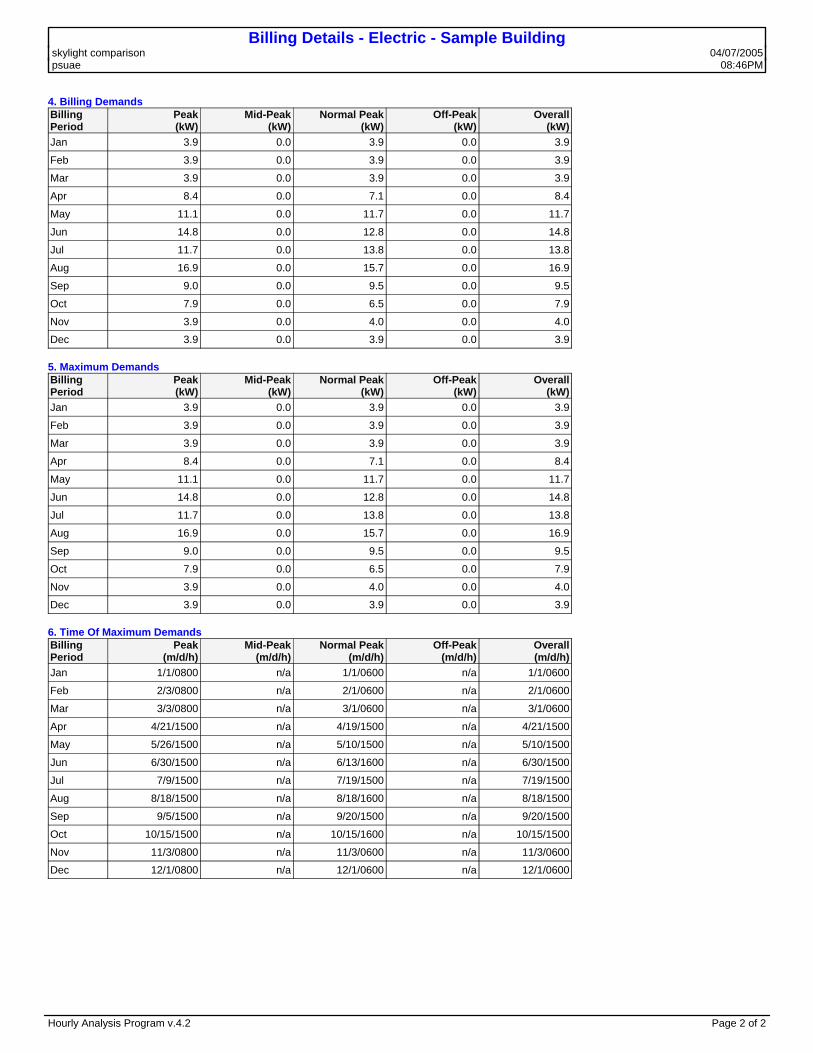
4. Billing DemandsBillingPeriod
Peak(kW)
Mid-Peak(kW)
Normal Peak(kW)
Off-Peak(kW)
Overall(kW)
Jan 3.9 0.0 3.9 0.0 3.9
Feb 3.9 0.0 3.9 0.0 3.9
Mar 3.9 0.0 3.9 0.0 3.9
Apr 8.4 0.0 7.1 0.0 8.4
May 11.1 0.0 11.7 0.0 11.7
Jun 14.8 0.0 12.8 0.0 14.8
Jul 11.7 0.0 13.8 0.0 13.8
Aug 16.9 0.0 15.7 0.0 16.9
Sep 9.0 0.0 9.5 0.0 9.5
Oct 7.9 0.0 6.5 0.0 7.9
Nov 3.9 0.0 4.0 0.0 4.0
Dec 3.9 0.0 3.9 0.0 3.9
5. Maximum DemandsBillingPeriod
Peak(kW)
Mid-Peak(kW)
Normal Peak(kW)
Off-Peak(kW)
Overall(kW)
Jan 3.9 0.0 3.9 0.0 3.9
Feb 3.9 0.0 3.9 0.0 3.9
Mar 3.9 0.0 3.9 0.0 3.9
Apr 8.4 0.0 7.1 0.0 8.4
May 11.1 0.0 11.7 0.0 11.7
Jun 14.8 0.0 12.8 0.0 14.8
Jul 11.7 0.0 13.8 0.0 13.8
Aug 16.9 0.0 15.7 0.0 16.9
Sep 9.0 0.0 9.5 0.0 9.5
Oct 7.9 0.0 6.5 0.0 7.9
Nov 3.9 0.0 4.0 0.0 4.0
Dec 3.9 0.0 3.9 0.0 3.9
6. Time Of Maximum DemandsBillingPeriod
Peak(m/d/h)
Mid-Peak(m/d/h)
Normal Peak(m/d/h)
Off-Peak(m/d/h)
Overall(m/d/h)
Jan 1/1/0800 n/a 1/1/0600 n/a 1/1/0600
Feb 2/3/0800 n/a 2/1/0600 n/a 2/1/0600
Mar 3/3/0800 n/a 3/1/0600 n/a 3/1/0600
Apr 4/21/1500 n/a 4/19/1500 n/a 4/21/1500
May 5/26/1500 n/a 5/10/1500 n/a 5/10/1500
Jun 6/30/1500 n/a 6/13/1600 n/a 6/30/1500
Jul 7/9/1500 n/a 7/19/1500 n/a 7/19/1500
Aug 8/18/1500 n/a 8/18/1600 n/a 8/18/1500
Sep 9/5/1500 n/a 9/20/1500 n/a 9/20/1500
Oct 10/15/1500 n/a 10/15/1600 n/a 10/15/1500
Nov 11/3/0800 n/a 11/3/0600 n/a 11/3/0600
Dec 12/1/0800 n/a 12/1/0600 n/a 12/1/0600
Hourly Analysis Program v.4.2 Page 2 of 2